mc/inf/301 - report on human resources management · the iom internship programme...
TRANSCRIPT
MC/INF/301 Original: English 28 October 2010
NINETY-NINTH SESSION _________________________________________________________________________
REPORT ON HUMAN RESOURCES MANAGEMENT

MC/INF/301 Page i
TABLE OF CONTENTS
Page I. INTRODUCTION ………………………………………………………..……... 1 II. IOM STAFFING ……………………………………………………..………….. 1
Vacancies and placements …………………….…………………………………. 1
Associate Experts …….………………………………………………………….. 2
Staff exchanges, secondments and loans ………..……………………………….. 2
The IOM Internship Programme ………………………..……………………….. 2
Rotation ………..………………………………………..……………………….. 3 III. EFFECTIVE HUMAN RESOURCES SERVICE DELIVERY……….……….. 3
HRM policy and services …………………………………………………………. 3
Staff well-being, health insurance and improved working conditions ..…………. 4
Staff relations …….………………………………………………………………. 4
Staff development and learning …….…………………………………………… 5
IV. CONCLUSION ………………...…….…………………………………………… 5 ANNEX – Statistical overview

MC/INF/301 Page 1
REPORT ON HUMAN RESOURCES MANAGEMENT I. INTRODUCTION 1. Effective human resources management continues to underpin the efficiency of the Organization and the effective delivery of programme and operational activities in support of the IOM Strategy. The importance of human resources management has been amplified over the reporting period as a number of critical organization-wide reforms took place, including the structure reform and the development of the unified Staff Regulations applicable to all IOM staff members. 2. The implementation of the staff rotation policy continued in 2010. One of the objectives of rotation has been the placement of senior managers from Headquarters in the Field and a corresponding transfer of Field colleagues to key positions at Headquarters. This movement of senior officials bodes well for improved coherence between Headquarters and the Field. At the same time, it is recognized that rotation has placed additional pressure on the Organization in terms of its structural and financial capacity to absorb change. The Administration will therefore take into consideration lessons learned in next year’s rotation exercise, in particular to manage the impact of restructuring. 3. The Human Resources Management Division (HRM) teams in Manila and Panama have continued to provide operational human resources support to the IOM Field Offices, while the HRM team at Headquarters has focused on a number of policy reforms and other activities that seek to enhance human resources management in IOM. Specific activities include the following: (a) Finalization of a unified version of the Staff Regulations for all IOM staff.
(b) Review of the existing Performance Development System together with the first steps taken towards the development of a new and integrated system that will embed staff evaluation within the broader managerial architecture of the Organization.
(c) Completion of the second year of the annual rotation exercise supported through the development and use of the Rotation Management System software, which operates as an electronic database for storing relevant information and producing related reports and statistical data.
(d) Active HRM engagement in the structural review at Headquarters and in the Field Implementation Team.
(e) Ongoing support for rapid deployment of staff in response to emergencies in Haiti and Pakistan.
II. IOM STAFFING Vacancies and placements 4. During the period under review, there was no significant change in the staff strength of the Organization: 7,735 in June 2009 and 7,699 at the end of June 2010, representing a 0.5 per cent decrease in the number of staff over the year. Between January 2009 and June 2010, IOM issued 94 vacancy notices for officials and recruited or placed 73 officials through

MC/INF/301 Page 2
internal (51) and external (22) advertisements. Furthermore, 8 vacancy notices were placed for General Service staff at Headquarters and 56 short-term vacancy notices were issued for officials. Recruitment activities were weighted towards the recruitment and deployment of staff to support IOM’s response to natural disasters and post-crisis activities, in situations such as the aftermath of the earthquake that struck Haiti in January 2010, and to meet staffing needs in Afghanistan, Pakistan, Sri Lanka and Sudan. Associate Experts 5. During the period under review, five new Associate Experts funded by the Governments of Italy, Japan, Sweden and the United States of America joined IOM, bringing the total number of Associate Experts deployed within the Organization to 23. IOM’s Associate Experts Programme comprises 16 agreements with donor countries and fosters the link for matching donor priorities with ongoing and potential IOM programmes, providing a valuable opportunity to achieve mutually beneficial developmental goals. As a result of the ongoing initiatives by the Organization to encourage donors to fund Associate Experts from developing countries, the Italian Government funded a national of Zimbabwe under the Programme. Administrative procedures are under way for a further three Associate Expert positions to be filled. The Organization retained two Associate Experts during the reporting period. Staff exchanges, secondments and loans 6. A total of 29 people were seconded to or from IOM during the reporting period. The secondments to IOM included one senior official from the Ministry of Justice of the Netherlands who was deployed to Haiti. In addition, 20 staff were seconded from SYNI1 to IOM. Of these, 14 have been deployed at Headquarters and 6 have been deployed in Field Offices in Eastern Europe. Discussions leading to the secondment of a researcher from the Migration Policy Institute to work for IOM were initiated during the reporting period. IOM seconded officials to the Global Forum on Migration and Development, the International Labour Organization (ILO), the World Health Organization and the World Intellectual Property Organization and is also discussing the loan of a Legal Officer to the United Nations Office for Project Services with cost coverage provided by the Office. The IOM Internship Programme 7. The IOM Internship Programme continues to be a valuable source of support to IOM’s core expertise, providing students or recent graduates with the opportunity to learn about the Organization’s activities and to gain initial work experience. During the reporting period, 70 interns were hosted at Headquarters and 123 in the Field from a wide range of educational backgrounds and nationalities. In addition, new agreements for hosting interns have been signed with the Nagoya University and the Tokyo University of Foreign Studies in Japan.
1 SYNI is a non-profit-making professional project carried out by Lausanne City Council which offers motivated
professionals the possibility of participating in formative international cooperation assignments in Switzerland and abroad. To that end, it facilitates short-term subsidized assignments for professionals residing in Switzerland and interested in acquiring international work experience. SYNI is funded and commissioned by the Swiss State Secretariat for Economic Affairs (SECO) and Lausanne City Council.
MC/INF/301 Page 3
Rotation 8. The 2009 rotation list was made up of 61 officials and included rotations that had been deferred from the 2008 exercise. A total of 33 officials were rotated as part of this cycle and out of these 26 officials were eligible for rotation. The remaining seven rotations were a result of necessary changes in the structure or emergency rotations brought about by the specific needs of some projects. Officials whose rotation was deferred from the 2009 rotation process will be included in the next rotational cycle. The Administration and the Staff Association Committee held several consultative meetings including a one-day retreat with senior managers to address issues related to staff mobility and rotation and to examine lessons learned from the first rotation exercise. Participants were aware that the rotation process had required a significant cultural change for the Organization and also recognized that the management of the next rotation cycle, together with the implementation of the structural review recommendations, will require a great deal of consultation and coordination in 2011. III. EFFECTIVE HUMAN RESOURCES SERVICE DELIVERY HRM policy and services 9. During the reporting period, the Human Resources Policy and Systems Unit, working in coordination with the Office of Legal Affairs and the Staff Association Committee, finalized the revised unified version of the Staff Regulations that will apply to all IOM staff at Headquarters and in the Field. A summary document explaining the new Regulations and comparing them to the previous Regulations for officials and employees will be submitted to the Standing Committee on Programmes and Finance for review and submission to the Council. 10. In the past year, the following additional policies and guidelines were developed and implemented: (a) The IOM policy and guidelines on employment contracts were reviewed and
standardized. The revised guidelines define the different types of contracts and associated entitlements and regulate the conditions required to obtain each type of employment contract. A new fixed-term contract for two years was introduced and the conditions for granting regular contracts with no fixed period of employment were modified to require, among other things, a minimum of 10 years of continuous service instead of the 5 years required under the previous instructions.
(b) New guidelines defining the administration of sick leave and submission of sick leave
requests under the human resources information system (PRISM HR) were developed. (c) New instructions to establish uniform and transparent rules related to the appointment
and employment of close relatives of IOM staff members, while respecting the principle of non-discrimination, were established.
(d) A policy to update and clarify the mandatory nature of IOM’s internal controls for
payroll management and other financial procedures was instituted.

MC/INF/301 Page 4
Staff well-being, health insurance and improved working conditions 11. During the year under review, IOM joined the Dual Career and Staff Mobility Programme as part of an initiative to support officials moving to various duty stations as part of the rotation process. The Programme is supported by the United Nations system and partnering organizations to assist globally mobile families to adapt to new duty stations and to help expatriate spouses/partners find jobs and maintain their professional careers.
12. Agreements were concluded with additional hospitals in Switzerland, the Philippines and Kenya, to facilitate admission procedures and improve the cost-effectiveness of health services. Other agreements are being negotiated in other IOM Field locations. 13. The extension of the Medical Service Plan health insurance coverage to IOM Field Offices is still in progress. Twelve additional offices have been enrolled in the Plan during the reporting period. A total of 115 Field Offices are now enrolled, with 6,148 participants (staff members and eligible dependants). 14. In response to the increasing risks of violence against humanitarian workers and exposure to traumatic events, the Occupational Health Unit (OHU) and the Health and Insurance Medical Unit (HIM) in Manila delivered and participated in different training activities for staff (first aid training for drivers; tactical emergency first aid training; security training for frequent female travellers) to reduce risk exposure and allow better initial reactions that can save lives. To minimize post-traumatic stress among staff, OHU/HIM also offered stress management and medical support to offices in Afghanistan, Haiti, Myanmar, South Africa and Sri Lanka in coordination with Stress Counsellors from the United Nations Department of Safety and Security’s Critical Incident Stress Management Unit. A stress management booklet focusing on staff working in conflict zones was produced to help staff cope with stress under traumatic conditions. Staff relations 15. HRM has continued to work closely with the Staff Association Committee. Regular meetings are convened between the Administration and the Staff Association Committee and HRM has sought to be proactive in addressing issues and concerns raised by the Committee in relation to staff matters. 16. At the beginning of the year HRM initiated the Staff Welfare Group,2 which meets once a month to address and initiate strategic mechanisms to help staff members and management cope with difficulties and problems which, if left unresolved, could adversely affect the work and effectiveness of Offices and the Organization as a whole. 17. In relation to staff grievances, the Joint Administrative Review Board received 10 appeals in the 12 months ending on 30 June 2010. No complaints were filed with the ILO Administrative Tribunal.
2 The Staff Welfare Group is composed of the Ombudsperson, the Gender Officer, the Head of the Staff Development and
Learning Unit, the Head of the Occupational Health Unit, the Policy Specialist, the Legal Officer and the Insurance and Provider Specialist and is chaired by the Director of HRM.

MC/INF/301 Page 5
Staff development and learning 18. The Training Advisory Committee was established in October 2009 with the aim of providing guidance on the overall orientation of Staff Development and Learning Unit (SDL) initiatives. The Committee has been consulted several times during the reporting period, and its recommendations have been embedded in the overall application of staff development and learning tools. 19. Continuing the trend established in 2009, Phase 2 of the IOM Project Management Training Package is now delivered in Field Offices in order to facilitate staff access by reducing travel costs. Five sessions were organized in 2009,3 as opposed to four in 2008.4 Six sessions are planned for 2010, one in Geneva and five in the Field.
20. Recognizing the complex role that IOM Chiefs of Mission have to play, SDL has advocated for a modular approach for targeted and meaningful training for Chiefs of Mission. As such, the first module “Managing IOM Resources” will be piloted in October 2010, with new modules on managing the security of IOM Staff, operations, media and mediation skills planned for delivery in 2011.
21. The Performance Development System was reviewed at the end of 2009 by a group of Resources Management Officers and HRM Specialists in Manila and Panama. Taking on board the recommendations of this review, HRM and SDL have now taken the first steps in developing a more robust system that will embed staff evaluation within the broader managerial architecture of the Organization. The intention of the IOM Administration is to launch the new system in the first half of 2011. IV. CONCLUSION 22. The coming year will present heightened challenges for the Administration as it implements the Field re-structuring procedures. It is anticipated that recent and ongoing reforms such as the new Staff Regulations and the implementation of a new staff evaluation system will facilitate HRM’s support to this implementation process. HRM continues to take important steps towards improving the quality of human resources management in IOM.
3 Sessions were organized in Brussels, Geneva, Manila, Nairobi and Panama. 4 All these sessions were organized in Geneva.

MC/INF/301 Annex (English only) Page 1
Annex
STATISTICAL OVERVIEW
IOM STAFF COMPOSITION ………..……………..…….…………………………… 2
Figure 1 IOM Field locations, 2006–June 2010 ………….………….……….……….. 2 Figure 2 IOM staffing trends, 2006–June 2010 ….……….…………………………… 2 Figure 3 IOM staff by category, location and gender, June 2010 …………………..…. 3 Figure 4 Officials – Distribution by gender and category/grade, 2006–June 2010 …... 3 Figure 5 All officials and Headquarters General Service staff – Distribution by
gender and category/grade, June 2010 ……………………………………….. 4 Figure 6 Officials – Distribution by country of nationality, category/grade
and gender, June 2010 ………..……………………………………………… 5 Figure 7 General Service staff in the Field – Distribution by category/grade and
gender, June 2010 …………………………………………………………… 8 Figure 8 Headquarters General Service staff – Distribution by country of
nationality and gender, June 2010 …………….……………………....…….. 8 Figure 9 General Service staff in the Field – Distribution by country of nationality,
category/grade and gender, June 2010 ..……………………..…….………… 9 ALTERNATIVE STAFFING RESOURCES ……………………………...………….. 12
Figure 10 Associate Experts – Distribution by country of nationality, 2006–June 2010.. 12 Figure 11 Interns – Distribution by duty station and gender, July 2009–June 2010 ..…. 13 Figure 12 Secondees – Distribution by duty station and gender, July 2009–June 2010 .. 14 RECRUITMENT AND SELECTION ……………………………………….………. 15
Figure 13 Vacancy notices issued for officials, 2006–June 2010 .…..…………… 15 Figure 14 Officials appointed through vacancy notices, 2006–June 2010 ..…………… 15 Figure 15 Officials appointed through vacancy notices – Distribution by country of
nationality, 2006–June 2010 ….……………………..……………………….. 16 Figure 16 Vacancy notices issued for employees at Headquarters, 2006–June 2010 .… 18 Figure 17 Mobility of internal staff, 2006–June 2010 ….…..……………..………….. 18 Figure 18 Temporary recruitment and selection, 2006–June 2010 ……….….………... 18 STAFF DEVELOPMENT AND LEARNING ….…………………………………… 19
Figure 19 Staff development and learning activities, 2006–June 2010 ………..………. 19 Figure 20 Staff trained – Distribution by gender, 2006–June 2010 …..……….……….. 19 Figure 21 Staff trained – Distribution by location, 2006–June 2010 …………………… 20 Figure 22 Staff trained – Distribution by category, 2006–June 2010 …....……….……. 20 Figure 23 Regional distribution of staff trained by location, January–June 2010 ……… 21 Figure 24 Staff trained – Distribution of staff trained by main areas of learning and
development and gender: Regional distribution, January–June 2010 ..……… 21
MC/INF/301 Annex (English only) Page 2
IOM STAFF COMPOSITION1
Figure 1: IOM Field locations, 2006–June 2010
290340
407440 461
0
50
100
150
200
250
300
350
400
450
500
Figure 2: IOM staffing trends,2 2006–June 2010
0
1000
2000
3000
4000
5000
6000
7000
8000
9000
GENERAL SERVICE 4533 5113 5841 6642 6883
OFFICIALS 808 939 1032 1093 816
TOTAL 5341 6052 6873 7735 7699
2006 2007 2008 2009 2010*
* As of 2010, National Officers have been included in the General Service category.
1 IOM staff statistics have been revised in order to group categories of staff with similar responsibilities. 2 Including staff members holding a short-term contract.
2006 2007 2008 2009 2010
MC/INF/301 Annex (English only) Page 3
Figure 3: IOM staff by category, location and gender, June 2010
Headquarters Field Category
F M F M Total
Officials3 57 51 223 355 686
Officials, short-term 8 4 43 52 107 Officials
(816)
Associate Experts 1 1 14 7 23
National Officers 0 0 157 173 330
General Service3 53 21 2 489 2 806 5 369 General Service (6 883)
General Service, short-term 2 1 461 720 1 184
TOTAL 121 78 3 387 4 113 7 699
Figure 4: Officials – Distribution by gender and category/grade, 2006–June 2010
June 2006 June 2007 June 2008 June 2009 June 2010 Category/grade
M F M F M F M F M F
P5 and above 14% 6% 13% 5% 12% 5% 11% 4% 13% 6%
P3–P4 38% 32% 36% 33% 35% 27% 34% 28% 46% 42%
P1–P2 14% 21% 14% 16% 12% 18% 15% 20% 21% 24%
PU 3% 4% 3% 4% 2% 4% 3% 5% 6% 8%
Short-term officials 17% 13% 10% 13% 12% 14% 9% 10% 12% 15%
Associate Experts 1% 4% 0% 3% 1% 2% 1% 3% 2% 4%
National Officers 14% 20% 24% 26% 27% 29% 27% 31% * *
Gender 458 350 532 407 587 445 624 469 470 346 Total
Gender (%) 57% 43% 57% 43% 57% 43% 57% 43% 58% 42%
Total officials 808 939 1 032 1 093 816
* For the current year, National Officers are reported under the General Service category.
3 The Director General, Deputy Director General, consultants, interns and staff on special leave without pay are excluded.
MC/INF/301 Annex (English only) Page 4
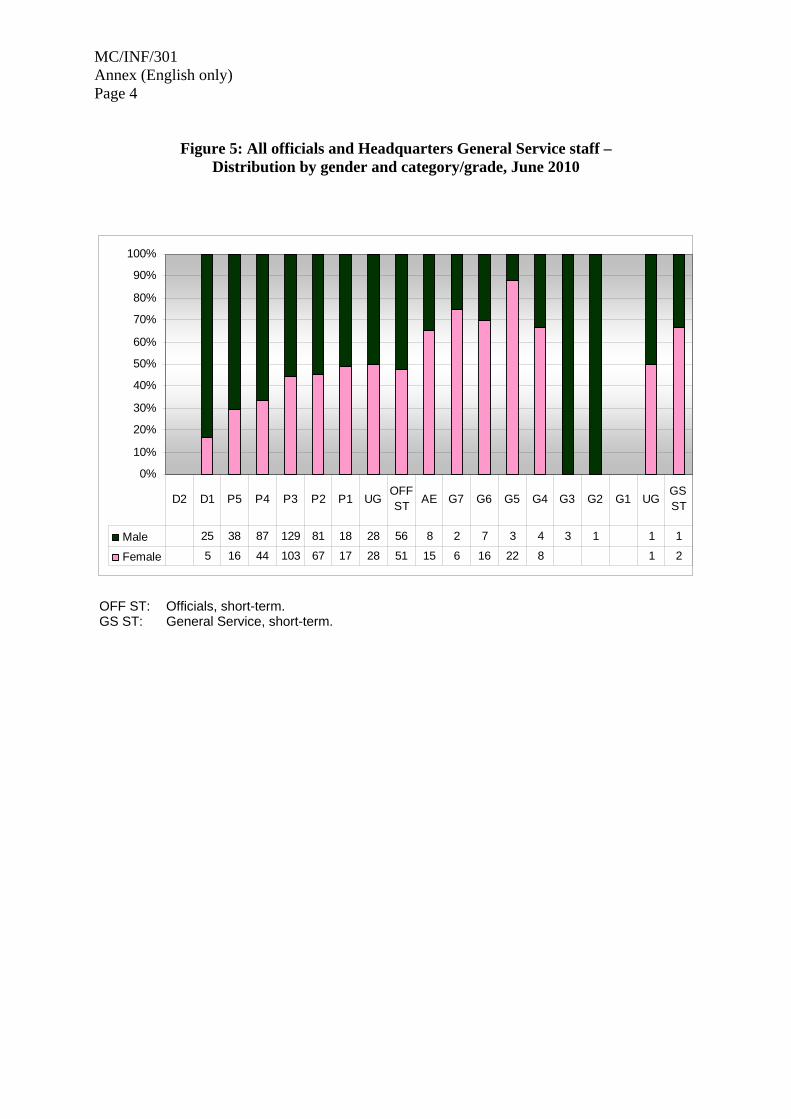
Figure 5: All officials and Headquarters General Service staff – Distribution by gender and category/grade, June 2010
0%
10%
20%
30%
40%
50%
60%
70%
80%
90%
100%
Male 25 38 87 129 81 18 28 56 8 2 7 3 4 3 1 1 1
Female 5 16 44 103 67 17 28 51 15 6 16 22 8 1 2
D2 D1 P5 P4 P3 P2 P1 UGOFF ST
AE G7 G6 G5 G4 G3 G2 G1 UGGS ST
OFF ST: Officials, short-term. GS ST: General Service, short-term.

MC/INF/301 Annex (English only) Page 5
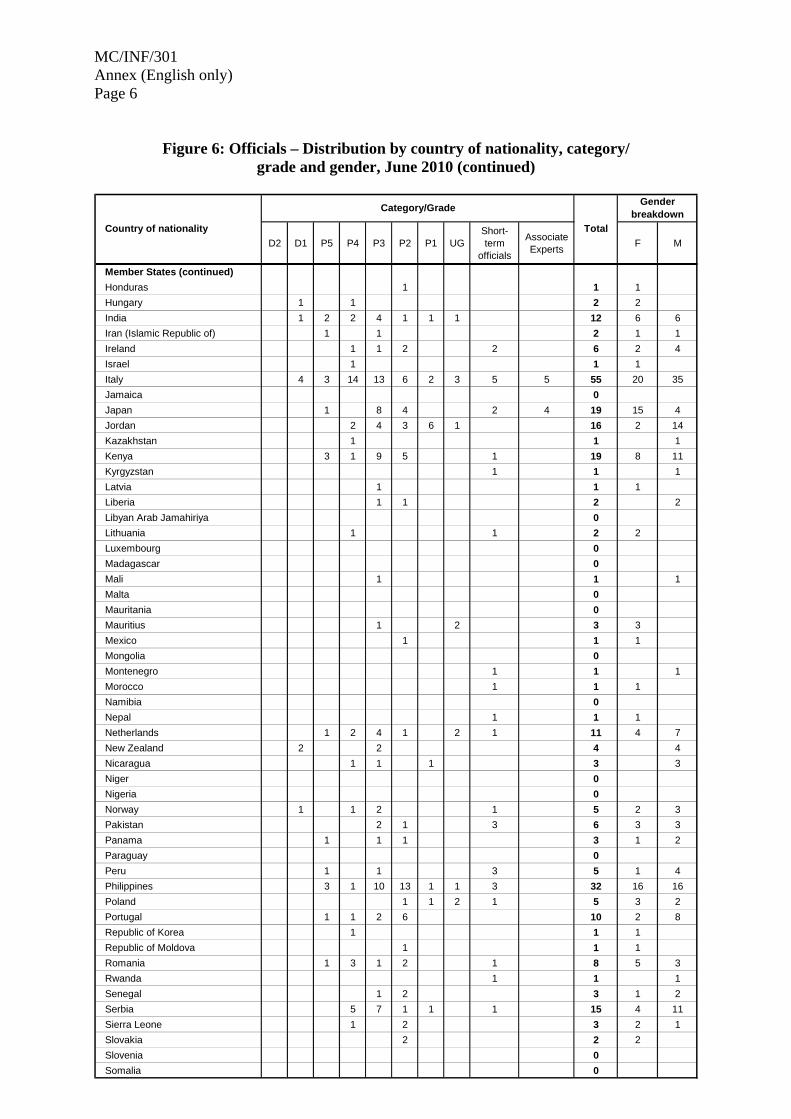
Figure 6: Officials – Distribution by country of nationality, category/ grade and gender, June 2010
D2 D1 P5 P4 P3 P2 P1 UGShort-term
officials
Associate Experts
F M
Member States
Afghanistan 1 2 3 3
Albania 1 1 2 2
Algeria 1 1 2 2
Angola 1 1 1
Argentina 1 1 1 3 1 2
Armenia 0
Australia 4 6 10 4 2 5 4 35 9 26
Austria 1 2 5 1 1 1 11 5 6
Azerbaijan 1 1 1
Bahamas 0
Bangladesh 1 1 1 1 4 1 3
Belarus 1 1 2 2
Belgium 2 3 3 2 1 1 2 14 7 7
Belize 0
Benin 0
Bolivia (Plurinational State of) 1 1 1 3 1 2
Bosnia and Herzegovina 1 4 5 3 2
Brazil 1 1 2 1 5 1 4
Bulgaria 1 1 1
Burkina Faso 1 1 2 1 1
Burundi 1 1 1
Cambodia 0
Cameroon 0
Canada 3 7 7 5 1 3 6 32 11 21
Cape Verde 0
Chile 1 1 1
Colombia 2 1 1 7 11 5 6
Congo 1 1 1
Costa Rica 2 2 4 1 1 10 2 8
Côte d’Ivoire 2 1 1 4 1 3
Croatia 2 1 1 1 5 3 2
Cyprus 0
Czech Republic 0
Democratic Republic of the Congo 1 2 3 3
Denmark 2 2 1 5 2 3
Dominican Republic 0
Ecuador 1 1 1
Egypt 1 2 3 5 11 4 7
El Salvador 1 1 1
Estonia 1 1 1
Finland 1 1 2 1 1
France 1 6 7 9 6 3 4 7 1 44 23 21
Gabon 0
Gambia 0
Georgia 1 1 2 4 4
Germany 5 2 5 9 2 1 7 3 34 15 19
Ghana 2 1 3 6 1 5
Greece 1 1 2 1 1
Guatemala 0
Guinea 1 1 1
Guinea-Bissau 0
Haiti 2 2 1 1
Country of nationality
Gender breakdown
Category/Grade
Total
MC/INF/301 Annex (English only) Page 6
Figure 6: Officials – Distribution by country of nationality, category/ grade and gender, June 2010 (continued)
D2 D1 P5 P4 P3 P2 P1 UGShort-term
officials
Associate Experts
F M
Member States (continued)
Honduras 1 1 1
Hungary 1 1 2 2
India 1 2 2 4 1 1 1 12 6 6
Iran (Islamic Republic of) 1 1 2 1 1
Ireland 1 1 2 2 6 2 4
Israel 1 1 1
Italy 4 3 14 13 6 2 3 5 5 55 20 35
Jamaica 0
Japan 1 8 4 2 4 19 15 4
Jordan 2 4 3 6 1 16 2 14
Kazakhstan 1 1 1
Kenya 3 1 9 5 1 19 8 11
Kyrgyzstan 1 1 1
Latvia 1 1 1
Liberia 1 1 2 2
Libyan Arab Jamahiriya 0
Lithuania 1 1 2 2
Luxembourg 0
Madagascar 0
Mali 1 1 1
Malta 0
Mauritania 0
Mauritius 1 2 3 3
Mexico 1 1 1
Mongolia 0
Montenegro 1 1 1
Morocco 1 1 1
Namibia 0
Nepal 1 1 1
Netherlands 1 2 4 1 2 1 11 4 7
New Zealand 2 2 4 4
Nicaragua 1 1 1 3 3
Niger 0
Nigeria 0
Norway 1 1 2 1 5 2 3
Pakistan 2 1 3 6 3 3
Panama 1 1 1 3 1 2
Paraguay 0
Peru 1 1 3 5 1 4
Philippines 3 1 10 13 1 1 3 32 16 16
Poland 1 1 2 1 5 3 2
Portugal 1 1 2 6 10 2 8
Republic of Korea 1 1 1
Republic of Moldova 1 1 1
Romania 1 3 1 2 1 8 5 3
Rwanda 1 1 1
Senegal 1 2 3 1 2
Serbia 5 7 1 1 1 15 4 11
Sierra Leone 1 2 3 2 1
Slovakia 2 2 2
Slovenia 0
Somalia 0
Gender breakdown
Country of nationality
Category/Grade
Total
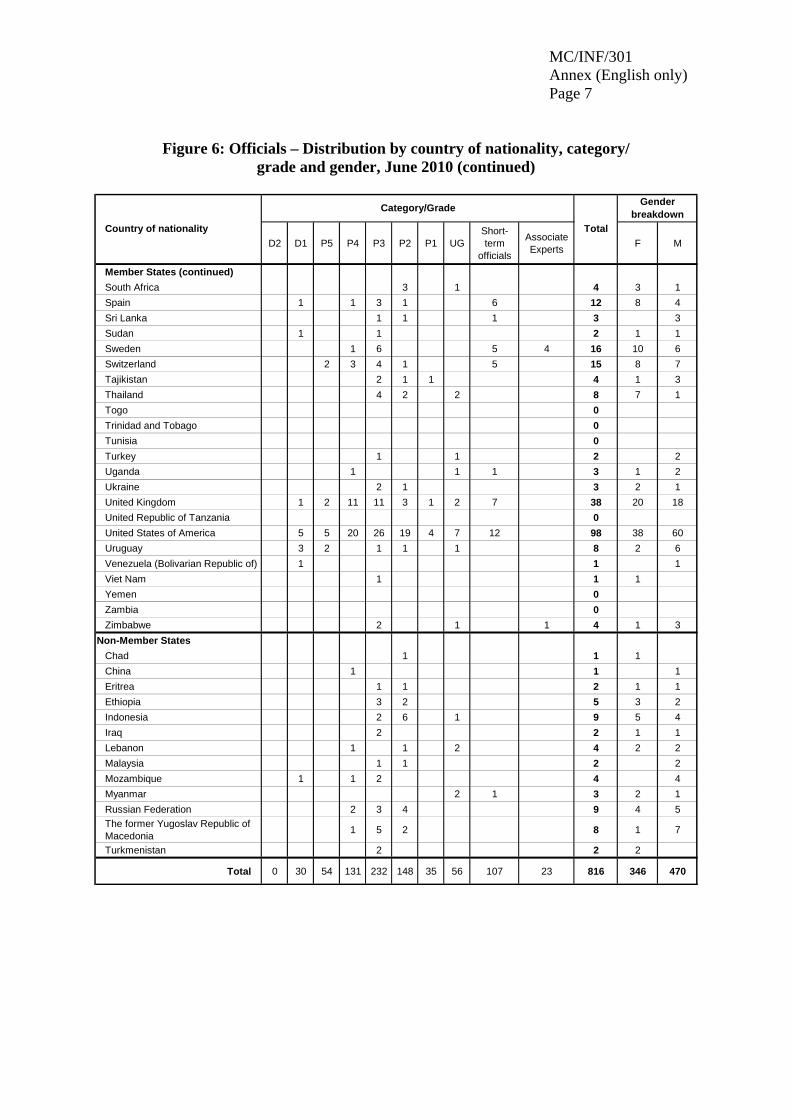
MC/INF/301 Annex (English only) Page 7
Figure 6: Officials – Distribution by country of nationality, category/ grade and gender, June 2010 (continued)
D2 D1 P5 P4 P3 P2 P1 UGShort-term
officials
Associate Experts
F M
Member States (continued)
South Africa 3 1 4 3 1
Spain 1 1 3 1 6 12 8 4
Sri Lanka 1 1 1 3 3
Sudan 1 1 2 1 1
Sweden 1 6 5 4 16 10 6
Switzerland 2 3 4 1 5 15 8 7
Tajikistan 2 1 1 4 1 3
Thailand 4 2 2 8 7 1
Togo 0
Trinidad and Tobago 0
Tunisia 0
Turkey 1 1 2 2
Uganda 1 1 1 3 1 2
Ukraine 2 1 3 2 1
United Kingdom 1 2 11 11 3 1 2 7 38 20 18
United Republic of Tanzania 0
United States of America 5 5 20 26 19 4 7 12 98 38 60
Uruguay 3 2 1 1 1 8 2 6
Venezuela (Bolivarian Republic of) 1 1 1
Viet Nam 1 1 1
Yemen 0
Zambia 0
Zimbabwe 2 1 1 4 1 3
Non-Member States
Chad 1 1 1
China 1 1 1
Eritrea 1 1 2 1 1
Ethiopia 3 2 5 3 2
Indonesia 2 6 1 9 5 4
Iraq 2 2 1 1
Lebanon 1 1 2 4 2 2
Malaysia 1 1 2 2
Mozambique 1 1 2 4 4
Myanmar 2 1 3 2 1
Russian Federation 2 3 4 9 4 5
The former Yugoslav Republic of Macedonia
1 5 2 8 1 7
Turkmenistan 2 2 2
Total 0 30 54 131 232 148 35 56 107 23 816 346 470
Country of nationality
Category/Grade
Total
Gender breakdown

MC/INF/301 Annex (English only) Page 8
Figure 7: General Service staff in the Field – Distribution by category/grade and gender, June 2010
0%
20%
40%
60%
80%
100%
Male 212 83 63 329 305 478 370 162 102 4 16 3 3 113 36 20 2 720 678
Female 91 30 4 99 326 572 388 189 91 7 11 1 5 2 104 39 8 3 461 676
G-1 G-1A G-1B G-2 G-3 G-4 G-5 G-6 G-7 G-8 G-9 G-10 G-11 G-13 NO-A NO-B NO-C NO-D ST UG
Figure 8: Headquarters General Service staff4 – Distribution by country of nationality and gender, June 2010
4 Including short-term employees.
Gender Country of nationality
F M Total
Albania 1 1 Argentina 1 1 Austria 0 Azerbaijan 0 Barbados 1 1 Bosnia and Herzegovina 1 1 Bulgaria 1 1 Canada 1 1 Colombia 1 1 Congo 1 1 Estonia 0 France 15 7 22 Germany 1 1 2 Ghana 1 1 Indonesia 1 1 Italy 3 1 4 Mexico 1 1 Netherlands 1 1 Peru 1 1 Philippines 1 1 Portugal 0 Romania 1 1 Slovakia 0 Spain 1 1 Sri Lanka 2 2 Switzerland 13 3 16 The former Yugoslav Republic of Macedonia 1 2 3 United Kingdom 7 1 8 United Republic of Tanzania 2 2 Uruguay 2 2
Grand total 55 22 77

MC/INF/301 Annex (English only) Page 9
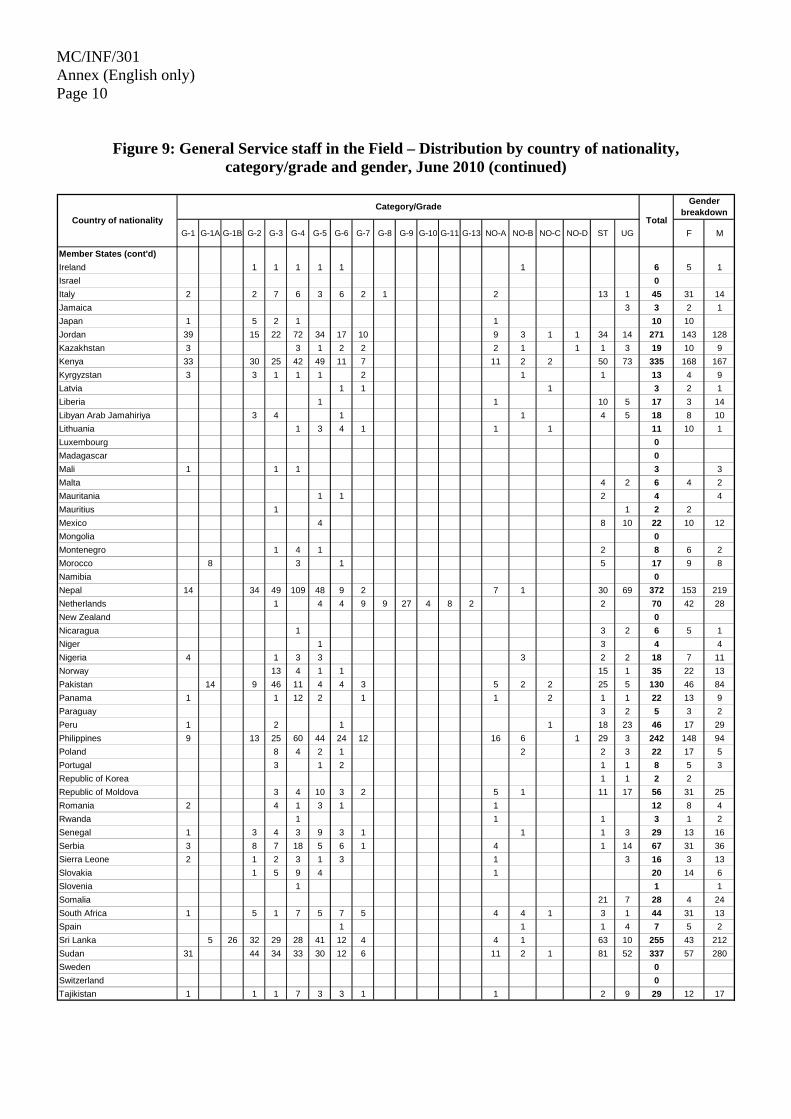
Figure 9: General Service staff in the Field – Distribution by country of nationality, category/grade and gender, June 2010
G-1 G-1A G-1B G-2 G-3 G-4 G-5 G-6 G-7 G-8 G-9 G-10 G-11 G-13 NO-A NO-B NO-C NO-D ST UG F M
Member States
Afghanistan 7 17 27 5 26 25 9 12 3 1 47 27 206 19 187
Albania 2 2 4 1 1 1 1 1 1 14 10 4
Algeria 0
Angola 5 21 26 7 19
Argentina 1 3 3 8 2 2 3 3 25 21 4
Armenia 3 4 1 1 2 1 9 21 11 10
Australia 3 9 6 3 1 22 18 4
Austria 7 8 6 2 1 1 2 2 29 21 8
Azerbaijan 1 2 1 3 1 1 1 16 26 16 10
Bahamas 1 1 2 2
Bangladesh 3 3 25 12 7 4 3 11 2 1 8 4 83 31 52
Belarus 2 3 8 1 2 1 1 18 12 6
Belgium 1 7 25 12 8 1 1 7 62 35 27
Belize 0
Benin 0
Bolivia (Plurinational State of) 12 4 16 7 9
Bosnia and Herzegovina 2 4 3 1 10 20 13 7
Brazil 0
Bulgaria 1 1 2 4 2 2
Burkina Faso 0
Burundi 1 1 1 3 2 1
Cambodia 7 2 4 4 2 4 1 2 1 3 10 40 15 25
Cameroon 1 1 2 4 2 2
Canada 3 3 2 1
Cape Verde 0
Chile 1 3 3 3 10 7 3
Colombia 19 25 33 23 49 19 5 31 7 4 26 271 512 319 193
Congo 6 6 3 3
Costa Rica 1 2 1 2 1 2 10 18 37 22 15
Côte d’Ivoire 1 1 1 2 1 2 10 1 19 7 12
Croatia 1 1 2 1 1 6 5 1
Cyprus 0
Czech Republic 4 4 1 1 2 12 7 5
Democratic Republic of the Congo
1 11 3 4 1 50 23 93 16 77
Denmark 0
Dominican Republic 2 1 1 12 1 17 9 8
Ecuador 12 11 2 10 2 4 5 3 9 58 27 31
Egypt 3 2 12 3 3 2 2 11 15 53 25 28
El Salvador 3 1 1 2 2 7 16 11 5
Estonia 1 3 1 5 5
Finland 3 5 2 4 1 6 3 24 14 10
France 11 11 10 1
Gabon 0
Gambia 1 1 2 1 1
Georgia 5 4 2 2 2 2 1 2 38 2 60 36 24
Germany 11 5 8 1 1 1 3 30 18 12
Ghana 4 5 4 11 10 8 1 3 2 1 2 51 26 25
Greece 4 1 1 3 1 1 1 3 15 9 6
Guatemala 8 1 8 1 5 1 2 2 3 31 14 17
Guinea 4 2 2 8 3 1 1 21 6 15
Guinea-Bissau 0
Haiti 10 10 6 21 5 3 2 3 1 2 1 114 6 184 37 147
Honduras 2 3 6 2 1 14 9 5
Hungary 1 2 1 3 2 2 3 14 7 7
India 4 3 3 1 11 4 7
Iran (Islamic Republic of) 1 1 2 1 3 1 1 1 2 13 5 8
Category/Grade
Total
Gender breakdown
Country of nationality
MC/INF/301 Annex (English only) Page 10
Figure 9: General Service staff in the Field – Distribution by country of nationality, category/grade and gender, June 2010 (continued)
G-1 G-1A G-1B G-2 G-3 G-4 G-5 G-6 G-7 G-8 G-9 G-10 G-11 G-13 NO-A NO-B NO-C NO-D ST UG F M
Member States (cont'd)
Ireland 1 1 1 1 1 1 6 5 1
Israel 0
Italy 2 2 7 6 3 6 2 1 2 13 1 45 31 14
Jamaica 3 3 2 1
Japan 1 5 2 1 1 10 10
Jordan 39 15 22 72 34 17 10 9 3 1 1 34 14 271 143 128
Kazakhstan 3 3 1 2 2 2 1 1 1 3 19 10 9
Kenya 33 30 25 42 49 11 7 11 2 2 50 73 335 168 167
Kyrgyzstan 3 3 1 1 1 2 1 1 13 4 9
Latvia 1 1 1 3 2 1
Liberia 1 1 10 5 17 3 14
Libyan Arab Jamahiriya 3 4 1 1 4 5 18 8 10
Lithuania 1 3 4 1 1 1 11 10 1
Luxembourg 0
Madagascar 0
Mali 1 1 1 3 3
Malta 4 2 6 4 2
Mauritania 1 1 2 4 4
Mauritius 1 1 2 2
Mexico 4 8 10 22 10 12
Mongolia 0
Montenegro 1 4 1 2 8 6 2
Morocco 8 3 1 5 17 9 8
Namibia 0
Nepal 14 34 49 109 48 9 2 7 1 30 69 372 153 219
Netherlands 1 4 4 9 9 27 4 8 2 2 70 42 28
New Zealand 0
Nicaragua 1 3 2 6 5 1
Niger 1 3 4 4
Nigeria 4 1 3 3 3 2 2 18 7 11
Norway 13 4 1 1 15 1 35 22 13
Pakistan 14 9 46 11 4 4 3 5 2 2 25 5 130 46 84
Panama 1 1 12 2 1 1 2 1 1 22 13 9
Paraguay 3 2 5 3 2
Peru 1 2 1 1 18 23 46 17 29
Philippines 9 13 25 60 44 24 12 16 6 1 29 3 242 148 94
Poland 8 4 2 1 2 2 3 22 17 5
Portugal 3 1 2 1 1 8 5 3
Republic of Korea 1 1 2 2
Republic of Moldova 3 4 10 3 2 5 1 11 17 56 31 25
Romania 2 4 1 3 1 1 12 8 4
Rwanda 1 1 1 3 1 2
Senegal 1 3 4 3 9 3 1 1 1 3 29 13 16
Serbia 3 8 7 18 5 6 1 4 1 14 67 31 36
Sierra Leone 2 1 2 3 1 3 1 3 16 3 13
Slovakia 1 5 9 4 1 20 14 6
Slovenia 1 1 1
Somalia 21 7 28 4 24
South Africa 1 5 1 7 5 7 5 4 4 1 3 1 44 31 13
Spain 1 1 1 4 7 5 2
Sri Lanka 5 26 32 29 28 41 12 4 4 1 63 10 255 43 212
Sudan 31 44 34 33 30 12 6 11 2 1 81 52 337 57 280
Sweden 0
Switzerland 0
Tajikistan 1 1 1 7 3 3 1 1 2 9 29 12 17
Category/Grade
Total
Gender breakdown
Country of nationality

MC/INF/301 Annex (English only) Page 11
Figure 9: General Service staff in the Field – Distribution by country of nationality, category/grade and gender, June 2010 (continued)
G-1 G-1A G-1B G-2 G-3 G-4 G-5 G-6 G-7 G-8 G-9 G-10 G-11 G-13 NO-A NO-B NO-C NO-D ST UG F M
Member States (cont'd)
Thailand 16 16 19 68 41 28 3 2 6 1 29 32 261 151 110
Togo 0
Trinidad and Tobago 1 1 2 1 1
Tunisia 1 1 1 1 4 2 2
Turkey 1 9 5 2 1 2 7 4 31 21 10
Uganda 6 1 4 4 2 2 1 1 1 32 1 55 22 33
Ukraine 1 3 26 10 4 6 5 2 43 100 67 33
United Kingdom 4 56 12 12 4 3 1 7 11 110 53 57
United Republic of Tanzania 2 6 3 9 8 1 2 2 33 13 20
United States of America 10 1 9 16 6 8 1 4 8 63 36 27
Uruguay 2 1 12 15 13 2
Venezuela (Bolivarian Republic of)
1 5 6 3 3
Viet Nam 3 5 19 18 8 7 4 3 2 2 2 73 53 20
Yemen 1 1 1 1 1 2 1 11 2 21 8 13
Zambia 8 1 1 3 1 1 12 3 30 11 19
Zimbabwe 27 13 22 18 23 9 3 9 2 21 11 158 67 91
Non-Member States
Chad 2 1 1 11 15 4 11
China, including Hong Kong Special Administrative Region
2 1 1 4 8 6 2
Cuba 1 1 1
Djibouti 1 1 1 3 2 1
Ethiopia 1 3 2 11 26 6 5 1 21 76 22 54
Guyana 1 3 4 2 2
Indonesia 26 12 8 61 45 23 11 6 64 18 274 117 157
Iraq 1 9 12 16 7 10 4 9 32 76 176 28 148
Kuwait 1 1 1 1 4 1 3
Lao People´s Dem. Republic 1 1 2 1 5 1 4
Lebanon 8 8 16 11 5
Malaysia 2 2 1 1
Mozambique 1 1 3 5 1 4
Myanmar 5 1 1 4 1 1 4 37 184 238 143 95
Papua New Guinea 1 1 1 1 1 5 2 3
Russian Federation 6 6 35 28 15 10 2 6 108 81 27
Saudi Arabia 1 1 1
Syrian Arab Republic 40 5 14 46 20 7 4 4 1 6 4 151 68 83
The former Yugoslav Republic of Macedonia
2 2 1 3 8 5 3
Timor-Leste 1 2 3 1 3 1 2 23 52 88 21 67
Turkmenistan 1 1 1 1 4 2 2
Uzbekistan 1 1 2 4 2 2
TOTAL 303 113 67 428 631 1050 758 351 193 11 27 4 8 2 217 75 28 5 1181 1354 6806 3107 3699
Total
Gender breakdown
Country of nationality
Category/Grade
MC/INF/301 Annex (English only) Page 12
ALTERNATIVE STAFFING RESOURCES
Figure 10: Associate Experts – Distribution by country of nationality, 2006–June 20105
2006 2007 2008 2009 June 2010
Armenia 16
Austria 1 1 1 1 1
Belgium 2 1 1 2 2
Denmark 1 1
Finland 1 1
France 1 1 1
Germany 3 1 1 2 3
Italy 4 4 5 5 5
Japan 1 2 4 3 4
Morocco
Netherlands 4
Niger 17
Sweden 4 1 1 4 4
Switzerland
United States of America 2 2 2
Zimbabwe 18
Total 23 12 16 20 23
5 Includes Associate Experts present for only part of the year. 6 Funded by the Government of the Netherlands. 7 Funded by the Organisation Internationale de la Francophonie. 8 Funded by the Government of Italy.
MC/INF/301 Annex (English only) Page 13
Figure 11: Interns – Distribution by duty station and gender, July 2009–June 2010
F M Total
HeadquartersAccounting 1 1Budget 1 1 2Director General´s Office 7 7Donor Relations 2 1 3Emergency and Post-crisis 8 1 9External Relations 1 1GFMD Support Unit 1 1 2International Dialogue on Migration . 7 2 9International Migration Law and Legal Affairs . 6 1 7Labour and Facilitated Migration . 3 3Media and Communication 2 2Migration Health 7 7PRISM Technical 1 1Regional Advisers 1 1Research and Publications 3 2 5Return Management and Counter-trafficking . 4 2 6Staff Development, Learning and Communication . 2 1 3Technical Cooperation on Migration . 1 1
Headquarters total 55 15 70
FieldAngola 1 1Armenia 1 1Australia 1 1Austria 4 4 8Azerbaijan 2 1 3Bangladesh 1 1Belgium 5 5Bosnia and Herzegovina 3 3Cambodia 3 2 5Colombia 6 2 8Costa Rica 1 1Egypt 2 2 4Finland 1 1 2France 3 3Germany 2 2Guatemala 1 1Hungary 1 1Indonesia 1 2 3Italy 2 1 3Jordan 1 1Kenya 2 2 4Montenegro 1 1Morocco 1 1Pakistan 4 2 6Paraguay 1 1Philippines 5 2 7Poland 1 1Republic of Korea 2 2Russian Federation 5 2 7Slovakia 1 1South Africa 2 2Sudan 1 1Syrian Arab Republic 1 1Tajikistan 1 1Thailand 11 5 16Timor-Leste 1 1Turkey 2 2Ukraine 2 2 4United States of America 1 1Viet Nam 2 2Zambia 1 1Zimbabwe 3 3
Field total 85 38 123
140 53 193
Duty station
GRAND TOTAL

MC/INF/301 Annex (English only) Page 14
Figure 12: Secondees – Distribution by duty station and gender, July 2009–June 2010
Duty station Female Male Total
Headquarters (SYNI Programme*)
Director General’s Office 2 2
Emergency and Post-crisis 3 1 4
International Migration Law and Legal Affairs
1 1
Labour and Facilitated Migration 1 1 2
Media and Communication 1 1
Research and Publications 3 3
Staff Development, Learning and Communication
1 1
Headquarters total 12 2 14
Eastern Europe (SYNI Programme) 3 3 6
Total (SYNI Programme) 15 5 20
Field
Afghanistan 1 1
Indonesia 3 2 5
Morocco 1 1
Netherlands 1 1
Sudan 1 1
Field total 3 6 9
* SYNI is a non-profit-making professional project carried out by Lausanne City Council which offers motivated
professionals the possibility of participating in formative international cooperation assignments in Switzerland and abroad.
MC/INF/301 Annex (English only) Page 15
RECRUITMENT AND SELECTION
Figure 13: Vacancy notices issued for officials, 2006–June 2010
Vacancy notices issued 2006 2007 2008 2009 June 2010
Total number of vacancy notices issued9 72 106 71 75 19
Headquarters positions 8 16 9 18 4
Field positions 64 90 62 57 15
Advertised internally only10 37 56 53 55 10
Headquarters positions 5 12 7 14 1
Field positions 32 44 46 41 9
Advertised internally and externally 35 50 18 20 9
Headquarters positions 3 4 2 4 3
Field positions 32 46 16 16 6
Figure 14: Officials appointed through vacancy notices, 2006–June 2010
Vacancy notices issued 2006 2007 2008 2009 June 2010
Vacancies filled internally 45 46 40 45 6
Headquarters positions 5 11 5 12 1
Field positions 40 35 35 33 5
Vacancies filled externally 14 40 10 18 4
Headquarters positions 2 3 1 4 1
Field positions 12 37 9 14 3
Total11 59 86 50 63 10
9 Since January 2008, vacancy notices advertised internally have also been open to external candidates from non-represented Member
States. 10 From January 2009 to June 2010, IOM issued 94 vacancy notices (75 + 19). 11 From January 2009 to June 2010, IOM recruited and placed a total of 73 staff members appointed through vacancy notices.

MC/INF/301 Annex (English only) Page 16
Figure 15: Officials appointed through vacancy notices – Distribution by country of nationality, 2006–June 2010
Country of nationality 2006 2007 2008 2009 June 2010
Afghanistan 1 Albania 1Argentina 1Australia 2 7 3 3 2Austria 2 2 1Azerbaijan 1 1Bangladesh 2Belarus 1Belgium 1Bosnia and HerzegovinaBrazil 1 2Burkina FasoCanada 7 1 3 2 1Cape VerdeChile 1ColombiaCosta Rica 2 2 2Côte d’Ivoire 1 1 CroatiaCzech RepublicDenmarkEcuador 1Egypt 1 3 1
Eritrea12
Ethiopia13 1 1 Finland 1France 5 5 2 2Georgia 1Germany 2 3 4 3 1Ghana 1 1Greece 1HungaryIndia 2 1 2
Indonesia13 2
Iraq12 1Ireland 1 1Israel 1Italy 4 8 2 5 Japan 1 1 1 Jordan 2 2 1 Kazakhstan 1Kenya 1 2 1Latvia 1 1Liberia 1Lithuania
Malaysia12 1Morocco
Mozambique13
Netherlands 1 2 2 1New Zealand 1
MC/INF/301 Annex (English only) Page 17
Figure 15: Officials appointed through vacancy notices – Distribution by country of nationality, 2006–June 2010 (continued)
Country of nationality 2006 2007 2008 2009 June 2010
NicaraguaNiger 1Nigeria 1Norway 1Pakistan 1Panama 1 PeruPhilippines 1 2 2 2 PolandPortugal 1 1Republic of Korea 1Republic of Moldova 1Romania 1 1 1
Russian Federation13 2 6 3 Senegal 1 2 Serbia 1 1Sierra Leone 1South Africa 1Slovakia 1Spain 1Sri Lanka 1Sudan 1 1 Sweden 2 1Switzerland 3 Thailand 2 1 1The former Yugoslav Republic of
Macedonia13 2 1
Togo 1Trinidad and Tobago 1 TunisiaTurkeyUganda 1Ukraine 2United Kingdom 3 1 2 5United States of America 8 14 11 11 Uruguay 1Venezuela (Bolivarian Republic of) 1
Total 59 86 50 63 10
Number of nationalities 30 36 26 31 9
12 Non-Member States.13 Observer States.

MC/INF/301 Annex (English only) Page 18
Figure 16: Vacancy notices issued for employees at Headquarters, 2006–June 2010
Vacancy notices issued 2006 2007 2008 2009 June 2010
Total number of vacancy notices issued 3 3 4 5 3
Advertised internally only 3 2 3 4 2
Advertised internally and externally 0 1 1 1 1
Total number of corresponding positions 3 3 4 5 3
Vacancies filled internally 2 1 3 4 2
Employees from Headquarters 2 1 3 1 0
Employees from the Field 0 0 1 3 2
Vacancies filled externally 0 114 1 0 1
Cancelled/reissued 0 0 0 115 0
Figure 17: Mobility of internal staff, 2006–June 2010
2006 2007 2008 2009 June 2010
From Headquarters to the Field 6 5 4 0 1
From the Field to Headquarters 1 8 2 5 1
From one Field Office to another 25 41 28 28 5
Reassignment within same duty station 13 19 11 14 1
Total 45 73 45 47 8
Figure 18: Temporary recruitment and selection, 2006–June 2010
2006 2007 2008 2009 June 2010
For officials
Number of temporary vacancy notices issued16 101 41 182 32 24
Number of temporary positions filled 56 17 182 21 17 Of which for emergency and post-conflict operations
26 21 66 1 1
For employees at Headquarters
Number of temporary vacancy notices issued 0 0 5 1 0
Number of temporary positions filled 0 0 5 1 0
Direct recruitment For officials 0 0 0 153 130
For employees 0 0 0 5 4
14 External candidate from a non-represented Member State. 15 VN 2009/01 (E) Administrative & Financial Assistant (G5) - Geneva, Switzerland has been cancelled and reissued as
SVN 2009/01 (E) Administrative & Financial Assistant (G5) - Geneva, Switzerland. 16 From January 2009 to June 2010, 56 temporary vacancies were published.
MC/INF/301 Annex (English only) Page 19
STAFF DEVELOPMENT AND LEARNING
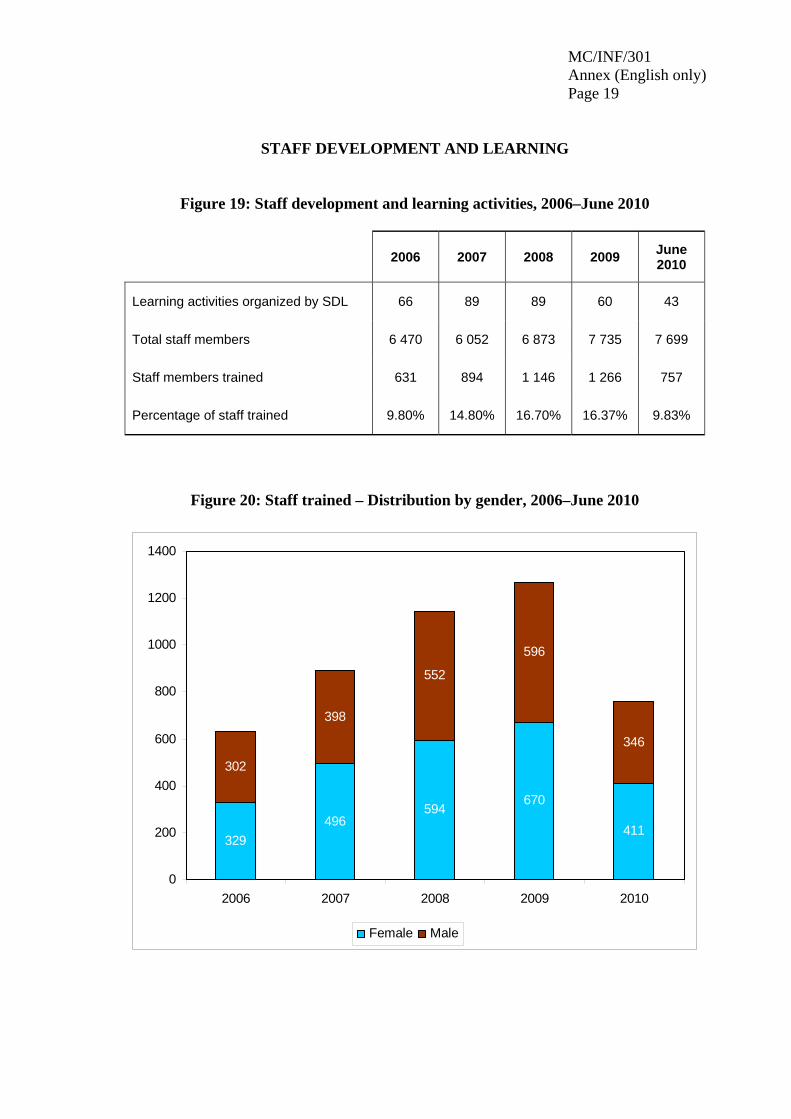
Figure 19: Staff development and learning activities, 2006–June 2010
2006 2007 2008 2009 June 2010
Learning activities organized by SDL 66 89 89 60 43
Total staff members 6 470 6 052 6 873 7 735 7 699
Staff members trained 631 894 1 146 1 266 757
Percentage of staff trained 9.80% 14.80% 16.70% 16.37% 9.83%
Figure 20: Staff trained – Distribution by gender, 2006–June 2010
496594
670
411
302
398
552
596
346
329
0
200
400
600
800
1000
1200
1400
2006 2007 2008 2009 2010
Female Male

MC/INF/301 Annex (English only) Page 20
Figure 21: Staff trained – Distribution by location, 2006–June 2010
559748
9741094
694
72
146
172
172
63
0
200
400
600
800
1 000
1 200
1 400
2006 2007 2008 2009 2010
Field HQ
Figure 22: Staff trained – Distribution by category, 2006–June 2010
189
377400
469
131
363 365
535
79
152
211229
255
371
568
0
100
200
300
400
500
600
2006 2007 2008 2009 2010
Officials Employees Ungraded
MC/INF/301 Annex (English only) Page 21
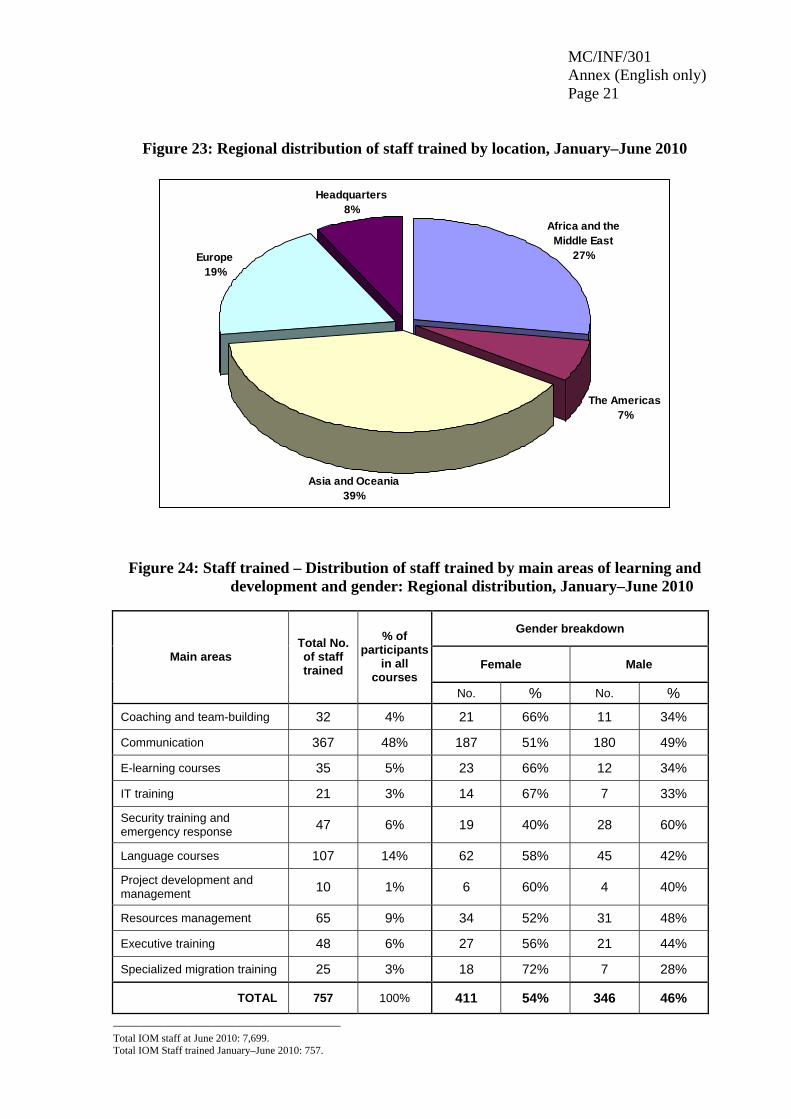
Figure 23: Regional distribution of staff trained by location, January–June 2010
The Americas7%
Europe19%
Asia and Oceania39%
Headquarters8%
Africa and the Middle East
27%
Figure 24: Staff trained – Distribution of staff trained by main areas of learning and development and gender: Regional distribution, January–June 2010
Gender breakdown
Female Male Main areas
Total No. of staff trained
% of participants
in all courses
No. % No. %
Coaching and team-building 32 4% 21 66% 11 34%
Communication 367 48% 187 51% 180 49%
E-learning courses 35 5% 23 66% 12 34%
IT training 21 3% 14 67% 7 33%
Security training and emergency response 47 6% 19 40% 28 60%
Language courses 107 14% 62 58% 45 42%
Project development and management 10 1% 6 60% 4 40%
Resources management 65 9% 34 52% 31 48%
Executive training 48 6% 27 56% 21 44%
Specialized migration training 25 3% 18 72% 7 28%
TOTAL 757 100% 411 54% 346 46%
______________________________________
Total IOM staff at June 2010: 7,699. Total IOM Staff trained January–June 2010: 757.