md 200 scan tool user's guide - road ranger this user guide references a screen on the md 200...
TRANSCRIPT
™
MD 200 Series Vehicle Diagnostic Scanner User's Guide APMT-0200 October 2006

Page left blank intentionally

Warnings and Cautions
Safety, Warnings, and Cautions
Always keep personal safety in mind when working on vehicles. Do not ignore common sense.
Use appropriate safety equipment including:• Safety glasses• Safety shoes• Gloves• Proper transmission jack or lift with safety chains• Guards and protective devices for presses, pullers, and drivers.• Wheel chocks
To protect yourself and the vehicle always adhere to the following precautions:
• Always refer to OEM manufactures service procedures before remov-ing or replacing any equipment.
• Keep yourself and equipment free from hot or moving parts.• Always disconnect the battery before replacing any electrical compo-
nent.• Always use a properly ventilated area when the engine is running.• Always have the parking brakes applied, the transmission in neutral,
and wheels blocked when working on a vehicle.• Never leave a vehicle unattended with the engine running.• Never operate diagnostic equipment while driving the vehicle.
Table of Contents
Safety, Warnings, and Cautions ............................................................ 1Introduction........................................................................................... 1
Eaton Support Hotline .................................................................... 1Using this User Guide............................................................................ 2
Common Navigation Tips ............................................................... 3Installing Batteries................................................................................. 5Cables & Connections ........................................................................... 6Powering up .......................................................................................... 9MD Scan- Overview............................................................................. 10MD Scan- Opening Screen .................................................................. 11MD Scan - Fault Code Retrieval ........................................................... 13
Overview ...................................................................................... 13Fault Code Menu .......................................................................... 14Fault Code Display - Viewing Codes ............................................. 15Clearing Fault Codes .................................................................... 16
MD Scan- Monitor Data....................................................................... 18Overview ...................................................................................... 18Data Monitor Main Menu ............................................................. 18Quick List ..................................................................................... 19User Data List Main Menu............................................................ 20Data List Setup - Component Selection........................................ 22View Data List .............................................................................. 25Save Data List .............................................................................. 26View (Saved) Data List ................................................................. 27Clear Current List ......................................................................... 29Component Information ............................................................... 30Data Collection ............................................................................. 31Overview ...................................................................................... 31Data Collection Main Menu .......................................................... 32Setup Capture List........................................................................ 33Record Data ................................................................................. 34View Data Capture........................................................................ 35Export Data Capture (to PC) ......................................................... 37Collection Configuration............................................................... 40
MD Comm- Overview .......................................................................... 43MD Comm- Connections and Operation.............................................. 44
What to Expect ............................................................................. 45Loading Drivers............................................................................ 45
MD Link- Overview.............................................................................. 46MD Link- Main Menu........................................................................... 47
Table of Contents
MD Link- Link Faults ........................................................................... 49Overview ...................................................................................... 49Viewing the Fault Menu - J1939................................................... 49Viewing the Fault Menu - J1587................................................... 52
MD Link- Monitor................................................................................ 53Overview ...................................................................................... 53Viewing the Link Monitor Menu ................................................... 53
MD Link- Data Capture........................................................................ 58Overview ...................................................................................... 58
MD Link-Troubleshooting J1939 Communication Links ..................... 62MD Logger- Overview ......................................................................... 67MD Logger- Main Menu ...................................................................... 68MD Logger- Setup............................................................................... 69
User Data List .............................................................................. 70Data List Setup ............................................................................ 72
MD Logger- Triggers........................................................................... 76Overview ...................................................................................... 76
MD Logger- Data Capture ................................................................... 81MD Logger- Record ............................................................................ 83
Overview ...................................................................................... 83Broadcast Data............................................................................. 87
MD Logger- View Data ........................................................................ 90MD Logger- Export Data to PC............................................................ 94Function Selection and Tool Configuration.......................................... 97
MD Comm - Function Selection ................................................... 98MD Scan - Function Selection...................................................... 99MD Link - Function Selection ..................................................... 100MD Logger - Function Selection ................................................ 101Configuration ............................................................................. 102User Upgrade............................................................................. 104Download................................................................................... 104System Info ............................................................................... 106
1
Getting Started
Introduction
This manual describes the procedure for installing and using the Eaton MD-200 Diagnostic Tool. This manual assumes the user has previous Microsoft® Windows™ experience.
This diagnostic scan tool is a software program designed to diagnose elec-tronic systems on heavy duty vehicles using the SAE J1587 and J1939 diag-nostic/communication links.
The scan tool has four available functions. It can be configured to be a scan tool, a communication adapter, a link tester, a data logger or any combination of options. The software has all four functions built in and requires an unlock code to free the function for use.
Eaton Support Hotline
Please call 1-800-826-HELP (4357) to contact an Eaton representative.
If you need assistance please have the following information ready:• A brief explanation of the problem you are having.• Include the exact wording of any error or warning message you have
received.• Give the sequence of steps you took before the error occurred.• Describe any changes made to your computer recently, and if the
software was running correctly in the past.
RegistrationRegister by mail using the accompanying registration card. Or register online at https://www.roadrangerstore.com, and receive one additional year of warranty coverage.
Registration allows users to be notified of upgrades and other useful informa-tion.
Getting Started
Using this User GuidePressing a buttonIn this User Guide, any time you are instructed to push a button, the button name will be shown with small arrow symbols. Examples include:
>SCAN< would indicate that you push the corresponding button on the MD-200.
>ENTER< would indicate that you push the corresponding button on the MD-200.
Selecting item on the screenIf a line on the display is to be selected on the scan tool, the reference to the line will be in bold text.
Screen HeadingWhen this user guide references a screen on the MD 200 it will be shown in italics
2
Getting Started
Common Navigation Tips
Navigation has been standardized so most commands can be selected using the >Up/Down Arrows< and pressing >Enter<.
Major functions are initiated by pressing: >SCAN< to view fault codes, >MON< to monitor data, or >DATA< to record data.
To move to the next screen press >ENTER< after highlighting the desired choice with the >Up/Down Arrows<. To move to a previous screen, press the appropriate >SCAN< or >MON< or >DATA< button.
For example:
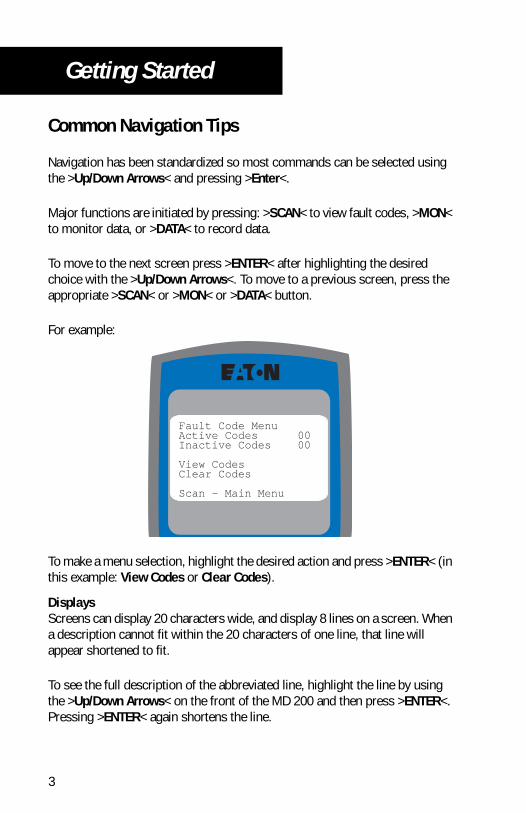
To make a menu selection, highlight the desired action and press >ENTER< (in this example: View Codes or Clear Codes).
DisplaysScreens can display 20 characters wide, and display 8 lines on a screen. When a description cannot fit within the 20 characters of one line, that line will appear shortened to fit.
To see the full description of the abbreviated line, highlight the line by using the >Up/Down Arrows< on the front of the MD 200 and then press >ENTER<. Pressing >ENTER< again shortens the line.
Fault Code Menu Active Codes 00Inactive Codes 00
View CodesClear Codes
Scan - Main Menu
3
Getting Started
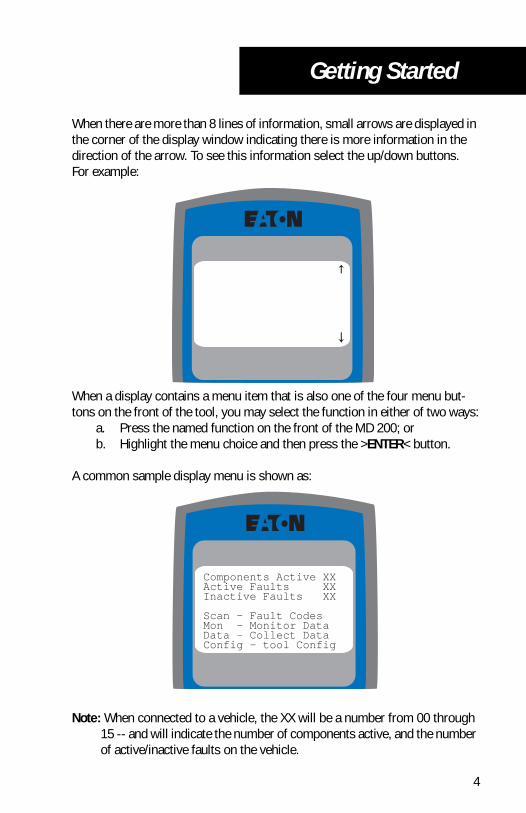
When there are more than 8 lines of information, small arrows are displayed in the corner of the display window indicating there is more information in the direction of the arrow. To see this information select the up/down buttons. For example:
When a display contains a menu item that is also one of the four menu but-tons on the front of the tool, you may select the function in either of two ways:
a. Press the named function on the front of the MD 200; or b. Highlight the menu choice and then press the >ENTER< button.
A common sample display menu is shown as:
Note: When connected to a vehicle, the XX will be a number from 00 through 15 -- and will indicate the number of components active, and the number of active/inactive faults on the vehicle.
Components Active XX Active Faults XXInactive Faults XX
Scan - Fault CodesMon - Monitor DataData - Collect DataConfig - tool Config
4

5
Overview
Installing Batteries1. Remove the battery cover.2. Install four AA alkaline batteries in the orientation illustrated.
3. Replace the battery cover.

Overview
Cables & ConnectionsNote: It is not necessary to turn off the tool prior to making connections.
Four basic cables are used. Three cables are included in every kit; however, the SC-CBL-03 combination 3-Pin Deutsch cable is only supplied with kits including the Link Tester function.
PC-CBL-01 (PC to Scan Tool Cable)
This cable is used for transfer of data collection files to the PC and for the MD Comm function.
Part Number Description
PC-CBL-01 PC (9-Pin Serial) to Scan Tool (RJ45) Cable
PC-CBL-02 Programming Cable
SC-CBL-01 Scan Tool to 6-Pin Deutsch Cable
SC-CBL-02 Scan Tool to 9-Pin Deutsch Cable
SC-CBL-03 Scan Tool to 3-Pin Deutsch
RJ45 Cable 9-Pin Serial Connector
6
Overview
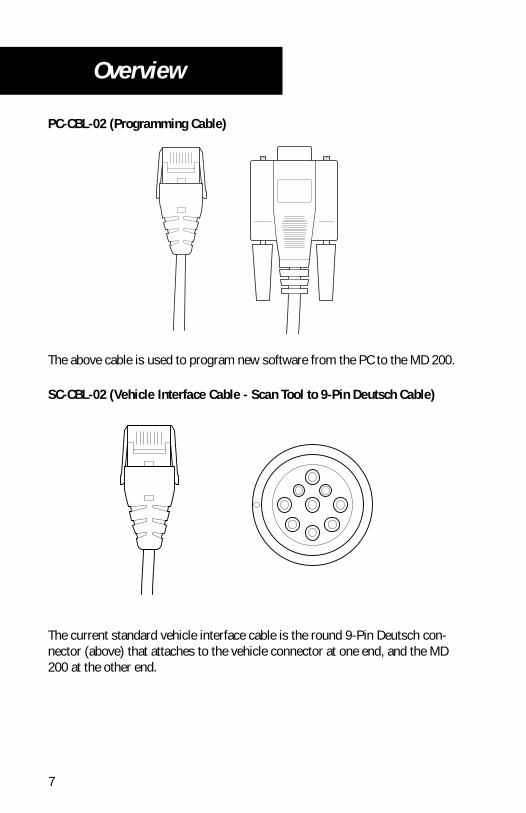
PC-CBL-02 (Programming Cable)
The above cable is used to program new software from the PC to the MD 200.
SC-CBL-02 (Vehicle Interface Cable - Scan Tool to 9-Pin Deutsch Cable)
The current standard vehicle interface cable is the round 9-Pin Deutsch con-nector (above) that attaches to the vehicle connector at one end, and the MD 200 at the other end.
7
Overview
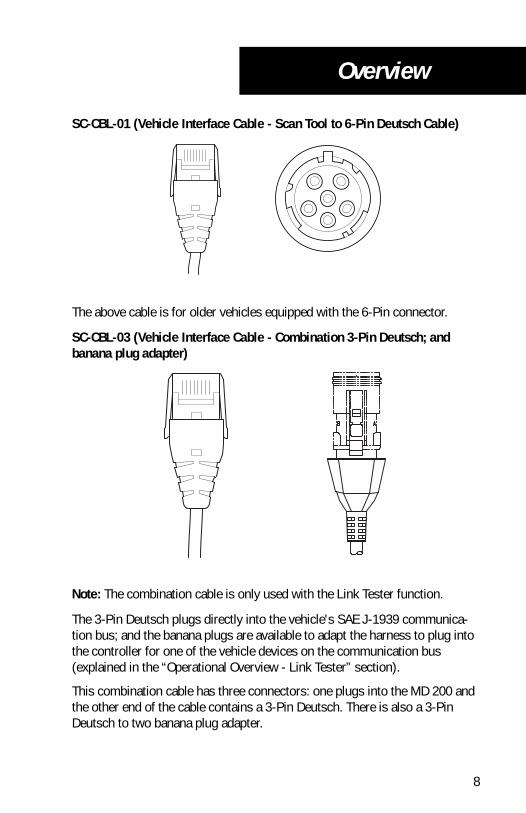
SC-CBL-01 (Vehicle Interface Cable - Scan Tool to 6-Pin Deutsch Cable)
The above cable is for older vehicles equipped with the 6-Pin connector.
SC-CBL-03 (Vehicle Interface Cable - Combination 3-Pin Deutsch; and banana plug adapter)
Note: The combination cable is only used with the Link Tester function.
The 3-Pin Deutsch plugs directly into the vehicle's SAE J-1939 communica-tion bus; and the banana plugs are available to adapt the harness to plug into the controller for one of the vehicle devices on the communication bus (explained in the “Operational Overview - Link Tester” section).
This combination cable has three connectors: one plugs into the MD 200 and the other end of the cable contains a 3-Pin Deutsch. There is also a 3-Pin Deutsch to two banana plug adapter.
8
9
Overview
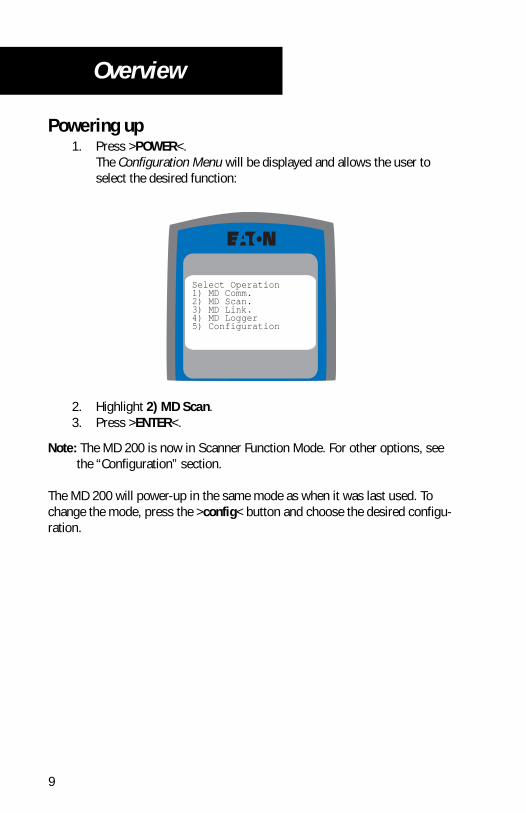
Powering up1. Press >POWER<.
The Configuration Menu will be displayed and allows the user to select the desired function:
2. Highlight 2) MD Scan. 3. Press >ENTER<.
Note: The MD 200 is now in Scanner Function Mode. For other options, see the “Configuration” section.
The MD 200 will power-up in the same mode as when it was last used. To change the mode, press the >config< button and choose the desired configu-ration.
Select Operation1) MD Comm.2) MD Scan.3) MD Link.4) MD Logger5) Configuration
10
MD Scanner - Operation
MD Scan- Overview
The MD 200 in the MD SCAN function allows the user to:
• Check which components are communicating.• Display diagnostic information.• View and clear fault codes.• Capture and export data.
The MD SCAN function only supports the SAE J1587 diagnostic link standard messaging. Some function may not work as described if a component installed on the vehicle does not adhere to the SAE standard.
MD Scanner - Operation
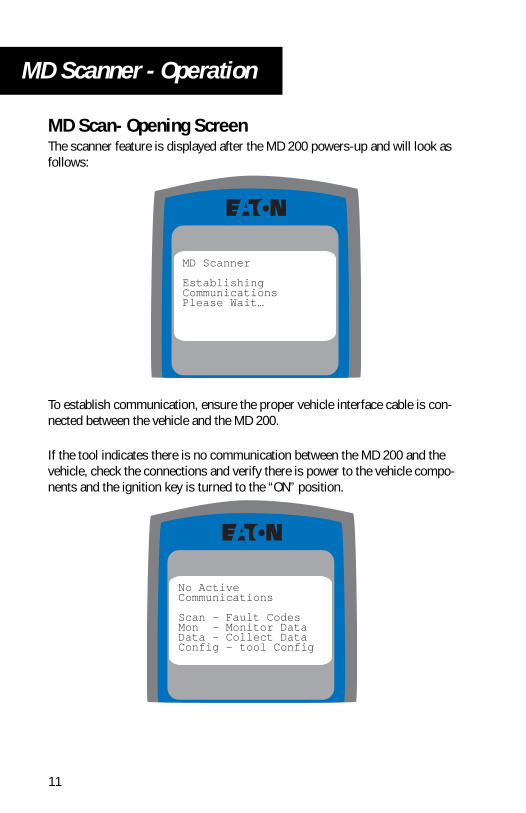
MD Scan- Opening ScreenThe scanner feature is displayed after the MD 200 powers-up and will look as follows:
To establish communication, ensure the proper vehicle interface cable is con-nected between the vehicle and the MD 200.
If the tool indicates there is no communication between the MD 200 and the vehicle, check the connections and verify there is power to the vehicle compo-nents and the ignition key is turned to the “ON” position.
MD Scanner
EstablishingCommunicationsPlease Wait…
No Active Communications
Scan - Fault CodesMon - Monitor DataData - Collect DataConfig - tool Config
11
MD Scanner - Operation
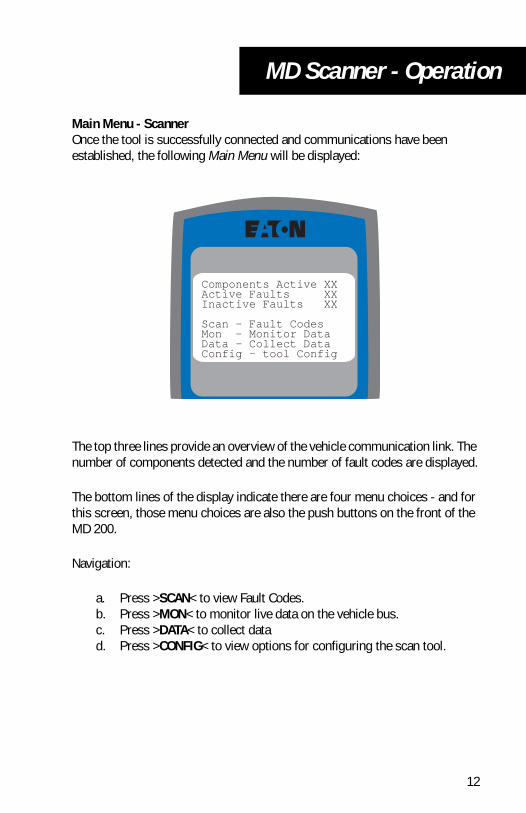
Main Menu - ScannerOnce the tool is successfully connected and communications have been established, the following Main Menu will be displayed:
The top three lines provide an overview of the vehicle communication link. The number of components detected and the number of fault codes are displayed.
The bottom lines of the display indicate there are four menu choices - and for this screen, those menu choices are also the push buttons on the front of the MD 200.
Navigation:
a. Press >SCAN< to view Fault Codes.b. Press >MON< to monitor live data on the vehicle bus.c. Press >DATA< to collect datad. Press >CONFIG< to view options for configuring the scan tool.
Components Active XX Active Faults XXInactive Faults XX
Scan - Fault CodesMon - Monitor DataData - Collect DataConfig - tool Config
12

MD Scanner - Operation
MD Scan - Fault Code Retrieval
Overview
Fault codes indicate a malfunction in a specific component. Codes are retrieved for any component connected to the vehicle SAE J1587 communica-tions link that provides standard fault messaging.
Pressing the >SCAN< button starts fault code retrieval. Active and inactive fault codes that have already been received will be displayed. The scan tool will then monitor the link for new fault codes and display them as they occur.
13
MD Scanner - Operation
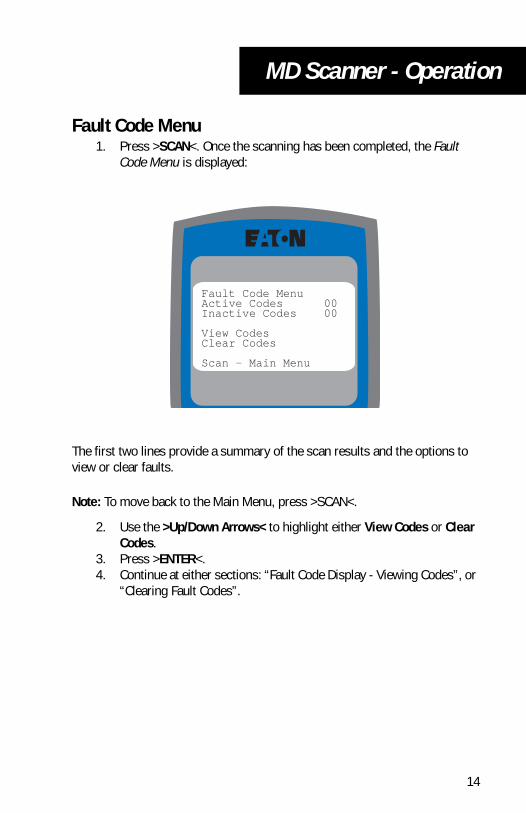
Fault Code Menu 1. Press >SCAN<. Once the scanning has been completed, the Fault
Code Menu is displayed:
The first two lines provide a summary of the scan results and the options to view or clear faults.
Note: To move back to the Main Menu, press >SCAN<.
2. Use the >Up/Down Arrows< to highlight either View Codes or Clear Codes.
3. Press >ENTER<. 4. Continue at either sections: “Fault Code Display - Viewing Codes”, or
“Clearing Fault Codes”.
Fault Code Menu Active Codes 00Inactive Codes 00
View CodesClear Codes
Scan - Main Menu
14

MD Scanner - Operation
Fault Code Display - Viewing Codes
If View Codes is selected from the Main Fault Code screen, all current codes reported on the communication link will be shown. If more than one code is present, the up and down arrows appear in the right corners of the display to indicate the user can scroll in the direction of the arrow(s).
Only one code per screen is displayed. Data to be displayed include MID, SID/PID, FMI, active/inactive status, occurrence count, and full description of the fault.
The following is the format for the View Codes screen, where active and inac-tive faults are shown in the format:
1. Press the >Up/Down Arrows< to move up/down the list when arrows indicate that additional faults exist.Fault codes are grouped by component. The screen displays the component, SAE-1587 fault number (MID, PID/SID, FMI), code description, and FMI description and status.
2. Press >ENTER< or >SCAN< to return to the Fault Code Menu where the user can Clear Codes.
MID/PIDorSID/FMI StatusOccurrence XXMID DescriptionPID/SID DescriptionFMI Description
Scan - Back to Menu
15
MD Scanner - Operation
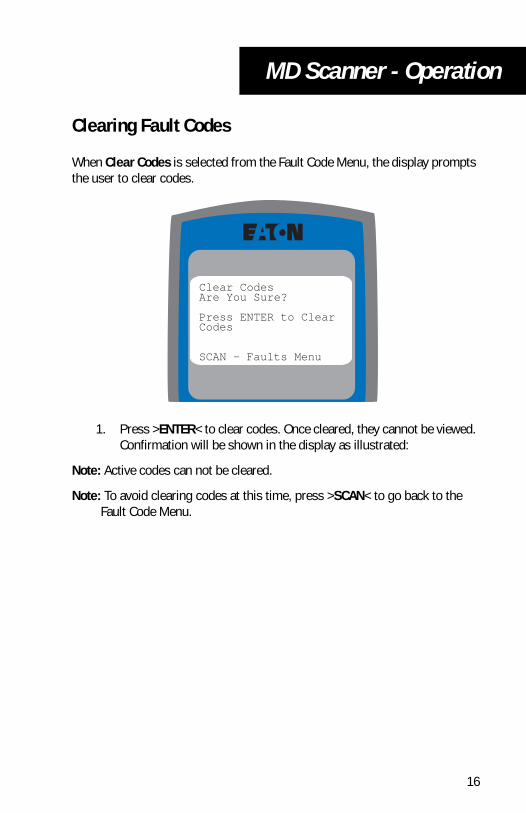
Clearing Fault Codes
When Clear Codes is selected from the Fault Code Menu, the display prompts the user to clear codes.
1. Press >ENTER< to clear codes. Once cleared, they cannot be viewed. Confirmation will be shown in the display as illustrated:
Note: Active codes can not be cleared.
Note: To avoid clearing codes at this time, press >SCAN< to go back to the Fault Code Menu.
Clear CodesAre You Sure?
Press ENTER to ClearCodes
SCAN - Faults Menu
16
MD Scanner - Operation
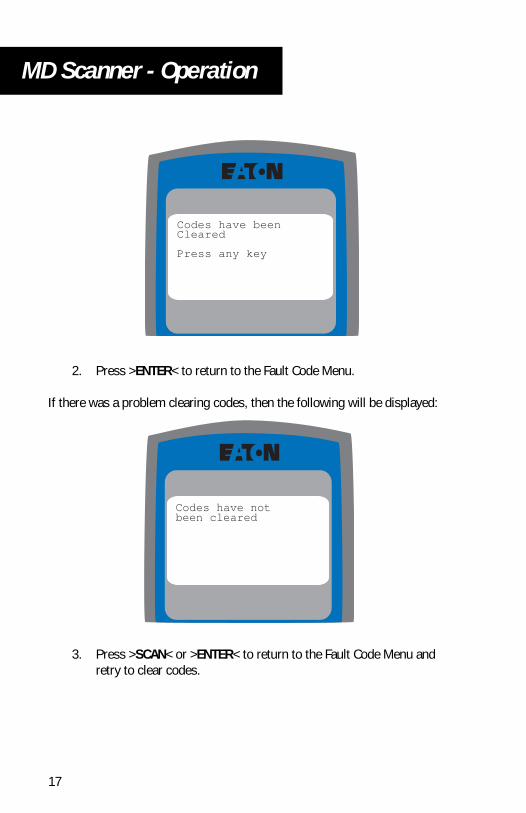
2. Press >ENTER< to return to the Fault Code Menu.
If there was a problem clearing codes, then the following will be displayed:
3. Press >SCAN< or >ENTER< to return to the Fault Code Menu and retry to clear codes.
Codes have beenCleared
Press any key
Codes have notbeen cleared
17
MD Scanner - Operation
MD Scan- Monitor Data
Overview
The Monitor Data function allows the user to view data from components via the vehicle communication link in real time (as it happens).
The data can be displayed by a:• Quick List• Custom User Data List
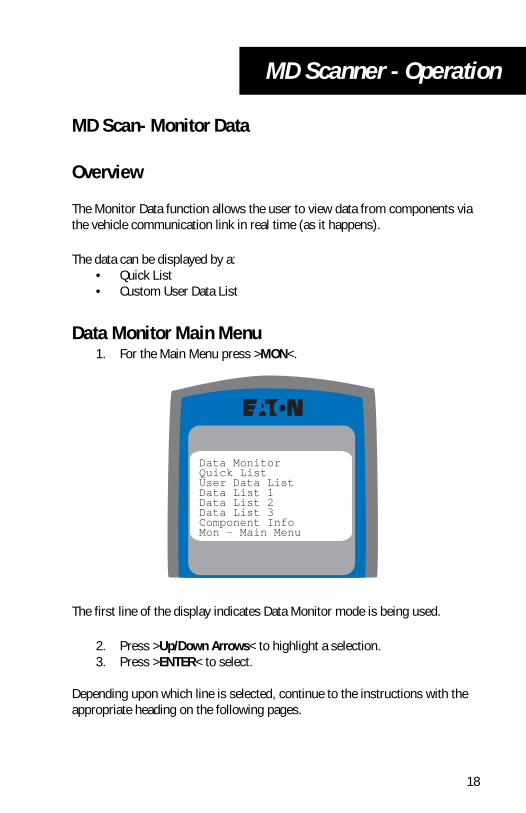
Data Monitor Main Menu1. For the Main Menu press >MON<.
The first line of the display indicates Data Monitor mode is being used.
2. Press >Up/Down Arrows< to highlight a selection.3. Press >ENTER< to select.
Depending upon which line is selected, continue to the instructions with the appropriate heading on the following pages.
Data MonitorQuick ListUser Data ListData List 1Data List 2Data List 3Component InfoMon - Main Menu
18
MD Scanner - Operation
Quick List
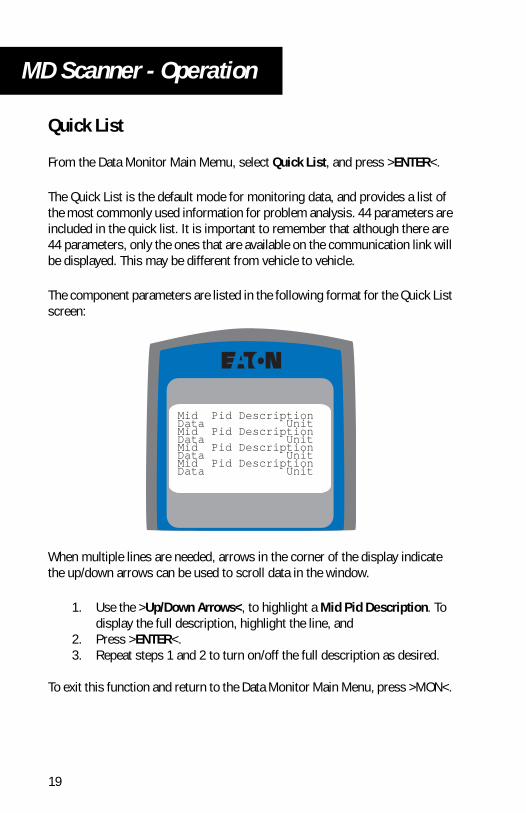
From the Data Monitor Main Memu, select Quick List, and press >ENTER<.
The Quick List is the default mode for monitoring data, and provides a list of the most commonly used information for problem analysis. 44 parameters are included in the quick list. It is important to remember that although there are 44 parameters, only the ones that are available on the communication link will be displayed. This may be different from vehicle to vehicle.
The component parameters are listed in the following format for the Quick List screen:
When multiple lines are needed, arrows in the corner of the display indicate the up/down arrows can be used to scroll data in the window.
1. Use the >Up/Down Arrows<, to highlight a Mid Pid Description. To display the full description, highlight the line, and
2. Press >ENTER<. 3. Repeat steps 1 and 2 to turn on/off the full description as desired.
To exit this function and return to the Data Monitor Main Menu, press >MON<.
Mid Pid DescriptionData UnitMid Pid DescriptionData UnitMid Pid DescriptionData UnitMid Pid DescriptionData Unit
19

MD Scanner - Operation
User Data List Main Menu
From the Data Monitor Main Menu select, User Data List, and press >ENTER<.
The User Data List presents four data choices:
1. Data List Setup, 2. View Data, 3. Save Data List, and4. Clear Current List.
To Create a Custom Data List of Parameters -- Use the Data List Setup Menu choice:
Create a custom list of parameters...1. Press the >Up/Down Arrows< to highlight Data List Setup.2. Press >ENTER<.3. Continue at the “Data List Setup - Component Selection” section.
To View Data:...1. Press the >Up/Down Arrows< to highlight View Data.2. Press >ENTER<.3. Continue at the “View Data List” section.
To Save Data List:...1. Press the >Up/Down Arrows< to highlight Save Data List.
User Data List
Data List Setup View Data Save Data List Clear Current List
Mon - Monitor Menu
20
MD Scanner - Operation
2. Press >ENTER<.3. Continue at the “Save Data List” section.
To Clear Current List:...1. Press the >Up/Down Arrows< to highlight Clear Current List.2. Press >ENTER<.3. Continue at the “Clear Current List” section.
21
MD Scanner - Operation
Data List Setup - Component Selection
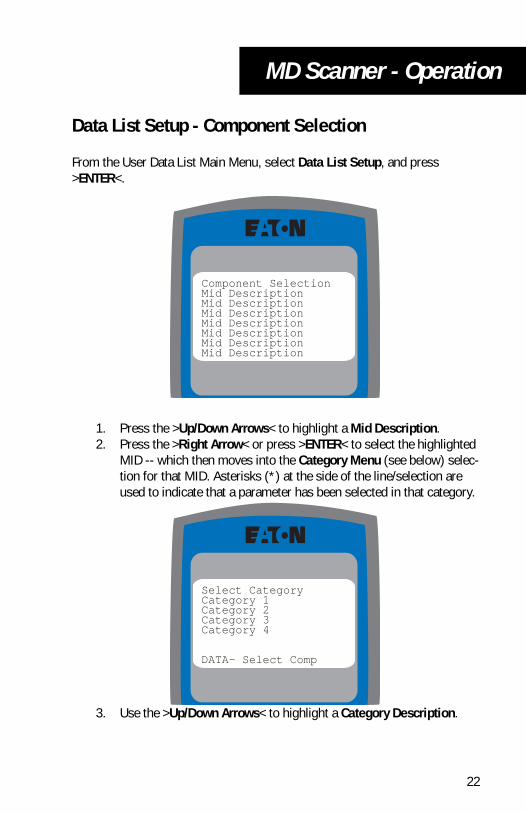
From the User Data List Main Menu, select Data List Setup, and press >ENTER<.
1. Press the >Up/Down Arrows< to highlight a Mid Description.2. Press the >Right Arrow< or press >ENTER< to select the highlighted
MID -- which then moves into the Category Menu (see below) selec-tion for that MID. Asterisks (*) at the side of the line/selection are used to indicate that a parameter has been selected in that category.
3. Use the >Up/Down Arrows< to highlight a Category Description.
Component Selection Mid DescriptionMid DescriptionMid DescriptionMid DescriptionMid DescriptionMid DescriptionMid Description
Select CategoryCategory 1Category 2Category 3Category 4
DATA- Select Comp
22
MD Scanner - Operation
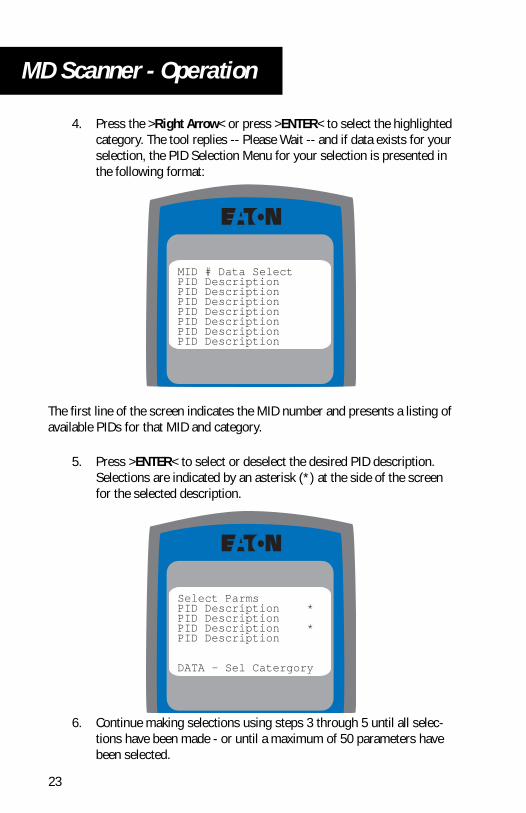
4. Press the >Right Arrow< or press >ENTER< to select the highlighted category. The tool replies -- Please Wait -- and if data exists for your selection, the PID Selection Menu for your selection is presented in the following format:
The first line of the screen indicates the MID number and presents a listing of available PIDs for that MID and category.
5. Press >ENTER< to select or deselect the desired PID description. Selections are indicated by an asterisk (*) at the side of the screen for the selected description.
6. Continue making selections using steps 3 through 5 until all selec-tions have been made - or until a maximum of 50 parameters have been selected.
MID # Data SelectPID DescriptionPID DescriptionPID DescriptionPID DescriptionPID DescriptionPID DescriptionPID Description
Select ParmsPID Description *PID DescriptionPID Description *PID Description
DATA - Sel Catergory
23
MD Scanner - Operation
7. Once all of the PID selections for this MID are complete, continue with the Component Selection until the custom MID/PID selection list is done.
Note: If the MD 200 is turned off by pressing >POWER< before saving the list OR if the user moves to another function, the selections will be lost. The user may save selections into one of three custom User Data Lists by using the Save Data List feature (available at the User Data List Menu).
Note: Using >ENTER< or the >Right Arrow< to move ahead; and the >Left Arrow< or >MON< button to move back, allows the user to go backward or forward through all menus.
24

MD Scanner - Operation
View Data List
From the User Data List Menu, select View Data, and press >ENTER<.
The displayed list is shown below:
1. Press the >Up/Down Arrows< to highlight a MID/PID Description. 2. Press >ENTER< to turn on/off a full description for the highlighted
item.
Note: Save the Data List as one of three available User Data Lists by returning to the User Data List Menu section by pressing the >MON< button and then following the instructions for “Save Data List” in the next section.
Mid Pid DescriptionData Unit Mid Pid DescriptionData UnitMid Pid DescriptionData UnitMid Pid DescriptionData Unit
25
MD Scanner - Operation
Save Data List
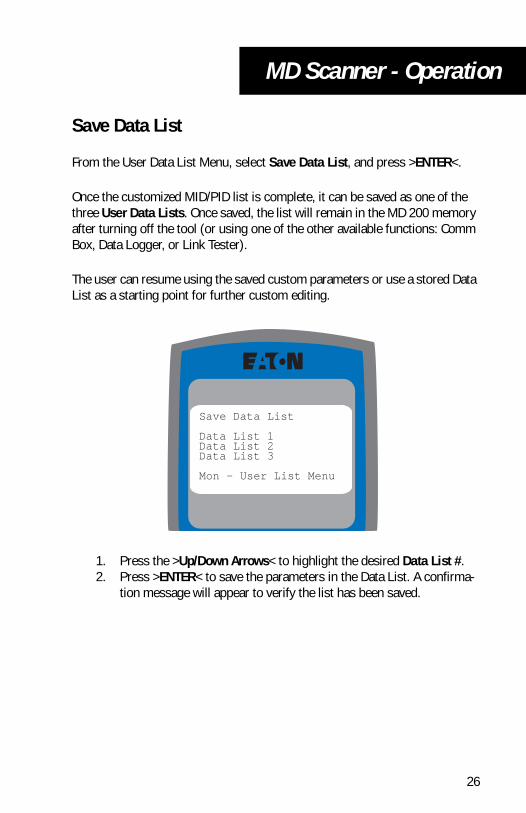
From the User Data List Menu, select Save Data List, and press >ENTER<.
Once the customized MID/PID list is complete, it can be saved as one of the three User Data Lists. Once saved, the list will remain in the MD 200 memory after turning off the tool (or using one of the other available functions: Comm Box, Data Logger, or Link Tester).
The user can resume using the saved custom parameters or use a stored Data List as a starting point for further custom editing.
1. Press the >Up/Down Arrows< to highlight the desired Data List #.2. Press >ENTER< to save the parameters in the Data List. A confirma-
tion message will appear to verify the list has been saved.
Save Data List
Data List 1Data List 2Data List 3
Mon - User List Menu
26
MD Scanner - Operation
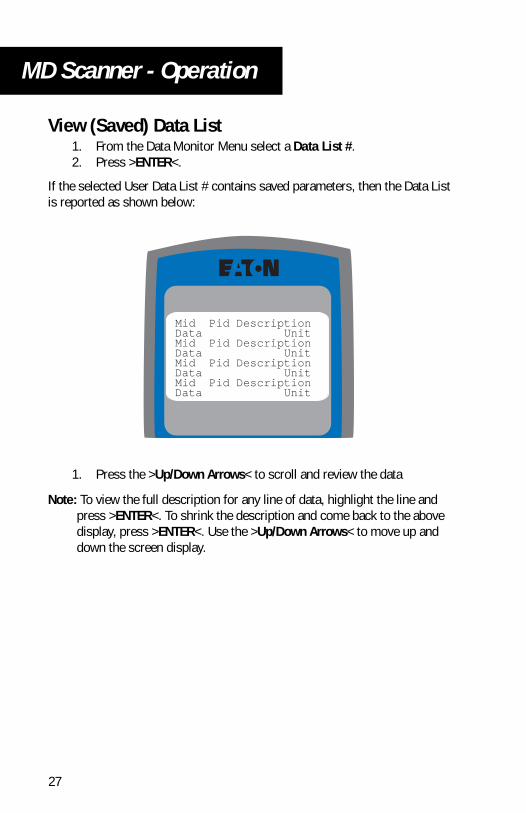
View (Saved) Data List1. From the Data Monitor Menu select a Data List #.2. Press >ENTER<.
If the selected User Data List # contains saved parameters, then the Data List is reported as shown below:
1. Press the >Up/Down Arrows< to scroll and review the data
Note: To view the full description for any line of data, highlight the line and press >ENTER<. To shrink the description and come back to the above display, press >ENTER<. Use the >Up/Down Arrows< to move up and down the screen display.
Mid Pid DescriptionData UnitMid Pid DescriptionData UnitMid Pid DescriptionData UnitMid Pid DescriptionData Unit
27
MD Scanner - Operation
If nothing was saved in the selected User Data List, then the following mes-sage will be displayed:
No data list # saved
28
MD Scanner - Operation
Clear Current List
From the Data Monitor Main Menu, select User Data List, press >ENTER<, select Clear Current List, and press >ENTER<.
After user confirmation, the tool will display “User data list selections cleared”.
This function will clear the currently selected parameter in the data list setup. The saved data lists are not cleared.
29
MD Scanner - Operation
Component Information
From the Data Monitor Main Menu, select Component Info, and press >ENTER<.
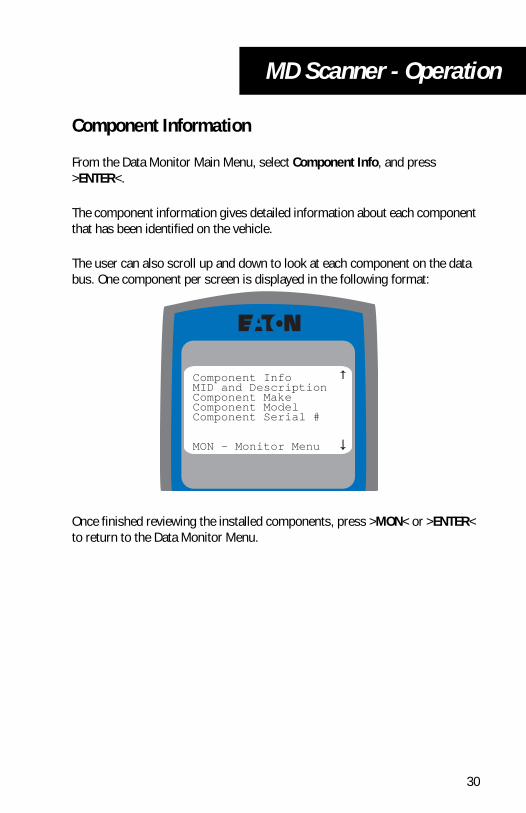
The component information gives detailed information about each component that has been identified on the vehicle.
The user can also scroll up and down to look at each component on the data bus. One component per screen is displayed in the following format:
Once finished reviewing the installed components, press >MON< or >ENTER< to return to the Data Monitor Menu.
Component InfoMID and DescriptionComponent MakeComponent ModelComponent Serial #
MON - Monitor Menu
30
MD Scanner - Operation
Data Collection
Overview
The Data Collection function records up to 30 seconds of recorded data at the rate designated using the Collection Config selection. Data is collected in a manner where the oldest data is replaced by newer data. Three data collection rates and three pointer positions for collecting the data can be selected by the user.
The parameter that may be chosen for data capture are taken from the current parameter list used in the Data Monitor Function. (see “Data List Setup - Com-ponent Section”). Of the 50 user-defined parameters, up to 10 can be used for Data Collection. When no list has been defined, the default list used is the Quick List.
Once the data has been collected, it can be reviewed by using the MD 200 dis-play (see the “View Data Capture” section), or you may export (send) the data to a PC for review (see the “Export Data Capture” section) using the PC's 9-pin serial port and the PC Interface Cable PC-CBL-01.
31
MD Scanner - Operation
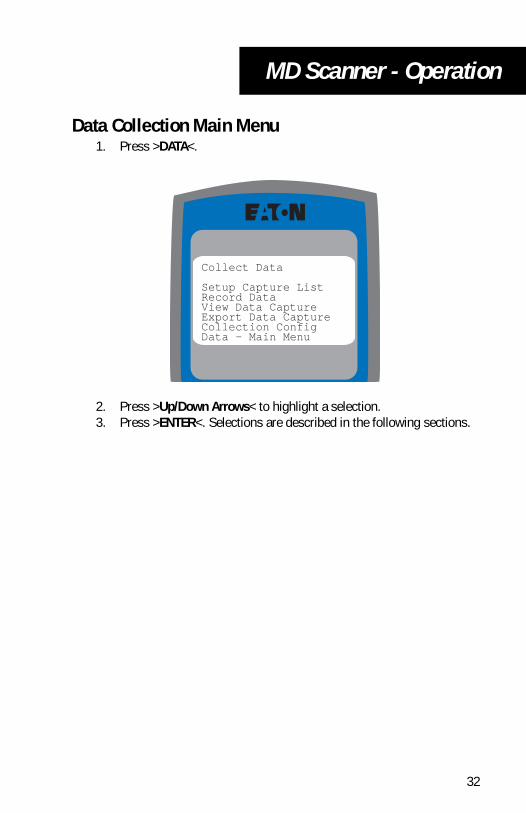
Data Collection Main Menu1. Press >DATA<.
2. Press >Up/Down Arrows< to highlight a selection.3. Press >ENTER<. Selections are described in the following sections.
Collect Data
Setup Capture ListRecord DataView Data CaptureExport Data CaptureCollection ConfigData - Main Menu
32
MD Scanner - Operation
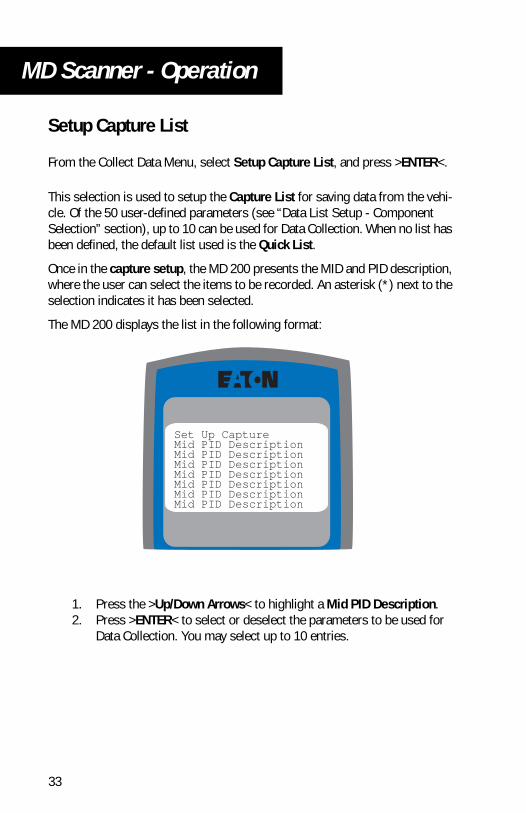
Setup Capture List
From the Collect Data Menu, select Setup Capture List, and press >ENTER<.
This selection is used to setup the Capture List for saving data from the vehi-cle. Of the 50 user-defined parameters (see “Data List Setup - Component Selection” section), up to 10 can be used for Data Collection. When no list has been defined, the default list used is the Quick List.
Once in the capture setup, the MD 200 presents the MID and PID description, where the user can select the items to be recorded. An asterisk (*) next to the selection indicates it has been selected.
The MD 200 displays the list in the following format:
1. Press the >Up/Down Arrows< to highlight a Mid PID Description. 2. Press >ENTER< to select or deselect the parameters to be used for
Data Collection. You may select up to 10 entries.
Set Up CaptureMid PID DescriptionMid PID DescriptionMid PID DescriptionMid PID DescriptionMid PID DescriptionMid PID DescriptionMid PID Description
33
MD Scanner - Operation
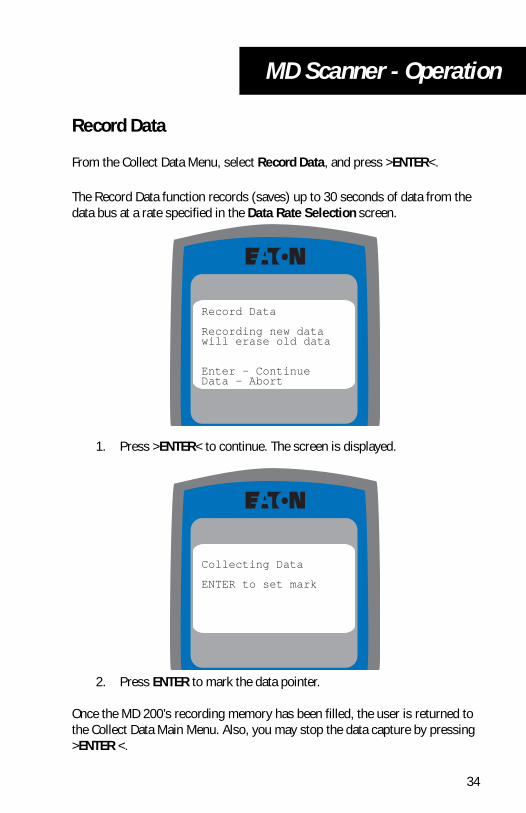
Record Data
From the Collect Data Menu, select Record Data, and press >ENTER<.
The Record Data function records (saves) up to 30 seconds of data from the data bus at a rate specified in the Data Rate Selection screen.
1. Press >ENTER< to continue. The screen is displayed.
2. Press ENTER to mark the data pointer.
Once the MD 200’s recording memory has been filled, the user is returned to the Collect Data Main Menu. Also, you may stop the data capture by pressing >ENTER <.
Record Data
Recording new datawill erase old data
Enter - ContinueData - Abort
Collecting Data
ENTER to set mark
34

MD Scanner - Operation
View Data Capture
From the Collect Data Menu, select View Data Capture, and press >ENTER<.
This selection allows for viewing of the data after an event has been collected. View the data by selecting the entry on the display screen and scrolling left and right.
If no data has been recorded, a message is displayed, otherwise the data is provided on a frame-by-frame basis from the first point in time to the last. The up and down arrows are used to scroll through the data list to view parame-ters; and the left and right arrows are used to move forward and back in time.
The data is shown in the same manner as for the Monitor Mode - with the exception that in the View Data Capture mode, the bottom line of the screen includes the current position within the recording - similar to looking at frames of pictures in a movie reel.
The information is displayed on 2 lines for each parameter. The first line indi-cates the MID and parameter name. The second line provides the data and units.
When the parameter name is too long for the display, the name is abbreviated to fit the screen size. Pressing >ENTER< on the highlighted line shows the full description of the data.
35

MD Scanner - Operation
Pressing >ENTER< again will shrink the description, and take the user back to the data display.
1. Press the >Up/Down Arrows< to scroll the list of parameters (2 lines at a time).
2. Press the >Left/Right Arrows< to scroll the data left/right (1 frame at a time).
Note: The current position in the recording is indicated by the scale at the bot-tom of the screen.
Mid PID DescriptionData UnitMid PID DescriptionData UnitMid PID DescriptionData Unit
--------*---------
36
MD Scanner - Operation
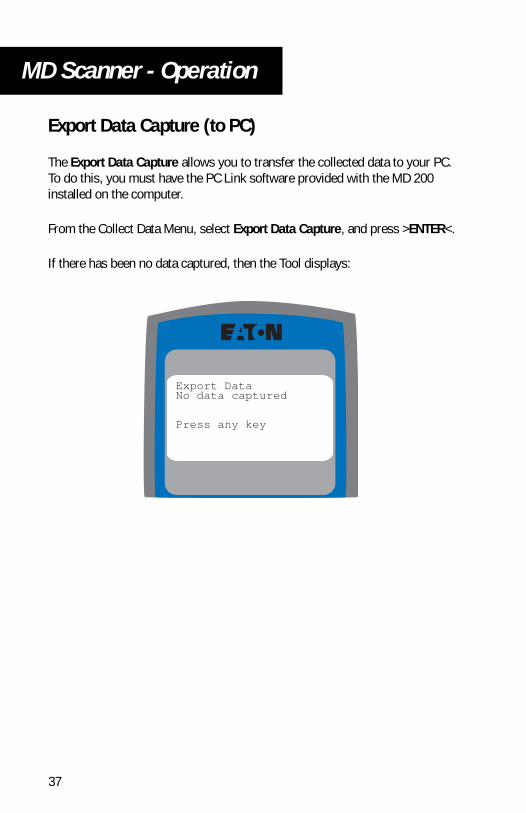
Export Data Capture (to PC)
The Export Data Capture allows you to transfer the collected data to your PC. To do this, you must have the PC Link software provided with the MD 200 installed on the computer.
From the Collect Data Menu, select Export Data Capture, and press >ENTER<.
If there has been no data captured, then the Tool displays:
Export DataNo data captured
Press any key
37
MD Scanner - Operation
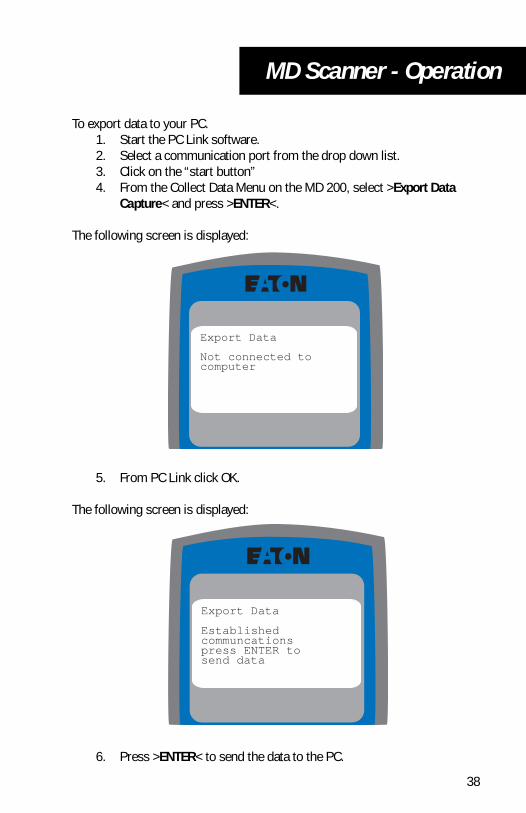
To export data to your PC.1. Start the PC Link software.2. Select a communication port from the drop down list.3. Click on the “start button”4. From the Collect Data Menu on the MD 200, select >Export Data
Capture< and press >ENTER<.
The following screen is displayed:
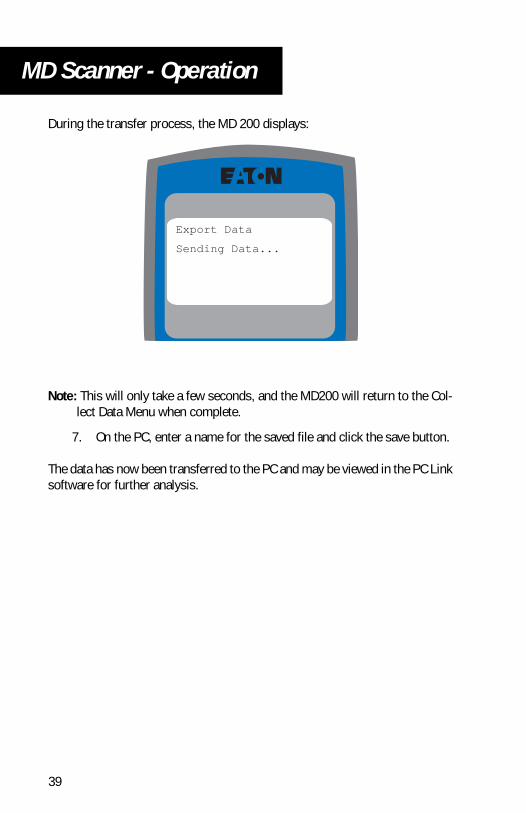
5. From PC Link click OK.
The following screen is displayed:
6. Press >ENTER< to send the data to the PC.
Export Data
Not connected tocomputer
Export Data
Established communcationspress ENTER tosend data
38
MD Scanner - Operation
During the transfer process, the MD 200 displays:
Note: This will only take a few seconds, and the MD200 will return to the Col-lect Data Menu when complete.
7. On the PC, enter a name for the saved file and click the save button.
The data has now been transferred to the PC and may be viewed in the PC Link software for further analysis.
Export Data
Sending Data...
39
MD Scanner - Operation
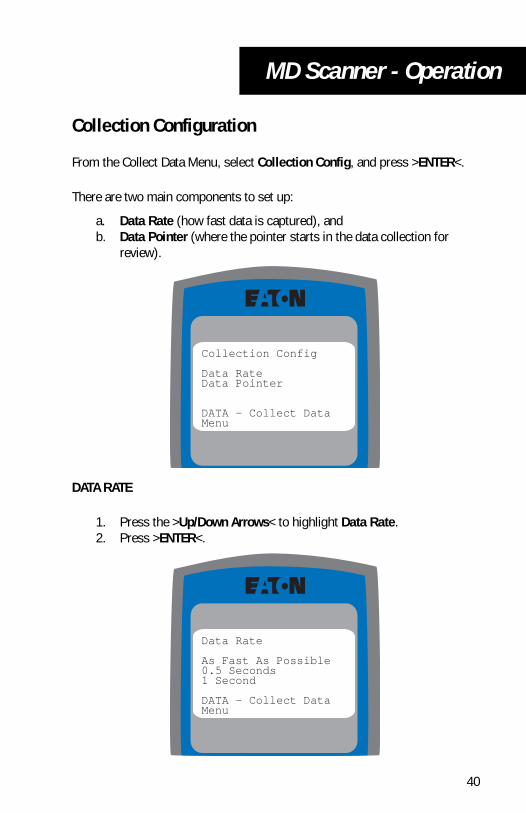
Collection Configuration
From the Collect Data Menu, select Collection Config, and press >ENTER<.
There are two main components to set up:
a. Data Rate (how fast data is captured), andb. Data Pointer (where the pointer starts in the data collection for
review).
DATA RATE
1. Press the >Up/Down Arrows< to highlight Data Rate.2. Press >ENTER<.
Collection Config
Data RateData Pointer
DATA - Collect DataMenu
Data Rate
As Fast As Possible0.5 Seconds1 Second
DATA - Collect DataMenu
40

MD Scanner - Operation
Note: The default rate is "As Fast as Possible".
3. Press the >Up/Down Arrows< to highlight one of the three choices.4. Press >ENTER<. This stores the selection and returns the user to the
Collect Data Menu.
DATA POINTER
The pointer setting specifies the data recording interval in relation to the mark entered by the user. For example, <At Beginning> will save 30 seconds of data after the mark; <In Middle> will save 15 seconds of data before the mark and 15 seconds of data after the mark; and <At End> will save 30 seconds of data before the mark.
1. Press the >Up/Down Arrows< to highlight Collection Config in the following menu:
Collect Data
Setup Capture ListRecord DataView Data CaptureExport Data CaptureCollection ConfigData - Main Menu
41
MD Scanner - Operation
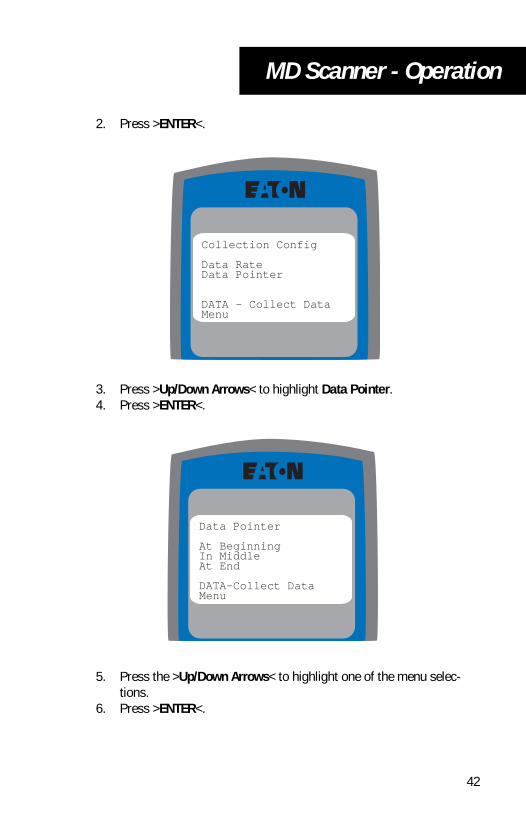
2. Press >ENTER<.
3. Press >Up/Down Arrows< to highlight Data Pointer.4. Press >ENTER<.
5. Press the >Up/Down Arrows< to highlight one of the menu selec-tions.
6. Press >ENTER<.
Collection Config
Data RateData Pointer
DATA - Collect DataMenu
Data Pointer
At BeginningIn MiddleAt End
DATA-Collect DataMenu
42

43
MD Comm - Operation
MD Comm- Overview
The MD 200 can function as a Communications Adapter (Comm Box) that provides the communication connection between the vehicle and the PC via the SAE J1587 data link.
Once in the Comm Mode, the PC is used for analysis and for other vehicle related operations.
The Comm Function system consists of:
• MD 200 Scan Tool• Communication Software Driver (included on the MD 200 CD)• PC to Scan Tool Cable PC-CBL-01• Scan Tool to 9-Pin Deutsch Cable SC-CBL-02• Scan Tool to 6-Pin Deutsch Cable SC-CBL-01 (Optional)• PC Software for Data Analysis
The Comm Box captures vehicle information being broadcast from the vehicle data link and converts it to PC communications and vice versa. One communi-cations mode is provide, RP1210A (SAE J1587).
PC communications are done through the PC’s 9-Pin Serial data port.
Note: J1939 is not supported.
The MD 200 will report the status of both the connection between the MD 200 to the vehicle and between the MD 200 and the PC.

MD Comm - Operation
MD Comm- Connections and Operation1. Insert the modular RJ45 end of the PC to Scan Tool Cable (PC-CBL-
01) into the smaller of the two receptacles on the top of the MD 200.
2. Connect the 9-Pin end of the cable to the Serial Port of the PC.3. Ensure the PC is ready to accept data (the appropriate software must
be loaded -- see the “Loading Drivers” section to set up the RP1210A drivers included on the software CD with the Comm Function).
4. Connect the appropriate (6-Pin Deutsch or 9-Pin Deutsch) cable between the MD 200 and the vehicle. The 9-Pin Deutsch cable is shown:
5. Turn on the MD 200 by pressing >POWER<.6. Ensure the MD 200 is in the Comm Function Mode (see the “Config-
uration” section).
The MD 200 will report the status of both the connection between the MD 200 to the vehicle and between the MD 200 and the PC.
Now the PC and vehicle can communicate.
RJ45 Cable 9-Pin Serial Connector
44
MD Comm - Operation
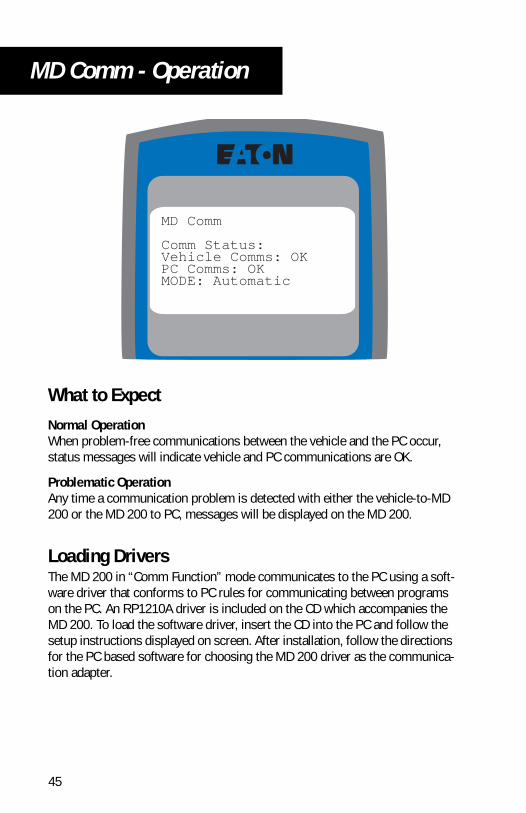
What to ExpectNormal OperationWhen problem-free communications between the vehicle and the PC occur, status messages will indicate vehicle and PC communications are OK.
Problematic OperationAny time a communication problem is detected with either the vehicle-to-MD 200 or the MD 200 to PC, messages will be displayed on the MD 200.
Loading DriversThe MD 200 in “Comm Function” mode communicates to the PC using a soft-ware driver that conforms to PC rules for communicating between programs on the PC. An RP1210A driver is included on the CD which accompanies the MD 200. To load the software driver, insert the CD into the PC and follow the setup instructions displayed on screen. After installation, follow the directions for the PC based software for choosing the MD 200 driver as the communica-tion adapter.
MD Comm
Comm Status:Vehicle Comms: OKPC Comms: OKMODE: Automatic
45

46
MD Link- Operation
MD Link- Overview
The MD 200 Link Tester allows for diagnosing problems that may occur on the SAE J1587 or J1939 heavy-duty vehicle communication links. Several functions are included and they consist of Link Faults, Link Monitor, and Record Data.
The MD Link Function system consists of:
• MD 200 Scan Tool• PC to Scan Tool Cable PC-CBL-01• Scan Tool to 9-Pin Deutsch Cable SC-CBL-02• Scan Tool to 6-Pin Deutsch Cable SC-CBL-01 (J1587 only)• Scan Tool to 3-Pin Deutsch Cable SC-CBL-03• PC Link Software for data extraction
The link tester is designed to be an aid in diagnosing heavy-duty vehicle com-munication links. Always consult your OEM manufacture's troubleshooting or service manual for proper repair procedures.
J1587 LinkThe SAE J1587 link is a low speed communication link that is designed to share information between electronic components installed on a vehicle. The rate of communication on the link is 9600 bits per second. This is much slower than the typical Internet dial-up rate, 56000 bits per second. The pri-mary use of the communication link is for diagnostic purposes. This includes viewing fault codes, clearing codes, and viewing data such as engine speed, road speed, accelerator pedal position, etc.
J1939 LinkThe SAE J1939 link is a high-speed communication link that is designed to share data and send control information between electronic components on a vehicle. This link is designed around CAN (controller area network). It is capa-ble of providing data exchange (such as J1587) as well as providing a mecha-nism that allows one component to control another (i.e. automated transmission controls the engine during a shift sequence). The rate of com-munication is 250,000 bits per second, which is much greater than that of J1587.
MD Link- Operation
MD Link- Main Menu
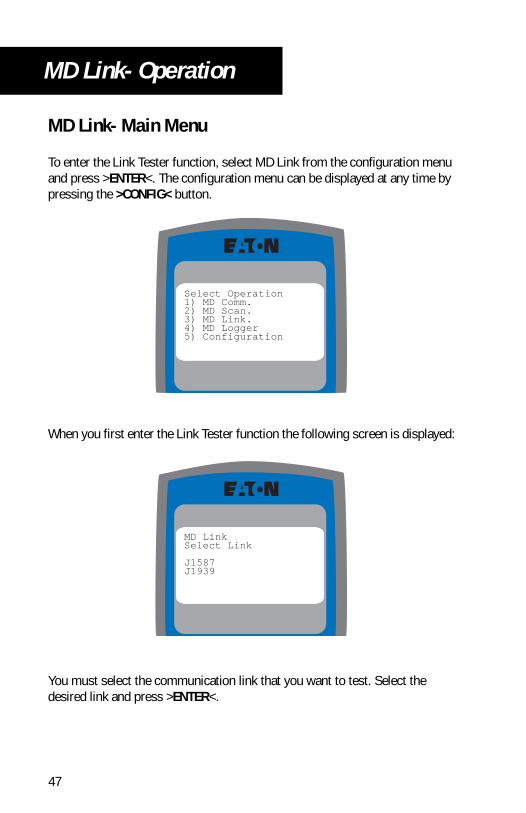
To enter the Link Tester function, select MD Link from the configuration menu and press >ENTER<. The configuration menu can be displayed at any time by pressing the >CONFIG< button.
When you first enter the Link Tester function the following screen is displayed:
You must select the communication link that you want to test. Select the desired link and press >ENTER<.
Select Operation1) MD Comm.2) MD Scan.3) MD Link.4) MD Logger5) Configuration
MD LinkSelect Link
J1587J1939
47
MD Link- Operation
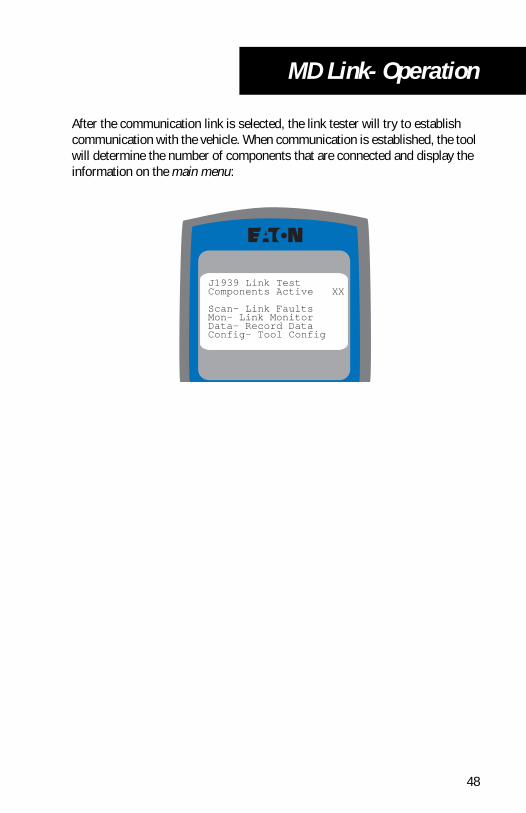
After the communication link is selected, the link tester will try to establish communication with the vehicle. When communication is established, the tool will determine the number of components that are connected and display the information on the main menu:
J1939 Link TestComponents Active XX
Scan- Link FaultsMon- Link MonitorData- Record DataConfig- Tool Config
48
MD Link- Operation
MD Link- Link Faults
Overview
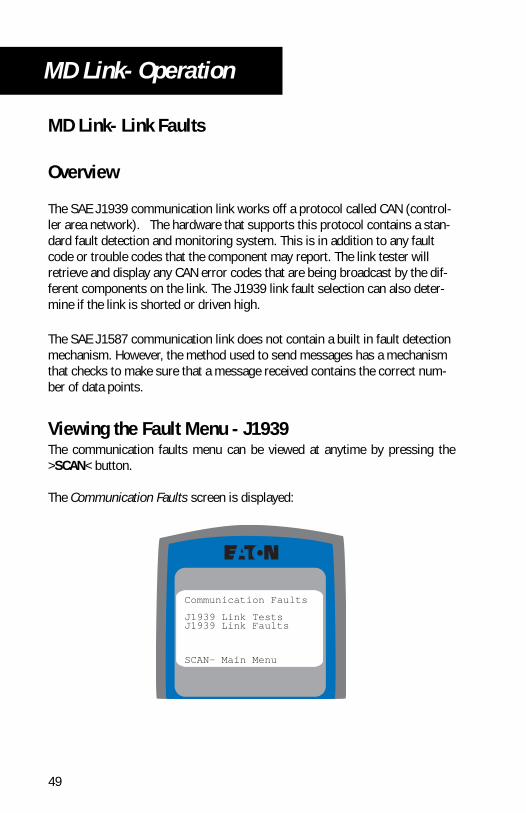
The SAE J1939 communication link works off a protocol called CAN (control-ler area network). The hardware that supports this protocol contains a stan-dard fault detection and monitoring system. This is in addition to any fault code or trouble codes that the component may report. The link tester will retrieve and display any CAN error codes that are being broadcast by the dif-ferent components on the link. The J1939 link fault selection can also deter-mine if the link is shorted or driven high.
The SAE J1587 communication link does not contain a built in fault detection mechanism. However, the method used to send messages has a mechanism that checks to make sure that a message received contains the correct num-ber of data points.
Viewing the Fault Menu - J1939The communication faults menu can be viewed at anytime by pressing the>SCAN< button.
The Communication Faults screen is displayed:
Communication Faults
J1939 Link TestsJ1939 Link Faults
SCAN- Main Menu
49
MD Link- Operation
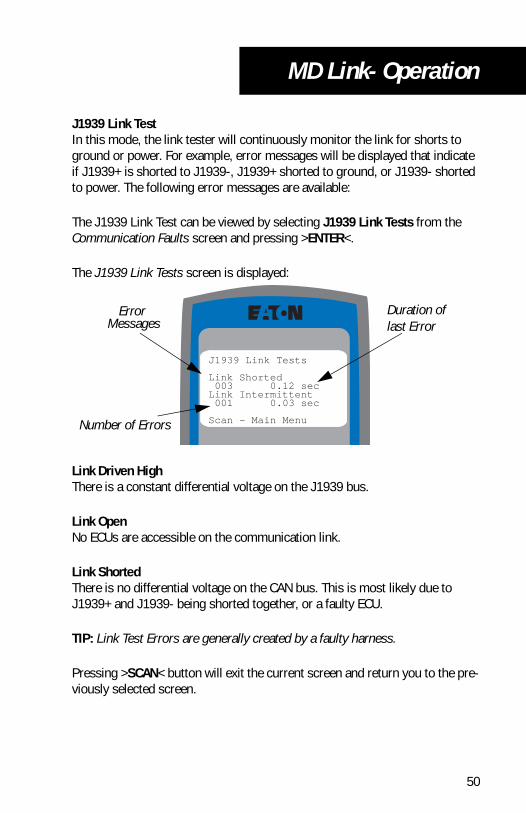
J1939 Link TestIn this mode, the link tester will continuously monitor the link for shorts to ground or power. For example, error messages will be displayed that indicate if J1939+ is shorted to J1939-, J1939+ shorted to ground, or J1939- shorted to power. The following error messages are available:
The J1939 Link Test can be viewed by selecting J1939 Link Tests from the Communication Faults screen and pressing >ENTER<.
The J1939 Link Tests screen is displayed:
Link Driven HighThere is a constant differential voltage on the J1939 bus.
Link OpenNo ECUs are accessible on the communication link.
Link ShortedThere is no differential voltage on the CAN bus. This is most likely due to J1939+ and J1939- being shorted together, or a faulty ECU.
TIP: Link Test Errors are generally created by a faulty harness.
Pressing >SCAN< button will exit the current screen and return you to the pre-viously selected screen.
J1939 Link Tests
Link Shorted 003 0.12 secLink Intermittent 001 0.03 sec
Scan - Main Menu
MessagesError
Number of Errors
Duration of last Error
50
MD Link- Operation
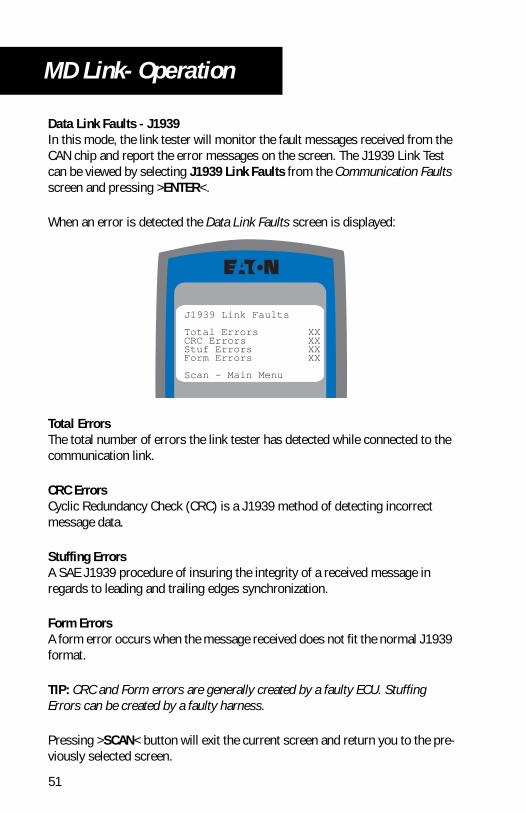
Data Link Faults - J1939In this mode, the link tester will monitor the fault messages received from the CAN chip and report the error messages on the screen. The J1939 Link Test can be viewed by selecting J1939 Link Faults from the Communication Faults screen and pressing >ENTER<.
When an error is detected the Data Link Faults screen is displayed:
Total ErrorsThe total number of errors the link tester has detected while connected to the communication link.
CRC ErrorsCyclic Redundancy Check (CRC) is a J1939 method of detecting incorrect message data.
Stuffing ErrorsA SAE J1939 procedure of insuring the integrity of a received message in regards to leading and trailing edges synchronization.
Form ErrorsA form error occurs when the message received does not fit the normal J1939 format.
TIP: CRC and Form errors are generally created by a faulty ECU. Stuffing Errors can be created by a faulty harness.
Pressing >SCAN< button will exit the current screen and return you to the pre-viously selected screen.
J1939 Link Faults
Total Errors XXCRC Errors XXStuf Errors XXForm Errors XX
Scan - Main Menu
51
MD Link- Operation
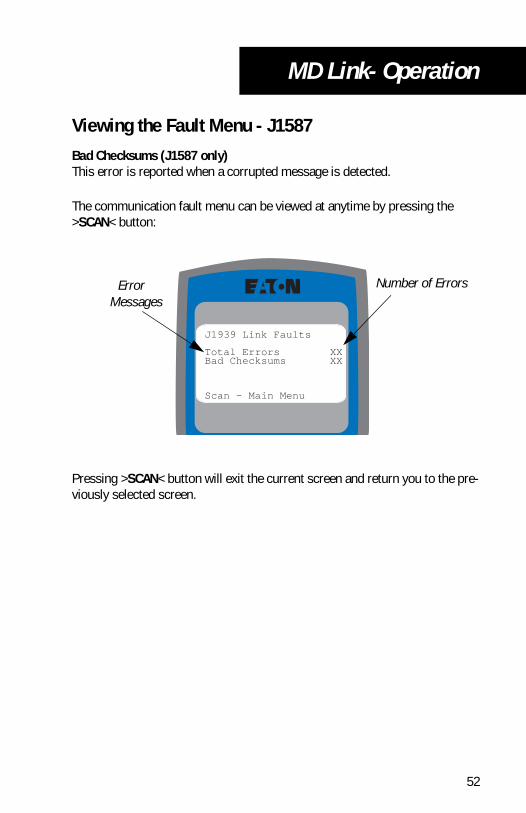
Viewing the Fault Menu - J1587Bad Checksums (J1587 only)This error is reported when a corrupted message is detected.
The communication fault menu can be viewed at anytime by pressing the >SCAN< button:
Pressing >SCAN< button will exit the current screen and return you to the pre-viously selected screen.
J1939 Link Faults
Total Errors XXBad Checksums XX
Scan - Main Menu
Error Number of ErrorsMessages
52

MD Link- Operation
MD Link- Monitor
Overview
The Link Monitor function allows you to view live information on either the SAE J1939 or J1587 communication links. The following functions are included: Roster, Communication Gap, and Communication Timing. These functions are described in the following sections.
Viewing the Link Monitor Menu
The Monitor menu can be viewed at anytime by pressing the >MON< button.
Link Monitor
Component RosterComm. Timing DisplayComm. Gap Test
Mon - Main Menu
53
MD Link- Operation
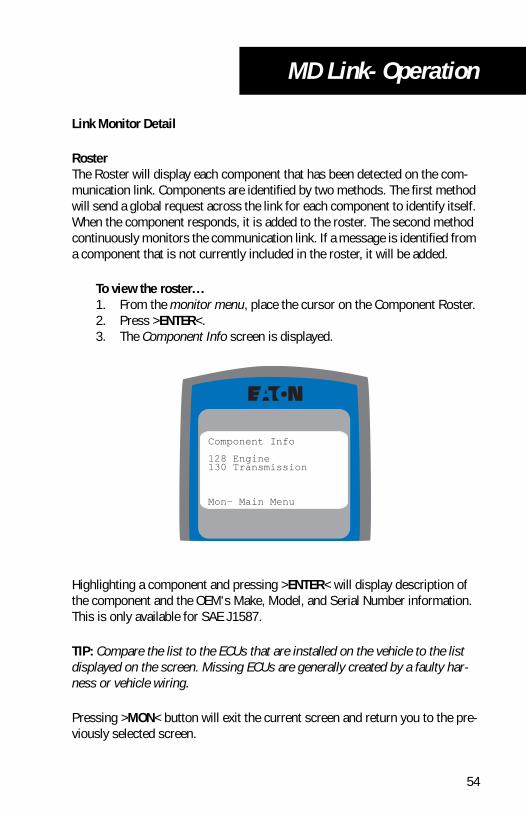
Link Monitor Detail
RosterThe Roster will display each component that has been detected on the com-munication link. Components are identified by two methods. The first method will send a global request across the link for each component to identify itself. When the component responds, it is added to the roster. The second method continuously monitors the communication link. If a message is identified from a component that is not currently included in the roster, it will be added.
To view the roster...1. From the monitor menu, place the cursor on the Component Roster.2. Press >ENTER<.3. The Component Info screen is displayed.
Highlighting a component and pressing >ENTER< will display description of the component and the OEM's Make, Model, and Serial Number information. This is only available for SAE J1587.
TIP: Compare the list to the ECUs that are installed on the vehicle to the list displayed on the screen. Missing ECUs are generally created by a faulty har-ness or vehicle wiring.
Pressing >MON< button will exit the current screen and return you to the pre-viously selected screen.
Component Info
128 Engine130 Transmission
Mon- Main Menu
54
MD Link- Operation
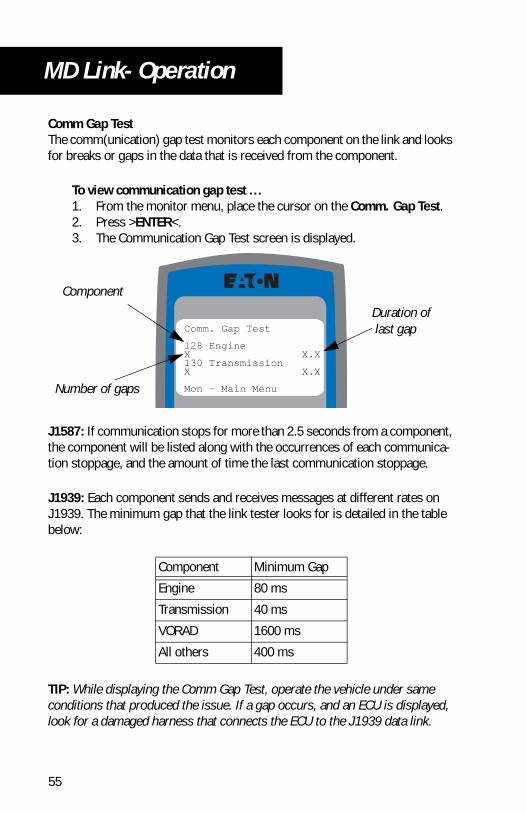
Comm Gap TestThe comm(unication) gap test monitors each component on the link and looks for breaks or gaps in the data that is received from the component.
To view communication gap test ...1. From the monitor menu, place the cursor on the Comm. Gap Test.2. Press >ENTER<.3. The Communication Gap Test screen is displayed.
J1587: If communication stops for more than 2.5 seconds from a component, the component will be listed along with the occurrences of each communica-tion stoppage, and the amount of time the last communication stoppage.
J1939: Each component sends and receives messages at different rates on J1939. The minimum gap that the link tester looks for is detailed in the table below:
TIP: While displaying the Comm Gap Test, operate the vehicle under same conditions that produced the issue. If a gap occurs, and an ECU is displayed, look for a damaged harness that connects the ECU to the J1939 data link.
Component Minimum Gap
Engine 80 ms
Transmission 40 ms
VORAD 1600 ms
All others 400 ms
Comm. Gap Test
128 EngineX X.X130 TransmissionX X.X
Mon - Main MenuNumber of gaps
Duration of
Component
last gap
55
MD Link- Operation
Pressing >MON< button will exit the current screen and return you to the pre-viously selected screen.
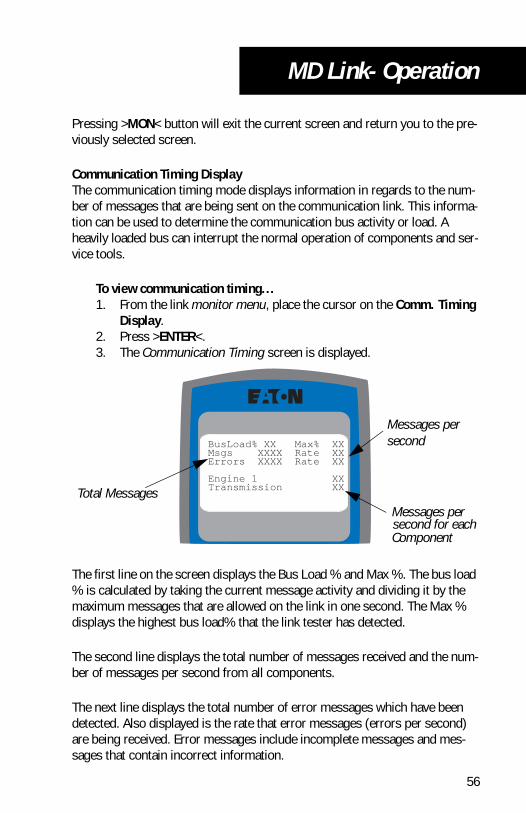
Communication Timing DisplayThe communication timing mode displays information in regards to the num-ber of messages that are being sent on the communication link. This informa-tion can be used to determine the communication bus activity or load. A heavily loaded bus can interrupt the normal operation of components and ser-vice tools.
To view communication timing...1. From the link monitor menu, place the cursor on the Comm. Timing
Display.2. Press >ENTER<.3. The Communication Timing screen is displayed.
The first line on the screen displays the Bus Load % and Max %. The bus load % is calculated by taking the current message activity and dividing it by the maximum messages that are allowed on the link in one second. The Max % displays the highest bus load% that the link tester has detected.
The second line displays the total number of messages received and the num-ber of messages per second from all components.
The next line displays the total number of error messages which have been detected. Also displayed is the rate that error messages (errors per second) are being received. Error messages include incomplete messages and mes-sages that contain incorrect information.
BusLoad% XX Max% XXMsgs XXXX Rate XXErrors XXXX Rate XX
Engine 1 XXTransmission XX
Messages persecond
Total Messages
Component
Messages persecond for each
56
MD Link- Operation
Note: The total number of bad messages will not be zero on a correctly oper-ating vehicle.
After the total number of bad messages, the following lines on the screen will display information on each component that has been detected on the com-munication link. The component will be listed along with messages per sec-ond that have been calculated for that component. The messages per second is a rolling average that is calculated in the following manner:
• For J1587, the average is calculated by totaling the number of mes-sages in a two second span then dividing that number by two, to dis-play the number of messages per second.
• For J1939, the average is calculated by totaling the number of mes-sages in a 0.5 second span then multiplying that number by two, to display the number of messages per second.
Pressing >MON< button will exit the current screen and return you to the pre-viously selected screen.
The above information is for reference only. The conditions vary greatly from one vehicle to another and depend on the number and type of compo-nents installed. Always consult your OEM Troubleshooting and Service Manuals before replacing any parts.
57
MD Link- Operation
MD Link- Data Capture
Overview
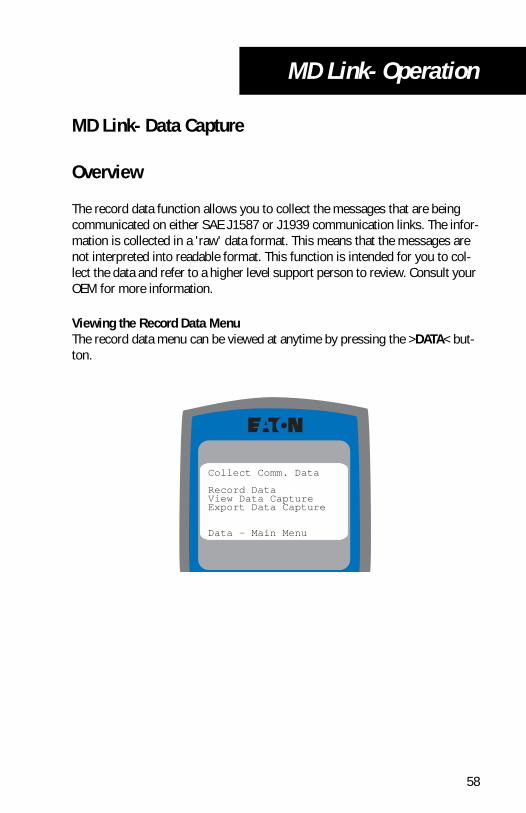
The record data function allows you to collect the messages that are being communicated on either SAE J1587 or J1939 communication links. The infor-mation is collected in a 'raw' data format. This means that the messages are not interpreted into readable format. This function is intended for you to col-lect the data and refer to a higher level support person to review. Consult your OEM for more information.
Viewing the Record Data MenuThe record data menu can be viewed at anytime by pressing the >DATA< but-ton.
Collect Comm. Data
Record DataView Data CaptureExport Data Capture
Data - Main Menu
58
MD Link- Operation
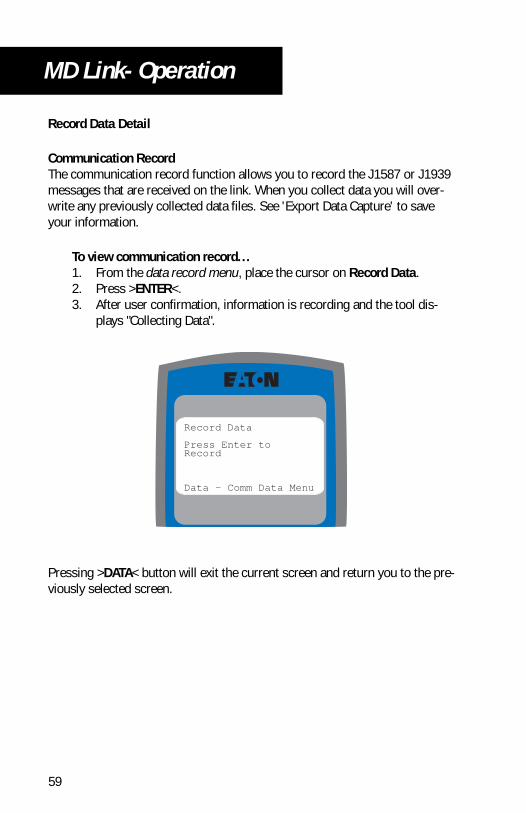
Record Data Detail
Communication RecordThe communication record function allows you to record the J1587 or J1939 messages that are received on the link. When you collect data you will over-write any previously collected data files. See 'Export Data Capture' to save your information.
To view communication record...1. From the data record menu, place the cursor on Record Data.2. Press >ENTER<.3. After user confirmation, information is recording and the tool dis-
plays "Collecting Data".
Pressing >DATA< button will exit the current screen and return you to the pre-viously selected screen.
Record Data
Press Enter toRecord
Data - Comm Data Menu
59
MD Link- Operation
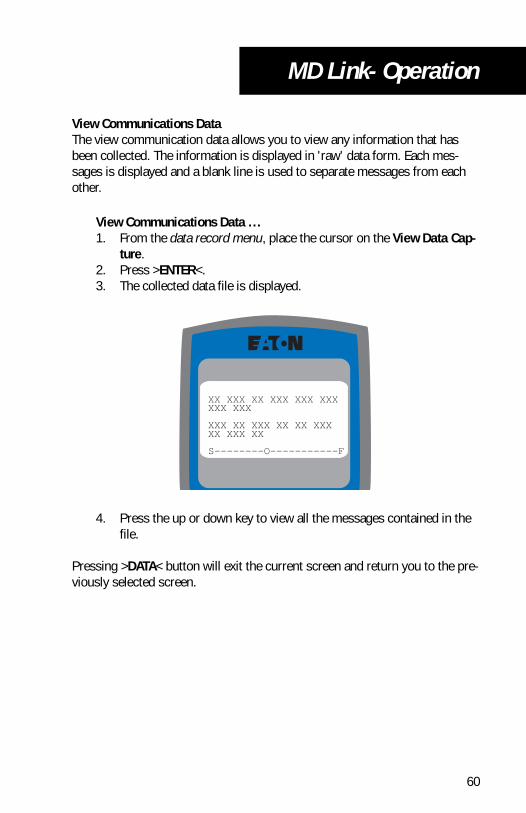
View Communications DataThe view communication data allows you to view any information that has been collected. The information is displayed in 'raw' data form. Each mes-sages is displayed and a blank line is used to separate messages from each other.
View Communications Data ...1. From the data record menu, place the cursor on the View Data Cap-
ture.2. Press >ENTER<.3. The collected data file is displayed.
4. Press the up or down key to view all the messages contained in the file.
Pressing >DATA< button will exit the current screen and return you to the pre-viously selected screen.
XX XXX XX XXX XXX XXXXXX XXX
XXX XX XXX XX XX XXXXX XXX XX
S--------O-----------F
60
MD Link- Operation
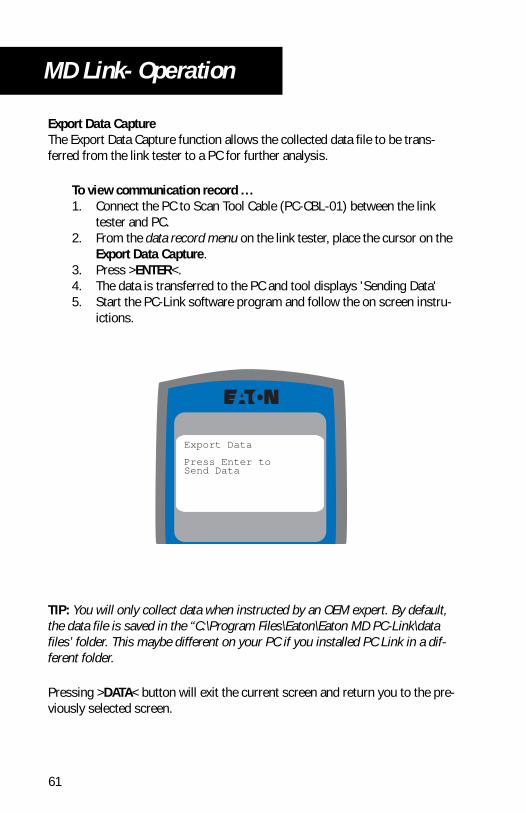
Export Data CaptureThe Export Data Capture function allows the collected data file to be trans-ferred from the link tester to a PC for further analysis.
To view communication record ...1. Connect the PC to Scan Tool Cable (PC-CBL-01) between the link
tester and PC.2. From the data record menu on the link tester, place the cursor on the
Export Data Capture.3. Press >ENTER<.4. The data is transferred to the PC and tool displays 'Sending Data'5. Start the PC-Link software program and follow the on screen instru-
ictions.
TIP: You will only collect data when instructed by an OEM expert. By default, the data file is saved in the “C:\Program Files\Eaton\Eaton MD PC-Link\data files’ folder. This maybe different on your PC if you installed PC Link in a dif-ferent folder.
Pressing >DATA< button will exit the current screen and return you to the pre-viously selected screen.
Export Data
Press Enter to Send Data
61
MD Link- Trouleshooting
MD Link-Troubleshooting J1939 Communication Links
Communication link failure on heavy-duty vehicles may include:
• Missing terminating resistors• Damaged harness• Connectors not seated properly• Harness Design• Installation• ECU/ECM failure• Link Shorted to Battery or Ground• Link Open• CAN message errors
These failures can be identified by observing the following symptoms.
• Transmission will not shift• Throttle pedal has no effect• Engine can increase or decrease RPM• Vehicle feels like it is in neutral• Cruise Control does not work properly
Most J1939 communication link problems will not produce a fault or trouble code. With this in mind the following steps can be taken to troubleshoot a problem. It is recommended that you eliminate the J1939 Data Link by per-forming a Pre-test. This pretest can be done using the MD-200 in Link tester mode. The following procedures are recommended.
62
MD Link- Trouleshooting
Link MonitorUsing the MD-200 Link Tester in Monitor mode, view which components are communicating on the J1939 data link and if there are any J1939 errors. To do this, use the following procedure.
1. Connect the MD-200 to the vehicle using the 9-pin Deutsch cable.2. Press the >POWER< button.
Note: If the MD-200 is already in link tester mode, you can go directly to step 5.
3. Press the >CONFIG< button.4. Use the arrow buttons and arrow down to the MD LINK and press
>ENTER<.5. Use the arrow buttons, select J1939 and press >ENTER<.6. Press >MON<.7. Use the arrow buttons, select Component Roster and press
>ENTER<.8. This screen will display what components are currently communicat-
ing on the J1939 link.9. Compare the list displayed on the MD-200 with what components
are installed on the vehicle. • If a component is not listed on the MD-200 and is connected to
the J1939 data link, a problem may exist in the J1939 data link harness.
10. After viewing the Component Roster, press >MON<.11. Using the arrow buttons, select Comm Timing Display and press
>ENTER<.12. The screen will display the following information:
a. BusLoad% - The percent of bus loading.
b. Msgs - Count of messages on the data link.
c. Errors- Count of Errors detected on the data link.
63
MD Link- Trouleshooting
13. You are looking at Msgs and Errors:• If there are Msgs and no errors, the J1939 data link is working
correctly with the components that are connected to the data link. Go to step 14.
• If there are Msgs and Errors, then there may be a problem with the J1939 data link.
a. The J1939 data link (harness)- Look for loose connections, missing terminating resistors and damaged harnesses.
b. An ECU/ECM is producing errors- An ECU/ECM is producing the errors. You can isolate which ECU/ECM is producing the errors. One by one disconnect an ECU/ECM from the J1939 data link. Example: Disconnect the Engine from the J1939 data link. View the MD-200 screen. Did the error go away? If so, the engine ECM is causing the problem, contact the Engine OEM. If not, reconnect the Engine ECM to the J1939 data link and disconnect the transmission ECU from the J1939 data link. View the MD-200 screen. Did the error go away? If so, the transmission ECU is causing the problem contact the Trans-mission OEM. If not, reconnect the transmission ECU to the J1939 data link and repeat this process for all components.
14. Press >MON<.15. Using the arrow buttons, select Comm. Gap Test and press
>ENTER<.16. You will need to drive the vehicle for this test. Drive the vehicle in the
same conditions that produced the problem. Example: Vibration, heat, water, etc. • If a component is displayed check the J1939 data link that is
connected to that component. Look for loose connections, missing terminating resistors, and a damaged harness. If the harness checks good then you will need to contact the OEM of the component that produced the Gap for further assistance.
Link Tests and Errors-Using the MD-200 Link Tester in SCAN mode, check if there are any J1939 errors present. To do this, use the following procedure.
1. Connect the MD-200 to the vehicle using the 9-pin Deutsch cable.2. Press the >POWER< button.
64
MD Link- Trouleshooting
Note: If the MD 200 is already in link tester mode, you can go directly to step 5.
3. Press the >CONFIG< button.4. Use the arrow buttons and arrow down to the MD LINK and press
>ENTER<.5. Use the arrow button and select J1939 and press >ENTER<.6. Press >SCAN<.7. Select Link Faults and press >ENETR<.8. View the Errors. a. CRC Errors are present when an ECU/ECM is producing corrupted
messages. You can isolate which ECU/ECM is producing the errors. One by one disconnect an ECU/ECM from the J1939 data link. Exam-ple: Disconnect the Engine from the J1939 data link. View the MD-200 screen. Did the error go away? If so, the engine ECM is causing the problem, contact the Engine OEM. If not, reconnect the Engine ECM to the J1939 data link and disconnect the transmission ECU from the J1939 data link. View the MD-200 screen. Did the error go away? If so, the transmission ECU is causing the problem, contact the Transmission OEM. If not, reconnect the transmission ECU to the J1939 data link and repeat this process for all components.
b. Stuff Errors are present when the J1939 data link is the problem. Look for loose connections and a damaged harness.
c. Form Errors are present when an ECU/ECM is producing corrupted messages. You can isolate which ECU/ECM is producing the errors. One by one disconnect an ECU/ECM from the J1939 data link. Exam-ple: Disconnect the Engine from the J1939 data link. View the MD-200 screen. Did the error go away? If so, the engine ECM is causing the problem, contact the Engine OEM. If not, reconnect the Engine ECM to the J1939 data link and disconnect the transmission ECU from the J1939 data link. View the MD-200 screen. Did the error go away? If so, the transmission ECU is causing the problem, contact the Transmission OEM. If not, reconnect the transmission ECU to the J1939 data link and repeat this process for all components.
d. Lost Communications: If this message appears on the screen it means the harness may have a short or open somewhere. Look for loose connections and a damaged harness.
9. Press >SCAN< to go back to Communication Faults Screen10. Select Link Test and press >ENETR<.
65
MD Link- Trouleshooting
11. View Link Test results.a. No Messages Appear If a messages does not appear on the screen,
the J1939 Link is working correctly.b. Messages Appear If this message appears on the screen it means
the harness may have a short or open somewhere. Look for loose connections and a damaged harness.
Data Collection-
Using the MD-200 Link Tester in Data mode, capture J1939 data so an expert can view the J1939 data and determine what problems may exist.
1. Connect the MD-200 to the vehicle using the 9-pin Deutsch cable.2. Press the >POWER< button.
Note: If the MD 200 is already in link tester mode, you can go directly to step 5.
3. Press the >CONFIG< button.4. Use the arrow buttons, arrow down to the MD LINK and press
>ENTER<.5. Use the arrow button and select J1939 and press >ENTER<6. Press >DATA<.7. Follow the procedure on page 58 to capture J1939 data. 8. This data will need to be viewed by an expert. You would only be at
this step if you were requested to capture data by an expert.
The above information is for reference only. The conditions vary greatly from one vehicle to another and depend on the number and type of compo-nents installed. Always consult your OEM Troubleshooting and Service Manuals before replacing any parts.
66
67
MD Logger - Operation
MD Logger- Overview
The MD 200 Data Logger allows for diagnosing problems that may occur on the J1587 heavy-duty vehicle communication link. Several functions are included and they consist of capturing data, setting up triggers, and viewing collected data.
The Data Logger function consists of the following:
• MD 200 Scan Tool• PC to Scan Tool Cable PC-CBL-01• Scan Tool to 9-Pin Deutsch Cable SC-CBL-02• Scan Tool to 6-Pin Deutsch Cable SC-CBL-01 (J1587 only)• PC Link Software for data extraction
The data logger is designed to be an aid in diagnosing heavy-duty vehicle sys-tems. Always consult your OEM manufacture's troubleshooting or service manual for proper repair procedures.
68
MD Logger - Operation
MD Logger- Main Menu
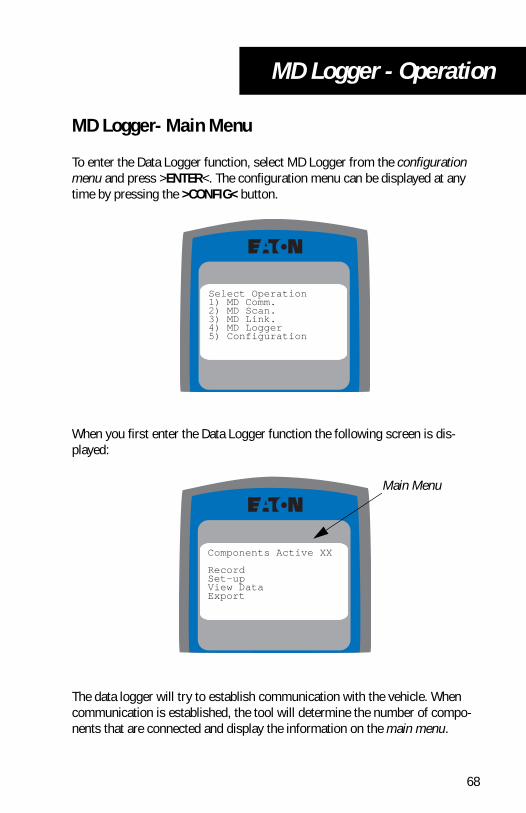
To enter the Data Logger function, select MD Logger from the configuration menu and press >ENTER<. The configuration menu can be displayed at any time by pressing the >CONFIG< button.
When you first enter the Data Logger function the following screen is dis-played:
The data logger will try to establish communication with the vehicle. When communication is established, the tool will determine the number of compo-nents that are connected and display the information on the main menu.
Select Operation1) MD Comm.2) MD Scan.3) MD Link.4) MD Logger5) Configuration
Components Active XX
Record Set-up View Data Export
Main Menu

MD Logger - Setup
MD Logger- Setup
The first step in using the data logger is to determine what data to collect and how to the collect data. To do this you select Set-up and press the >ENTER< button. There are several choices and each is explained in the following sec-tions.
Set-up Menu
User Data Lists Triggers Data Capture Rate Data Capture Length
DATA - Main Menu
69
MD Logger - Setup
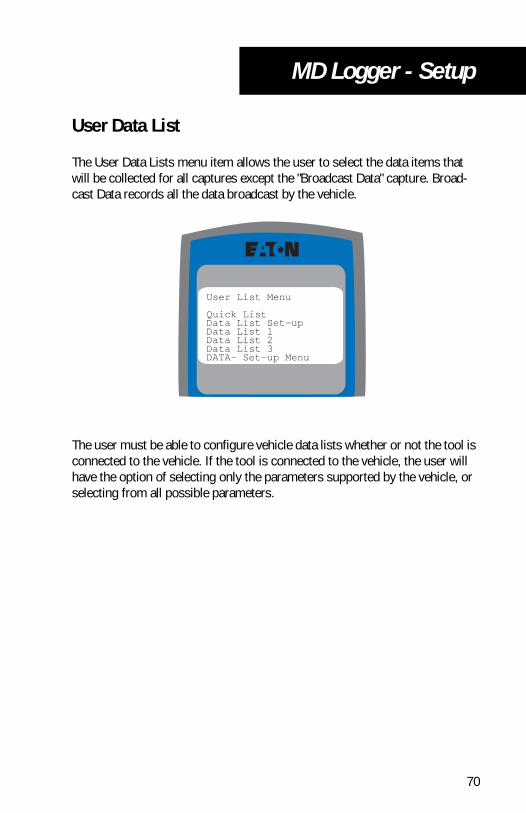
User Data List
The User Data Lists menu item allows the user to select the data items that will be collected for all captures except the "Broadcast Data" capture. Broad-cast Data records all the data broadcast by the vehicle.
The user must be able to configure vehicle data lists whether or not the tool is connected to the vehicle. If the tool is connected to the vehicle, the user will have the option of selecting only the parameters supported by the vehicle, or selecting from all possible parameters.
User List Menu
Quick List Data List Set-up Data List 1Data List 2Data List 3 DATA- Set-up Menu
70
MD Logger - Setup
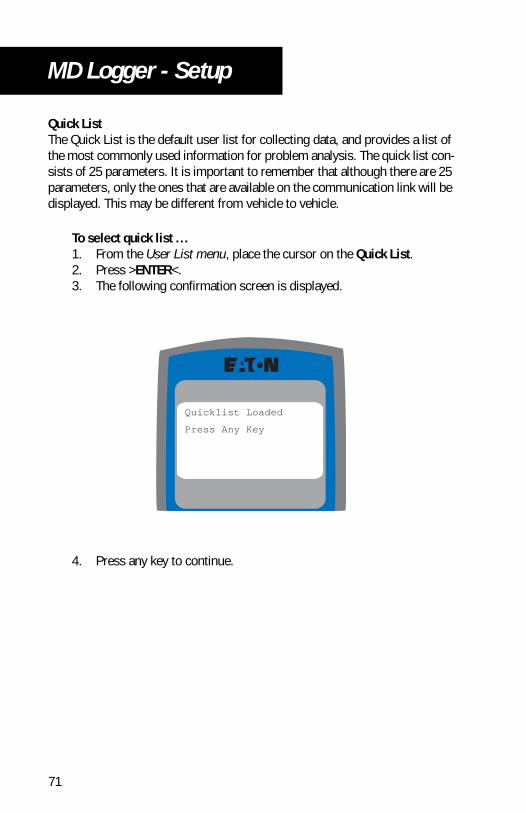
Quick ListThe Quick List is the default user list for collecting data, and provides a list of the most commonly used information for problem analysis. The quick list con-sists of 25 parameters. It is important to remember that although there are 25 parameters, only the ones that are available on the communication link will be displayed. This may be different from vehicle to vehicle.
To select quick list ...1. From the User List menu, place the cursor on the Quick List.2. Press >ENTER<.3. The following confirmation screen is displayed.
4. Press any key to continue.
Quicklist Loaded
Press Any Key
71
MD Logger - Setup
Data List Setup
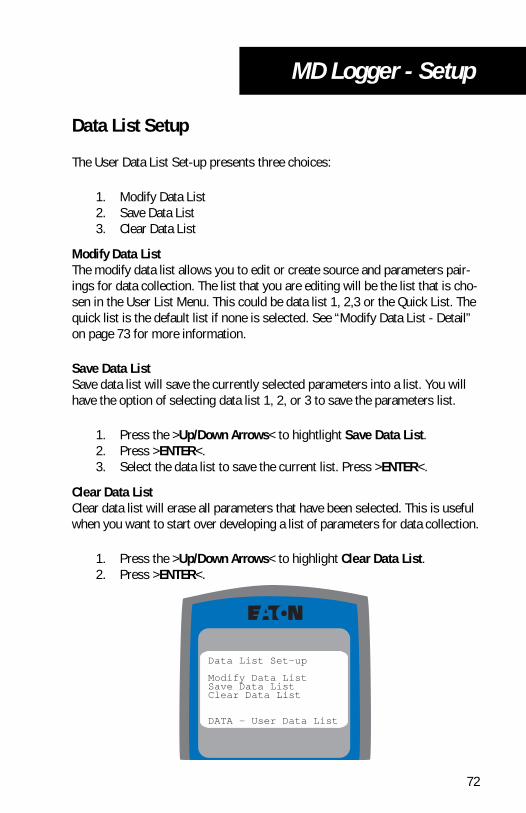
The User Data List Set-up presents three choices:
1. Modify Data List 2. Save Data List 3. Clear Data List
Modify Data ListThe modify data list allows you to edit or create source and parameters pair-ings for data collection. The list that you are editing will be the list that is cho-sen in the User List Menu. This could be data list 1, 2,3 or the Quick List. The quick list is the default list if none is selected. See “Modify Data List - Detail” on page 73 for more information.
Save Data List Save data list will save the currently selected parameters into a list. You will have the option of selecting data list 1, 2, or 3 to save the parameters list.
1. Press the >Up/Down Arrows< to hightlight Save Data List.2. Press >ENTER<.3. Select the data list to save the current list. Press >ENTER<.
Clear Data ListClear data list will erase all parameters that have been selected. This is useful when you want to start over developing a list of parameters for data collection.
1. Press the >Up/Down Arrows< to highlight Clear Data List.2. Press >ENTER<.
Data List Set-up
Modify Data ListSave Data ListClear Data List
DATA - User Data List
72
MD Logger - Setup
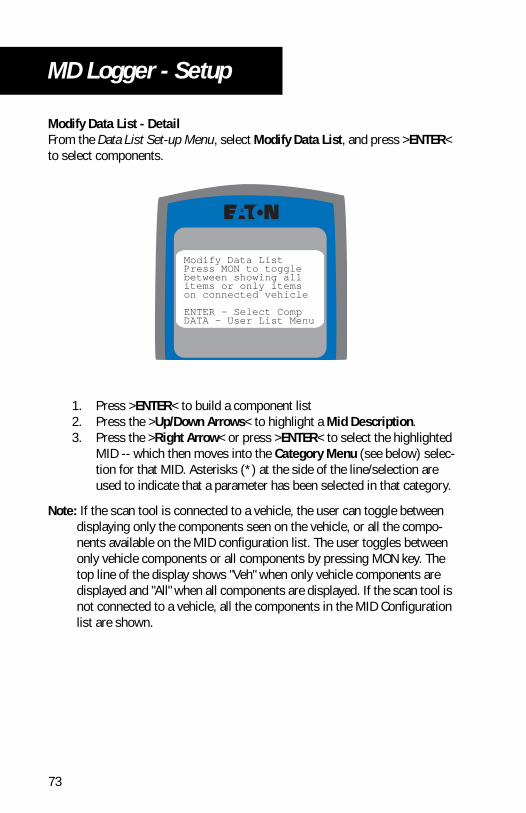
Modify Data List - DetailFrom the Data List Set-up Menu, select Modify Data List, and press >ENTER< to select components.
1. Press >ENTER< to build a component list2. Press the >Up/Down Arrows< to highlight a Mid Description.3. Press the >Right Arrow< or press >ENTER< to select the highlighted
MID -- which then moves into the Category Menu (see below) selec-tion for that MID. Asterisks (*) at the side of the line/selection are used to indicate that a parameter has been selected in that category.
Note: If the scan tool is connected to a vehicle, the user can toggle between displaying only the components seen on the vehicle, or all the compo-nents available on the MID configuration list. The user toggles between only vehicle components or all components by pressing MON key. The top line of the display shows "Veh" when only vehicle components are displayed and "All" when all components are displayed. If the scan tool is not connected to a vehicle, all the components in the MID Configuration list are shown.
Modify Data List Press MON to toggle between showing all items or only items on connected vehicle
ENTER - Select Comp DATA - User List Menu
73
MD Logger - Setup
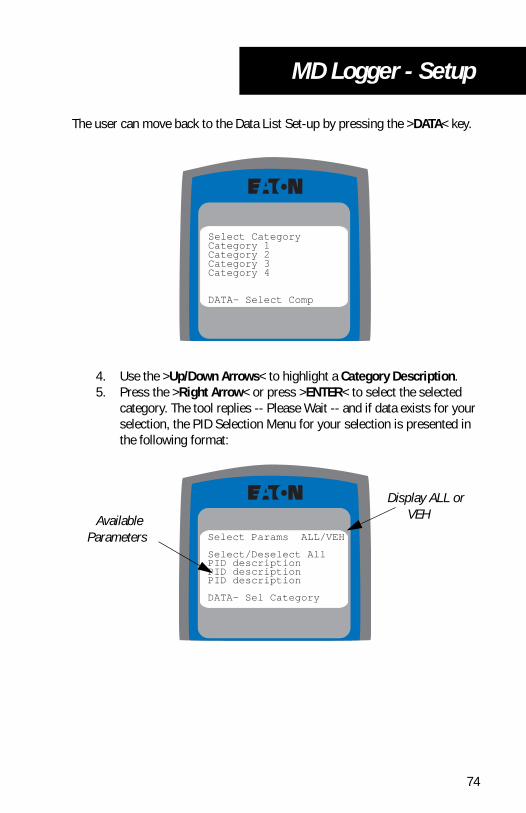
The user can move back to the Data List Set-up by pressing the >DATA< key.
4. Use the >Up/Down Arrows< to highlight a Category Description.5. Press the >Right Arrow< or press >ENTER< to select the selected
category. The tool replies -- Please Wait -- and if data exists for your selection, the PID Selection Menu for your selection is presented in the following format:
Select CategoryCategory 1Category 2Category 3Category 4
DATA- Select Comp
Select Params ALL/VEH
Select/Deselect All PID description PID description PID description
DATA- Sel Category
Display ALL or VEHAvailable
Parameters
74

MD Logger - Setup
6. Press >ENTER< to select or deselect the desired PID description. Selections are indicated by an asterisk (*) at the side of the screen for the selected description.
7. Continue making selections using steps 5 and 6 until all selections have been made - or until a maximum of 25 parameters have been selected.
8. Once all of the PID selections for this MID are complete, continue with the Component Selection until the custom MID/PID selection list is done.
Note: If the MD 200 is turned off by pressing >POWER< before saving the list OR if the user moves to another function, the selections will be lost. The user may save selections into one of three custom User Data Lists by using the Save Data List feature (available at the Data List Set-up Menu).
Select ParmsPID Description *PID DescriptionPID Description *PID Description
DATA - Sel Catergory
Asterisk will bedisplayed for
selected parameters
75
MD Logger - Setup
MD Logger- Triggers
Overview
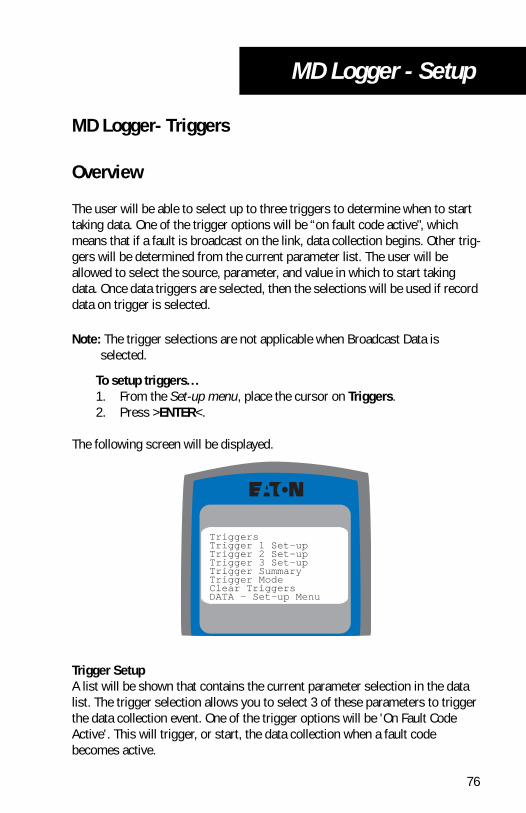
The user will be able to select up to three triggers to determine when to start taking data. One of the trigger options will be “on fault code active", which means that if a fault is broadcast on the link, data collection begins. Other trig-gers will be determined from the current parameter list. The user will be allowed to select the source, parameter, and value in which to start taking data. Once data triggers are selected, then the selections will be used if record data on trigger is selected.
Note: The trigger selections are not applicable when Broadcast Data is selected.
To setup triggers...1. From the Set-up menu, place the cursor on Triggers.2. Press >ENTER<.
The following screen will be displayed.
Trigger SetupA list will be shown that contains the current parameter selection in the data list. The trigger selection allows you to select 3 of these parameters to trigger the data collection event. One of the trigger options will be 'On Fault Code Active'. This will trigger, or start, the data collection when a fault code becomes active.
TriggersTrigger 1 Set-upTrigger 2 Set-upTrigger 3 Set-upTrigger SummaryTrigger ModeClear TriggersDATA - Set-up Menu
76

MD Logger - Setup
To select triggers...1. Use the >Up/Down Arrows<, to select Trigger 1 (or Trigger 2, or
Trigger 3).2. Press >ENTER<.
The following screen will be displayed.
3. Select the desired source and parameter from the list and press >ENTER<.The following screen will be displayed.
4. Press the >Up/Down Arrows< to select one of the menu selections and press >ENTER<.
Trigger # Set-up
On Fault Code ActiveMID ParameterMID ParameterMID Parameter
DATA - Trig Settings
Available Options
MID PID Description
Equal To =Greater Than >Less Than <
DATA - Trig Set-up
77
MD Logger - Setup
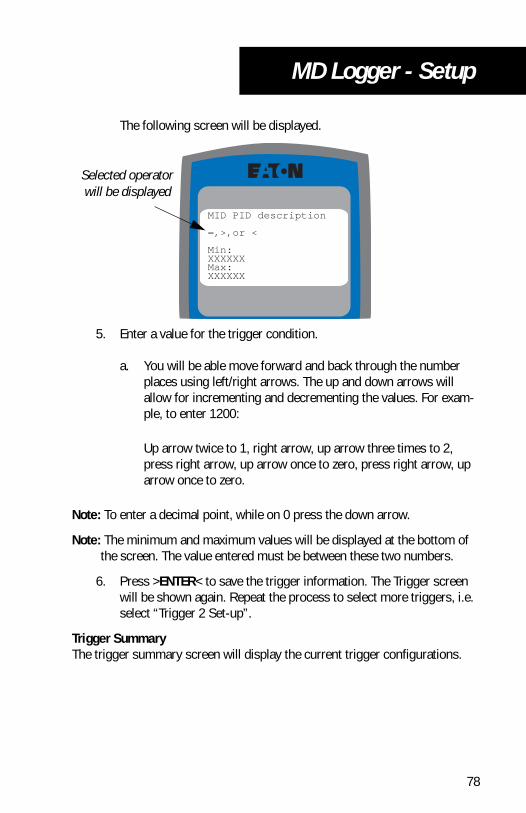
The following screen will be displayed.
5. Enter a value for the trigger condition.
a. You will be able move forward and back through the number places using left/right arrows. The up and down arrows will allow for incrementing and decrementing the values. For exam-ple, to enter 1200:
Up arrow twice to 1, right arrow, up arrow three times to 2, press right arrow, up arrow once to zero, press right arrow, up arrow once to zero.
Note: To enter a decimal point, while on 0 press the down arrow.
Note: The minimum and maximum values will be displayed at the bottom of the screen. The value entered must be between these two numbers.
6. Press >ENTER< to save the trigger information. The Trigger screen will be shown again. Repeat the process to select more triggers, i.e. select “Trigger 2 Set-up”.
Trigger SummaryThe trigger summary screen will display the current trigger configurations.
MID PID description
=,>,or <
Min: XXXXXX Max: XXXXXX
Selected operator will be displayed
78
MD Logger - Setup
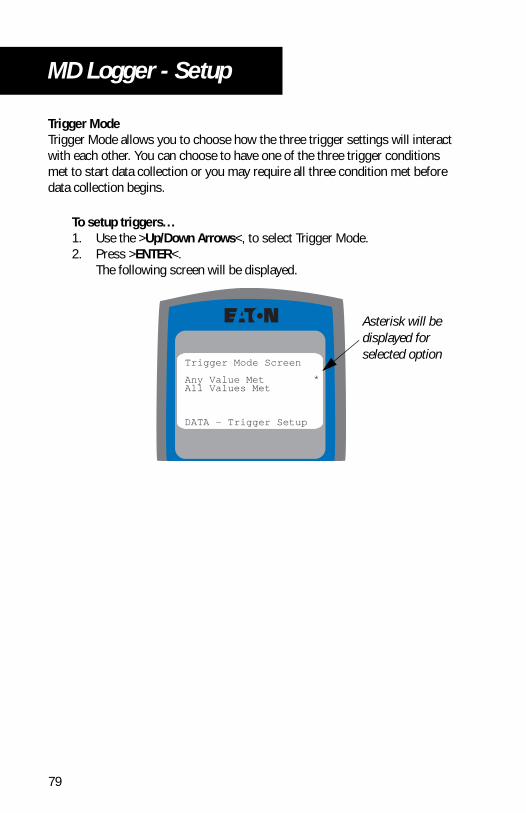
Trigger ModeTrigger Mode allows you to choose how the three trigger settings will interact with each other. You can choose to have one of the three trigger conditions met to start data collection or you may require all three condition met before data collection begins.
To setup triggers...1. Use the >Up/Down Arrows<, to select Trigger Mode.2. Press >ENTER<.
The following screen will be displayed.
Trigger Mode Screen
Any Value MetAll Values Met
DATA - Trigger Setup
*
Asterisk will bedisplayed forselected option
79
MD Logger - Setup
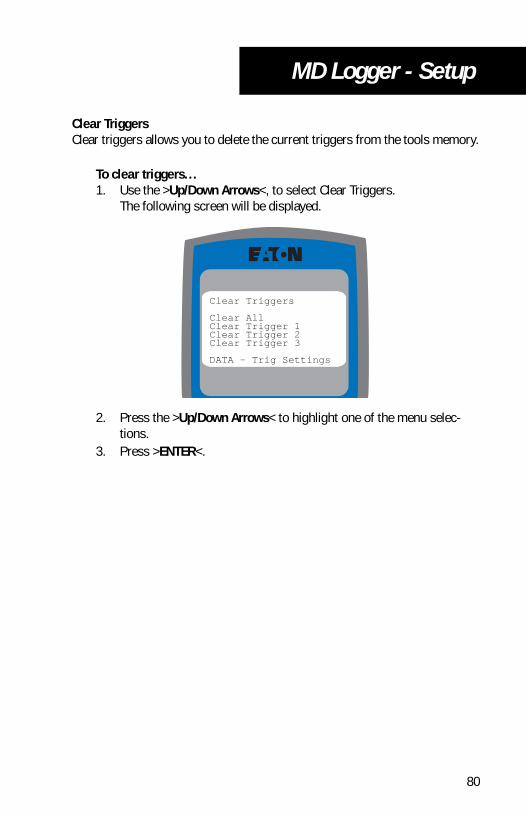
Clear TriggersClear triggers allows you to delete the current triggers from the tools memory.
To clear triggers...1. Use the >Up/Down Arrows<, to select Clear Triggers.
The following screen will be displayed.
2. Press the >Up/Down Arrows< to highlight one of the menu selec-tions.
3. Press >ENTER<.
Clear Triggers
Clear AllClear Trigger 1Clear Trigger 2Clear Trigger 3
DATA - Trig Settings
80
MD Logger - Setup
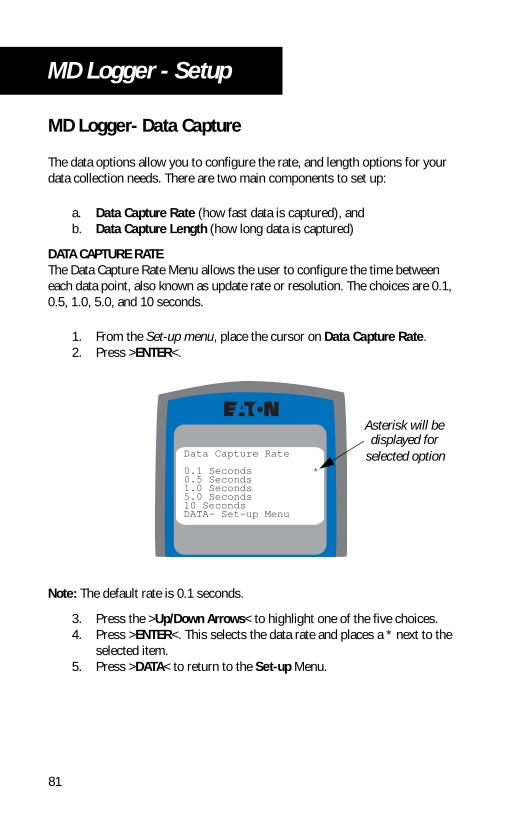
MD Logger- Data Capture
The data options allow you to configure the rate, and length options for your data collection needs. There are two main components to set up:
a. Data Capture Rate (how fast data is captured), andb. Data Capture Length (how long data is captured)
DATA CAPTURE RATEThe Data Capture Rate Menu allows the user to configure the time between each data point, also known as update rate or resolution. The choices are 0.1, 0.5, 1.0, 5.0, and 10 seconds.
1. From the Set-up menu, place the cursor on Data Capture Rate.2. Press >ENTER<.
Note: The default rate is 0.1 seconds.
3. Press the >Up/Down Arrows< to highlight one of the five choices.4. Press >ENTER<. This selects the data rate and places a * next to the
selected item.5. Press >DATA< to return to the Set-up Menu.
Data Capture Rate
0.1 Seconds 0.5 Seconds 1.0 Seconds 5.0 Seconds 10 Seconds DATA- Set-up Menu
*
Asterisk will bedisplayed for
selected option
81

MD Logger - Setup
DATA CAPTURE LENGTH
Data capture length will set the amount of time that the data logger will collect data. When the data logger begins to collect data, it will keep track of the time and stop the data collection when it has reached this limit.
To set data length...1. Press the >Up/Down Arrows< to select Data Capture Length.2. Press >ENTER<.
3. Press the >Up/Down Arrows< to select one of the choices.4. Press >ENTER<. This selects the data rate and places a * next to the
selected item.5. Press >DATA< to return to the Set-up Menu.
Data Capture Length1 Minute *2 Minutes5 Minutes10 Minutes20 Minutes30 MinutesDATA - Set-up Menu
Asterisk will bedisplayed for
selected option
82
MD Logger - Record
MD Logger- Record
Overview
Once the data logger setup is complete, you are ready to start logging data. Several methods are available to collect the data, they include:
1. EZ record2. On Key press3. On Trigger4. Broadcast Data
All methods allow you to capture multiple data captures.
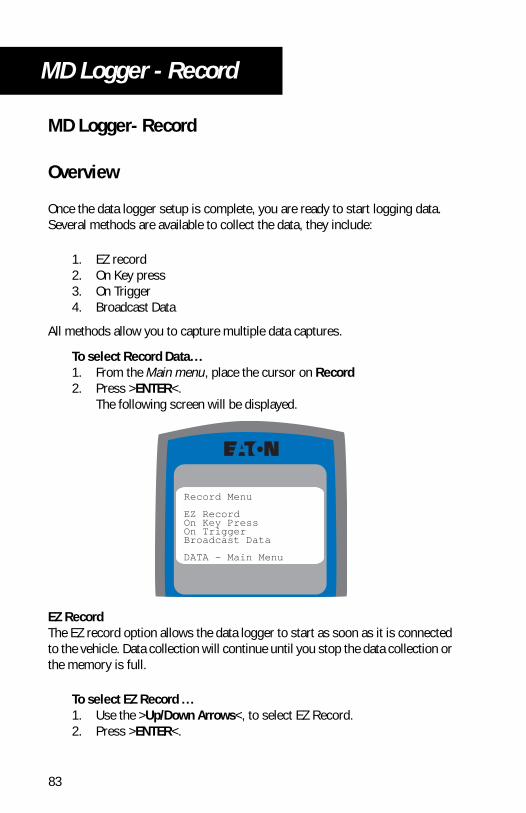
To select Record Data...1. From the Main menu, place the cursor on Record2. Press >ENTER<.
The following screen will be displayed.
EZ RecordThe EZ record option allows the data logger to start as soon as it is connected to the vehicle. Data collection will continue until you stop the data collection or the memory is full.
To select EZ Record ...1. Use the >Up/Down Arrows<, to select EZ Record.2. Press >ENTER<.
Record Menu
EZ Record On Key Press On Trigger Broadcast Data
DATA - Main Menu
83
MD Logger - Record
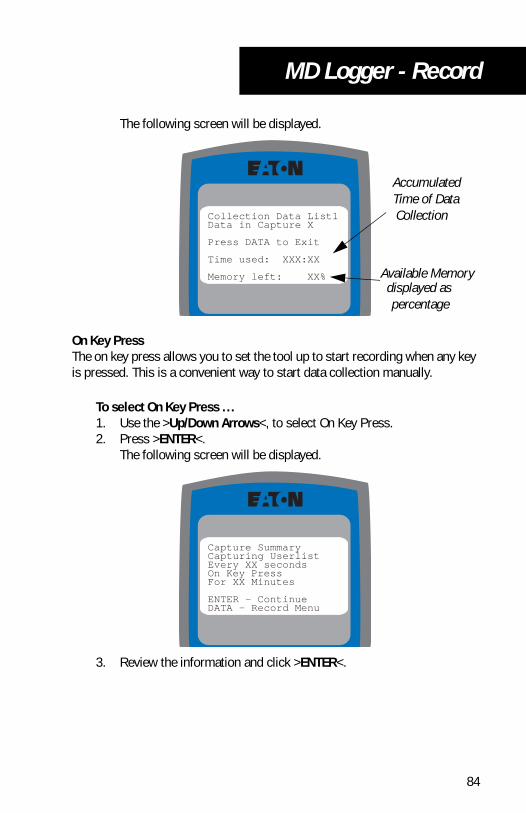
The following screen will be displayed.
On Key PressThe on key press allows you to set the tool up to start recording when any key is pressed. This is a convenient way to start data collection manually.
To select On Key Press ...1. Use the >Up/Down Arrows<, to select On Key Press.2. Press >ENTER<.
The following screen will be displayed.
3. Review the information and click >ENTER<.
Collection Data List1 Data in Capture X
Press DATA to Exit
Time used: XXX:XX
Memory left: XX% Available Memorydisplayed as
percentage
AccumulatedTime of Data Collection
Capture Summary Capturing Userlist Every XX seconds On Key Press For XX Minutes
ENTER - Continue DATA - Record Menu
84
MD Logger - Record
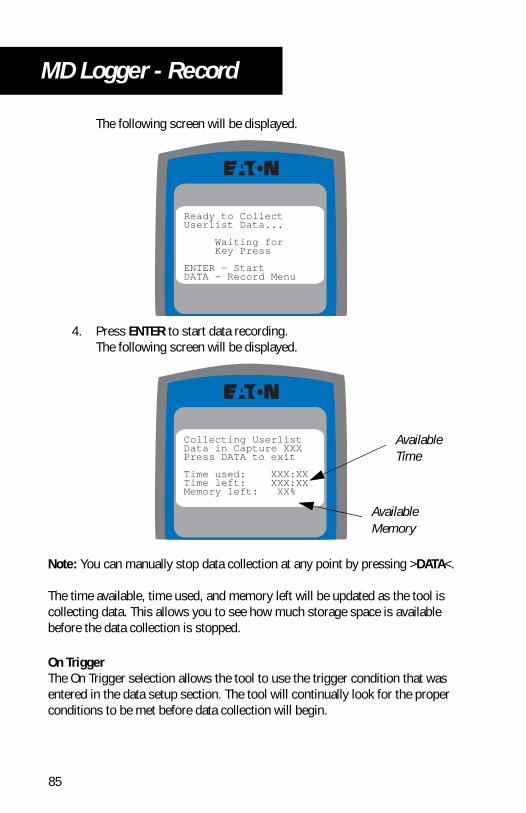
The following screen will be displayed.
4. Press ENTER to start data recording.The following screen will be displayed.
Note: You can manually stop data collection at any point by pressing >DATA<.
The time available, time used, and memory left will be updated as the tool is collecting data. This allows you to see how much storage space is available before the data collection is stopped.
On TriggerThe On Trigger selection allows the tool to use the trigger condition that was entered in the data setup section. The tool will continually look for the proper conditions to be met before data collection will begin.
Ready to Collect Userlist Data...
Waiting for Key Press
ENTER - StartDATA - Record Menu
Collecting Userlist Data in Capture XXX Press DATA to exit
Time used: XXX:XX Time left: XXX:XX Memory left: XX%
AvailableMemory
AvailableTime
85
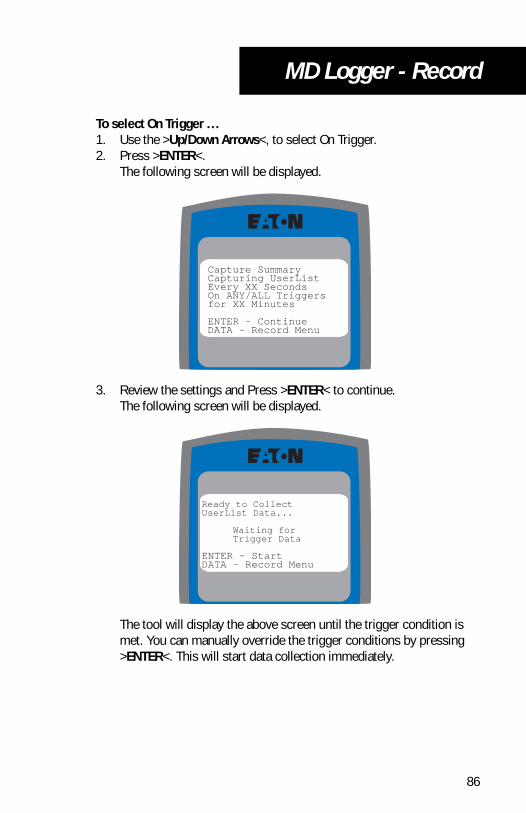
MD Logger - Record
To select On Trigger ...1. Use the >Up/Down Arrows<, to select On Trigger.2. Press >ENTER<.
The following screen will be displayed.
3. Review the settings and Press >ENTER< to continue.The following screen will be displayed.
The tool will display the above screen until the trigger condition is met. You can manually override the trigger conditions by pressing >ENTER<. This will start data collection immediately.
Capture Summary Capturing UserList Every XX Seconds On ANY/ALL Triggers for XX Minutes
ENTER - Continue DATA - Record Menu
Ready to Collect UserList Data...
Waiting for Trigger Data
ENTER - StartDATA - Record Menu
86
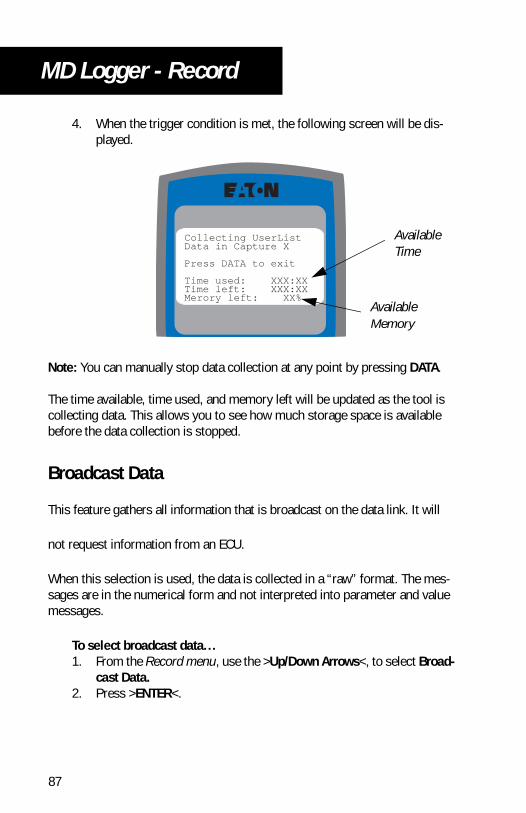
MD Logger - Record
4. When the trigger condition is met, the following screen will be dis-played.
Note: You can manually stop data collection at any point by pressing DATA.
The time available, time used, and memory left will be updated as the tool is collecting data. This allows you to see how much storage space is available before the data collection is stopped.
Broadcast Data
This feature gathers all information that is broadcast on the data link. It will
not request information from an ECU.
When this selection is used, the data is collected in a “raw” format. The mes-sages are in the numerical form and not interpreted into parameter and value messages.
To select broadcast data...1. From the Record menu, use the >Up/Down Arrows<, to select Broad-
cast Data.2. Press >ENTER<.
Collecting UserListData in Capture X
Press DATA to exit
Time used: XXX:XXTime left: XXX:XXMerory left: XX%
AvailableMemory
AvailableTime
87
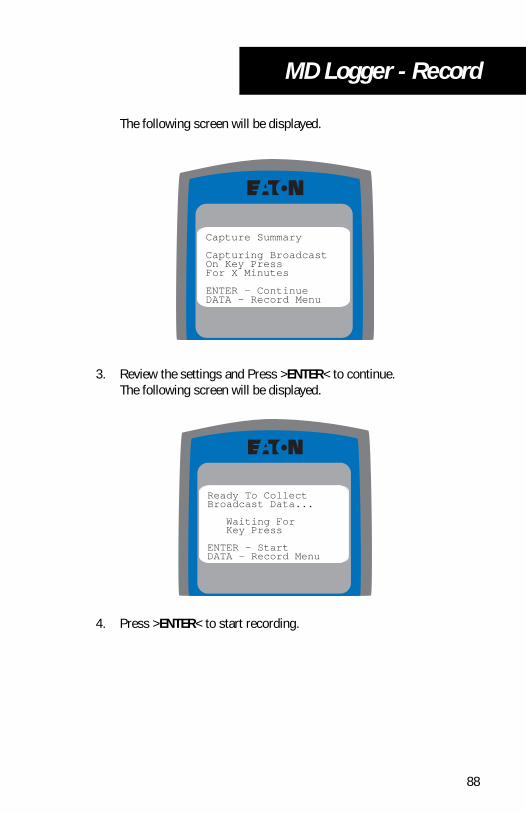
MD Logger - Record
The following screen will be displayed.
3. Review the settings and Press >ENTER< to continue.The following screen will be displayed.
4. Press >ENTER< to start recording.
Capture Summary
Capturing BroadcastOn Key PressFor X Minutes
ENTER - ContinueDATA - Record Menu
Ready To CollectBroadcast Data...
Waiting For Key Press
ENTER - StartDATA - Record Menu
88
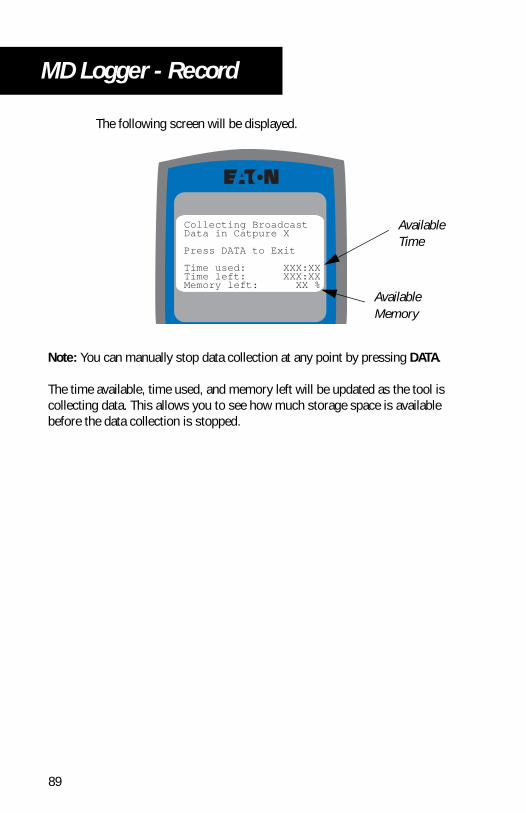
MD Logger - Record
The following screen will be displayed.
Note: You can manually stop data collection at any point by pressing DATA.
The time available, time used, and memory left will be updated as the tool is collecting data. This allows you to see how much storage space is available before the data collection is stopped.
Collecting BroadcastData in Catpure X
Press DATA to Exit
Time used: XXX:XXTime left: XXX:XXMemory left: XX %
AvailableMemory
AvailableTime
89
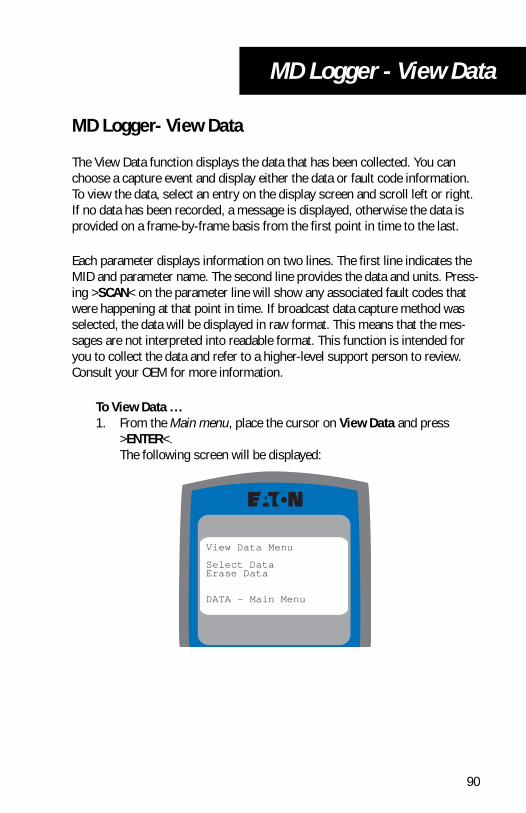
MD Logger - View Data
MD Logger- View Data
The View Data function displays the data that has been collected. You can choose a capture event and display either the data or fault code information. To view the data, select an entry on the display screen and scroll left or right. If no data has been recorded, a message is displayed, otherwise the data is provided on a frame-by-frame basis from the first point in time to the last.
Each parameter displays information on two lines. The first line indicates the MID and parameter name. The second line provides the data and units. Press-ing >SCAN< on the parameter line will show any associated fault codes that were happening at that point in time. If broadcast data capture method was selected, the data will be displayed in raw format. This means that the mes-sages are not interpreted into readable format. This function is intended for you to collect the data and refer to a higher-level support person to review. Consult your OEM for more information.
To View Data ...1. From the Main menu, place the cursor on View Data and press
>ENTER<.The following screen will be displayed:
View Data Menu
Select Data Erase Data
DATA - Main Menu
90

MD Logger - View Data
Select DataThe select data capture allows you to set what you want to view.
1. Use the >Up/Down Arrows<, and select >Select DATA<.2. Press >ENTER<.
The following screen will be displayed.
Note: If there are no data captures collected, you will not be able to proceed to the screen shown above.
3. Use the >Up/Down Arrows<, and select the desired capture.4. Press >ENTER<.
The following screen will be displayed.
Select Data Capture Capture 1 Capture 2 Capture 3 Capture 4 Capture 5
DATA - View Data Menu
View Menu
View DataView Faults
DATA- Data Menu
91

MD Logger - View Data
a. View Data
1. Press the >Up/Down Arrows< to scroll the list of parameters (2 lines at a time).
2. Press the >Left/Right Arrows< to scroll the data left/right (1 frame at a time).
Note: The bottom of the screen will display the time position of the displayed data in the data collection file.
3. If FAULT is displayed at the bottom of the screen, there was a fault code recorded at this time period. To view the Fault Code press the >SCAN< key at any time. Press >SCAN< again to return to the view data screen.
Mid PID DescriptionData UnitMid PID DescriptionData UnitMid PID DescriptionData Unit======================XXX:XX.X T FAULT->Data
Component Parameter
Value
FaultAvailable
TimeStamp
Indicatesthis is the
triggered time
92

MD Logger - View Data
b. Fault Codes
1. Press the >Up/Down Arrows< to scroll the list of fault codes.2. Press the >Left/Right Arrows< to scroll the data left/right (1 frame at
a time).
Note: The bottom of the screen indicates the current position in time of the recording.
3. To view the data captured screen, press the >SCAN< key at any time. This will display the data captured at the specific point in time where the fault occurred. Press >SCAN< again to return to the fault screen.
Erase DataThe Erase Data selection allows you to erase, or clear, all data captures in stored in memory. Once the data is erased it is permanently deleted and can not be undone.
To erase data...1. Use the >Up/Down Arrows<, to select Erase Data and press
>ENTER<.2. A screen will appear to confirm erase.3. Press >ENTER< to confirm selection. Press >DATA< to exit without
erasing the data.
MID/PID/SID/FMI StatusOccurrence xxMID DescriptionPID/SID DescriptionFMI Description
======================XXX:XX.X FAULT->
Fault CodesFault Descriptions
Arrow indicatesmore faults available
93
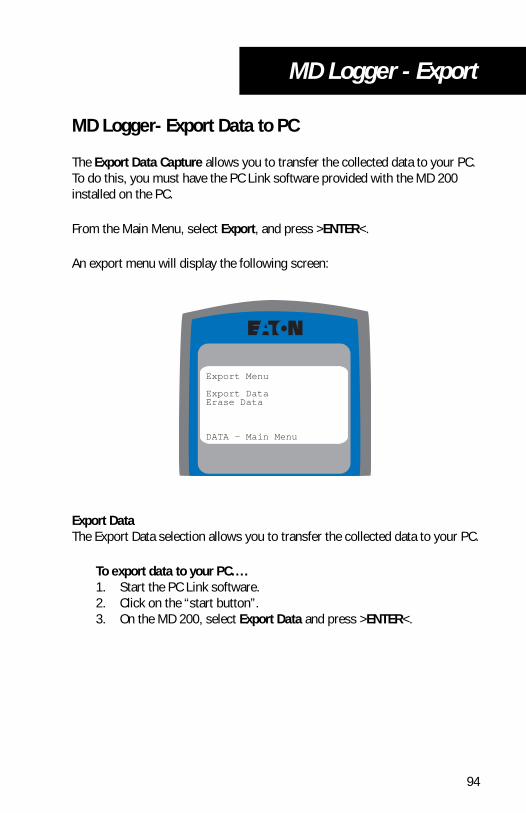
MD Logger - Export
MD Logger- Export Data to PC
The Export Data Capture allows you to transfer the collected data to your PC. To do this, you must have the PC Link software provided with the MD 200 installed on the PC.
From the Main Menu, select Export, and press >ENTER<.
An export menu will display the following screen:
Export DataThe Export Data selection allows you to transfer the collected data to your PC.
To export data to your PC....1. Start the PC Link software.2. Click on the “start button”.3. On the MD 200, select Export Data and press >ENTER<.
Export Menu
Export Data Erase Data
DATA - Main Menu
94
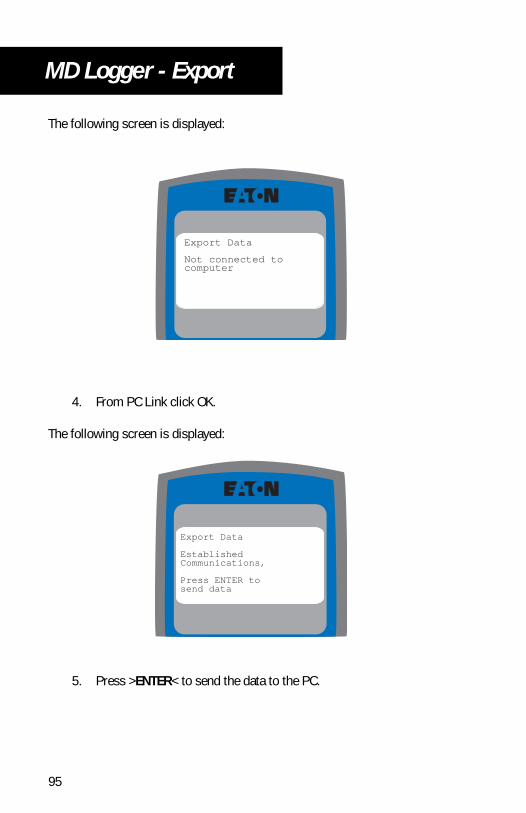
MD Logger - Export
The following screen is displayed:
4. From PC Link click OK.
The following screen is displayed:
5. Press >ENTER< to send the data to the PC.
Export Data
Not connected tocomputer
Export Data
Established Communications,
Press ENTER to send data
95
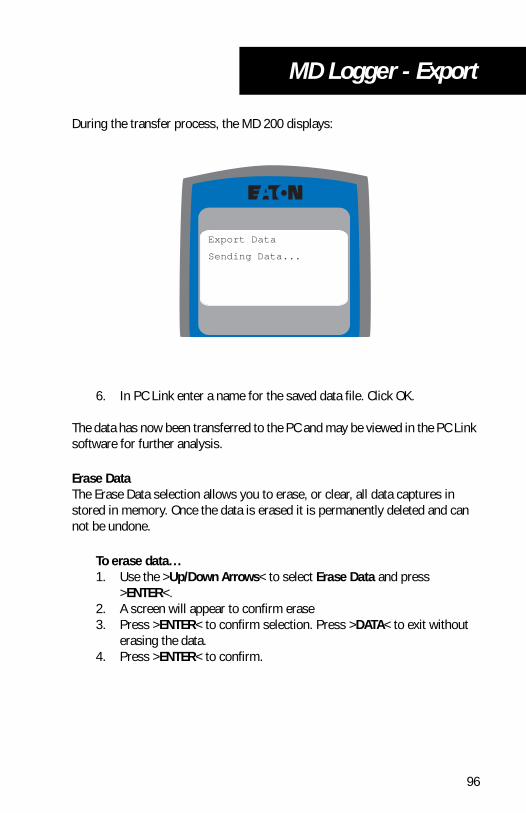
MD Logger - Export
During the transfer process, the MD 200 displays:
6. In PC Link enter a name for the saved data file. Click OK.
The data has now been transferred to the PC and may be viewed in the PC Link software for further analysis.
Erase DataThe Erase Data selection allows you to erase, or clear, all data captures in stored in memory. Once the data is erased it is permanently deleted and can not be undone.
To erase data...1. Use the >Up/Down Arrows< to select Erase Data and press
>ENTER<.2. A screen will appear to confirm erase3. Press >ENTER< to confirm selection. Press >DATA< to exit without
erasing the data.4. Press >ENTER< to confirm.
Export Data
Sending Data...
96
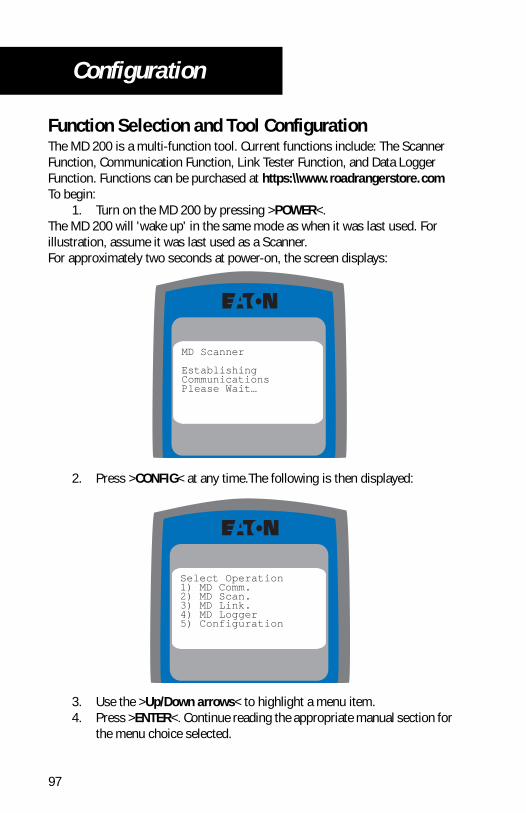
Configuration
Function Selection and Tool ConfigurationThe MD 200 is a multi-function tool. Current functions include: The Scanner Function, Communication Function, Link Tester Function, and Data Logger Function. Functions can be purchased at https:\\www.roadrangerstore.com To begin:
1. Turn on the MD 200 by pressing >POWER<.The MD 200 will 'wake up' in the same mode as when it was last used. For illustration, assume it was last used as a Scanner. For approximately two seconds at power-on, the screen displays:
2. Press >CONFIG< at any time.The following is then displayed:
3. Use the >Up/Down arrows< to highlight a menu item.4. Press >ENTER<. Continue reading the appropriate manual section for
the menu choice selected.
MD Scanner
EstablishingCommunicationsPlease Wait…
Select Operation1) MD Comm.2) MD Scan.3) MD Link.4) MD Logger5) Configuration
97
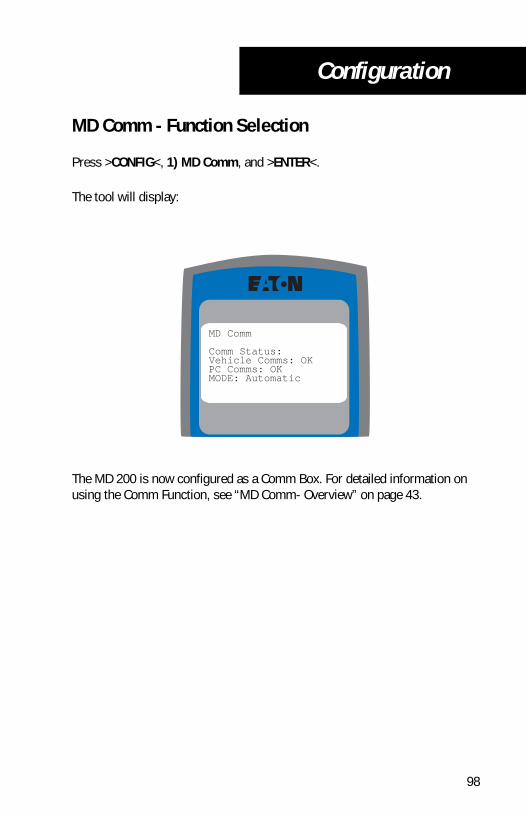
Configuration
MD Comm - Function Selection
Press >CONFIG<, 1) MD Comm, and >ENTER<.
The tool will display:
The MD 200 is now configured as a Comm Box. For detailed information on using the Comm Function, see “MD Comm- Overview” on page 43.
MD Comm
Comm Status:Vehicle Comms: OKPC Comms: OKMODE: Automatic
98
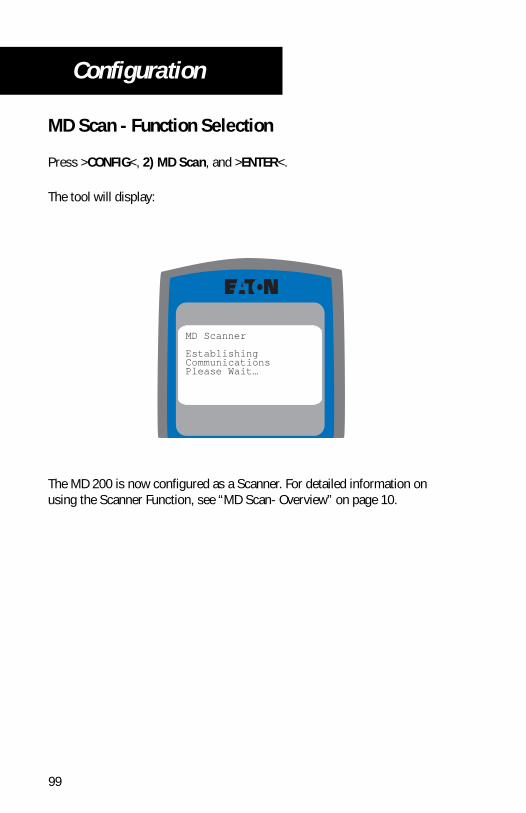
Configuration
MD Scan - Function Selection
Press >CONFIG<, 2) MD Scan, and >ENTER<.
The tool will display:
The MD 200 is now configured as a Scanner. For detailed information on using the Scanner Function, see “MD Scan- Overview” on page 10.
MD Scanner
EstablishingCommunicationsPlease Wait…
99

Configuration
MD Link - Function Selection
Press >CONFIG<, 3) MD Link, and >ENTER<.
The MD 200 is now configured as a Link Tester. For detailed information on using the Link Tester Function, see “MD Link- Overview” on page 46.
The tool will display:
MD Link Tester
EstablishingCommunicationsPlease Wait…
100
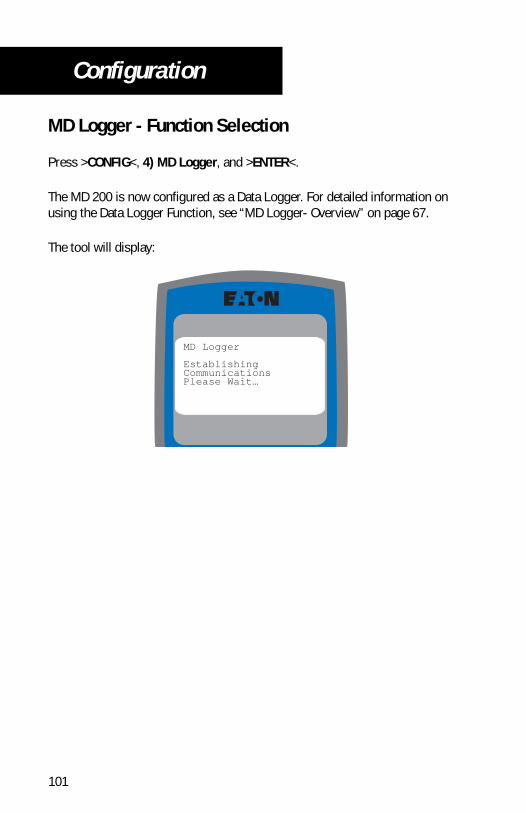
Configuration
MD Logger - Function Selection
Press >CONFIG<, 4) MD Logger, and >ENTER<.
The MD 200 is now configured as a Data Logger. For detailed information on using the Data Logger Function, see “MD Logger- Overview” on page 67.
The tool will display:
MD Logger
EstablishingCommunicationsPlease Wait…
101
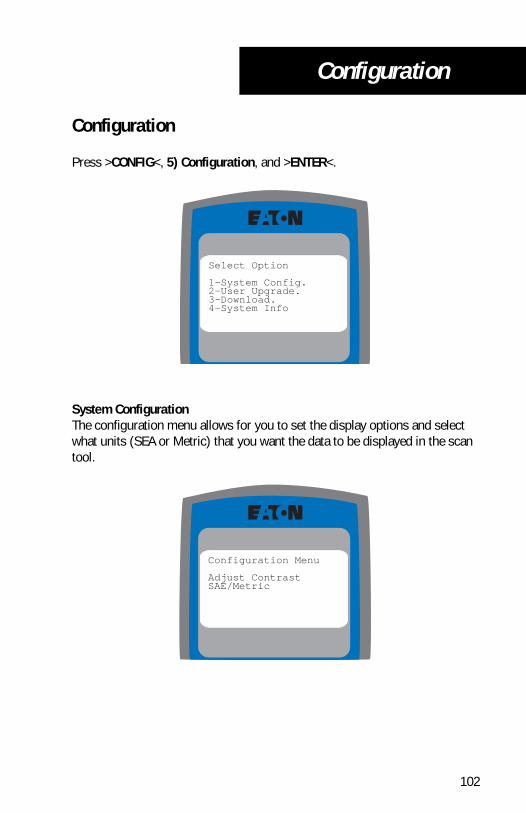
Configuration
Configuration
Press >CONFIG<, 5) Configuration, and >ENTER<.
System ConfigurationThe configuration menu allows for you to set the display options and select what units (SEA or Metric) that you want the data to be displayed in the scan tool.
Select Option
1-System Config.2-User Upgrade.3-Download.4-System Info
Configuration Menu
Adjust ContrastSAE/Metric
102

Configuration
Adjust Contrast
1. Use the Up, Down, Left, and Right keys to adjust contrast.2. Use the >MON< button to turn backlight on or off.
Units
1. Use the >Up or Down< keys to select the units2. Press >ENTER< to save the units selection.
To Adjust ContrastUse UP, DOWN, LEFTRIGHT Keys.Use MON Key toToggleBackLight
Select Display Units
SAEMetric *
103
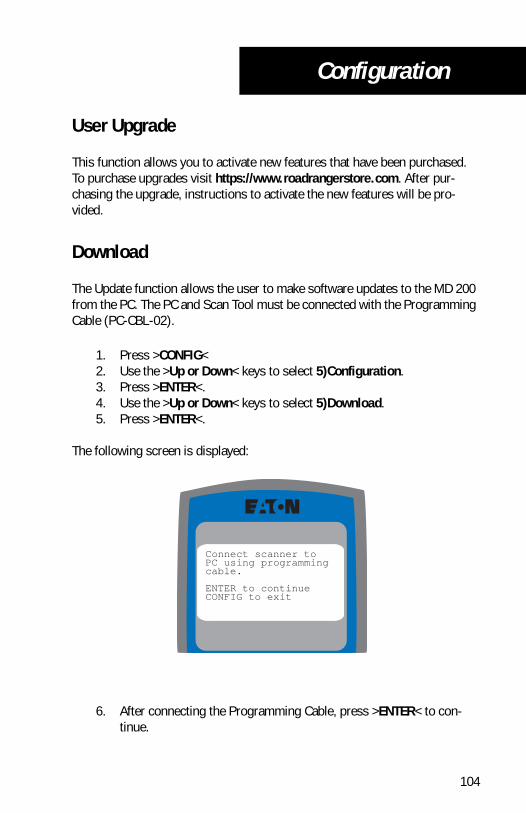
Configuration
User Upgrade
This function allows you to activate new features that have been purchased. To purchase upgrades visit https://www.roadrangerstore.com. After pur-chasing the upgrade, instructions to activate the new features will be pro-vided.
Download
The Update function allows the user to make software updates to the MD 200 from the PC. The PC and Scan Tool must be connected with the Programming Cable (PC-CBL-02).
1. Press >CONFIG<2. Use the >Up or Down< keys to select 5)Configuration.3. Press >ENTER<.4. Use the >Up or Down< keys to select 5)Download.5. Press >ENTER<.
The following screen is displayed:
6. After connecting the Programming Cable, press >ENTER< to con-tinue.
Connect scanner toPC using programmingcable.
ENTER to continueCONFIG to exit
104
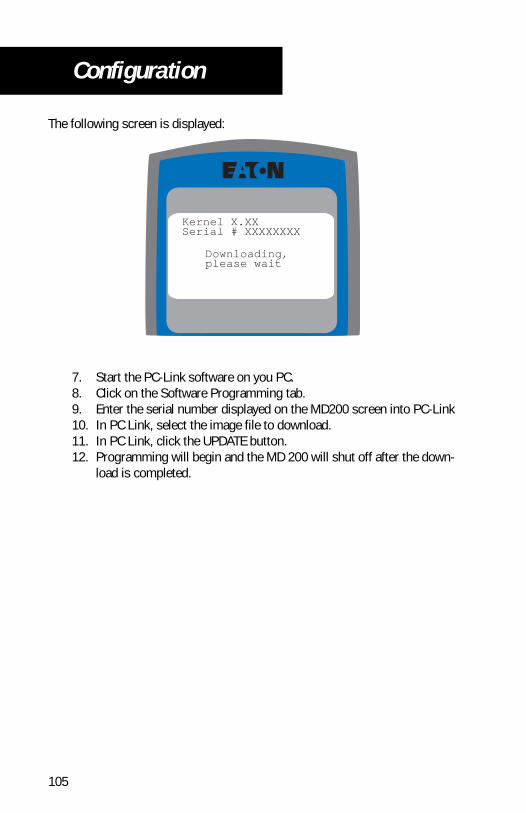
Configuration
The following screen is displayed:
7. Start the PC-Link software on you PC.8. Click on the Software Programming tab.9. Enter the serial number displayed on the MD200 screen into PC-Link10. In PC Link, select the image file to download.11. In PC Link, click the UPDATE button.12. Programming will begin and the MD 200 will shut off after the down-
load is completed.
Downloading, please wait
Kernel X.XXSerial # XXXXXXXX
105
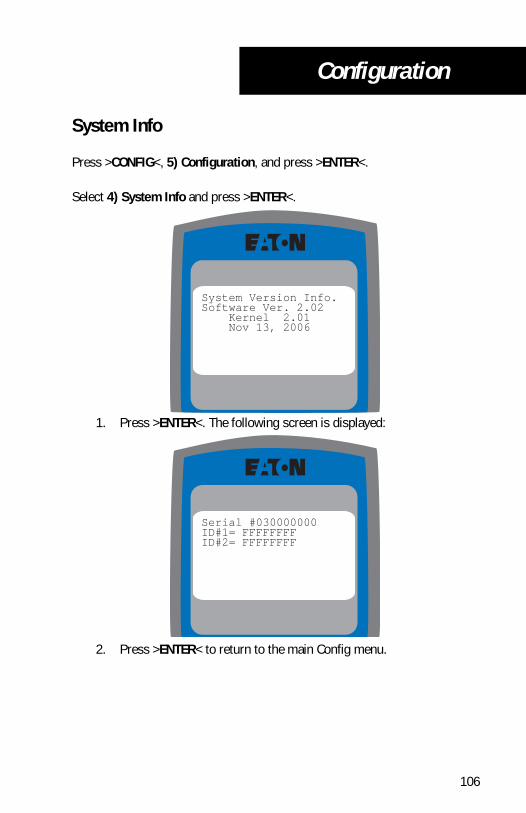
Configuration
System Info
Press >CONFIG<, 5) Configuration, and press >ENTER<.
Select 4) System Info and press >ENTER<.
1. Press >ENTER<. The following screen is displayed:
2. Press >ENTER< to return to the main Config menu.
System Version Info.Software Ver. 2.02 Kernel 2.01 Nov 13, 2006
Serial #030000000ID#1= FFFFFFFFID#2= FFFFFFFF
106

APMT-0200Printed in USA
Eaton CorporationRoadranger Parts MarketingPO Box 4013Kalamazoo, MI 49003U.S.Awww .roadranger.com
1-800-826-HELP (4357)www.roadrangerstore.com
©2006 Eaton Corporation. EATON CORPORATION hereby grants its customers, vendors, or distributors permission to freely copy, reproduce and/or distribute this document in printed format. THIS INFORMATION IS NOT INTENDED FOR SALE OR RESALE, AND THIS NOTICE MUST REMAIN ON ALL COPIES.
Eaton MD™ Tools are provided to Eaton Corporation by SPX Corporation