md&a - bb · Índice de comissionamento % 23.1 23.8 22.7 23.1 22.6 Índice de despesas gerais e...
TRANSCRIPT

2Q16
MD&A BB Seguridade Participações S.A
P R E S E N T A T I O N
The Management Discussion and Analysis – MD&A presents the economic and financial status of BB Seguridade Participações S.A. (BB
Seguridade). Directed to financial analysts, shareholders and investors, this quarterly report provides an analysis of economic and
financial indicators of BB Seguridade’s, stocks performance and other aspects considered relevant for the assessment of the company’s
performance.
Back to November 2012, Banco do Brasil S.A. (BB) announced its intention to create BB Seguridade, a wholly owned subsidiary
responsible for consolidating, under a single holding company all activities related to insurance, open-end private pension plans,
premium bonds, brokerage, and other. In the same document, BB disclosed its intention to promote an IPO of the holding company BB
Seguridade at BM&FBovespa S.A. – Bolsa de Valores, Mercadorias e Futuros.
The bookbuilding of the aforementioned public offering was concluded on April 25th
, 2013 and the price was set at R$17.00 per share.
The shares started being traded on April 29th
, 2013. In the offering, the controlling shareholder (Banco do Brasil) sold 675 million shares,
in a transaction that involved approximately R$11.5 billion, with 500 million shares sold in the base offering, 100 million in the hot issue,
and 75 million in the greenshoe. The announcement of the offering closing was published on May 17th
, 2013.
The consolidated financial statements were prepared in compliance with the International Financial Reporting Standards – IFRS.
All the analyses in this report are based on IFRS Financial Statements, but are occasionally supplemented by managerial data, besides
other information calculated based on accounting principles determined by the Superintendência de Seguros Privados – SUSEP (the
regulator of the insurance industry in Brazil).
O N - L I N E A C C E S S
This MD&A is available at BB Seguridade’s IR website, where additional information about the Company is also available such as:
corporate structure, corporate governance, historical series for download, among other important information for shareholders and
investors. The company’s website can be accessed through either http://www.bancodobrasilseguridade.com.br.
This report makes references and statements about growth estimates, earnings forecasts and future strategies regarding BB Seguridade. Such statements are based on current expectations, estimates and projections of the Management about future events and financial trends that may affect the businesses that the Group is involved in.
These forward looking statements are not guarantees of future performance and involve risks and uncertainties that could overextend the control of the management, and thus can result in balances and values different from those anticipated and discussed in this report. The expectations and projections depend on market conditions (technological changes, competitive constraints on products, prices, etc.), on the country’s macroeconomic performance (interest and exchange rates, political and economic changes, inflation, changes in tax rules, etc.) and on international markets.
Future expectations based on this report should consider the risks and uncertainties that involve the businesses of BB Seguridade. BB Seguridade has no responsibility to update any estimate contained either in this report or in reports published previously.
Tables and charts in this report shows, in addition to the accounting balances, financial and managerial figures. The changes of relative rates are calculated before rounding procedure in R$ million. The rounding method used follows the rules established by Resolution 886/66 of IBGE’s Foundation: if the decimal number is equal or greater than 0.5, it increases by one unit, if the decimal number is less than 0.5, there is no increase.
2Q16 Earnings Conference Call
Index
1. Summary 5
2. Earnings Analysis 18
3. Balance Sheet Analysis 23
4. Underwriting and Accumulation 28
5. Distribution 105
6. Definitions 113
August 09th, 2016
Portuguese
Time: 10 am (Brasília time)
9 am (Eastern time)
Dial-in: Brazil +55-11-3137 8025
USA +1-786-837 9597
UK +44-20-3318 3776
Webcast: www.bancodobrasilseguridade.com.br
English
Time: 11:30 am (Brasília time)
10:30 am (Eastern time)
Dial-in: Brazil +55-11-3137 8025
USA +1-786-837 9597
UK +44-20-3318 3776
Webcast: www.bancodobrasilseguridade.com.br
Contacts
Investor Relations
+55 (11) 3066-9894
Rua Alexandre Dumas, 1671 – Térreo – Ala B Chácara Santo Antônio – São Paulo – SP CEP: 04717-903

BB Seguridade Participações S.A. | Management Discussion & Analysis 2Q16 5
1 . S U M M A R Y
Table 1 – Key figuresrites
Unidade 2T 15 3T 15 4T 15 1T 16 2T 16
Sumário do s resultado s
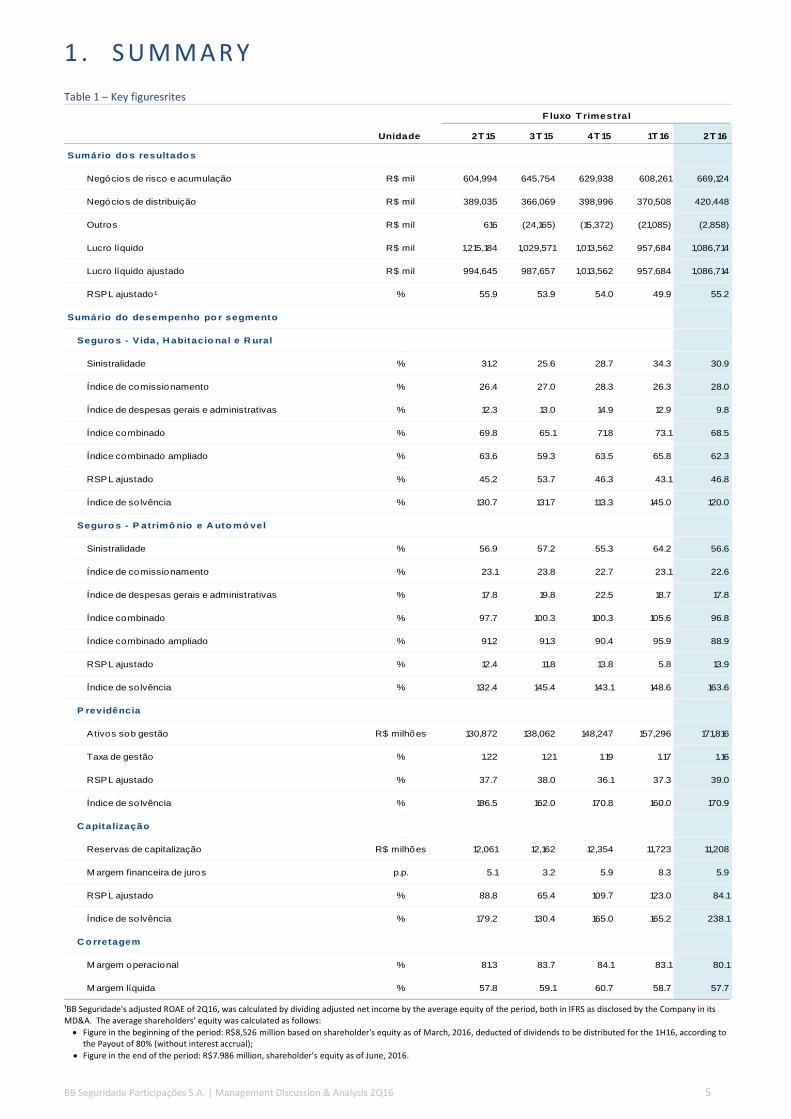
Negócios de risco e acumulação R$ mil 604,994 645,754 629,938 608,261 669,124
Negócios de distribuição R$ mil 389,035 366,069 398,996 370,508 420,448
Outros R$ mil 616 (24,165) (15,372) (21,085) (2,858)
Lucro líquido R$ mil 1,215,184 1,029,571 1,013,562 957,684 1,086,714
Lucro líquido ajustado R$ mil 994,645 987,657 1,013,562 957,684 1,086,714
RSPL ajustado¹ % 55.9 53.9 54.0 49.9 55.2
Sumário do desempenho po r segmento
Seguro s - Vida, H abitacio nal e R ural
Sinistralidade % 31.2 25.6 28.7 34.3 30.9
Índice de comissionamento % 26.4 27.0 28.3 26.3 28.0
Índice de despesas gerais e administrativas % 12.3 13.0 14.9 12.9 9.8
Índice combinado % 69.8 65.1 71.8 73.1 68.5
Índice combinado ampliado % 63.6 59.3 63.5 65.8 62.3
RSPL ajustado % 45.2 53.7 46.3 43.1 46.8
Índice de so lvência % 130.7 131.7 113.3 145.0 120.0
Seguro s - P atrimô nio e A uto mó vel
Sinistralidade % 56.9 57.2 55.3 64.2 56.6
Índice de comissionamento % 23.1 23.8 22.7 23.1 22.6
Índice de despesas gerais e administrativas % 17.8 19.8 22.5 18.7 17.8
Índice combinado % 97.7 100.3 100.3 105.6 96.8
Índice combinado ampliado % 91.2 91.3 90.4 95.9 88.9
RSPL ajustado % 12.4 11.8 13.8 5.8 13.9
Índice de so lvência % 132.4 145.4 143.1 148.6 163.6
P revidência
Ativos sob gestão R$ milhões 130,872 138,062 148,247 157,296 171,816
Taxa de gestão % 1.22 1.21 1.19 1.17 1.16
RSPL ajustado % 37.7 38.0 36.1 37.3 39.0
Índice de so lvência % 186.5 162.0 170.8 160.0 170.9
C apitalização
Reservas de capitalização R$ milhões 12,061 12,162 12,354 11,723 11,208
M argem financeira de juros p.p. 5.1 3.2 5.9 8.3 5.9
RSPL ajustado % 88.8 65.4 109.7 123.0 84.1
Índice de so lvência % 179.2 130.4 165.0 165.2 238.1
C o rretagem
M argem operacional % 81.3 83.7 84.1 83.1 80.1
M argem líquida % 57.8 59.1 60.7 58.7 57.7
F luxo T rimestral
¹BB Seguridade's adjusted ROAE of 2Q16, was calculated by dividing adjusted net income by the average equity of the period, both in IFRS as disclosed by the Company in its MD&A. The average shareholders’ equity was calculated as follows:
Figure in the beginning of the period: R$8,526 million based on shareholder's equity as of March, 2016, deducted of dividends to be distributed for the 1H16, according to the Payout of 80% (without interest accrual);
Figure in the end of the period: R$7.986 million, shareholder’s equity as of June, 2016.
BB Seguridade Participações S.A. | Management Discussion & Analysis 2Q16 6
A D J U S T E D N E T I N C O M E
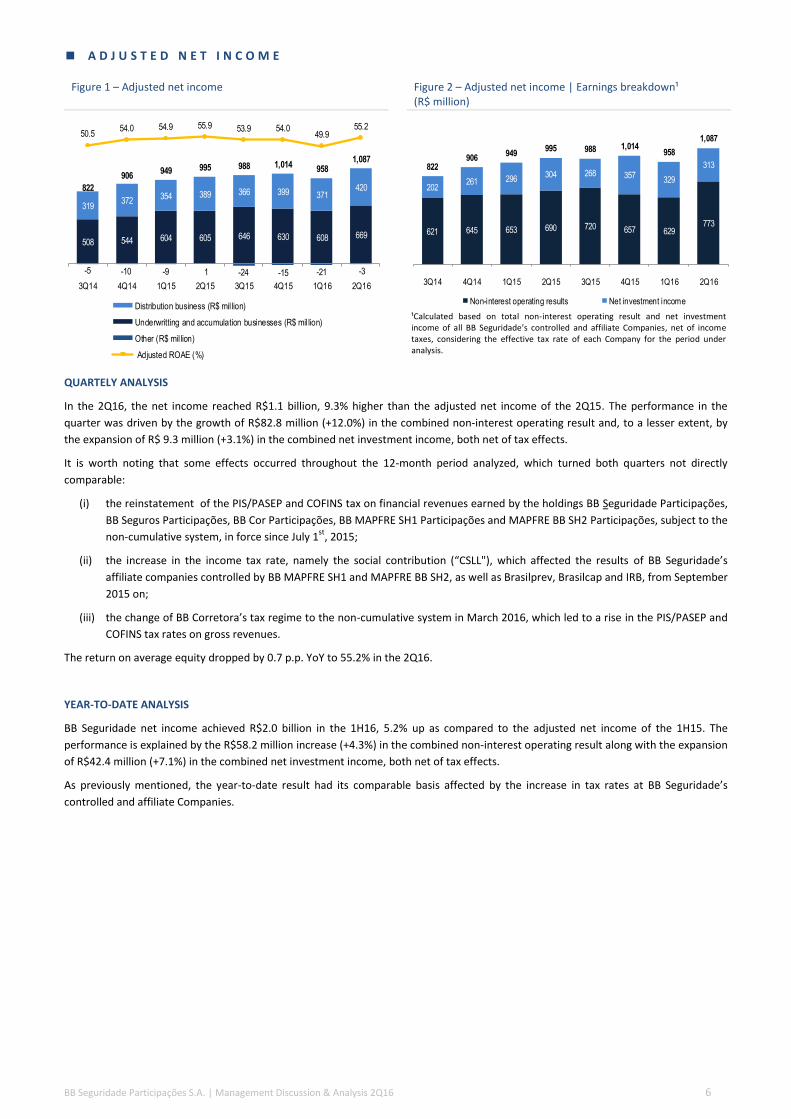
Figure 1 – Adjusted net income Figure 2 – Adjusted net income | Earnings breakdown¹ (R$ million)
-5 -10 -9 1 -24 -15 -21 -3
508 544 604 605 646 630 608 669
319372
354 389 366 399 371420822
906949 995 988 1,014
9581,087
50.554.0 54.9 55.9 53.9 54.0
49.955.2
3Q14 4Q14 1Q15 2Q15 3Q15 4Q15 1Q16 2Q16
Distribution business (R$ million)
Underwritting and accumulation businesses (R$ million)
Other (R$ million)
Adjusted ROAE (%)
621 645 653 690 720 657 629773
202261 296
304 268 357329
313822906
949995 988 1,014
958
1,087
3Q14 4Q14 1Q15 2Q15 3Q15 4Q15 1Q16 2Q16
Non-interest operating results Net investment income
¹Calculated based on total non-interest operating result and net investment income of all BB Seguridade’s controlled and affiliate Companies, net of income taxes, considering the effective tax rate of each Company for the period under analysis.
QUARTELY ANALYSIS
In the 2Q16, the net income reached R$1.1 billion, 9.3% higher than the adjusted net income of the 2Q15. The performance in the
quarter was driven by the growth of R$82.8 million (+12.0%) in the combined non-interest operating result and, to a lesser extent, by
the expansion of R$ 9.3 million (+3.1%) in the combined net investment income, both net of tax effects.
It is worth noting that some effects occurred throughout the 12-month period analyzed, which turned both quarters not directly
comparable:
(i) the reinstatement of the PIS/PASEP and COFINS tax on financial revenues earned by the holdings BB Seguridade Participações,
BB Seguros Participações, BB Cor Participações, BB MAPFRE SH1 Participações and MAPFRE BB SH2 Participações, subject to the
non-cumulative system, in force since July 1st
, 2015;
(ii) the increase in the income tax rate, namely the social contribution (“CSLL"), which affected the results of BB Seguridade’s
affiliate companies controlled by BB MAPFRE SH1 and MAPFRE BB SH2, as well as Brasilprev, Brasilcap and IRB, from September
2015 on;
(iii) the change of BB Corretora’s tax regime to the non-cumulative system in March 2016, which led to a rise in the PIS/PASEP and
COFINS tax rates on gross revenues.
The return on average equity dropped by 0.7 p.p. YoY to 55.2% in the 2Q16.
YEAR-TO-DATE ANALYSIS
BB Seguridade net income achieved R$2.0 billion in the 1H16, 5.2% up as compared to the adjusted net income of the 1H15. The
performance is explained by the R$58.2 million increase (+4.3%) in the combined non-interest operating result along with the expansion
of R$42.4 million (+7.1%) in the combined net investment income, both net of tax effects.
As previously mentioned, the year-to-date result had its comparable basis affected by the increase in tax rates at BB Seguridade’s
controlled and affiliate Companies.

BB Seguridade Participações S.A. | Management Discussion & Analysis 2Q16 7
Figure 3 – Adjusted net income | Quarterly evolution breakdown (R$ million)
Figure 4 – Adjusted net income | Year-to-date evolution breakdown (R$ million)
995
83 9 1,087
2Q15 Adjusted netincome
Change in non-interestoperating result¹
Change in netinvestment income¹
2Q16 Adjusted netincome
¹Calculated based on total non-interest operating result and net investment income of all BB Seguridade’s controlled and affiliate Companies, net of income taxes, considering the effective tax rate of each Company for the period under analysis.
1,944
58 42 2,044
1H15 Adjusted netincome
Change in non-interestoperating result¹
Change in netinvestment income¹
1H16 Adjusted netincome
¹Calculated based on total non-interest operating result and net investment income of all BB Seguridade’s controlled and affiliate Companies, net of income taxes, considering the effective tax rate of each Company for the period under analysis.
U N D E R W R I T I N G A N D A C C U M U L A T I O N B U S I N E S S E S
Table 2 – Earnings analysis | Adjusted income statement
C hg. %
R $ tho usand 2Q15 1Q16 2Q16 On 2Q15 On 1Q16 1H 15 1H 16 On 1H 15
Equity inco me 1,001,759 966,901 1,089,192 8.7 12.6 1,958,003 2,056,092 5.0
Underwritting and accumulation businesses 604,994 608,261 669,124 10.6 10.0 1,208,958 1,277,385 5.7
Life, M ortgage Life and Rural 286,147 284,536 314,528 9.9 10.5 580,282 599,064 3.2
Property and Casualty 50,070 25,248 62,883 25.6 149.1 99,482 88,131 (11.4)
Pension Plans 157,150 167,105 181,388 15.4 8.5 322,192 348,493 8.2
Reinsurance 46,623 40,720 41,212 (11.6) 1.2 72,335 81,932 13.3
Premium Bonds 64,589 90,040 68,403 5.9 (24.0) 134,446 158,443 17.8
Dental Insurance 415 612 710 71.1 16.0 221 1,322 498.2
Distribution businesses 389,035 370,508 420,448 8.1 13.5 743,131 790,956 6.4
Other 7,730 (11,868) (380) - (96.8) 5,914 (12,249) -
G&A expenses (11,855) (20,005) (13,176) 11.1 (34.1) (23,569) (33,181) 40.8
Personnel expenses (10,137) (11,898) (10,330) 1.9 (13.2) (17,802) (22,228) 24.9
Administrative expenses (2,107) (2,139) (2,792) 32.5 30.5 (5,945) (4,931) (17.1)
Tax expenses (12) (5,974) (503) 3,938.9 (91.6) (485) (6,476) 1,234.1
Other operating income (expenses) 401 6 448 11.8 7,371.4 663 454 (31.5)
N et investment inco me 4,741 10,788 10,699 125.7 (0.8) 9,326 21,487 130.4
Financial income 4,741 48,997 10,699 125.7 (78.2) 36,284 59,696 64.5
Financial expenses - (38,209) - - - (26,958) (38,209) 41.7
A djusted net inco me 994,645 957,684 1,086,714 9.3 13.5 1,943,760 2,044,398 5.2
Quarterly F lo w C hg. % H alf -Yearly F lo w

BB Seguridade Participações S.A. | Management Discussion & Analysis 2Q16 8
E X T R A O R D I N A R Y E V E N T S
Table 3 – Earnings Analysis | Extraordinary events
C hg. %
R $ tho usand 2Q15 1Q16 2Q16 On 2Q15 On 1Q16 1H 15 1H 16 On 1H 15
A djusted net inco me 994,645 957,684 1,086,714 9.3 13.5 1,943,760 2,044,398 5.2
Extrao rdinary events 220,539 - - - - 220,539 - -
Brasilprev: reversal of provisions 220,539 - - - - 220,539 - -
N et inco me 1,215,184 957,684 1,086,714 (10.6) 13.5 2,164,299 2,044,398 (5.5)
Quarterly F lo w C hg. % H alf -Yearly F lo w
Brasilprev – Reversal of provision: in December 2014, pursuant to resolution CNSP nº 281/13 and SUSEP Rule 462/13, Brasilprev
recorded R$1.0 billion in reversals. The amount refers to the entire balance previously recorded in Provision for Insufficiency of
Contributions and Provision for Financial Fluctuation.
Simultaneously, Brasilprev conducted its half-yearly Liability Adequacy Test, based on financial statements of December 2014, in
compliance with SUSEP rule 457/12, and recorded R$514.1 million in Supplementary Coverage Provision (PCC).
The Liability Adequacy Test assesses the obligations arising from pension plan contracts and, when found insufficient technical
provisions, the company can adopt two alternatives:
the use of unrealized gains (strategy adopted until June 2014); or
the constitution of Supplementary Coverage Provision (strategy used in December 2014).
Until June 2014, Brasilprev had been using unrealized gains to offset possible insufficiency of technical provisions identified by the
Liability Adequacy Test. In December 2014, the deadline for reversal of Other Technical Provisions (where there were allocated the
balances of Provision for Insufficiency for Contributions and Provision for Financial Fluctuations), SUSEP has allowed the use of an
alternative forward yield curve structure, to minimize the inherent volatility of the original methodology. In this context, Brasilprev
chose to occasionally use the constitution of Supplementary Coverage Provision to offset the insufficiency of technical provisions
indicated by the December 2014 Liability Adequacy Test.
On the occasion of the Liability Adequacy Test, dated as of June 2015, and due to the volatility of the forward yield curve, Brasilprev,
supported by Paragraphs 2 and 3 of article 8th
of SUSEP Rule 457/12, re-adopted the procedure which employs the unrealized gains of
guaranteeing assets on technical provisions held to maturity to offset a possible insufficiency identified by the Liability Adequacy Test.
In this context, based on the Liability Adequacy Test, dated as of June 2015, the balance of R$514.1 million of Supplementary Coverage
Provision was fully reversed, with a positive impact of R$294.1 million in Brasilprev’s net income, equivalent to a net effect of R$220.5
million in BB Seguridade’s net income.

BB Seguridade Participações S.A. | Management Discussion & Analysis 2Q16 9
BB MAPFRE SH1 | Life, Mortgage Life and Rural
Figure 5 – SH1 | Premiums written (R$ million) Figure 6 – SH1 | Adjusted net income and ROAE
1,553
2,175
1,542
1,867
2,094 2,098
1,497
2,097
3Q14 4Q14 1Q15 2Q15 3Q15 4Q15 1Q16 2Q16
288 287 277 287354
272 266317
75 80 115 95
104
129 113103
363 367392 382
457400 379
419
47.0 46.4 48.0 45.253.7
46.3 43.1 46.8
3Q14 4Q14 1Q15 2Q15 3Q15 4Q15 1Q16 2Q16
Net investment income¹ (R$ million)
Non-interest operating result¹ (R$ million)
Adjusted ROAE (%)
¹Net of income taxes considering the Company’s effective tax rate for the period
under analysis.
QUARTELY ANALYSIS
The net income from Life, Mortgage Life and Rural business segment reached R$419.4 million in the 2Q16, 9.9% down YoY. The earnings
before taxes and profit sharing amounted to R$693.2 million, 16.3% higher YoY, justified by the improvement in the non-interest
operating result and in the net investment income.
In the 2Q16, premiums written amounted to R$2.1 billion, 12.3% higher YoY, boosted by the growth in rural insurance premiums
(+119.2%), mainly in crop insurance, and in life (+9.3%), partially offset by the drop in credit life premiums (-37.7%).
The combined ratio improved 1.3 p.p. YoY to 68.5% in the 2Q16. Such improvement was explained by the lower loss ratio in the life
segment in addition to the lower G&A ratio, partially offset by the increase in the commission ratio.
YEAR-TO-DATE ANALYSIS
The net income from Life, Mortgage Life and Rural business segment totaled R$798.9 million year-to-date, 3.2% up YoY. The earnings before taxes and profit sharing grew by 10.2%, driven by the increase in the underwriting result along with the evolution of the net investment income.
Premiums written amounted to R$3.6 billion, 5.4% higher YoY, boosted mainly by rural (+95.7%) and life (+10.0%).
The combined ratio deteriorated 1.2 p.p. to 70.9% in the 1H16, due to the increased loss ratio in credit life and in rural, in addition to
the higher commission ratio.

BB Seguridade Participações S.A. | Management Discussion & Analysis 2Q16 10
MAPFRE BB SH2 | P&C
Figure 7 – SH2 | Premiums written (R$ million) Figure 8 – SH2 | Adjusted net income and ROAE
2,3632,203 2,121
2,325 2,4222,228 2,174
2,284
3Q14 4Q14 1Q15 2Q15 3Q15 4Q15 1Q16 2Q16
14-0.4
1 12-17 -17
-58
25
56 7298 89 116
136108
10171 71
99 10099
119
50126
9.5 9.312.6 12.4 11.8
13.8
5.8
13.9
3T14 4T14 1T15 2T15 3T15 4T15 1T16 2T16
Resultado financeiro¹ (R$ milhões)
Resultado operacional não decorrente de juros¹ (R$ milhões)
RSPL ajustado(%)
¹Net of income taxes considering the Company’s effective tax rate.
QUARTELY ANALYSIS
The net income from the P&C business segment amounted to R$125.8 million in the 2Q16, 25.6% up YoY. The performance is explained
by the 26.1% increase in the net investment income in addition to the 39.3% growth in the underwriting result, explained by the
improvement of 0.9 p.p. in the combined ratio, which was helped by the lower loss ratio as well as a lower commission ratio.
Premiums written amounted to R$2.3 billion in the 2Q16, 1.8% down YoY, dragged down by the auto insurance (-17.9%), partially offset
by the expansion of the casualty segment (+17.4%), concentrated in the independent broker channel.
YEAR-TO-DATE ANALYSIS
Year-to-date, the net income achieved R$176.3 million, 11.4% down YoY. The performance is explained by the 2.6 p.p. deterioration in
the combined ratio, due to worsen loss and commission ratios, partially offset by the better net investment income.
In the 1H16, premiums written grew by 0.3% YoY, supported by the sales from casualty and from the segment other. In auto, premiums
written dropped by 14.1% YoY.
BB Seguridade Participações S.A. | Management Discussion & Analysis 2Q16 11
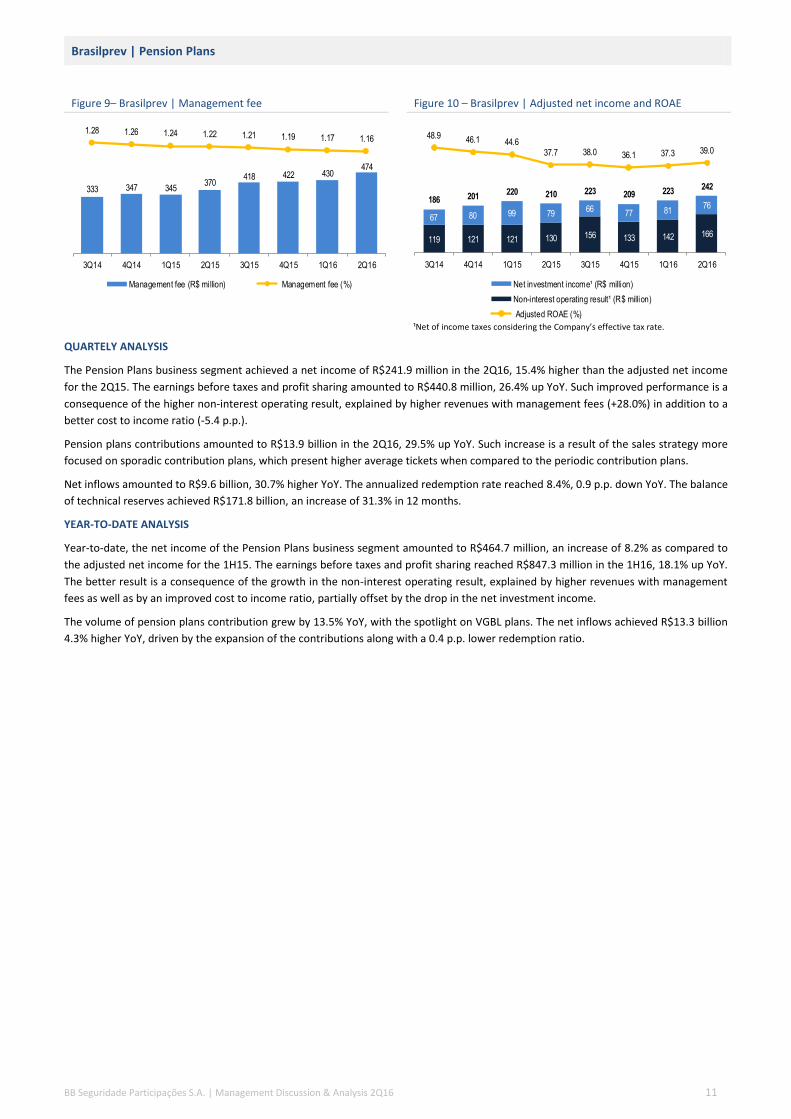
Brasilprev | Pension Plans
Figure 9– Brasilprev | Management fee Figure 10 – Brasilprev | Adjusted net income and ROAE
333 347 345370
418 422 430474
1.28 1.26 1.24 1.22 1.21 1.19 1.17 1.16
3Q14 4Q14 1Q15 2Q15 3Q15 4Q15 1Q16 2Q16
Management fee (R$ million) Management fee (%)
119 121 121 130 156 133 142 166
67 80 99 7966
77 8176
186 201220 210 223 209 223
242
48.9 46.1 44.637.7 38.0 36.1 37.3 39.0
3Q14 4Q14 1Q15 2Q15 3Q15 4Q15 1Q16 2Q16
Net investment income¹ (R$ million)
Non-interest operating result¹ (R$ million)
Adjusted ROAE (%) ¹Net of income taxes considering the Company’s effective tax rate.
QUARTELY ANALYSIS
The Pension Plans business segment achieved a net income of R$241.9 million in the 2Q16, 15.4% higher than the adjusted net income
for the 2Q15. The earnings before taxes and profit sharing amounted to R$440.8 million, 26.4% up YoY. Such improved performance is a
consequence of the higher non-interest operating result, explained by higher revenues with management fees (+28.0%) in addition to a
better cost to income ratio (-5.4 p.p.).
Pension plans contributions amounted to R$13.9 billion in the 2Q16, 29.5% up YoY. Such increase is a result of the sales strategy more
focused on sporadic contribution plans, which present higher average tickets when compared to the periodic contribution plans.
Net inflows amounted to R$9.6 billion, 30.7% higher YoY. The annualized redemption rate reached 8.4%, 0.9 p.p. down YoY. The balance
of technical reserves achieved R$171.8 billion, an increase of 31.3% in 12 months.
YEAR-TO-DATE ANALYSIS
Year-to-date, the net income of the Pension Plans business segment amounted to R$464.7 million, an increase of 8.2% as compared to
the adjusted net income for the 1H15. The earnings before taxes and profit sharing reached R$847.3 million in the 1H16, 18.1% up YoY.
The better result is a consequence of the growth in the non-interest operating result, explained by higher revenues with management
fees as well as by an improved cost to income ratio, partially offset by the drop in the net investment income.
The volume of pension plans contribution grew by 13.5% YoY, with the spotlight on VGBL plans. The net inflows achieved R$13.3 billion
4.3% higher YoY, driven by the expansion of the contributions along with a 0.4 p.p. lower redemption ratio.

BB Seguridade Participações S.A. | Management Discussion & Analysis 2Q16 12
Brasilcap | Premium Bonds
Figure 11 – Brasilcap | Collections (R$ million) Figure 12 – Brasilcap | Net income and ROAE
1,396
2,028
1,321
1,961
1,379
1,856
1,043
1,571
3Q14 4Q14 1Q15 2Q15 3Q15 4Q15 1Q16 2Q16
30 44 29 27 28 19 18 25
4454 75 69
4189
11778
74
98 10597
68
109
135
103
85.1102.3 102.6
88.865.4
109.7 123.0
84.1
3Q14 4Q14 1Q15 2Q15 3Q15 4Q15 1Q16 2Q16
Net investment income¹ (R$ million)
Non-interest operating results¹ (R$mill ion)
ROAE (%)
¹Net of income taxes considering the Company’s effective tax rate.
QUARTELY ANALYSIS
In the 2Q16, the net income for the Premium Bonds business segment reached R$102.6 million, 5.9% higher YoY. The earnings before
taxes and profit sharing was of R$189.2 million, 16.9% up YoY, boosted by the growth of 23.8% in the net investment income, as a result
of the wider spread.
The result with premium bonds remained flat as compared to the same period of 2015. The net revenues with premium bonds decreased 23.3%, due to the drop of 19.9% in premium bonds collection in addition to an increased average reserve quote, which was partially offset by the drop of 29.7% in the acquisition costs as well as by the 29.6% fall in the result with lottery expenses.
YEAR-TO-DATE ANALYSIS
Premium Bonds business segment reached a net income of R$237.7 million in the 1H16, 17.8% higher YoY. The earnings before taxes
and profit sharing achieved R$437.1 million, 29.8% higher YoY, explained by the growth of 48.3% in the net investment income, due to a
1.8 p.p. wider spread along with the higher average balance of interest earning assets.
Year-to-date, the result with premium bonds dropped by 15.7% as compared to the same period of 2015. The performance was a result
of the retraction of 24.9% in the net revenues with premium bonds, due to the 20.4% decrease in premium bonds collection along with
a higher average reserve quote. The contraction of the net revenues with premium bonds was partially offset by lower expenses with
acquisition costs (-31.3%) along with the drop in the result with lottery expenses (-23.5%).
BB Seguridade Participações S.A. | Management Discussion & Analysis 2Q16 13
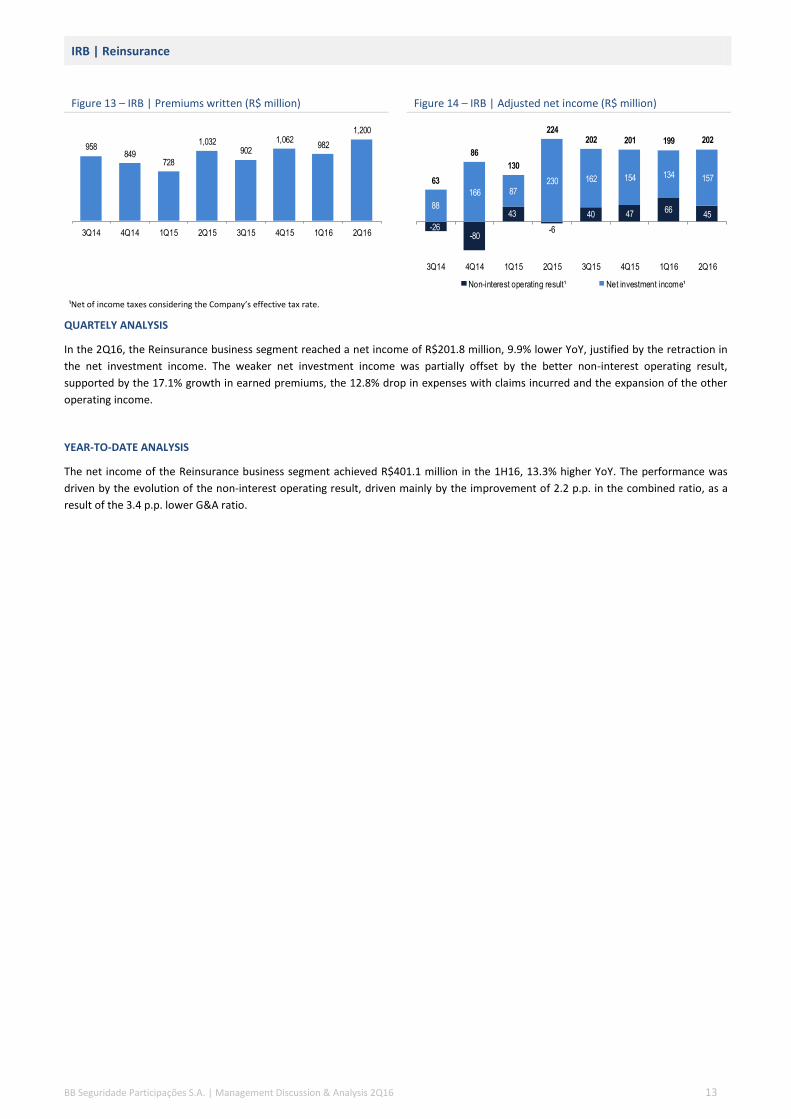
IRB | Reinsurance
Figure 13 – IRB | Premiums written (R$ million) Figure 14 – IRB | Adjusted net income (R$ million)
958849
728
1,032902
1,062982
1,200
3Q14 4Q14 1Q15 2Q15 3Q15 4Q15 1Q16 2Q16
-26-80
43
-6
40 4766
4588
166 87230 162 154 134 15763
86
130
224202 201 199 202
3Q14 4Q14 1Q15 2Q15 3Q15 4Q15 1Q16 2Q16
Non-interest operating result¹ Net investment income¹
¹Net of income taxes considering the Company’s effective tax rate.
QUARTELY ANALYSIS
In the 2Q16, the Reinsurance business segment reached a net income of R$201.8 million, 9.9% lower YoY, justified by the retraction in
the net investment income. The weaker net investment income was partially offset by the better non-interest operating result,
supported by the 17.1% growth in earned premiums, the 12.8% drop in expenses with claims incurred and the expansion of the other
operating income.
YEAR-TO-DATE ANALYSIS
The net income of the Reinsurance business segment achieved R$401.1 million in the 1H16, 13.3% higher YoY. The performance was
driven by the evolution of the non-interest operating result, driven mainly by the improvement of 2.2 p.p. in the combined ratio, as a
result of the 3.4 p.p. lower G&A ratio.

BB Seguridade Participações S.A. | Management Discussion & Analysis 2Q16 14
D I S T R I B U T I O N B U S I N E S S E S
BB Corretora | Brokerage
Figure 15 – BB Corretora | Brokerage revenues (R$ million) Figure 16 – BB Corretora | Adjusted net income and operating margin
563
648610
673619
658 632
728
3Q14 4Q14 1Q15 2Q15 3Q15 4Q15 1Q16 2Q16
319372 354
389 366399
371420
81.8 81.7 83.5 81.383.7 84.1 83.1
80.1
3Q14 4Q14 1Q15 2Q15 3Q15 4Q15 1Q16 2Q16
Adjusted net income (R$ million) Operating margin (%)
QUARTELY ANALYSIS
The net income for BB Corretora amounted to R$420.4 million in the 2Q16, 8.1% higher YoY, driven by:
(i) the growth of 8.3% in brokerage revenues, mainly the ones arising from the Life, Mortgage Life and Rural segment in addition
to the ones from Pension Plans; and
(ii) the increase of 26.4% in the net investment income, driven by a higher volume in addition to the higher return on financial
investments.
In the quarter, the EBIT margin fell by 1.2 p.p. YoY, impacted by the higher PIS/PASEP and COFINS tax rates since March 2016.
YEAR-TO-DATE ANALYSIS
Year-to-date, BB Corretora reported a net income of R$791.0 million, 6.4% higher YoY, explained by:
(i) the growth of 6.0% in brokerage revenues, boosted by revenues arising from Life, Mortgage Life and Rural segment in addition
to the ones from the Pension Plans segment; and
(ii) the increase of 31.1% in the net investment income, driven by the growth of both the volume and the average yield on interest
earning assets.
The EBIT margin achieved 81.5% in the 1H16, 0.9 p.p. down YoY, impacted by the higher PIS/PASEP and COFINS tax rates since March
2016.

BB Seguridade Participações S.A. | Management Discussion & Analysis 2Q16 15
G U I D A N C E 2 0 1 6
Year to date, BB Seguridade’s net income grew by 5.2% as compared to the same period of 2015. The performance of the second
quarter contributed significantly to the impressive acceleration of the net income growth pace, although it still remained below the
2016 guidance. The main reasons for the deviation are:
(i) the bases are not directly comparable as a consequence of the following changes in tax rules: (i) the increase of the income tax
rate, namely the social contribution (“CSLL"), which affected the results of BB Seguridade’s affiliate companies controlled by BB
MAPFRE SH1 and MAPFRE BB SH2, as well as Brasilprev, Brasilcap and IRB, from September 2015 on; (ii) the reinstatement, in
force since July 1st
, 2015, of the PIS/PASEP and COFINS tax rates on financial revenues earned by the holdings BB Seguridade
Participações, BB Seguros Participações, BB Cor Participações, BB MAPFRE SH1 Participações and MAPFRE BB SH2
Participações, which are subject to the non-cumulative system; (iii) the change of BB Corretora’s tax regime to the non-
cumulative system in March 2016, which led to a rise in the PIS/PASEP and COFINS tax rates on gross revenues;
(ii) the weaker than expected premiums of credit life insurance; and
(iii) the deterioration in the loss ratio in auto and casualty insurance.
Taking into account the increase in PIS/PASEP and COFINS tax rates on BB Corretora’s gross revenues and the likelihood of a reduction
in the base interest rate in the second half of 2016, factors that were not expected at the time the 2016 budget was built, along with an
uncertain environment for sales of credit life insurance, the Company has decided to revise its estimates for the growth in the adjusted
net income in 2016, as follows:
Table 4 – Estimates for 2016
R atioValues o bserved
1H 16
2016 P revio us
estimates
2016 R evised
estimates
BB Seguridade - Adjusted net income growth (%) 5.2 8.0 - 12.0 4.0 - 8.0
BB Seguridade Participações S.A. | Management Discussion & Analysis 2Q16 16
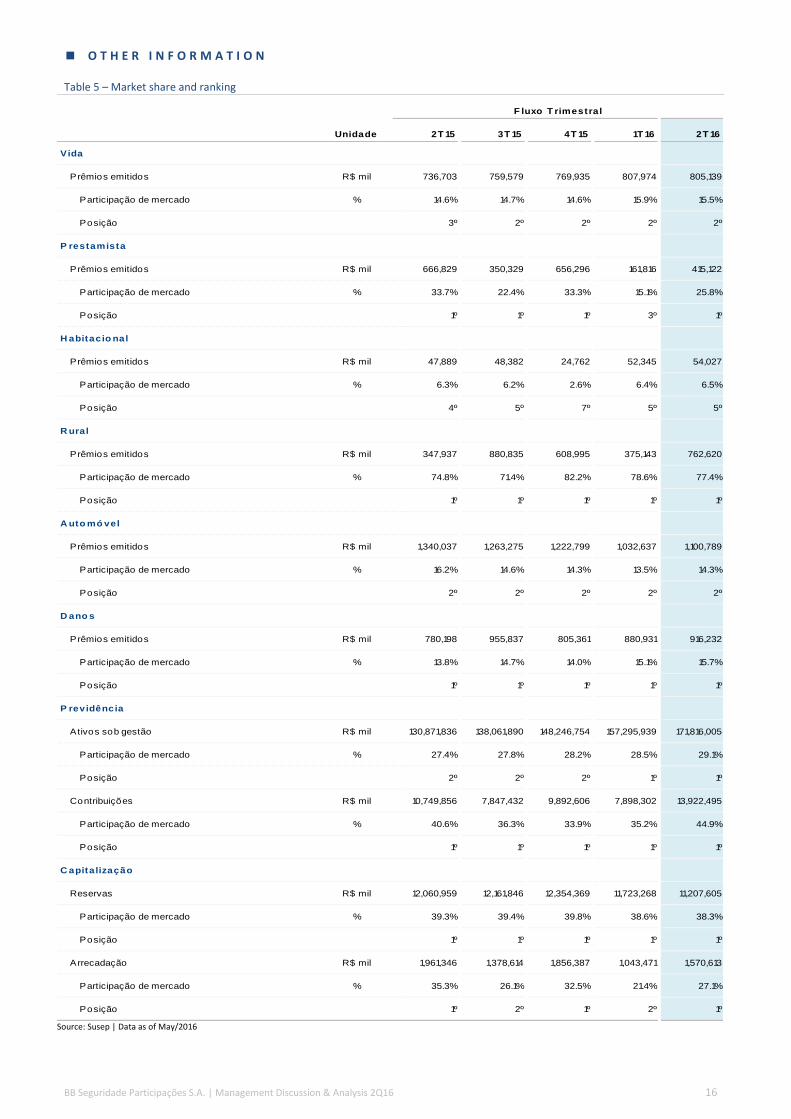
O T H E R I N F O R M A T I O N
Table 5 – Market share and ranking
Unidade 2T 15 3T 15 4T 15 1T 16 2T 16
Vida
Prêmios emitidos R$ mil 736,703 759,579 769,935 807,974 805,139
Participação de mercado % 14.6% 14.7% 14.6% 15.9% 15.5%
Posição 3º 2º 2º 2º 2º
P restamista
Prêmios emitidos R$ mil 666,829 350,329 656,296 161,816 415,122
Participação de mercado % 33.7% 22.4% 33.3% 15.1% 25.8%
Posição 1º 1º 1º 3º 1º
H abitacio nal
Prêmios emitidos R$ mil 47,889 48,382 24,762 52,345 54,027
Participação de mercado % 6.3% 6.2% 2.6% 6.4% 6.5%
Posição 4º 5º 7º 5º 5º
R ural
Prêmios emitidos R$ mil 347,937 880,835 608,995 375,143 762,620
Participação de mercado % 74.8% 71.4% 82.2% 78.6% 77.4%
Posição 1º 1º 1º 1º 1º
A uto mó vel
Prêmios emitidos R$ mil 1,340,037 1,263,275 1,222,799 1,032,637 1,100,789
Participação de mercado % 16.2% 14.6% 14.3% 13.5% 14.3%
Posição 2º 2º 2º 2º 2º
D ano s
Prêmios emitidos R$ mil 780,198 955,837 805,361 880,931 916,232
Participação de mercado % 13.8% 14.7% 14.0% 15.1% 15.7%
Posição 1º 1º 1º 1º 1º
P revidência
Ativos sob gestão R$ mil 130,871,836 138,061,890 148,246,754 157,295,939 171,816,005
Participação de mercado % 27.4% 27.8% 28.2% 28.5% 29.1%
Posição 2º 2º 2º 1º 1º
Contribuições R$ mil 10,749,856 7,847,432 9,892,606 7,898,302 13,922,495
Participação de mercado % 40.6% 36.3% 33.9% 35.2% 44.9%
Posição 1º 1º 1º 1º 1º
C apitalização
Reservas R$ mil 12,060,959 12,161,846 12,354,369 11,723,268 11,207,605
Participação de mercado % 39.3% 39.4% 39.8% 38.6% 38.3%
Posição 1º 1º 1º 1º 1º
Arrecadação R$ mil 1,961,346 1,378,614 1,856,387 1,043,471 1,570,613
Participação de mercado % 35.3% 26.1% 32.5% 21.4% 27.1%
Posição 1º 2º 1º 2º 1º
F luxo T rimestral
Source: Susep | Data as of May/2016
BB Seguridade Participações S.A. | Management Discussion & Analysis 2Q16 17
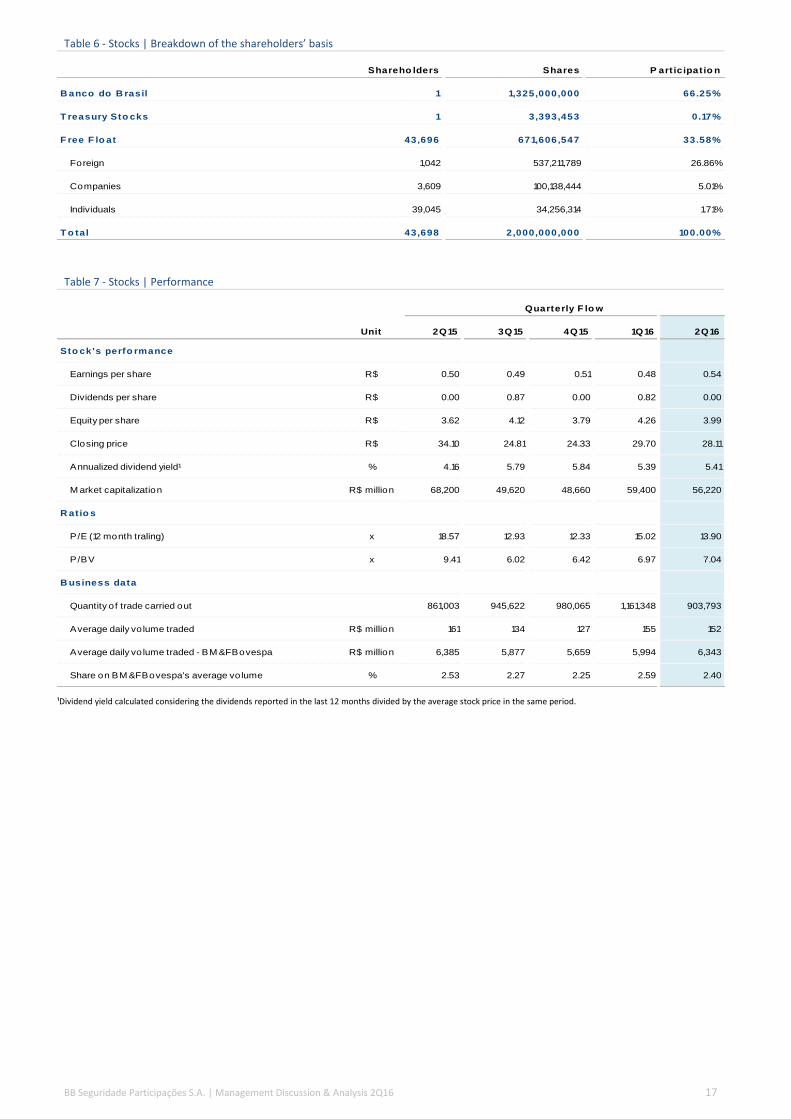
Table 6 - Stocks | Breakdown of the shareholders’ basis
Shareho lders Shares P art icipat io n
B anco do B rasil 1 1,325,000,000 66.25%
T reasury Sto cks 1 3,393,453 0.17%
F ree F lo at 43,696 671,606,547 33.58%
Foreign 1,042 537,211,789 26.86%
Companies 3,609 100,138,444 5.01%
Individuals 39,045 34,256,314 1.71%
T o tal 43,698 2,000,000,000 100.00%
Table 7 - Stocks | Performance
Unit 2Q15 3Q15 4Q15 1Q16 2Q16
Sto ck's perfo rmance
Earnings per share R$ 0.50 0.49 0.51 0.48 0.54
Dividends per share R$ 0.00 0.87 0.00 0.82 0.00
Equity per share R$ 3.62 4.12 3.79 4.26 3.99
Closing price R$ 34.10 24.81 24.33 29.70 28.11
Annualized dividend yield¹ % 4.16 5.79 5.84 5.39 5.41
M arket capitalization R$ million 68,200 49,620 48,660 59,400 56,220
R atio s
P/E (12 month traling) x 18.57 12.93 12.33 15.02 13.90
P/BV x 9.41 6.02 6.42 6.97 7.04
B usiness data
Quantity of trade carried out 861,003 945,622 980,065 1,161,348 903,793
Average daily vo lume traded R$ million 161 134 127 155 152
Average daily vo lume traded - BM &FBovespa R$ million 6,385 5,877 5,659 5,994 6,343
Share on BM &FBovespa's average volume % 2.53 2.27 2.25 2.59 2.40
Quarterly F lo w
¹Dividend yield calculated considering the dividends reported in the last 12 months divided by the average stock price in the same period.

BB Seguridade Participações S.A. | Management Discussion & Analysis 2Q16 18
2 . E A R N I N G S A N A L Y S I S
E A R N I N G S B R E A K D O W N
Figure 17 – Earnings Analysis | Breakdown¹
¹Does not consider the individual results from BB Seguridade, BB Seguros and BB Cor holdings, as well as the dental plans operation when negative.
N E T I N V E S T M E N T I N C O M E
Figure 18 – Earnings Analysis | Net investment income (R$ million)
QUARTERLY ANALYSIS
In the 2Q16, the net investment income of the holding BB Seguridade grew by 125.6% YoY, explained by the increase of 122.3% in the average balance of cash and cash equivalents, along with a higher average Selic rate.
YEAR-TO-DATE ANALYSIS
Year-to-date, the net investment income of the holding company rose 130.4% YoY, driven by the expansion of 91.2% in the cash average balance along with a higher average Selic rate.
38.5
40.6
37.0
39.1
36.2
38.8
37.9
38.6
32.9
30.0
30.7
28.8
33.9
29.2
29.1
28.9
16.9
16.4
17.2
15.8
16.5
15.2
17.1
16.6
6.0
7.1
7.3
6.5
4.5
7.0
9.2
6.3
4.3
3.9
5.2
5.0
4.9
5.8
2.6
5.8
1.5
1.9
2.7
4.7
4.1
4.0
4.2
3.8
0.04
0.06
0.07
0.06
3Q14
4Q14
1Q15
2Q15
3Q15
4Q15
1Q16
2Q16
Brokerage Life, Mortgage Life and Rural Pension Plans Premium Bonds Property and Casualty Reinsurance Dental Insurance Other
2 2
5 5 54
11 11
3Q14 4Q14 1Q15 2Q15 3Q15 4Q15 1Q16 2Q16

BB Seguridade Participações S.A. | Management Discussion & Analysis 2Q16 19
G E N E R A L A N D A D M I N I S T R A T I V E E X P E N S E S
Figure 19 – Earnings Analysis | General and administrative expenses (R$ million)
QUARTERLY ANALYSIS
In the 2Q16, the G&A expenses of the holding company rose by 11.1% YoY, due to:
(i) the growth of 32.5% in administrative expenses, mostly
due to the higher expenses with specialized technical
services and other administrative expenses; and
(ii) higher tax expenses, as a result of the re-establishment,
from July 2015 on, of the PIS/PASEP (0.65%) and COFINS
(4.00%) tax rates on financial revenues at the holding
level.
YEAR-TO-DATE ANALYSIS
In the 1H16, BB Seguridade’s G&A grew 40.8% YoY, explained by:
(i) higher tax expenses, as a result of the re-establishment, from July 2015 on, of the PIS/PASEP (0.65%) and COFINS (4.00%)
tax rates on financial revenues at the holding level, besides the IOF tax payments on withdrawals of short-term financial
investments for dividend payment;
(ii) higher personnel expenses, explained by the increase in headcount, besides the migration of part of BB Corretora’s staff
to BB Seguridade, as along with the employees collective bargaining agreement.
Table 8 – Earnings Analysis | General and administrative expenses
8
12 12 12
15
1920
13
3Q14 4Q14 1Q15 2Q15 3Q15 4Q15 1Q16 2Q16
C hg. %
R $ tho usand 2Q15 1Q16 2Q16 On 2Q15 On 1Q16 1H 15 1H 16 On 1H 15
A dministrat ive expenses (2,107) (2,139) (2,792) 32.5 30.5 (5,945) (4,931) (17.1)
Specialized technical services (349) (98) (713) 104.3 627.2 (2,399) (811) (66.2)
Condominium fee (703) (877) (912) 29.7 3.9 (1,360) (1,789) 31.6
Communication (308) (292) (375) 21.7 28.5 (515) (667) 29.4
Other administrative expenses (747) (872) (792) 6.1 (9.1) (2,001) (1,664) (16.8)
P erso nnel expenses (10,137) (11,898) (10,330) 1.9 (13.2) (17,802) (22,228) 24.9
Compensation (5,615) (6,847) (5,591) (0.4) (18.4) (9,923) (12,438) 25.3
Welfare benefits (3,103) (3,413) (3,072) (1.0) (10.0) (5,317) (6,485) 22.0
Other compensation (706) (795) (881) 24.7 10.8 (1,281) (1,676) 30.8
Benefits (713) (843) (786) 10.3 (6.7) (1,281) (1,629) 27.2
T ax expenses (12) (5,974) (503) 3,938.9 (91.6) (485) (6,477) 1,234.3
COFINS (9) (1,922) (420) 4,382.7 (78.1) (29) (2,342) 7,872.3
PIS/Pasep (2) (310) (68) 2,755.2 (78.1) (6) (378) 5,828.0
IOF - (3,741) (2) - (99.9) (448) (3,743) 735.4
Other (1) (1) (13) 1,781.9 2,168.9 (2) (14) 753.7
Other o perat ing inco me (expenses) 401 6 448 11.8 7,371.4 663 454 (31.5)
G&A expenses (11,855) (20,005) (13,176) 11.1 (34.1) (23,569) (33,181) 40.8
Quarterly F lo w C hg. % H alf -Yearly F lo w

BB Seguridade Participações S.A. | Management Discussion & Analysis 2Q16 20
A D J U S T E D N E T I N C O M E C O M P O S I T I O N
Figure 20 – Earnings Analysis | Non-interest operating results vs net investment income (R$ million)¹
Figure 21 – Earnings Analysis | Non-interest operating results vs net investment income (%)¹
¹Net of taxes considering the Companies effective tax rate.
Table 9 – Earnings Analysis | Non-interest operating results vs net investment income¹
C hg. %
R $ tho usand 2Q15 1Q16 2Q16 On 2Q15 On 1Q16 1H 15 1H 16 On 1H 15
N o n-interest o perat ing results 690,454 628,560 773,234 12.0 23.0 1,343,597 1,401,793 4 .3
Life, M ortgage Life and Rural 214,918 199,670 237,492 10.5 18.9 422,976 437,162 3.4
Property and Casualty 5,795 (28,930) 12,583 117.1 - 6,297 (16,347) -
Pension Plans 97,818 106,627 124,597 27.4 16.9 188,743 231,223 22.5
Premium Bonds 18,296 12,144 16,410 (10.3) 35.1 37,827 28,555 (24.5)
Reinsurance (362) 13,425 9,098 - (32.2) 7,522 22,522 199.4
Dental Insurance 375 559 576 53.5 3.0 109 1,135 937.5
Holdings and broker 353,615 325,064 372,478 5.3 14.6 680,122 697,542 2.6
N et investment inco me 304,191 329,125 313,480 3.1 (4.8) 600,163 642,605 7 .1
Life, M ortgage Life and Rural 71,231 84,866 77,036 8.1 (9.2) 157,307 161,902 2.9
Property and Casualty 44,275 54,178 50,300 13.6 (7.2) 93,184 104,478 12.1
Pension Plans 59,332 60,479 56,791 (4.3) (6.1) 133,449 117,270 (12.1)
Premium Bonds 46,293 77,895 51,993 12.3 (33.3) 96,619 129,888 34.4
Reinsurance 46,985 27,295 32,115 (31.6) 17.7 64,813 59,410 (8.3)
Dental Insurance 40 53 134 238.3 155.5 112 187 67.7
Holdings and broker 36,034 24,359 45,111 25.2 85.2 54,679 69,470 27.1
A djusted net inco me 994,645 957,684 1,086,714 9.3 13.5 1,943,760 2,044,398 5 .2
Quarterly F lo w C hg. % H alf -Yearly F lo w
¹Net of taxes considering the Companies effective tax rate.
621 645 653 690 720 657 629773
202261 296
304 268 357329
313822906
949995 988 1,014
958
1,087
3Q14 4Q14 1Q15 2Q15 3Q15 4Q15 1Q16 2Q16
Non-interest operating results Net investment income
75.5 71.2 68.8 69.4 72.964.8 65.6 71.2
24.5 28.8 31.2 30.6 27.135.2 34.4 28.8
3Q14 4Q14 1Q15 2Q15 3Q15 4Q15 1Q16 2Q16
Non-interest operating results Net investment income

BB Seguridade Participações S.A. | Management Discussion & Analysis 2Q16 21
N O N - I N T E R E S T O P E R A T I N G R E S U L T
QUARTERLY ANALYSIS
The combined non-interest operating results amounted to R$773.2 million in the 2Q16, 12.0% higher YoY, as a result of:
(i) the growth of R$36.6 million in the operating result at BB Corretora, due to higher brokerage revenues arising mainly from the
Life, Mortgage Life and Rural and Pension Plans business segments;
(ii) the expansion of R$26.8 million in the non-interest operating result arising from the Pension Plans business segment, explained
mainly by the increase in revenues with management fees, driven by the expansion in the average balance of assets under
management; and
(iii) the growth of R$22.6 million in the non-interest operating result arising from the Life, Mortgage Life and Rural business
segment, driven mainly by the higher volume of earned premiums along with an improved combined ratio.
YEAR-TO-DATE ANALYSIS
The combined non-interest operating results amounted to R$1.4 billion in the 1H16, 4.3% up YoY, driven mainly by:
(i) the expansion of R$52.0 million in the operating result at BB Corretora, due to higher brokerage revenues arising mainly from
the Life, Mortgage Life and Rural and Pension Plans segments;
(ii) the growth of R$42.5 million in the non-interest operating result arising from the Pension Plans business segment, mostly due
to the increase in revenues with management fees, as a result of the higher average balance of assets under management; and
(iii) the increase of R$14.2 million in the non-interest operating result arising from the Life, Mortgage Life and Rural business
segment, driven mainly by the higher volume of earned premiums.
The increase of the non-interest operating results arising from the segments above mentioned was partially offset by the drop of R$22.6
million in the non-interest operating results from the Property and Casualty business segment, due mainly to the deterioration in the
loss and commission ratios.
N E T I N V E S T M E N T I N C O M E
Figure 22 – Earnings Analysis | Average Selic rate (%) Figure 23 – Earnings Analysis | Forward yield curve (%)
Source: Bacen Source: ValorPro
QUARTERLY ANALYSIS
The combined net investment income of BB Seguridade and its controlled and affiliated companies amounted to R$313.5 million in
2Q16, 3.1% higher YoY. The improved performance was driven mainly by the growth observed in the Property and Casualty, Life,
Mortgage Life and Rural, and Premium Bonds business segments, along with BB Corretora.
The increase in the balance of interest earning assets, the higher average Selic rate and the downward shift in the forward yield curve,
which positively impacted the mark-to-market results of pre-fixed bonds, boosted the net investment income in the 2Q16. On the other
hand, the lower inflation had a negative impact on the return on inflation protected bonds classified as held to maturity.
YEAR-TO-DATE ANALYSIS
The combined net investment income of BB Seguridade and its controlled and affiliated companies totaled R$642.6 million year-to-date,
an increase of 7.1% YoY. The growth in the net investment income came mainly from the Premium Bonds and Property and Casualty
business segments, along with BB Corretora, and is explained by the growth in the average balance of interest earning assets, the higher
average Selic rate and the downward shift in the forward yield curve, which positively impacted the mark-to-market results of the pre-
fixed bonds.
10.90 11.2112.19
13.1413.99 14.15 14.15 14.15
3Q14 4Q14 1Q15 2Q15 3Q15 4Q15 1Q16 2Q16
13.39 13.23
13.13 12.99 12.97
13.95
13.27
12.9412.76 12.69
13.94
12.92
12.41 12.25
12.15
13.87
13.71 13.83 13.90 13.88
DI1F17 DI1F18 DI1F19 DI1F20 DI1F21
Mar/15
Mar/16
Jun/15
Jun/16
BB Seguridade Participações S.A. | Management Discussion & Analysis 2Q16 22
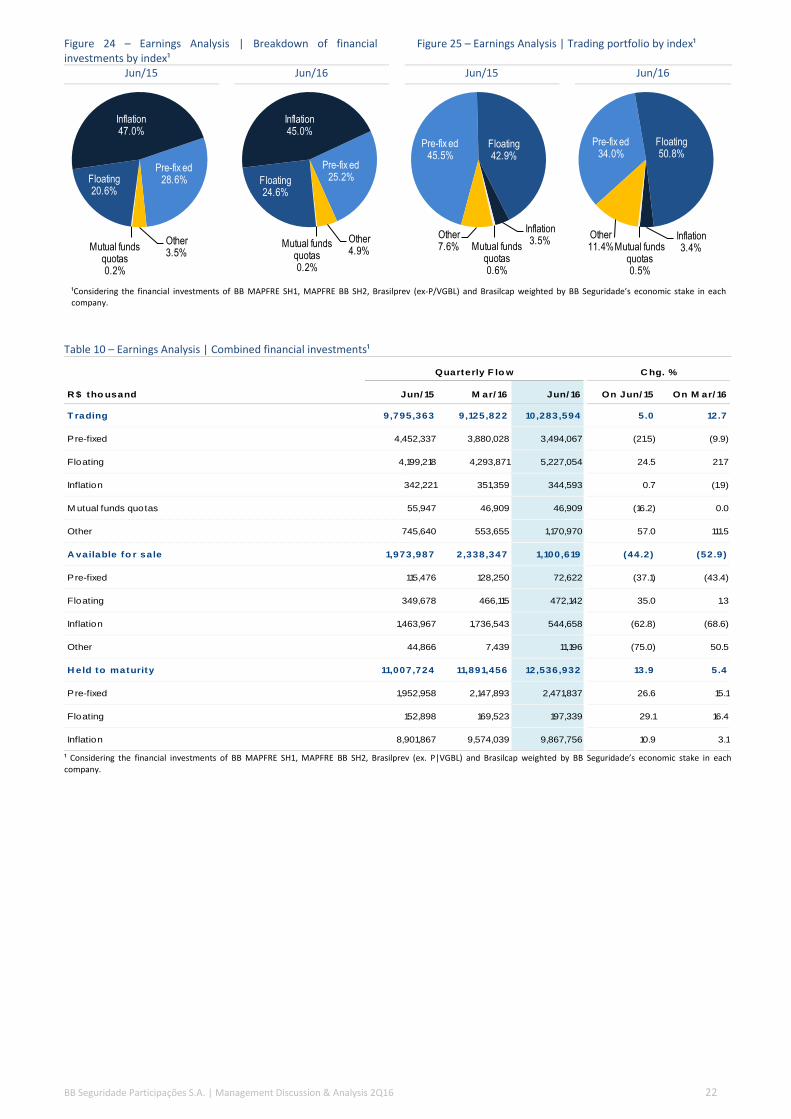
Figure 24 – Earnings Analysis | Breakdown of financial investments by index¹
Figure 25 – Earnings Analysis | Trading portfolio by index¹
Jun/15 Jun/16 Jun/15 Jun/16
¹Considering the financial investments of BB MAPFRE SH1, MAPFRE BB SH2, Brasilprev (ex-P/VGBL) and Brasilcap weighted by BB Seguridade’s economic stake in each company.
Table 10 – Earnings Analysis | Combined financial investments¹
¹ Considering the financial investments of BB MAPFRE SH1, MAPFRE BB SH2, Brasilprev (ex. P|VGBL) and Brasilcap weighted by BB Seguridade’s economic stake in each company.
Pre-fix ed28.6%
Other3.5%
Mutual funds quotas0.2%
Floating20.6%
Inflation47.0%
Pre-fix ed25.2%
Other4.9%
Mutual funds quotas0.2%
Floating24.6%
Inflation45.0%
Pre-fix ed45.5%
Floating42.9%
Inflation3.5%
Mutual funds quotas0.6%
Other7.6%
Pre-fix ed34.0%
Floating50.8%
Inflation3.4%Mutual funds
quotas0.5%
Other11.4%
R $ tho usand Jun/ 15 M ar/ 16 Jun/ 16 On Jun/ 15 On M ar/ 16
T rading 9,795,363 9,125,822 10,283,594 5.0 12.7
Pre-fixed 4,452,337 3,880,028 3,494,067 (21.5) (9.9)
Floating 4,199,218 4,293,871 5,227,054 24.5 21.7
Inflation 342,221 351,359 344,593 0.7 (1.9)
M utual funds quotas 55,947 46,909 46,909 (16.2) 0.0
Other 745,640 553,655 1,170,970 57.0 111.5
A vailable fo r sale 1,973,987 2,338,347 1,100,619 (44.2) (52.9)
Pre-fixed 115,476 128,250 72,622 (37.1) (43.4)
Floating 349,678 466,115 472,142 35.0 1.3
Inflation 1,463,967 1,736,543 544,658 (62.8) (68.6)
Other 44,866 7,439 11,196 (75.0) 50.5
H eld to maturity 11,007,724 11,891,456 12,536,932 13.9 5.4
Pre-fixed 1,952,958 2,147,893 2,471,837 26.6 15.1
Floating 152,898 169,523 197,339 29.1 16.4
Inflation 8,901,867 9,574,039 9,867,756 10.9 3.1
Quarterly F lo w C hg. %

BB Seguridade Participações S.A. | Management Discussion & Analysis 2Q16 23
3 . B A L A N C E S H E E T A N A L Y S I S
Table 11 – Balance Sheet Analysis |Balance sheet
C A S H A N D C A S H E Q U I V A L E N T S
By the end of June 2016, the balance of cash and cash equivalents reached R$297.3 million, 128.0% up YoY. The balance of cash and
cash equivalents is mainly composed of repos.
I N V E S T M E N T S
Table 12 – Balance Sheet Analysis |Direct investments
Note: (1) Controlled companies, fully consolidated
R $ tho usand Jun/ 15 M ar/ 16 Jun/ 16 On Jun/ 15 On M ar/ 16
A ssets 8,981,254 8,533,876 9,628,779 7.2 12.8
Cash and cash equivalents 130,381 303,095 297,315 128.0 (1.9)
Investments 7,096,937 8,192,062 7,739,443 9.1 (5.5)
Current tax assets 20,782 38,715 39,163 88.4 1.2
Dividends receivable 1,733,150 - 1,550,209 (10.6) -
Other assets 4 4 2,649 66,125.0 66,125.0
Liabilit ies 1,736,879 7,487 1,642,798 (5.4) 21,842.0
Dividends payable 1,731,444 5 1,635,524 (5.5) -
Current tax liabilities 9 483 191 2,023.0 (60.4)
Other liabilities 5,426 6,999 7,083 30.5 1.2
Shareho lders' equity 7,244,375 8,526,389 7,985,981 10.2 (6.3)
B alance C hg. %
T o tal
o wnership (%)
R $ tho usand Jun/ 16 Jun/ 15 M ar/ 16 Jun/ 16
Insurance, P ensio n P lans and
P remium B o nds
BB Seguros Participações Holding (1) 100.0 7,035,170 7,759,793 7,677,702
Insurance B ro kerage -
BB Cor Participações Holding (1) 100.0 61,767 432,269 61,741
A cco unting
treatmentA ctivity
Investment balance

BB Seguridade Participações S.A. | Management Discussion & Analysis 2Q16 24
Table 13 – Balance Sheet Analysis |BB Seguros Participações’ investments
Note: (1) Affiliated companies, booked by the equity method
Table 14 – Balance Sheet Analysis |BB Cor Participações’ investments
Note: (1) Controlled companies, fully consolidated
T o tal
o wnership (%)
R $ tho usand Jun/ 16 Jun/ 15 M ar/ 16 Jun/ 16
Insurance
B B M A P F R E SH 1 P art icipaçõ es S.A . H o lding (1) 75.0 2,946,875 2,802,045 3,121,739
Companhia de Seguros Aliança do Brasil Insurance - - -
M APFRE Vida S.A. Insurance - - -
M A P F R E B B SH 2 P art icipaçõ es S.A . H o lding (1) 50.0 2,105,911 2,208,269 2,325,815
Aliança do Brasil Seguros S.A. Insurance - - -
Brasilveículos Companhia de Seguros Insurance - - -
M APFRE Seguros Gerais S.A. Insurance - - -
BB M APFRE Assistência S.A. Insurance - - -
P ensio n P lans - - -
B rasilprev Seguro s e P revidênciaInsurance/
P ensio n P lans(1) 75.0 1,833,477 1,745,096 1,927,155
H ealth - - -
B rasildental Operado ra de P lano s
Odo nto ló gico s S.AH ealth (1) 75.0 1,954 5,520 6,231
P remium B o nds - - -
B rasilcap C apitalização P remium B o nds (1) 66.7 433,839 402,059 470,462
R einsurance - - -
IR B R einsurance (1) 20.4 626,849 596,368 626,384
A ctivity
A cco unting
treatment
Investment balance
T o tal
o wnership (%)
R $ tho usand Jun/ 16 Jun/ 15 M ar/ 16 Jun/ 16
Insurance bro kerage
B B C o rreto ra de Seguro s e A dm. de
B ens
Insurance
B ro ker(1) 100.0 35,001 405,483 34,976
A ctivityA cco unting
treatment
Investment balance

BB Seguridade Participações S.A. | Management Discussion & Analysis 2Q16 25
Figure 26 – Balance Sheet Analysis | Ownership structure at 06/30/2016


BB Seguridade Participações S.A. | Management Discussion & Analysis 2Q16 27
S H A R E H O L D E R ’ S E Q U I T Y
Shareholder’s equity amounted to R$8.0 billion in June 2016,10.2% higher YoY.
The paid-in capital, which amounts to R$5.6 billion, is divided into 2.0 billion common shares, without par value. The shareholders’
equity of R$8.0 billion is equivalent to a book value of R$3.99 per share.
Table 15 – Balance Sheet Analysis | Statement of changes in equity
Capital
Capital
reserve
Legal and
statutory
reserve
Treasury
stock
Retained
earnings
(losses)
Accumulate
d other
comprehensi
ve income Total
B alance o n D ecember 31, 2014 5,646,768 266 2,290,014 (266) - (12,798) 7,923,984
Transactions with stock payments - 446 - (446) - - -
Additional dividends in 2H14 - - (1,103,927) - - - (1,103,927)
Capital reserve - - 432,859 - (432,859) - -
Additional dividends proposed in 1H15 - - - - (1,731,440) - (1,731,440)
Other comprehensive income - - - - - (8,541) (8,541)
Net income for the period - - - - 2,164,299 - 2,164,299
B alance o n June 30, 2015 5,646,768 712 1,618,946 (712) - (21,339) 7,244,375
Changes in the Period - 446 (671,068) (446) - (8,541) (679,609)
B alance o n D ecember 31, 2015 5,646,768 712 2,027,573 (48,961) - (45,324) 7,580,768
Transactions with stock payments - 292 - (292) - - -
Share buyback program - - - (33,953) - - (33,953)
Capital reserve - - 408,880 - (408,880) - -
Additional dividends proposed in 1H16 - - - - (1,635,518) - (1,635,518)
Other comprehensive income - - - - - 30,286 30,286
Net income for the period - - - - 2,044,398 - 2,044,398
B alance o n M arch 31, 2016 5,646,768 1,004 2,436,453 (83,206) - (15,038) 7,985,981
C hanges in the P erio d - 292 408,880 (34,245) - 30,286 405,213

BB Seguridade Participações S.A. | Management Discussion & Analysis 2Q16 28
4 . U N D E R W R I T I N G A N D A C C U M U L A T I O N
L I F E , M O R T G A G E L I F E A N D R U R A L
BB Seguridade offers life, mortgage life and rural insurance through its affiliate company BB Mapfre SH1. This company was established
by a 20-year term partnership with Mapfre in 2010, and the joint operations began in 2011. BB Seguridade holds, through BB Seguros, a
74.99% economic stake in BB Mapfre SH1, composed of 100% of the preferred shares and 49.99% of the common shares. The segments
in which BB Mapfre SH1 operates is dominated by the Brazilian banks, what reflects the association of this kind of products with the
bancassurance channel.
The following topics show a brief description of the main products offered by BB Mapfre SH1:
a. Life insurance is a product focused on individuals which assures financial protection to the beneficiaries, chosen by the
policyholder, in case of death (natural or accidental), or permanent disability of the insured. If a claim occurs, the insurance
company pays the amount agreed in the insurance policy to the beneficiary. Differently from the products sold in other countries,
the life insurance sold by BB Mapfre SH1 is a term life insurance without accumulation. If the customer fails to make the monthly
payments, the coverage is suspended without any amount being reverted to the policyholder.
b. Credit life insurance is a life insurance policy intended to pay off a borrower’s loan in case of death or permanent disability of the
insured. This type of product is designed to protect both the lender and the insured dependents, preventing them to inherit this
liability. This product is already quite widespread in Brazil and it is expected to grow with the expansion of the loan portfolio. The
main beneficiary of this type of product is the lender.
c. Mortgage life insurance is an insurance policy intended to pay off a mortgage in case of death or disability of the insured. The
insurance policy gives the guarantee that his family will keep the property and the bank will receive the full payment of the
mortgage debt. A mortgage life insurance also protects against physical damage to the insured property. The premium is calculated
on a monthly basis and varies according to the outstanding loan balance and the borrower’s age.
d. Rural insurance encompasses a group of three main products: (i) the crop insurance, which protects the farmers from weather
hazards and falling prices of the crop; (ii) the rural lien insurance, which protects the asset given as collateral for a rural loan; and
(iii) the rural producer credit life insurance, which is an insurance designed for farmers intended to pay off the rural loan in case of
death of the insured.
A U T O , P R O P E R T Y A N D C A S U A L T I E S
BB Seguridade offers auto, property and casualties insurance through its affiliate Mapfre BB SH2. This company was established by a 20-
year term partnership with Mapfre Brasil signed in 2010, and the joint operations began in 2011. In this partnership BB Seguridade
holds a 50.00% economic stake in Mapfre BB SH2, being 51.0% of the preferred shares and 49.0% of the common shares.
In this segment, the insurance policies for large risks and auto require a more customized assistance and selling process, which result in
a higher concentration of sales in independent brokers than in the bancassurance channel.
The following paragraphs show a brief description of the main products offered by Mapfre BB SH2:
a. Property insurance is a type of insurance sold to individuals or companies that provides protection against risks to properties,
linked or not to loans. The main products of this segment are: home insurance (covers the risks related to a private residence),
business insurance (covers the risks related to a property that belongs to a company) and insurance for machinery and equipment
(protection to a property that belongs either to individuals or companies).
b. Auto insurance is an insurance policy designed to provide protection for vehicles, of commercial or particular use, against theft,
physical damage and/or bodily injury resulting from traffic collisions, besides other assistances provided to the policy holder. The
auto insurance market is dynamic and competitive, what benefit the client to shop around for the best price before closing the
deal. Besides that, the renewal of this kind of policies occur on an yearly basis, what makes easier for the competitors to go after
the clients and makes it difficult to establish and strengthen a long term relationship with costumers, unlike other segments.
c. DPVAT is a mandatory insurance in Brazil that covers personal injury caused by vehicles to passengers, drivers or pedestrians.
DPVAT offers coverage for three natures of damage: death, permanent disability, and reimbursement for medical and hospital
expenses. DPVAT is funded by vehicles owners through annual payments. Out of the amount collected, 45% is transferred to the
Ministry of Health (SUS), to fund the hospital care victims of traffic accidents across the country, and 5% are transferred to the
Ministry of Cities, for exclusive use in programs directed to the prevention of traffic accidents. The remaining 50% are directed to
the payment of claims.

BB Seguridade Participações S.A. | Management Discussion & Analysis 2Q16 29
P E N S I O N P L A N S
BB Seguridade operates in the private pension plans segment through its affiliate Brasilprev, in partnership with the American company
Principal Financial Group (PFG). Brasilprev was established in 1993 as a partnership between Banco do Brasil and a group of insurance
companies. After going through a series of corporate restructuring, within 1999-2000, PFG, through its subsidiary in Brazil, Principal
Financial Group do Brasil, acquired an economic stake in the company and established a partnership with Banco do Brasil. In 2010, BB
Seguros and PFG renewed their partnership, extending it for 23 years more. As a result of this new agreement, Banco do Brasil
increased its stake in Brasilprev from 49.99% to 74.99%. Pension plans are growing in popularity in Brazil, due to increasing life
expectancy, level of financial education and tax benefits for individuals.
Brasilprev has three main sources of revenue: the load fee, charged on contributions and redemptions, the management fees on assets
under management, and the premiums paid to cover risks.
Nowadays, there are three types of private pension plans in Brazil: Free Benefit Generator Plan (PGBL), Free Benefit Generator Life Plan
(VGBL), and traditional plans, which are no longer sold. The private pension plans in Brazil are described as follows:
a. Free Benefit Generator Plan (PGBL): is recommended for people who declare income taxes in the complete form, as the
contributions are tax deductible up to the limit of 12% of the annual gross taxable income. In this modality, in case of redemption
or benefit received, the income taxes are calculated on the amount redeemed or income received.
In Brazil, there are two alternatives for an individual to present the tax statements, the simple form or the complete form. In the
complete form, a Brazilian citizen can inform not only the income but also deductible expenses, such as expenses with health
insurance, education, investments in PGBL, and other.
In addition, the participant may choose to be taxed either in the progressive tax system or in the regressive tax system when buying
a pension plan.
In the progressive tax system, the annuity is taxed when money is received according to the “Tabela Progressiva Mensal” (Montlhy
Progressive Table) made available by the Brazilian Internal Revenue Service. The tax brackets can vary from zero to 27.5% according
to the annual wages with adjustment in the income tax declaration. Redemptions are taxed at 15% regardless the amount
redeemed, with adjustment in the income tax declaration according to the Monthly Progressive Table.
In the regressive tax system, in the event of redemption or annuity received, tax is withheld and is definitive, with no possibility of
adjustment in the annual tax statement. The rates are determined by the length of stay of each inflow in the plan, starting at 35%,
with gradual reduction every two years, reaching a level of 10% after 10 years.
b. Free Benefit Generator Life Plan (VGBL): is recommended for those who declare income taxes in the simplified form or is
exempt, since the contributions are not tax deductible. As in PGBL, the customer can choose either the progressive or the
regressive tax system. In this modality, the tax benefit is that in case of redemption or annuity received, income tax will be
charged on interest earned only. Another advantage of the VGBL is its simplicity of the procedure for the inheritance
transmission, being suitable for customers who wish to make a succession planning. In this product, the customer can
determine who will be the beneficiaries after his death and, unlike other assets, funds invested in VGBL are not part of the
inventory, which is a procedure with legal costs and attorney's fees that can consume from 6% to 20% of the wealth received
by the heirs.
c. Traditional Plan: guarantees a fixed interest of 6% plus inflation (IGP-M) or Taxa Referencial (TR) per year. These plans are no
longer sold and account for R$9.0 billion of the assets under management of Brasilprev.
P R E M I U M B O N D S
BB Seguridade offers premium bonds through its affiliate company Brasilcap, in a partnership with Icatu and Aliança da Bahia. Premium
bonds are very peculiar to the Brazilian market, but there are also quite similar products in United Kingdom and in Spain.
Premium bonds are mainly sold through the bancassurance channel and it is an alternative way to accumulate reserves, with term and
interest rate previously determined, entitling the bondholder to participate in lotteries. Premiums are distributed through periodic
draws, being most frequent the usage of a combination of numbers in pre-determined series, based on the Brazilian Official Lottery.
Depending on the type of premium bond and the payment method chosen, the load fee and lottery quotas can exceed 10% of the
amount collected. The amount intended to cover lottery, administrative expenses, and operational and acquisition costs are covered by
these quotas.
In case of early redemption, the bondholder must obey a grace period (12 months in most products). Beyond the grace period, penalties
will be applied if the bondholder decides for early redemption, which will decrease as the bond approaches to maturity.

BB Seguridade Participações S.A. | Management Discussion & Analysis 2Q16 30
R E I N S U R A N C E
The reinsurance industry in Brazil has been growing substantially since the market became opened in April 2008. With the approval of
the Complementary Law No. 126/2007, the state monopoly over reinsurance ceased to exist and a 40% market reserve for reinsurers
based in Brazil became effective in March 2011.
In some cases, due to contract or regulation, reinsurance becomes mandatory, and according to SUSEP data, the main risks covered
today are P&C, financial, rural and transportation.
BB Seguridade operates in the reinsurance industry through IRB-Brasil Resseguros S.A.. Founded in 1939, IRB used to have a monopoly
over reinsurance in Brazil until 2007.
In 2013, BB Seguridade, through its subsidiary BB Seguros Participações acquired a stake in IRB, entering the Brazilian reinsurance
market. After that, IRB went through a process of privatization and capital increase. At the end of this process, BB Seguros became the
holder of 20.51% of IRB’s total economics, and became part of its control block, together with the Brazilian Federal Government,
Bradesco Auto Re, Itaú Seguros, Itaú Vida e Previdência and Fundo de Investimentos em Participações Caixa Barcelona.
On December 29th
, 2014, it was approved in Extraordinary General Meeting, the amendment of IRB’s Bylaws to change the number of
stocks from 1.035.663 to 1.040.000, in order to include 4.337 treasury stocks. Therefore, the BB Seguro’s stake in IRB was changed from
20.51% to 20.43%.
The income statement, financial information, balance sheet and performance ratios on BB Seguridade’s affiliates presented in this report, are influenced by the investor company accounting entries, e.g., changes in goodwill. Therefore, the statements are not necessarily reconcilable with those published by the Companies.

BB Seguridade Participações S.A. | Management Discussion & Analysis 2Q16 31
4 . 1 L I F E , M O R T G A G E L I F E A N D R U R A L
E A R N I N G S A N A L Y S I S
Table 16 – Life, Mortgage Life and Rural |Income statement
C hg. %
R $ tho usand 2Q15 1Q16 2Q16 On 2Q15 On 1Q16 1H 15 1H 16 On 1H 15
P remiums writ ten 1,866,794 1,496,845 2,096,620 12.3 40.1 3,408,878 3,593,465 5.4
Changes in technical reserves - premiums (268,315) 361,891 (216,618) (19.3) - (225,870) 145,273 -
Earned premiuns 1,598,479 1,858,736 1,880,002 17.6 1.1 3,183,008 3,738,738 17.5
Revenue of po licies issuance 2,907 6,049 3,372 16.0 (44.2) 6,662 9,421 41.4
Claims incurred (531,331) (877,276) (874,922) 64.7 (0.3) (1,284,000) (1,752,198) 36.5
Acquisition costs (399,235) (449,869) (469,817) 17.7 4.4 (787,152) (919,686) 16.8
Result with reinsurance (28,291) 141,843 154,573 - 9.0 124,027 296,416 139.0
Administrative expenses (69,077) (93,118) (88,936) 28.7 (4.5) (143,590) (182,054) 26.8
Tax expenses (51,236) (62,762) (57,157) 11.6 (8.9) (102,613) (119,919) 16.9
Other operating income (expenses) (65,541) (64,085) (18,665) (71.5) (70.9) (95,080) (82,750) (13.0)
Underwrit ing result 456,675 459,518 528,452 15.7 15.0 901,262 987,970 9.6
N et investment inco me 146,979 190,477 168,258 14.5 (11.7) 325,206 358,735 10.3
Financial income 187,915 245,606 235,084 25.1 (4.3) 404,263 480,690 18.9
Financial expenses (40,936) (55,129) (66,826) 63.2 21.2 (79,057) (121,955) 54.3
Equity income (7,526) (7,740) (7,729) 2.7 (0.1) (15,170) (15,469) 2.0
Operat ing result 596,128 642,255 688,979 15.6 7.3 1,211,298 1,331,234 9.9
Gains or losses on non-current assets (4) (187) 4,186 - - 3 3,999 133,209.2
Earnings befo re taxes and pro f it
sharing596,124 642,068 693,165 16.3 8.0 1,211,301 1,335,233 10.2
Taxes (210,869) (260,592) (269,959) 28.0 3.6 (429,853) (530,551) 23.4
Profit sharing (3,673) (2,043) (3,781) 2.9 85.0 (7,635) (5,824) (23.7)
N et inco me 381,582 379,433 419,425 9.9 10.5 773,812 798,857 3.2
Quarterly F lo w C hg. % H alf -Yearly F lo w

BB Seguridade Participações S.A. | Management Discussion & Analysis 2Q16 32
To provide a better analysis, the following table shows a managerial view built considering the reallocation of the result with
reinsurance to the other accounts that compose the Income Statement. This reallocation allows the analysis of the performance ratios
already considering the reinsurance effects.
Table 17 – Life, Mortgage Life and Rural | Managerial income statement
Retained premiums = Premiums written + premiums ceded to reinsurance Changes in technical provisions = Changes in technical provisions + changes in technical provisions on reinsured operations Retained claims = Claims incurred + recovery of indemnity claims + recovery of claims expenses + changes in provisions for claims IBNR + salvages and reimbursed assets + changes in provision for claims IBNER provisions for claims to be settled + changes of expenses related to IBNR + changes in estimates for salvages and reimbursed assets + provisions for claims to be settled
C hg. %
R $ tho usand 2Q15 1Q16 2Q16 On 2Q15 On 1Q16 1H 15 1H 16 On 1H 15
P remiums writ ten 1,866,794 1,496,845 2,096,620 12.3 40.1 3,408,878 3,593,465 5.4
Premiums ceded to reinsurance (33,491) (113,056) (285,166) 751.5 152.2 (94,362) (398,222) 322.0
R etained premiums 1,833,303 1,383,788 1,811,454 (1.2) 30.9 3,314,516 3,195,243 (3.6)
Changes in technical reserves - premiums (323,391) 326,934 (132,319) (59.1) - (339,342) 194,616 -
R etained earned premiuns 1,509,912 1,710,722 1,679,136 11.2 (1.8) 2,975,174 3,389,858 13.9
Revenue of po licies issuance 2,907 6,049 3,372 16.0 (44.2) 6,662 9,421 41.4
Claims retained (471,054) (587,419) (519,480) 10.3 (11.6) (952,138) (1,106,899) 16.3
Acquisition costs (399,235) (449,869) (469,817) 17.7 4.4 (787,152) (919,686) 16.8
Administrative expenses (69,077) (93,118) (88,936) 28.7 (4.5) (143,590) (182,054) 26.8
Tax expenses (51,236) (62,762) (57,157) 11.6 (8.9) (102,613) (119,919) 16.9
Other operating income (expenses) (65,541) (64,085) (18,665) (71.5) (70.9) (95,080) (82,750) (13.0)
Underwrit ing result 456,676 459,518 528,451 15.7 15.0 901,263 987,968 9.6
N et investment inco me 146,979 190,477 168,258 14.5 (11.7) 325,206 358,735 10.3
Financial income 187,915 245,606 235,084 25.1 (4.3) 404,263 480,690 18.9
Financial expenses (40,936) (55,129) (66,826) 63.2 21.2 (79,057) (121,955) 54.3
Equity income (7,526) (7,740) (7,729) 2.7 (0.1) (15,170) (15,469) 2.0
Operat ing result 596,129 642,255 688,979 15.6 7.3 1,211,299 1,331,234 9.9
Gains or losses on non-current assets (4) (187) 4,186 - - 3 3,999 133,209.2
Earnings befo re taxes and pro f it
sharing596,125 642,068 693,165 16.3 8.0 1,211,302 1,335,233 10.2
Taxes (210,869) (260,592) (269,959) 28.0 3.6 (429,853) (530,551) 23.4
Profit sharing (3,673) (2,043) (3,781) 2.9 85.0 (7,635) (5,824) (23.7)
A djusted net inco me 381,583 379,433 419,425 9.9 10.5 773,814 798,858 3.2
Quarterly F lo w C hg. % H alf -Yearly F lo w
BB Seguridade Participações S.A. | Management Discussion & Analysis 2Q16 33
A D J U S T E D N E T I N C O M E
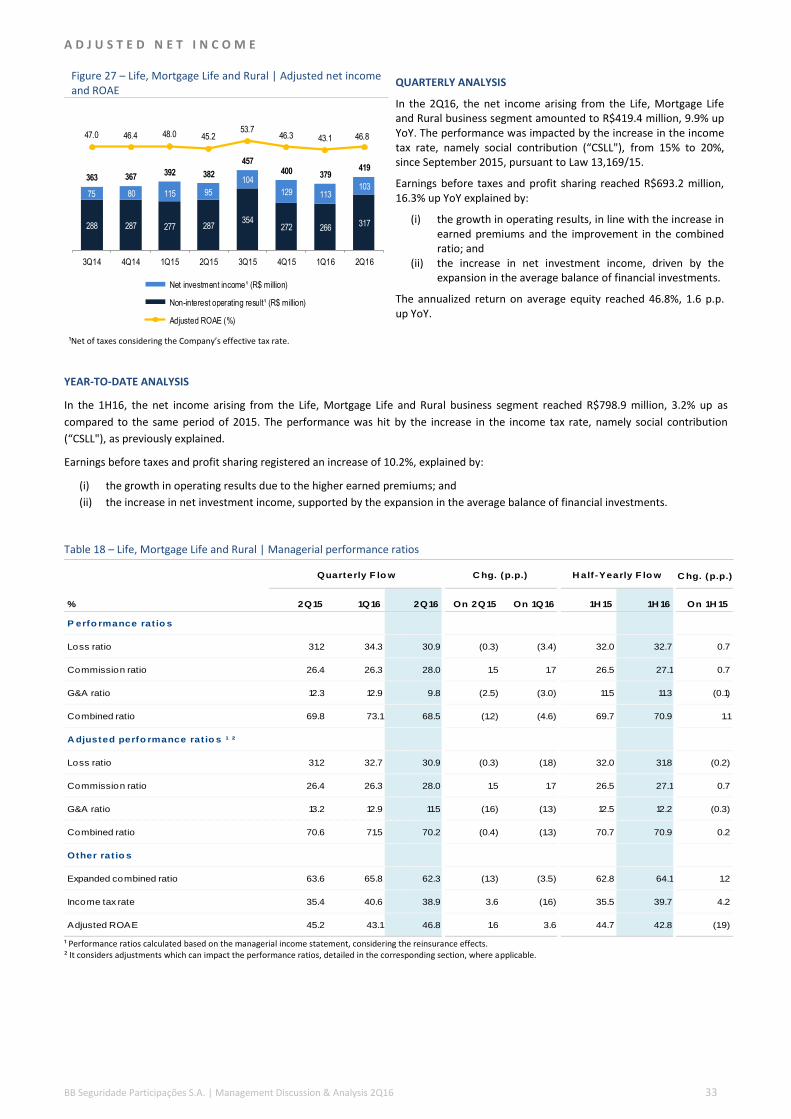
Figure 27 – Life, Mortgage Life and Rural | Adjusted net income and ROAE
QUARTERLY ANALYSIS
In the 2Q16, the net income arising from the Life, Mortgage Life and Rural business segment amounted to R$419.4 million, 9.9% up YoY. The performance was impacted by the increase in the income tax rate, namely social contribution (“CSLL"), from 15% to 20%, since September 2015, pursuant to Law 13,169/15.
Earnings before taxes and profit sharing reached R$693.2 million, 16.3% up YoY explained by:
(i) the growth in operating results, in line with the increase in earned premiums and the improvement in the combined ratio; and
(ii) the increase in net investment income, driven by the expansion in the average balance of financial investments.
The annualized return on average equity reached 46.8%, 1.6 p.p. up YoY.
¹Net of taxes considering the Company’s effective tax rate.
YEAR-TO-DATE ANALYSIS
In the 1H16, the net income arising from the Life, Mortgage Life and Rural business segment reached R$798.9 million, 3.2% up as
compared to the same period of 2015. The performance was hit by the increase in the income tax rate, namely social contribution
(“CSLL"), as previously explained.
Earnings before taxes and profit sharing registered an increase of 10.2%, explained by:
(i) the growth in operating results due to the higher earned premiums; and
(ii) the increase in net investment income, supported by the expansion in the average balance of financial investments.
Table 18 – Life, Mortgage Life and Rural | Managerial performance ratios
¹ Performance ratios calculated based on the managerial income statement, considering the reinsurance effects. ² It considers adjustments which can impact the performance ratios, detailed in the corresponding section, where applicable.
288 287 277 287354
272 266317
75 80 115 95
104
129 113103
363 367392 382
457400 379
419
47.0 46.4 48.0 45.253.7
46.3 43.1 46.8
3Q14 4Q14 1Q15 2Q15 3Q15 4Q15 1Q16 2Q16
Net investment income¹ (R$ million)
Non-interest operating result¹ (R$ million)
Adjusted ROAE (%)
C hg. (p.p.)
% 2Q15 1Q16 2Q16 On 2Q15 On 1Q16 1H 15 1H 16 On 1H 15
P erfo rmance rat io s
Loss ratio 31.2 34.3 30.9 (0.3) (3.4) 32.0 32.7 0.7
Commission ratio 26.4 26.3 28.0 1.5 1.7 26.5 27.1 0.7
G&A ratio 12.3 12.9 9.8 (2.5) (3.0) 11.5 11.3 (0.1)
Combined ratio 69.8 73.1 68.5 (1.2) (4.6) 69.7 70.9 1.1
A djusted perfo rmance rat io s ¹ ²
Loss ratio 31.2 32.7 30.9 (0.3) (1.8) 32.0 31.8 (0.2)
Commission ratio 26.4 26.3 28.0 1.5 1.7 26.5 27.1 0.7
G&A ratio 13.2 12.9 11.5 (1.6) (1.3) 12.5 12.2 (0.3)
Combined ratio 70.6 71.5 70.2 (0.4) (1.3) 70.7 70.9 0.2
Other rat io s
Expanded combined ratio 63.6 65.8 62.3 (1.3) (3.5) 62.8 64.1 1.2
Income tax rate 35.4 40.6 38.9 3.6 (1.6) 35.5 39.7 4.2
Adjusted ROAE 45.2 43.1 46.8 1.6 3.6 44.7 42.8 (1.9)
Quarterly F lo w C hg. (p.p.) H alf -Yearly F lo w

BB Seguridade Participações S.A. | Management Discussion & Analysis 2Q16 34
U N D E R W R I T I N G R E S U L T
Figure 28 – Life, Mortgage Life and Rural | Underwriting result QUARTERLY ANALYSIS
In the 2Q16, the underwriting result grew by 15.7% YoY, driven by the 11.2% increase in earned premiums and the 1.2 p.p. improvement in the combined ratio. Such improvement in the combined ratio is explained by the lower loss and G&A ratios, partially offset by a higher commission ratio.
YEAR-TO-DATE ANALYSIS
In the 1H16, the underwriting result came 9.6% higher as compared to the same period of 2015, justified by the increase in the volume of earned premiums, partially offset by the 1.1 p.p. deterioration in the combined ratio, due to higher loss and commission ratios.
N E T I N V E S T M E N T I N C O M E
Figure 29 – Life, Mortgage Life and Rural | Net investment income (R$ million)
QUARTERLY ANALYSIS
In the 2Q16, the net investment income grew by 14.5% YoY, justified by the expansion of the average volume of financial investments, partially offset by the contraction in the net interest margin, as a result of the increase in the average yield on pending claims and obligations with insurance and reinsurance operations.
YEAR-TO-DATE ANALYSIS
In the 1H16, the net investment income grew by 10.3% YoY, explained by the increase in the average volume of financial investments, partially offset by the contraction in the net interest margin.
432 450 445 457
554
426460
528
71.0 69.8 69.7 69.8 65.171.8 73.1 68.5
3Q14 4Q14 1Q15 2Q15 3Q15 4Q15 1Q16 2Q16
Underwriting result (R$ mill ion) Combined ratio (%)
109122
178
147 157
197 190168
3Q14 4Q14 1Q15 2Q15 3Q15 4Q15 1Q16 2Q16

BB Seguridade Participações S.A. | Management Discussion & Analysis 2Q16 35
U N D E R W R I T I N G R E S U L T A N A L Y S I S
P R E M I U M S W R I T T E N
Figure 30 – Life, Mortgage Life and Rural | Premiums written QUARTERLY ANALYSIS
In the 2Q16, premiums written amounted to R$2.1 billion, 12.3% higher YoY, boosted by the increase in premiums arising from rural, mainly in crop insurance, as well as in life, partially offset by the fall in credit life.
Retained premiums fell by 1.2% YoY, as a result of the larger share of the crop insurance in the mix of premiums written, as this segment presents a higher volume of premiums ceded to reinsurance.
YEAR-TO-DATE ANALYSIS
In the 1H16, premiums written amounted to R$3.6 billion, 5.4% up as compared to the 1H15, with a higher concentration in rural and in life insurance.
Figure 31 – Life, Mortgage Life and Rural | Premiums written in the bancassurance channel (R$ million)
Figure 32 – Life, Mortgage Life and Rural | Premiums written in other channels (R$ million)
Table 19 – Life, Mortgage Life and Rural | Breakdown of premiums written
Figure 33 – Life, Mortgage Life and Rural | Breakdown of premiums written (%)
Figure 34 – Life, Mortgage Life and Rural | Breakdown of retained premiums (%)
1,453
2,126
1,481 1,833 1,758 1,9341,384
1,811
99
49
61
33 336164
113
2851,553
2,175
1,542
1,867 2,094 2,098
1,497
2,097
93.6 97.7 96.1 98.2
84.0
92.2 92.486.4
3Q14 4Q14 1Q15 2Q15 3Q15 4Q15 1Q16 2Q16
Retained premiums (R$ million) Premiums ceded (R$ million)
Retention rate (%)
1,342
1,993
1,257
1,655
1,896 1,929
1,194
1,879
3Q14 4Q14 1Q15 2Q15 3Q15 4Q15 1Q16 2Q16
210
182
285
212198
168
303
218
3Q14 4Q14 1Q15 2Q15 3Q15 4Q15 1Q16 2Q16
C hg. %
R $ tho usand 2Q15 1Q16 2Q16 On 2Q15 On 1Q16 1H 15 1H 16 On 1H 15
Life 736,703 807,974 805,139 9.3 (0.4) 1,466,044 1,613,113 10.0
Credit Life 666,829 161,816 415,122 (37.7) 156.5 1,098,690 576,938 (47.5)
M ortgage Life 47,889 52,345 54,027 12.8 3.2 94,717 106,372 12.3
Rural 347,937 375,143 762,620 119.2 103.3 581,309 1,137,763 95.7
DPVAT 67,181 99,129 59,262 (11.8) (40.2) 167,676 158,391 (5.5)
Other 255 437 450 76.4 3.1 443 887 100.1
T o tal 1,866,794 1,496,845 2,096,619 12.3 40.1 3,408,878 3,593,464 5.4
Quarterly F lo w C hg. % H alf -Yearly F lo w
46.035.1
47.339.5 36.3 36.7
54.038.4
3.6
1.7
6.5
3.62.6 1.8
6.6
2.8
22.2 45.028.0
35.7
16.731.3
10.8
19.8
3.02.3 3.0 2.6
2.3
1.2 3.5
2.6
25.215.4 15.1 18.6
42.129.0 25.1
36.4
0.4
3Q14 4Q14 1Q15 2Q15 3Q15 4Q15 1Q16 2Q16
Life DPVAT Credit Life Mortgage Life Rural Other
49.135.5
48.940.1 43.1 39.7
58.244.3
3.9
1.8
6.8
3.7 3.11.9
7.2
3.3
23.746.0
29.136.4
19.9 33.9
11.6
22.8
2.92.2 2.9 2.5
2.51.2 3.4
2.5
20.4 14.1 12.3 17.431.3 23.3 19.5 27.1
0.4
-0.1
3Q14 4Q14 1Q15 2Q15 3Q15 4Q15 1Q16 2Q16
Life DPVAT Credit Life Mortgage Life Rural Other

BB Seguridade Participações S.A. | Management Discussion & Analysis 2Q16 36
C H A N G E S I N T E C H N I C A L R E S E R V E S - P R E M I U M S
Table 20 – Life, Mortgage Life and Rural | Changes in technical reserves – premiums
R E T A I N E D E A R N E D P R E M I U M S
Figure 35 – Life, Mortgage Life and Rural | Retained earned premiums (R$ million)
QUARTERLY ANALYSIS
In the 2Q16, the retained earned premiums increased 11.2% YoY, driven mainly by life and rural insurance.
YEAR-TO-DADE ANALYSIS
In the 1H16, retained earned premiums grew by 13.9% as compared to the same period of 2015, with a higher concentration in life, rural and, to a lesser extent, in credit life insurance.
Table 21 – Life, Mortgage Life and Rural | Breakdown of retained earned premiums
C hg. %
R $ tho usand 2Q15 1Q16 2Q16 On 2Q15 On 1Q16 1H 15 1H 16 On 1H 15
Provision for unearned premiums (250,896) 398,990 (174,171) (30.6) - (177,804) 224,818 -
Provision for benefits to be granted (except
VGBL and VRGP)- - - - - (276) - -
Provision for administrative expenses -
DPVAT(551) (1,594) (175) (68.1) (89.0) (1,674) (1,769) 5.7
Provision for technical surplus 1,786 4,402 (225) - - (5,460) 4,177 -
Complementary provisions of contributions - (32,355) (21,418) - (33.8) - (53,772) -
Other provisions (except VGBL and VRGP) (18,654) (7,553) (20,628) 10.6 173.1 (40,656) (28,181) (30.7)
C hange in technical reserves -
premiums(268,315) 361,891 (216,618) (19.3) - (225,870) 145,273 -
Quarterly F lo w C hg. % H alf -Yearly F lo w
1,489 1,491 1,465 1,510 1,589 1,5101,711 1,679
3Q14 4Q14 1Q15 2Q15 3Q15 4Q15 1Q16 2Q16
C hg. %
R $ tho usand 2Q15 1Q16 2Q16 On 2Q15 On 1Q16 1H 15 1H 16 On 1H 15
Life 703,215 833,156 799,323 13.7 (4.1) 1,367,657 1,632,478 19.4
Credit Life 388,446 381,407 383,920 (1.2) 0.7 744,921 765,327 2.7
M ortgage Life 50,680 47,529 45,204 (10.8) (4.9) 98,451 92,733 (5.8)
Rural 300,694 350,679 392,255 30.5 11.9 597,716 742,934 24.3
DPVAT 66,630 97,536 59,086 (11.3) (39.4) 166,002 156,622 (5.7)
Other 247 416 (652) - - 427 (236) -
T o tal 1,509,912 1,710,722 1,679,136 11.2 (1.8) 2,975,174 3,389,858 13.9
Quarterly F lo w C hg. % H alf -Yearly F lo w

BB Seguridade Participações S.A. | Management Discussion & Analysis 2Q16 37
R E T A I N E D C L A I M S
Figure 36 – Life, Mortgage Life and Rural | Retained claims QUARTERLY ANALYSIS
In the 2Q16, the loss ratio improved by 0.3 p.p. YoY, as a result of lower claims in life and in credit life, partially offset by the increase in claims in rural.
YEAR-TO-DATE ANALYSIS
In the 1H16, the loss ratio worsened by 0.7 p.p. as compared to the same period of 2015, largely explained by the increase in claims in the credit life insurance in the 1Q16, driven mainly by the late accounting of additional expenses for claims amounting to R$27.8 million, due to reported claims which were not fully processed because of registration mismatches.
Setting this effect apart, the loss ratio would have been 31.8% in the 1H16, 0.2 p.p. lower YoY.
¹Segregates the effects of the reversal of provisions for claims incurred but not enough reported (IBNER), the accounting of reported claims related to previous periods in the non-contributory product and the reversal of provisions for technical surplus.
Table 22 – Life, Mortgage Life and Rural | Breakdown of retained claims
472
367
481 471407 433
587519
31.7
24.6
31.2
25.628.7
34.330.9
27.3
28.9
32.8
32.7
3Q14 4Q14 1Q15 2Q15 3Q15 4Q15 1Q16 2Q16
Retained claims (R$ mil lion) Loss ratio (%)
Adjusted loss ratio¹ (%)
C hg. %
R $ tho usand 2Q15 1Q16 2Q16 On 2Q15 On 1Q16 1H 15 1H 16 On 1H 15
C laims incurred (531,331) (877,277) (874,922) 64.7 (0.3) (1,284,000) (1,752,198) 36.5
Expenses with claims (546,823) (851,366) (1,004,345) 83.7 18.0 (1,291,370) (1,855,711) 43.7
Changes in provisions for claims IBNR (11,995) (62,751) (41,897) 249.3 (33.2) (53,593) (104,648) 95.3
Changes in provisions for claims IBNER (7,569) 4,358 128,814 - 2,855.8 (1,523) 133,172 -
Recovery of claims - Coinsurance 37,456 38,863 53,993 44.1 38.9 73,957 92,856 25.6
Recovery of claims - Reinsurance 60,276 289,858 355,441 489.7 22.6 331,862 645,299 94.4
Salvage 325 528 56 (82.8) (89.4) 371 584 57.2
Reimbursements (18) - 669 - - 12 669 5,274.7
Assistance services (5,001) (7,160) (7,579) 51.6 5.9 (12,957) (14,739) 13.7
Other 2,293 251 (4,632) - - 1,103 (4,381) -
R etained claims (471,054) (587,419) (519,480) 10.3 (11.6) (952,138) (1,106,899) 16.3
A djustments - 27,822 - - - - 27,822 -
Claims in credit life related to previous
periods - 27,822 - - - - 27,822 -
A djusted retained claims (471,054) (559,597) (519,480) 10.3 (7.2) (952,138) (1,079,077) 13.3
Quarterly F lo w C hg. % H alf -Yearly F lo w

BB Seguridade Participações S.A. | Management Discussion & Analysis 2Q16 38
A C Q U I S I T I O N C O S T S
Figure 37 – Life, Mortgage Life and Rural | Acquisition costs QUARTERLY ANALYSIS
In the 2Q16, the commission ratio reached 28.0%, 1.6 p.p. higher YoY, largely explained by the increase in the ratio of the credit life and rural insurance.
YEAR-TO-DATE ANALYSIS
In the 1H16, commission ratio reached 27.1%, 0.6 p.p. higher than the ratio reported in the same period last year.
¹Segregates the effects of the reversal of provisions related to acquisition costs in the segment other and the reversal of provisions for technical surplus
Table 23 – Life, Mortgage Life and Rural | Acquisition costs
389 387 388 399429 427 450 470
26.1 26.0
26.7 27.1 26.5 26.4 27.0 28.3 26.3 28.0
3Q14 4Q14 1Q15 2Q15 3Q15 4Q15 1Q16 2Q16
Acquisition costs (R$ million) Commission ratio (%)
Adjusted commission ratio¹ (%)
C hg. %
R $ tho usand 2Q15 1Q16 2Q16 On 2Q15 On 1Q16 1H 15 1H 16 On 1H 15
Commission charged on premiums written (486,084) (317,277) (468,193) (3.7) 47.6 (856,636) (785,470) (8.3)
Agency commission (3,803) (187) (1,687) (55.6) 800.8 (8,787) (1,875) (78.7)
Commissions recovered - Coinsurance 4,883 5,743 5,469 12.0 (4.8) 9,608 11,212 16.7
Change in deferred acquisition costs 120,164 (108,737) 30,476 (74.6) - 131,206 (78,262) -
Other acquisition costs (34,395) (29,411) (35,881) 4.3 22.0 (62,543) (65,292) 4.4
A cquisit io n co sts (399,235) (449,869) (469,817) 17.7 4.4 (787,152) (919,686) 16.8
Quarterly F lo w C hg. % H alf -Yearly F lo w

BB Seguridade Participações S.A. | Management Discussion & Analysis 2Q16 39
G E N E R A L & A D M I N I S T R A T I V E E X P E N S E S
Figure 38 – Life, Mortgage Life and Rural | G&A expenses QUARTERLY ANALYSIS
In the 2Q16, the G&A ratio improved by 2.5 p.p. YoY due to the reduction in other operating income (expenses). This line was impacted by changes in the provision for loans losses, which presented reversals in both 2Q16 (R$28.9 million) and 2Q15 (R$13.1 million) recorded in the impairment line.
By segregating the effect of the reversals of provision for loan losses, the G&A ratio would have presented an improvement of 1.7 p.p. YoY.
YEAR-TO-DATE ANALYSIS
In the 1H16, the G&A ratio improved by 0.1 p.p. as compared to the same period of 2015. Both periods presented reversals in the provision for loan losses, recorded in the impairment line, in a total amount of R$28.9 million for the 1H16 and of R$29.8 million for the 1H15. By setting apart these reversals, the G&A ratio would have been 0.3 p.p. lower as compared to the 1H15.
¹Segregates the effects of the transfer of resources between Grupo Segurador BB MAPFRE’s companies in order to adequate the allocation of the insurance segments, the constitutions and reversals of provisions for loan losses, the reinforcement in contributions to the Rural Insurance Stability Fund (FESR) and the reversal of provisions for technical surplus.
72 82 75 69 86126
93 89
83
152
30 6665
4064
19
42
54
5151
5559 63
57
198
288
155186
206225 220
165
13.3
19.3
10.612.3 13.0
14.9
9.810.3
14.1
11.713.2 13.4
15.8
12.911.5
3Q14 4Q14 1Q15 2Q15 3Q15 4Q15 1Q16 2Q16
Tax expenses (R$ million)
Other operating income (expenses) (R$ million)
Administrative expenses (R$ million)
G&A ratio (%)
Adjusted G&A ratio¹ (%)

BB Seguridade Participações S.A. | Management Discussion & Analysis 2Q16 40
Table 24 – Life, Mortgage Life and Rural | General & Administrative expenses
C hg. %
R $ tho usand 2Q15 1Q16 2Q16 On 2Q15 On 1Q16 1H 15 1H 16 On 1H 15
A dministrat ive expenses (69,076) (93,118) (88,936) 28.8 (4.5) (143,590) (182,054) 26.8
Personnel (32,692) (37,684) (33,567) 2.7 (10.9) (67,428) (71,250) 5.7
Outsourcing (18,365) (23,701) (23,603) 28.5 (0.4) (38,156) (47,304) 24.0
Location and operation (10,761) (23,792) (20,195) 87.7 (15.1) (20,418) (43,987) 115.4
Institutional advertisement and publicity (2,930) (1,580) (2,866) (2.2) 81.4 (5,744) (4,445) (22.6)
Releases (44) (497) (38) (14.2) (92.4) (499) (535) 7.2
Other administrative expenses (3,113) (3,200) (6,043) 94.2 88.8 (6,374) (9,245) 45.0
DPVAT administrative expenses (1,171) (2,664) (2,624) 124.1 (1.5) (4,970) (5,288) 6.4
Other o perat ing inco me (expenses) (65,543) (64,085) (18,665) (71.5) (70.9) (95,080) (82,750) (13.0)
FESR contributions (30,819) (45,222) (34,710) 12.6 (23.2) (51,452) (79,931) 55.4
Charging expenses (4,248) (8,454) (5,968) 40.5 (29.4) (10,917) (14,421) 32.1
Civil contingencies (9,508) (3,406) (5,617) (40.9) 64.9 (14,017) (9,024) (35.6)
Events expenses (2,603) (917) (1,336) (48.7) 45.6 (4,226) (2,253) (46.7)
Endomarketing (6,378) - (7,101) 11.3 - (6,378) (7,101) 11.3
Social contributions (136) (126) (12) (90.9) (90.2) (279) (138) (50.4)
Impairment 13,012 (140) 41,091 215.8 - 26,061 40,951 57.1
Other operating income (expenses) (24,862) (5,821) (5,012) (79.8) (13.9) (33,873) (10,833) (68.0)
T ax expenses (51,236) (62,762) (57,157) 11.6 (8.9) (102,612) (119,919) 16.9
COFINS (42,751) (52,240) (48,198) 12.7 (7.7) (85,519) (100,438) 17.4
PIS (7,032) (8,555) (7,365) 4.7 (13.9) (13,982) (15,919) 13.9
Inspection fee (1,050) (1,455) (1,455) 38.6 - (2,101) (2,911) 38.6
Other tax expenses (403) (512) (139) (65.6) (72.9) (1,012) (652) (35.6)
G&A (185,854) (219,965) (164,757) (11.4) (25.1) (341,283) (384,724) 12.7
A djustments (13,100) - (28,900) 120.6 - (29,800) (28,900) (3.0)
Reversal o f provision for loan losses (13,100) - (28,900) 120.6 - (29,800) (28,900) (3.0)
A djusted G&A expenses (198,954) (219,965) (193,657) (2.7) (12.0) (371,083) (413,624) 11.5
Quarterly F lo w C hg. % H alf -Yearly F lo w

BB Seguridade Participações S.A. | Management Discussion & Analysis 2Q16 41
Life Insurance
Table 25 – Life Insurance | Key figures
QUARTERLY ANALYSIS
Life insurance premiums reached R$805.1 million in the 2Q16, 9.3% up YoY. The increase was observed in both the bancassurance and the independent broker channel, which grew 9.2% and 9.6% respectively.
YEAR-TO-DATE ANALYSIS
In the 1H16, life insurance premiums reached R$1.6 billion, 10.0% up as compared to the same period of 2015, with higher premiums
written in both the bancassurance (+10.0%) and the independent broker (+10.3%) channels.
Figure 39 – Life Insurance | Premiums written (R$ million) Figure 40 – Life Insurance | Breakdown of premiums written (%)
Figure 41 – Life Insurance | Premiums written in bancassurance channel (R$ million)
Figure 42 – Life Insurance | Premiums written in other channels (R$ million)
C hg. %
R $ tho usand 2Q15 1Q16 2Q16 On 2Q15 On 1Q16 1H 15 1H 16 On 1H 15
P remiums writ ten 736,703 807,974 805,139 9.3 (0.4) 1,466,044 1,613,113 10.0
Premiums ceded to reinsurance (2,003) (2,025) (1,885) (5.9) (6.9) (7,137) (3,910) (45.2)
R etained premiums 734,700 805,949 803,254 9.3 (0.3) 1,458,907 1,609,203 10.3
Changes in technical reserves - premiums (31,485) 27,206 (3,931) (87.5) - (91,250) 23,275 -
Earned premiums 703,215 833,156 799,323 13.7 (4.1) 1,367,657 1,632,478 19.4
Retained claims (248,463) (247,090) (245,288) (1.3) (0.7) (470,957) (492,378) 4.5
Acquisition costs (225,333) (252,854) (260,135) 15.4 2.9 (440,649) (512,989) 16.4
Underwrit ing margin 229,420 333,212 293,900 28.1 (11.8) 456,051 627,112 37.5
Quarterly F lo w C hg. % H alf -Yearly F lo w
714764
729 737 760 770808 805
3Q14 4Q14 1Q15 2Q15 3Q15 4Q15 1Q16 2Q16
78.582.4
74.8 80.5 81.283.0
74.880.4
21.5 17.625.2 19.5 18.8 17.0
25.2 19.6
3Q14 4Q14 1Q15 2Q15 3Q15 4Q15 1Q16 2Q16
Bancassurance Other channels
561
630
546593
617 639604
648
3Q14 4Q14 1Q15 2Q15 3Q15 4Q15 1Q16 2Q16
153
134
184
144 143131
204
158
3Q14 4Q14 1Q15 2Q15 3Q15 4Q15 1Q16 2Q16

BB Seguridade Participações S.A. | Management Discussion & Analysis 2Q16 42
Figure 43 – Life Insurance | Underwriting margin (R$ million) Figure 44 – Life Insurance | Underwriting margin by distribution channel (%)
QUARTERLY ANALYSIS
The underwriting margin for life insurance rose 4.1 p.p. YoY to 36.8% in the 2Q16. The improved margin is explained by the decrease of
4.6 p.p. in the loss ratio, with better results in both the bancassurance and the independent broker channels.
YEAR-TO-DATE ANALYSIS
In the 1H16, the underwriting margin reached 38.4%, 5.1 p.p. up YoY, justified by the 4.3 p.p. drop in the loss ratio, with improvements
in both distribution channels, as well as the 0.8 p.p. fall in the commission ratio in the bancassurance channel.
Figure 45 – Life Insurance | Loss ratio (%) Figure 46 – Life Insurance | Commission ratio (%)
225
303
227 229
271 264
333
294
3Q14 4Q14 1Q15 2Q15 3Q15 4Q15 1Q16 2Q16
32.0
42.0
34.132.6
36.2 37.040.0
36.8
37.4
50.8
35.2 36.1
41.042.8 43.5
39.2
14.6
2.9
30.5
18.8 18.3
12.7
25.227.5
3Q14 4Q14 1Q15 2Q15 3Q15 4Q15 1Q16 2Q16
Total Bancassurance Other channels
36.2
24.7
33.5 35.332.0 29.8 29.7 30.7
28.5
14.1
28.4 29.424.6 21.5
23.8 25.2
61.4
72.2
49.8
59.3 60.364.6
54.4 51.8
3Q14 4Q14 1Q15 2Q15 3Q15 4Q15 1Q16 2Q16
Total Bancassurance Other channels
31.733.3 32.4
32.0 31.833.2
30.3
32.5
34.135.1 36.3
34.6 34.535.7
32.7
35.6
24.025.0
19.7
21.9 21.522.7
20.4 20.7
3Q14 4Q14 1Q15 2Q15 3Q15 4Q15 1Q16 2Q16
Total Bancassurance Other channels

BB Seguridade Participações S.A. | Management Discussion & Analysis 2Q16 43
Credit Life Insurance
Table 26 – Credit Life Insurance | Key figures
QUARTERLY ANALYSIS
Credit life insurance premiums written amounted to R$415.1 million in the 2Q16, 37.7% down YoY. The underwriting margin grew by
0.7 p.p. YoY to 47.9%, boosted by the improvement of 3.1 p.p. in the loss ratio, partially offset by the 2.4 p.p. deterioration in the
commission ratio.
YEAR-TO-DATE ANALYSIS
In the 1H16, credit life premiums written amounted to R$576.9 million, 47.5% down as compared to the same period of 2015. The
underwriting margin reached 42.7%, 8.5 p.p. down YoY, largely explained by the deterioration in the loss ratio observed in the first
quarter of the year, which was negatively impacted by the accounting of R$27.8 million in claims that had incurred in previous periods
but have not been reported due to mismatches in client data.
By setting apart this effect, the loss ratio in the 1H16 would have been of 23.5%, 3.6 p.p. higher than in the 1H15, resulting in a 4.8 p.p.
drop in the underwriting margin.
Figure 47 – Credit Life Insurance | Premiums written (R$ million)
Figure 48 – Credit Life Insurance | Underwriting margin
Figure 49 – Credit Life Insurance | Loss ratio (%) Figure 50 – Credit Life Insurance | Commission ratio (%)
¹Segregates the effects of the accounting of the accounting of reported claims related to previous periods in the non-contributory product
C hg. %
R $ tho usand 2Q15 1Q16 2Q16 On 2Q15 On 1Q16 1H 15 1H 16 On 1H 15
P remiums writ ten 666,829 161,816 415,122 (37.7) 156.5 1,098,690 576,938 (47.5)
Premiums ceded to reinsurance (114) (835) (1,247) 997.8 49.3 (343) (2,083) 506.9
R etained premiums 666,715 160,981 413,874 (37.9) 157.1 1,098,347 574,855 (47.7)
Changes in technical reserves - premiums (278,269) 220,427 (29,954) (89.2) - (353,426) 190,472 -
Earned premiuns 388,446 381,407 383,920 (1.2) 0.7 744,921 765,327 2.7
Retained claims (97,216) (123,684) (84,247) (13.3) (31.9) (148,389) (207,931) 40.1
Acquisition costs (107,953) (114,614) (115,888) 7.4 1.1 (215,264) (230,501) 7.1
Underwrit ing margin 183,278 143,109 183,786 0.3 28.4 381,268 326,895 (14.3)
Quarterly F lo w C hg. % H alf -Yearly F lo w
345
979
432
667
350
656
162
415
3Q14 4Q14 1Q15 2Q15 3Q15 4Q15 1Q16 2Q16
148
207 198183
221
186
143
184
40.1
54.7 55.547.2
55.248.8
37.5
47.9
3Q14 4Q14 1Q15 2Q15 3Q15 4Q15 1Q16 2Q16
Underwriting margin (R$ million) Underwriting margin (%)
33.5
14.4
25.0
21.6
32.4
21.9
13.4
21.1
16.1
25.1
3Q14 4Q14 1Q15 2Q15 3Q15 4Q15 1Q16 2Q16
Loss ratio Adjusted loss ratio¹
26.424.2
30.1
27.828.7
29.6 30.1 30.2
3Q14 4Q14 1Q15 2Q15 3Q15 4Q15 1Q16 2Q16

BB Seguridade Participações S.A. | Management Discussion & Analysis 2Q16 44
Rural Insurance
Table 27 – Rural Insurance | Key figures
QUARTERLY ANALYSIS
In the 2Q16, premiums written in the rural segment amounted to R$762.6 million, 119.2% up YoY. Crop insurance was the one
recording the highest growth in the period, justified by an early release of working capital loans for the crop season 2016/2017, starting
in February 2016, unlike 2015 when loans followed the regular flow of the crop season which starts in July. Among other segments, rural
lien grew by 28.3% and credit life for farmers grew by 4.7%.
YEAR-TO-DATE ANALYSIS
Year-to-date, premiums written in the rural segment amounted to R$1.1 billion, 95.7% up YoY. Crop insurance recorded the highest
increase in the period, 770.0% (retained premiums: +919.9%), justified by the early release of working capital loans for the crop season
2016/2017, as previously mentioned, while rural lien premiums written grew 15.6% (retained premiums: +14.7%) and credit life for
farmers increased 14.3% (retained premiums: +14.3%).
Figure 51 – Rural Insurance | Premiums written (R$ million) Figure 52 – Rural Insurance | Breakdown of premiums written (%)
Figure 53 – Rural Insurance | Underwriting margin Figure 54 – Rural Insurance | Underwriting margin by product (%)
C hg. %
R $ tho usand 2Q15 1Q16 2Q16 On 2Q15 On 1Q16 1H 15 1H 16 On 1H 15
P remiums writ ten 347,937 375,143 762,620 119.2 103.3 581,309 1,137,763 95.7
Premiums ceded to reinsurance (29,018) (105,378) (271,955) 837.2 158.1 (80,334) (377,334) 369.7
R etained premiums 318,920 269,765 490,665 53.9 81.9 500,974 760,430 51.8
Changes in technical reserves - premiums (18,226) 80,914 (98,410) 439.9 - 96,742 (17,496) -
Earned premiuns 300,694 350,679 392,255 30.5 11.9 597,716 742,934 24.3
Retained claims (59,279) (120,888) (132,062) 122.8 9.2 (171,969) (252,951) 47.1
Acquisition costs (59,371) (75,587) (86,825) 46.2 14.9 (118,120) (162,412) 37.5
Underwrit ing margin 182,044 154,203 173,368 (4.8) 12.4 307,626 327,571 6.5
Quarterly F lo w C hg. % H alf -Yearly F lo w
12752 43 20
490
222157
387144161
113 144
186
193
112
185
113117
77178
194
193
105
187
73
1
6
11
2
1
4
391334
233
348
881
609
375
763
3Q14 4Q14 1Q15 2Q15 3Q15 4Q15 1Q16 2Q16
Crop Rural lien Credit life for farmers Other
32.4
15.7 18.35.7
55.6
36.4 41.950.8
36.9
48.3 48.3
41.4
21.1
31.729.8
24.3
28.9 35.1 33.0
51.2
22.131.7 28.0 24.5
1.8 1.0 0.4 1.7 1.2 0.3 0.2 0.5
3Q14 4Q14 1Q15 2Q15 3Q15 4Q15 1Q16 2Q16
Crop Rural lien Credit life for farmers Other
216
170
126
182
219
181154
173
67.456.8
42.3
60.5 64.451.5
44.0 44.2
3Q14 4Q14 1Q15 2Q15 3Q15 4Q15 1Q16 2Q16
Underwriting margin (R$ million) Underwriting margin (%)
78.1
33.6
-25.7
41.0
70.7
29.1
-7.0
-25.7
68.7
67.4 66.0 69.368.0
60.057.3
71.1
59.0 63.8
54.359.6 61.8
56.9 55.758.7
3Q14 4Q14 1Q15 2Q15 3Q15 4Q15 1Q16 2Q16
Crop Rural lien Credit life for farmers
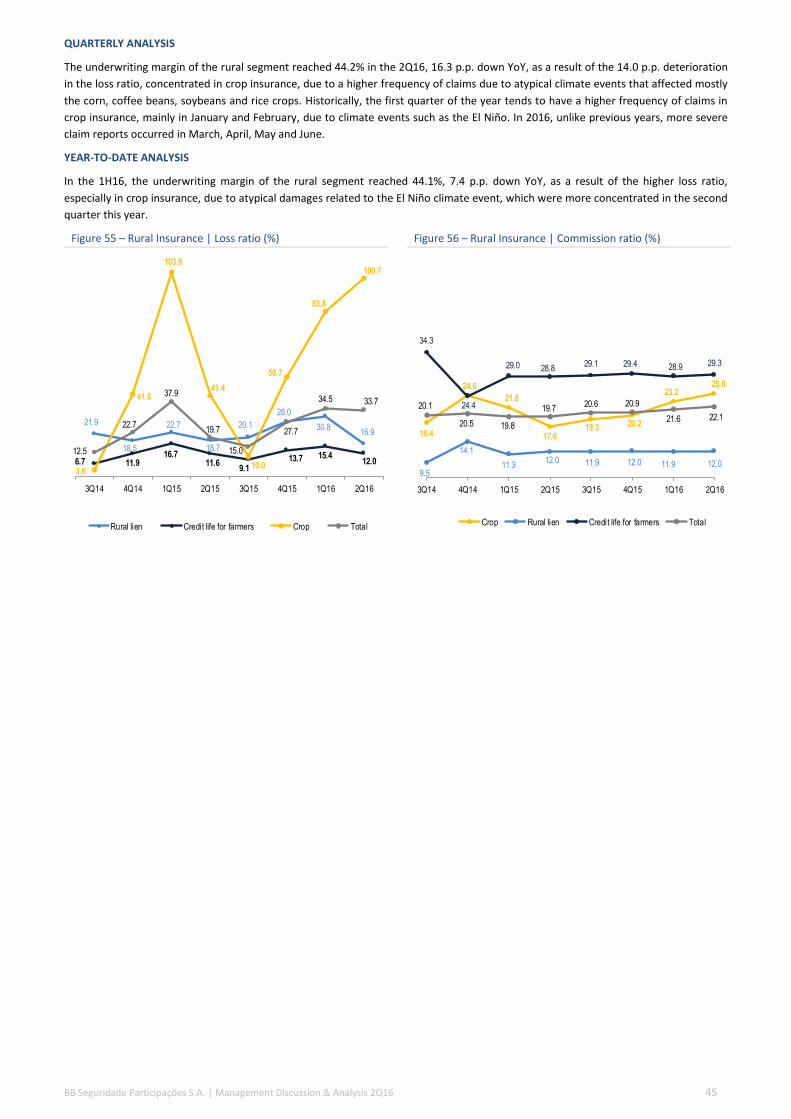
BB Seguridade Participações S.A. | Management Discussion & Analysis 2Q16 45
QUARTERLY ANALYSIS
The underwriting margin of the rural segment reached 44.2% in the 2Q16, 16.3 p.p. down YoY, as a result of the 14.0 p.p. deterioration
in the loss ratio, concentrated in crop insurance, due to a higher frequency of claims due to atypical climate events that affected mostly
the corn, coffee beans, soybeans and rice crops. Historically, the first quarter of the year tends to have a higher frequency of claims in
crop insurance, mainly in January and February, due to climate events such as the El Niño. In 2016, unlike previous years, more severe
claim reports occurred in March, April, May and June.
YEAR-TO-DATE ANALYSIS
In the 1H16, the underwriting margin of the rural segment reached 44.1%, 7.4 p.p. down YoY, as a result of the higher loss ratio,
especially in crop insurance, due to atypical damages related to the El Niño climate event, which were more concentrated in the second
quarter this year.
Figure 55 – Rural Insurance | Loss ratio (%) Figure 56 – Rural Insurance | Commission ratio (%)
6.7 11.916.7
11.69.1
13.7 15.412.0
3.6
41.8
103.9
41.4
10.0
50.7
83.8
100.7
12.5
22.7
37.9
19.7
15.0
27.7
34.5 33.7
21.9
18.5
22.7
18.7
20.1
28.0
30.816.9
3Q14 4Q14 1Q15 2Q15 3Q15 4Q15 1Q16 2Q16
Rural lien Credit life for farmers Crop Total
18.4
24.6
21.8
17.619.3 20.2
23.225.0
9.5
14.1
11.312.0 11.9 12.0 11.9 12.0
34.3
24.4
29.0 28.829.1 29.4 28.9 29.3
20.1
20.5 19.8
19.720.6 20.9
21.6 22.1
3Q14 4Q14 1Q15 2Q15 3Q15 4Q15 1Q16 2Q16
Crop Rural lien Credit life for farmers Total

BB Seguridade Participações S.A. | Management Discussion & Analysis 2Q16 46
Mortgage Life Insurance
Table 28 – Mortgage Life Insurance | Key figures
QUARTERLY ANALYSIS
In the 2Q16, mortgage life premiums amounted to R$54.0 million, 12.8% up YoY. The underwriting margin reached 70.3% in the
quarter, 3.6 p.p. down as compared to 2Q15, due to the deterioration of 1.0 p.p. in the loss ratio and of 2.7 p.p. in the commission ratio.
YEAR-TO-DATE ANALYSIS
Year-to-date, mortgage life premiums amounted to R$106.4 million, 12.3% up YoY. Underwriting margin reached 68.1%, 6.3 p.p. down
YoY, justified by the deterioration of the loss ratio, as a result of a higher frequency of claims concentrated in the first quarter of the
year, and by the 1.7 p.p. increase in the commission ratio.
Figure 57 – Mortgage Life Insurance | Premiums written (R$ million)
Figure 58 – Mortgage Life Insurance | Underwriting margin
Figure 59 – Mortgage Life Insurance | Loss ratio (%) Figure 60 – Mortgage Life Insurance | Commission ratio (%)
C hg. %
R $ tho usand 2Q15 1Q16 2Q16 On 2Q15 On 1Q16 1H 15 1H 16 On 1H 15
P remiums writ ten 47,889 52,345 54,027 12.8 3.2 94,717 106,372 12.3
Premiums ceded to reinsurance (2,344) (4,796) (8,966) 282.6 87.0 (6,526) (13,762) 110.9
R etained premiums 45,545 47,549 45,061 (1.1) (5.2) 88,191 92,610 5.0
Changes in technical reserves - premiums 5,135 (20) 143 (97.2) - 10,260 123 (98.8)
Earned premiuns 50,680 47,529 45,204 (10.8) (4.9) 98,451 92,733 (5.8)
Retained claims (7,772) (10,824) (7,352) (5.4) (32.1) (14,757) (18,176) 23.2
Acquisition costs (5,436) (5,339) (6,057) 11.4 13.5 (10,470) (11,397) 8.8
Underwrit ing margin 37,473 31,366 31,794 (15.2) 1.4 73,224 63,160 (13.7)
Quarterly F lo w C hg. % H alf -Yearly F lo w
4650
47 48 48
25
52 54
3Q14 4Q14 1Q15 2Q15 3Q15 4Q15 1Q16 2Q16
3329
36 37 35
13
31 32
79.3 74.2 74.8 73.9 78.8
53.866.0 70.3
3Q14 4Q14 1Q15 2Q15 3Q15 4Q15 1Q16 2Q16
Underwriting margin (R$ million) Underwriting margin (%)
11.3
13.8 14.6 15.3
10.2
33.2
22.8
16.3
3Q14 4Q14 1Q15 2Q15 3Q15 4Q15 1Q16 2Q16
9.4
12.010.5 10.7 11.0
13.0
11.2
13.4
3Q14 4Q14 1Q15 2Q15 3Q15 4Q15 1Q16 2Q16

BB Seguridade Participações S.A. | Management Discussion & Analysis 2Q16 47
DPVAT
Table 29 – DPVAT | Key figures
Other
Table 30 – Other | Key figures
C hg. %
R $ tho usand 2Q15 1Q16 2Q16 On 2Q15 On 1Q16 1H 15 1H 16 On 1H 15
P remiums writ ten 67,181 99,129 59,262 (11.8) (40.2) 167,676 158,391 (5.5)
R etained premiums 67,181 99,129 59,262 (11.8) (40.2) 167,676 158,391 (5.5)
Changes in technical reserves - premiums (551) (1,594) (175) (68.1) (89.0) (1,674) (1,769) 5.7
Earned premiuns 66,630 97,536 59,086 (11.3) (39.4) 166,002 156,622 (5.7)
Retained claims (58,306) (84,882) (50,505) (13.4) (40.5) (145,988) (135,387) (7.3)
Acquisition costs (978) (1,388) (830) (15.2) (40.2) (2,375) (2,218) (6.6)
Underwrit ing margin 7,346 11,266 7,751 5.5 (31.2) 17,639 19,017 7.8
Quarterly F lo w C hg. % H alf -Yearly F lo w
C hg. %
R $ tho usand 2Q15 1Q16 2Q16 On 2Q15 On 1Q16 1H 15 1H 16 On 1H 15
P remiums writ ten 255 437 450 76.4 3.1 443 887 100.1
Premiums ceded to reinsurance (13) (22) (1,112) 8,190.2 4,958.7 (22) (1,134) 5,167.8
R etained premiums 242 415 (662) - - 422 (247) -
Changes in technical reserves - premiums 5 2 10 92.9 525.5 5 11 115.5
Earned premiums 247 416 (652) - - 427 (236) -
Retained claims (19) (51) (26) 36.4 (48.8) (77) (77) (0.9)
Acquisition costs (165) (88) (82) (50.4) (6.7) (275) (169) (38.3)
Underwrit ing margin 63 278 (760) - - 75 (482) -
Quarterly F lo w C hg. % H alf -Yearly F lo w

BB Seguridade Participações S.A. | Management Discussion & Analysis 2Q16 48
N E T I N V E S T M E N T I N C O M E
Figure 61 – Life, Mortgage Life and Rural | Net investment income (R$ million)
QUARTERLY ANALYSIS
In the 2Q16, the net interest income grew by 7.8% YoY, explained by the expansion of the average balance of financial investments, partially offset by the compression of the net interest margin.
Adjusted interest revenues grew by 19.7%, as a result of the increase in both the average balance of financial investments and the average rate of return of these investments. The average balance of earning assets grew by 13.8% while the average yield rose by 0.2 p.p., due to both a higher average Selic rate and the downward shift move of the forward yield curve.
Adjusted interest expenses grew by 66.6%, as a result of the increase in the average balance and in the average yield on interest bearing
liabilities. The average balance of interest bearing liabilities grew by 19.5%, while the average yield increased by 2.1 p.p., as a result of a
higher yield on pending claims and obligations with insurance and reinsurance operations.
YEAR-TO-DATE ANALYSIS
In the 1H16, the net interest income grew by 7.2% YoY, explained by the growth in the average balance of financial investments,
partially offset by a retraction in the net interest margin.
Adjusted interest revenues grew by 16.3%, as a result of the increase in the average balance of financial investments, while the average
return on these investments remained stable. The average yield on held to maturity financial investments presented a contraction,
justified by the drop in inflation rates, while the yield on mark to market financial investments rose by 1.3 p.p..
Adjusted interest expenses grew by 57.5%, as a result of the increase in both the average balance of interest bearing liabilities as well as
the increase in the average yield on pending claims and obligations with insurance and reinsurance operations.
Table 31 – Life, Mortgage Life and Rural | Financial income and expenses¹
¹Managerial view
109122
178
147 157
197 190168
3Q14 4Q14 1Q15 2Q15 3Q15 4Q15 1Q16 2Q16
C hg. %
R $ tho usand 2Q15 1Q16 2Q16 On 2Q15 On 1Q16 1H 15 1H 16 On 1H 15
A djusted interest revenues 190,097 248,728 227,530 19.7 (8.5) 409,466 476,257 16.3
Revenues with mark to market financial
investments 121,344 182,763 158,805 30.9 (13.1) 257,534 341,568 32.6
Revenues with held to maturity financial
investments 53,875 48,711 49,894 (7.4) 2.4 121,940 98,605 (19.1)
Judicial deposits 10,981 12,235 14,903 35.7 21.8 21,130 27,138 28.4
Receivables from insurance and
reinsurance operations 3,897 5,019 3,927 0.8 (21.7) 8,863 8,946 0.9
A djusted interest expenses (38,493) (52,400) (64,123) 66.6 22.4 (73,967) (116,523) 57.5
Pending claims (15,798) (28,620) (26,558) 68.1 (7.2) (32,710) (55,178) 68.7
Judicial provisions (10,153) (10,827) (11,615) 14.4 7.3 (20,183) (22,442) 11.2
Obligations with insurance and reinsurance
operations (12,542) (12,954) (25,950) 106.9 100.3 (21,074) (38,904) 84.6
N et interest inco me 151,604 196,327 163,407 7.8 (16.8) 335,499 359,734 7.2
Quarterly F lo w C hg. % H alf -Yearly F lo w

BB Seguridade Participações S.A. | Management Discussion & Analysis 2Q16 49
Table 32 – Life, Mortgage Life and Rural | Quarterly figures - Volume and rate analysis¹
¹ Calculated with the same methodology of the parts. Due to the different weights of the elements which compose it, the total does not reflect the sum of the parts.
Table 33 – Life, Mortgage Life and Rural | Quarterly figures - Earning assets - average balance and interest rates
Table 34 – Life, Mortgage Life and Rural | Quarterly figures - Interest bearing liabilities - average balance and interest rates
R $ tho usand A verage vo lume A verage rate N et change
Earning assets
M ark to M arket financial investments 19,833 17,628 37,461
Held to maturity financial investments 3,896 (7,877) (3,981)
Judicial deposits 1,504 2,419 3,922
Receivables from insurance and reinsurance operations 962 (932) 30
T o tal 27,550 9,883 37,433
Interest bearing liabilit ies
Pending claims (4,967) (5,793) (10,760)
Judicial provisions (877) (585) (1,462)
Obligations with insurance and reinsurance operations (5,150) (8,259) (13,408)
T o tal (10,452) (15,178) (25,630)
2Q16/ 2Q15
R $ millio nA verage
balance
Interest
revenues
A nnualized
rate (%)
A verage
balance
Interest
revenues
A nnualized
rate (%)
Earning assets
M ark to M arket financial investments 3,850 121 13.7 4,400 159 15.2
Held to maturity financial investments 1,671 54 14.0 1,812 50 11.5
Judicial deposits 725 11 6.4 807 15 7.6
Receivables from insurance and reinsurance operations 472 4 3.5 625 4 2.5
T o tal 6,718 190 12.2 7,644 228 12.4
2Q15 2Q16
R $ millio nA verage
balance
Interest
expenses
A nnualized
rate (%)
A verage
balance
Interest
expenses
A nnualized
rate (%)
Interest bearing liabilit ies
Pending claims 1,579 (16) 4.1 1,942 (27) 5.4
Judicial provisions 609 (10) 6.7 659 (12) 6.9
Obligations with insurance and reinsurance operations 249 (13) 19.3 310 (26) 29.5
T o tal 2,437 (38) 6.4 2,911 (64) 8.5
2Q15 2Q16
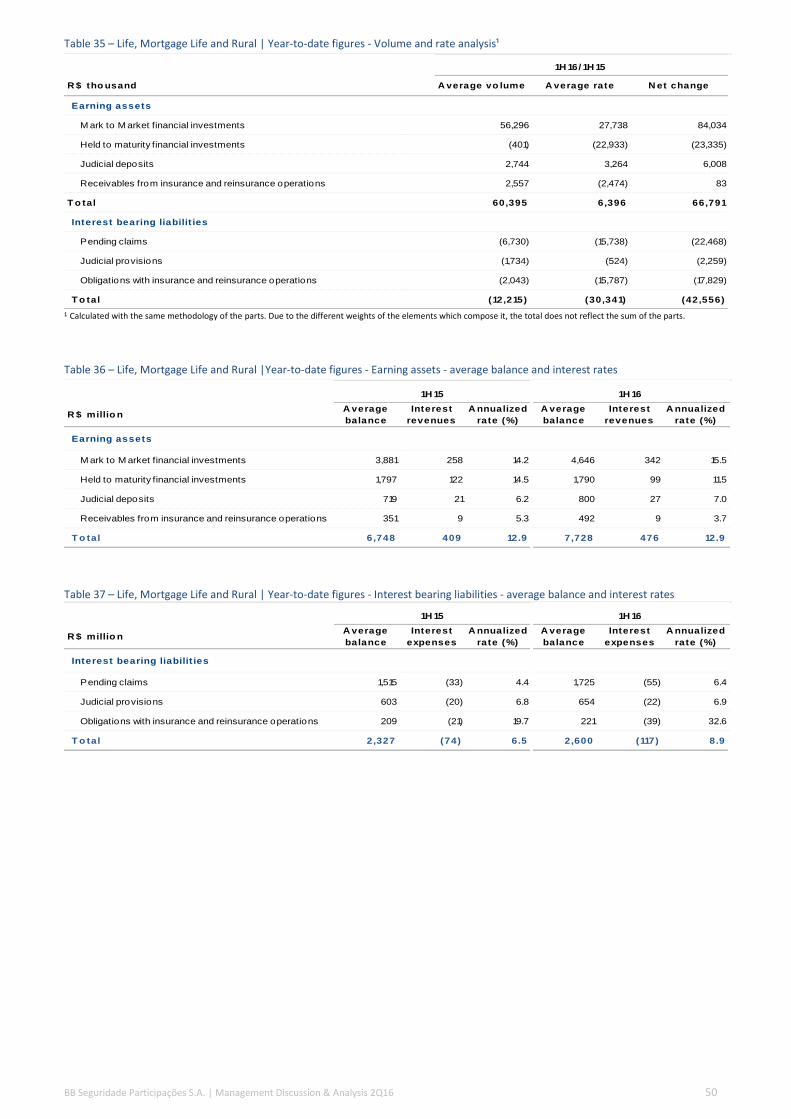
BB Seguridade Participações S.A. | Management Discussion & Analysis 2Q16 50
Table 35 – Life, Mortgage Life and Rural | Year-to-date figures - Volume and rate analysis¹
¹ Calculated with the same methodology of the parts. Due to the different weights of the elements which compose it, the total does not reflect the sum of the parts.
Table 36 – Life, Mortgage Life and Rural |Year-to-date figures - Earning assets - average balance and interest rates
Table 37 – Life, Mortgage Life and Rural | Year-to-date figures - Interest bearing liabilities - average balance and interest rates
R $ tho usand A verage vo lume A verage rate N et change
Earning assets
M ark to M arket financial investments 56,296 27,738 84,034
Held to maturity financial investments (401) (22,933) (23,335)
Judicial deposits 2,744 3,264 6,008
Receivables from insurance and reinsurance operations 2,557 (2,474) 83
T o tal 60,395 6,396 66,791
Interest bearing liabilit ies
Pending claims (6,730) (15,738) (22,468)
Judicial provisions (1,734) (524) (2,259)
Obligations with insurance and reinsurance operations (2,043) (15,787) (17,829)
T o tal (12,215) (30,341) (42,556)
1H 16/ 1H 15
R $ millio nA verage
balance
Interest
revenues
A nnualized
rate (%)
A verage
balance
Interest
revenues
A nnualized
rate (%)
Earning assets
M ark to M arket financial investments 3,881 258 14.2 4,646 342 15.5
Held to maturity financial investments 1,797 122 14.5 1,790 99 11.5
Judicial deposits 719 21 6.2 800 27 7.0
Receivables from insurance and reinsurance operations 351 9 5.3 492 9 3.7
T o tal 6,748 409 12.9 7,728 476 12.9
1H 15 1H 16
R $ millio nA verage
balance
Interest
expenses
A nnualized
rate (%)
A verage
balance
Interest
expenses
A nnualized
rate (%)
Interest bearing liabilit ies
Pending claims 1,515 (33) 4.4 1,725 (55) 6.4
Judicial provisions 603 (20) 6.8 654 (22) 6.9
Obligations with insurance and reinsurance operations 209 (21) 19.7 221 (39) 32.6
T o tal 2,327 (74) 6.5 2,600 (117) 8.9
1H 15 1H 16
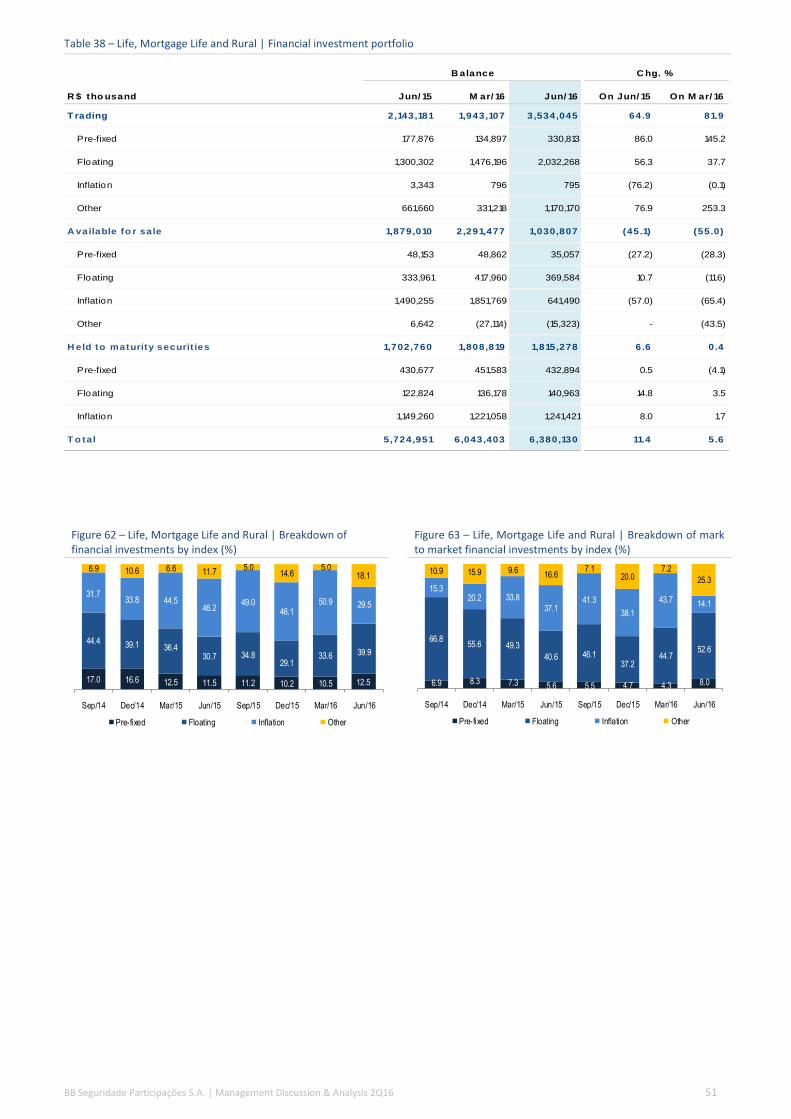
BB Seguridade Participações S.A. | Management Discussion & Analysis 2Q16 51
Table 38 – Life, Mortgage Life and Rural | Financial investment portfolio
Figure 62 – Life, Mortgage Life and Rural | Breakdown of financial investments by index (%)
Figure 63 – Life, Mortgage Life and Rural | Breakdown of mark to market financial investments by index (%)
R $ tho usand Jun/ 15 M ar/ 16 Jun/ 16 On Jun/ 15 On M ar/ 16
T rading 2,143,181 1,943,107 3,534,045 64.9 81.9
Pre-fixed 177,876 134,897 330,813 86.0 145.2
Floating 1,300,302 1,476,196 2,032,268 56.3 37.7
Inflation 3,343 796 795 (76.2) (0.1)
Other 661,660 331,218 1,170,170 76.9 253.3
A vailable fo r sale 1,879,010 2,291,477 1,030,807 (45.1) (55.0)
Pre-fixed 48,153 48,862 35,057 (27.2) (28.3)
Floating 333,961 417,960 369,584 10.7 (11.6)
Inflation 1,490,255 1,851,769 641,490 (57.0) (65.4)
Other 6,642 (27,114) (15,323) - (43.5)
H eld to maturity securit ies 1,702,760 1,808,819 1,815,278 6.6 0.4
Pre-fixed 430,677 451,583 432,894 0.5 (4.1)
Floating 122,824 136,178 140,963 14.8 3.5
Inflation 1,149,260 1,221,058 1,241,421 8.0 1.7
T o tal 5,724,951 6,043,403 6,380,130 11.4 5.6
B alance C hg. %
17.0 16.6 12.5 11.5 11.2 10.2 10.5 12.5
44.4 39.1 36.430.7 34.8
29.133.6 39.9
31.733.8 44.5
46.249.0
46.150.9 29.5
6.9 10.6 6.6 11.7 5.014.6
5.018.1
Sep/14 Dec/14 Mar/15 Jun/15 Sep/15 Dec/15 Mar/16 Jun/16
Pre-fixed Floating Inflation Other
6.9 8.3 7.3 5.6 5.5 4.7 4.3 8.0
66.855.6 49.3
40.6 46.137.2
44.752.6
15.320.2 33.8
37.141.3
38.1
43.7 14.1
10.9 15.9 9.616.6
7.120.0
7.2
25.3
Sep/14 Dec/14 Mar/15 Jun/15 Sep/15 Dec/15 Mar/16 Jun/16
Pre-fixed Floating Inflation Other
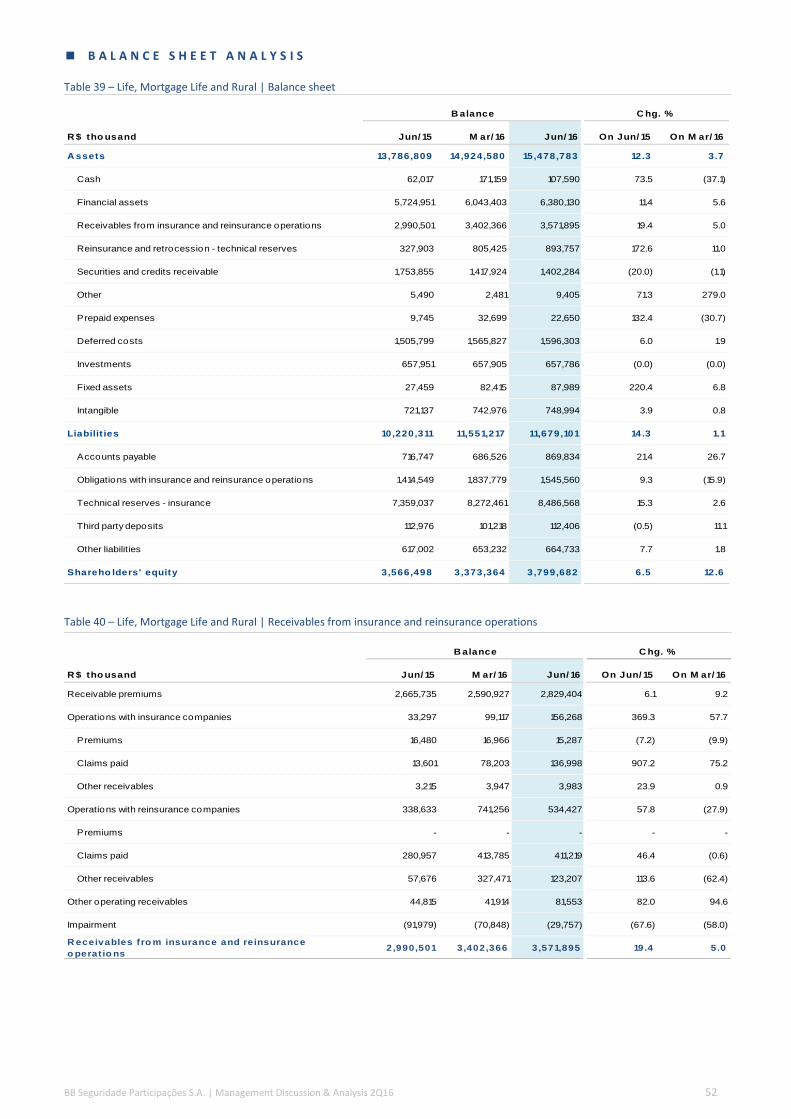
BB Seguridade Participações S.A. | Management Discussion & Analysis 2Q16 52
B A L A N C E S H E E T A N A L Y S I S
Table 39 – Life, Mortgage Life and Rural | Balance sheet
Table 40 – Life, Mortgage Life and Rural | Receivables from insurance and reinsurance operations
R $ tho usand Jun/ 15 M ar/ 16 Jun/ 16 On Jun/ 15 On M ar/ 16
A ssets 13,786,809 14,924,580 15,478,783 12.3 3.7
Cash 62,017 171,159 107,590 73.5 (37.1)
Financial assets 5,724,951 6,043,403 6,380,130 11.4 5.6
Receivables from insurance and reinsurance operations 2,990,501 3,402,366 3,571,895 19.4 5.0
Reinsurance and retrocession - technical reserves 327,903 805,425 893,757 172.6 11.0
Securities and credits receivable 1,753,855 1,417,924 1,402,284 (20.0) (1.1)
Other 5,490 2,481 9,405 71.3 279.0
Prepaid expenses 9,745 32,699 22,650 132.4 (30.7)
Deferred costs 1,505,799 1,565,827 1,596,303 6.0 1.9
Investments 657,951 657,905 657,786 (0.0) (0.0)
Fixed assets 27,459 82,415 87,989 220.4 6.8
Intangible 721,137 742,976 748,994 3.9 0.8
Liabilit ies 10,220,311 11,551,217 11,679,101 14.3 1.1
Accounts payable 716,747 686,526 869,834 21.4 26.7
Obligations with insurance and reinsurance operations 1,414,549 1,837,779 1,545,560 9.3 (15.9)
Technical reserves - insurance 7,359,037 8,272,461 8,486,568 15.3 2.6
Third party deposits 112,976 101,218 112,406 (0.5) 11.1
Other liabilities 617,002 653,232 664,733 7.7 1.8
Shareho lders' equity 3,566,498 3,373,364 3,799,682 6.5 12.6
B alance C hg. %
R $ tho usand Jun/ 15 M ar/ 16 Jun/ 16 On Jun/ 15 On M ar/ 16
Receivable premiums 2,665,735 2,590,927 2,829,404 6.1 9.2
Operations with insurance companies 33,297 99,117 156,268 369.3 57.7
Premiums 16,480 16,966 15,287 (7.2) (9.9)
Claims paid 13,601 78,203 136,998 907.2 75.2
Other receivables 3,215 3,947 3,983 23.9 0.9
Operations with reinsurance companies 338,633 741,256 534,427 57.8 (27.9)
Premiums - - - - -
Claims paid 280,957 413,785 411,219 46.4 (0.6)
Other receivables 57,676 327,471 123,207 113.6 (62.4)
Other operating receivables 44,815 41,914 81,553 82.0 94.6
Impairment (91,979) (70,848) (29,757) (67.6) (58.0)
R eceivables fro m insurance and reinsurance
o perat io ns2,990,501 3,402,366 3,571,895 19.4 5.0
B alance C hg. %

BB Seguridade Participações S.A. | Management Discussion & Analysis 2Q16 53
Table 41 – Life, Mortgage Life and Rural | Reinsurance and retrocession – technical reserves
Table 42 – Life, Mortgage Life and Rural | Securities and credits receivable
R $ tho usand Jun/ 15 M ar/ 16 Jun/ 16 On Jun/ 15 On M ar/ 16
Deferred premiums - PPNG 78,647 303,247 369,995 370.5 22.0
Deferred premiums - RVNE 6,380 8,258 8,617 35.1 4.3
Other deferred premiums (145) (145) (145) - -
IBNR claims 30,992 24,507 39,893 28.7 62.8
Pending claims 196,696 412,135 400,151 103.4 (2.9)
Provision for related expenses 2,812 2,852 3,485 23.9 22.2
Other provision 12,522 54,571 71,762 473.1 31.5
R einsurance and retro cessio n - technical reserves 327,903 805,425 893,757 172.6 11.0
B alance C hg. %
R $ tho usand Jun/ 15 M ar/ 16 Jun/ 16 On Jun/ 15 On M ar/ 16
Securities and credits receivable 500,101 108,908 98,744 (80.3) (9.3)
Other tax and social security receivables 122,469 98,878 89,966 (26.5) (9.0)
Receivable tax and social security - tax loss 172,651 185,312 180,948 4.8 (2.4)
Receivable tax and social security - temporary adjustements 197,644 198,666 180,394 (8.7) (9.2)
Prepaid income tax and social contributions - - - - -
Tax and judicial deposits 741,993 806,963 831,668 12.1 3.1
Other receivables 24,342 19,236 20,604 (15.4) 7.1
Impairment (5,345) (40) (40) (99.3) -
Securit ies and credits receivable 1,753,855 1,417,924 1,402,284 (20.0) (1.1)
B alance C hg. %
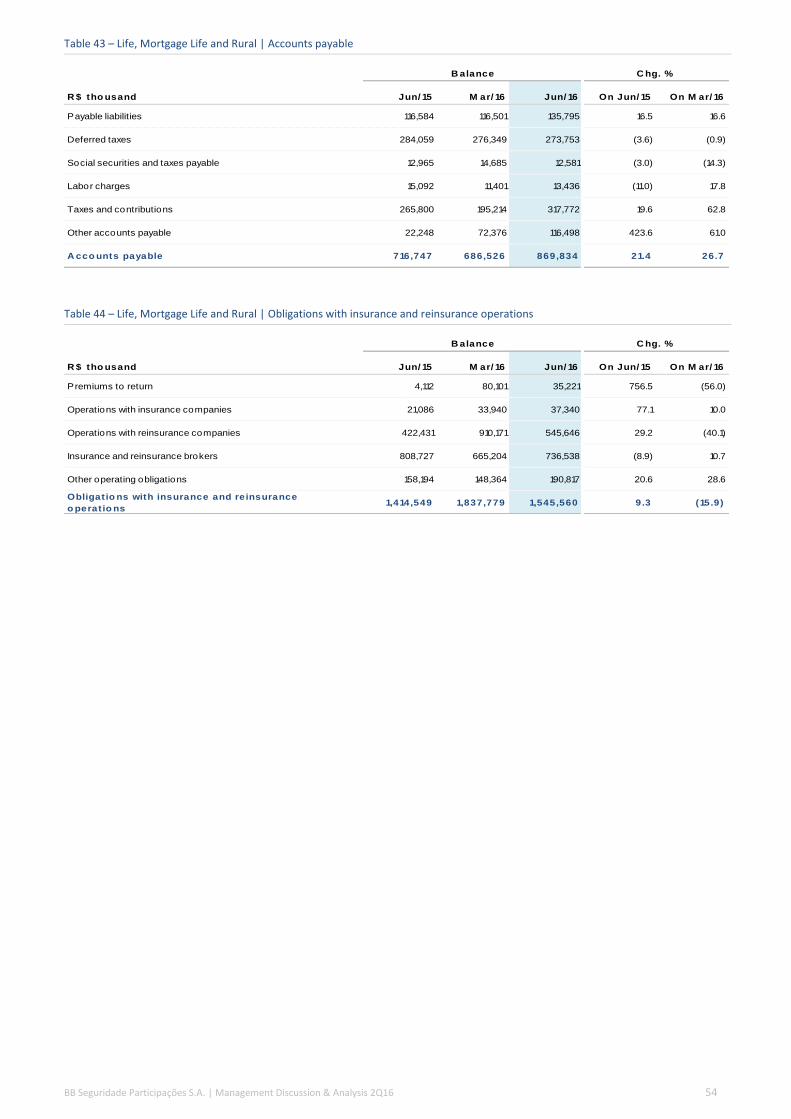
BB Seguridade Participações S.A. | Management Discussion & Analysis 2Q16 54
Table 43 – Life, Mortgage Life and Rural | Accounts payable
Table 44 – Life, Mortgage Life and Rural | Obligations with insurance and reinsurance operations
R $ tho usand Jun/ 15 M ar/ 16 Jun/ 16 On Jun/ 15 On M ar/ 16
Payable liabilities 116,584 116,501 135,795 16.5 16.6
Deferred taxes 284,059 276,349 273,753 (3.6) (0.9)
Social securities and taxes payable 12,965 14,685 12,581 (3.0) (14.3)
Labor charges 15,092 11,401 13,436 (11.0) 17.8
Taxes and contributions 265,800 195,214 317,772 19.6 62.8
Other accounts payable 22,248 72,376 116,498 423.6 61.0
A cco unts payable 716,747 686,526 869,834 21.4 26.7
B alance C hg. %
R $ tho usand Jun/ 15 M ar/ 16 Jun/ 16 On Jun/ 15 On M ar/ 16
Premiums to return 4,112 80,101 35,221 756.5 (56.0)
Operations with insurance companies 21,086 33,940 37,340 77.1 10.0
Operations with reinsurance companies 422,431 910,171 545,646 29.2 (40.1)
Insurance and reinsurance brokers 808,727 665,204 736,538 (8.9) 10.7
Other operating obligations 158,194 148,364 190,817 20.6 28.6
Obligat io ns with insurance and reinsurance
o perat io ns1,414,549 1,837,779 1,545,560 9.3 (15.9)
B alance C hg. %
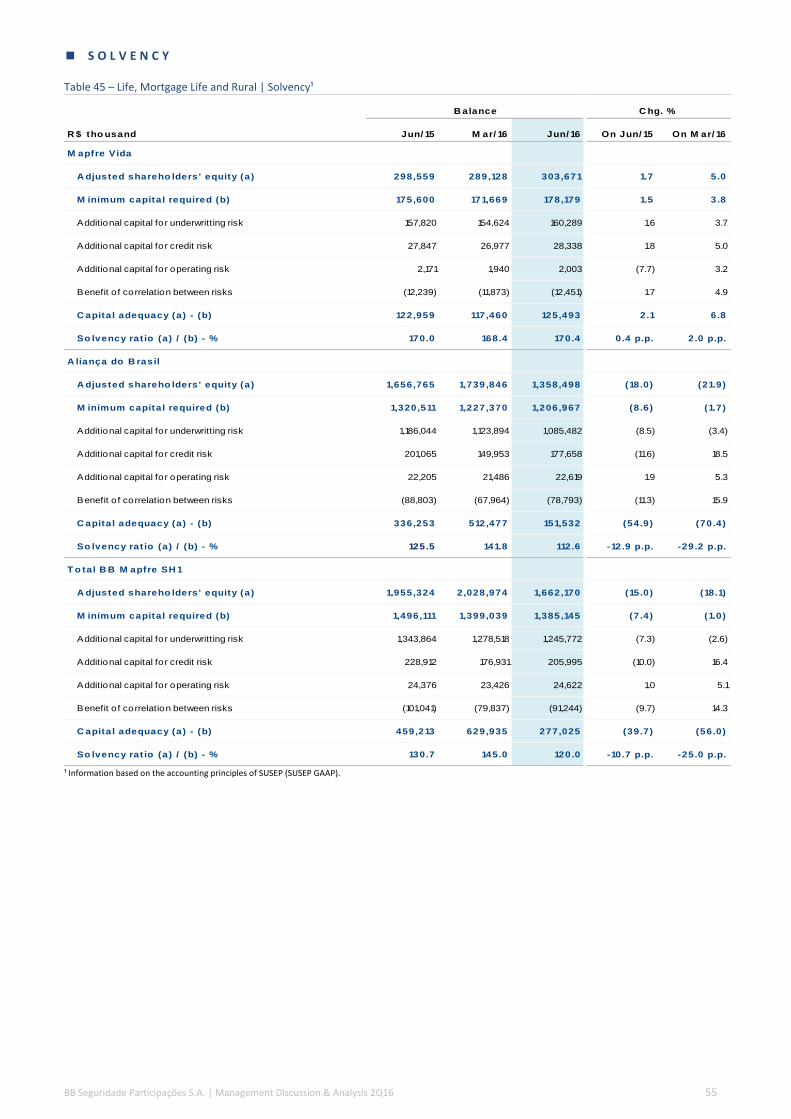
BB Seguridade Participações S.A. | Management Discussion & Analysis 2Q16 55
S O L V E N C Y
Table 45 – Life, Mortgage Life and Rural | Solvency¹
¹ Information based on the accounting principles of SUSEP (SUSEP GAAP).
R $ tho usand Jun/ 15 M ar/ 16 Jun/ 16 On Jun/ 15 On M ar/ 16
M apfre Vida
A djusted shareho lders' equity (a) 298,559 289,128 303,671 1.7 5.0
M inimum capital required (b) 175,600 171,669 178,179 1.5 3.8
Additional capital for underwritting risk 157,820 154,624 160,289 1.6 3.7
Additional capital for credit risk 27,847 26,977 28,338 1.8 5.0
Additional capital for operating risk 2,171 1,940 2,003 (7.7) 3.2
Benefit o f correlation between risks (12,239) (11,873) (12,451) 1.7 4.9
C apital adequacy (a) - (b) 122,959 117,460 125,493 2.1 6.8
So lvency rat io (a) / (b) - % 170.0 168.4 170.4 0.4 p.p. 2.0 p.p.
A liança do B rasil
A djusted shareho lders' equity (a) 1,656,765 1,739,846 1,358,498 (18.0) (21.9)
M inimum capital required (b) 1,320,511 1,227,370 1,206,967 (8.6) (1.7)
Additional capital for underwritting risk 1,186,044 1,123,894 1,085,482 (8.5) (3.4)
Additional capital for credit risk 201,065 149,953 177,658 (11.6) 18.5
Additional capital for operating risk 22,205 21,486 22,619 1.9 5.3
Benefit o f correlation between risks (88,803) (67,964) (78,793) (11.3) 15.9
C apital adequacy (a) - (b) 336,253 512,477 151,532 (54.9) (70.4)
So lvency rat io (a) / (b) - % 125.5 141.8 112.6 -12.9 p.p. -29.2 p.p.
T o tal B B M apfre SH 1
A djusted shareho lders' equity (a) 1,955,324 2,028,974 1,662,170 (15.0) (18.1)
M inimum capital required (b) 1,496,111 1,399,039 1,385,145 (7.4) (1.0)
Additional capital for underwritting risk 1,343,864 1,278,518 1,245,772 (7.3) (2.6)
Additional capital for credit risk 228,912 176,931 205,995 (10.0) 16.4
Additional capital for operating risk 24,376 23,426 24,622 1.0 5.1
Benefit o f correlation between risks (101,041) (79,837) (91,244) (9.7) 14.3
C apital adequacy (a) - (b) 459,213 629,935 277,025 (39.7) (56.0)
So lvency rat io (a) / (b) - % 130.7 145.0 120.0 -10.7 p.p. -25.0 p.p.
C hg. %B alance

BB Seguridade Participações S.A. | Management Discussion & Analysis 2Q16 56
4 . 2 P R O P E R T Y A N D C A S U A L T Y
E A R N I N G S A N A L Y S I S
Table 46 – Property and Casualty | Income statement
C hg. %
R $ tho usand 2Q15 1Q16 2Q16 On 2Q15 On 1Q16 1H 15 1H 16 On 1H 15
P remiums writ ten 2,324,756 2,173,922 2,283,537 (1.8) 5.0 4,445,260 4,457,459 0.3
Changes in technical reserves - premiums (127,706) 65,702 59,670 - (9.2) (78,615) 125,372 -
Earned premiuns 2,197,050 2,239,624 2,343,207 6.7 4.6 4,366,645 4,582,831 5.0
Revenue of po licies issuance 1,969 7,683 4,839 145.8 (37.0) 5,010 12,522 149.9
Claims incurred (1,253,277) (1,297,163) (1,286,609) 2.7 (0.8) (2,672,964) (2,583,772) (3.3)
Acquisition costs (417,506) (437,902) (438,806) 5.1 0.2 (808,412) (876,708) 8.4
Result with reinsurance (120,503) (263,887) (216,006) 79.3 (18.1) (100,658) (479,893) 376.8
Administrative expenses (222,134) (242,246) (222,897) 0.3 (8.0) (446,384) (465,143) 4.2
Tax expenses (43,629) (43,463) (45,918) 5.2 5.6 (95,818) (89,381) (6.7)
Other operating income (expenses) (97,159) (67,896) (75,411) (22.4) 11.1 (191,114) (143,307) (25.0)
Underwrit ing result 44,811 (105,251) 62,400 39.3 - 56,305 (42,851) -
N et investment inco me 136,260 191,707 171,771 26.1 (10.4) 294,424 363,478 23.5
Financial income 172,897 156,929 132,438 (23.4) (15.6) 477,102 289,367 (39.3)
Financial expenses (36,637) 34,778 39,333 - 13.1 (182,678) 74,111 -
Equity income (1,594) (915) (806) (49.4) (11.9) (3,130) (1,721) (45.0)
Operat ing result 179,477 85,542 233,364 30.0 172.8 347,599 318,906 (8.3)
Gains or losses on non-current assets (603) (224) 897 - - (611) 673 -
Earnings befo re taxes and pro f it
sharing178,874 85,318 234,261 31.0 174.6 346,988 319,579 (7.9)
Taxes (62,631) (37,095) (97,062) 55.0 161.7 (126,772) (134,157) 5.8
Profit sharing (16,103) 2,272 (11,432) (29.0) - (21,253) (9,160) (56.9)
N et inco me 100,140 50,495 125,767 25.6 149.1 198,963 176,262 (11.4)
Quarterly F lo w C hg. % H alf -Yearly F lo w

BB Seguridade Participações S.A. | Management Discussion & Analysis 2Q16 57
To provide a better analysis, the following table shows a managerial view built considering the reallocation of the result with
reinsurance to the other accounts that compose the Income Statement. This reallocation allows the analysis of the performance ratios
already considering the reinsurance effects.
Table 47 – Property and Casualty | Managerial income statement¹
¹ In accordance with Susep Rule 508, since 2016 the accouting of expenses with sales representatives changed from “other operating income (expenses)” to “acquisition costs”. Therefore, the managerial income statement of 2015 was adjusted for analysis purposes.
Retained premiums = Premiums written + premiums ceded to reinsurance Changes in technical provisions = Changes in technical provisions + changes in technical provisions on reinsured operations Retained claims = Claims incurred + recovery of indemnity claims + recovery of claims expenses + changes in provisions for claims IBNR + salvages and reimbursed assets + changes in provision for claims IBNER provisions for claims to be settled + changes of expenses related to IBNR + changes in estimates for salvages and reimbursed assets provisions for claims to be settled.
C hg. %
R $ tho usand 2Q15 1Q16 2Q16 On 2Q15 On 1Q16 1H 15 1H 16 On 1H 15
P remiums writ ten 2,324,756 2,173,922 2,283,537 (1.8) 5.0 4,445,260 4,457,459 0.3
Premiums ceded reinsurance (299,181) (418,109) (444,280) 48.5 6.3 (595,350) (862,389) 44.9
R etained premiums 2,025,575 1,755,813 1,839,257 (9.2) 4.8 3,849,910 3,595,070 (6.6)
Changes in technical reserves - premiums (115,472) 138,014 99,558 - (27.9) (38,631) 237,573 -
R etained earned premiuns 1,910,103 1,893,827 1,938,816 1.5 2.4 3,811,279 3,832,643 0.6
Revenue of po licies issuance 1,969 7,683 4,839 145.8 (37.0) 5,010 12,522 149.9
Claims retained (1,086,833) (1,215,253) (1,098,222) 1.0 (9.6) (2,218,257) (2,313,475) 4.3
Acquisition costs (440,888) (437,902) (438,806) (0.5) 0.2 (859,572) (876,708) 2.0
Administrative expenses (222,134) (242,246) (222,897) 0.3 (8.0) (446,384) (465,143) 4.2
Tax expenses (43,629) (43,463) (45,918) 5.2 5.6 (95,818) (89,381) (6.7)
Other operating income (expenses) (73,777) (67,896) (75,411) 2.2 11.1 (139,954) (143,307) 2.4
Underwrit ing result 44,811 (105,251) 62,402 39.3 - 56,304 (42,849) -
N et investment inco me 136,260 191,707 171,771 26.1 (10.4) 294,424 363,478 23.5
Financial income 172,897 156,929 132,438 (23.4) (15.6) 477,102 289,367 (39.3)
Financial expenses (36,637) 34,778 39,333 - 13.1 (182,678) 74,111 -
Equity income (1,594) (915) (806) (49.4) (11.9) (3,130) (1,721) (45.0)
Operat ing result 179,477 85,542 233,364 30.0 172.8 347,598 318,906 (8.3)
Gains or losses on non-current assets (603) (224) 897 - - (611) 673 -
Earnings befo re taxes and pro f it
sharing178,874 85,318 234,261 31.0 174.6 346,987 319,579 (7.9)
Taxes (62,631) (37,095) (97,062) 55.0 161.7 (126,772) (134,157) 5.8
Profit sharing (16,103) 2,272 (11,432) (29.0) - (21,253) (9,160) (56.9)
A djusted net inco me 100,140 50,495 125,767 25.6 149.1 198,962 176,262 (11.4)
Quarterly F lo w C hg. % H alf -Yearly F lo w
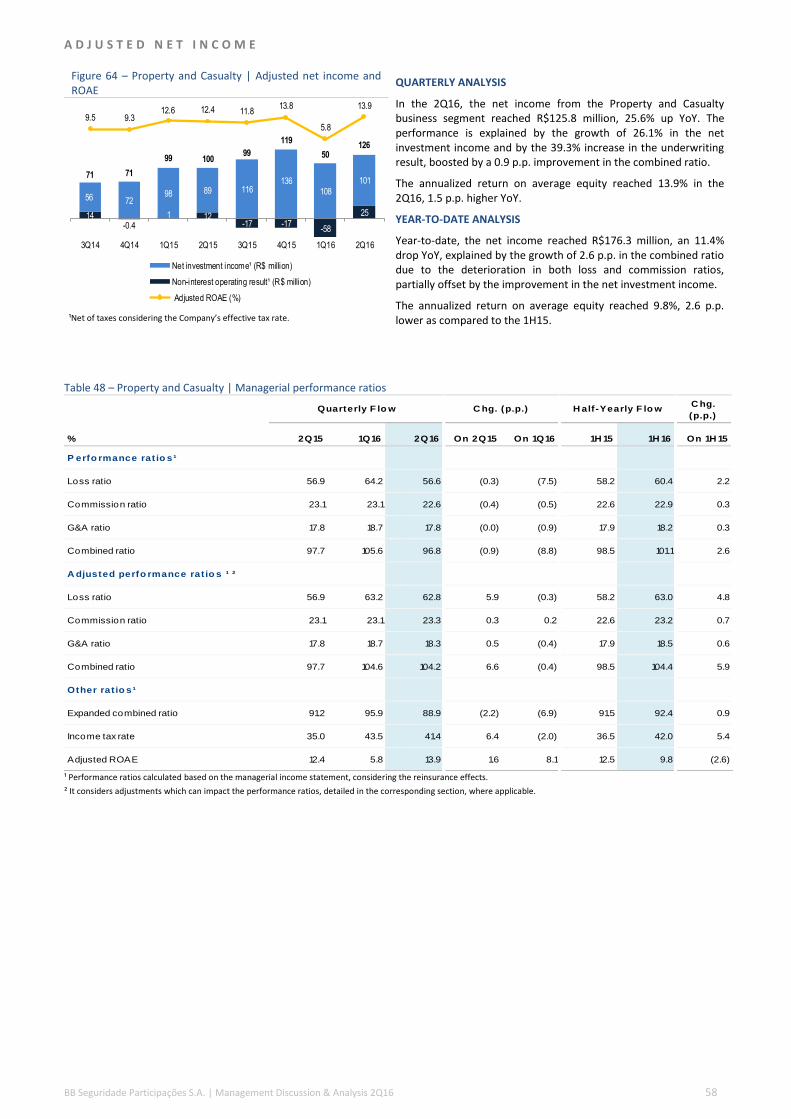
BB Seguridade Participações S.A. | Management Discussion & Analysis 2Q16 58
A D J U S T E D N E T I N C O M E
Figure 64 – Property and Casualty | Adjusted net income and ROAE
QUARTERLY ANALYSIS
In the 2Q16, the net income from the Property and Casualty business segment reached R$125.8 million, 25.6% up YoY. The performance is explained by the growth of 26.1% in the net investment income and by the 39.3% increase in the underwriting result, boosted by a 0.9 p.p. improvement in the combined ratio.
The annualized return on average equity reached 13.9% in the 2Q16, 1.5 p.p. higher YoY.
YEAR-TO-DATE ANALYSIS
Year-to-date, the net income reached R$176.3 million, an 11.4% drop YoY, explained by the growth of 2.6 p.p. in the combined ratio due to the deterioration in both loss and commission ratios, partially offset by the improvement in the net investment income.
The annualized return on average equity reached 9.8%, 2.6 p.p. lower as compared to the 1H15.
¹Net of taxes considering the Company’s effective tax rate.
Table 48 – Property and Casualty | Managerial performance ratios
¹ Performance ratios calculated based on the managerial income statement, considering the reinsurance effects.
² It considers adjustments which can impact the performance ratios, detailed in the corresponding section, where applicable.
14-0.4
1 12-17 -17
-58
25
56 7298 89 116
136108
10171 71
99 10099
119
50126
9.5 9.312.6 12.4 11.8
13.8
5.8
13.9
3Q14 4Q14 1Q15 2Q15 3Q15 4Q15 1Q16 2Q16
Net investment income¹ (R$ million)
Non-interest operating result¹ (R$ million)
Adjusted ROAE (%)
C hg.
(p.p.)
% 2Q15 1Q16 2Q16 On 2Q15 On 1Q16 1H 15 1H 16 On 1H 15
P erfo rmance rat io s¹
Loss ratio 56.9 64.2 56.6 (0.3) (7.5) 58.2 60.4 2.2
Commission ratio 23.1 23.1 22.6 (0.4) (0.5) 22.6 22.9 0.3
G&A ratio 17.8 18.7 17.8 (0.0) (0.9) 17.9 18.2 0.3
Combined ratio 97.7 105.6 96.8 (0.9) (8.8) 98.5 101.1 2.6
A djusted perfo rmance rat io s ¹ ²
Loss ratio 56.9 63.2 62.8 5.9 (0.3) 58.2 63.0 4.8
Commission ratio 23.1 23.1 23.3 0.3 0.2 22.6 23.2 0.7
G&A ratio 17.8 18.7 18.3 0.5 (0.4) 17.9 18.5 0.6
Combined ratio 97.7 104.6 104.2 6.6 (0.4) 98.5 104.4 5.9
Other rat io s¹
Expanded combined ratio 91.2 95.9 88.9 (2.2) (6.9) 91.5 92.4 0.9
Income tax rate 35.0 43.5 41.4 6.4 (2.0) 36.5 42.0 5.4
Adjusted ROAE 12.4 5.8 13.9 1.6 8.1 12.5 9.8 (2.6)
Quarterly F lo w C hg. (p.p.) H alf -Yearly F lo w

BB Seguridade Participações S.A. | Management Discussion & Analysis 2Q16 59
U N D E R W R I T I N G R E S U L T
Figure 65 – Property and Casualty | Underwriting result QUARTERLY ANALYSIS
The underwriting result reached R$62.4 million in the 2Q16, 39.3% up YoY, explained by the 0.9 p.p. improvement in the combined ratio, as a result of lower loss and commission ratios, especially in casualty insurance.
YEAR-TO-DATE ANALYSIS
In the 1H16, the underwriting result came negative in R$42.8 million, against a positive result of R$56.3 million in the 1H15. The performance was impacted by the deterioration of 2.6 p.p. in the combined ratio, explained by the increase in the loss ratio in both auto and casualty insurance segments.
¹Adjustments segregate the effects from the reallocation of the insurance segments, the strengthening and reversions of provision loan losses and the strengthening and reversions of IBNR and IBNER provisions.
N E T I N V E S T M E N T I N C O M E
Figure 66 – Property and Casualty | Net investment income (R$ million)
QUARTERLY ANALYSIS
In the 2Q16, net investment income grew by 26.1% YoY, driven by the increase in the average balance of financial investments as well as a higher return on interest earning assets.
YEAR-TO-DATE ANALYSIS
In the 1H16, net investment income grew by 23.5% as compared to the same period of 2015, justified by the increase in the average balance of financial investments, as well as the higher average yield on interest earning assets.
4019 11
45
-5 -6
-105
6297.8 98.9
100.3
100.3
105.6
96.898.6
100.1 99.497.7
99.0
101.7
104.6
104.2
3Q14 4Q14 1Q15 2Q15 3Q15 4Q15 1Q16 2Q16
Underwriting result (R$ mill ion) Combined ratio (%)
Adjusted combined ratio¹ (%)
92 100
158
136
183
206192
172
3Q14 4Q14 1Q15 2Q15 3Q15 4Q15 1Q16 2Q16
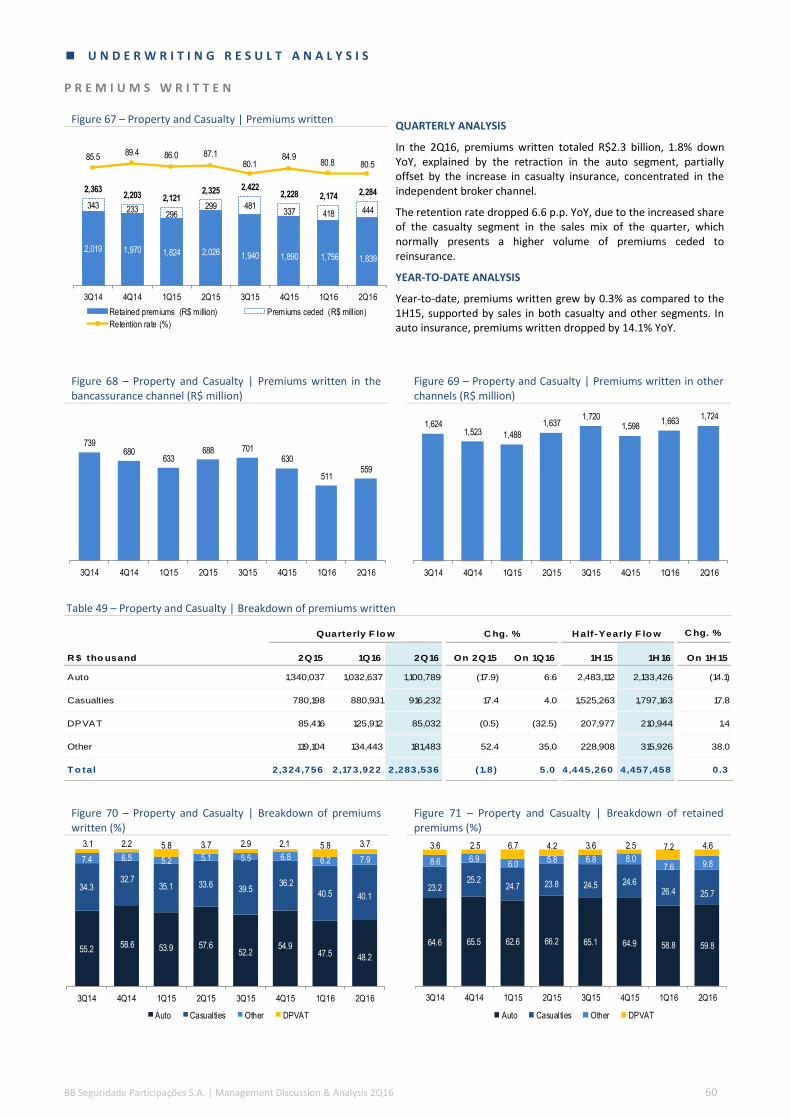
BB Seguridade Participações S.A. | Management Discussion & Analysis 2Q16 60
U N D E R W R I T I N G R E S U L T A N A L Y S I S
P R E M I U M S W R I T T E N
Figure 67 – Property and Casualty | Premiums written QUARTERLY ANALYSIS
In the 2Q16, premiums written totaled R$2.3 billion, 1.8% down YoY, explained by the retraction in the auto segment, partially offset by the increase in casualty insurance, concentrated in the independent broker channel.
The retention rate dropped 6.6 p.p. YoY, due to the increased share of the casualty segment in the sales mix of the quarter, which normally presents a higher volume of premiums ceded to reinsurance.
YEAR-TO-DATE ANALYSIS
Year-to-date, premiums written grew by 0.3% as compared to the 1H15, supported by sales in both casualty and other segments. In auto insurance, premiums written dropped by 14.1% YoY.
Figure 68 – Property and Casualty | Premiums written in the bancassurance channel (R$ million)
Figure 69 – Property and Casualty | Premiums written in other channels (R$ million)
Table 49 – Property and Casualty | Breakdown of premiums written
Figure 70 – Property and Casualty | Breakdown of premiums written (%)
Figure 71 – Property and Casualty | Breakdown of retained premiums (%)
2,019 1,970 1,824 2,026 1,940 1,890 1,756 1,839
343 233296
299 481337 418 444
2,3632,203 2,121
2,325 2,4222,228 2,174 2,284
85.589.4 86.0 87.1
80.184.9
80.8 80.5
3Q14 4Q14 1Q15 2Q15 3Q15 4Q15 1Q16 2Q16
Retained premiums (R$ million) Premiums ceded (R$ mill ion)
Retention rate (%)
739680
633688 701
630
511559
3Q14 4Q14 1Q15 2Q15 3Q15 4Q15 1Q16 2Q16
1,6241,523 1,488
1,6371,720
1,5981,663
1,724
3Q14 4Q14 1Q15 2Q15 3Q15 4Q15 1Q16 2Q16
C hg. %
R $ tho usand 2Q15 1Q16 2Q16 On 2Q15 On 1Q16 1H 15 1H 16 On 1H 15
Auto 1,340,037 1,032,637 1,100,789 (17.9) 6.6 2,483,112 2,133,426 (14.1)
Casualties 780,198 880,931 916,232 17.4 4.0 1,525,263 1,797,163 17.8
DPVAT 85,416 125,912 85,032 (0.5) (32.5) 207,977 210,944 1.4
Other 119,104 134,443 181,483 52.4 35.0 228,908 315,926 38.0
T o tal 2,324,756 2,173,922 2,283,536 (1.8) 5.0 4,445,260 4,457,458 0.3
Quarterly F lo w C hg. % H alf -Yearly F lo w
55.258.6 53.9 57.6
52.254.9
47.5 48.2
34.332.7
35.1 33.639.5
36.240.5 40.1
7.4 6.5 5.2 5.1 5.5 6.8 6.2 7.9
3.1 2.2 5.8 3.7 2.9 2.1 5.8 3.7
3Q14 4Q14 1Q15 2Q15 3Q15 4Q15 1Q16 2Q16
Auto Casualties Other DPVAT
64.6 65.5 62.6 66.2 65.1 64.9 58.8 59.8
23.225.2
24.7 23.8 24.5 24.626.4 25.7
8.6 6.96.0
5.8 6.8 8.07.6 9.8
3.6 2.5 6.7 4.2 3.6 2.5 7.2 4.6
3Q14 4Q14 1Q15 2Q15 3Q15 4Q15 1Q16 2Q16
Auto Casualties Other DPVAT

BB Seguridade Participações S.A. | Management Discussion & Analysis 2Q16 61
C H A N G E S I N T E C H N I C A L R E S E R V E R S - P R E M I U M S
Table 50 – Property and Casualty | Changes in technical reserves – premiums
R E T A I N E D E A R N E D P R E M I U M S
Figure 72 – Property and Casualty | Retained earned premiums (R$ million)
QUARTERLY ANALYSIS
In the 2Q16, retained earned premiums increased by 1.5% YoY, boosted by casualty and other segments, partially offset by the weak performance in auto. Earned premiums were positively impacted in the 2Q16 by a reversal of provisions for unearned premiums, in the total amount of R$58.3 million, as a result of accountability adjustments along with the change in the risk-term of insurance policies hired to cover consortium groups, from yearly to monthly.
YEAR-TO-DATE ANALYSIS
In the 1H16, retained earned premiums grew by 0.6%, boosted by the increase in both casualty and other segments, partially offset by
the weak performance in auto insurance.
Table 51 – Property and Casualty | Breakdown of retained earned premiums
C hg. %
R $ tho usand 2Q15 1Q16 2Q16 On 2Q15 On 1Q16 1H 15 1H 16 On 1H 15
Provision for unearned premiums (126,260) 77,597 60,522 - (22.0) (75,040) 138,120 -
Provision for administrative expenses -
DPVAT(139) (1,072) (138) (1.0) (87.1) (470) (1,209) 157.4
Provision for technical surplus (1,307) (10,824) (715) (45.3) (93.4) (3,105) (11,538) 271.6
C hange in technical reserves -
premiums(127,706) 65,702 59,670 - (9.2) (78,615) 125,372 -
Quarterly F lo w C hg. % H alf -Yearly F lo w
1,794 1,8111,901 1,910 1,860 1,891 1,894 1,939
3Q14 4Q14 1Q15 2Q15 3Q15 4Q15 1Q16 2Q16
C hg. %
R $ tho usand 2Q15 1Q16 2Q16 On 2Q15 On 1Q16 1H 15 1H 16 On 1H 15
Auto 1,237,502 1,156,284 1,143,410 (7.6) (1.1) 2,430,015 2,299,694 (5.4)
Casualties 466,862 472,713 545,791 16.9 15.5 925,119 1,018,504 10.1
DPVAT 85,279 124,840 84,894 (0.5) (32.0) 207,508 209,734 1.1
Other 120,459 139,991 164,720 36.7 17.7 248,637 304,711 22.6
T o tal 1,910,103 1,893,827 1,938,816 1.5 2.4 3,811,279 3,832,643 0.6
Quarterly F lo w C hg. % H alf -Yearly F lo w

BB Seguridade Participações S.A. | Management Discussion & Analysis 2Q16 62
R E T A I N E D C L A I M S
Figure 73 – Property and Casualty | Retained claims QUARTERLY ANALYSIS
In the 2Q16, the loss ratio dropped 0.3 p.p. YoY, driven by the improvement in casualty and other segments, partially offset by the 4.1 p.p. deterioration in the auto insurance.
It is worth noting that the improvement in the loss ratio was positively impacted by:
(i) the R$58.3 million reversal in provisions for unearned premiums, as a result of accountability adjustments and along with a change in the risk-term of insurance policies hired to cover consortium groups, from yearly to monthly; and
¹Adjustments segregate the effects from the strengthening and reversions of IBNR and IBNER provisions.
(ii) the R$83.5 million reversal of IBNER and IBNR provisions, as a result of changes in the methodology of calculation, that began
to incorporate estimates of revenues with salvages, in addition to the increase in claims in the first semester, which led to the
reversals of these provisions, since once reported, claims automatically become part of the provision for claims to be settled.
Setting apart these effects, the loss ratio would have been of 62.8%, 5.9 p.p. higher YoY.
YEAR-TO-DATE ANALYSIS
In the 1H16, the loss ratio worsened by 2.2 p.p. as compared to the same period of 2015, justified by the increase in claims in both auto
and casualty segments, partially offset by the improvement in the loss ratio in the other segment.
In the semester, in addition to the reversals mentioned in the quarterly analysis, the IBNR and IBNER provisions were strengthened by
R$18.5 million in the first quarter, with an impact in the loss ratio. Setting apart these effects, the loss ratio would have been of 63.0%,
4.8 p.p. higher as compared to the 1H15.
Table 52 – Property and Casualty | Breakdown of retained claims
1,009 1,0421,131 1,087 1,064 1,045
1,2151,098
55.3
64.2
56.6
56.2 57.659.5
56.9 57.2 58.063.2
62.8
3Q14 4Q14 1Q15 2Q15 3Q15 4Q15 1Q16 2Q16
Retained claims (R$ million) Loss ratio (%)
Adjusted loss ratio¹ (%)
C hg. %
R $ tho usand 2Q15 1Q16 2Q16 On 2Q15 On 1Q16 1H 15 1H 16 On 1H 15
C laims incurred (1,253,277) (1,297,163) (1,286,608) 2.7 (0.8) (2,672,964) (2,583,772) (3.3)
Expenses with claims (1,300,085) (1,260,705) (1,387,052) 6.7 10.0 (2,728,792) (2,647,757) (3.0)
Changes in provisions for claims IBNR (34,347) (70,971) (25,214) (26.6) (64.5) (46,265) (96,186) 107.9
Changes in provisions for claims IBNER 11,758 (25,448) 20,837 77.2 - (31,730) (4,612) (85.5)
Changes of expenses related to IBNR (126) (23) 116 - - 101 93 (7.7)
Recovery of claims - Coinsurance 17,134 14,051 (19,193) - - 22,665 (5,142) -
Recovery of claims - Reinsurance 166,444 81,910 188,387 13.2 130.0 454,708 270,297 (40.6)
Salvage 70,840 77,840 92,577 30.7 18.9 152,935 170,418 11.4
Reimbursements 26,510 35,051 37,535 41.6 7.1 50,819 72,586 42.8
Change in estimates of salvaged and
reimbursement12,575 198 58,599 366.0 29,530.1 26,721 58,797 120.0
Assistance services (57,535) (67,156) (64,814) 12.7 (3.5) (119,417) (131,969) 10.5
R etained claims (1,086,833) (1,215,253) (1,098,222) 1.0 (9.6) (2,218,257) (2,313,475) 4.3
A djustments - 18,518 (83,506) - - - (64,988) -
Strengthening of IBNR and IBNER
provisions- 18,518 - - - - 18,518 -
Reversal of IBNR and IBNER provisions - - (83,506) - - - (83,506) -
A djusted retained claims (1,086,833) (1,196,735) (1,181,728) 8.7 (1.3) (2,218,257) (2,378,463) 7.2
Quarterly F lo w C hg. % H alf -Yearly F lo w

BB Seguridade Participações S.A. | Management Discussion & Analysis 2Q16 63
A C Q U I S I T I O N C O S T S
Figure 74 – Property and Casualty | Acquisition costs QUARTERLY ANALYSIS
In the 2Q16, the commission ratio dropped by 0.5 p.p. YoY. The improvement was concentrated in the bancassurance channel, partially offset by the deterioration in the independent broker channel.
Setting apart the effect of the reversal of the provision for unearned premiums, amounting to R$58.3 million, the commission ratio would have been of 23.3%, 0.2 p.p. higher as compared to the 2Q15, explained by the increase in the independent broker channel as well as the increased share of the casualty segment in the sales mix, which present higher commission ratio when compared to the other segments.
YEAR-TO-DATE ANALYSIS
In the 1H16, the commission ratio increased by 0.3 p.p. as compared to the 1H15. When adjusting the ratio by the reversal of the
provision for unearned premiums, the increase would have been of 0.7 p.p. The performance is explained by the increase in the
commission ratio for the independent broker channel, as well as the increased share of the casualty segment in the sales mix, which
present a higher commission ratio when compared to other segments.
Table 53 – Property and Casualty | Acquisition costs
400428 419 441 443 429 438 439
22.323.6
22.023.1 23.8
22.7 23.1 22.6
3Q14 4Q14 1Q15 2Q15 3Q15 4Q15 1Q16 2Q16
Acquisition costs (R$ million) Commission ratio (%)
C hg. %
R $ tho usand 2Q15 1Q16 2Q16 On 2Q15 On 1Q16 1H 15 1H 16 On 1H 15
Comission charged on premiums written (342,310) (316,722) (323,496) (5.5) 2.1 (650,881) (640,218) (1.6)
Agency commission (40,414) (30,521) (47,410) 17.3 55.3 (66,665) (77,931) 16.9
Commissions recovered - Coinsurance 844 1,545 344 (59.2) (77.7) 1,939 1,889 (2.6)
Change in deferred acquisition costs 12,716 (32,672) (15,042) - (54.0) (5,085) (47,714) 838.3
Other acquisition costs (71,724) (59,533) (53,202) (25.8) (10.6) (138,880) (112,734) (18.8)
A cquisit io n co sts (440,888) (437,902) (438,806) (0.5) 0.2 (859,572) (876,708) 2.0
Quarterly F lo w C hg. % H alf -Yearly F lo w

BB Seguridade Participações S.A. | Management Discussion & Analysis 2Q16 64
G E N E R A L & A D M I N I S T R A T I V E E X P E N S E S
Figure 75 – Property and Casualty | G&A expenses QUARTERLY ANALYSIS
In the 2Q16, the G&A ratio remained flat as compared to the same
period of 2015. Segregating the effect of the reversal of provision
for unearned premiums, which boosted the earned premiums in
the period, the ratio would have reached 18.3%, 0.5 p.p. higher
YoY. The increase in the G&A ratio is largely explained by higher
expenses with outsourcing and charging.
YEAR-TO-DATE ANALYSIS
In the 1H16, the G&A ratio came 0.3 p.p. higher YoY, due to the increase in the administrative expenses line, mostly given to the growth in location and operation expenses due to higher rental costs.
¹Adjustments segregate the effects from the reallocation of the insurance segments and the strengthening and reversions of provisions for loan losses.
Table 54 – Property and Casualty | General & Administrative expenses
214 214 224 222 226 242 242 223
89 61 66 74103
12368 75
4448 52 44
4060
43 46
346323
343340
369
426
354 344
19.317.8 18.0
17.819.8
22.5
18.7
17.8
20.1 19.0
18.6
21.218.3
3Q14 4Q14 1Q15 2Q15 3Q15 4Q15 1Q16 2Q16
Tax expenses (R$ million)
Other operating income (expenses) (R$ million)
Administrative expenses (R$ million)
G&A ratio (%)
Adjusted G&A ratio¹ (%)
C hg. %
R $ tho usand 2Q15 1Q16 2Q16 On 2Q15 On 1Q16 1H 15 1H 16 On 1H 15
A dministrat ive expenses (222,134) (242,247) (222,897) 0.3 (8.0) (446,384) (465,142) 4.2
Personnel (123,744) (126,815) (115,597) (6.6) (8.8) (241,453) (242,412) 0.4
Outsourcing (43,338) (48,718) (47,824) 10.4 (1.8) (93,012) (96,542) 3.8
Location and operation (52,865) (62,082) (54,687) 3.4 (11.9) (102,629) (116,769) 13.8
Institutional advertisement and publicity (4,324) (1,942) (3,271) (24.4) 68.4 (6,985) (5,212) (25.4)
Releases (238) (647) (46) (80.9) (93.0) (832) (693) (16.7)
Other administrative expenses 2,376 (2,043) (1,472) - (27.9) (1,472) (3,513) 138.6
Other o perat ing inco me (expenses) (73,777) (67,896) (75,411) 2.2 11.1 (139,954) (143,307) 2.4
FESR contributions - 0 2 - 455.5 - 2 -
Charging expenses (6,300) (12,784) (9,828) 56.0 (23.1) (15,202) (22,613) 48.8
Civil contingencies 4,276 (2,051) 4,984 16.6 - (3,642) 2,933 -
Events expenses (4,000) (430) (3,825) (4.4) 789.3 (7,012) (4,255) (39.3)
Endomarketing (3,680) (14) (4,628) 25.8 31,970.8 (3,683) (4,643) 26.0
Social contributions (668) (325) - - - (1,366) (325) (76.2)
Impairment (8,867) (17,200) (4,015) (54.7) (76.7) (13,564) (21,215) 56.4
Other operating income (expenses) (54,539) (35,091) (58,101) 6.5 65.6 (95,485) (93,192) (2.4)
T ax expenses (43,629) (43,462) (45,919) 5.2 5.7 (95,818) (89,381) (6.7)
COFINS (34,291) (32,638) (35,040) 2.2 7.4 (75,385) (67,679) (10.2)
PIS (5,661) (5,391) (5,552) (1.9) 3.0 (12,419) (10,943) (11.9)
Inspection fee (2,112) (2,779) (2,779) 31.6 0.0 (4,225) (5,558) 31.6
Other tax expenses (1,565) (2,654) (2,548) 62.8 (4.0) (3,789) (5,202) 37.3
G&A (339,541) (353,606) (344,226) 1.4 (2.7) (682,157) (697,830) 2.3
Quarterly F lo w C hg. % H alf -Yearly F lo w

BB Seguridade Participações S.A. | Management Discussion & Analysis 2Q16 65
Auto Insurance
Table 55 – Auto Insurance | Key figures
QUARTERLY ANALYSIS
In the 2Q16, auto insurance premiums written amounted to R$1.1 billion, 17.9% down YoY, largely impacted by the reduction in the
sales of brand new cars, which resulted in the 8.0% drop in the insured fleet. The fall in premiums written was also impacted by the
sales mix of the 2Q15, when the increased sales of the multi-annual modality anticipated part of the 2016 issuances.
YEAR-TO-DATE ANALYSIS
In the 1H16, premiums written dropped by 14.1% YoY, impacted by the reduction in the sales of brand new cars along with the fact that
the 1H15 sales mix presented increased sales of the multi-annual modality in the bancassurance channel, which anticipated part of the
2016 issuances.
Figure 76 – Auto Insurance | Premiums written (R$ million) Figure 77 – Auto Insurance | Insured fleet (thousand)
Figure 78 – Auto Insurance | Premiums written in bancassurance channel (R$ million)
Figure 79 – Auto Insurance | Premiums written in other channels (R$ million)
C hg. %
R $ tho usand 2Q15 1Q16 2Q16 On 2Q15 On 1Q16 1H 15 1H 16 On 1H 15
P remiums writ ten 1,340,037 1,032,637 1,100,789 (17.9) 6.6 2,483,112 2,133,426 (14.1)
Premiums ceded to reinsurance (104) (790) 4 - - (1,412) (786) (44.3)
R etained premiums 1,339,934 1,031,847 1,100,793 (17.8) 6.7 2,481,700 2,132,640 (14.1)
Changes in technical reserves - premiums (102,431) 124,436 42,617 - (65.8) (51,685) 167,053 -
Earned premiuns 1,237,502 1,156,284 1,143,410 (7.6) (1.1) 2,430,015 2,299,694 (5.4)
Retained claims (769,788) (826,216) (757,778) (1.6) (8.3) (1,547,702) (1,583,994) 2.3
Acquisition costs (208,215) (203,686) (192,229) (7.7) (5.6) (401,084) (395,914) (1.3)
Underwrit ing margin 259,500 126,382 193,403 (25.5) 53.0 481,230 319,785 (33.5)
Quarterly F lo w C hg. % H alf -Yearly F lo w
1,305 1,2901,143
1,3401,263 1,223
1,0331,101
3Q14 4Q14 1Q15 2Q15 3Q15 4Q15 1Q16 2Q16
2,825 2,870 2,879 2,889 2,850 2,806 2,759 2,659
3Q14 4Q14 1Q15 2Q15 3Q15 4Q15 1Q16 2Q16
551 532
473513 527
460
376403
3Q14 4Q14 1Q15 2Q15 3Q15 4Q15 1Q16 2Q16
754 758
670
827
736763
657697
3Q14 4Q14 1Q15 2Q15 3Q15 4Q15 1Q16 2Q16

BB Seguridade Participações S.A. | Management Discussion & Analysis 2Q16 66
Figure 80 – Auto Insurance | Underwriting margin (R$ million) Figure 81 – Auto Insurance | Underwriting margin by distribution channel (%)
QUARTERLY ANALYSIS
In the 2Q16, the underwriting margin in the auto segment dropped by 4.1 p.p. YoY. The retraction is explained by the increase in the
loss ratio, as a result of the higher frequency of robbery and theft in the period. The commission ratio remained stable presenting a 0.5
p.p. increase in the independent broker channel which was offset by the 1.0 p.p. drop in the bancassurance channel.
YEAR-TO-DATE ANALYSIS
Year-to-date, the underwriting margin reached 13.9%, 5.9 p.p. down as compared to the 1H15, justified by the 5.2 p.p. increase in the
loss ratio, largely explained by the higher frequency of theft and robbery in the period.
In the 1H16, the commission ratio reached 17.2%, 0.7 p.p. up YoY, concentrated in the independent broker channel.
Figure 82 – Auto Insurance | Loss ratio (%) Figure 83 – Auto Insurance | Commission ratio (%)
210196
222
259
209
264
126
193
3Q14 4Q14 1Q15 2Q15 3Q15 4Q15 1Q16 2Q16
18.216.5
18.621.0
17.4
21.3
10.9
16.9
28.0
22.523.9
26.3 25.7
31.6
19.4
22.6
11.6 12.715.1
17.7
12.015.0
5.9
13.6
3Q14 4Q14 1Q15 2Q15 3Q15 4Q15 1Q16 2Q16
Total Bancassurance Other channels
65.665.4 65.2
62.265.1
61.2
71.5
66.3
61.8 65.0
60.562.0
56.8
68.4
65.2
68.165.5 65.4
63.3
67.1
63.9
73.2
66.9
3Q14 4Q14 1Q15 2Q15 3Q15 4Q15 1Q16 2Q16
Total Bancassurance Other channels
16.3
18.0
16.216.8 17.5 17.5 17.6
16.8
10.2
12.111.1
13.212.3 11.6 12.2 12.2
20.321.9
19.5 19.020.8 21.1 20.8
19.5
3Q14 4Q14 1Q15 2Q15 3Q15 4Q15 1Q16 2Q16
Total Bancassurance Other channels

BB Seguridade Participações S.A. | Management Discussion & Analysis 2Q16 67
Casualty Insurance
Table 56 – Casualty Insurance | Key figures
QUARTERLY ANALYSIS
In the 2Q16, casualty insurance premiums written amounted to R$916.2 million, 17.4% up YoY, boosted by higher sales of large risks
insurance in the independent broker channel. The premiums written in the bancassurance channel decreased 11.0% YoY.
YEAR-TO-DATE ANALYSIS
In the 1H16, casualty insurance premiums written amounted to R$1.8 billion, 17.8% higher as compared to the 1H15, concentrated in
the independent broker channel which grew 26.4%. In the semester, premiums in the bancassurance channel decreased 12.9%.
Figure 84 – Casualty Insurance | Premiums written (R$ million) Figure 85 – Casualty Insurance | Breakdown of premiums written (%)
Figure 86 – Casualty Insurance | Premiums written in bancassurance channel (R$ million)
Figure 87 – Casualty Insurance | Premiums written in other channels (R$ million)
C hg. %
R $ tho usand 2Q15 1Q16 2Q16 On 2Q15 On 1Q16 1H 15 1H 16 On 1H 15
P remiums writ ten 780,198 880,931 916,232 17.4 4.0 1,525,263 1,797,163 17.8
Premiums ceded to reinsurance (298,408) (416,862) (443,907) 48.8 6.5 (592,900) (860,769) 45.2
R etained premiums 481,790 464,068 472,325 (2.0) 1.8 932,363 936,394 0.4
Changes in technical reserves - premiums (14,928) 8,644 73,466 - 749.9 (7,244) 82,110 -
Earned premiuns 466,862 472,713 545,791 16.9 15.5 925,119 1,018,504 10.1
Retained claims (209,904) (249,639) (235,022) 12.0 (5.9) (417,552) (484,661) 16.1
Acquisition costs (169,577) (180,402) (193,138) 13.9 7.1 (318,187) (373,540) 17.4
Underwrit ing margin 87,381 42,671 117,631 34.6 175.7 189,380 160,302 (15.4)
Quarterly F lo w C hg. % H alf -Yearly F lo w
811
720 745780
956
805881
916
3Q14 4Q14 1Q15 2Q15 3Q15 4Q15 1Q16 2Q16
77.0 79.7 78.7 77.7 81.9 79.084.7 83.1
23.0 20.3 21.3 22.3 18.1 21.015.3 16.9
3Q14 4Q14 1Q15 2Q15 3Q15 4Q15 1Q16 2Q16
Other channels Bancassurance
187
146159
174 173 169
135
155
3Q14 4Q14 1Q15 2Q15 3Q15 4Q15 1Q16 2Q16
625574 586 606
783
636
746 762
3Q14 4Q14 1Q15 2Q15 3Q15 4Q15 1Q16 2Q16
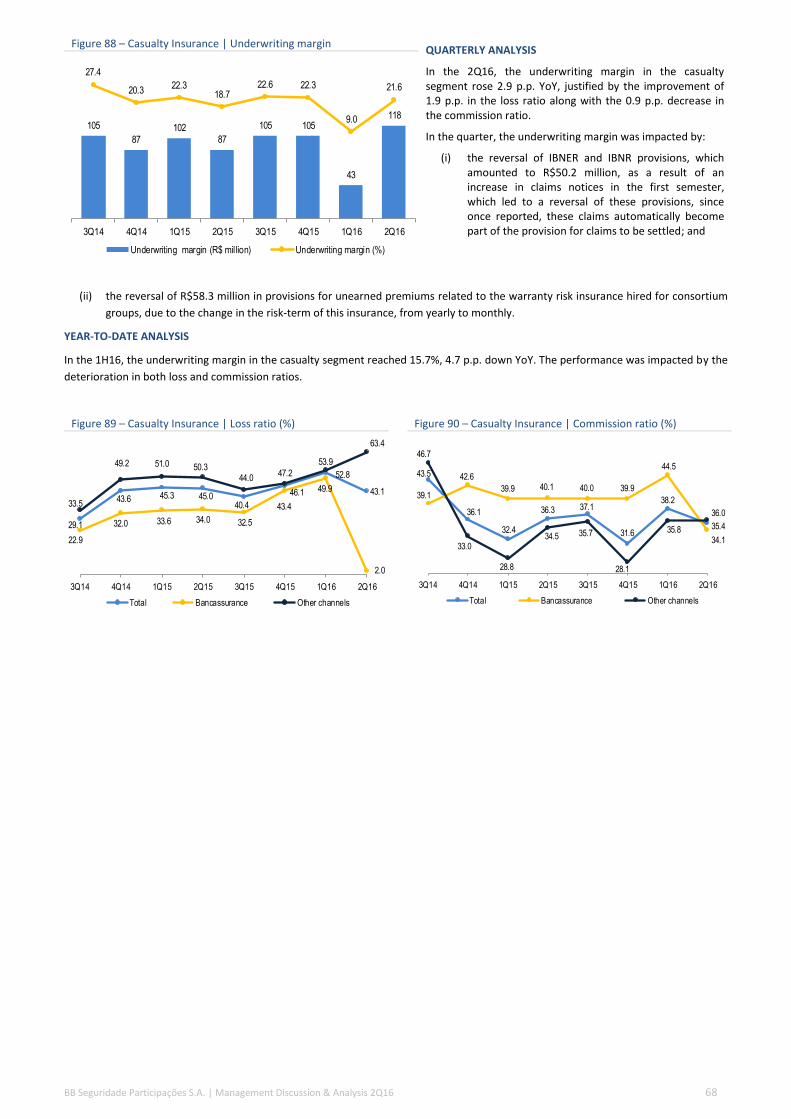
BB Seguridade Participações S.A. | Management Discussion & Analysis 2Q16 68
Figure 88 – Casualty Insurance | Underwriting margin QUARTERLY ANALYSIS
In the 2Q16, the underwriting margin in the casualty segment rose 2.9 p.p. YoY, justified by the improvement of 1.9 p.p. in the loss ratio along with the 0.9 p.p. decrease in the commission ratio.
In the quarter, the underwriting margin was impacted by:
(i) the reversal of IBNER and IBNR provisions, which amounted to R$50.2 million, as a result of an increase in claims notices in the first semester, which led to a reversal of these provisions, since once reported, these claims automatically become part of the provision for claims to be settled; and
(ii) the reversal of R$58.3 million in provisions for unearned premiums related to the warranty risk insurance hired for consortium
groups, due to the change in the risk-term of this insurance, from yearly to monthly.
YEAR-TO-DATE ANALYSIS
In the 1H16, the underwriting margin in the casualty segment reached 15.7%, 4.7 p.p. down YoY. The performance was impacted by the
deterioration in both loss and commission ratios.
Figure 89 – Casualty Insurance | Loss ratio (%) Figure 90 – Casualty Insurance | Commission ratio (%)
105
87
10287
105 105
43
118
27.4
20.322.3
18.722.6 22.3
9.0
21.6
3Q14 4Q14 1Q15 2Q15 3Q15 4Q15 1Q16 2Q16
Underwriting margin (R$ million) Underwriting margin (%)
29.1
43.6 45.3 45.040.4
46.1
52.8
43.1
22.9
32.0 33.6 34.0 32.5
43.4
49.9
2.0
33.5
49.2 51.0 50.344.0
47.2
53.9
63.4
3Q14 4Q14 1Q15 2Q15 3Q15 4Q15 1Q16 2Q16
Total Bancassurance Other channels
43.5
36.1
32.4
36.3 37.1
31.6
38.2
35.4
39.1
42.6
39.9 40.1 40.0 39.9
44.5
34.1
46.7
33.0
28.8
34.5 35.7
28.1
35.8
36.0
3Q14 4Q14 1Q15 2Q15 3Q15 4Q15 1Q16 2Q16
Total Bancassurance Other channels

BB Seguridade Participações S.A. | Management Discussion & Analysis 2Q16 69
DPVAT
Table 57 – DPVAT | Key figures
Other
Table 58 – Other | Key figures
C hg. %
R $ tho usand 2Q15 1Q16 2Q16 On 2Q15 On 1Q16 1H 15 1H 16 On 1H 15
P remiums writ ten 85,416 125,912 85,032 (0.5) (32.5) 207,977 210,944 1.4
R etained premiums 85,416 125,912 85,032 (0.5) (32.5) 207,977 210,944 1.4
Changes in technical reserves - premiums (137) (1,072) (138) 0.5 (87.1) (469) (1,209) 158.0
Earned premiuns 85,279 124,840 84,894 (0.5) (32.0) 207,508 209,734 1.1
Retained claims (74,798) (108,879) (72,582) (3.0) (33.3) (182,800) (181,462) (0.7)
Acquisition costs (1,244) (1,763) (1,191) (4.2) (32.5) (2,941) (2,954) 0.4
Underwrit ing margin 9,238 14,198 11,121 20.4 (21.7) 21,767 25,319 16.3
Quarterly F lo w C hg. % H alf -Yearly F lo w
C hg. %
R $ tho usand 2Q15 1Q16 2Q16 On 2Q15 On 1Q16 1H 15 1H 16 On 1H 15
P remiums writ ten 119,104 134,443 181,483 52.4 35.0 228,908 315,926 38.0
Premiums ceded to reinsurance (669) (457) (377) (43.7) (17.6) (1,038) (834) (19.7)
R etained premiums 118,434 133,986 181,106 52.9 35.2 227,870 315,092 38.3
Changes in technical reserves - premiums 2,025 6,005 (16,386) - - 20,768 (10,381) -
Earned premiuns 120,459 139,991 164,720 36.7 17.7 248,637 304,711 22.6
Retained claims (32,343) (30,518) (32,839) 1.5 7.6 (70,203) (63,358) (9.8)
Acquisition costs (61,852) (52,051) (52,249) (15.5) 0.4 (137,360) (104,300) (24.1)
Underwrit ing margin 26,263 57,422 79,632 203.2 38.7 41,073 137,054 233.7
Quarterly F lo w C hg. % H alf -Yearly F lo w

BB Seguridade Participações S.A. | Management Discussion & Analysis 2Q16 70
N E T I N V E S T M E N T I N C O M E
Figure 91 – Property and Casualty | Financial investments return over the CDI¹ (%)
QUARTERLY ANALYSIS
In the 2Q16, the net investment income grew by 26.1% YoY, driven by the higher average return on interest earning assets as well as the higher average balance of financial investments. The increase in the average yield is directly linked to a higher average Selic rate, partially offset by lower inflation indexes, which negatively impacted the yield on inflation protected securities classified as held to maturity.
YEAR-TO-DATE ANALYSIS
In the 1H16, net investment income grew by 23.5%, justified by the expansion in the average balance of financial investments as well as the higher yield on interest earning assets.
¹Change calculated based on the daily Selic rate and the daily return measured on the company´s financial investments, net of management fee.
Table 59 – Property and Casualty | Financial investments portfolio
Figure 92 – Property and Casualty | Breakdown of financial investments by index (%)
Figure 93 – Property and Casualty | Breakdown of mark to market financial investments by index (%)
93.3 98.6
130.6
106.097.3
106.8 102.9 101.7
3Q14 4Q14 1Q15 2Q15 3Q15 4Q15 1Q16 2Q16
R $ tho usand Jun/ 15 M ar/ 16 Jun/ 16 On Jun/ 15 On M ar/ 16
T rading 1,473,121 1,696,184 2,331,329 58.3 37.4
Pre-fixed 154,123 - - - -
Floating 820,425 1,086,513 1,745,520 112.8 60.7
Inflation 441 451 490 11.3 8.9
Other 498,133 609,221 585,319 17.5 (3.9)
A vailable fo r sale 1,074,726 1,184,966 595,864 (44.6) (49.7)
Pre-fixed 158,733 183,216 92,667 (41.6) (49.4)
Floating 198,482 305,373 389,982 96.5 27.7
Inflation 637,740 640,832 67,841 (89.4) (89.4)
Other 79,771 55,544 45,374 (43.1) (18.3)
H eld to maturity securit ies 1,522,357 1,561,836 1,646,356 8 .1 5.4
Pre-fixed 633,703 617,914 631,198 (0.4) 2.1
Floating 121,586 134,806 183,261 50.7 35.9
Inflation 767,068 809,117 831,896 8.5 2.8
T o tal 4,070,204 4 ,442,987 4 ,573,549 12.4 2.9
B alance C hg. %
44.637.5 29.1
28.0 28.726.5
34.450.7
20.024.4
22.8 23.3 19.3 20.3
18.0
15.8
18.5 23.933.8 34.5 37.8 38.9 32.6
19.7
16.8 14.2 14.3 14.2 14.2 14.3 15.0 13.8
Sep/14 Dec/14 Mar/15 Jun/15 Sep/15 Dec/15 Mar/16 Jun/16
Floating Pre-fixed Inflation Others
62.352.3 40.9
40.0 40.036.7
48.3
73.0
9.515.3
11.5 12.3 7.3 8.8
6.4
3.22.5 10.4
24.6 25.030.6 32.2
22.3 2.3
25.7 22.0 23.0 22.7 22.1 22.3 23.1 21.5
Sep/14 Dec/14 Mar/15 Jun/15 Sep/15 Dec/15 Mar/16 Jun/16
Floating Pre-fixed Inflation Others
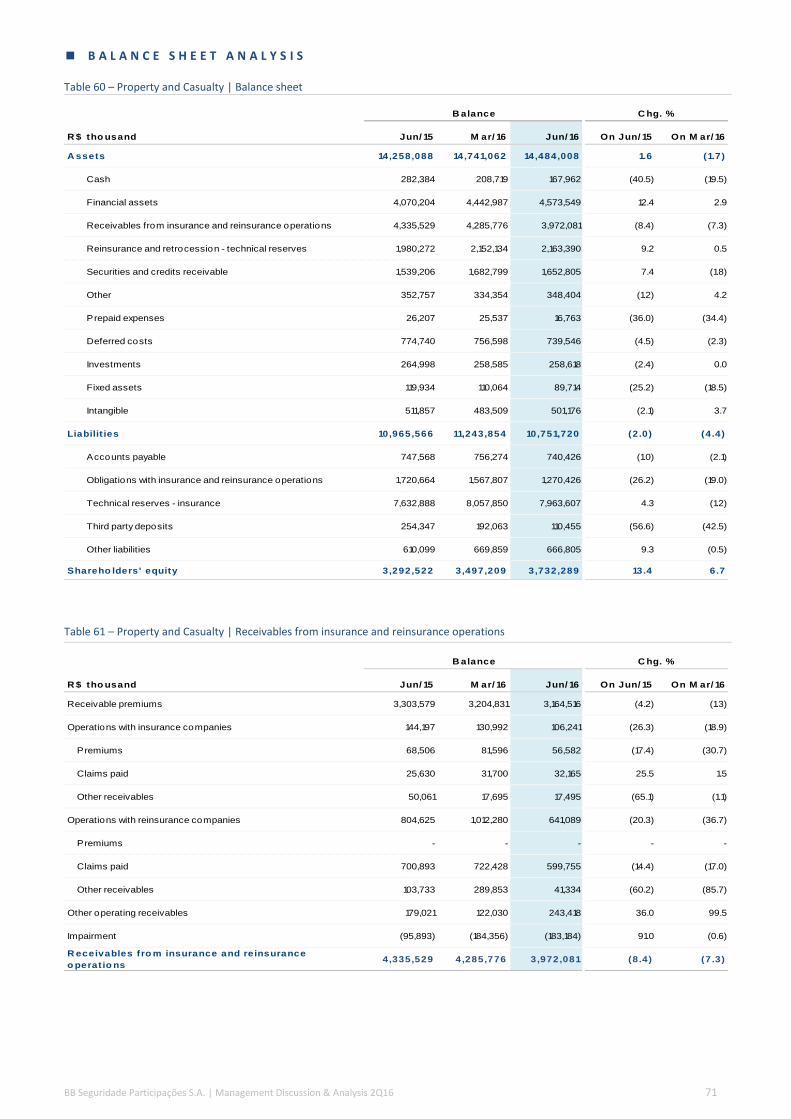
BB Seguridade Participações S.A. | Management Discussion & Analysis 2Q16 71
B A L A N C E S H E E T A N A L Y S I S
Table 60 – Property and Casualty | Balance sheet
Table 61 – Property and Casualty | Receivables from insurance and reinsurance operations
R $ tho usand Jun/ 15 M ar/ 16 Jun/ 16 On Jun/ 15 On M ar/ 16
A ssets 14,258,088 14,741,062 14,484,008 1.6 (1.7)
Cash 282,384 208,719 167,962 (40.5) (19.5)
Financial assets 4,070,204 4,442,987 4,573,549 12.4 2.9
Receivables from insurance and reinsurance operations 4,335,529 4,285,776 3,972,081 (8.4) (7.3)
Reinsurance and retrocession - technical reserves 1,980,272 2,152,134 2,163,390 9.2 0.5
Securities and credits receivable 1,539,206 1,682,799 1,652,805 7.4 (1.8)
Other 352,757 334,354 348,404 (1.2) 4.2
Prepaid expenses 26,207 25,537 16,763 (36.0) (34.4)
Deferred costs 774,740 756,598 739,546 (4.5) (2.3)
Investments 264,998 258,585 258,618 (2.4) 0.0
Fixed assets 119,934 110,064 89,714 (25.2) (18.5)
Intangible 511,857 483,509 501,176 (2.1) 3.7
Liabilit ies 10,965,566 11,243,854 10,751,720 (2.0) (4.4)
Accounts payable 747,568 756,274 740,426 (1.0) (2.1)
Obligations with insurance and reinsurance operations 1,720,664 1,567,807 1,270,426 (26.2) (19.0)
Technical reserves - insurance 7,632,888 8,057,850 7,963,607 4.3 (1.2)
Third party deposits 254,347 192,063 110,455 (56.6) (42.5)
Other liabilities 610,099 669,859 666,805 9.3 (0.5)
Shareho lders' equity 3,292,522 3,497,209 3,732,289 13.4 6.7
B alance C hg. %
R $ tho usand Jun/ 15 M ar/ 16 Jun/ 16 On Jun/ 15 On M ar/ 16
Receivable premiums 3,303,579 3,204,831 3,164,516 (4.2) (1.3)
Operations with insurance companies 144,197 130,992 106,241 (26.3) (18.9)
Premiums 68,506 81,596 56,582 (17.4) (30.7)
Claims paid 25,630 31,700 32,165 25.5 1.5
Other receivables 50,061 17,695 17,495 (65.1) (1.1)
Operations with reinsurance companies 804,625 1,012,280 641,089 (20.3) (36.7)
Premiums - - - - -
Claims paid 700,893 722,428 599,755 (14.4) (17.0)
Other receivables 103,733 289,853 41,334 (60.2) (85.7)
Other operating receivables 179,021 122,030 243,418 36.0 99.5
Impairment (95,893) (184,356) (183,184) 91.0 (0.6)
R eceivables fro m insurance and reinsurance
o perat io ns4,335,529 4,285,776 3,972,081 (8.4) (7.3)
B alance C hg. %
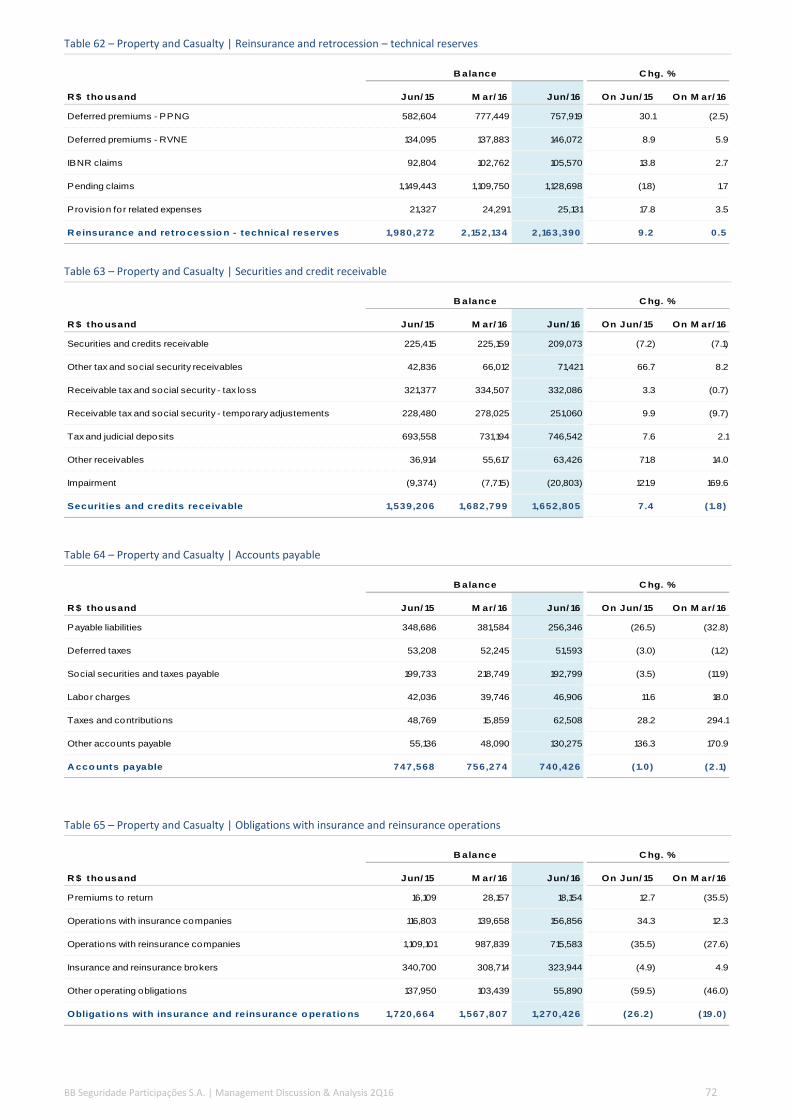
BB Seguridade Participações S.A. | Management Discussion & Analysis 2Q16 72
Table 62 – Property and Casualty | Reinsurance and retrocession – technical reserves
Table 63 – Property and Casualty | Securities and credit receivable
Table 64 – Property and Casualty | Accounts payable
Table 65 – Property and Casualty | Obligations with insurance and reinsurance operations
R $ tho usand Jun/ 15 M ar/ 16 Jun/ 16 On Jun/ 15 On M ar/ 16
Deferred premiums - PPNG 582,604 777,449 757,919 30.1 (2.5)
Deferred premiums - RVNE 134,095 137,883 146,072 8.9 5.9
IBNR claims 92,804 102,762 105,570 13.8 2.7
Pending claims 1,149,443 1,109,750 1,128,698 (1.8) 1.7
Provision for related expenses 21,327 24,291 25,131 17.8 3.5
R einsurance and retro cessio n - technical reserves 1,980,272 2,152,134 2,163,390 9.2 0.5
B alance C hg. %
R $ tho usand Jun/ 15 M ar/ 16 Jun/ 16 On Jun/ 15 On M ar/ 16
Securities and credits receivable 225,415 225,159 209,073 (7.2) (7.1)
Other tax and social security receivables 42,836 66,012 71,421 66.7 8.2
Receivable tax and social security - tax loss 321,377 334,507 332,086 3.3 (0.7)
Receivable tax and social security - temporary adjustements 228,480 278,025 251,060 9.9 (9.7)
Tax and judicial deposits 693,558 731,194 746,542 7.6 2.1
Other receivables 36,914 55,617 63,426 71.8 14.0
Impairment (9,374) (7,715) (20,803) 121.9 169.6
Securit ies and credits receivable 1,539,206 1,682,799 1,652,805 7.4 (1.8)
B alance C hg. %
R $ tho usand Jun/ 15 M ar/ 16 Jun/ 16 On Jun/ 15 On M ar/ 16
Payable liabilities 348,686 381,584 256,346 (26.5) (32.8)
Deferred taxes 53,208 52,245 51,593 (3.0) (1.2)
Social securities and taxes payable 199,733 218,749 192,799 (3.5) (11.9)
Labor charges 42,036 39,746 46,906 11.6 18.0
Taxes and contributions 48,769 15,859 62,508 28.2 294.1
Other accounts payable 55,136 48,090 130,275 136.3 170.9
A cco unts payable 747,568 756,274 740,426 (1.0) (2.1)
B alance C hg. %
R $ tho usand Jun/ 15 M ar/ 16 Jun/ 16 On Jun/ 15 On M ar/ 16
Premiums to return 16,109 28,157 18,154 12.7 (35.5)
Operations with insurance companies 116,803 139,658 156,856 34.3 12.3
Operations with reinsurance companies 1,109,101 987,839 715,583 (35.5) (27.6)
Insurance and reinsurance brokers 340,700 308,714 323,944 (4.9) 4.9
Other operating obligations 137,950 103,439 55,890 (59.5) (46.0)
Obligat io ns with insurance and reinsurance o perat io ns 1,720,664 1,567,807 1,270,426 (26.2) (19.0)
B alance C hg. %
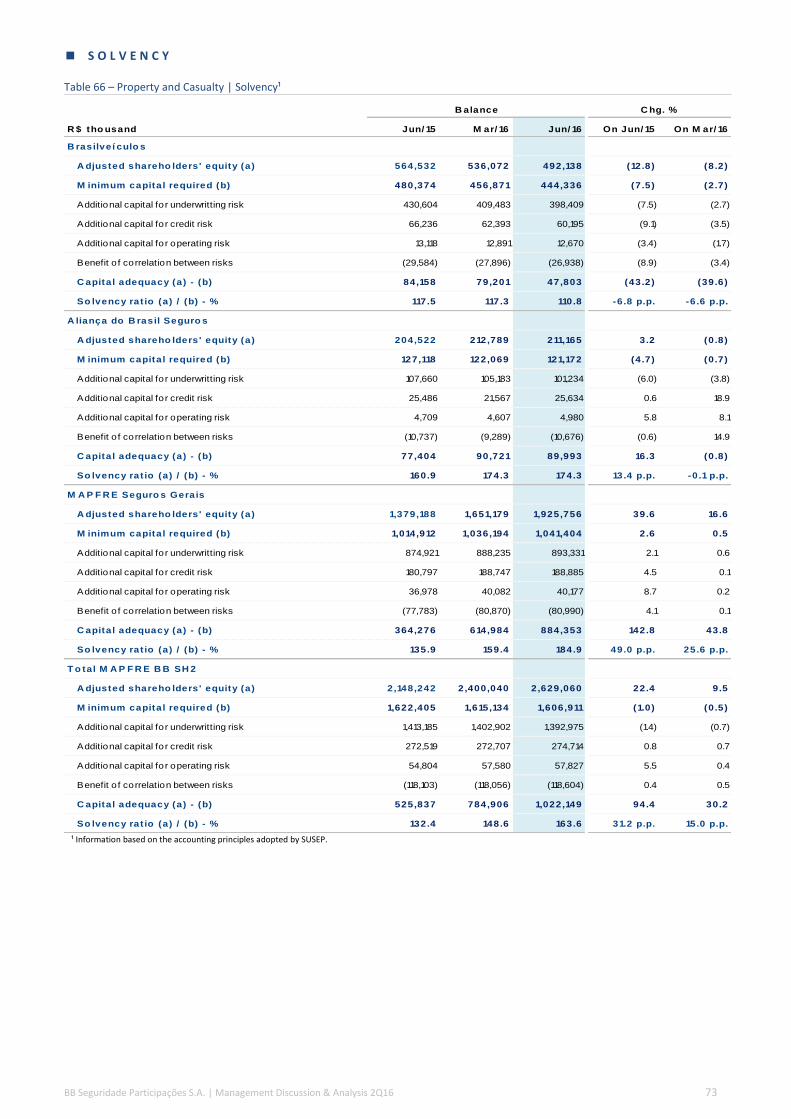
BB Seguridade Participações S.A. | Management Discussion & Analysis 2Q16 73
S O L V E N C Y
Table 66 – Property and Casualty | Solvency¹
¹ Information based on the accounting principles adopted by SUSEP.
R $ tho usand Jun/ 15 M ar/ 16 Jun/ 16 On Jun/ 15 On M ar/ 16
B rasilveí culo s
A djusted shareho lders' equity (a) 564,532 536,072 492,138 (12.8) (8.2)
M inimum capital required (b) 480,374 456,871 444,336 (7.5) (2.7)
Additional capital for underwritting risk 430,604 409,483 398,409 (7.5) (2.7)
Additional capital for credit risk 66,236 62,393 60,195 (9.1) (3.5)
Additional capital for operating risk 13,118 12,891 12,670 (3.4) (1.7)
Benefit o f correlation between risks (29,584) (27,896) (26,938) (8.9) (3.4)
C apital adequacy (a) - (b) 84,158 79,201 47,803 (43.2) (39.6)
So lvency rat io (a) / (b) - % 117.5 117.3 110.8 -6.8 p.p. -6.6 p.p.
A liança do B rasil Seguro s
A djusted shareho lders' equity (a) 204,522 212,789 211,165 3.2 (0.8)
M inimum capital required (b) 127,118 122,069 121,172 (4.7) (0.7)
Additional capital for underwritting risk 107,660 105,183 101,234 (6.0) (3.8)
Additional capital for credit risk 25,486 21,567 25,634 0.6 18.9
Additional capital for operating risk 4,709 4,607 4,980 5.8 8.1
Benefit o f correlation between risks (10,737) (9,289) (10,676) (0.6) 14.9
C apital adequacy (a) - (b) 77,404 90,721 89,993 16.3 (0.8)
So lvency rat io (a) / (b) - % 160.9 174.3 174.3 13.4 p.p. -0.1 p.p.
M A P F R E Seguro s Gerais
A djusted shareho lders' equity (a) 1,379,188 1,651,179 1,925,756 39.6 16.6
M inimum capital required (b) 1,014,912 1,036,194 1,041,404 2.6 0.5
Additional capital for underwritting risk 874,921 888,235 893,331 2.1 0.6
Additional capital for credit risk 180,797 188,747 188,885 4.5 0.1
Additional capital for operating risk 36,978 40,082 40,177 8.7 0.2
Benefit o f correlation between risks (77,783) (80,870) (80,990) 4.1 0.1
C apital adequacy (a) - (b) 364,276 614,984 884,353 142.8 43.8
So lvency rat io (a) / (b) - % 135.9 159.4 184.9 49.0 p.p. 25.6 p.p.
T o tal M A P F R E B B SH 2
A djusted shareho lders' equity (a) 2,148,242 2,400,040 2,629,060 22.4 9.5
M inimum capital required (b) 1,622,405 1,615,134 1,606,911 (1.0) (0.5)
Additional capital for underwritting risk 1,413,185 1,402,902 1,392,975 (1.4) (0.7)
Additional capital for credit risk 272,519 272,707 274,714 0.8 0.7
Additional capital for operating risk 54,804 57,580 57,827 5.5 0.4
Benefit o f correlation between risks (118,103) (118,056) (118,604) 0.4 0.5
C apital adequacy (a) - (b) 525,837 784,906 1,022,149 94.4 30.2
So lvency rat io (a) / (b) - % 132.4 148.6 163.6 31.2 p.p. 15.0 p.p.
C hg. %B alance

BB Seguridade Participações S.A. | Management Discussion & Analysis 2Q16 74
4 . 3 P E N S I O N P L A N S
E A R N I N G S A N A L Y S I S
Table 67 – Pension Plans | Income statement
C hg. %
R $ tho usand 2Q15 1Q16 2Q16 On 2Q15 On 1Q16 1H 15 1H 16 On 1H 15
Inco me and premiums co ntribut io n 10,749,856 7,898,302 13,922,494 29.5 76.3 19,223,589 21,820,796 13.5
Provision for benefits to be granted (10,706,286) (7,850,075) (13,872,139) 29.6 76.7 (19,140,037) (21,722,214) 13.5
N et revenue with co ntribut io ns and
VGB L premiums43,570 48,227 50,355 15.6 4.4 83,552 98,582 18.0
M anagement fee 370,450 430,217 474,295 28.0 10.2 715,007 904,512 26.5
Changes in other technical reserves 35,301 (11,041) (30,732) - 178.3 (28,234) (41,773) 48.0
Expenses with benefits, redemptions and
claims(70,493) (21,325) (13,636) (80.7) (36.1) (37,273) (34,961) (6.2)
Acquisition costs (98,140) (105,436) (97,540) (0.6) (7.5) (190,202) (202,976) 6.7
Earned premiums 49,958 46,703 54,075 8.2 15.8 99,790 100,778 1.0
Contributions to cover risks 49,572 49,311 49,225 (0.7) (0.2) 99,679 98,536 (1.1)
Changes in technical reserves -premiums 386 (2,608) 4,850 1,156.5 - 111 2,242 1,913.7
Gro ss inco me 330,646 387,345 436,817 32.1 12.8 642,640 824,162 28.2
Administrative expenses (74,678) (79,291) (83,570) 11.9 5.4 (145,532) (162,861) 11.9
Tax expenses (31,055) (35,928) (38,679) 24.5 7.7 (59,596) (74,607) 25.2
Other operating income (expenses) (6,064) (10,621) (10,074) 66.1 (5.1) (12,918) (20,695) 60.2
R esult with pensio n plans and
insurance218,849 261,506 304,495 39.1 16.4 424,594 565,999 33.3
N et investment inco me 129,824 145,029 136,230 4.9 (6.1) 293,077 281,259 (4.0)
Financial income 3,634,397 5,512,078 5,129,648 41.1 (6.9) 6,735,090 10,641,726 58.0
Financial expenses (3,504,573) (5,367,049) (4,993,418) 42.5 (7.0) (6,442,013) (10,360,467) 60.8
Equity income - - - - - - - -
Operat ing result 348,673 406,534 440,724 26.4 8.4 717,670 847,258 18.1
Gains or losses on non-current assets 50 - 85 70.8 - 67 85 27.5
Earnings befo re taxes and pro f it
sharing348,723 406,534 440,809 26.4 8.4 717,737 847,343 18.1
Taxes (136,196) (180,466) (195,757) 43.7 8.5 (281,804) (376,223) 33.5
Profit sharing (3,000) (3,246) (3,186) 6.2 (1.8) (6,335) (6,432) 1.5
A djusted net inco me 209,527 222,822 241,866 15.4 8.5 429,598 464,688 8.2
One-o ff events 294,091 - - - - 294,091 - -
Reversal o f technical provisions 514,056 - - - - 514,056 - -
Reversal o f technical provisions - impact on
financial results- - - - - - - -
Tax expenses on one-off events (23,904) - - - - (23,904) - -
Taxes on one-off events (196,061) - - - - (196,061) - -
N et inco me 503,618 222,822 241,866 (52.0) 8.5 723,689 464,688 (35.8)
Quarterly F lo w C hg. % H alf -Yearly F lo w

BB Seguridade Participações S.A. | Management Discussion & Analysis 2Q16 75
A D J U S T E D N E T I N C O M E
Figure 94 – Pension Plans | Adjusted net income and ROAE QUARTERLY ANALYSIS
The net income of the Pension Plans business reached R$241.9 million in the 2Q16, 15.4% higher YoY. When compared to the 2Q15, the performance was impacted by the increase of the income tax rate, namely the social contribution (“CSLL"), from 15% to 20%, since September 2015, pursuant to Law 13,169 / 15.
The earnings before taxes and profit sharing was of R$440.8 million in the quarter, 26.4% higher YoY. The growth was supported by the improvement in the non-interest operating result, driven by both the higher revenues with management fees and a better cost to income ratio.
The annualized return on average equity reached 39.0% in the 2Q16, 1.3 p.p. higher when compared to the same period of 2015.
¹ Net of taxes considering the effective tax rate
YEAR-TO-DATE ANALYSIS
In the 1H16, the net income reached R$464.7 million, 8.2% up YoY,. The performance was impacted by the increase in the income tax rate, namely the social contribution (“CSLL”), as previously discussed.
The earnings before taxes and profit sharing reached R$847.3 million in the semester, equivalent to an 18.1% growth as compared to the same period of 2015. The improvement of this line came from the increase in the non-interest operating result, explained by higher revenues with management fees as well as a better cost to income ratio, partially offset by the lower net investment income.
The annualized return on average equity reached 37.0% in the 1H16, 1.6 p.p. lower YoY, impacted by a higher earnings retention after the 2Q15, in order to be prepared for the capital requirement for market risk, which inflated the basis for the average equity calculation when compared to the 1H15.
Table 68 – Pension Plans | Performance ratios
119 121 121 130 156 133 142 166
67 80 99 7966
77 8176
186 201220 210 223 209 223
242
48.9 46.1 44.637.7 38.0 36.1 37.3 39.0
3Q14 4Q14 1Q15 2Q15 3Q15 4Q15 1Q16 2Q16
Net investment income¹ (R$ million)
Non-interest operating result¹ (R$ million)
Adjusted ROAE (%)
C hg. (p.p.)
% 2Q15 1Q16 2Q16 On 2Q15 On 1Q16 1H 15 1H 16 On 1H 15
Commission ratio 0.9 1.3 0.7 (0.2) (0.6) 1.0 0.9 (0.1)
Load fee 0.4 0.6 0.4 (0.0) (0.2) 0.4 0.5 0.0
M anagement fee 1.22 1.17 1.16 (0.06) (0.01) 1.23 1.16 (0.07)
Redemption ratio 9.3 9.2 8.4 (0.9) (0.7) 9.2 8.8 (0.4)
Cost to income ratio 52.8 50.2 47.4 (5.4) (2.8) 52.7 48.7 (4.0)
Income tax rate 39.1 44.4 44.4 5.4 0.0 39.3 44.4 5.1
Adjusted ROAE 37.7 37.3 39.0 1.3 1.7 38.6 37.0 (1.6)
Quarterly F lo w C hg. (p.p.) H alf -Yearly F lo w

BB Seguridade Participações S.A. | Management Discussion & Analysis 2Q16 76
R E S U L T W I T H P E N S I O N P L A N S A N D I N S U R A N C E
Figure 95 – Pension Plans | Result with pension plans and insurance and Cost to income ratio
QUARTERLY ANALYSIS
The result with pension plans and insurance grew by 39.1% YoY, driven mainly by the increase of 28.0% in revenues with management fees, as a result of the expansion in the volume of assets under management.
The cost to income ratio reached 47.4% and improved 5.4 p.p. YoY.
YEAR-TO-DATE ANALYSIS
In the 1H16, the result with pension plans and insurance grew by 33.3% YoY, boosted by the increase of 26.5% in revenues with management fees, as a result of the 31.3% expansion in the volume of assets under management over the last twelve months
The cost to income ratio improved 4.0 p.p. YoY to 48.7%.
N E T I N V E S T M E N T I N C O M E
Figure 96 – Pension Plans | Net investment income (R$ million) QUARTERLY ANALYSIS
Net investment income grew by 4.9% YoY, mostly explained by the increase in the average balance of earning assets classified as held to maturity.
YEAR-TO-DATE ANALYSIS
In the 1H16, the net investment income fell 4.0% YoY, mostly driven by the 0.7 p.p. contraction in the spread between the company’s earning assets and its interest bearing liabilities.
200 200 206 219
270238
262
304
51.8 54.3 52.6 52.847.4
54.250.2
47.4
3Q14 4Q14 1Q15 2Q15 3Q15 4Q15 1Q16 2Q16
Result with pension plans and insurance (R$ million) Cost to income ratio (%)
111
130
163
130
112
134145
136
3Q14 4Q14 1Q15 2Q15 3Q15 4Q15 1Q16 2Q16

BB Seguridade Participações S.A. | Management Discussion & Analysis 2Q16 77
R E S U L T W I T H P E N S I O N P L A N S A N D I N S U R A N C E A N A L Y S I S
I N C O M E A N D P R E M I U M S C O N T R I B U T I O N
Figure 97 – Pension Plans | Income and premiums contribution (R$ million)
QUARTERLY ANALYSIS
Pension plans contributions grew 29.5% YoY to R$13.9 billion in the 2Q16. Such performance is a consequence of the strategy adopted by the Company to focus on sporadic contribution plans in the period, which present a higher average ticket when compared to the periodic contribution plans. In the quarter, sporadic pension plans outstanding increased by 88.5 thousand while periodic pension plans outstanding increased by 13.2 thousand.
VGBL plans, the main source of contributions, accounted for 95.4% of the total raised in the quarter, and increased its share by 1.4 p.p. YoY.
YEAR-TO-DATE ANALYSIS
In the 1H16, pension plans contributions grew by 13.5% YoY, with the main highlight being VGBL plans. The sales in the period
presented a higher concentration in sporadic contribution products, which led to a 2.9 p.p. increase over the last twelve months in the
share of these plans in total pension plans outstanding .
Figure 98 – Pension Plans | Contributions breakdown (%) Figure 99 – Pension Plans | Pension plans outstanding (%)
7,152
9,4668,474
10,750
7,847
9,893
7,898
13,922
3Q14 4Q14 1Q15 2Q15 3Q15 4Q15 1Q16 2Q16
91.2 89.1 92.7 94.0 91.9 89.5 92.3 95.4
7.1 9.6 5.9 4.9 6.6 9.3 6.2 3.81.7 1.3 1.4 1.1 1.5 1.2 1.4 0.8
3Q14 4Q14 1Q15 2Q15 3Q15 4Q15 1Q16 2Q16
VGBL PGBL Traditional
82.7 81.8 81.1 79.8 79.1 78.3 78.4 76.9
17.3 18.2 18.9 20.2 20.9 21.7 21.6 23.1
Sep/14 Dec/14 Mar/15 Jun/15 Sep/15 Dec/15 Mar/16 Jun/16
Periodic contribution Sporadic contribution
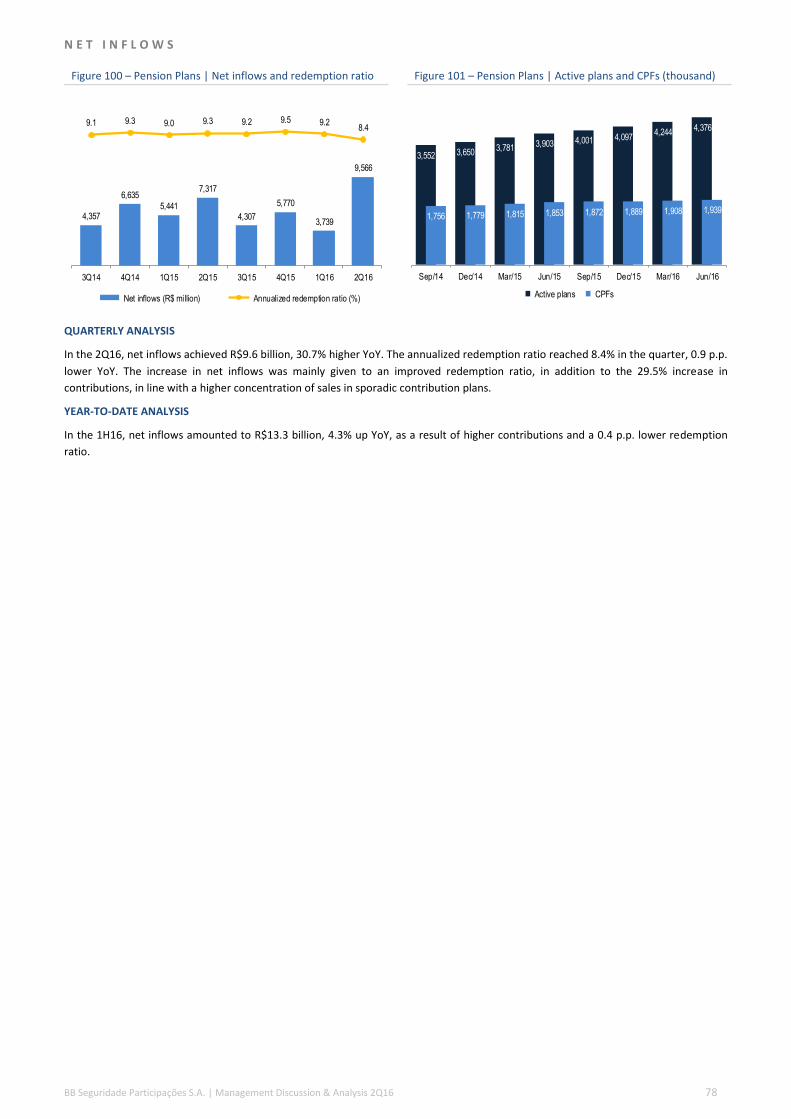
BB Seguridade Participações S.A. | Management Discussion & Analysis 2Q16 78
N E T I N F L O W S
Figure 100 – Pension Plans | Net inflows and redemption ratio Figure 101 – Pension Plans | Active plans and CPFs (thousand)
QUARTERLY ANALYSIS
In the 2Q16, net inflows achieved R$9.6 billion, 30.7% higher YoY. The annualized redemption ratio reached 8.4% in the quarter, 0.9 p.p.
lower YoY. The increase in net inflows was mainly given to an improved redemption ratio, in addition to the 29.5% increase in
contributions, in line with a higher concentration of sales in sporadic contribution plans.
YEAR-TO-DATE ANALYSIS
In the 1H16, net inflows amounted to R$13.3 billion, 4.3% up YoY, as a result of higher contributions and a 0.4 p.p. lower redemption
ratio.
4,357
6,635
5,441
7,317
4,307
5,770
3,739
9,566
9.1 9.3 9.0 9.3 9.2 9.5 9.28.4
3Q14 4Q14 1Q15 2Q15 3Q15 4Q15 1Q16 2Q16
Net inflows (R$ million) Annualized redemption ratio (%)
3,552 3,6503,781 3,903 4,001 4,097
4,2444,376
1,756 1,779 1,815 1,853 1,872 1,889 1,908 1,939
Sep/14 Dec/14 Mar/15 Jun/15 Sep/15 Dec/15 Mar/16 Jun/16
Active plans CPFs

BB Seguridade Participações S.A. | Management Discussion & Analysis 2Q16 79
Table 69 – Pension Plans | Changes in technical reserves and provisions for insurance and pension plans
Table 70 – Pension Plans | Changes in technical reserves and provisions for insurance and pension plans by product
R $ tho usand Jun/ 15 M ar/ 16 Jun/ 16 On Jun/ 15 On M ar/ 16
B enefits to be granted
Init ial balance 117,151,210 145,163,667 154,099,072 31.5 6.2
Constitution 6,658,884 14,369,548 9,570,507 43.7 (33.4)
Reversal (97,540) (10,706,997) (125,100) 28.3 (98.8)
Restatement 4,364,119 5,272,853 4,930,207 13.0 (6.5)
F inal balance 128,076,672 154,099,072 168,474,686 31.5 9.3
B enefits granted
Init ial balance 1,666,811 1,981,309 2,079,483 24.8 5.0
Constitution 207,729 376,054 88,146 (57.6) (76.6)
Reversal (167,805) (364,887) (63,432) (62.2) (82.6)
Restatement 67,541 87,007 61,613 (8.8) (29.2)
F inal balance 1,774,277 2,079,483 2,165,810 22.1 4.2
Other pro visio ns
Init ial balance 1,509,641 1,101,778 1,117,384 (26.0) 1.4
Constitution 51,520 98,900 268,354 420.9 171.3
Reversal (557,188) (104,166) (236,984) (57.5) 127.5
Restatement 16,914 20,873 26,754 58.2 28.2
F inal balance 1,020,887 1,117,384 1,175,508 15.1 5.2
T o tal P ro visio ns 130,871,836 157,295,939 171,816,005 31.3 9.2
B alance C hg. %
R $ tho usand Jun/ 15 M ar/ 16 Jun/ 16 On Jun/ 15 On M ar/ 16
P |VGB L R eserves
Init ial balance 111,925,002 139,681,869 148,474,744 32.7 6.3
Constitution 7,723,636 14,704,561 9,808,442 27.0 (33.3)
Reversal (102,623) (10,944,937) (196,666) 91.6 (98.2)
Restatement 3,246,094 5,033,251 4,688,732 44.4 (6.8)
F inal balance 122,792,109 148,474,744 162,775,252 32.6 9.6
T radit io nal R eserves
Init ial balance 8,402,660 8,564,886 8,821,196 5.0 3.0
Constitution 111,752 139,941 118,951 6.4 (15.0)
Reversal (708,524) (231,113) (229,235) (67.6) (0.8)
Restatement 273,838 347,481 329,842 20.5 (5.1)
F inal balance 8,079,727 8,821,195 9,040,754 11.9 2.5
T o tal P ro visio ns 130,871,836 157,295,939 171,816,005 31.3 9.2
B alance C hg. %

BB Seguridade Participações S.A. | Management Discussion & Analysis 2Q16 80
M A N A G E M E N T F E E
Figure 102 – Pension Plans | Management fee¹,²
QUARTERLY ANALYSIS
Revenues with management fees grew by 28.0% YoY, driven by the increase of 31.3% in assets under management.
The average management fee dropped by 0.06 p.p., as a result of the continuous increase in the share of VGBL plans in the total assets under management, which usually charge a lower management fee, besides the decreased share of traditional plans, which charge a higher fee.
YEAR-TO-DATE ANALYSIS
In the 1H16, revenues with management fees grew by 26.5% as compared to the same period of 2015. Under the same analysis, the average management fee dropped by 0.07 p.p. due to the lower share of traditional plans in the total technical reserves, which charge a higher management fee, in addition to the higher concentration of VGBL plans in the portfolio.
¹Management fee annualized considering the total of 252 working days. ²Working days calculated based on ANBIMA data.
Figure 103 – Pension Plans | Technical reserves (R$ billion) Figure 104 – Pension Plans | Technical reserves (%)
By the end of June 2016, technical reserves grew 31.3% in 12 months to R$171.8 billion. Assets under management from PGBL and
VGBL plans rose 32.6% YoY and reached R$162.8 billion.
333 347 345370
418 422 430474
1.28 1.26 1.24 1.22 1.21 1.19 1.17 1.16
3Q14 4Q14 1Q15 2Q15 3Q15 4Q15 1Q16 2Q16
Management fee (R$ million) Management fee (%)
73 80 88 98 104 113 121134
2223
2425
2627
2829
88
88
89
99
103112
120131
138148
157172
Sep/14 Dec/14 Mar/15 Jun/15 Sep/15 Dec/15 Mar/16 Jun/16
VGBL PGBL Traditional
70.3 71.9 73.1 74.8 75.5 76.1 76.7 78.0
21.5 20.8 19.9 19.1 18.5 18.1 17.7 16.8
8.1 7.3 7.0 6.2 6.0 5.8 5.6 5.3
Sep/14 Dec/14 Mar/15 Jun/15 Sep/15 Dec/15 Mar/16 Jun/16
VGBL PGBL Traditional
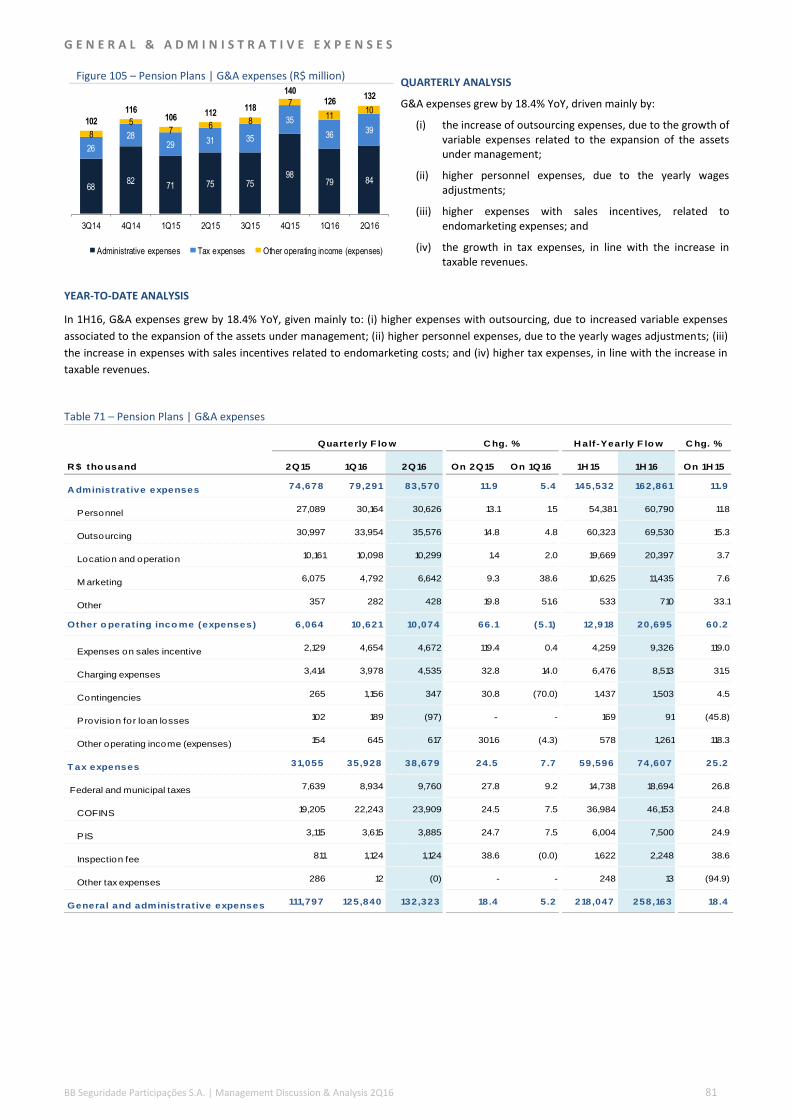
BB Seguridade Participações S.A. | Management Discussion & Analysis 2Q16 81
G E N E R A L & A D M I N I S T R A T I V E E X P E N S E S
Figure 105 – Pension Plans | G&A expenses (R$ million) QUARTERLY ANALYSIS
G&A expenses grew by 18.4% YoY, driven mainly by:
(i) the increase of outsourcing expenses, due to the growth of variable expenses related to the expansion of the assets under management;
(ii) higher personnel expenses, due to the yearly wages adjustments;
(iii) higher expenses with sales incentives, related to endomarketing expenses; and
(iv) the growth in tax expenses, in line with the increase in taxable revenues.
YEAR-TO-DATE ANALYSIS
In 1H16, G&A expenses grew by 18.4% YoY, given mainly to: (i) higher expenses with outsourcing, due to increased variable expenses
associated to the expansion of the assets under management; (ii) higher personnel expenses, due to the yearly wages adjustments; (iii)
the increase in expenses with sales incentives related to endomarketing costs; and (iv) higher tax expenses, in line with the increase in
taxable revenues.
Table 71 – Pension Plans | G&A expenses
6882
71 75 7598
79 84
26
2829 31 35
35
36398
57
6 8
7
1110
102
116106
112118
140126
132
3Q14 4Q14 1Q15 2Q15 3Q15 4Q15 1Q16 2Q16
Administrative expenses Tax expenses Other operating income (expenses)
C hg. %
R $ tho usand 2Q15 1Q16 2Q16 On 2Q15 On 1Q16 1H 15 1H 16 On 1H 15
A dministrat ive expenses 74,678 79,291 83,570 11.9 5.4 145,532 162,861 11.9
Personnel 27,089 30,164 30,626 13.1 1.5 54,381 60,790 11.8
Outsourcing 30,997 33,954 35,576 14.8 4.8 60,323 69,530 15.3
Location and operation 10,161 10,098 10,299 1.4 2.0 19,669 20,397 3.7
M arketing 6,075 4,792 6,642 9.3 38.6 10,625 11,435 7.6
Other 357 282 428 19.8 51.6 533 710 33.1
Other o perat ing inco me (expenses) 6,064 10,621 10,074 66.1 (5.1) 12,918 20,695 60.2
Expenses on sales incentive 2,129 4,654 4,672 119.4 0.4 4,259 9,326 119.0
Charging expenses 3,414 3,978 4,535 32.8 14.0 6,476 8,513 31.5
Contingencies 265 1,156 347 30.8 (70.0) 1,437 1,503 4.5
Provision for loan losses 102 189 (97) - - 169 91 (45.8)
Other operating income (expenses) 154 645 617 301.6 (4.3) 578 1,261 118.3
T ax expenses 31,055 35,928 38,679 24.5 7.7 59,596 74,607 25.2
Federal and municipal taxes 7,639 8,934 9,760 27.8 9.2 14,738 18,694 26.8
COFINS 19,205 22,243 23,909 24.5 7.5 36,984 46,153 24.8
PIS 3,115 3,615 3,885 24.7 7.5 6,004 7,500 24.9
Inspection fee 811 1,124 1,124 38.6 (0.0) 1,622 2,248 38.6
Other tax expenses 286 12 (0) - - 248 13 (94.9)
General and administrat ive expenses 111,797 125,840 132,323 18.4 5.2 218,047 258,163 18.4
Quarterly F lo w C hg. % H alf -Yearly F lo w

BB Seguridade Participações S.A. | Management Discussion & Analysis 2Q16 82
C O S T T O I N C O M E R A T I O
Figure 106 – Pension Plans | Cost to income ratio (%) QUARTERLY ANALYSIS
Cost to income ratio improved 5.4 p.p. YoY to 47.4% in the 2Q16. This evolution was supported by the growth of 24.7% in revenues, boosted mainly by management fees, along with the strict cost control.
YEAR-TO-DATE ANALYSIS
Year to date, the cost to income ratio reached 48.7%, an improvement of 4.0 p.p. as compared to 1H15, as a result of the growth of 26.5% in revenues with management fees, along with the strict cost control.
51.8 54.3 52.6 52.847.4
54.250.2
47.4
3Q14 4Q14 1Q15 2Q15 3Q15 4Q15 1Q16 2Q16
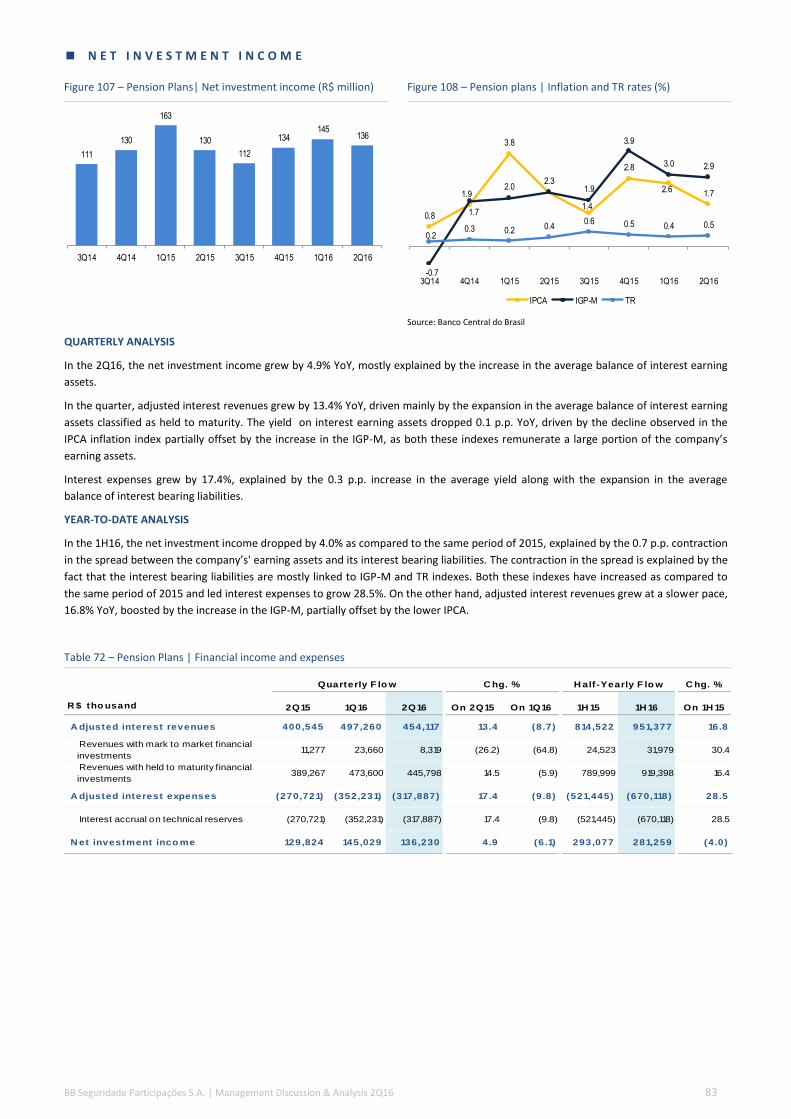
BB Seguridade Participações S.A. | Management Discussion & Analysis 2Q16 83
N E T I N V E S T M E N T I N C O M E
Figure 107 – Pension Plans| Net investment income (R$ million) Figure 108 – Pension plans | Inflation and TR rates (%)
Source: Banco Central do Brasil
QUARTERLY ANALYSIS
In the 2Q16, the net investment income grew by 4.9% YoY, mostly explained by the increase in the average balance of interest earning
assets.
In the quarter, adjusted interest revenues grew by 13.4% YoY, driven mainly by the expansion in the average balance of interest earning
assets classified as held to maturity. The yield on interest earning assets dropped 0.1 p.p. YoY, driven by the decline observed in the
IPCA inflation index partially offset by the increase in the IGP-M, as both these indexes remunerate a large portion of the company’s
earning assets.
Interest expenses grew by 17.4%, explained by the 0.3 p.p. increase in the average yield along with the expansion in the average
balance of interest bearing liabilities.
YEAR-TO-DATE ANALYSIS
In the 1H16, the net investment income dropped by 4.0% as compared to the same period of 2015, explained by the 0.7 p.p. contraction
in the spread between the company’s' earning assets and its interest bearing liabilities. The contraction in the spread is explained by the
fact that the interest bearing liabilities are mostly linked to IGP-M and TR indexes. Both these indexes have increased as compared to
the same period of 2015 and led interest expenses to grow 28.5%. On the other hand, adjusted interest revenues grew at a slower pace,
16.8% YoY, boosted by the increase in the IGP-M, partially offset by the lower IPCA.
Table 72 – Pension Plans | Financial income and expenses
111
130
163
130
112
134145
136
3Q14 4Q14 1Q15 2Q15 3Q15 4Q15 1Q16 2Q16
0.8 1.7
3.8
2.3
1.4
2.8
2.6 1.7
0.20.3 0.2 0.4
0.6 0.5 0.4 0.5
-0.7
1.92.0 1.9
3.9
3.0 2.9
3Q14 4Q14 1Q15 2Q15 3Q15 4Q15 1Q16 2Q16
IPCA IGP-M TR
C hg. %
R $ tho usand 2Q15 1Q16 2Q16 On 2Q15 On 1Q16 1H 15 1H 16 On 1H 15
A djusted interest revenues 400,545 497,260 454,117 13.4 (8.7) 814,522 951,377 16.8
Revenues with mark to market financial
investments 11,277 23,660 8,319 (26.2) (64.8) 24,523 31,979 30.4
Revenues with held to maturity financial
investments 389,267 473,600 445,798 14.5 (5.9) 789,999 919,398 16.4
A djusted interest expenses (270,721) (352,231) (317,887) 17.4 (9.8) (521,445) (670,118) 28.5
Interest accrual on technical reserves (270,721) (352,231) (317,887) 17.4 (9.8) (521,445) (670,118) 28.5
N et investment inco me 129,824 145,029 136,230 4.9 (6.1) 293,077 281,259 (4.0)
Quarterly F lo w C hg. % H alf -Yearly F lo w

BB Seguridade Participações S.A. | Management Discussion & Analysis 2Q16 84
Table 73 – Pension Plans | Quarterly figures - Volume and rate analysis
¹ Calculated with the same methodology of the parts. Due to the different weights of the elements which compose it, the total does not reflect the sum of the parts.
Table 74 – Pension Plans | Quarterly figures - Earning assets - average balance and interest rates¹
¹Guaranteeing assets and free assets of Traditional plans and guaranteeing assets of the P/VGBL plans in the granting stage.
Table 75 – Pension Plans | Quarterly figures - Interest bearing liabilities - average balance and interest rates¹
¹ Technical reserves of Traditional and P/VGBL plans in the granting stage.
R $ tho usand A verage vo lume A verage rate N et change
Earning assets
M ark to market financial investments 28 (2,986) (2,958)
Held to maturity financial investments 46,137 10,393 56,530
T o tal¹ 41,791 11,781 53,572
Interest bearing liabilit ies
Technical reserves (30,047) (17,119) (47,166)
T o tal (30,047) (17,119) (47,166)
2Q16/ 2Q15
R $ millio nA verage
balance
Interest
revenues
A nnualized
rate (%)
A verage
balance
Interest
revenues
A nnualized
rate (%)
Earning assets
M ark to market financial investments 1,330 11 3.6 1,334 8 2.5
Held to maturity financial investments 9,251 389 18.6 10,319 446 18.4
T o tal 10,581 401 16.6 11,653 454 16.5
2Q15 2Q16
R $ millio nA verage
balance
Interest
expenses
A nnualized
rate (%)
A verage
balance
Interest
expenses
A nnualized
rate (%)
Interest bearing liabilit ies
Technical reserves 8,920 (271) 12.0 9,851 (318) 12.3
T o tal 8,920 (271) 12.0 9,851 (318) 12.3
2Q15 2Q16

BB Seguridade Participações S.A. | Management Discussion & Analysis 2Q16 85
Table 76 – Pension Plans | Year-to-date figures - Volume and rate analysis
¹ Calculated with the same methodology of the parts. Due to the different weights of the elements which compose it, the total does not reflect the sum of the parts.
Table 77 – Pension Plans | Year-to-date figures - Earning assets - average balance and interest rates¹
¹Guaranteeing assets and free assets of Traditional plans and guaranteeing assets of the P/VGBL plans in the granting stage.
Table 78 – Pension Plans | Year-to-date figures - Interest bearing liabilities - average balance and interest rates¹
¹ Technical reserves of Traditional and P/VGBL plans in the granting stage.
R $ tho usand A verage vo lume A verage rate N et change
Earning assets
M ark to market financial investments (2,519) 9,976 7,456
Held to maturity financial investments 94,860 34,539 129,398
T o tal¹ 79,791 57,064 136,855
Interest bearing liabilit ies
Technical reserves (45,713) (102,959) (148,672)
T o tal (45,713) (102,959) (148,672)
1H 16/ 1H 15
R $ millio nA verage
balance
Interest
revenues
A nnualized
rate (%)
A verage
balance
Interest
revenues
A nnualized
rate (%)
Earning assets
M ark to market financial investments 1,310 25 3.9 1,214 32 5.4
Held to maturity financial investments 9,171 790 18.6 10,226 919 19.1
T o tal 10,480 815 16.7 11,440 951 17.6
1H 15 1H 16
R $ millio nA verage
balance
Interest
expenses
A nnualized
rate (%)
A verage
balance
Interest
expenses
A nnualized
rate (%)
Interest bearing liabilit ies
Technical reserves 8,779 (521) 11.9 9,713 (670) 13.5
T o tal 8,779 (521) 11.9 9,713 (670) 13.5
1H 15 1H 16

BB Seguridade Participações S.A. | Management Discussion & Analysis 2Q16 86
Table 79 – Pension Plans | Financial investments portfolio breakdown (except PGBL and VGBL funds)
Figure 109 – Pension Plans | Financial investments breakdown by index- except PGBL and VGBL funds (%)
Figure 110 – Pension Plans | Assets allocation (%)
R $ tho usand Jun/ 15 M ar/ 16 Jun/ 16 On Jun/ 15 On M ar/ 16
H eld to maturity securit ies 9,411,322 10,153,207 10,485,535 11.4 3.3
Pre-fixed 94,765 79,445 81,870 (13.6) 3.1
Inflation 9,316,557 10,073,762 10,403,664 11.7 3.3
M ark to market securit ies 1,380,497 1,180,225 1,487,661 7.8 26.0
Pre-fixed 415,060 208,597 197,685 (52.4) (5.2)
Floating 674,982 652,729 984,052 45.8 50.8
Inflation 290,455 318,899 305,925 5.3 (4.1)
T o tal 10,791,819 11,333,432 11,973,196 10.9 5.6
B alance C hg. %
87.8 89.9 90.1 89.0 91.8 93.3 91.7 89.4
5.4 3.3 5.5 6.3 6.0 4.5 5.8 8.2
6.8 6.8 4.4 4.7 2.2 2.2 2.5 2.3
Sep/14 Dec/14 Mar/15 Jun/15 Sep/15 Dec/15 Mar/16 Jun/16
Inflation Floating Pre-fixed
77.4 78.6 79.8 82.6 83.1 83.0 86.5 87.9
14.3 13.9 13.8 12.2 12.1 12.8 9.5 9.06.6 6.0 5.2 4.1 3.9 3.4 3.1 2.6
1.6 1.5 1.3 1.1 0.8 0.8 0.8 0.6
Sep/14 Dec/14 Mar/15 Jun/15 Sep/15 Dec/15 Mar/16 Jun/16
Stocks/Other Debentures and commercial papers
CDBs, DPGEs, CRIs, FDICs, LHs and LFs Government bonds

BB Seguridade Participações S.A. | Management Discussion & Analysis 2Q16 87
B A L A N C E S H E E T A N A L Y S I S
Table 80 – Pension Plans | Balance sheet
S O L V E N C Y
Table 81 – Pension Plans | Solvency
R $ tho usand Jun/ 15 M ar/ 16 Jun/ 16 On Jun/ 15 On M ar/ 16
A ssets 134,352,919 160,664,056 175,689,660 30.8 9.4
Cash and cash equivalents 6,882 3,645 3,819 (44.5) 4.8
Financial assets 132,865,826 158,938,214 173,777,763 30.8 9.3
Receivables from insurance and reinsurance operations 2,500 2,285 1,884 (24.6) (17.6)
Securities and credits receivable 446,098 545,732 597,246 33.9 9.4
Prepaid expenses 1,742 3,055 2,254 29.4 (26.2)
Deferred costs 837,196 970,360 1,108,135 32.4 14.2
Credits from private pension transactions 665 1,214 - - -
Fixed assets 15,057 18,919 18,212 21.0 (3.7)
Intangible 176,953 180,633 180,347 1.9 (0.2)
Liabilit ies 131,877,678 158,306,663 173,089,507 31.3 9.3
Accounts payable 362,797 270,875 389,149 7.3 43.7
Obligations with insurance and reinsurance operations 5,924 11,308 15,822 167.1 39.9
Debts from private pension transactions 1,349 1,110 1,060 (21.4) (4.5)
Third party deposits 227,612 201,030 292,153 28.4 45.3
Technical reserves - insurance 97,839,207 120,573,977 133,978,684 36.9 11.1
Technical reserves - private pension 33,032,629 36,721,962 37,837,321 14.5 3.0
Other liabilities 408,160 526,401 575,318 41.0 9.3
Shareho lders' equity 2,475,241 2,357,393 2,600,153 5.0 10.3
B alance C hg. %
R $ tho usand Jun/ 15 M ar/ 16 Jun/ 16 On Jun/ 15 On M ar/ 16
A djusted shareho lder's equity (a) 2,296,547 2,173,705 2,417,553 5.3 11.2
M inimum capital requirement (b) 1,231,432 1,358,431 1,414,191 14.8 4.1
Base capital 15,000 15,000 15,000 - -
Additional capital for underwritting risk 1,089,710 1,198,036 1,238,375 13.6 3.4
Additional capital for credit risk 61,781 66,429 73,546 19.0 10.7
Additional capital for operating risk 109,555 125,837 137,453 25.5 9.2
Correlation risk reduction (29,614) (31,871) (35,183) 18.8 10.4
C apital adequacy (a) - (b) 1,065,115 815,274 1,003,362 (5.8) 23.1
So lvency rat io (a) / (b) - % 186.5 160.0 170.9 -15.5 p.p. 10.9 p.p.
B alance C hg. %
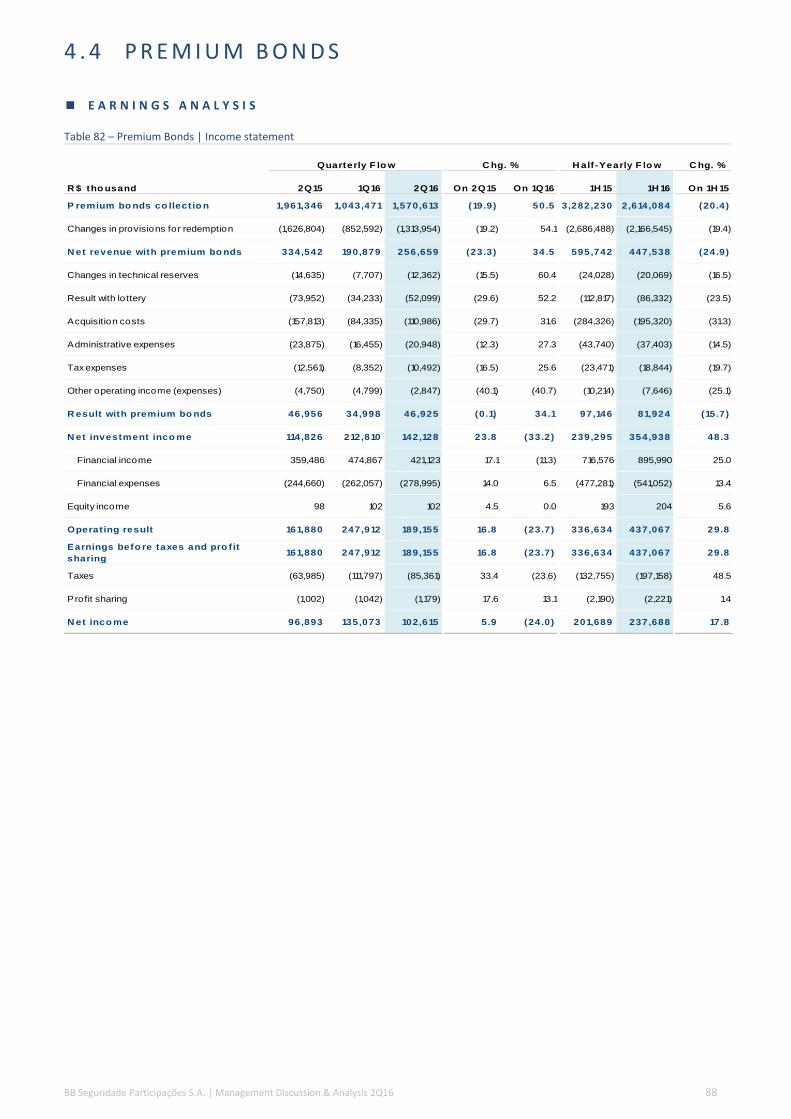
BB Seguridade Participações S.A. | Management Discussion & Analysis 2Q16 88
4 . 4 P R E M I U M B O N D S
E A R N I N G S A N A L Y S I S
Table 82 – Premium Bonds | Income statement
C hg. %
R $ tho usand 2Q15 1Q16 2Q16 On 2Q15 On 1Q16 1H 15 1H 16 On 1H 15
P remium bo nds co llect io n 1,961,346 1,043,471 1,570,613 (19.9) 50.5 3,282,230 2,614,084 (20.4)
Changes in provisions for redemption (1,626,804) (852,592) (1,313,954) (19.2) 54.1 (2,686,488) (2,166,545) (19.4)
N et revenue with premium bo nds 334,542 190,879 256,659 (23.3) 34.5 595,742 447,538 (24.9)
Changes in technical reserves (14,635) (7,707) (12,362) (15.5) 60.4 (24,028) (20,069) (16.5)
Result with lo ttery (73,952) (34,233) (52,099) (29.6) 52.2 (112,817) (86,332) (23.5)
Acquisition costs (157,813) (84,335) (110,986) (29.7) 31.6 (284,326) (195,320) (31.3)
Administrative expenses (23,875) (16,455) (20,948) (12.3) 27.3 (43,740) (37,403) (14.5)
Tax expenses (12,561) (8,352) (10,492) (16.5) 25.6 (23,471) (18,844) (19.7)
Other operating income (expenses) (4,750) (4,799) (2,847) (40.1) (40.7) (10,214) (7,646) (25.1)
R esult with premium bo nds 46,956 34,998 46,925 (0.1) 34.1 97,146 81,924 (15.7)
N et investment inco me 114,826 212,810 142,128 23.8 (33.2) 239,295 354,938 48.3
Financial income 359,486 474,867 421,123 17.1 (11.3) 716,576 895,990 25.0
Financial expenses (244,660) (262,057) (278,995) 14.0 6.5 (477,281) (541,052) 13.4
Equity income 98 102 102 4.5 0.0 193 204 5.6
Operat ing result 161,880 247,912 189,155 16.8 (23.7) 336,634 437,067 29.8
Earnings befo re taxes and pro f it
sharing161,880 247,912 189,155 16.8 (23.7) 336,634 437,067 29.8
Taxes (63,985) (111,797) (85,361) 33.4 (23.6) (132,755) (197,158) 48.5
Profit sharing (1,002) (1,042) (1,179) 17.6 13.1 (2,190) (2,221) 1.4
N et inco me 96,893 135,073 102,615 5.9 (24.0) 201,689 237,688 17.8
C hg. %Quarterly F lo w H alf -Yearly F lo w

BB Seguridade Participações S.A. | Management Discussion & Analysis 2Q16 89
N E T I N C O M E
Figure 111 – Premium Bonds |Net income and ROAE QUARTERLY ANALYSIS
In the 2Q16, the net income of the premium bonds business reached R$102.6 million, 5.9% up YoY. It is worth noting that, comparing to the 2Q15, the performance was impacted by the increase in the income tax rate, namely social contribution (“CSLL"), from 15% to 20%, since September 2015, pursuant to Law 13,169/15.
The earnings before taxes and profit sharing reached R$189.2 million in the quarter, 16.8% higher YoY. The growth is explained by the improvement of 23.8% in the net investment income, as a result of the higher spread.
¹Net of taxes considering the Company’s effective income tax rate.
YEAR-TO-DATE ANALYSIS
In the 1H16, the net income of the premium bonds segment reached R$237.7 million, 17.8% higher YoY. The growth was mainly due to the 48.3% improvement in the net investment income, partially offset by the increase in the income tax rate, as previously discussed. Setting apart the increase in the income tax rate, the earnings before taxes and profit sharing grew by 29.8% YoY.
Table 83 – Premium Bonds | Performance ratios
30 44 29 27 28 19 18 25
4454 75 69
4189
11778
74
98 10597
68
109
135
103
85.1102.3 102.6
88.865.4
109.7 123.0
84.1
3Q14 4Q14 1Q15 2Q15 3Q15 4Q15 1Q16 2Q16
Net investment income¹ (R$ million)
Non-interest operating results¹ (R$mill ion)
ROAE (%)
C hg.
(p.p.)
% 2Q15 1Q16 2Q16 On 2Q15 On 1Q16 1H 15 1H 16 On 1H 15
Spread 5.1 p.p. 8.3 p.p. 5.9 p.p. 0.8 (2.4) 4.9 p.p. 6.7 p.p. 1.8
Lottery ratio 22.1 17.9 20.3 (1.8) 2.4 18.9 19.3 0.4
Commission ratio 47.2 44.2 43.2 (3.9) (0.9) 47.7 43.6 (4.1)
G&A ratio 12.3 15.5 13.4 1.0 (2.2) 13.0 14.3 1.3
Premium bonds margin 14.0 18.3 18.3 4.2 (0.1) 16.3 18.3 2.0
Income tax rate 39.5 45.1 45.1 5.6 0.0 39.4 45.1 5.7
ROAE 88.8 123.0 84.1 (4.8) (38.9) 88.3 96.9 8.6
Quarterly F lo w C hg. (p.p.) H alf -Yearly F lo w

BB Seguridade Participações S.A. | Management Discussion & Analysis 2Q16 90
R E S U L T W I T H P R E M I U M B O N D S
Figure 112 – Premium Bonds | Result with premium bonds and margin
QUARTERLY ANALYSIS
The result with premium bonds remained almost flat YoY. The net revenue with premium bonds fell by 23.3%, as a result of the 19.9% decrease in premium bonds collection and a higher average reserve quote. This effect was partially offset by the reduction of 29.7% in the acquisition costs as well as by the 29.6% drop in lottery expenses.
YEAR-TO-DATE ANALYSIS
In the 1H16, the result with premium bonds fell by 15.7% YoY, driven by the 24.9% drop in net revenues with premium bonds, due to
the 20.4% decrease in premium bonds collection and the higher average reserve quote. The drop in net revenues with premium bonds
was partially offset by the 31.3% fall in acquisition costs and the 23.5% drop in lottery expenses.
N E T I N V E S T M E N T I N C O M E
Figure 113 – Premium Bonds | Net investment income and spread
QUARTERLY ANALYSIS
In the 2Q16, the net investment income rose by 23.8% YoY, driven by a 0.8 p.p. increase in the net interest margin, explained by:
(i) the increase of the average yield on pre-fixed bonds held to maturity, due to the maturity of bonds which were bought in an environment of lower Selic rate and now were reinvested at higher yields; and
(ii) the downward shift of the forward yield curve, which positively impacted the returns on pre-fixed bonds marked-to-market.
YEAR-TO-DATE ANALYSIS
In the 1H16, the net investment income grew by 48.3% YoY, driven by a 1.8 p.p. increase in the spread. Such improvement was due to the higher Selic rate, the downward shift of the forward yield curve, which positively impacted the returns on pre-fixed bonds marked-to-market, and the maturity of securities which were bought in an environment of lower Selic rate and now were reinvested at higher yields.
51
73
50 47 4734 35
47
21.1 19.9 19.2
14.0
20.5
11.1
18.3 18.3
3Q14 4Q14 1Q15 2Q15 3Q15 4Q15 1Q16 2Q16
Result with premium bonds (R$ million) Premium bonds margin (%)
7387
124 115
67
148
213
142
3.6 3.9
5.4 5.1
3.2
5.9
8.3
5.9
3Q14 4Q14 1Q15 2Q15 3Q15 4Q15 1Q16 2Q16
Net investment income (R$ million) Spread (p.p.)

BB Seguridade Participações S.A. | Management Discussion & Analysis 2Q16 91
R E S U L T W I T H P R E M I U M B O N D S A N A L Y S I S
P R E M I U M B O N D S C O L L E C T I O N
Figure 114 – Premium Bonds | Collection (R$ million) QUARTERLY ANALYSIS
In the 2Q16, premium bonds collection came 19.9% lower YoY. This contraction is explained by the decrease in the average collection, since the bonds outstanding grew by 7.5% under the same comparable basis.
YEAR-TO-DATE ANALYSIS
In the 1H16, premium bonds collection dropped by 20.4% YoY, due mainly to the decrease in the average collection.
Figure 115 – Premium Bonds | Collections by product (%) Figure 116 – Premium Bonds | Bonds outstanding by product (%)
By the end of June, 2016, the unique payment bonds accounted for 82.5% of the bonds outstanding, 4.1 p.p. higher YoY. This increase is
mostly explained by the sales of the Postalcap bond, which is a low cost unique payment bond that has been sold in the Post Office
branches since May, 2015.
599804 751 689 576 571 635 642
797
1,223
570
1,273
803
1,285
409
929
1,396
2,028
1,321
1,961
1,379
1,856
1,043
1,571
3Q14 4Q14 1Q15 2Q15 3Q15 4Q15 1Q16 2Q16
Monthly payment Unique payment
42.9 39.7
56.8
35.1 41.830.8
60.8
40.9
57.1 60.3
43.2
64.9 58.269.2
39.2
59.1
3Q14 4Q14 1Q15 2Q15 3Q15 4Q15 1Q16 2Q16
Monthly payment Unique payment
20.6 21.0 22.5 21.6 20.2 18.3 18.4 17.5
79.4 79.0 77.5 78.3 78.1 77.0 73.7 70.1
1.7 4.7 7.9 12.4
3Q14 4Q14 1Q15 2Q15 3Q15 4Q15 1Q16 2Q16
Monthly payment Unique payment Unique payment - Postalcap

BB Seguridade Participações S.A. | Management Discussion & Analysis 2Q16 92
C H A N G E S I N P R O V I S I O N S F O R R E D E M P T I O N
Figure 117 – Premium Bonds | Changes in provisions for redemption and average reserve quote
QUARTERLY ANALYSIS
In the 2Q16, changes in provisions for redemptions fell by 19.2% YoY as a result of the drop in collections. The average reserve quote grew by 0.8 p.p., as a result of the increased share of the unique payment bonds in the mix of new sales, since this product presents higher reserve quotes when compared to the first installments of monthly payment bonds.
YEAR-TO-DATE ANALYSIS
In the 1H16, changes in provision for redemptions fell by 19.4% YoY as a result of the fall in collections. The average reserve quote rose by 1.1 p.p., as a result of the increased share of the unique payment bonds in the mix of new sales, since these products have a higher reserve quotes when compared to the first installments of monthly payment bonds.
Table 84 – Premium Bonds | Changes in premium bonds provision
Table 85 – Premium Bonds | Changes in provisions for redemption¹
¹ Provision’s flow does not pass through income statement
1,156
1,663
1,060
1,627
1,150
1,547
853
1,314
82.8 82.080.2
82.9 83.4 83.3 81.783.7
3Q14 4Q14 1Q15 2Q15 3Q15 4Q15 1Q16 2Q16
Changes in provisions for redemptions (R$ million) Average reserve quote (%)
R $ tho usand Jun/ 15 M ar/ 16 Jun/ 16 On Jun/ 15 On M ar/ 16
P remium bo nds pro visio n
Init ial balance 11,079,530 11,670,395 11,058,730 (0.2) (5.2)
Constitution 1,638,664 856,681 1,321,046 (19.4) 54.2
Cancellations (11,535) (3,991) (7,295) (36.8) 82.8
Transfers (1,506,349) (1,677,680) (2,062,334) 36.9 22.9
Interest accrual 201,209 213,325 207,923 3.3 (2.5)
F inal balance 11,401,519 11,058,730 10,518,070 (7.7) (4.9)
B alance C hg. %
R $ tho usand Jun/ 15 M ar/ 16 Jun/ 16 On Jun/ 15 On M ar/ 16
P ro visio n fo r redemptio n
Init ial balance 269,008 294,265 312,412 16.1 6.2
Constitution 1,505,460 1,677,237 2,062,578 37.0 23.0
Transfers 10,168 8,853 11,008 8.3 24.3
Payments (1,502,943) (1,668,298) (2,066,213) 37.5 23.9
Interest accrual 1,227 1,248 1,702 38.7 36.4
Premium bonds expiration (813) (893) (1,280) 57.4 43.3
F inal balance 282,107 312,412 320,207 13.5 2.5
B alance C hg. %
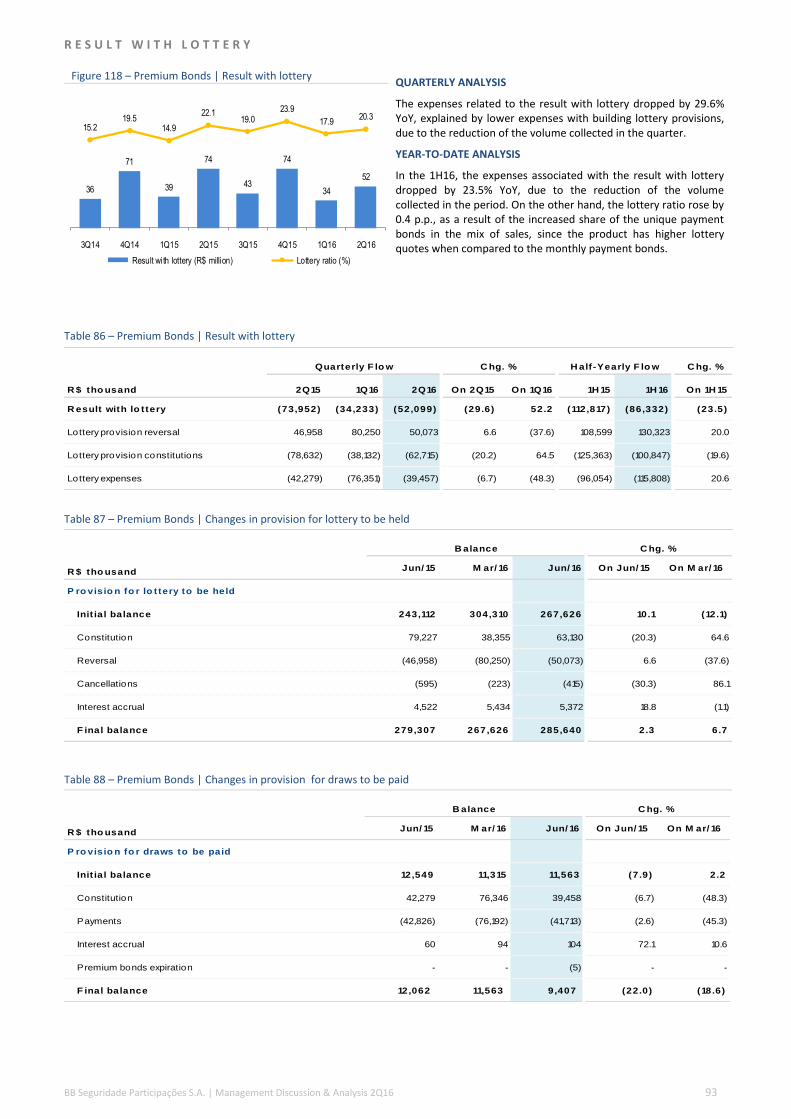
BB Seguridade Participações S.A. | Management Discussion & Analysis 2Q16 93
R E S U L T W I T H L O T T E R Y
Figure 118 – Premium Bonds | Result with lottery QUARTERLY ANALYSIS
The expenses related to the result with lottery dropped by 29.6% YoY, explained by lower expenses with building lottery provisions, due to the reduction of the volume collected in the quarter.
YEAR-TO-DATE ANALYSIS
In the 1H16, the expenses associated with the result with lottery dropped by 23.5% YoY, due to the reduction of the volume collected in the period. On the other hand, the lottery ratio rose by 0.4 p.p., as a result of the increased share of the unique payment bonds in the mix of sales, since the product has higher lottery quotes when compared to the monthly payment bonds.
Table 86 – Premium Bonds | Result with lottery
Table 87 – Premium Bonds | Changes in provision for lottery to be held
Table 88 – Premium Bonds | Changes in provision for draws to be paid
36
71
39
74
43
74
34
52
15.219.5
14.9
22.119.0
23.9
17.920.3
3Q14 4Q14 1Q15 2Q15 3Q15 4Q15 1Q16 2Q16
Result with lottery (R$ million) Lottery ratio (%)
C hg. %
R $ tho usand 2Q15 1Q16 2Q16 On 2Q15 On 1Q16 1H 15 1H 16 On 1H 15
R esult with lo ttery (73,952) (34,233) (52,099) (29.6) 52.2 (112,817) (86,332) (23.5)
Lottery provision reversal 46,958 80,250 50,073 6.6 (37.6) 108,599 130,323 20.0
Lottery provision constitutions (78,632) (38,132) (62,715) (20.2) 64.5 (125,363) (100,847) (19.6)
Lottery expenses (42,279) (76,351) (39,457) (6.7) (48.3) (96,054) (115,808) 20.6
Quarterly F lo w C hg. % H alf-Yearly F lo w
R $ tho usand Jun/ 15 M ar/ 16 Jun/ 16 On Jun/ 15 On M ar/ 16
P ro visio n fo r lo ttery to be held
Init ial balance 243,112 304,310 267,626 10.1 (12.1)
Constitution 79,227 38,355 63,130 (20.3) 64.6
Reversal (46,958) (80,250) (50,073) 6.6 (37.6)
Cancellations (595) (223) (415) (30.3) 86.1
Interest accrual 4,522 5,434 5,372 18.8 (1.1)
F inal balance 279,307 267,626 285,640 2.3 6.7
B alance C hg. %
R $ tho usand Jun/ 15 M ar/ 16 Jun/ 16 On Jun/ 15 On M ar/ 16
P ro visio n fo r draws to be paid
Init ial balance 12,549 11,315 11,563 (7.9) 2.2
Constitution 42,279 76,346 39,458 (6.7) (48.3)
Payments (42,826) (76,192) (41,713) (2.6) (45.3)
Interest accrual 60 94 104 72.1 10.6
Premium bonds expiration - - (5) - -
F inal balance 12,062 11,563 9 ,407 (22.0) (18.6)
B alance C hg. %

BB Seguridade Participações S.A. | Management Discussion & Analysis 2Q16 94
A C Q U I S I T I O N C O S T S
Figure 119 – Premium Bonds | Acquisition costs QUARTERLY ANALYSIS
In the 2Q16, the acquisition costs dropped by 29.7% YoY due to lower collections. The commission ratio dropped by 4.0 p.p., as a result of the increased share of the unique payment bonds in the mix of new sales, which has a lower commission ratio when compared to the first installments of monthly payment bonds.
YEAR-TO-DATE ANALYSIS
In the 1H16, the acquisition costs dropped by 31.3% YoY, due to both the reduction in collections and the increased share of the unique payment bonds in the mix of new sales, which has a lower commission ratio when compared to the first installments of monthly payment bonds.
108
174
127
158
108
145
84111
45.147.7 48.4 47.2 47.3 46.9
44.2 43.2
3Q14 4Q14 1Q15 2Q15 3Q15 4Q15 1Q16 2Q16
Acquisition costs (R$ million) Commission ratio (%)

BB Seguridade Participações S.A. | Management Discussion & Analysis 2Q16 95
G E N E R A L & A D M I N I S T R A T I V E E X P E N S E S
Figure 120 – Premium Bonds | G&A expenses (R$ million)¹ QUARTERLY ANALYSIS
In the 2Q16, G&A expenses dropped by 16.8% YoY, driven mainly by:
(i) the 12.3% decrease of the administrative expenses, explained by lower expenses with location and operation and with institutional advertisement and publicity, partially offset by the increase in the personnel expenses, due to both the collective bargaining agreement and higher expenses with benefits;
(ii) the 40.1% drop in other expenses, due to lower operating expenses related to provisions for the payment to the shareholder Icatu Cap, for the transfer of rights to sell premium bonds in the former Banco Nossa Caixa branches; and
(iii) the 16.5% reduction of tax expenses, as a result of the contraction in the taxable operating income for PIS/PASEP and COFINS collection.
¹Does not includes BB Capitalização
YEAR-TO-DATE ANALYSIS
In the 1H16, G&A expenses dropped by 17.5% YoY, explained by:
(i) the 14.5% drop in administrative expenses, as a result of lower costs with outsourcing and with institutional advertisement and
publicity, partially offset by higher personnel expenses, due to both the collective bargaining and higher benefit expenses;
(ii) the 25.1% decrease in other expenses, due to lower operating expenses related to provisions for the payment to the
shareholder Icatu Cap, for the transfer of rights to sell premium bonds in the former Banco Nossa Caixa branches; and
(iii) the 19.7% reduction of tax expenses, as a result of the contraction in the taxable operating income for PIS/PASEP and COFINS
collection.
2229
20 24 2231
1621
10
15
1113 10
12
810
6
6
5
5
2
3
5
3
38
49
3641
34
46
3034
3Q14 4Q14 1Q15 2Q15 3Q15 4Q15 1Q16 2Q16
Administrative expenses
Tax expenses
Other operating income (expenses)
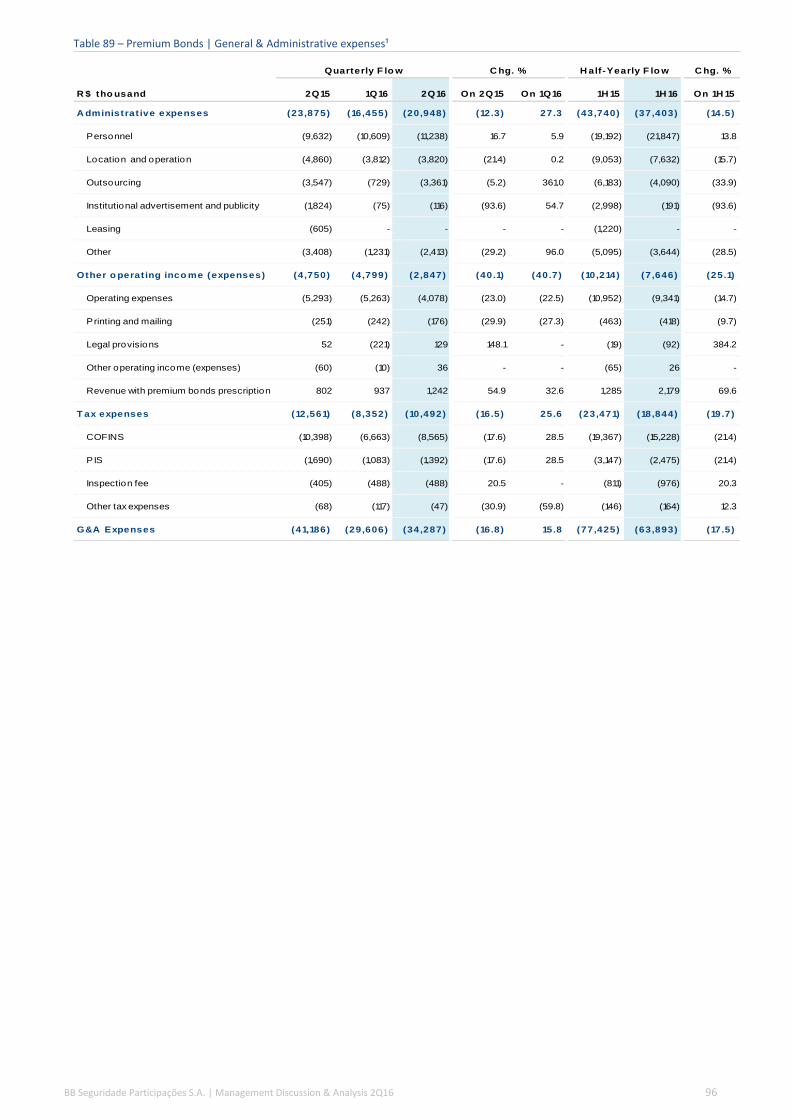
BB Seguridade Participações S.A. | Management Discussion & Analysis 2Q16 96
Table 89 – Premium Bonds | General & Administrative expenses¹
C hg. %
R $ tho usand 2Q15 1Q16 2Q16 On 2Q15 On 1Q16 1H 15 1H 16 On 1H 15
A dministrat ive expenses (23,875) (16,455) (20,948) (12.3) 27.3 (43,740) (37,403) (14.5)
Personnel (9,632) (10,609) (11,238) 16.7 5.9 (19,192) (21,847) 13.8
Location and operation (4,860) (3,812) (3,820) (21.4) 0.2 (9,053) (7,632) (15.7)
Outsourcing (3,547) (729) (3,361) (5.2) 361.0 (6,183) (4,090) (33.9)
Institutional advertisement and publicity (1,824) (75) (116) (93.6) 54.7 (2,998) (191) (93.6)
Leasing (605) - - - - (1,220) - -
Other (3,408) (1,231) (2,413) (29.2) 96.0 (5,095) (3,644) (28.5)
Other o perat ing inco me (expenses) (4,750) (4,799) (2,847) (40.1) (40.7) (10,214) (7,646) (25.1)
Operating expenses (5,293) (5,263) (4,078) (23.0) (22.5) (10,952) (9,341) (14.7)
Printing and mailing (251) (242) (176) (29.9) (27.3) (463) (418) (9.7)
Legal provisions 52 (221) 129 148.1 - (19) (92) 384.2
Other operating income (expenses) (60) (10) 36 - - (65) 26 -
Revenue with premium bonds prescription 802 937 1,242 54.9 32.6 1,285 2,179 69.6
T ax expenses (12,561) (8,352) (10,492) (16.5) 25.6 (23,471) (18,844) (19.7)
COFINS (10,398) (6,663) (8,565) (17.6) 28.5 (19,367) (15,228) (21.4)
PIS (1,690) (1,083) (1,392) (17.6) 28.5 (3,147) (2,475) (21.4)
Inspection fee (405) (488) (488) 20.5 - (811) (976) 20.3
Other tax expenses (68) (117) (47) (30.9) (59.8) (146) (164) 12.3
G&A Expenses (41,186) (29,606) (34,287) (16.8) 15.8 (77,425) (63,893) (17.5)
Quarterly F lo w C hg. % H alf -Yearly F lo w

BB Seguridade Participações S.A. | Management Discussion & Analysis 2Q16 97
N E T I N V E S T M E N T I N C O M E
Figure 121 – Premium Bonds | Net investment income (R$ million)
Figure 122 – Premium Bonds | Annualized average interest rates and spread¹
¹Does not includes BB Capitalização
Table 90 – Premium Bonds | Financial income and expenses
QUARTERLY ANALYSIS
In the 2Q16, the net interest income grew by 19.4% YoY, driven by the increase of 0.8 p.p. in the spread.
Interest revenues grew by 10.5% YoY, due to the 1.0 p.p. increase in the average yield on interest earning assets, as a result of:
(i) the 1.7 p.p. increase in the average return on financial investments held to maturity, boosted by the pre-fixed bonds, due to the
maturity of securities which were bought in an environment of lower Selic rate and now were reinvested at higher yields; and
(ii) the 1.1 p.p. growth in the average yield on marked-to-market financial investments, due to the downward shift of the forward
yield curve.
The interest expenses grew by 4.3% YoY, as a result of the 0.2 p.p. increase in the average yield on interests bearing liabilities, driven
mainly by a higher yield on technical provisions due to the increased TR rate, an index that remunerates a significant portion of the
premium bonds portfolio.
YEAR-TO-DATE ANALYSIS
In the 1H16, the net interest income grew by 39.4% YoY, driven mainly by the 1.8 p.p. increase in the spread.
Interest revenues grew by 22.8% YoY, due to the 2.3 p.p. increase in the average return on interest earning assets. Such improvement is
justified by a higher average Selic rate, the downward shift of the forward yield curve, which positively impacted the marked-to-market
pre-fixed bonds, and the maturity of bonds which were previously bought in an environment of lower Selic rate and now were
reinvested at higher yields.
Interest expenses grew by 10.5% YoY, as a result of the 0.5 p.p. increase in the average yield on interests bearing liabilities, driven
mainly by a higher TR rate, an index that remunerates a significant portion of the premium bonds portfolio.
7387
124115
67
148
213
142
3Q14 4Q14 1Q15 2Q15 3Q15 4Q15 1Q16 2Q16
5.7 5.9 6.2 6.7 6.9 6.9
6.9
6.8
3.6 3.95.4 5.1
3.2
5.9
8.3
5.9
9.3 9.811.6 11.7
10.1
12.815.2
12.7
3Q14 4Q14 1Q15 2Q15 3Q15 4Q15 1Q16 2Q16
Yield on interest rate of bearing l iabilities (%)Spread (p.p.)Yield on interest earnings assets (%)
C hg. %
R $ tho usand 2Q15 1Q16 2Q16 On 2Q15 On 1Q16 1H 15 1H 16 On 1H 15
Interest revenues 352,886 465,406 389,821 10.5 (16.2) 696,168 855,227 22.8
Revenues with mark to market financial
investments278,924 367,998 310,601 11.4 (15.6) 540,579 678,599 25.5
Expenses with mark to market financial
investments(6,600) (9,461) (31,302) 374.3 230.9 (20,408) (40,763) 99.7
Revenues with held to maturity financial
investments80,203 105,560 109,926 37.1 4.1 174,823 215,486 23.3
Interest accrual on judicial deposits 359 1,309 596 66.0 (54.5) 1,174 1,905 62.2
Interest expenses (208,991) (222,943) (218,035) 4.3 (2.2) (399,054) (440,978) 10.5
Interest accrual on technical reserves (207,018) (220,101) (215,102) 3.9 (2.3) (395,956) (435,203) 9.9
Other (1,973) (2,842) (2,933) 48.6 3.2 (3,098) (5,775) 86.4
N et interest inco me 143,895 242,463 171,786 19.4 (29.1) 297,114 414,249 39.4
Quarterly F lo w C hg. % H alf -Yearly F lo w

BB Seguridade Participações S.A. | Management Discussion & Analysis 2Q16 98
Table 91 – Premium Bonds | Quarterly figures – Volume and rate analysis
¹ Calculated with the same methodology of the parts. Due to the different weights of the elements which compose it, the total does not reflect the sum of the parts. ² Includes: (i) interest expenses related to interest accrual of the payment made to Icatu Cap for the transfer of its rights to market premium bonds products in the branches formerly owned by Banco Nossa Caixa starting in May 2014 and (ii) interest accrual of legal provisions.
Table 92 – Premium Bonds | Quarterly figures - Earning assets average balance and interest rates
Table 93 – Premium Bonds | Quarterly figures - Interest bearing liabilities average balance and interest rates
¹ Includes: (i) interest expenses related to interest accrual of the payment made to Icatu Cap for the transfer of its rights to market premium bonds products in the branches formerly owned by Banco Nossa Caixa starting in May 2014 and (ii) interest accrual of legal provisions.
R $ tho usand A verage vo lume A verage rate N et change
Earning assets
M ark to market financial investments (25,978) 32,953 6,975
Held to maturity financial investments 15,567 14,156 29,723
Judicial deposits 129 108 237
T o tal¹ (3,384) 40,319 36,935
Interest bearing liabilit ies
Technical reserves - premium bonds 7,652 (15,736) (8,084)
Other (667) (293) (960)
T o tal 3,373 (12,417) (9,044)
2Q16/ 2Q15
R $ tho usandA verage
balance
Interest
revenues
A nnualized
rate (%)
A verage
balance
Interest
revenues
A nnualized
rate (%)
Earnings assets
M ark to market financial investments 9,299,573 272,324 12.7 8,508,222 279,299 13.8
Held to maturity financial investments 2,980,328 80,203 11.6 3,472,019 109,926 13.3
Judicial deposits 681,417 359 0.2 869,532 596 0.3
T o tal 12,961,319 352,886 11.7 12,849,772 389,821 12.7
2Q15 2Q16
R $ tho usandA verage
balance
Interest
expenses
A nnualized
rate (%)
A verage
balance
Interest
expenses
A nnualized
rate (%)
Interest bearing liabilit ies
Technical reserves - premium bonds 11,873,320 (207,018) 7.0 11,465,437 (215,102) 7.3
Other¹ 732,899 (1,973) 1.1 948,752 (2,933) 1.2
T o tal 12,606,219 (208,991) 6.7 12,414,189 (218,035) 6.8
2Q15 2Q16

BB Seguridade Participações S.A. | Management Discussion & Analysis 2Q16 99
Table 94 – Premium Bonds | Year-to-date figures - Volume and rate analysis
¹ Calculated with the same methodology of the parts. Due to the different weights of the elements which compose it, the total does not reflect the sum of the parts. ² Includes: (i) interest expenses related to interest accrual of the payment made to Icatu Cap for the transfer of its rights to market premium bonds products in the branches formerly owned by Banco Nossa Caixa starting in May 2014 and (ii) interest accrual of legal provisions.
Table 95 – Premium Bonds | Year-to-date figures - Earning assets average balance and interest rates
Table 96 – Premium Bonds | Year-to-date figures - Interest bearing liabilities average balance and interest rates
¹ Includes: (i) interest expenses related to interest accrual of the payment made to Icatu Cap for the transfer of its rights to market premium bonds products in the branches formerly owned by Banco Nossa Caixa starting in May 2014 and (ii) interest accrual of legal provisions.
R $ tho usand A verage vo lume A verage rate N et change
Earning assets
M ark to market financial investments (47,076) 164,741 117,665
Held to maturity financial investments 34,165 6,498 40,663
Judicial deposits 400 331 731
T o tal¹ 196,574 (37,515) 159,059
Interest bearing liabilit ies
Technical reserves - premium bonds 4,636 (43,883) (39,247)
Other (1,282) (1,394) (2,677)
T o tal (2,670) (39,254) (41,924)
1H 16/ 1H 15
R $ tho usandA verage
balance
Interest
revenues
A nnualized
rate (%)
A verage
balance
Interest
revenues
A nnualized
rate (%)
Earnings assets
M ark to market financial investments 9,241,272 520,171 12.0 8,606,097 637,836 15.6
Held to maturity financial investments 3,155,987 174,823 11.8 3,750,644 215,486 12.0
Judicial deposits 648,870 1,174 0.4 821,126 1,905 0.5
T o tal 13,046,129 696,168 11.3 13,177,866 855,227 13.6
1H 15 1H 16
R $ tho usandA verage
balance
Interest
expenses
A nnualized
rate (%)
A verage
balance
Interest
expenses
A nnualized
rate (%)
Interest bearing liabilit ies
Technical reserves - premium bonds 11,906,484 (395,956) 6.7 11,780,987 (435,203) 7.4
Other¹ 708,801 (3,098) 0.9 911,141 (5,775) 1.3
T o tal 12,615,285 (399,054) 6.4 12,692,128 (440,978) 6.9
1H 15 1H 16

BB Seguridade Participações S.A. | Management Discussion & Analysis 2Q16 100
Table 97 – Premium Bonds | Mark to market and derivatives effect¹
¹ Does not include BB Capitalização
Table 98 – Premium Bonds | Financial investments portfolio breakdown
Figure 123 – Premium Bonds | Asset allocation¹ (%) Figure 124 – Premium Bonds | Breakdown of mark to market financial investments by index¹ (%)
¹ Does not include BB Capitalização. ¹ Does not include BB Capitalização.
C hg. %
R $ tho usand 2Q15 1Q16 2Q16 On 2Q15 On 1Q16 1H 15 1H 16 On 1H 15
M ark to market (1,775) 135,198 10,258 - (92.4) (9,351) 145,455 -
Derivatives 8,557 (72,080) (7,829) - (89.1) 17,269 (79,910) -
N et result 6,782 63,117 2,429 (64.2) (96.2) 7,919 65,546 727.7
Quarterly F lo w C hg. % H alf-Yearly F lo w
R $ tho usand Jun/ 15 M ar/ 16 Jun/ 16 On Jun/ 15 On M ar/ 16
M ark to market securit ies 9,665,443 8,944,095 8,072,350 (16.5) (9.7)
Pre-fixed 5,895,654 5,433,391 4,646,388 (21.2) (14.5)
Floating 3,461,438 3,231,039 3,138,376 (9.3) (2.9)
Inflation 223,843 208,309 216,025 (3.5) 3.7
Equity funds 83,916 70,360 70,360 (16.2) 0.0
Other 592 996 1,201 102.8 20.5
H eld to maturity securit ies 2,868,000 3,210,161 3,733,875 30.2 16.3
Pre-fixed 1,863,024 2,160,970 2,655,192 42.5 22.9
Inflation 1,004,976 1,049,192 1,078,683 7.3 2.8
T o tal 12,533,443 12,154,256 11,806,225 (5.8) (2.9)
B alance C hg. %
15.0 15.1 15.7 14.5 15.1 15.7 17.2 14.7
6.3 5.8 5.5 4.7 4.7 4.4 4.5 4.2
67.9 71.3 75.0 75.0 75.4 75.5 73.173.1
10.1 7.1 3.2 5.2 4.3 3.9 4.6 7.4
0.7 0.6 0.7 0.7 0.6 0.5 0.6 0.6
Sep/14 Dec/14 Mar/15 Jun/15 Sep/15 Dec/15 Mar/16 Jun/16
Time deposits and other Debentures and commercial papers
Government bonds Repo + cash
Equity funds
4.0 3.4 2.9 2.3 2.2 2.2 2.3 2.7
42.852.9
59.4 61.0 65.6 62.9 60.7 57.6
52.142.9
36.7 35.8 31.4 34.1 36.1 38.9
1.1 0.9 0.9 0.9 0.8 0.7 0.8 0.9
Sep/14 Dec/14 Mar/15 Jun/15 Sep/15 Dec/15 Mar/16 Jun/16
Inflation Pre-fixed Floating Equity funds

BB Seguridade Participações S.A. | Management Discussion & Analysis 2Q16 101
B A L A N C E S H E E T A N A L Y S I S
Table 99 – Premium Bonds | Balance sheet
S O L V E N C Y
Table 100 – Premium Bonds | Solvency¹
¹ Information based on the accounting principles adopted by SUSEP. Does not include BB Capitalização.
R $ tho usand Jun/ 15 M ar/ 16 Jun/ 16 On Jun/ 15 On M ar/ 16
A ssets 13,408,516 13,175,112 12,879,875 (3.9) (2.2)
Cash and cash equivalents 311 399 111 (64.4) (72.2)
Financial assets 12,533,443 12,154,256 11,806,225 (5.8) (2.9)
Securities and credits receivable 848,628 1,005,516 1,060,407 25.0 5.5
Prepaid expenses 13,132 1,935 1,798 (86.3) (7.1)
Investments 1,239 1,223 1,217 (1.7) (0.4)
Fixed assets 4,388 2,845 2,725 (37.9) (4.2)
Intangible 4,754 4,315 3,829 (19.5) (11.3)
Other assets 2,621 4,623 3,563 35.9 (22.9)
Liabilit ies 12,923,831 12,738,104 12,340,252 (4.5) (3.1)
Accounts payable 101,048 98,579 144,073 42.6 46.1
Premium bonds operations debits 27,773 18,017 24,091 (13.3) 33.7
Technical reserves - premium bonds 12,060,959 11,723,268 11,207,605 (7.1) (4.4)
Other liabilities 734,051 898,240 964,483 31.4 7.4
Shareho lders' equity 484,685 437,008 539,623 11.3 23.5
C hg. %B alance
R $ tho usand Jun/ 15 M ar/ 16 Jun/ 16 On Jun/ 15 On M ar/ 16
A djusted shareho lders' equity (a) 466,794 430,754 533,991 14.4 24.0
M inimum capital required (b) 260,506 260,775 224,232 (13.9) (14.0)
Additional capital for underwritting risk 49,416 50,639 48,921 (1.0) (3.4)
Additional capital for credit risk 212,639 212,132 176,774 (16.9) (16.7)
Additional capital for operating risk 19,332 19,308 18,586 (3.9) (3.7)
Benefit o f correlation between risks (20,881) (21,304) (20,049) (4.0) (5.9)
C apital adequacy (a) - (b) 206,288 169,979 309,760 50.2 82.2
So lvency rat io (a) / (b) - % 179.2 165.2 238.1 59.0 p.p. 73.0 p.p.
B alance C hg. %
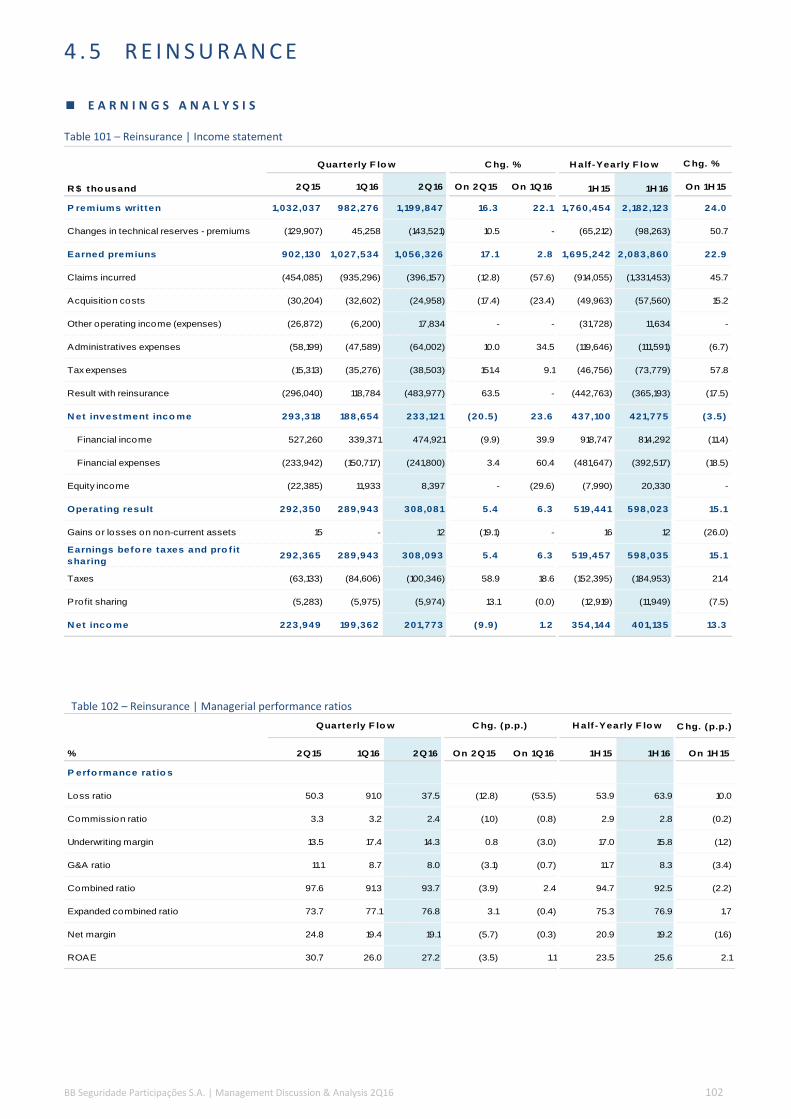
BB Seguridade Participações S.A. | Management Discussion & Analysis 2Q16 102
4 . 5 R E I N S U R A N C E
E A R N I N G S A N A L Y S I S
Table 101 – Reinsurance | Income statement
Table 102 – Reinsurance | Managerial performance ratios
C hg. (p.p.)
% 2Q15 1Q16 2Q16 On 2Q15 On 1Q16 1H 15 1H 16 On 1H 15
P erfo rmance rat io s
Loss ratio 50.3 91.0 37.5 (12.8) (53.5) 53.9 63.9 10.0
Commission ratio 3.3 3.2 2.4 (1.0) (0.8) 2.9 2.8 (0.2)
Underwriting margin 13.5 17.4 14.3 0.8 (3.0) 17.0 15.8 (1.2)
G&A ratio 11.1 8.7 8.0 (3.1) (0.7) 11.7 8.3 (3.4)
Combined ratio 97.6 91.3 93.7 (3.9) 2.4 94.7 92.5 (2.2)
Expanded combined ratio 73.7 77.1 76.8 3.1 (0.4) 75.3 76.9 1.7
Net margin 24.8 19.4 19.1 (5.7) (0.3) 20.9 19.2 (1.6)
ROAE 30.7 26.0 27.2 (3.5) 1.1 23.5 25.6 2.1
Quarterly F lo w C hg. (p.p.) H alf -Yearly F lo w
C hg. %
R $ tho usand 2Q15 1Q16 2Q16 On 2Q15 On 1Q16 1H 15 1H 16 On 1H 15
P remiums writ ten 1,032,037 982,276 1,199,847 16.3 22.1 1,760,454 2,182,123 24.0
Changes in technical reserves - premiums (129,907) 45,258 (143,521) 10.5 - (65,212) (98,263) 50.7
Earned premiuns 902,130 1,027,534 1,056,326 17.1 2.8 1,695,242 2,083,860 22.9
Claims incurred (454,085) (935,296) (396,157) (12.8) (57.6) (914,055) (1,331,453) 45.7
Acquisition costs (30,204) (32,602) (24,958) (17.4) (23.4) (49,963) (57,560) 15.2
Other operating income (expenses) (26,872) (6,200) 17,834 - - (31,728) 11,634 -
Administratives expenses (58,199) (47,589) (64,002) 10.0 34.5 (119,646) (111,591) (6.7)
Tax expenses (15,313) (35,276) (38,503) 151.4 9.1 (46,756) (73,779) 57.8
Result with reinsurance (296,040) 118,784 (483,977) 63.5 - (442,763) (365,193) (17.5)
N et investment inco me 293,318 188,654 233,121 (20.5) 23.6 437,100 421,775 (3.5)
Financial income 527,260 339,371 474,921 (9.9) 39.9 918,747 814,292 (11.4)
Financial expenses (233,942) (150,717) (241,800) 3.4 60.4 (481,647) (392,517) (18.5)
Equity income (22,385) 11,933 8,397 - (29.6) (7,990) 20,330 -
Operat ing result 292,350 289,943 308,081 5.4 6.3 519,441 598,023 15.1
Gains or losses on non-current assets 15 - 12 (19.1) - 16 12 (26.0)
Earnings befo re taxes and pro f it
sharing292,365 289,943 308,093 5.4 6.3 519,457 598,035 15.1
Taxes (63,133) (84,606) (100,346) 58.9 18.6 (152,395) (184,953) 21.4
Profit sharing (5,283) (5,975) (5,974) 13.1 (0.0) (12,919) (11,949) (7.5)
N et inco me 223,949 199,362 201,773 (9.9) 1.2 354,144 401,135 13.3
Quarterly F lo w C hg. % H alf -Yearly F lo w
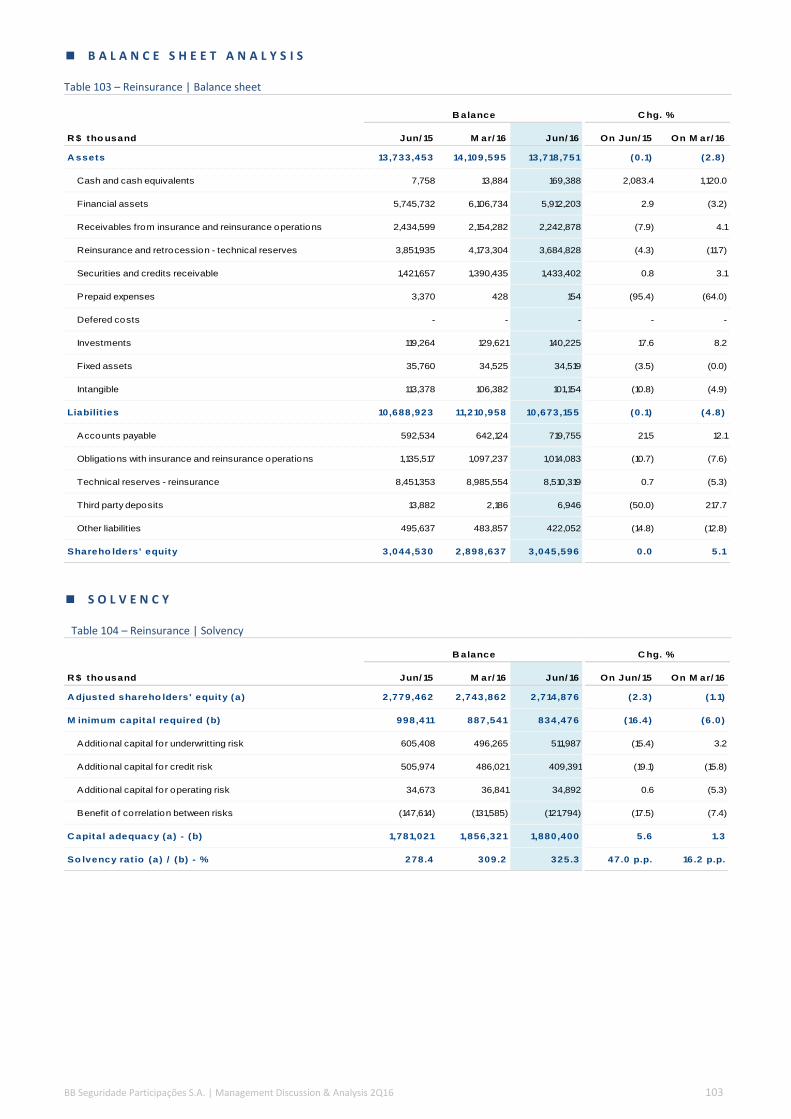
BB Seguridade Participações S.A. | Management Discussion & Analysis 2Q16 103
B A L A N C E S H E E T A N A L Y S I S
Table 103 – Reinsurance | Balance sheet
S O L V E N C Y
Table 104 – Reinsurance | Solvency
R $ tho usand Jun/ 15 M ar/ 16 Jun/ 16 On Jun/ 15 On M ar/ 16
A ssets 13,733,453 14,109,595 13,718,751 (0.1) (2.8)
Cash and cash equivalents 7,758 13,884 169,388 2,083.4 1,120.0
Financial assets 5,745,732 6,106,734 5,912,203 2.9 (3.2)
Receivables from insurance and reinsurance operations 2,434,599 2,154,282 2,242,878 (7.9) 4.1
Reinsurance and retrocession - technical reserves 3,851,935 4,173,304 3,684,828 (4.3) (11.7)
Securities and credits receivable 1,421,657 1,390,435 1,433,402 0.8 3.1
Prepaid expenses 3,370 428 154 (95.4) (64.0)
Defered costs - - - - -
Investments 119,264 129,621 140,225 17.6 8.2
Fixed assets 35,760 34,525 34,519 (3.5) (0.0)
Intangible 113,378 106,382 101,154 (10.8) (4.9)
Liabilit ies 10,688,923 11,210,958 10,673,155 (0.1) (4.8)
Accounts payable 592,534 642,124 719,755 21.5 12.1
Obligations with insurance and reinsurance operations 1,135,517 1,097,237 1,014,083 (10.7) (7.6)
Technical reserves - reinsurance 8,451,353 8,985,554 8,510,319 0.7 (5.3)
Third party deposits 13,882 2,186 6,946 (50.0) 217.7
Other liabilities 495,637 483,857 422,052 (14.8) (12.8)
Shareho lders' equity 3,044,530 2,898,637 3,045,596 0.0 5.1
B alance C hg. %
R $ tho usand Jun/ 15 M ar/ 16 Jun/ 16 On Jun/ 15 On M ar/ 16
A djusted shareho lders' equity (a) 2,779,462 2,743,862 2,714,876 (2.3) (1.1)
M inimum capital required (b) 998,411 887,541 834,476 (16.4) (6.0)
Additional capital for underwritting risk 605,408 496,265 511,987 (15.4) 3.2
Additional capital for credit risk 505,974 486,021 409,391 (19.1) (15.8)
Additional capital for operating risk 34,673 36,841 34,892 0.6 (5.3)
Benefit o f correlation between risks (147,614) (131,585) (121,794) (17.5) (7.4)
C apital adequacy (a) - (b) 1,781,021 1,856,321 1,880,400 5.6 1.3
So lvency rat io (a) / (b) - % 278.4 309.2 325.3 47.0 p.p. 16.2 p.p.
B alance C hg. %

BB Seguridade Participações S.A. | Management Discussion & Analysis 2Q16 104
4 . 6 D E N T A L I N S U R A N C E
E A R N I N G S A N A L Y S I S
Table 105 – Dental Insurance | Income statement
B A L A N C E S H E E T A N A L Y S I S
Table 106 – Dental Insurance | Balance sheet
C hg. %
R $ tho usand 2Q15 1Q16 2Q16 On 2Q15 On 1Q16 1H 15 1H 16 On 1H 15
Operat ing revenues 3,786 4,934 4,882 28.9 (1.1) 3,810 9,816 157.6
Health assistance plans revenues 3,786 4,934 4,882 28.9 (1.1) 3,810 9,816 157.6
Administratives expenses (2,880) (3,438) (3,333) 15.7 (3.1) (3,957) (6,771) 71.1
Tax expenses (405) (306) (370) (8.6) 20.9 (408) (676) 65.7
Operat ing result 501 1,190 1,179 135.3 (0.9) (555) 2,369 -
N et investment inco me 53 112 275 418.9 145.6 108 386 257.4
Financial revenues 82 169 343 318.7 103.1 140 512 265.9
Financial expenses (29) (57) (69) 138.9 21.6 (32) (126) 294.7
Earnings befo re taxes and pro f it
sharing554 1,302 1,453 162.3 11.6 (447) 2,755 -
Taxes - (486) (506) - 4.0 742 (992) -
N et inco me 554 816 947 71.0 16.1 295 1,763 497.6
Quarterly F lo w C hg. % H alf -Yearly F lo w
R $ tho usand Jun/ 15 M ar/ 16 Jun/ 16 On Jun/ 15 On M ar/ 16
A ssets 8,497 13,474 17,037 100.5 26.4
Cash and cash equivalents 406 101 328 (19.3) 224.4
Financial assets 5,873 10,159 11,515 96.1 13.3
Receivables from insurance and reinsurance operations 397 614 2,275 473.1 270.5
Tax assets 1,146 1,803 1,819 58.7 0.9
Other assets 675 797 1,100 63.0 38.1
Liabilit ies 5,891 6,114 8,730 48.2 42.8
Technical reserves 3,897 2,975 5,117 31.3 72.0
Tax liabilities 219 228 311 42.2 36.6
Other liabilities 1,775 2,911 3,302 86.0 13.4
Shareho lders' equity 2,606 7,360 8,307 218.8 12.9
B alance C hg. %

BB Seguridade Participações S.A. | Management Discussion & Analysis 2Q16 105
5 . D I S T R I B U T I O N
B A N C A S S U R A N C E
The main role of an insurance broker (either an individual or an entity) is to intermediate the insurance business between insurance
companies and their clients. The insurance intermediation in Brazil is not required by law, but the brokerage payment is mandatory for
all insurance contracts, regardless the involvement of a broker. According to the law 6,317 as of 1975, in case no broker is involved, the
amount supposed to be paid as brokerage shall be directed to the Fund for Developing the Insurance Culture, managed by the
Foundation National Insurance School– FUNENSEG.
BB Seguridade distributes its products through its own broker, BB Corretora, in the Banco do Brasil channel.The brokerage business in
the bancassurance channel is not a complex business model, as it does not have underwriting risk and it has low capital needs. These
factors are added to the vast footprint and the strong franchise of Banco do Brasil.

BB Seguridade Participações S.A. | Management Discussion & Analysis 2Q16 106
5 . 1 B B C O R R E T O R A
E A R N I N G S A N A L Y S I S
Table 107 – Brokerage | Income statement
C hg. %
R $ tho usand 2Q15 1Q16 2Q16 On 2Q15 On 1Q16 1H 15 1H 16 On 1H 15
B ro kerage revenues 672,566 631,567 728,118 8.3 15.3 1,282,263 1,359,685 6.0
Administrative expenses (73,304) (47,564) (52,217) (28.8) 9.8 (127,909) (99,781) (22.0)
Personnel expenses (400) (53) (1,706) 326.5 3,136.7 (1,871) (1,759) (6.0)
Other operating income (expenses) (2,414) (3,198) (4,210) 74.4 31.6 (1,821) (7,408) 306.8
Tax expenses (49,756) (56,108) (86,677) 74.2 54.5 (94,703) (142,785) 50.8
Operat ing result 546,692 524,643 583,308 6.7 11.2 1,055,958 1,107,951 4.9
N et investment inco me 39,675 35,262 50,133 26.4 42.2 65,156 85,395 31.1
Financial income 39,685 49,872 50,571 27.4 1.4 77,036 100,443 30.4
Financial expenses (10) (14,610) (438) 4,281.3 (97.0) (11,880) (15,048) 26.7
Earnings befo re taxes 586,367 559,905 633,441 8.0 13.1 1,121,114 1,193,346 6.4
Taxes (197,334) (189,397) (212,993) 7.9 12.5 (377,985) (402,390) 6.5
N et inco me 389,033 370,508 420,448 8.1 13.5 743,130 790,955 6.4
C hg. % Quarterly F lo w H alf -Yearly F lo w
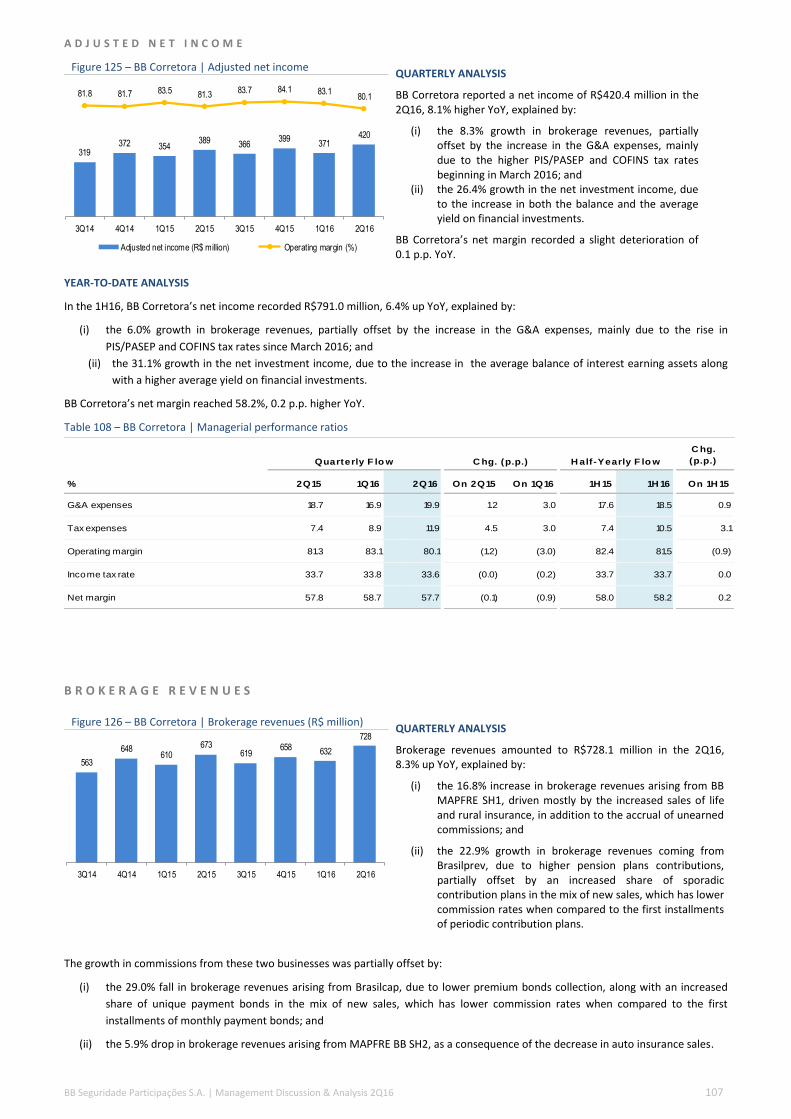
BB Seguridade Participações S.A. | Management Discussion & Analysis 2Q16 107
A D J U S T E D N E T I N C O M E
Figure 125 – BB Corretora | Adjusted net income QUARTERLY ANALYSIS
BB Corretora reported a net income of R$420.4 million in the 2Q16, 8.1% higher YoY, explained by:
(i) the 8.3% growth in brokerage revenues, partially offset by the increase in the G&A expenses, mainly due to the higher PIS/PASEP and COFINS tax rates beginning in March 2016; and
(ii) the 26.4% growth in the net investment income, due to the increase in both the balance and the average yield on financial investments.
BB Corretora’s net margin recorded a slight deterioration of 0.1 p.p. YoY.
YEAR-TO-DATE ANALYSIS
In the 1H16, BB Corretora’s net income recorded R$791.0 million, 6.4% up YoY, explained by:
(i) the 6.0% growth in brokerage revenues, partially offset by the increase in the G&A expenses, mainly due to the rise in
PIS/PASEP and COFINS tax rates since March 2016; and
(ii) the 31.1% growth in the net investment income, due to the increase in the average balance of interest earning assets along
with a higher average yield on financial investments.
BB Corretora’s net margin reached 58.2%, 0.2 p.p. higher YoY.
Table 108 – BB Corretora | Managerial performance ratios
B R O K E R A G E R E V E N U E S
Figure 126 – BB Corretora | Brokerage revenues (R$ million) QUARTERLY ANALYSIS
Brokerage revenues amounted to R$728.1 million in the 2Q16, 8.3% up YoY, explained by:
(i) the 16.8% increase in brokerage revenues arising from BB MAPFRE SH1, driven mostly by the increased sales of life and rural insurance, in addition to the accrual of unearned commissions; and
(ii) the 22.9% growth in brokerage revenues coming from Brasilprev, due to higher pension plans contributions, partially offset by an increased share of sporadic contribution plans in the mix of new sales, which has lower commission rates when compared to the first installments of periodic contribution plans.
The growth in commissions from these two businesses was partially offset by:
(i) the 29.0% fall in brokerage revenues arising from Brasilcap, due to lower premium bonds collection, along with an increased
share of unique payment bonds in the mix of new sales, which has lower commission rates when compared to the first
installments of monthly payment bonds; and
(ii) the 5.9% drop in brokerage revenues arising from MAPFRE BB SH2, as a consequence of the decrease in auto insurance sales.
319372 354
389 366399
371420
81.8 81.7 83.5 81.383.7 84.1 83.1
80.1
3Q14 4Q14 1Q15 2Q15 3Q15 4Q15 1Q16 2Q16
Adjusted net income (R$ million) Operating margin (%)
C hg.
(p.p.)
% 2Q15 1Q16 2Q16 On 2Q15 On 1Q16 1H 15 1H 16 On 1H 15
G&A expenses 18.7 16.9 19.9 1.2 3.0 17.6 18.5 0.9
Tax expenses 7.4 8.9 11.9 4.5 3.0 7.4 10.5 3.1
Operating margin 81.3 83.1 80.1 (1.2) (3.0) 82.4 81.5 (0.9)
Income tax rate 33.7 33.8 33.6 (0.0) (0.2) 33.7 33.7 0.0
Net margin 57.8 58.7 57.7 (0.1) (0.9) 58.0 58.2 0.2
Quarterly F lo w C hg. (p.p.) H alf -Yearly F lo w
563
648610
673619
658 632
728
3Q14 4Q14 1Q15 2Q15 3Q15 4Q15 1Q16 2Q16

BB Seguridade Participações S.A. | Management Discussion & Analysis 2Q16 108
YEAR-TO-DATE ANALYSIS
In the 1H16, brokerage revenues grew by 6.0% YoY, explained by:
(i) the 16.0% increase in brokerage revenues arising from BB MAPFRE SH1, driven mostly by increased sales of life and rural
insurance, in addition to the accrual of unearned commissions; and
(ii) the 14.0% growth in brokerage revenues arising from Brasilprev, in line with the increase in pension plan contributions.
The growth in these two businesses was partially offset by:
(i) the 31.2% contraction in the brokerage revenues arising from Brasilcap, due to lower premium bonds collection along with an
increased share of unique payment bonds in the mix of new sales; and
(ii) the 4.9% drop in the brokerage revenues arising from MAPFRE BB SH2, as a consequence of the decrease in the auto insurance
sales.
Table 109 – BB Corretora | Brokerage revenues breakdown
Figure 127 – BB Corretora | Brokerage revenues breakdown (%)
Figure 128 – BB Corretora | Unearned commissions breakdown (%)
G E N E R A L A N D A D M I N I S T R A T I V E E X P E N S E S
Figure 129 – BB Corretora | G&A expenses QUARTERLY ANALYSIS
In the 2Q16, G&A expenses grew by 15.0% YoY, driven by the 74.2% increase in tax expenses, as a consequence of the publication of the Brazilian Internal Revenue Service Rule Nr. 1,628, dated as of March 17th, 2016, which changed the PIS/PASEP and COFINS tax regime for the insurance brokers.
Due to this change, the insurance brokers, previously framed in the cumulative system, turned to the non-cumulative regime and, as a consequence, the PIS/PASEP and COFINS tax rate on brokerage gross revenues increased from 4.65% to 9.25%. It is worth noting that the taxation on financial revenues remained unchanged at 4.65%.
Under the same analysis, the growth observed in tax expenses was partially offset by the contraction of 28.8% in administrative
expenses, due to lower administrative costs of products and operational support and IT expenses.
C hg. %
R $ tho usand 2Q15 1Q16 2Q16 On 2Q15 On 1Q16 1H 15 1H 16 On 1H 15
SH1 352,517 383,475 411,699 16.8 7.4 685,603 795,174 16.0
SH2 82,088 78,889 77,267 (5.9) (2.1) 164,181 156,156 (4.9)
Brasilprev 133,706 112,066 164,280 22.9 46.6 242,416 276,346 14.0
Brasilcap 102,745 55,899 72,976 (29.0) 30.6 187,338 128,875 (31.2)
Other 1,510 1,238 1,896 25.5 53.1 2,725 3,134 15.0
T o tal 672,566 631,567 728,118 8.3 15.3 1,282,263 1,359,685 6.0
Quarterly F lo w C hg. % H alf -Yearly F lo w
56.3 50.9 54.6 52.459.9 54.8
60.7 56.5
14.812.9
13.5 12.2
13.012.2
12.510.6
15.417.0
17.8 19.915.3
17.417.7
22.6
13.118.6 13.9 15.3 11.4 15.1
8.9 10.0
0.3 0.6 0.2 0.2 0.3 0.5 0.2 0.3
3Q14 4Q14 1Q15 2Q15 3Q15 4Q15 1Q16 2Q16
SH1 SH2 Brasilprev Brasilcap Other
78.0 82.0 82.9 84.9 82.8 83.6 83.3 83.3
7.35.8 5.5 5.2
5.3 4.9 4.9 5.08.7 7.6 7.9 7.4 7.7 7.2 7.5 7.33.4 3.1 2.9 2.2 2.0 2.0 2.2 1.8
2.6 1.4 0.8 0.4 2.2 2.2 2.1 2.6
Sep/14 Dec/14 Mar/15 Jun/15 Sep/15 Dec/15 Mar/16 Jun/16
Life P&C Auto Custom Rural
102119
100126
101 104 107
145
18.2 18.316.5
18.716.3 15.9 16.9
19.9
10.8 10.8 9.111.3
8.9 8.4 8.0 8.0
3Q14 4Q14 1Q15 2Q15 3Q15 4Q15 1Q16 2Q16
G&A Expenses (R$ million) G&A ratio (%) G&A ratio ex-taxes (%)

BB Seguridade Participações S.A. | Management Discussion & Analysis 2Q16 109
YEAR-TO-DATE ANALYSIS
In the 1H16, G&A expenses rose by 11.2% YoY, explained mainly by the 50.8% growth in tax expenses, as a consequence of the
increased PIS/PASEP and COFINS rates. Such growth observed in tax expenses was partially offset by the contraction of 22.0% in
administrative expenses, due to lower administrative costs of products and operational support.
Table 110 – BB Corretora | General & Administrative expenses
Table 111 – BB Corretora | Banco do Brasil distribution network
Source: Banco Central do Brasil
N E T I N V E S T M E N T I N C O M E
Figure 130 – BB Corretora | Net investment income (R$ million) QUARTERLY ANALYSIS
In the 2Q16, the net investment income grew by 26.4% YoY, due to the increased average balance of interest earning assets along with the higher average yield on financial investments.
The financial income grew by 27.4% YoY, driven by:
(i) the 1.3 p.p. increase in the average yield on interest earning assets, driven mainly by the higher average Selic rate; and
(ii) the 10.8% increase in the average balance of financial investments.
YEAR-TO-DATE ANALYSIS
In the 1H16, the net investment income grew by 31.1% YoY, as a result of the increased average balance of interest earning assets and
the higher average yield on financial investments.
C hg. %
R $ tho usand 2Q15 1Q16 2Q16 On 2Q15 On 1Q16 1H 15 1H 16 On 1H 15
A dministrat ive expenses (73,304) (47,564) (52,217) (28.8) 9.8 (127,909) (99,781) (22.0)
Administrative cost of products (24,832) (16,298) (15,573) (37.3) (4.4) (53,736) (31,871) (40.7)
Operational support (38,499) (20,957) (28,432) (26.1) 35.7 (55,040) (49,389) (10.3)
Information technology (9,822) (10,130) (8,184) (16.7) (19.2) (18,774) (18,314) (2.4)
Other (152) (179) (29) (81.1) (84.0) (360) (208) (42.3)
T ax expenses (49,756) (56,108) (86,677) 74.2 54.5 (94,703) (142,785) 50.8
PIS/PASEP (4,630) (6,560) (12,343) 166.6 88.2 (8,835) (18,902) 113.9
COFINS (28,490) (34,928) (57,359) 101.3 64.2 (54,372) (92,287) 69.7
ISS (16,635) (14,621) (16,974) 2.0 16.1 (31,495) (31,594) 0.3
IOF (1) (0) (1) 33.6 572.3 (1) (2) 53.4
P erso nnel expenses (400) (53) (1,706) 326.5 3,136.7 (1,871) (1,759) (6.0)
Other o perat ing inco me (expenses) (2,413) (3,198) (4,210) 74.5 31.6 (1,820) (7,408) 307.0
G&A Expenses (125,872) (106,923) (144,810) 15.0 35.4 (226,303) (251,733) 11.2
Quarterly F lo w C hg. % H alf -Yearly F lo w
N umber o f
branches
M arket share
(%)
N umber o f
branches
M arket share
(%)
N umber o f
branches
M arket share
(%)
B anco do B rasil distribut io n
netwo rk5,544 24.0 5,428 23.8 5,428 23.9
Northeast 1,190 32.4 1,134 31.2 1,136 31.4
North 330 28.7 320 27.9 320 27.7
M idwest 497 26.9 482 26.4 483 26.5
South 1,087 24.9 1,065 24.8 1,057 24.9
Southeast 2,440 20.2 2,427 20.4 2,432 20.5
Jun/ 16Jun/ 15 M ar/ 16
23
34
25
40
34
49
35
50
3Q14 4Q14 1Q15 2Q15 3Q15 4Q15 1Q16 2Q16

BB Seguridade Participações S.A. | Management Discussion & Analysis 2Q16 110
The financial Income grew by 30.4% YoY, driven by:
(i) the 1.3 p.p. increase in the yield on interest earning assets, driven by the higher average Selic rate; and
(ii) the 13.2% increase in the average balance of financial investments.
Financial expenses rose by 26.7%, explained by the expansion in the average balance of dividends payable and the higher yield on
interest bearing liabilities, due to the higher Selic rate.
Table 112 – BB Corretora | Quarterly figures – Earning assets average balance and interest rates
Table 113 – BB Corretora | Quarterly figures – Interest bearing liabilities average balance and interest rates
Table 8 – BB Corretora | Year-to-date figures – Earning assets average balance and interest rates
Table 9 – BB Corretora | | Year-to-date figures – Interest bearing liabilities average balance and interest rates
R $ tho usandA verage
balanceR evenues
A nnualized
rate (%)
A verage
balanceR evenues
A nnualized
rate (%)
Earning assets
Cash and financial instruments 1,287,828 36,482 12.2 1,441,940 47,093 13.7
Other assets 147,721 3,038 8.8 163,865 3,477 8.8
Current tax assets 74,002 165 0.9 67,430 - -
T o tal 1,509,551 39,685 11.3 1,673,236 50,570 12.6
2Q15 2Q16
R $ tho usandA verage
balanceExpenses
A nnualized
rate (%)
A verage
balanceExpenses
A nnualized
rate (%)
Interest bearing liabilit ies
Dividends payable 371,566 - - 395,478 - -
Other liabilities 410 (10) 9.7 398 (8) 7.7
T o tal 371,975 (10) 0 .0 395,876 (8) 0 .4
2Q15 2Q16
R $ tho usandA verage
balanceR evenues
A nnualized
rate (%)
A verage
balanceR evenues
A nnualized
rate (%)
Earning assets
Cash and financial instruments 1,477,362 71,043 10.2 1,680,585 93,628 11.6
Other assets 146,327 5,810 8.4 162,174 6,815 8.7
Current tax assets 63,807 183 0.6 67,430 - -
T o tal 1,687,497 77,036 9 .7 1,910,189 100,443 11.0
1H 15 1H 16
R $ tho usandA verage
balanceExpenses
A nnualized
rate (%)
A verage
balanceExpenses
A nnualized
rate (%)
Interest bearing liabilit ies
Dividends payable 716,909 (11,860) 3.4 778,011 (14,602) 3.8
Other liabilities 405 (20) 10.0 394 (15) 7.8
T o tal 717,314 (11,880) 3 .4 778,405 (14,618) 3 .9
1H 15 1H 16

BB Seguridade Participações S.A. | Management Discussion & Analysis 2Q16 111
B A L A N C E S H E E T A N A L Y S I S
Table 10 – Brokerage | Balance sheet
R $ tho usand Jun/ 15 M ar/ 16 Jun/ 16 On Jun/ 15 On M ar/ 16
A ssets 2,621,456 2,263,097 2,936,295 12.0 29.7
Cash and cash equivalents 1,334,449 523,092 1,473,171 10.4 181.6
Securities 186,316 654,375 233,267 25.2 (64.4)
Current tax assets 107,987 163,862 261,562 142.2 59.6
Commission receivable 842,549 760,498 801,277 (4.9) 5.4
Other assets 150,155 161,270 167,018 11.2 3.6
Liabilit ies 2,586,455 1,857,614 2,901,319 12.2 56.2
Dividends payable 743,131 - 790,956 6.4 -
Provision 9,165 11,050 11,653 27.1 5.5
Current tax liabilities 214,991 215,283 434,940 102.3 102.0
Unearned commissions 1,594,929 1,612,894 1,643,086 3.0 1.9
Other liabilities 24,239 18,387 20,684 (14.7) 12.5
Shareho lders' equity 35,001 405,483 34,976 (0.1) (91.4)
C hg. % B alance


BB Seguridade Participações S.A. | Management Discussion & Analysis 2Q16 113
6 . D E F I N I T I O N S
C O M M O N R A T I O S
Quarterly adjusted ROAE annualized = (adjusted net income / average equity) x 4;
Average volume = net change - average rate
Average rate = (current period interest / current period balance) x (previous period balance) - (previous period interest)
Net change = current period interest - previous period interest
Assets annualized rate = interest revenues / average earning assets balance
Liabilities annualized rate = interest expenses / average interest bearing liabilities
I N S U R A N C E
Loss Ratio = claims incurred / earned premiums;
Commission Ratio = acquisition costs / earned premiums;
Technical Margin = (earned premiums + policies issuance revenue + claims incurred + acquisition costs + result with reinsurance) /
earned premiums;
G&A Ratio = (administrative expenses + tax expenses + other operating income (expenses)) / earned premiums;
Combined Ratio = (policies issuance revenue + claims incurred + acquisition costs + result with reinsurance + administrative expenses +
tax expenses + other operating income (expenses)) / earned premiums;
Expanded combined ratio = (policies issuance revenue + claims incurred + acquisition costs + result with reinsurance + administrative
expenses + tax expenses + other operating income (expenses)) / (earned premiums + net investment income).
M A N A G E R I A L
Earned Premiums = premiums written – premiums written in raw reinsurance – changes in technical reserves – changes in expenses
with reinsurance provisions;
Retained claims = claims incurred – indemnity claims (recovery) – claims expenses (recovery) – changes in claims provision IBNR –
salvages assets – changes in claim provision IBNER PSL – change of expenses related of IBNR;
Commission = acquisition costs – commission return;
G&A expenses = administrative expenses + tax expenses + other operating income (expenses);

BB Seguridade Participações S.A. | Management Discussion & Analysis 2Q16 114
P E N S I O N P L A N S
Commission Ratio = acquisition cost / income and premiums contributions
Cost to income = (changes in other technical reserves + expenses with benefits, redemptions and claims + acquisition costs +
administrative expenses + tax expenses + other operating income (expenses)) / (net revenues with contributions and VGBL premiums +
revenues with management fee + earned premiums)
P R E M I U M B O N D S
Lottery Ratio = lottery results / net revenue with premium bonds;
Commission Ratio = acquisition costs / net revenue with premium bonds;
G&A Ratio = (administrative expenses + tax expenses + other operating income (expenses)) / net revenue with premium bonds;
Reserve quote = change in provision for redemption / premium bonds collection
Premium Bond Margin = result with premium bonds / net revenue with premium bonds;
Net Margin = adjusted net income / net revenue with premium bonds.
Spread = average yield on interest earning assets – average yield on interest bearing liabilities
R E I N S U R A N C E
Claim Ratio = claims incurred / earned premiums;
Commission Ratio = acquisition costs / earned premiums;
Technical Margin = (claims incurred + acquisition costs + result with reinsurance) / earned premiums;
G&A Ratio = (administrative expenses + tax expenses + other operating income (expenses)) / earned premiums;
Combined Ratio = (claims incurred + acquisition costs + result with reinsurance + administrative expenses + tax expenses + other
operating income (expenses)) / earned premiums;
Expanded combined ratio = (claims incurred + acquisition costs + result with reinsurance + administrative expenses + tax expenses +
other operating income (expenses)) / (earned premiums + net investment income).
B R O K E R A G E
Adjusted Operational Margin = operational results / brokerage revenues;
Adjusted Net Margin = adjusted net income / brokerage revenues.