measurement and analysis of fast magnetic fluctuations in tpe
TRANSCRIPT
2007 March 27 12th IEA/RFP Workshop
Measurement and Analysis ofFast Magnetic Fluctuations
in the Edge region of TPE-RXReversed-Field Pinch Plasma
Measurement and Analysis ofFast Magnetic Fluctuations
in the Edge region of TPE-RXReversed-Field Pinch Plasma
National Institute of Advanced IndustrialScience and Technology (AIST)
Kiyoyuki Yambe, Satoru Kiyama, Lorenzo Frassinetti,Yoichi Hirano, Haruhisa Koguchi, Hajime Sakakita
National Institute of Advanced IndustrialScience and Technology (AIST)
Kiyoyuki Yambe, Satoru Kiyama, Lorenzo Frassinetti,Yoichi Hirano, Haruhisa Koguchi, Hajime Sakakita

OutlineOutline• Motivation• TPE-RX RFP plasma• Measurement system of Edge region• Detail of Fast Complex Edge Probe (CEP)• Measurement results of CEP
Toroidal magnetic fluctuation CEP vs MMS• Time evolution of δBp power spectrum
High Θ and Low Θ operationD2 and H2 discharges
• Summary

Back ground and Purpose 1Back ground and Purpose 1Reversed-Field Pinch (RFP) PlasmaInstability large, Particle and Energy confinements
are poor compared with Tokamak etc..
Instability is caused by magnetic andelectrostatic fluctuations.
Pulsed Poloidal Current Drive (PPCD)→suppressed magnetic and electrostatic
fluctuations at center→Good confinement state

Back ground and Purpose 2Back ground and Purpose 2More good confinement state・・・
In the edge region, suppressed magneticand electrostatic fluctuations
TPE-RX RFP has the extensive magnetic measurementsystem outside vacuum vessel.
→We have observed magnetic fluctuationswith less than 5 kHz (slow fluctuations).
In order to measure fast fluctuations (more than 5 kHz),we developed a newly complex edge probe
which is set at inside vacuum vessel.

OutlineOutline• Motivation• TPE-RX RFP plasma• Measurement system of Edge region• Detail of Fast Complex Edge Probe (CEP)• Measurement results of CEP
Toroidal magnetic fluctuation CEP vs MMS• Time evolution of δBp power spectrum
High Θ and Low Θ operationD2 and H2 discharges
• Summary

TPE-RX Reversed-Field PinchTPE-RX Reversed-Field Pinch
-50
0
50
100
150
200
250
-0.5
0
0.5
1
1.5
2
2.5
0 20 40 60 80 100
200kA Standard
Ip [kA]
Btwin [mT] F
Theta
Ip [kA], Btwin [mT]
Theta, F
Time [ms]
• Major radius : 1.72m• Minor radius : 0.45m• Triple shell• Molybdenum limiters
• Plasma current : Ip ~ 200 kA• Pinch parameter : Θ = Bpw/<Bt> ~ 1.6• Reversed parameter : F = Btw/<Bt>~-0.16• Lifetime t ~ 80 ms

Measurement system of Edge regionMeasurement system of Edge regionComplex Edge Probe (new)
TPE-RX Reversed-Field Pinch
Measurement system in the edge region
→Extensive Magnetic Measurement System (MMS)
Measurement for Toroidal magnetic field BtPoloidal magnetic field BpRadial magnetic field Br
Setup outside vacuum vesselFluctuation of less than 5 kHz(Low frequency band)
In order to measure for fast fluctuation of high than 5 kHz,
we develop a newly Complex Edge Probe (CEP)
Poloidal cross-sectional in TPE-RX

Fast Complex Edge ProbeFast Complex Edge ProbeMeasurement1. Magnetic fluctuations
Toroidal magneticfluctuation : δBtPoloidal magneticfluctuation : δΒpRadial magneticfluctuation : δBr
2. Electrostatic fluctuationsToroidal electric field : EtPoloidal electric field : EpRadial electric field : Er(Estimate from E = (Vf1-Vf2)/d)
Structure of CEP• Outer radius is 14mmφ• 6 pins for electrostatic probe• Built-in Magnetic probes• Movable r = 0.45 m~0.485 m
Outer radius:14mmφ Length:229mm
φ
rθ
2.0
2.4
3.5φ
0.5 0.53.0
6.0
1.0 1.0
0.5
0.25 0.25
0.5
2.0
2.4
3.5φ
4.5φ
3.5φ
4.5φ
4.5φ
0.1C
Complex Edge Probe (CEP)
Bobbin of magnetic pick-up coils
Boron Nitride

OutlineOutline• Motivation• TPE-RX RFP plasma• Measurement system of Edge region• Detail of Fast Complex Edge Probe (CEP)• Measurement results of CEP
Toroidal magnetic fluctuation CEP vs MMS• Time evolution of δBp power spectrum
High Θ and Low Θ operationD2 and H2 discharges
• Summary
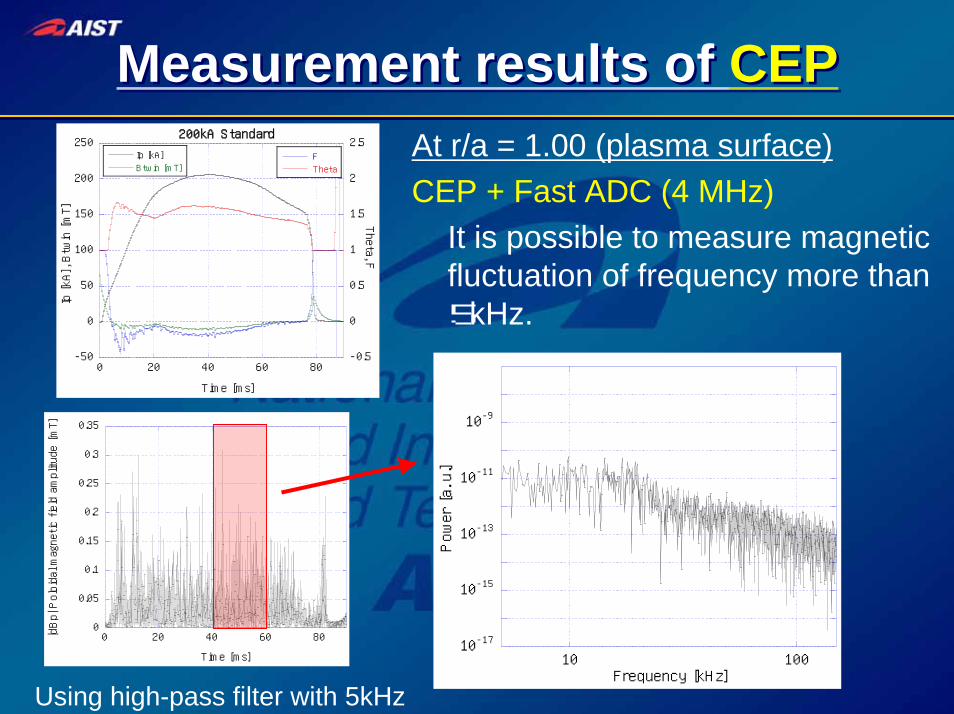
Measurement results of CEPMeasurement results of CEPAt r/a = 1.00 (plasma surface)CEP + Fast ADC (4 MHz)
It is possible to measure magnetic fluctuation of frequency more than 5kHz.
-50
0
50
100
150
200
250
-0.5
0
0.5
1
1.5
2
2.5
0 20 40 60 80
200kA Standard
Ip [kA]
Btwin [mT] F
Theta
Ip [kA], Btwin [mT]
Theta, F
Time [ms]
10-17
10-15
10-13
10-11
10-9
10 100
Power [a. u.]
Frequency [kHz]
0
0.05
0.1
0.15
0.2
0.25
0.3
0.35
0 20 40 60 80|dBp| Poloidal magnetic field amplitude [mT]
Time [ms]
Using high-pass filter with 5kHz

Toroidal magnetic fluctuation with locked modeToroidal magnetic fluctuation with locked mode
0
0.5
1
1.5
2
0 10 20 30 40 50 60 70 80
MMS woLMCEP woLM
δBt A
mpl
itude
[mT]
Time [ms]
0
0.5
1
1.5
2
0 10 20 30 40 50 60 70 80
MMS wLMCEP wLM
δBt A
mpl
itude
[mT]
Time [ms]
LM
MMS vs CEP• Toroidal magnetic fluctuation amplitude MMS < CEP• Case with Locked Mode (LM) MMS > CEP
Fluctuations change with LM?(Fluctuations rapidly increase?)Problem on the measurement?
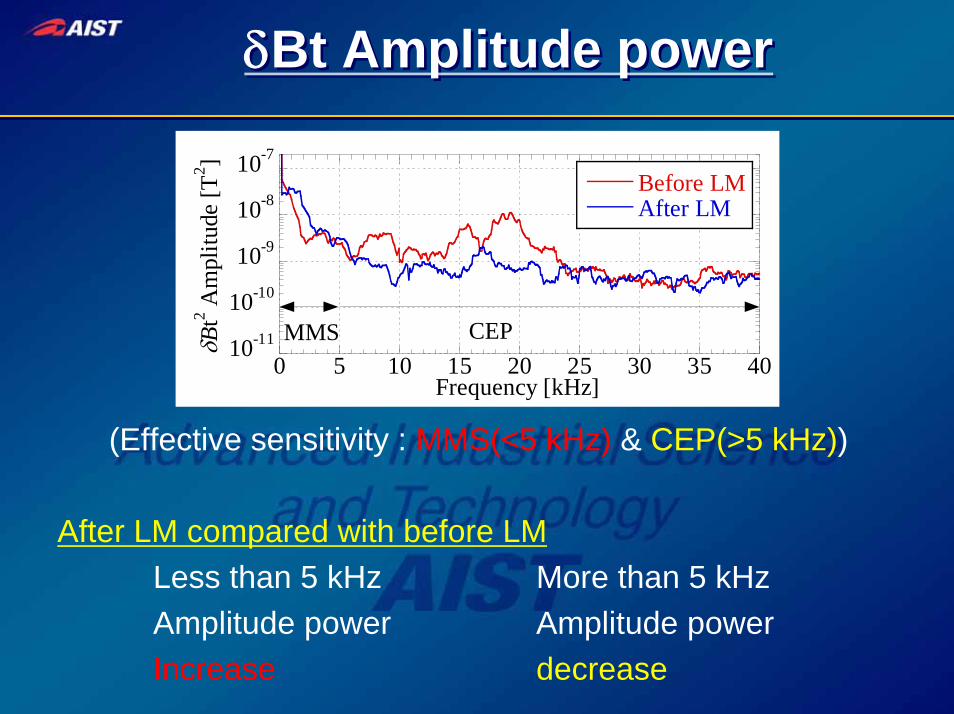
δBt Amplitude powerδBt Amplitude power
10-11
10-10
10-9
10-8
10-7
0 5 10 15 20 25 30 35 40
Before LMAfter LM
δBt2 A
mpl
itude
[T2 ]
Frequency [kHz]
MMS CEP
(Effective sensitivity : MMS(<5 kHz) & CEP(>5 kHz))
After LM compared with before LMLess than 5 kHz More than 5 kHzAmplitude power Amplitude powerIncrease decrease

Low frequency and High frequencyLow frequency and High frequency
0
5x10⁻⁹
1x10⁻⁸
1.5x10⁻⁸
2x10⁻⁸
10 12 14 16 18 20
CEP Before LMCEP After LM
δBt2 A
mpl
itude
[T2 ]
Frequency [kHz]0
2x10-84x10-86x10-88x10-81x10-7
1.2x10⁻⁷
0 1 2 3 4 5
MMS Before LMMMS After LM
δBt2 A
mpl
itude
[T2 ]
Frequency [kHz]
• Low frequency regionAmplitude powers increase less than 3 kHz.
• High frequency regionAmplitude powers decrease between 11 kHz and 18 kHz.
After LMAmplitude powers of fast fluctuations shift to
slow fluctuations.
Main n = 6 in TPE-RX

Fluctuation amplitude shiftFluctuation amplitude shift
0
0.1
0.2
0.3
0.4
0.5
0 10 20 30 40 50 60 70 80
MMS <10 kHzCEP >5 kHz
δBt A
mpl
itude
[mT]
Time [ms]
LM
Fluctuation amplitude signals by MMS using a band-pass filter (1 kHz – 10 kHz) and CEP (5 kHz – 20 kHz)
Before and After LMFluctuation amplitudes are same levels.

OutlineOutline• Motivation• TPE-RX RFP plasma• Measurement system of Edge region• Detail of Fast Complex Edge Probe (CEP)• Measurement results of CEP
Toroidal magnetic fluctuation CEP vs MMS• Time evolution of δBp power spectrum
High Θ and Low Θ operationD2 and H2 discharges
• Summary
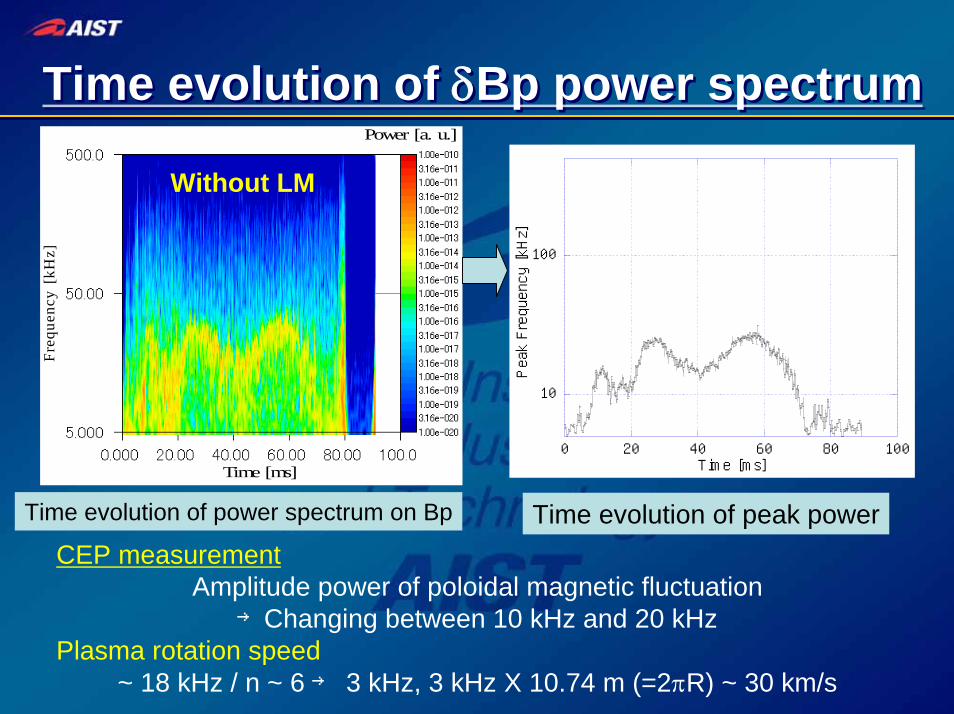
Time evolution of δBp power spectrumTime evolution of δBp power spectrum
Time [ms]
Freq
uenc
y[k
Hz]
Power [a. u.]
Time evolution of power spectrum on Bp Time evolution of peak power
10
100
0 20 40 60 80 100
Peak Frequency [kHz]
Time [ms]
Without LM
CEP measurementAmplitude power of poloidal magnetic fluctuation→Changing between 10 kHz and 20 kHz
Plasma rotation speed~ 18 kHz / n ~ 6 → 3 kHz, 3 kHz X 10.74 m (=2πR) ~ 30 km/s

δBp in High Θ operationδBp in High Θ operation
Time evolutions of Θ and F. Time evolutions of δBp
-0.5
0
0.5
1
1.5
2
2.5
-0.5
0
0.5
1
1.5
2
2.5
0 20 40 60 80
DeepStandardShallow
HighStandardLow
F
Theta
Time [ms]
5
678910
20
30
40
50
0 20 40 60 80
HighStandardLow
Peak Frequency [kHz]
Time [ms]
High Θ and Deep F < -0.25The frequency of dBp increases to about 30 kHz with saw-toothed crashes.
Low Θ < 1.5 and Shallow F > -0.1The frequency of dBp has about 20 kHz.

Dependence on frequency in Θ&FDependence on frequency in Θ&F
Dependence on frequency in F Dependence on frequency in Θ
5
678910
20
30
40
50
1.3 1.4 1.5 1.6 1.7 1.8
HighStandardLow
Frequency [kHz]
Theta
5
678910
20
30
40
50
-0.5 -0.4 -0.3 -0.2 -0.1 0
DeepStandardShallow
Frequency [kHz]
F
Peaked F ~ -0.15、Θ ~ 1.55Θ and F have frequency trend.
→In the edge region, resonance n numbers ・・・

D2 and H2 DischargesD2 and H2 Discharges
5
678910
20
30
40
50
1.3 1.4 1.5 1.6 1.7 1.8
D2 HighH2 High
Frequency [kHz]
Theta
5
678910
20
30
40
50
1.3 1.4 1.5 1.6 1.7 1.8
D2 StandardH2 Standard
Frequency [kHz]
Theta
Case of standard operationD2 discharge and H2 discharge are same trends.
High Θ operationIn H2 discharge, the frequency decreases more than Θ > 1.6.→The plasma rotation hardly recoveries after the saw-toothed crashes.
In H2 case, a momentum large decrease…

OutlineOutline• Motivation• TPE-RX RFP plasma• Measurement system of Edge region• Detail of Fast Complex Edge Probe (CEP)• Measurement results of CEP
Toroidal magnetic fluctuation CEP vs MMS• Time evolution of δBp power spectrum
High Θ and Low Θ operationD2 and H2 discharges
• Summary

SummarySummary
1. Fast magnetic fluctuations (δB) are measured by a newly developed CEP in the edge region of TPE-RX RFP plasma. The δB by CEP (inside vacuum vessel) are compared with those by MMS (outside vacuum vessel).
2. The δB levels before and after the appearance of the LM are compared in both CEP and MMS signals. It is found that the rapid increase of δB signal by MMS just after the LM is mainly caused by the slowing down of the plasma rotation.
3. We found that the frequencies of δB amplitude power show more than 10 kHz by CEP measurement.→ Θ and F have frequency trend.