measurement in the systems domain ronan fitzpatrick school of computing, dublin institute of...
Post on 21-Dec-2015
219 views
TRANSCRIPT

Measurement in the Systems Domain
Ronan FitzpatrickSchool of Computing, Dublin Institute of Technology.
March 2007

Overview
Quotations Overview of measurement Mainstream systems metrics Categories of Knowledge
Management metrics Deriving and validating metrics Positioning measurement.

Quotations
“Measure what is measurable, and make measurable what is not so”.
(Galileo Galilei )

Quotations “I often say that when you can measure what you
are speaking about, and express it in numbers, you know something about it; but when you cannot measure it, when you cannot express it in numbers, your knowledge is of a meagre and unsatisfactory kind; it may be the beginning of knowledge, but you have scarcely in your thoughts advanced to the state of science, whatever the matter may be”.
(Lord Kelvin, 1883)
Quotations
“You can’t control what you can’t measure”.
(DeMarco, 1982; p3)
“We must be bold in our attempts at measurement. Just because no one has measured some attribute of interest does not mean that it cannot be measured satisfactorily”.
(Fenton and Pfleeger, 1996; p20)

Measurement – The vocabulary
Measure Indirect measure Metric Software metrics

A structural model of measurement – Kitchenham et. al. (1995)
Software measurement Applying the formality of scientific
measurement to software products.
Definition Software measurements [that is] using
numerical ratings to measure the complexity and reliability of source code, the length and quality of the development process and the performance of the application when completed.
(Online computing dictionary by Farlex).
Software measurement
Predictive
Assessment
Software metrics
Tom Gilb (1976) explains that in his book “the term ‘metrics’ simply means
measures … that are quantified numerically and have useful accuracy and reliability”.

Proposed by Halstead in 1972 & 1975 Hypothesised that algorithms, considered as
distillations of thought, may possess a general structure which obeys physical laws.
Based on the number of operators and operands in a program.
Measurement of small algorithms yields data, which is suitable for estimating the time required to program the algorithms.
Halstead’s Elements of software science

Gilb’s (1976) - Bebugging
Gilb (1976) devised bebugging to measure the number of errors in a program.
Introduced intentional errors into a program
Based on the percent of these intentional errors that testers found he argued for an estimate of how many actual errors testers would find.

McCabe’s (1976) Software complexity measure
1
3 2
4
5
6
8 7
n1
n2
n3
n4
n5
Nodes = n1 , n2 , n3 , n4 , n5
Arcs = 1, 2, 3, 4, 5, 6, 7, 8
Uses a simple formula
Cyclomatic complexity v (F) = (Number of arcs – number of nodes) + 2
i.e., v(F) = (8 – 5) + 2 = 5
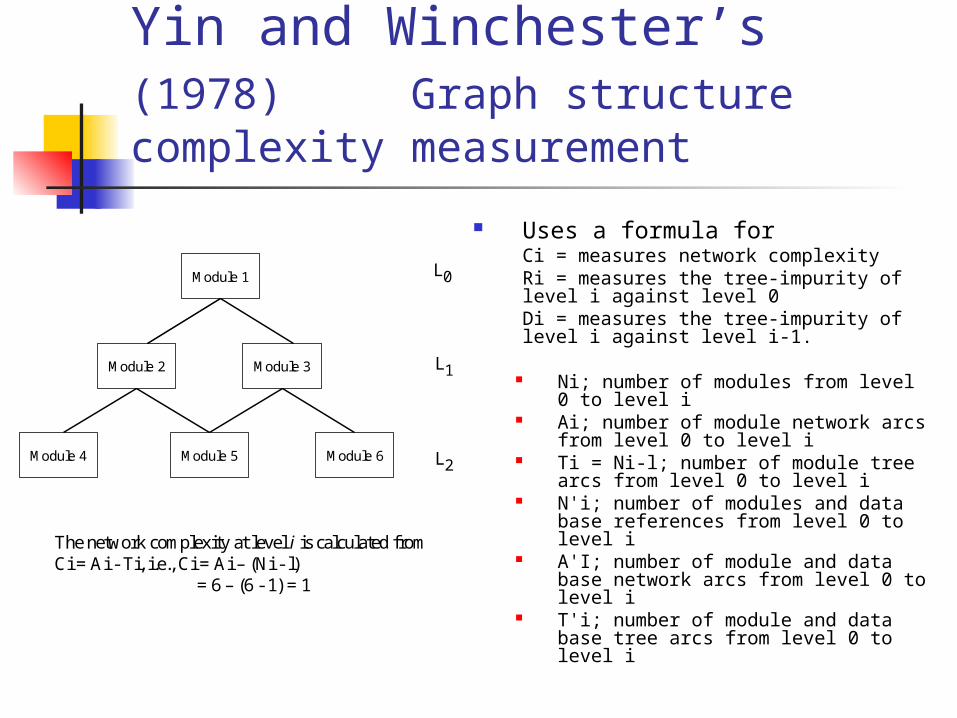
Yin and Winchester’s (1978) Graph structure complexity measurement
Uses a formula for Ci = measures network complexityRi = measures the tree-impurity of level i against level 0Di = measures the tree-impurity of level i against level i-1.
Ni; number of modules from level 0 to level i
Ai; number of module network arcs from level 0 to level i
Ti = Ni-l; number of module tree arcs from level 0 to level i
N'i; number of modules and data base references from level 0 to level i
A'I; number of module and data base network arcs from level 0 to level i
T'i; number of module and data base tree arcs from level 0 to level i
L0
L1
L2
Module 1
Module 2 Module 3
Module 6Module 5Module 4
The network complexity at level i is calculated fromCi = Ai - Ti, i.e., Ci = Ai – (Ni - l)
= 6 – (6 - 1) = 1

Albrect - (1979) Function Point analysis
Function Point items Weight Simple Average Complex Number of external inputs x 3 x 4 x 6 Number of external outputs x 4 x 5 x 7 Number of external inquiries x 3 x 4 x 6 Number of internal logical files x 7 x 10 x 15 Number of external interface files.
x 5 x 7 x 10
Function Point items Average Item
count Calculation for an ‘Average’ project
Number of external inputs 25 25 x 4 = 100 Number of external outputs 54 54 x 5 = 270 Number of external inquiries 18 18 x 4 = 72 Number of internal files 6 6 x 10 = 60 Number of external interface files. 3 3 x 7 = 21 Total unadjusted function points (UFPs) 523
Function Points = UFPs x (0.65 + 0.01 x (DI1 to DI14))

Albrect - (1979) Function Point analysis
Assuming Di = 3 for all 14 characteristics
(DI1 to DI14) = 14 x 3 = 42FP = 523 x [0.65 + 0.01 x 42]
= 523 x [0.65 + 0.42]= 560
Characteristic DI Characteristic DI Data communications On-line update Distributed data processing Complex processing Performance Reusability Heavily used configuration Installation ease Transaction rate Operation ease On-line data entry Multiple sites End user efficiency Facilitate change
Total degree of influence = (DI1 to DI14)
DI ValuesNot present or No influence = 0Insignificant influence = 1Moderate influence = 2Average influence = 3Significant influence = 4Strong influence throughout = 5

Having calculated the Function points Use number of lines of code (LOC) per
function point in order to calculate total lines of Code in a project.
LOC varies per programming language.
Albrect - (1979) Function Point analysis

Originally named COCOMO, the COnstructive COst MOdel
Devised by Barry Boehm in 1981 a method for estimating project cost, effort,
and schedule.
Has since been re-designated COCOMO 81.
The metrics of COCOMO 81 are styled Person-Months (PM), Time to Develop (TDEV)
and Thousands of Delivered Source Instructions (KDSI).
COCOMO - (1981)
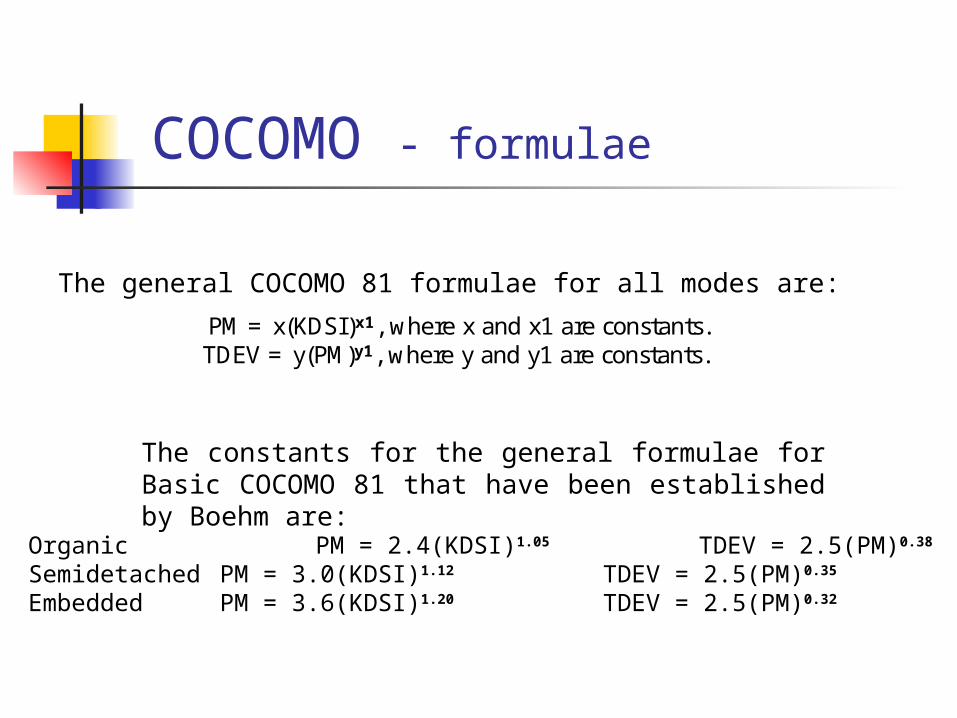
COCOMO - formulae
PM = x(KDSI)x1, where x and x1 are constants.TDEV = y(PM)y1, where y and y1 are constants.
Organic PM = 2.4(KDSI)1.05 TDEV = 2.5(PM)0.38
Semidetached PM = 3.0(KDSI)1.12 TDEV = 2.5(PM)0.35
Embedded PM = 3.6(KDSI)1.20 TDEV = 2.5(PM)0.32
The constants for the general formulae for Basic COCOMO 81 that have been established by Boehm are:
The general COCOMO 81 formulae for all modes are:

Henry and Hafura - (1981) Information flow complexity
Based on formulaModule 1
Module 2 Module 3
Module 6Module 5Module 4
3232111Module 6
1548443632Module 5
012010Module 4
728913Module 3
1020451622Module 2
12030412Module 1
complexitylength((Fi) * (Fo))2Fan-out (Fo)
Fan-in (Fi)
Module
3232111Module 6
1548443632Module 5
012010Module 4
728913Module 3
1020451622Module 2
12030412Module 1
complexitylength((Fi) * (Fo))2Fan-out (Fo)
Fan-in (Fi)
Module
Information flow complexity (M) = Length (M) * ((fan-in(M)) * (fan-out(M)))2

DeMarco - (1982) Bang per Buck (BPB)
Proprietary
All Projects RE
FP
DEOFP
Scientific Commercial
Data-strong
Hybrid
Function-strong

Modern measurement Usability
Effectiveness, Efficiency, Safety and Satisfaction
Heuristic evaluation OO measurement Internet measurement Website measurement Accessibility
Underpinning motivation
Generally based on the notion that some elements of an entity can be
measured a formula can be derived that uses
those measures a value can be calculated that is a
reliable predictor of some attribute of an entity.

Categories of KM metrics (Bose, 2004)
Human capital Structural capital Customer capital Organisational capital Innovation capital Process capital Intellectual capital Other intangible assets

Models COCOMO Function Points Factor-Criteria-metric Goal/Question/Metric paradigm
Deriving and Validating metrics – models, methods and methodology
Methods Theoretical validation
“is concerned with demonstrating that a measure is [mathematically] measuring the concept it is purporting to measure”.
Briand et al., (1998) Empirical validation
“validation of prediction systems involves experimentation and hypothesis testing. Rather than being a mathematical proof, validation involves confirming or refuting the hypothesis”.
Fenton and Pfleeger (1996:p104)
Deriving and Validating metrics – models, methods and methodology

Stages of the metrics methodology
(Shepperd and Ince, 1993) Methodology
Problem identification
Informal model
Formal models and axiomatisation
Theoretical evaluation
Empirical evaluation
New models/hypotheses
Application
Using metrics
Complexity measurement Systems sizing and estimating Production control Quality assurance

A model for a metric validation study - Fenton &
Pfleeger (1996;p125) Conception
e.g., a measure of a website’s design is a valid predictor of a visitor’s engagement experience when visiting the website.
Design State an hypothesis
Preparation e.g., the size of the study – websites and visitors, The
study environment, The empirical validation team, The timescale
Execution – Data gathering Analysis
Using statistical methods and data analysis techniques to show the validity of the predictor.
Documentation and decision making

Statistical analysis
7010 20 30 40 50 60 80 90 100
Calculated quality-of-product ratio(predictor; independent; explanatory variable)
10
20
30
40
50
60
70
8090
100
Cal
cula
ted
me
dian
Qua
lity-
of-u
se r
atio
(pre
dict
ed;
dep
ende
nt; r
espo
nse
varia
ble
)
Predicted quality-of-use ratio
Calculated quality-of-product ratio
Positioning measurement
Numbers - Scientific domain Ancient civilisations
Numbers in the Arts? Van Gough Read & Write
Numbers in nature? What have they got to do with a
mother and her new born babe?

Beware the term
It is advocated that the term ‘metric’ should be avoided. Card (2003) writes “
Avoid use of [the term] metric (a term not used in CMM or CMMI)".
References IEEE Std 1061 (1998) IEEE Standard for a Software Quality Metrics
Methodology, IEEE Computer Society, Institute of Electrical and Electronics Engineers, Inc., 345 East 47th Street, New York, NY 1W1Z USA
ISO/IEC TR 9126-4 (2004) International Standard. Software engineering – Product quality, Part 4: Quality in use metrics, British Standards Institution, 389 Chiswick High Road, London, UK
Shepperd, M.J. and Ince, D. (1993) Derivation and validation of Software Metrics, Clarendon Press, Oxford, UK
Schneidewind, N.F. (1992) Methodology for validating software metrics, IEEE Transactions on Software Engineering, IEEE Computer Society, Los Alamitos, CA, USA, Vol 18(2) p410-422
Schneidewind, N. F. (1994) Validating Metrics for Ensuring Space Shuttle Flight Software Quality, Computer, IEEE Computer Society, Los Alamitos, CA, USA, Vol 27(8) p50-57

Conclusion
Quotations Overview of measurement Mainstream systems metrics Categories of Knowledge
Management metrics Deriving and validating metrics Positioning measurement.

Questions?