measurement of uncertainty (mou) report
TRANSCRIPT
Measurement of Uncertainty (MoU) Report
2
Contents
Measurement of Uncertainty (MoU) Report
1.0 Introduction . . . . . . . . . . . . . . . . . . . . . . . . . . . . . . . . . . . . . . . . . . . . . . . . . . . . 3
1.1 MoU Overview . . . . . . . . . . . . . . . . . . . . . . . . . . . . . . . . . . . . . . . . . . . . . . . . . . . 3
Section 2: Configuring your account to use the MoU report . . . . . . . . . . . . . 4
2.1 Entering your SEM data . . . . . . . . . . . . . . . . . . . . . . . . . . . . . . . . . . . . . . . . . . 4
2.2 Copying your SEM data across instruments . . . . . . . . . . . . . . . . . . . . . . . . 6
3.0 Building your MoU Report . . . . . . . . . . . . . . . . . . . . . . . . . . . . . . . . . . . . . . . 7
4.0 Your MoU Report. . . . . . . . . . . . . . . . . . . . . . . . . . . . . . . . . . . . . . . . . . . . . . . . 10

3
1.0 Introduction
IAMQC Peer has added new features that will add significant value for the end user.
Customers can now generate a Measurement of Uncertainty report in MS Excel format from
their online IAMQC Peer account. Measurement of Uncertainty has become an important
consideration in many laboratories and is referred to by many of the accreditation bodies
as a requirement during audits.
Uncertainty of a measurement refers to the doubt which exists for the result of any
measurement within the laboratory. There are a number of factors which must be
considered when calculating uncertainty, including the chosen method, potential bias,
analytical errors and so on.
When uncertainty is quantified it is no longer uncertainty, but the confidence interval
within which the results fall. Uncertainty should be assessed regularly and attempts made
to improve the value.
For a detailed description of Measurement of Uncertainty, please refer to the PDF
document at https://peer.iamqc.com/files/docs/UncertaintyOfMeasurement.pdf
1.1 MoU Overview
To calculate the MoU for your instruments the report uses both Intra-assay and Inter
Assay precision.
1. Intra assay precision refers to precision within a single run; it is normally measured by
running 20 or more replicates of the same sample at the same time and calculating
the Standard Error of the Mean (SEM).
The SEM is calculated using the formula, SEM = {(SD of your run) divided by (square
root of the number of replicates)} = (SD)/√n
2. Inter Assay precision refers to precision over multiple different runs. IAMQC Peer uses
your labs running SD to calculate the Inter Assay precision of your analytes.
To measure uncertainty using the SEM values calculated in step 1, the user must enter
them into the SEM table in their IAMQC peer account.

4
Where the SEM values are not available for a particular assay the system will calculate a
Measurement of Uncertainty using the labs cumulative peer data.
The calculated MoU value is then multiplied by a coverage factor (k) of 2, to give a level
of confidence of approximately 95 percent. This is called the Expanded MoU. The value
of k = 2 assumes that the uncertainty is normally distributed.
Some other coverage factors (for a normal distribution) are:
k = 1 for a confidence level of approximately 68 percent
k = 2.58 for a confidence level of 99 percent
k = 3 for a confidence level of 99.7 percent
Section 2: Configuring your account to use the MoU report
2.1 Entering your SEM data
To configure your SEM values
1. Calculate the SEM values for each QC lot/level and analyte. This can be per individual
instrument, instrument model or for your whole lab
2. Log into your IAMQC Peer account at https://peer.iamqc.com/login.asp
3. Click on Setup – SEM Values in the top menu
4. On the SEM entry screen, First select the QC product you want to enter values for

5
5. Then select an instrument
6. All tests configured for that lot on that instrument will then be displayed with one
column per level of QC, Enter your SEM values and click the Save button when
complete.
7. If your SEM values are specific to each instrument, repeat the steps 4-6 for each
instrument.
If you want to copy the same SEM values across multiple instruments see section 2.2

6
2.2 Copying your SEM data across instruments
1. If you are using the same SEM values across multiple instruments you can quickly copy
SEM values between them.
To access this function, click the Copy Values button at the bottom of the table:
2. There are two options, which can be selected in the drop down menu.
a: Copy values from another instrument to the currently selected instrument.
This will copy all SEM values from the instrument selected from the list to your
current instrument
b: Copy SEM values from the current instrument to one or more other instruments
This will copy the SEM values from your current instrument to each selected
instrument checked in the list.

7
3.0 Building your MoU Report
1. Log into your IAMQC Peer account at https://peer.iamqc.com/login.asp
2. Click on Reports – Peer Reports in the top menu
3. In the Report Screen select the Month, Year and QC sample type you want to build the
report for and click apply
4. If you are running multiple lots concurrently, at this stage select the lot number you
want to build the report for from the drop-down and click apply.
5. Click on the Build button for the Measurement of Uncertainty report:

8
6. This will bring you to the MoU report interface where you can customise the report
criteria further.
Confirm the product, lot number and date range you want to view on the report.
Select the instruments you want to view on the report, and then click the Build button.
7. The system will display the following message if any analytes do not have an SEM
value entered.
Click on the Build button to proceed
While the system is calculating the MoU values, it will display the following message
8. When the report is complete, you will be prompted to save the Excel file to your
computer.

9
9. Once you are in the MoU Report portal, you do not need to go back to the main
reports page to generate reports for different QC products or lots, you can change the
selection criteria from the MoU home screen.
10
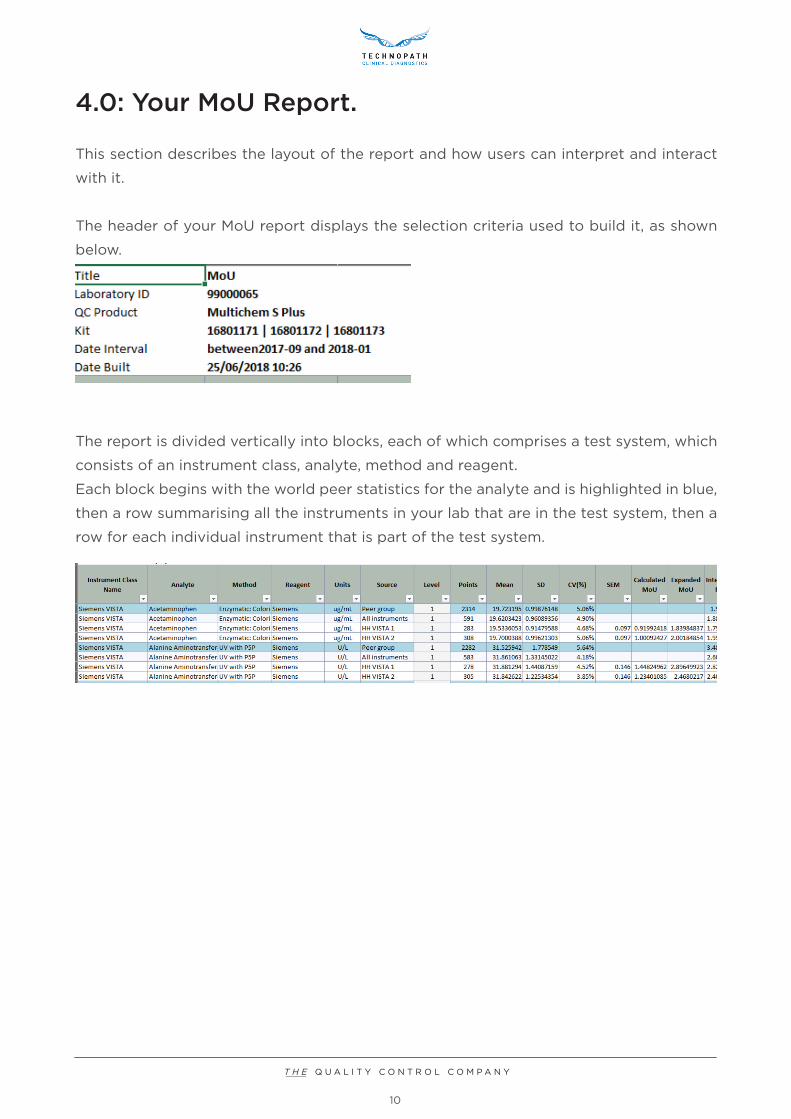
4.0: Your MoU Report.
This section describes the layout of the report and how users can interpret and interact
with it.
The header of your MoU report displays the selection criteria used to build it, as shown
below.
The report is divided vertically into blocks, each of which comprises a test system, which
consists of an instrument class, analyte, method and reagent.
Each block begins with the world peer statistics for the analyte and is highlighted in blue,
then a row summarising all the instruments in your lab that are in the test system, then a
row for each individual instrument that is part of the test system.

11
Columns A to F display information about the configuration of the test system and have
filters to allow you to quickly narrow down your view to specific tests, reagents, methods
or instruments.
Each row is divided horizontally by QC Level.
In each row, for each level where data is present, the report displays the Mean, SD and
CV(%) and Inter-Assay MoU for the selected summary period.
For the individual Instrument rows the report also shows the SEM value (if present) along
with the Calculated and Expanded MoU.
The system also shows the Inter-Assay MoU for each instrument, which is calculated using
the instruments cumulative SD.