measuring acoustic noise emitted by … acoustic noise emitted by power transformers menno van der...
TRANSCRIPT

AES 109th CONVENTION, LOS ANGELES, 2000 SEPTEMBER 22-25 1
MEASURING ACOUSTIC NOISE EMITTED BY POWERTRANSFORMERS
Menno van der Veen
Corresponding Author, [email protected]
Francisco de Leon, Brian Gladstone, Valeriu Tatu
Plitron Manufacturing Inc., [email protected]
Abstract - This paper proposes a new Measurement Standardization Procedure to measure and quantify theacoustic noise produced by power transformers in audio and video equipment under normal and adverse mainsconditions. These conditions and the physical mechanisms that cause the noise are discussed. A newmeasurement set up and units are proposed to measure and quantify the transformer noise. Examples ofmeasurements on four transformers are given for comparision and illustration.
INTRODUCTION
The aim of this preprint is to propose a new standard procedure for the measurement and quantifying of theacoustical noise produced by power transformers in audio and video equipment under normal and adverse mainsconditions.
There is "zero tolerance" among consumers and professional users of audio and video equipment for audiblenoise of any kind. Nothing is more distressing than the sound of a transformer "buzzing". This is understandablesince anyone paying thousands of dollars for a quality system to reproduce music or video wants to hear onlymusic. High end amplifier and studio equipment manufacturers work very hard to ensure the transformers intheir products will not make noise under any operating condition. Specifying and selecting a properly designedand manufactured transformer is a critical issue in the design of high quality video and audio products. Powertransformers should be dead silent, under no circumstances they should produce any noise.
However, reality is totally different! Transformers may suddenly become noisy. They begin to hum, buzz orrattle, not because they are happy, but because they suddenly operate in a magnetic region where a transformerbehaves as an acoustic transducer. This unpleasant feature is known worldwide, and has lead to the need for thedevelopment of a new range of "low noise" transformers.
Why does a transformer make noise? Section 1 explains the acoustic noise generating mechanism insidepower transformers. Section 2 defines the theory of measuring and quantifying the acoustical power transformernoise. A new set of units for quantifying transformer noise is introduced. A new absorbing type noise testchamber is proposed. Section 3 introduces a measurement setup for emulating adverse mains conditions anddefines the calibrated measurement of the acoustical noise levels produced by power transformers under variousadverse mains conditions. Section 4 shows and discusses measurements. Conclusions are in section 5.
VAN DER VEEN ET AL. TRANSFORMER NOISE
AES 109th CONVENTION, LOS ANGELES, 2000 SEPTEMBER 22-25 2
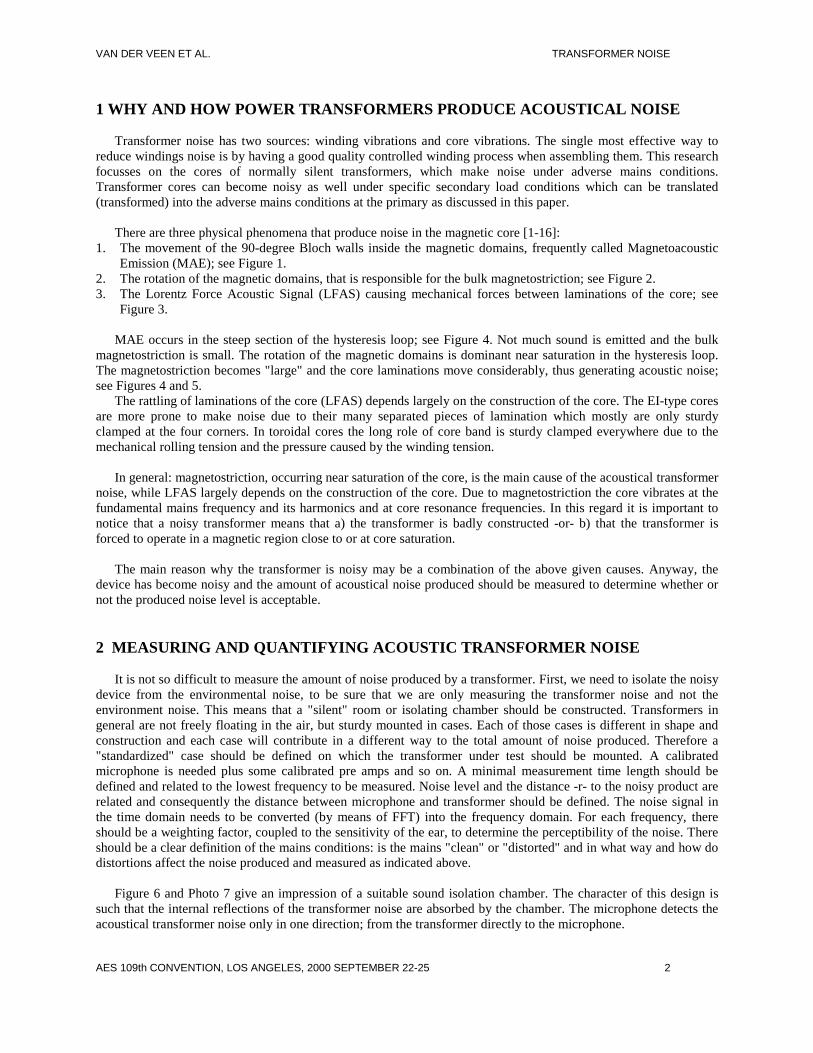
1 WHY AND HOW POWER TRANSFORMERS PRODUCE ACOUSTICAL NOISE
Transformer noise has two sources: winding vibrations and core vibrations. The single most effective way toreduce windings noise is by having a good quality controlled winding process when assembling them. This researchfocusses on the cores of normally silent transformers, which make noise under adverse mains conditions.Transformer cores can become noisy as well under specific secondary load conditions which can be translated(transformed) into the adverse mains conditions at the primary as discussed in this paper.
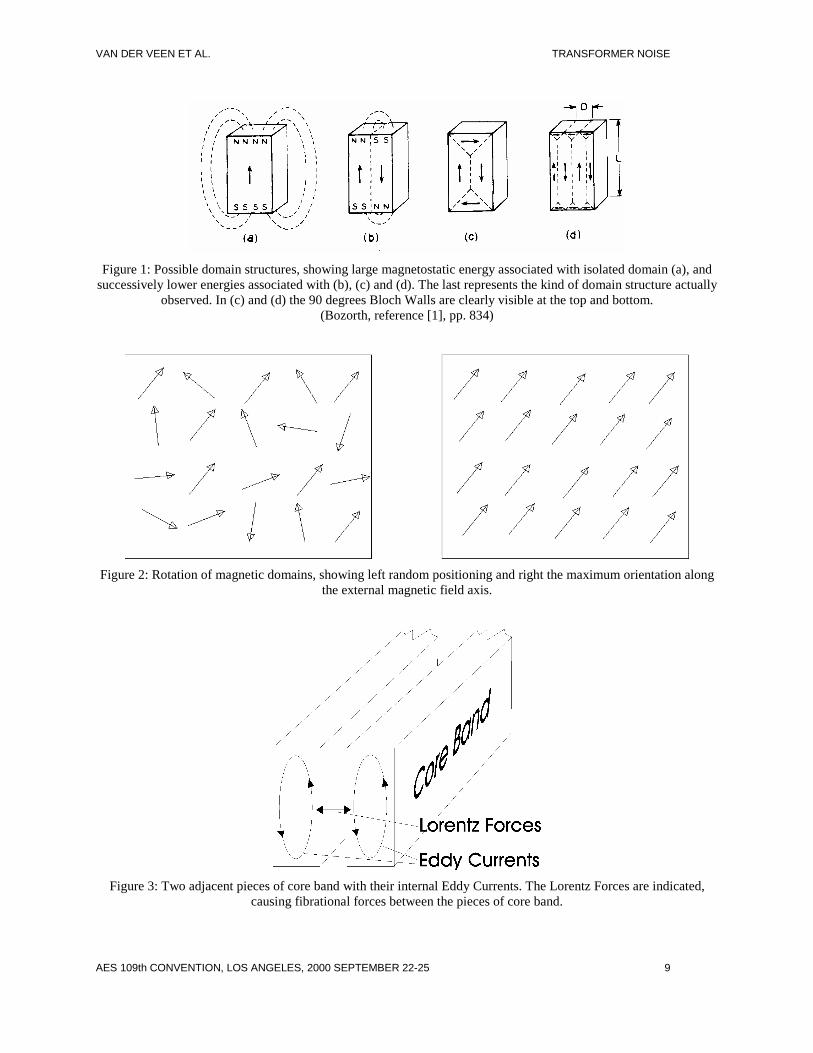
There are three physical phenomena that produce noise in the magnetic core [1-16]:1. The movement of the 90-degree Bloch walls inside the magnetic domains, frequently called Magnetoacoustic
Emission (MAE); see Figure 1.2. The rotation of the magnetic domains, that is responsible for the bulk magnetostriction; see Figure 2.3. The Lorentz Force Acoustic Signal (LFAS) causing mechanical forces between laminations of the core; see
Figure 3.
MAE occurs in the steep section of the hysteresis loop; see Figure 4. Not much sound is emitted and the bulkmagnetostriction is small. The rotation of the magnetic domains is dominant near saturation in the hysteresis loop.The magnetostriction becomes "large" and the core laminations move considerably, thus generating acoustic noise;see Figures 4 and 5.
The rattling of laminations of the core (LFAS) depends largely on the construction of the core. The EI-type coresare more prone to make noise due to their many separated pieces of lamination which mostly are only sturdyclamped at the four corners. In toroidal cores the long role of core band is sturdy clamped everywhere due to themechanical rolling tension and the pressure caused by the winding tension.
In general: magnetostriction, occurring near saturation of the core, is the main cause of the acoustical transformernoise, while LFAS largely depends on the construction of the core. Due to magnetostriction the core vibrates at thefundamental mains frequency and its harmonics and at core resonance frequencies. In this regard it is important tonotice that a noisy transformer means that a) the transformer is badly constructed -or- b) that the transformer isforced to operate in a magnetic region close to or at core saturation.
The main reason why the transformer is noisy may be a combination of the above given causes. Anyway, thedevice has become noisy and the amount of acoustical noise produced should be measured to determine whether ornot the produced noise level is acceptable.
2 MEASURING AND QUANTIFYING ACOUSTIC TRANSFORMER NOISE
It is not so difficult to measure the amount of noise produced by a transformer. First, we need to isolate the noisydevice from the environmental noise, to be sure that we are only measuring the transformer noise and not theenvironment noise. This means that a "silent" room or isolating chamber should be constructed. Transformers ingeneral are not freely floating in the air, but sturdy mounted in cases. Each of those cases is different in shape andconstruction and each case will contribute in a different way to the total amount of noise produced. Therefore a"standardized" case should be defined on which the transformer under test should be mounted. A calibratedmicrophone is needed plus some calibrated pre amps and so on. A minimal measurement time length should bedefined and related to the lowest frequency to be measured. Noise level and the distance -r- to the noisy product arerelated and consequently the distance between microphone and transformer should be defined. The noise signal inthe time domain needs to be converted (by means of FFT) into the frequency domain. For each frequency, thereshould be a weighting factor, coupled to the sensitivity of the ear, to determine the perceptibility of the noise. Thereshould be a clear definition of the mains conditions: is the mains "clean" or "distorted" and in what way and how dodistortions affect the noise produced and measured as indicated above.
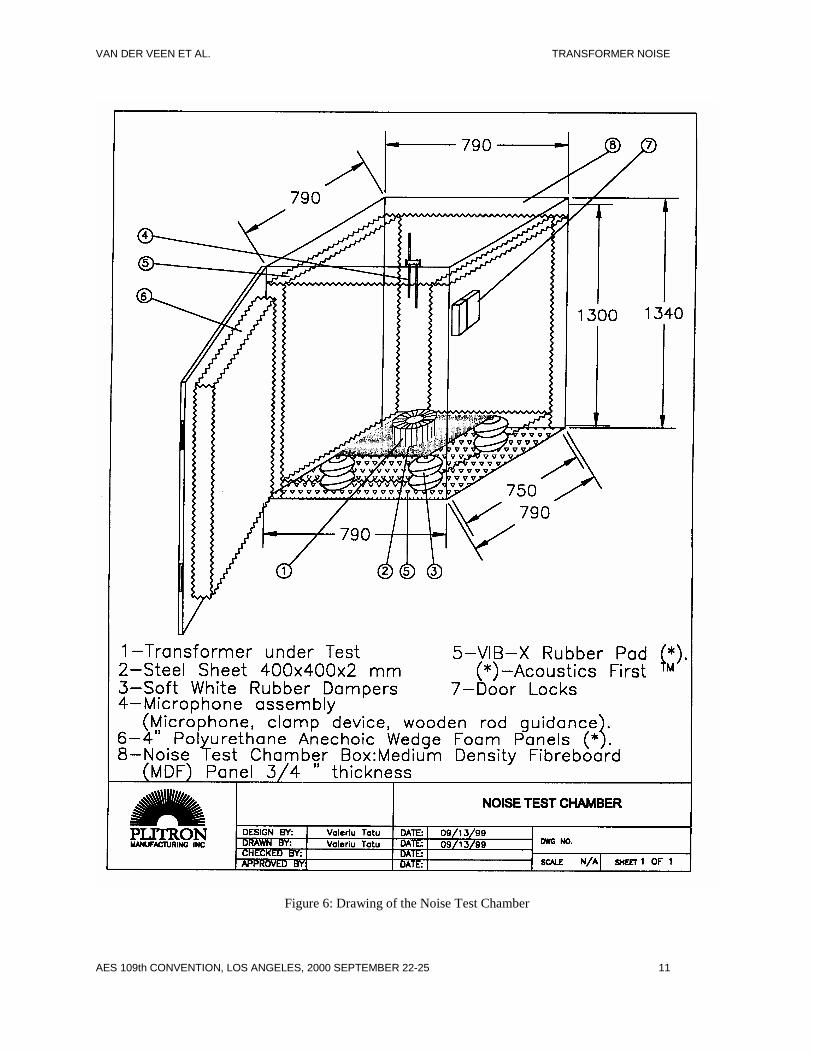
Figure 6 and Photo 7 give an impression of a suitable sound isolation chamber. The character of this design issuch that the internal reflections of the transformer noise are absorbed by the chamber. The microphone detects theacoustical transformer noise only in one direction; from the transformer directly to the microphone.
VAN DER VEEN ET AL. TRANSFORMER NOISE
AES 109th CONVENTION, LOS ANGELES, 2000 SEPTEMBER 22-25 3
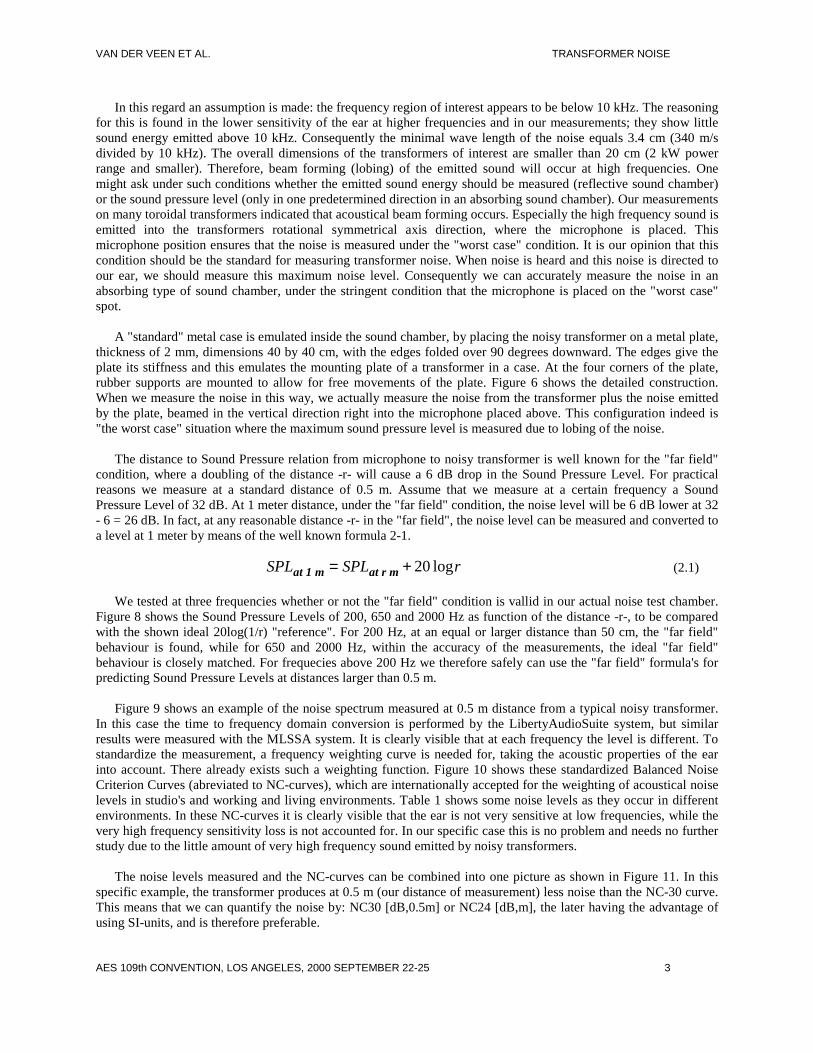
In this regard an assumption is made: the frequency region of interest appears to be below 10 kHz. The reasoningfor this is found in the lower sensitivity of the ear at higher frequencies and in our measurements; they show littlesound energy emitted above 10 kHz. Consequently the minimal wave length of the noise equals 3.4 cm (340 m/sdivided by 10 kHz). The overall dimensions of the transformers of interest are smaller than 20 cm (2 kW powerrange and smaller). Therefore, beam forming (lobing) of the emitted sound will occur at high frequencies. Onemight ask under such conditions whether the emitted sound energy should be measured (reflective sound chamber)or the sound pressure level (only in one predetermined direction in an absorbing sound chamber). Our measurementson many toroidal transformers indicated that acoustical beam forming occurs. Especially the high frequency sound isemitted into the transformers rotational symmetrical axis direction, where the microphone is placed. Thismicrophone position ensures that the noise is measured under the "worst case" condition. It is our opinion that thiscondition should be the standard for measuring transformer noise. When noise is heard and this noise is directed toour ear, we should measure this maximum noise level. Consequently we can accurately measure the noise in anabsorbing type of sound chamber, under the stringent condition that the microphone is placed on the "worst case"spot.
A "standard" metal case is emulated inside the sound chamber, by placing the noisy transformer on a metal plate,thickness of 2 mm, dimensions 40 by 40 cm, with the edges folded over 90 degrees downward. The edges give theplate its stiffness and this emulates the mounting plate of a transformer in a case. At the four corners of the plate,rubber supports are mounted to allow for free movements of the plate. Figure 6 shows the detailed construction.When we measure the noise in this way, we actually measure the noise from the transformer plus the noise emittedby the plate, beamed in the vertical direction right into the microphone placed above. This configuration indeed is"the worst case" situation where the maximum sound pressure level is measured due to lobing of the noise.
The distance to Sound Pressure relation from microphone to noisy transformer is well known for the "far field"condition, where a doubling of the distance -r- will cause a 6 dB drop in the Sound Pressure Level. For practicalreasons we measure at a standard distance of 0.5 m. Assume that we measure at a certain frequency a SoundPressure Level of 32 dB. At 1 meter distance, under the "far field" condition, the noise level will be 6 dB lower at 32- 6 = 26 dB. In fact, at any reasonable distance -r- in the "far field", the noise level can be measured and converted toa level at 1 meter by means of the well known formula 2-1.
SPLat 1 m = SPLat r m + 20 logr (2.1)
We tested at three frequencies whether or not the "far field" condition is vallid in our actual noise test chamber.Figure 8 shows the Sound Pressure Levels of 200, 650 and 2000 Hz as function of the distance -r-, to be comparedwith the shown ideal 20log(1/r) "reference". For 200 Hz, at an equal or larger distance than 50 cm, the "far field"behaviour is found, while for 650 and 2000 Hz, within the accuracy of the measurements, the ideal "far field"behaviour is closely matched. For frequecies above 200 Hz we therefore safely can use the "far field" formula's forpredicting Sound Pressure Levels at distances larger than 0.5 m.
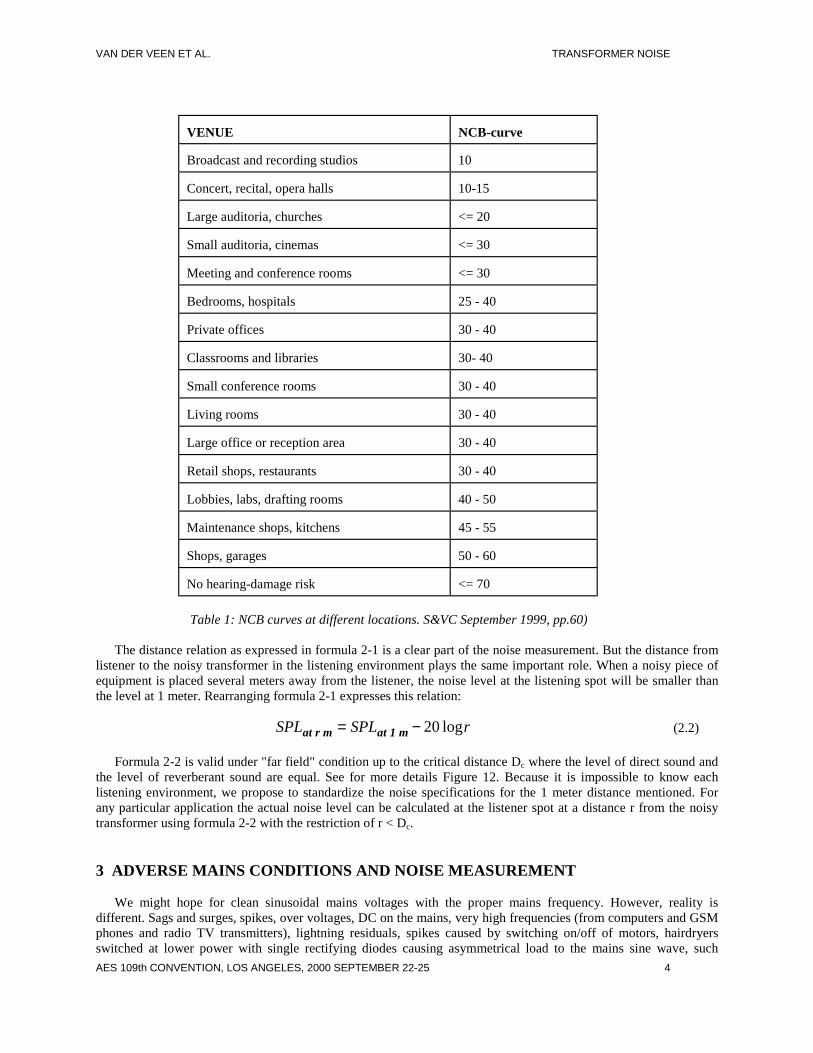
Figure 9 shows an example of the noise spectrum measured at 0.5 m distance from a typical noisy transformer.In this case the time to frequency domain conversion is performed by the LibertyAudioSuite system, but similarresults were measured with the MLSSA system. It is clearly visible that at each frequency the level is different. Tostandardize the measurement, a frequency weighting curve is needed for, taking the acoustic properties of the earinto account. There already exists such a weighting function. Figure 10 shows these standardized Balanced NoiseCriterion Curves (abreviated to NC-curves), which are internationally accepted for the weighting of acoustical noiselevels in studio's and working and living environments. Table 1 shows some noise levels as they occur in differentenvironments. In these NC-curves it is clearly visible that the ear is not very sensitive at low frequencies, while thevery high frequency sensitivity loss is not accounted for. In our specific case this is no problem and needs no furtherstudy due to the little amount of very high frequency sound emitted by noisy transformers.
The noise levels measured and the NC-curves can be combined into one picture as shown in Figure 11. In thisspecific example, the transformer produces at 0.5 m (our distance of measurement) less noise than the NC-30 curve.This means that we can quantify the noise by: NC30 [dB,0.5m] or NC24 [dB,m], the later having the advantage ofusing SI-units, and is therefore preferable.
VAN DER VEEN ET AL. TRANSFORMER NOISE
AES 109th CONVENTION, LOS ANGELES, 2000 SEPTEMBER 22-25 4
VENUE NCB-curve
Broadcast and recording studios 10
Concert, recital, opera halls 10-15
Large auditoria, churches <= 20
Small auditoria, cinemas <= 30
Meeting and conference rooms <= 30
Bedrooms, hospitals 25 - 40
Private offices 30 - 40
Classrooms and libraries 30- 40
Small conference rooms 30 - 40
Living rooms 30 - 40
Large office or reception area 30 - 40
Retail shops, restaurants 30 - 40
Lobbies, labs, drafting rooms 40 - 50
Maintenance shops, kitchens 45 - 55
Shops, garages 50 - 60
No hearing-damage risk <= 70
Table 1: NCB curves at different locations. S&VC September 1999, pp.60)
The distance relation as expressed in formula 2-1 is a clear part of the noise measurement. But the distance fromlistener to the noisy transformer in the listening environment plays the same important role. When a noisy piece ofequipment is placed several meters away from the listener, the noise level at the listening spot will be smaller thanthe level at 1 meter. Rearranging formula 2-1 expresses this relation:
SPLat r m = SPLat 1 m − 20 logr (2.2)
Formula 2-2 is valid under "far field" condition up to the critical distance Dc where the level of direct sound andthe level of reverberant sound are equal. See for more details Figure 12. Because it is impossible to know eachlistening environment, we propose to standardize the noise specifications for the 1 meter distance mentioned. Forany particular application the actual noise level can be calculated at the listener spot at a distance r from the noisytransformer using formula 2-2 with the restriction of r < Dc.
3 ADVERSE MAINS CONDITIONS AND NOISE MEASUREMENT
We might hope for clean sinusoidal mains voltages with the proper mains frequency. However, reality isdifferent. Sags and surges, spikes, over voltages, DC on the mains, very high frequencies (from computers and GSMphones and radio TV transmitters), lightning residuals, spikes caused by switching on/off of motors, hairdryersswitched at lower power with single rectifying diodes causing asymmetrical load to the mains sine wave, such
VAN DER VEEN ET AL. TRANSFORMER NOISE
AES 109th CONVENTION, LOS ANGELES, 2000 SEPTEMBER 22-25 5
conditions are the reality! And how does the mains transformer react on all this mess? It starts to make acousticalnoise. We researched which mains conditions generate noise inside power transformers and found three majorcauses:
1: The mains 'sinusoid' is not symmetrical. This is identical to a DC-voltage on the mains. A very nice example is:the single phase rectifier used in hair dryers at lower power by means of one series diode. The combination of thisrectifier with the actual load resistance and the resistance of the mains wires create an effective DC-voltage on themains. See Figure 13 for an explanation of this effect of hair dryers.(It is very easy to test a particular transformer for noise under this "DC on mains" condition. Connect a 100 or 200W light bulb in series with a proper diode to the same mains socket of the transformer under test and check fortransformer noise by listening).Our measurements indicate that only a few mV-DC can be large enough to bring a transformer into its noisy region.We did many tests to determine the amount of DC-voltage on the mains by means of the light bulb and other loadsin series with a diode and by observing the DC content on the mains due to asymmetrical loading elsewhere in ouror other buildings connected to the same distribution transformer. We found a DC-component smaller than 100 mVfor 120 V at 60 Hz mains. However, by experience we know that bad conditions today surely will be worsetomorrow. We therefore propose to take an extra margin and to use 250 mV-DC as our standard condition for"adverse" mains. (For 230 V at 50 Hz mains, the standard adverse mains condition equals the same 250 mV-DC).
2: Over voltage brings the transformer into its saturation region as well. Example: in Europe the transfer from220 V to 230 V @ 50 Hz mains voltage takes place in a period of several years, combined with a certain plus/minusdeviation. Now suppose, an older 220 V transformer design, having to operate at 230 V (and sometimes in practiceup to 240 V). When such a design is constructed with no safety margin of magnetic headroom, saturation will occurat larger input voltages. Our research showed us that 10 % over voltage is a good margin for testing a transformerunder conditions of over voltage.
3: Transformers designed for 60 Hz mains frequency can be used in a 50 Hz mains frequency environment. Whenno magnetic headroom is available, a 60 Hz transformer will saturate at 50 Hz and become noisy. However, it is ouropinion that manufacturers clearly should identify on their transformers the mains frequency of safe and silentoperation. In this research we assume that all transformers are operating at the right mains frequency of design.
Contrary to popular belief the other effects of mains signal distortion are not included in our list of major noisecauses. In the case of sags and surges, a very short momentary saturation of the core can occur. The burst of soundemitted has such a short duration that seldom this will be a problem. Spikes do not produce noise due to their limitedtime length, and their limited amount of energy will be absorbed inside the conducting shielding inside thetransformer. Very high frequencies (Radio and TV, GSM, computers) can not excite the transformer acousticallybecause it is a mechanical vibrating device with a rather large mass and therefore a limited emitting frequency range.Our measurements showed that above 10 kHz almost no sound is emitted. When considering lower frequencyharmonics, for instance the 2-nd and 3-rd ... of the mains frequency: the second harmonic distortion is equivalent toa residual DC-voltage on the mains, while the 3-rd and higher harmonics have a much smaller amplitude than themains fundamental. This fundamental (50 or 60 Hz) is using most of the magnetic headroom inside the core and ismost prone to lead to core saturation. This is not the case with harmonics. The amplitude of the magnetic fluxdensity inside the core is inversely proportional to the frequency of the voltage applied. Harmonics have smalleramplitudes, larger frequencies and consequently create negligible flux densities inside the core. Therefore we omittheir influence in audio and video equipment. Above said is certainly not the case for transformers used in switchingTriac lighting equipment. However, the study of the effects of such equipment is outside the scope of this research.
Based on above given experience and understanding of the noise generating mechanism inside transformers, wenow can define a measurement setup for making "adverse" mains conditions. Figure 14 shows the schematics in asimple form. Through a variac or variable voltage power supply a pure and undistorted mains voltage can be set atthe "nominal level" and at a "10 % over voltage level". By means of another variac plus transformer, a rectifyingcircuit and a buffering capacitor, a "DC-voltage" can be added to the mains voltage.

VAN DER VEEN ET AL. TRANSFORMER NOISE
AES 109th CONVENTION, LOS ANGELES, 2000 SEPTEMBER 22-25 6
It will be clear now that we propose to test the acoustical noise of a transformer under four conditions:
a) clean mains at nominal mains voltage level and at defined nominal mains frequency: unit: NC.. [dB,m,nom]b) clean mains at 10 % over voltage level: unit: NC.. [dB,m, +10%AC]c) clean mains plus 250 mV-DCvoltage: unit: NC.. [dB,m, +250mV-DC]d) clean mains plus 10 % over voltage plus 250 mV-DC voltage: unit: NC.. [dB,m, +10%AC,+250mV-DC].
4 MEASUREMENTS
From the many transformers we tested, we now will discuss four examples:
1. a special low noise (LoNoTM) toroidal transformer, designed and manufactured at Plitron, as a result of theknowledge gained in this research (Plitron 6931 Toroid)
2. a standard Plitron toroidal transformer (Plitron 87053201 Toroid)3. an EI transformer from unknown brand (Standard EI)4. a low noise toroidal design from another manufacturer (Other Toroid)
The power rating of each transformer is at or close to 500kVA. See for more details Photo 15 and Table 2 wherethe results of the measurements are summarized.
All transformers were tested at their nominal frequency and voltage as specified by the manufacturer. Allmeasurements were performed at 0.5 m distance. They are shown in detail in the Figures 17 and following. Theconversion to one meter distance was performed by subtracting 6 dB from the measured half meter distance NCcurve levels. The conditions of adverse mains are clearly defined above and given in the new units.
It is striking in Table 2 that the 250 mV DC-component causes the most noise. This is explained by the fact thatin most transformer designs only over-voltage is taken into consideration. Proper dealing with a DC component asksfor a totally different transformer construction. These measurements explain as well why a normally silenttransformer suddenly starts humming. The most probable cause is a DC-component, caused by an asymmetricalloading somewhere on the mains.
Transformer Plitron6931Toroid
Plitron87053201Toroid
Standard EI OtherToroid
[dB,m,nom] NC4 NC4 NC7 NC4
[dB,m,+10%AC] NC4 NC4 NC14 NC4
[dB,m,+250mV-DC NC4 NC19 NC10 NC16
[dB,m,+10%AC,+250mV-DC] NC8 NC20 NC23 NC17
Table 2: results of acoustical noise measurements on four different transformers

VAN DER VEEN ET AL. TRANSFORMER NOISE
AES 109th CONVENTION, LOS ANGELES, 2000 SEPTEMBER 22-25 7
5 CONCLUSIONS
Transformer cores can make acoustical noise like humming and rattling. The mechanisms that cause this noiseinside the core have been explained. A method has been developed to measure and to scale the acoustic noise of apower transformer under four standardized conditions. They are: nominal mains voltage and mains frequency, 10 %over voltage, 250 mV-DC added and a combination of 10 % over voltage plus 250 mV-DC. The measuredacoustical noise is compared to the widely accepted Balanced Noise Criterion curves, thus enabling world widecomparison of noise levels. A noise test chamber is proposed, based on absorbing all reflections and measuring onlyat the main axis, where the maximum noise level can be expected due to beam forming at high frequencies.Transformers are always mounted in cases, and a emulation of such a case is proposed by means of a steel plate withstandardized dimensions. Distance plays an important role, and the distance relations are given for the "far field"condition, which has been verified in the actual noise test chamber, while a one meter distance is proposed asstandard unit distance. Four units have been defined for quantifying the noise levels and the conditions ofmeasurement. The tests on four transformers indicate that more attention should be paid to DC-voltage handlingcapabilities of transformers. The results show as well that the new Plitron LoNo1 range is able to withstand adversemains conditions of all the types discussed.
6 AKNOWLEDGEMENTS
The authors wish to thank the Canadian Government IRAP organization for the funding of this research. Manythanks as well to all the proof readers; specially mentioned are Rinus Boone, Technical University Delft, TheNetherlands, and James Hayward.
7 BIBLIOGRAPHY
[1] Richard M. Bozorth, "Ferromagnetism", IEEE Press[2] A.W. Kelley, "Measurement of Spacecraft Power Transformer Acoustic Noise", IEEE Transactions onMagnetics, Vol. 26, No.1, January 1990[3] R. Ranjan, D.C. Jiles, and P.K. Rastogi, "Magnetic Properties of Decarburized Steels: An Investigation of theEffects of Grain Size and Carbon Content", IEEE Transactions on Magnetics, Vol. Mag-23, No. 3, May 1987, pp.1869-1876[4] C. Edwards and S.B. Palmer, "The Effect of Stress and Sample Shape on the Magnitude and Frequency ofMagnetomechanical Acoustic Emission", Journal of the Acoustic Society of America, 82 (2), pp. 534-544, August1987[5] W.A. Theiner and H.H. Willems, "Determination of Microstructural Parameters by Magnetic and UltrasonicQuantitative NDE", in Nondestructive Methods for Materials Property Determination (Editors: C.O. Ruud and R.G.Green), pp. 249-258, Plenum Press, N.Y., 1984[6] A.E. Lord, "Acoustic Emission", in Physical Acoustics XI (Editors: W.P. Mason and R.N. Thurston), chapter 6,pp. 289-354, 1975[7] L. Laftman, "Magnetostriction and Its Contributions to Noise in a PWM Inverter Fed Induction Machine",Journal on Physique IV (France), No. 8, pp. Pr2-567 to Pr2-579, 1998[8] D.J. Jiles, "Introduction to Magnetism and Magnetic Materials", pp. 121, 426-428, Second Edition, Chapman &Hall, 1988[9] Nipon Steel Corporation, "Orientcore", Grain-Oriented Electrical Steel Sheets, Cat. No. EXE 320 July 1988, pp.2, 243-245[10] M. Enokizono, K. Takahashi, and Y. Yamura, "Development of a New Straing Gage for Measurement of TwoDimensional Magnetostriction", Journal of Magnetism and Magnetic Materials, No. 196-197 (1999) pp. 907-909[11] B. Weiser, A. Hasenzagl, and H. Pfutzner, "Mechanisms of Noise Generation of Model Transformer Cores",Journal of Magnetism and Magnetic Materials, No. 160 (1996) pp. 207-209
1 LoNo is a registered trademark by Plitron Manufacturing Inc.
VAN DER VEEN ET AL. TRANSFORMER NOISE
AES 109th CONVENTION, LOS ANGELES, 2000 SEPTEMBER 22-25 8
[12] M. Birsan, J.A. Szpunar, T.W. Krause, and D.L. Atherton, "Magnetic Barkhausen Noise Study of Domain WallDynamics in Grain Oriented 3% S-Fe", IEEE Transactions on Magnetics, Vol. Mag-32, No. 2, March 1996, pp.527-534[13] F. Fiorillo, "Advances in Fe-Si Properties and Their Interpretation", Journal of Magnetism and MagneticMaterials, No. 157/158, 1996, pp. 428-432[14] S. Crottier-Combe, S. Audisio, J. Degauque, J.L. Porteseil, E. Ferrara, M. Pasquale, and F. Fiorillo, "TheMagnetic Properties of Fe-Si 6.5 wt% Alloys Obtained by a SiC14 -based CVD Process", Journal of Magnetism andMagnetic Materials, No. 160, 1996, pp. 151-153[15] N. Fedynakin, R, Krasnokutsky, and R. Shuvalov, "Noise of Magnetic Core", Nuclear Instruments and Methodsin Physics Research, A 413, 1998, pp. 161-165[16] Tadashi Sasaki et al, "Magnetostrictive Vibration of Electrical Steel Sheets under a Non-SinusoidalMagnetizing Conditions, IEEE Transactions on Magnetics, Vol. Mag-23, No. 5, September 1987, pp. 3077-3079[17] Sound & Video Contractor, September 1999, pp. 56-60[18] Don & Carolyn Davis, "Sound System Engineering", Second Edition, Howard W. Sams & Co., ISBN:0-672-21857-7, "Large-Room Acoustics", pp. 174-200, figure 8-7 pp. 174
VAN DER VEEN ET AL. TRANSFORMER NOISE
AES 109th CONVENTION, LOS ANGELES, 2000 SEPTEMBER 22-25 9
Figure 1: Possible domain structures, showing large magnetostatic energy associated with isolated domain (a), andsuccessively lower energies associated with (b), (c) and (d). The last represents the kind of domain structure actually
observed. In (c) and (d) the 90 degrees Bloch Walls are clearly visible at the top and bottom.(Bozorth, reference [1], pp. 834)
Figure 2: Rotation of magnetic domains, showing left random positioning and right the maximum orientation alongthe external magnetic field axis.
Figure 3: Two adjacent pieces of core band with their internal Eddy Currents. The Lorentz Forces are indicated,causing fibrational forces between the pieces of core band.

VAN DER VEEN ET AL. TRANSFORMER NOISE
AES 109th CONVENTION, LOS ANGELES, 2000 SEPTEMBER 22-25 10
Figure 4: MAE occurs in the steep section of the hysteresis loop. Rotation and LFAS are dominant near saturation inthe hysteresis loop.
Figure 5: AC magnetostriction: the Magnetostriction Amplitude is shown versus the AC induction in Tesla.(reference [9])
VAN DER VEEN ET AL. TRANSFORMER NOISE
AES 109th CONVENTION, LOS ANGELES, 2000 SEPTEMBER 22-25 11
Figure 6: Drawing of the Noise Test Chamber

VAN DER VEEN ET AL. TRANSFORMER NOISE
AES 109th CONVENTION, LOS ANGELES, 2000 SEPTEMBER 22-25 12
Figure 7: Photo of the Noise Test Chamber

VAN DER VEEN ET AL. TRANSFORMER NOISE
AES 109th CONVENTION, LOS ANGELES, 2000 SEPTEMBER 22-25 13
Figure 8: Sound pressure levels for three frequencies (200, 650 and 2000 Hz) versus distance –r-, compared to theideal reference 20log(1/r) behaviour.
Figure 9: Example of a Liberty Audiosuite measurement of the noise produced in the Noise Test Chamber by anoisy example transformer. The vertical axis is in dB-SPL, while the horizontal axis shows the frequency in Hz.

VAN DER VEEN ET AL. TRANSFORMER NOISE
AES 109th CONVENTION, LOS ANGELES, 2000 SEPTEMBER 22-25 14
Figure 10: Balanced Noise Criterion Curves (reference [17])
Figure 11: Example of a measurement of the noise of a transformer, combined with the NC-curve overlay. Themeasurement is performed at a 0.5 m distance, and the maximum noise level is just at NC30 close to 600 Hz. The
noise level at 1 m distance equals 30 – 6 = NC24.

VAN DER VEEN ET AL. TRANSFORMER NOISE
AES 109th CONVENTION, LOS ANGELES, 2000 SEPTEMBER 22-25 15
Figure 12: The noise level from a point source, as a function of the distance, is indicated by the sloped line (DirectSound Level). The reverberant Sound Level (caused by the point source) is independent of the distance to the source
in the room. The critical distance DC is found where the Direct and Reverberant Sound Levels are equal(reference [18]).
Figure 13: When the mains is loaded by an asymmetrical load, a DC-component will occur at the mains sockets.

VAN DER VEEN ET AL. TRANSFORMER NOISE
AES 109th CONVENTION, LOS ANGELES, 2000 SEPTEMBER 22-25 16
Figure 14: Representation of the measurement setup for emulating “dirty” mains conditions.
Figure 15: The four transformers under test. From Left to Right: Plitron 6931, Plitron 87053201, Standard EI andOther Toroid.
VAN DER VEEN ET AL. TRANSFORMER NOISE
AES 109th CONVENTION, LOS ANGELES, 2000 SEPTEMBER 22-25 17
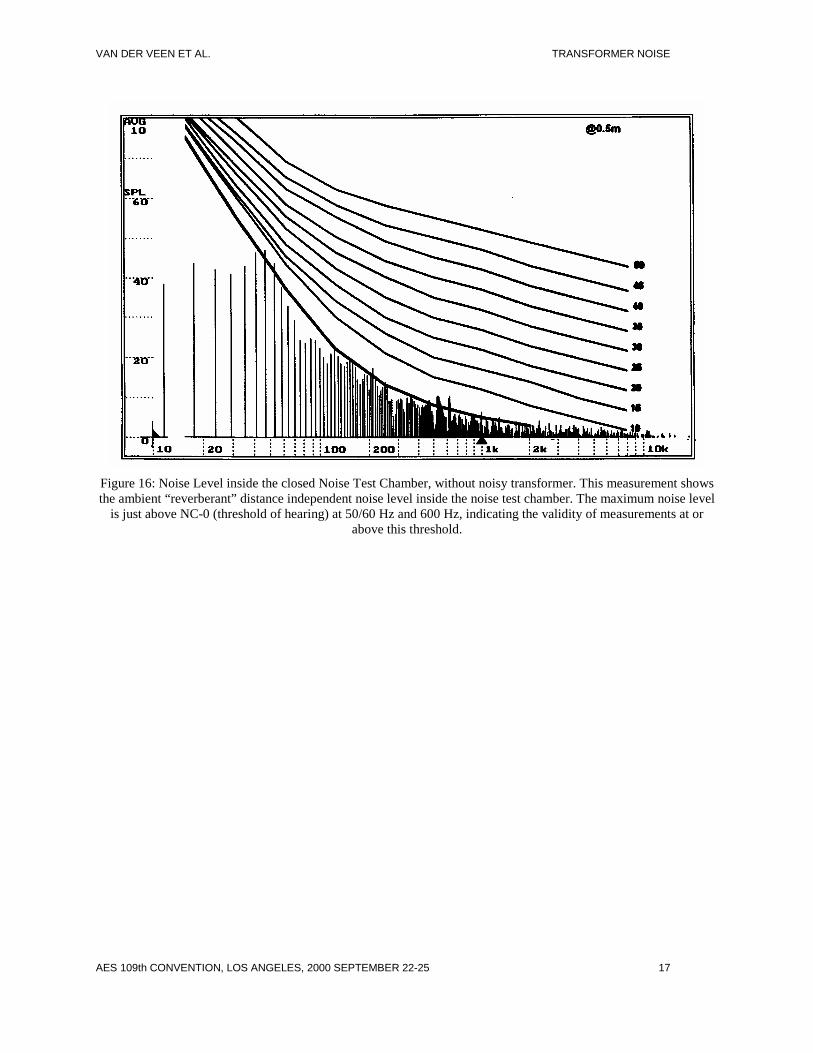
Figure 16: Noise Level inside the closed Noise Test Chamber, without noisy transformer. This measurement showsthe ambient “reverberant” distance independent noise level inside the noise test chamber. The maximum noise level
is just above NC-0 (threshold of hearing) at 50/60 Hz and 600 Hz, indicating the validity of measurements at orabove this threshold.

VAN DER VEEN ET AL. TRANSFORMER NOISE
AES 109th CONVENTION, LOS ANGELES, 2000 SEPTEMBER 22-25 18
Fig. 17: Plitron 6931, from top to bottom: nominal, +10% AC, + 250 mV DC, + 10% AC + 250 mV DC.
Fig. 18: Plitron 87053201, from top to bottom: nominal,+ 10% AC, + 250 mV DC, + 10% AC + 250 mV DC.

VAN DER VEEN ET AL. TRANSFORMER NOISE
AES 109th CONVENTION, LOS ANGELES, 2000 SEPTEMBER 22-25 19
Fig. 19: EI-Unknown, from top to bottom: nominal, +10% AC, + 250 mV DC, + 10% AC + 250 mV DC.
Fig. 20: Other Toroid, from top to bottom: nominal, +10% AC, + 250 mV DC, + 10% AC + 250 mV DC.