measuring cognitive ability in the national child
TRANSCRIPT

Social Origins, Cognitive Ability and Educational Attainment: A Birth Cohort and Life Course Perspective May 2016
1
Measuring cognitive ability in
the National Child Development Study (NCDS),
the British Cohort Study (BCS70), the Longitudinal
Study of Young People in England (LSYPE), and the
Avon Study of Parents and Children (ALSPAC)
Mollie Bourne
May 2016
SOCED Project Data Note 2016-5-20

Social Origins, Cognitive Ability and Educational Attainment: A Birth Cohort and Life Course Perspective May 2016
2
1 Introduction
The purpose of this document is twofold: to describe the approach taken to measuring cognitive ability in the three
earlier birth cohorts (NSHC 1946, NCDS 1958 and BCS 1970), and to outline the possibilities for the construction
of similar variables in the two later cohorts (LSYPE and ALSPAC). Regarding the latter point, there are two main
concerns: first, an understanding of the way in which ‘cognitive ability’ has previously been conceptualised and
measured is important so that a high degree of comparability can be attained across the datasets and, while taking
account of this, the second concern is to determine whether Key Stage 2 performance (the only measure available in
LSYPE) can be considered adequate as a proxy for cognitive ability. For detailed information on each of the datasets
used please see Bourne and Betthaeuser (2016); Betthaeuser and Bourne (2016a, 2016b, 2016c); and Bourne (2016).
Further information on the ASLPAC data, the data dictionary and detailed acknowledgements can be found in
Appendix E.
Section 2 describes how variables in the earlier three cohorts were constructed. In Section 3, the options available
when using LSYPE and ALSPAC are described. Section 4 examines associations between cognitive ability (variously
measured) and other key variables; both descriptive statistics and multivariate analyses are presented. In Section 5,
the changing role of cognitive ability over time is considered; BCS70 with ALSPAC data, then BCS70 with LSYPE
data are employed for this purpose, determining whether any over-time changes detected are sensitive to the use of
alternative proxies (and/or samples). Section 6 provides a summary. See Table 1 for a list of all relevant variables.
Table 1. Cognitive Ability Measures Used (or Available for Use) in NCDS, BCS70, LSYPE and ALSPAC
Dataset Variable name Description
NCDS 1958 n914 n917
Verbal score on general ability test Non-verbal score on general ability test
BCS 1970 i3504 – i3540 i3575 – i3616 i3541 – i3574 i3617 – i3644
BAS word definitions test (37 items) BAS word similarities test (42 items) BAS recall of digits test (34 items) BAS matrices test (28 items)
LSYPE cvap2aps cvap2eng cvap2mat cvap2sci
KS2 average points score (using fine grading) for contextual value added KS2 English points score (using fine grading) for contextual value added KS2 Maths points score (using fine grading) for contextual value added KS2 Science points score (using fine grading) for contextual value added
ALSPAC f8ws020 – f8ws030 f8ws050 – f8ws060 f8ws100 f8ws101 f8ws110 f8ws111 f8ws112 k2_read; k2_writ k2_hwrit; k2_spell k2_tote k2_extem k2_pap1m; k2_pap2m k2_marit k2_totm k2_extmm k2_papas; k2_papbs k2_tots k2_extsm k2_totps ks4_cvap2aps ks4_cvap2eng
WISC-III: All subtest raw scores (13 items) WISC-III: All subtest scaled scores (11 items – excluding two digit span) WISC-III: Sum of all verbal subtests WISC-III: Sum of all performance subtests WISC-III: Verbal IQ WISC-III: Performance IQ WISC-III: Total IQ Mark achieved in English reading test; Mark achieved in English writing test English handwriting test mark; English spelling test mark Total mark achieved in English test (sum of reading and writing tests) English extension mark Mark achieved in paper A of maths test; Mark achieved in paper B Mark achieved in mental arithmetic paper of maths test Total mark achieved in maths test (sum of paper A, B and mental arithmetic) Maths extension mark Mark achieved in paper A of science test; Mark achieved in paper B Total mark achieved in science test (sum of paper A and paper B tests) Science extension mark Total KS2 point score used in the value added calculations KS2 average points score (using fine grading) for contextual value added KS2 English points score (using fine grading) for contextual value added

Social Origins, Cognitive Ability and Educational Attainment: A Birth Cohort and Life Course Perspective May 2016
3
ks4_cvap2mat ks4_cvap2sci
KS2 Maths points score (using fine grading) for contextual value added KS2 Science points score (using fine grading) for contextual value added
2 Previous Approaches: Conceptual and Operational Implications
With the three earlier cohorts, cognitive ability was measured using the results from a range of tests administered by
survey interviewers. Information relating to the test scores used has been found in Bukodi et al (2014) and Schoon
(2010; 2008). In the 1946 cohort, the results from a ‘general cognitive ability’ test taken at age 11 were used, which
yielded scores for verbal intelligence and non-verbal ability (Schoon 2010; Richards et al 2010).1 In the 1958 cohort,
scores from a general ability test taken at age 11, again comprising the assessment of both verbal and non-verbal
skills, were used (Schoon 2008).2 In the 1970 cohort, scores from four sub-tests of the British Ability Scales (BAS),
taken at age 10, were used: Word Definitions and Word Similarities to measure verbal ability, and Recall of Digits
and Matrices to measure non-verbal ability (Schoon 2010).
For each cohort, a principal components analysis (PCA) was carried out on the sub-tests. In each case, a single
component could be confirmed and this was taken to represent a ‘general cognitive ability factor (g)’ (Schoon 2010;
2008), or a ‘latent (g) factor in intelligence’ (Bukodi et al 2014).
I have attempted to reconstruct the cognitive ability measures previously used by Schoon (2010) and Bukodi et al
(2014) as follows. For the 1958 cohort, a PCA was conducted on the two variables listed in Table 1 and scores from
the first unrotated factor were saved for each valid case. The first component accounted for 90% of the total
variance, which is the same as was found by Schoon (2008). For the BCS70 cohort, for each item making up the
different tests listed in Table 1, cases with responses coded ‘no questionnaire’ (-6), ‘not stated’ (-3) or ‘no response’
(9) were set to missing, those with a correct response (1) were given a value of 1 and those with an incorrect
response (2) were given a value of 0. Items from the similarities subtest were treated in pairs, so that cases were only
assigned a value of 1 if they got both parts of the question correct.3 The individual item variables were then summed
to derive an overall score for each sub-test and a PCA was conducted on these four variables. The first principal
component score accounted for 58% of the total variance, which is very close to the figure of 57% found by
Schoon (2008); the slight discrepancy may be due to differences in sample exclusions. See Table 2 which describes
the factor loadings.
Table 2. PCA to Derive Cognitive Ability Measures using NCDS and BCS70
PCA New Variable
Eigenvalue Loading % of variance Min Max Mean (SD)
Verbal Non-verbal
NCDS 1.81 0.71 0.71 0.90 -3.61 3.13 0.00 (1.34) Word Def Word Sim Recall Matrices
BCS70 2.31 0.55 0.55 0.39 0.49 0.58 -5.64 5.13 0.00 (1.52)
2.1 A Discussion of ‘g’
There has been much discussion in the psychology, education and wider literature regarding the differences between
intelligence, IQ and cognitive ability4, how these concepts should be treated and measured, and what they can – and
1 Scores form the Word Reading, Vocabulary and Arithmetic tests were not used by Schoon (2010). 2 The variables listed in Table 1 – n914 and n917 – are the summed scores from the various tests. 3 See http://www.cls.ioe.ac.uk/page.aspx?&sitesectionid=843&sitesectiontitle=Derived+variables from the CLS website which recommends treating the measures in this way. 4 With ‘cognitive ability’ variously termed ‘cognitive function’, ‘cognition’, ‘cognitive capital’, and so on. It has been suggested that these are distinct (e.g. Bynner and Wadsworth 2010), but this is rarely recognised.

Social Origins, Cognitive Ability and Educational Attainment: A Birth Cohort and Life Course Perspective May 2016
4
cannot – tell us about a person’s intellectual capacity. The overriding message that emerges from these discussions is
that there are both conceptual and operational distinctions that should be recognised, and these will have
implications for the approach we take to constructing a similar measure of cognitive ability in ALSPAC.
In brief, there is a good degree of consensus in the literature that IQ and ‘g’ are in fact different things, despite these
terms often being used interchangeably (e.g. Schoon 2008:76; Gregg and Macmillian 2010:263-4; Bukodi et al
2014:297). According to Colom et al (2002), the notion of general intelligence (g) rests on correlations among test
scores (e.g. determined using PCA) and should be distinguished from ‘intelligence in general’ – or IQ – which rests
on the summation of standardised test scores and therefore is in fact ‘g’ plus specific cognitive abilities and skills.5
Capturing the common variance across ability tests – precisely the same approach as has been taken using the earlier
cohorts – is seen as the closest approximation to determining the latent measure of intelligence (g) (Deary 2001).
3 Constructing Cognitive Ability Measures in ALSPAC and LSYPE
The main purpose of using the ALSPAC dataset is to examine how closely associated are the measures of cognitive
ability, determined via the WISC-III intelligence test, and measures of performance on national ability tests, derived
from scores at Key Stage 2.
The first consideration therefore relates to which WISC-III variables might be used to examine this (possibilities are
listed in Table 1).6,7 The verbal and performance IQ measures use scores which have been standardised and
summed, and the full-scale IQ is then a summation of these. Kaufman (1994) warns against use of the full-scale IQ
because it ‘does not adequately reflect the diversity of cognitive capabilities that have been identified in many studies
of children’s thinking. Consequently, the notion of ‘g’ must be thought of as the global ability underlying a
conventional intelligence test such as the WISC-III…, but not as a theoretical construct underlying human intellect’
(1994:43). Similarly, Colom et al (2002) examine the Wechsler Adult Intelligence Scale (WAIS-III) (though this is
broadly similar in content to the WISC-III), and determine that the full-scale IQ does not directly or exclusively
measure ‘g’: ‘there is no significant association between the scientific construct of general intelligence (g) and the
differences in intelligence in general (IQ) assessed by the WAIS-III’ (2002:449).
Taking account of this, as well as the need to differentiate between IQ and ‘g’ as outlined above, the variables
measuring WISC IQs have not been used in the construction of the cognitive ability variables in ALSPAC. Instead,
two WISC variables were constructed as follows: the first uses scaled scores from each of the 11 subtests (this is the
approach that has been used in some previous studies [e.g. Kaufman 1994; Kamphaus 1993; Roid et al 1993], which
have determined that the loadings on the first unrotated factor of a PCA can be used to adequately represent ‘g’)
(variable “WISC-11”, N=6,620), and the second uses the composite variables – f8ws100 and f8ws101 (the sum of all
verbal and performance subtests, respectively) (variable “WISC-2”, N=7,347). In both cases, the variables were used
in a PCA, saving the scores from the first principal component extracted.
The second consideration relates to which Key Stage 2 variables might be used. According to the Key Stage 2 NPD
User Guide, variables providing information on fine grading should be preferred for use over those with
information on actual test scores because the latter are likely to introduce bias by omitting lower attaining pupils (see
NPD 2011 for more information, including details of the algorithms used to create the fine graded scores from the
original variables). In addition, the set of average point score variables (using fine grading) – cvap2aps, cvap2eng,
cvap2mat and cvap2sci – are the only ones which are present in both ALSPAC and LSYPE. Two Key Stage 2
variables have been constructed using the ALSPAC data: the first uses Maths, English and Science points scores to
5 There are also different origins of the concepts of intelligence as measured via IQ and the alternative, more theoretically-oriented, approach to capturing cognitive ability as a general capacity (Richards and Deary 2010; Spearman 1904); the latter of which is now more frequently employed (Deary 2001). 6 Scaled scores are raw scores adjusted for differences in age. 7 Verbal subtests are: Information, Similarities, Arithmetic, Vocabulary and Comprehension. Performance subtests are: Digit Span, Picture Completion, Coding, Picture Arrangement, Block Design and Object Assembly.

Social Origins, Cognitive Ability and Educational Attainment: A Birth Cohort and Life Course Perspective May 2016
5
carry out a PCA, saving the scores from the first principal component extracted (variable “KS2ems”, N=11,036),
and the second uses just Maths and English points scores to carry out a PCA in the same way (variable “KS2em”,
N=11,081). The reason for excluding Science from one of the measures is that these tests are quite different in
content from other – more general – ability tests, including those administered as a part of the WISC and also those
used in the earlier cohorts. Other studies that have sought to examine the relationship between cognitive ability and
scores in national assessments, such as Key Stage tests, have also taken this approach (e.g. Duckworth and Schoon
2010; Gregg and Macmillan 2010). The results of each of these PCAs are given in Table 3.8
Table 3. PCA to Derive Cognitive Ability Measures using ALSPAC
PCA New Variable
Eigenvalue Loading % of variance Min Max Mean (SD)
English Maths Science
KS2em 1.75 0.71 0.71 -- 0.88 -3.64 2.55 0.00 (1.32) KS2ems 2.54 0.57 0.58 0.58 0.85 -5.09 3.03 0.00 (1.59) Verbal Performance
WISC-2 1.51 0.71 0.71 0.75 -5.07 3.84 0.00 (1.23) WISC-11† 3.67 -- -- 0.33 -7.58 6.13 0.00 (1.92) Notes:
† Factor loadings are not presented for this variable because there are too many to list
Note that the PCA conducted using the 11 subtests of WISC-III identified two factors: the first with an eigenvalue
of 3.67 and the second with a value of 1.14. Only values from the first component were saved.
Table 4 examines the correlations between the new variables WISC-2 and WISC-11 on the one hand, and KS2em
and KS2ems on the other, which are all strong and are statistically significant (p<0.00).
Table 4. Pearsons Correlations between Key Stage 2 Measures and WISC Measures, derived using PCA
KS2em KS2ems WISC-2 WISC-11
KS2em 1.00** KS2ems 0.98** 1.00** WISC-2 0.70** 0.71** 1.00** WISC-11 0.74** 0.75** 0.98** 1.00**
The only options for deriving a measure of cognitive ability in the LSYPE involve using Key Stage 2 scores. These
variables have been constructed using the same approach as described above. See Table 5. (KS2em N=7,585;
KS2ems N=7,565.)
Table 5. PCA to Derive Cognitive Ability Measures using LSYPE
PCA New variable
Eigenvalue Loading % of variance Min Max Mean (sd)
English Maths Science
KS2em 1.75 0.71 0.71 -- 0.87 -3.93 >2.45 0.00 (1.32) KS2ems 2.53 0.57 0.58 0.58 0.84 -5.46 >2.95 0.00(1.59) Notes:
Precise maximum values have been omitted to preserve anonymity
8 There were a number of cases with zero scores on the point score measures in ALSPAC (N~850 [~5%], depending on the measure). These cases were set to missing before the PCA was carried out because they do not represent failure of the tests (NPD 2011:16–17). Examining the data, cases with a score of zero do in fact have valid (and often high) scores on the variables which give the actual test marks and further, the same variables from the NPD file linked to the LSYPE data have a range 15–36 while these measures have a minimum of 0, then a range of 15–36 (i.e. no cases have a point score between 1–14).

Social Origins, Cognitive Ability and Educational Attainment: A Birth Cohort and Life Course Perspective May 2016
6
Figure 1 demonstrates that the percentile distributions of the KS2em and KS2ems variables in LSYPE and ALSPAC
are almost identical. Figure 2 superimposes the percentile distributions of each Key Stage 2 variable onto each WISC
variable (ALSPAC data only).
Figure 1. Percentile Distributions of KS2em and KS2ems in LSYPE and ALSPAC
Figure 2. Percentile Distributions of Each Pair of Key Stage 2 and WISC Measures in ALSPAC
02
46
Per
cent
-4 -2 0 2 4ALSPAC KS2em
02
46
Per
cent
-6 -4 -2 0 2 4ALSPAC KS2ems
02
46
Per
cen
t
-4 -2 0 2 4LSYPE KS2em
02
46
Per
cen
t
-6 -4 -2 0 2 4LSYPE KS2ems

Social Origins, Cognitive Ability and Educational Attainment: A Birth Cohort and Life Course Perspective May 2016
7
Tables 6-9 present cross tabulations of each pair of Key Stage 2 and WISC variables using ALSPAC data, after
having transformed these into deciles. These four tables are summarised in Table 14.
Table 6. Cross-Tabulation of KS2em and WISC-2, Presented in Deciles, in ALSPAC (%)
1
2 3 4 5 6 7 8 9 10 Top
Total
1 62 31
22 11
8 4
4 2
2 1
1 1
0 0
1 0
0 0
0 0
100 5
2 37 27
24 17
15 11
10 7
4 3
5 3
3 2
2 1
1 1
0 0
100 8
3 22 17
22 17
19 15
13 10
11 9
6 5
3 3
3 3
1 1
0 0
100 8
4 11 10
19 16
17 14
15 13
15 13
8 7
5 5
6 6
2 2
1 1
100 9
5 8 8
15 14
18 17
15 14
13 13
10 10
9 9
6 6
3 3
2 2
100 10
6 4 4
10 10
12 12
15 15
13 13
17 17
11 12
10 11
6 7
2 2
100 11
7 2 2
8 8
11 12
11 12
15 16
15 16
14 16
11 13
10 11
4 6
100 11
8 1 1
3 4
8 9
9 11
12 14
15 18
15 19
16 20
13 16
8 11
100 12
9 1 1
2 3
4 5
8 10
8 10
12 15
14 19
17 22
20 27
15 22
100 13
10 Top
0 0
1 1
1 2
4 5
6 8
7 9
12 17
13 19
23 32
35 56
100 14
Total 11 100
11 100
10 100
10 100
10 100
10 100
10 100
10 100
10 100
8 100
100 100
02
46
Per
cent
-6 -4 -2 0 2 4KS2em and WISC-2
KS2em WISC2
02
46
Per
cent
-6 -4 -2 0 2 4KS2ems and WISC-2
KS2ems WISC2
02
46
Per
cent
-10 -5 0 5KS2em and WISC-11
KS2em WISC11
02
46
Per
cent
-10 -5 0 5KS2ems and WISC-11
KS2ems WISC11

Social Origins, Cognitive Ability and Educational Attainment: A Birth Cohort and Life Course Perspective May 2016
8
Table 7. Cross-Tabulation of KS2em and WISC-11, Presented in Deciles, in ALSPAC (%)
1 2 3 4 5 6 7 8 9 10 Top
Total
1 69 32
20 9
6 3
3 2
1 1
0 0
0 0
0 0
0 0
0 0
100 5
2 40 28
28 19
13 9
8 6
6 4
3 2
1 1
1 1
0 0
0 0
100 7
3 21 17
25 19
21 16
13 10
10 8
4 4
4 3
2 2
0 0
0 0
100 8
4 12 11
20 17
20 18
15 13
12 10
8 7
7 6
4 4
1 1
0 0
100 9
5 8 7
16 14
17 16
19 17
11 10
13 12
9 8
5 5
2 2
1 1
100 10
6 3 3
8 8
14 14
17 17
16 16
14 15
13 14
10 11
5 6
1 1
100 11
7 2 2
6 7
11 12
12 13
15 17
15 17
15 17
12 14
7 9
4 5
100 11
8 1 1
3 3
6 7
11 13
13 15
15 19
16 19
15 19
14 19
7 10
100 12
9 0 0
2 3
3 4
6 7
10 13
11 14
15 19
19 25
23 32
12 19
100 163
10 Top
0 0
0 0
1 1
2 3
5 6
7 10
11 15
15 21
21 31
39 64
100 14
Total 11 100
11 100
10 100
10 100
10 100
10 100
10 100
10 100
9 100
8 100
100 100
Table 8. Cross-Tabulation of KS2ems and WISC-2, Presented in Deciles, in ALSPAC (%)
1 2 3 4 5 6 7 8 9 10 Top
Total
1 66 34
20 10
7 4
4 2
1 1
0 0
1 0
0 0
0 0
0 0
100 5
2 37 26
25 18
17 12
8 6
5 3
5 3
2 2
1 1
1 1
0 0
100 7
3 21 16
24 18
20 16
14 11
10 8
6 5
2 2
3 2
1 1
0 0
100 8
4 13 10
21 17
17 14
16 13
11 9
8 7
6 5
6 5
1 1
0 0
100 9
5 6 6
13 12
16 15
16 15
15 14
13 13
9 9
8 8
3 3
1 1
100 10
6 4 4
12 12
14 14
15 15
13 13
14 15
11 12
8 9
7 8
3 3
100 11
7 2 2
6 6
10 11
10 11
18 20
16 17
13 15
13 15
9 10
3 5
100 11
8 1 1
4 5
8 10
10 12
12 14
14 17
16 20
14 18
13 17
7 10
100 12
9 0 0
2 2
4 5
8 10
8 10
12 15
14 19
17 23
20 27
15 24
100 13
10 Top
0 0
1 1
1 1
3 5
5 7
7 9
11 16
14 20
23 33
35 57
100 14
Total 11 100
11 100
10 100
10 100
10 100
10 100
10 100
10 100
10 100
8 100
100 100
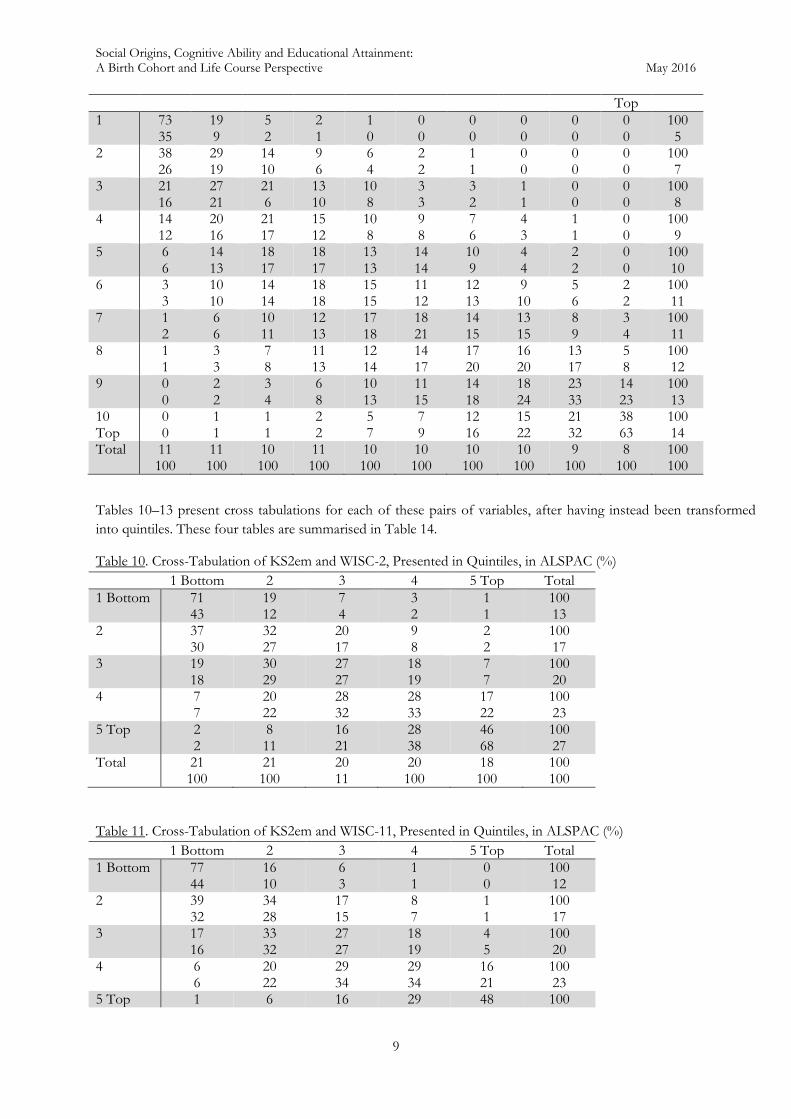
Table 9. Cross-Tabulation of KS2ems and WISC-11, Presented in Deciles, in ALSPAC (%)
1 2 3 4 5 6 7 8 9 10 Total
Social Origins, Cognitive Ability and Educational Attainment: A Birth Cohort and Life Course Perspective May 2016
9
Top
1 73 35
19 9
5 2
2 1
1 0
0 0
0 0
0 0
0 0
0 0
100 5
2 38 26
29 19
14 10
9 6
6 4
2 2
1 1
0 0
0 0
0 0
100 7
3 21 16
27 21
21 6
13 10
10 8
3 3
3 2
1 1
0 0
0 0
100 8
4 14 12
20 16
21 17
15 12
10 8
9 8
7 6
4 3
1 1
0 0
100 9
5 6 6
14 13
18 17
18 17
13 13
14 14
10 9
4 4
2 2
0 0
100 10
6 3 3
10 10
14 14
18 18
15 15
11 12
12 13
9 10
5 6
2 2
100 11
7 1 2
6 6
10 11
12 13
17 18
18 21
14 15
13 15
8 9
3 4
100 11
8 1 1
3 3
7 8
11 13
12 14
14 17
17 20
16 20
13 17
5 8
100 12
9 0 0
2 2
3 4
6 8
10 13
11 15
14 18
18 24
23 33
14 23
100 13
10 Top
0 0
1 1
1 1
2 2
5 7
7 9
12 16
15 22
21 32
38 63
100 14
Total 11 100
11 100
10 100
11 100
10 100
10 100
10 100
10 100
9 100
8 100
100 100
Tables 10–13 present cross tabulations for each of these pairs of variables, after having instead been transformed
into quintiles. These four tables are summarised in Table 14.
Table 10. Cross-Tabulation of KS2em and WISC-2, Presented in Quintiles, in ALSPAC (%)
1 Bottom 2 3 4 5 Top Total
1 Bottom 71 43
19 12
7 4
3 2
1 1
100 13
2 37 30
32 27
20 17
9 8
2 2
100 17
3 19 18
30 29
27 27
18 19
7 7
100 20
4 7 7
20 22
28 32
28 33
17 22
100 23
5 Top 2 2
8 11
16 21
28 38
46 68
100 27
Total 21 100
21 100
20 11
20 100
18 100
100 100
Table 11. Cross-Tabulation of KS2em and WISC-11, Presented in Quintiles, in ALSPAC (%)
1 Bottom 2 3 4 5 Top Total
1 Bottom 77 44
16 10
6 3
1 1
0 0
100 12
2 39 32
34 28
17 15
8 7
1 1
100 17
3 17 16
33 32
27 27
18 19
4 5
100 20
4 6 6
20 22
29 34
29 34
16 21
100 23
5 Top 1 6 16 29 48 100

Social Origins, Cognitive Ability and Educational Attainment: A Birth Cohort and Life Course Perspective May 2016
10
2 8 21 40 73 27 Total 21
100 21 100
20 100
20 100
18 100
100 100
Table 12. Cross-Tabulation of KS2ems and WISC-2, Presented in Quintiles, in ALSPAC (%)
1 Bottom 2 3 4 5 Top Total
1 Bottom 72 43
19 12
6 4
2 2
1 0
100 13
2 39 31
33 27
18 15
9 7
1 1
100 17
3 18 17
30 30
27 27
18 19
7 7
100 20
4 6 7
19 22
30 34
28 34
16 21
100 23
5 Top 2 2
8 10
16 21
28 39
47 70
100 27
Total 21 100
21 100
20 100
20 100
18 100
100 100
Table 13. Cross-Tabulation of KS2ems and WISC-11, Presented in Quintiles, in ALSPAC (%)
1 Bottom 2 3 4 5 Top Total
1 Bottom 77 44
16 10
5 3
1 1
0 0
100 12
2 41 32
35 28
16 13
7 6
0 0
100 17
3 17 16
34 33
27 27
18 18
5 5
100 20
4 5 6
20 22
30 35
30 35
15 19
100 23
5 Top 1 2
6 7
16 22
29 40
48 75
100 28
Total 21 100
21 100
20 100
20 100
18 100
100 100
Table 14 provides summary statistics, based on the cross-classifications of the decile and quintile measures
presented in Tables 6–13 above.
Table 14. Summary Statistics based on Cross-Classifications of Decile and Quintile Measures
Decile Measures
% Same decile % KS2 higher than WISC % WISC higher than KS2
KS2em & WISC-2 22 54 24 KS2em & WISC-11 23 55 22 KS2ems & WISC-2 22 54 24 KS2ems & WISC-11 23 56 21 Quintile Measures

Social Origins, Cognitive Ability and Educational Attainment: A Birth Cohort and Life Course Perspective May 2016
11
% Same quintile % KS2 higher than WISC % WISC higher than KS2
KS2em & WISC-2 39 43 16 KS2em & WISC-11 40 44 16 KS2ems & WISC-2 40 43 17 KS2ems & WISC-11 41 44 15
Examining Figures 1 and 2 alongside Table 14 above, it is clear that there are some differences in the distributions
of Key Stage and WISC measures. Less than half of cases fall into the same quintile, and relatively high proportions
of respondents score higher on Key Stage examinations than they do on WISC tests; this suggests that using scores
from Key Stage tests will result in a general overestimation of cognitive ability.
3.1 An Alternative Treatment of Cases with Zero Scores on Key Stage 2 Measures in ALSPAC
An apparent difference between the distributions of the various measures, as shown in Figures 1 and 2, is that the
Key Stage variables have a notable proportion of cases with zero scores9 (N=278, 2.5% in the case of KS2em and
N=125, 1.1% in the case of KS2ems) – representing those that failed the tests – while the WISC variables display a
smooth continuum of those with low scores at the left tail. The WISC tests presumably include a number of
extremely easy items, making it far more unusual to fail completely. A question that then arises is whether there is an
alternative approach to the treatment of those that have failed Key Stage tests which would thereby facilitate more
of a ‘like-with-like’ comparison.
Two alternative measures have been constructed using ALSPAC data, and these are considered in this section. Both
are based on the KS2em variable, as this is the measure we expect to use in analyses. The first measure excludes
cases who have failed either Key Stage 2 Maths or English by setting those with zero scores to missing before
running the PCA (variable “KS2emX1”). The second measure ‘imputes’ non-failed scores for those who have failed
either English or Maths from other Key Stage tests, where these are available. First, failed English scores are
replaced with non-failed Maths scores and vice versa. Then, of those who failed both (or failed one and are missing
on the other), failed scores are replaced with non-failed Science scores. Table 15 justifies this approach by showing
that mean non-failed scores tend to be lower on other tests for those who have failed Maths or English, than for
those who have not failed. Finally, those who failed all Maths, English and Science tests are set to missing (variable
“KS2emX2”).
Table 15. Comparison of Non-Failed Scores on Alternative Key Stage Tests
% Also failed Mean non-failed scores
English Maths English Maths Science
Failed Maths 66% -- 20.51 -- 22.13 Non-failed Maths 2% -- 27.27 -- 29.14 Failed English -- 58% -- 20.66 23.18 Non-failed English -- 1% -- 27.74 29.14
The results of the PCAs used to derive these two new measures are given in Table 16. The first approach – setting
cases with failed scores to missing – of course results in a variable with fewer valid cases than does the latter
approach (KS2emX1 N=10,461; KS2emX2 N=10,948).
Table 16. PCA to Derive Alternative Key Stage 2 Cognitive Ability Measures using ALSPAC
PCA New Variable
9 Note that these cases do not actually take a value of 0 in the original measure, but a value of 15. Nonetheless, they represent those at the lowest end of the distribution (captured by the ‘spike’ in Figures 1 and 2); the procedure for extracting the first principal component using PCA is the same as it would have been if the lower bound of the original scale had first been shifted to 0 (and thus the scores saved for each case would be identical).

Social Origins, Cognitive Ability and Educational Attainment: A Birth Cohort and Life Course Perspective May 2016
12
Eigenvalue Loading % of variance Min Max Mean (SD)
English Maths
KS2emX1 1.68 0.71 0.71 0.84 -3.68 2.78 0.00 (1.29) KS2emX2 1.72 0.71 0.71 0.86 -3.55 2.76 0.00 (1.31)
Table 17 examines the correlations between KS2emX1 and KS2emX2 on the one hand, and WISC-2 and WISC-11
on the other. The correlations from Table 4, which compare the WISC measures with KS2em, are also presented
for ease of comparison. The correlations are slightly weaker when using these new alternative measures.
Table 17. Pearsons Correlations between Alternative Key Stage 2 Measures and WISC Measures
KS2emX1 KS2emX2 KS2em WISC-2 WISC-11
KS2emX1 1.00** KS2emX2 1.00** 1.00** KS2em 1.00** 0.97** 1.00** WISC-2 0.66** 0.68** 0.70** 1.00** WISC-11 0.71** 0.73** 0.74** 0.98** 1.00**
Figure 3 displays the percentile distributions of the KS2emX1 and KS2emX2 variables, with the KS2em variable
superimposed on top of them. Figure 4 superimposes the percentile distributions onto each WISC variable. Having
treated those with failed Key Stage 2 scores clearly brings the distribution of the measures closer to that of the
WISC (compare Figures 2 and 4). This is particularly so when considering the WISC-2 variable, however, the closer
association is in fact shown to be between these alternative Key Stage 2 measures and the WISC-11 variable when
examining the correlations given in Table 17.
Figure 3. Percentile Distributions of KS2emX1 and KS2emX2
Figure 4. Percentile Distributions of Each Pair of Alternative Key Stage 2 and WISC Measures
02
46
Perc
ent
-4 -2 0 2 4KS2emX1 and KS2em
KS2emX1 KS2em
02
46
Perc
ent
-4 -2 0 2 4KS2emX2 and KS2em
KS2emX2 KS2em

Social Origins, Cognitive Ability and Educational Attainment: A Birth Cohort and Life Course Perspective May 2016
13
Taking the same approach presented above, cross-classifications of each alternative Key Stage measure with each
WISC measure were derived after having transformed the variables into deciles and quintiles. Each cross-tabulation
is given in Tables A1–A8 in the Appendix, and a summary of these is presented in Table 18 below. These results
should be contrasted with those given in Table 14 above, which displays the same summary for the cross-
classifications of the constructed Key Stage measures before making any amendments to those with zero scores
(KS2em and KS2ems). Reassigning failed scores to non-failed scores does not tend to increase the proportion of
cases found in the same decile; the proportion found in a higher Key Stage than WISC decile is reduced, but this
reduction is insubstantial.
Table 18. Summary Statistics based on Cross-Classifications of Alternative Key Stage 2 Decile and Quintile
Measures with WISC measures
Decile Measures
% Same decile % KS2 higher than WISC % WISC higher than KS2
KS2emX1 & WISC-2 21 51 28 KS2emX1 & WISC-11 24 51 25 KS2emX2 & WISC-2 22 53 25 KS2emX2 & WISC-11 23 54 23
Quintile Measures
% Same quintile % KS2 higher than WISC % WISC higher than KS2
KS2emX1 & WISC-2 39 40 21 KS2emX1 & WISC-11 41 40 19
02
46
Per
cen
t
-6 -4 -2 0 2 4KS2emX1 and WISC-2
KS2emX1 WISC-2
02
46
Per
cen
t
-10 -5 0 5KS2emX1 and WISC-11
KS2emX1 WISC-11
02
46
Per
cen
t
-6 -4 -2 0 2 4KS2emX2 and WISC-2
KS2emX2 WISC-2
02
46
Per
cen
t
-10 -5 0 5KS2emX2 and WISC-11
KS2emX2 WISC-11

Social Origins, Cognitive Ability and Educational Attainment: A Birth Cohort and Life Course Perspective May 2016
14
KS2emX2 & WISC-2 39 42 19 KS2emX2 & WISC-11 41 43 16
4 Associations between the Different Cognitive Ability Measures and Other Focal
Variables10
In order to determine whether performance at Key Stage 2 can be considered adequate as a proxy for cognitive
ability, it is important to demonstrate that these constructed measures are associated with social origin and
educational attainment variables in a way which is similar to the WISC measures. In this section, the variables
KS2em (which makes no adjustments for the 2.5% of cases with zero scores) and KS2emX2 (which replaces failed
scores with non-failed scores on other tests where possible, setting others to missing) are examined using ALSPAC
data. Parental class, status, education and income, and respondents’ educational attainment have been constructed in
ways which, as far as possible, mirror the approaches previously taken when using LSYPE data. Appendix B
provides an explanation of how these measures were constructed, descriptive statistics and some notes on how their
distributions compare with those found using LSYPE data.
Table 19 shows how the Key Stage 2 and WISC measures are distributed across these other focal variables, both by
presenting the proportions found in the lowest and highest deciles across categories and also by presenting the
means, using a normalised version of each measure.
Table 19. Key Stage 2 and WISC Distributions across Other Focal Variables, in ALSPAC
% of category falling into lowest and highest deciles
Mean (variables normalised)
KS2em KS2emX2 WISC2 WISC11 KS2em KS2emX2 WISC2 WISC11
1st 10th 1st 10th 1st 10th 1st 10th
NS-SeC Hi managerial 3 21 3 21 5 17 5 18 0.69 0.67 0.62 0.61 Lo managerial 6 13 6 13 7 12 6 12 0.64 0.61 0.59 0.57 Intermediate 8 10 8 10 11 8 10 8 0.61 0.58 0.56 0.55 Small empl. 13 3 13 3 13 5 12 5 0.53 0.50 0.54 0.53 Lo supervisory 11 7 11 7 13 5 15 4 0.56 0.53 0.53 0.51 Semi routine 15 4 16 4 16 4 17 3 0.52 0.49 0.52 0.49 Routine 16 5 16 5 18 3 18 2 0.51 0.49 0.51 0.49 Education 7. Both parents have degrees 2 38 1 38 2 28 2 29 0.77 0.75 0.67 0.66 6. 3 18 3 18 5 15 4 16 0.69 0.67 0.61 0.60 5. 3 16 3 16 5 13 5 13 0.68 0.65 0.60 0.58 4. 8 9 7 9 9 6 9 5 0.61 0.58 0.56 0.54 3. 12 5 13 5 15 4 15 4 0.55 0.52 0.53 0.51 2. 17 4 18 4 21 1 23 1 0.49 0.47 0.49 0.47 1. Neither has qualifications 30 1 27 1 37 1 38 2 0.41 0.40 0.42 0.39
10 Note that a complete case analysis has not been done in this section; cases with valid information on the two relevant variables included in each bivariate relationship described are used. The initial (full) sample size in ALSPAC is 15,445.

Social Origins, Cognitive Ability and Educational Attainment: A Birth Cohort and Life Course Perspective May 2016
15
CG Status (quintiles) 5. Top 3 20 3 20 5 16 5 17 0.69 0.66 0.62 0.61 4. 5 17 4 17 7 15 6 15 0.67 0.64 0.60 0.59 3. 7 9 7 9 9 7 10 6 0.61 0.58 0.56 0.54 2. 12 5 12 5 12 5 14 5 0.56 0.53 0.54 0.52 1. Bottom 17 4 17 4 19 3 19 3 0.50 0.48 0.50 0.48 Income (quintiles) 5. Top 2 26 2 25 3 20 3 20 0.72 0.70 0.63 0.62 4. 4 18 4 18 6 13 6 13 0.67 0.64 0.60 0.58 3. 5 11 6 11 9 10 8 10 0.64 0.61 0.57 0.56 2. 7 8 8 8 12 6 12 6 0.60 0.57 0.55 0.53 1. Bottom 12 6 11 6 16 6 16 5 0.56 0.53 0.53 0.51
Educational Attainment 5. 2+A-levels 0 22 1 22 2 16 2 16 0.73 0.70 0.63 0.62 4. 1 7 2 7 6 4 6 3 0.65 0.61 0.56 0.54 3. 10 1 13 1 19 1 20 1 0.49 0.45 0.49 0.46 2. 40 0 39 0 45 0 48 0 0.34 0.32 0.41 0.38 1. No qualifications 54 1 38 1 40 1 43 0 0.28 0.35 0.41 0.39 A-level Transition No 17 2 17 3 20 2 21 2 0.49 0.46 0.50 0.47 Yes 1 19 1 19 4 14 3 14 0.71 0.68 0.62 0.60 Key Stage 5 Transition No 22 1 21 1 24 1 26 1 0.45 0.43 0.47 0.45 Yes 2 16 3 15 5 12 5 12 0.68 0.65 0.60 0.58 2+ A-level Threshold Did not pass 16 3 16 3 18 2 19 2 0.50 0.48 0.50 0.48 Passed threshold 0 22 1 22 2 16 2 16 0.73 0.70 0.63 0.62
Tables 20–23 examine the relationship between social class, having used a fivefold collapse to derive an ordinal
measure, and the alternative measures of cognitive ability, given in quintiles.
Table 20. Cross-Tabulation of Social Class and KS2em Quintiles, in ALSPAC (%)
Quintiles
1 Bottom 2 3 4 5 Top Total
Higher managerial 8 8
12 11
18 16
26 22
37 32
100 18
Lower managerial 13 18
17 22
20 26
23 29
26 32
100 26
Intermediate 21 35
23 37
21 33
20 31
16 24
100 32
Semi routine 30 24
24 18
21 16
15 11
10 7
100 15
Routine 30 16
25 12
21 10
14 7
10 5
100 10
Total 19 100
20 100
20 100
20 100
21 100
100 100
Table 21. Cross-Tabulation of Social Class and KS2emX2 Quintiles, in ALSPAC (%)
Quintiles

Social Origins, Cognitive Ability and Educational Attainment: A Birth Cohort and Life Course Perspective May 2016
16
1 Bottom 2 3 4 5 Top Total
Higher managerial 8 7
13 12
18 16
26 22
37 32
100 18
Lower managerial 14 19
16 21
20 26
23 29
26 32
100 26
Intermediate 21 35
23 36
21 33
20 31
16 24
100 32
Semi routine 29 23
25 19
21 15
15 11
10 7
100 15
Routine 31 16
25 12
21 10
14 7
10 5
100 10
Total 19 100
20 100
20 100
20 100
21 100
100 100
Table 22. Cross-Tabulation of Social Class and WISC-2 Quintiles, in ALSPAC (%)
Quintiles
1 Bottom 2 3 4 5 Top Total
Higher managerial 10 13
15 19
20 24
25 31
31 38
100 25
Lower managerial 15 23
19 28
19 28
22 32
24 34
100 29
Intermediate 24 32
22 29
21 28
18 24
15 19
100 27
Semi routine 31 18
24 14
22 12
14 8
9 5
100 12
Routine 33 14
27 11
17 6
13 5
40 4
100 8
Total 20 100
20 100
20 100
20 100
20 100
100 100
Table 23. Cross-Tabulation of Social Class and WISC-11 Quintiles, in ALSPAC (%)
Quintiles
1 Bottom 2 3 4 5 Top Total
Higher managerial 9 12
15 19
20 25
25 32
31 39
100 25
Lower managerial 16 24
18 26
20 28
22 32
24 34
100 29
Intermediate 23 31
23 30
22 28
18 24
14 19
100 26
Semi routine 31 19
27 15
21 12
13 7
9 5
100 12
Routine 37 15
24 10
17 7
13 5
9 3
100 8
Total 20 100
20 100
20 100
20 100
20 100
100 100
For each of the Tables 20–23 above, global log odds ratios were calculated, using the method proposed by Cox and
Jackson (2009). Differences between the averages of the centre four global log odds ratios for each pair of Key

Social Origins, Cognitive Ability and Educational Attainment: A Birth Cohort and Life Course Perspective May 2016
17
Stage 2 and WISC measures were then tested for significance.11 Similar cross-tabulations were also produced for
each cognitive ability measure by parental education12, status and income, and respondents’ overall educational
attainment as well as GCSE performance13 (see Tables A9–A28 in the Appendix); differences between the averages
of the centre four global log odds ratios were tested in the same way. The results of each test are given in Table 24.
Whether social origin is measured via parental class, education, status or income, and regardless of which pair of
Key Stage–WISC measures is observed, there are no significant differences between the average global log odds
ratios. However, differences between Key Stage measures and WISC measures in their association with educational
attainment are statistically significant, and this is found to be so regardless of which pair of measures is assessed.
Table 24. Average Centre Four Global Log Odds Ratios and a Test of Significance in the Differences
Average Centre Four Difference SE Difference Lower CI Upper CI
KS2 WISC
NS-SeC KS2em–WISC-2 0.94 0.91 0.03 0.06 -0.14 0.09 KS2em–WISC-11 0.94 0.99 0.05 0.06 -0.07 0.18 KS2emX2–WISC-2 0.94 0.91 0.03 0.06 -0.15 0.09 KS2emX2–WISC-11 0.94 0.99 0.05 0.06 -0.07 0.17 Education KS2em–WISC-2 1.22 1.11 0.12 0.06 -0.23 0.00 KS2em–WISC-11 1.22 1.20 0.02 0.06 -0.14 0.10 KS2emX2–WISC-2 1.23 1.11 0.13 0.06 -0.24 -0.01 KS2emX2–WISC-11 1.23 1.20 0.03 0.06 -0.15 0.09 Status KS2em–WISC-2 1.07 0.95 0.12 0.06 -0.23 0.00 KS2em–WISC-11 1.07 1.06 0.01 0.06 -0.12 0.12 KS2emX2–WISC-2 1.06 0.95 0.11 0.06 -0.22 0.00 KS2emX2–WISC-11 1.06 1.06 0.00 0.06 -0.11 0.12
Table 24 Continued. Average Centre Four Global Log Odds Ratios and a Test of Significance in the Differences
Average Centre Four Difference SE Difference Lower CI Upper CI
KS2 WISC
Income KS2em–WISC-2 0.82 0.75 0.07 0.06 -0.20 0.05 KS2em–WISC-11 0.82 0.78 0.04 0.07 -0.17 0.09 KS2emX2–WISC-2 0.81 0.75 0.06 0.06 -0.18 0.06 KS2emX2–WISC-11 0.81 0.78 0.03 0.07 -0.15 0.10 Attainment KS2em–WISC-2 2.96 2.39 0.57** 0.12 -0.80 -0.35 KS2em–WISC-11 2.96 2.61 0.35** 0.13 -0.60 -0.09 KS2emX2–WISC-2 2.89 2.39 0.50** 0.12 -0.73 -0.27 KS2emX2–WISC-11 2.89 2.61 0.27** 0.13 -0.53 -0.02 GCSE Performance KS2em–WISC-2 2.76 1.93 0.83** 0.07 -0.97 -0.69 KS2em–WISC-11 2.76 2.11 0.65** 0.08 -0.80 -0.50 KS2emX2–WISC-2 2.72 1.93 0.79** 0.07 -0.93 -0.65
11 From the global log odds ratios, covariances are calculated to determine the standard errors of the average. The significance tests take into account the dependence that is introduced by measuring the same individuals (Cox and Jackson 2009:484). 12 The parental education variable was collapsed into a five-category measure in order to carry out the same exercise. The new variable was recoded so that 1=1, 2 & 3=2, 4=3, 5=4, 6 & 7=5. 13 The number of A*–C GCSE grades variable was split into quintiles before running the cross-tabulation.

Social Origins, Cognitive Ability and Educational Attainment: A Birth Cohort and Life Course Perspective May 2016
18
KS2emX2–WISC-11 2.72 2.11 0.61** 0.08 -0.76 -0.46 Notes:
** p<0.01
Correlations between the number of GCSEs attained and each cognitive ability measure are given below.
Number of GCSEs – KS2em: 0.72**
Number of GCSEs – KS2emX2: 0.72**
Number of GCSEs – WISC2: 0.57**
Number of GCSEs – WISC11: 0.60**
4.1 Multivariate Analyses
This section advances upon the examination of bivariate relationships presented above, by now considering
differences between Key Stage and WISC measures in the context of multivariate analyses. A series of binary logistic
regression models were run which altered the independent variable of cognitive ability, but kept the rest of the
model specification otherwise unchanged. The dependent variable considered measures whether or not respondents
attained the 2+ A-level threshold. See Table 25, in which cognitive ability is variously represented by the alternative
measures KS2emX2, WISC-2 and WISC-11. The baseline models, M0, include only social origin variables, models
M1 introduce cognitive ability z-scores and models M2 replace this with cognitive ability quintiles.
For the models presented in Table 25, social origin measures have been coded in the same way as presented in Table
3 of Bukodi et al (2014:300), with one exception: the parental class variable has been collapsed into a five-category
ordinal measure due to problems associated with controlling for parents who are self-employed (namely, for ‘small
employers and own account workers’ all cases are self-employed). Classes 3–5 have therefore been combined.
Respondents’ gender and parents’ employment status (employer or self-employed vs employed) are included as
controls. The same sample is employed for each model (i.e. those with complete information on all variables,
including each cognitive ability measure).

Social Origins, Cognitive Ability and Educational Attainment: A Birth Cohort and Life Course Perspective May 2016
19
Table 25. Binary Logistic Regression of Attaining the 2+ A-levels Educational Threshold on Parental Class, Status and Education, and [KS2 and WISC] Cognitive Ability
(Average Marginal Effects) – ALSPAC Only
KS2emX2 WISC-2 WISC-11
M0 M1 M2 M1 M2 M1 M2 Lower
CI Est Upper
CI Lower
CI Est Upper
CI Lower
CI Est Upper
CI Lower
CI Est Upper
CI Lower
CI Est Upper
CI Lower
CI Est Upper
CI Lower
CI Est Upper
CI
Parental class (5) 4. Semi-routine 3. 3+4+5† 2. Lower managerial 1. Higher managerial
[-.06] [.01] [.02] [.05]
-.00 .06* .08* .11*
[.06] [.12] [.14] [.18]
[-.05] [-.02] [-.01] [.00]
.01 .03 .05 .06*
[.07] [.08] [.10] [.12]
[-.05] [-.02] [-.01] [.01]
.01 .03 .05 .06*
[.06] [.08] [.10] [.12]
[-.05] [-.01] [-.00] [.01]
.01 .04 .05 .07*
[.06] [.09] [.11] [.14]
[-.05] [-.01] [-.00] [.02]
.01 .04 .06 .08*
[.06] [.09] [.11] [.14]
[-.05] [-.01] [-.00] [.01]
.01 .04 .05 .07*
[.06] [.09] [.11] [.13]
[-.05] [-.01] [.00] [.02]
.01 .04 .06* .08*
[.07] [.09] [.11] [.14]
Parental status 0–1
[.17]
.24*
[.31]
[.08]
.14*
[.20]
[.09]
.15*
[.21]
[.10]
.17*
[.23]
[.11]
.18*
[.24]
[.09]
.16*
[.22]
[.09]
.16*
[.22]
Parental education 0–1
[.35]
.39*
[.42]
[.19]
.23*
[.27]
[.20]
.24*
[.28]
[.23]
.27*
[.31]
[.24]
.28*
[.32]
[.21]
.25*
[.29]
[.23]
.27*
[.30]
Self employed 0–1
[-.11]
-.04
[.04]
[-.08]
-.01
[.05]
[-.08]
-.02
[.05]
[-.11]
-.05
[.02]
[-.11]
-.04
[.03]
[-.11]
-.05
[.02]
[-.12]
-.05
[.02]
Gender (male) Female
[.06]
.08*
[.11]
[.03]
.06*
[.08]
[.04]
.06*
[.08]
[.06]
.09*
[.11]
[.06]
.09*
[.11]
[.06]
.09*
[.11]
[.06]
.09*
[.11]
Cognitive ability z-scores
[.22]
.23*
[.24]
[.06]
.17*
[.19]
[.18]
.19*
[.20]
Cognitive ability (3rd) Bottom 2nd 4th Top
[-.39] [-.26] [.11] [.25]
-.34* -.22* .15* .29*
[-.30] [-.18] [.19] [.33]
[-.28] [-.11] [.07] [.22]
-.23* -.07* .12* .27*
[-.19] [-.02] [.16] [.31]
[-.33] [-.16] [.06] [.21]
-.29* -.12* .10* .25*
[-.25] [-.08] [.14] [.29]
N 4,644 4,644 4,644 4,644 4,644 4,644 4,644 Notes: † 3+4+5 = Intermediate, small employers and own account workers, and lower supervisory and technical.
* p<0.05

Social Origins, Cognitive Ability and Educational Attainment: A Birth Cohort and Life Course Perspective May 2016
20
For all of the models shown, each of the three components of social origin has significant effects, even after
controlling for cognitive ability, on whether or not respondents reach the 2+ A-level threshold. This is shown to be
the case regardless of whether Key Stage 2 or WISC scores are used to represent cognitive ability (though it is
notable that the effects of social origin are more greatly reduced with the inclusion of the former [by ~41–45%]
than they are with the latter [by ~33–36%]). As regards cognitive ability, Key Stage measures have a larger negative
effect for those in lower-scoring quintiles, coupled with a slightly larger positive effect for those in higher-scoring
quintiles, relative to WISC. This is largely parallel to what is shown in the descriptive statistics of Table 19. Similarly,
using z-score measures, the Key Stage proxy is shown to have a more substantial influence on attainment.
Appendix C presents the results of a set of sensitivity analyses. In Table C1, the reference group chosen for the
cognitive ability quintiles variable is changed; this serves only to reinforce the findings in Table 25. Tables C3–C4
use alternative coding approaches for social origin variables; these variations have little influence over the
substantive findings of Table 25, though there are some differences between Key Stage and WISC models in the
significance of estimates for the salariat classes (shown in Table C2 but not in Table C3) and the net effect of
parental education is slightly larger in the WISC models. Cognitive ability estimates are unchanged and thus in sum,
discrepancies of the kind described above are shown to be largely robust.
Table 26 replicates the models presented in Table 25, but with the inclusion of parental income as an additional
component of social origins. Model M3 is equivalent to model M0+parental income. Models M4 and M5 introduce
cognitive ability, as in Table 25. The indicator for parental income is statistically significant and the size of the effect
is relatively substantial across models. Comparing model M0 in Table 25 to model M3 in Table 26, the inclusion of
income does little to affect the size or significance of the other social origin variables. Aside from the (in)significance
of the social class parameters once cognitive ability is controlled, patterns of association in Table 26 are, on the
whole, not dissimilar to those presented in Table 25; notably, there is almost no change in the average marginal
effects for each cognitive ability quintile. Appendix C, Tables C4 and C5 repeat the analyses, using parental income
first in linear form and then in quintiles. These changes make no difference to the substantive conclusions drawn
from Table 26.
The LSYPE dataset was then used to carry out the same exercise, generating a measure for cognitive ability
constructed using an approach identical to that for KS2emX214 (i.e. a modified version of the variable KS2em. See
Appendix D for the results of the PCA).15 Table 27 presents the estimates from these models, with those from the
ALSPAC data replicated again in the same table for ease of comparison. The same estimates for LSYPE models
with confidence intervals are given in Table C6, Appendix C. Models M0–M5 correspond to those in Tables 25 and
26; i.e.:
Model M0: Parental class + Parental status + Parental Education (+ self-employment and gender controls)
Model M1: Model M0 + Cognitive ability (z-scores)
Model M2: Model M0 + Cognitive ability (quintiles)
Model M3: Model M0 + Parental income
Model M4: Model M3 + Cognitive ability (z-scores)
Model M5: Model M3 + Cognitive ability (quintiles)
Table 27 highlights some initial differences in both social origin and Key Stage measures in predicting the likelihood
of exceeding the 2+ A-level threshold between the LSYPE and ALSPAC samples. The size and significance of
estimates for parental class and status are similar, though those for parental education are larger using ALSPAC data.
Conversely, the estimate for parental income in LSYPE is twice the size of that in ALSPAC (until cognitive ability
14 The KS2emX1 variable was also constructed using LSYPE data but it is not used in the analyses which follow. 15 Wave 7 longitudinal weights are applied and the survey design is accounted for using Stata’s svyset command.

Social Origins, Cognitive Ability and Educational Attainment: A Birth Cohort and Life Course Perspective May 2016
21
Table 26. Binary Logistic Regression of Attaining the 2+ A-levels Educational Threshold on Parental Class, Status, Education and Income, and [KS2 and WISC] Cognitive
Ability (Average Marginal Effects) – ALSPAC Only
KS2emX2 WISC-2 WISC-11
M3 M4 M5 M4 M5 M4 M5 Lower
CI Est Upper
CI Lower
CI Est Upper
CI Lower
CI Est Upper
CI Lower
CI Est Upper
CI Lower
CI Est Upper
CI Lower
CI Est Upper
CI Lower
CI Est Upper
CI
Parental class (5) 4. Semi-routine 3. 3+4+5† 2. Lower managerial 1. Higher managerial
[-.06] [-.00] [.01] [.02]
.00 .05 .07* .09*
[.06] [.11] [.13] [.15]
[-.04] [-.03] [-.01] [-.01]
.01 .02 .04 .05
[.07] [.07] [.09] [.10]
[-.05] [-.02] [-.01] [-.01]
.01 .03 .04 .05
[.06] [.08] [.09] [.11]
[-.05] [-.02] [-.01] [-.00]
.01 .03 .05 .06
[.06] [.08] [.10] [.12]
[-.05] [-.02] [-.01] [-.00]
.01 .03 .05 .06
[.07] [.09] [.10] [.12]
[-.05] [-.02] [-.01] [-.00]
.01 .03 .04 .06
[.07] [.08] [.10] [.11]
[-.05] [-.02] [-.00] [.00]
.01 .04 .05 .06
[.07] [.09] [.11] [.12]
Parental status 0–1
[.14]
.21*
[.27]
[.06]
.12*
[.18]
[.06]
.13*
[.19]
[.08]
.14*
[.21]
[.09]
.15*
[.22]
[.07]
.13*
[.20]
[.07]
.13*
[.20]
Parental education 0–1
[.31]
.35*
[.39]
[.17]
.21*
[.25]
[.18]
.22*
[.26]
[.20]
.24*
[.28]
[.21]
.25*
[.29]
[.19]
.22*
[.26]
[.20]
.24*
[.28]
Parental income 0–1
[.16]
.21*
[.26]
[.08]
.13*
[.18]
[.09]
.14*
[.19]
[.12]
.17*
[.22]
[.12]
.17*
[.22]
[.11]
.16*
[.21]
[.11]
.16*
[.21]
Self employed 0–1
[-.10]
-.02
[.05]
[-.07]
-.00
[.06]
[-.07]
-.01
[.06]
[-.10]
-.03
[.03]
[-.09]
-.02
[.04]
[-.10]
-.04
[.03]
[-.10]
-.04
[.03]
Gender (male) Female
[.05]
.08*
[.11]
[.03]
.06*
[.08]
[.04]
.06*
[.08]
[.06]
.09*
[.11]
[.06]
.09*
[.11]
[.06]
.09*
[.11]
[.06]
.08*
[.11]
Cognitive ability z-scores
[.22]
.23*
[.24]
[.16]
.17*
[.19]
[.17]
.19*
[.20]
Cognitive ability (3rd) Bottom 2nd 4th Top
[-.39] [-.26] [.10] [.25]
-.34* -.22* .15* .29*
[-.30] [-.18] [.19] [.33]
[-.27] [-.11] [.07] [.22]
-.23* -.07* .11* .26*
[-.19] [-.03] [.15] [.30]
[-.33] [-.16] [.05] [.20]
-.29* -.12* .09* .24*
[-.25] [-.08] [.13] [.29]
N 4,644 4,644 4,644 4,644 4,644 4,644 4,644 Notes: † 3+4+5 = Intermediate, small employers and own account workers, and lower supervisory and technical.
* p<0.05

Social Origins, Cognitive Ability and Educational Attainment: A Birth Cohort and Life Course Perspective May 2016
22
Table 27. Binary Logistic Regression of Attaining the 2+ A-levels Educational Threshold on Parental Class, Status,
Education and Income, and [KS2] Cognitive Ability (Average Marginal Effects) – LSYPE and ALSPAC
KS2emX2_LSYPE KS2emX2_ALSPAC
M0 M1 M2 M3 M4 M5 M0 M1 M2 M3 M4 M5
Parental class (5) 4. Semi-routine 3. 3+4+5† 2. Lower managerial 1. Higher managerial
0.02 0.04 0.06* 0.12*
0.02 0.00 0.03 0.06*
0.01 0.01 0.03 0.06*
0.02 0.03 0.05 0.09*
0.02 0.00 0.02 0.05
0.01 0.00 0.03 0.05
-0.00 0.06* 0.08* 0.11*
0.01 0.03 0.05 0.06*
0.01 0.03 0.05 0.06*
0.00 0.05 0.07* 0.09*
0.01 0.02 0.04 0.05
0.01 0.03 0.04 0.05
Parental status 0–1
0.27*
0.13*
0.14*
0.25*
0.13*
0.13*
0.24*
0.14*
0.15*
0.21*
0.12*
0.13*
Parental education 0–1
0.33*
0.16*
0.16*
0.32*
0.15*
0.16*
0.39*
0.23*
0.24*
0.35*
0.21*
0.22*
Parental income 0–1
0.45*
0.19*
0.20*
0.21*
0.13*
0.14*
Self employed 0–1
0.06*
0.06*
0.05*
0.06*
0.05*
0.05*
-0.04
-0.01
-0.02
-0.02
-0.00
-0.01
Gender (male) Female
0.08*
0.07*
0.07*
0.09*
0.07*
0.07*
0.08*
0.06*
0.06*
0.08*
0.06*
0.06*
Cognitive ability z-scores
0.23*
0.23*
0.23*
0.23*
Cognitive ability (3rd) Bottom 2nd 4th Top
-0.27* -0.13* 0.20* 0.44*
-0.27* -0.13* 0.19* 0.43*
-0.34* -0.22* 0.15* 0.29*
-.34* -.22* .15* .29*
N 5,868 4,644 Notes: † 3+4+5 = Intermediate, small employers and own account workers, and lower supervisory and technical.
LSYPE data are weighted and clustering has been accounted for using the svyset command
is introduced). It should be noted that the measure of parental income in LSYPE is of far better quality (see
Appendix B), and a direct comparison between them is problematic. Estimates of cognitive ability, measured via z-
scores, are identical in LSYPE and ALSPAC models, but notable differences arise in the quintiles measure: estimates
for those in the higher quintiles are larger in LSYPE, and for those in the lower quintiles they are smaller (implying a
further divergence from scores determined via WISC). Overall, Key Stage 2 is shown to be an even more powerful
predictor among the LSYPE sample than the ALSPAC sample.
5 The Changing Role of Cognitive Ability over Time
This section will consider the role of cognitive ability over time, both by analysing change between the BCS70 and
ALSPAC samples and between the BCS70 and LSYPE samples.
5.1 Differences between Key Stage 2 and WISC in Assessing the Role of Cognitive Ability across
Cohorts – Analyses using ALSPAC and BCS70
This section presents a set of preliminary analyses to examine the changing role of cognitive ability over time, using
BCS70 and ALSPAC data. The intention is to determine, by alternating between the use of Key Stage 2 and WISC
in otherwise-identical model specifications, whether we detect changes in cognitive ability effects of similar or
different kinds. Table 28 (excluding parental income) and Table 29 (including parental income) present the results of
a series of logistic regression models predicting whether or not individuals passed the 2+ A-level threshold. Models
M1 include social origin variables, cognitive ability (z-scores), cohort and a cognitive ability-by-cohort interaction.
Models M2 replace the z-scores measure with cognitive ability quintiles.16
16 Coefficient values are presented instead of AMEs. The value of the interaction term cannot change independently of the value of component terms so a separate marginal effect for the interaction cannot be estimated (see Stata margins manual).

Social Origins, Cognitive Ability and Educational Attainment: A Birth Cohort and Life Course Perspective May 2016
23
Table 28. Binary Logistic Regression of Attaining the 2+ A-levels Educational Threshold on Cohort, Parental Class, Status and Education, [KS2 and WISC] Cognitive Ability,
and Cognitive Ability-by-Cohort – ALSPAC and BCS70
KS2emX2 WISC-2 WISC-11
M1 M2 M1 M2 M1 M2
Lower CI
Est Upper CI
Lower CI
Est Upper CI
Lower CI
Est Upper CI
Lower CI
Est Upper CI
Lower CI
Est Upper CI
Lower CI
Est Upper CI
Cohort (BCS70) ALSPAC
[0.95]
1.08*
[1.22]
[1.10]
1.35*
[1.59]
[1.42]
1.55*
[1.67]
[1.24]
1.48*
[1.72]
[1.43]
1.56*
[1.69]
[1.38]
1.62*
[1.86]
Parental class (5) 4. Semi-routine 3. 3+4+5† 2. Lower managerial 1. Higher managerial
[-0.31] [-0.07] [0.01] [0.13]
-0.05 0.15 0.26* 0.40*
[0.21] [0.38] [0.51] [0.67]
[-0.32] [-0.05] [0.01] [0.15]
-0.06 0.17 0.26* 0.42*
[0.20] [0.40] [0.51] [0.69]
[-0.33] [-0.04] [0.02] [0.16]
-0.08 0.19 0.27* 0.43*
[0.17] [0.41] [0.51] [0.69]
[-0.32] [-0.02] [0.03] [0.17]
-0.07 0.20 0.27* 0.43*
[0.18] [0.42] [0.51] [0.69]
[-0.33] [-0.04] [0.02] [0.16]
-0.07 0.18 0.26* 0.42*
[0.19] [0.40] [0.50] [0.69]
[-0.32] [-0.02] [0.04] [0.18]
-0.06 0.20 0.28* 0.45*
[0.19] [0.42] [0.53] [0.71]
Parental status 0–1
[0.30]
0.57*
[0.85]
[0.33]
0.61*
[0.88]
[0.35]
0.62*
[0.89]
[0.38]
0.65*
[0.92]
[0.32]
0.60*
[0.87]
[0.34]
0.61*
[0.88]
Parental education 0–1
[1.07]
1.27*
[1.46]
[1.14]
1.33*
[1.53]
[1.14]
1.33*
[1.52]
[1.20]
1.39*
[1.58]
[1.10]
1.29*
[1.48]
[1.16]
1.35*
[1.54]
Self employed 0–1
[-0.23]
-0.01
[0.22]
[-0.25]
-0.03
[0.19]
[-0.29]
-0.07
[0.14]
[-0.29]
-0.07
[0.14]
[-0.29]
-0.07
[0.14]
[-0.30]
-0.09
[0.13]
Gender (male) Female
[0.14]
0.25*
[0.35]
[0.14]
0.25*
[0.35]
[0.23]
0.34*
[0.44]
[0.22]
0.32*
[0.43]
[0.23]
0.34*
[0.44]
[0.22]
0.32*
[0.43]
Cognitive ability z-scores
[0.72]
0.82*
[0.92]
[0.71]
0.82*
[0.92]
[0.72]
0.82*
[0.92]
Cognitive ability*Cohort z-score*ALSPAC
[0.46]
0.61*
[0.75]
[0.03]
0.16*
[0.30]
[0.12]
0.25*
[0.39]
Cognitive ability (3rd) Bottom 2nd 4th Top
[-1.60] [-0.65] [0.20] [0.92]
-1.15* -0.34* 0.45* 1.16*
[-0.71] [-0.02] [0.70] [1.39]
[-1.59] [-0.65] [0.19] [0.91]
-1.15* -0.33* 0.44* 1.15*
[-0.70] [-0.02] [0.69] [1.39]
[-1.60] [-0.65] [0.20] [0.92]
-1.15* -0.34* 0.45* 1.16*
[-0.71] [-0.02] [0.70] [1.40]
Cognitive ability*Cohort Bottom*ALSPAC 2nd*ALSPAC 4th*ALSPAC Top*ALSPAC
[-1.45] [-1.15] [-0.07] [-0.02]
-0.89* -0.76* 0.24 0.29
[-0.33] [-0.38] [0.56] [0.61]
[-0.53] [-0.35] [-0.22] [-0.15]
-0.04 0.02 0.09 0.18
[0.46] [0.39] [0.41] [0.50]
[-0.81] [-0.57] [-0.31] [-0.22]
-0.31 -0.21 0.01 0.11
[0.19] [0.16] [0.32] [0.44]
Combined sample N 8,608 8,608 8,608 8,608 8,608 8,608 Notes: † 3+4+5 = Intermediate, small employers and own account workers, and lower supervisory and technical.
* p<0.05

Social Origins, Cognitive Ability and Educational Attainment: A Birth Cohort and Life Course Perspective May 2016
24
Table 29. Binary Logistic Regression of Attaining the 2+ A-levels Educational Threshold on Cohort, Parental Class, Status, Education and Income, [KS2 and WISC] Cognitive
Ability, and Cognitive Ability-by-Cohort – ALSPAC and BCS70
KS2emX2 WISC-2 WISC-11
M3 M4 M3 M4 M3 M4
Lower CI
Est Upper CI
Lower CI
Est Upper CI
Lower CI
Est Upper CI
Lower CI
Est Upper CI
Lower CI
Est Upper CI
Lower CI
Est Upper CI
Cohort (BCS70) ALSPAC
[0.86]
0.99*
[1.13]
[1.01]
1.26*
[1.50]
[1.31]
1.44*
[1.58]
[1.14]
1.38*
[1.63]
[1.33]
1.46*
[1.59]
[1.28]
1.52*
[1.77]
Parental class (5) 4. Semi-routine 3. 3+4+5† 2. Lower managerial 1. Higher managerial
[-0.32] [-0.10] [-0.05] [0.03]
-0.06 0.13 0.20 0.30*
[0.20] [0.35] [0.45] [0.58]
[-0.32] [-0.08] [-0.04] [0.05]
-0.06 0.15 0.21 0.32*
[0.20] [0.37] [0.46] [0.59]
[-0.34] [-0.07] [-0.03] [0.05]
-0.08 0.15 0.21 0.32*
[0.17] [0.38] [0.45] [0.58]
[-0.33] [-0.06] [-0.03] [0.06]
-0.07 0.17 0.21 0.33*
[0.18] [0.39] [0.46] [0.59]
[-0.33] [-0.07] [-0.04] [0.05]
-0.07 0.15 0.21 0.31*
[0.18] [0.37] [0.45] [0.58]
[-0.32] [-0.06] [-0.02] [0.07]
-0.07 0.17 0.23 0.34*
[0.19] [0.39] [0.47] [0.60]
Parental status 0–1
[0.18]
0.46*
[0.74]
[0.20]
0.48*
[0.77]
[0.22]
0.49*
[0.77]
[0.25]
0.53*
[0.80]
[0.20]
0.48*
[0.75]
[0.21]
0.49*
[0.76]
Parental education 0–1
[0.94]
1.14*
[1.34]
[1.00]
1.20*
[1.40]
[0.99]
1.19*
[1.38]
[1.05]
1.25*
[1.44]
[0.95]
1.15*
[1.34]
[1.01]
1.21*
[1.40]
Parental income 0–1
[0.53]
0.77*
[1.02]
[0.57]
0.82*
[1.06]
[0.63]
0.87*
[1.11]
[0.64]
0.88*
[1.11]
[0.62]
0.86*
[1.10]
[0.63]
0.87*
[1.11]
Self employed 0–1
[-0.22]
-0.00
[0.22]
[-0.25]
-0.03
[0.19]
[-0.28]
-0.07
[0.15]
[-0.28]
-0.06
[0.15]
[-0.28]
-0.07
[0.15]
[-0.30]
-0.08
[0.14]
Gender (male) Female
[0.13]
0.24*
[0.35]
[0.13]
0.24*
[0.35]
[0.23]
0.34*
[0.44]
[0.22]
0.32*
[0.43]
[0.23]
0.33*
[0.44]
[0.21]
0.32*
[0.42]
Cognitive ability z-scores
[0.70]
0.80*
[0.91]
[0.70]
0.80*
[0.90]
[0.70]
0.81*
[0.91]
Cognitive ability*Cohort z-score*ALSPAC
[0.47]
0.61*
[0.76]
[0.04]
0.18*
[0.31]
[0.13]
0.26*
[0.40]
Cognitive ability (3rd) Bottom 2nd 4th Top
[-1.58] [-0.64] [0.18] [0.90]
-1.13* -0.32* 0.43* 1.13*
[-0.69] [-0.01] [0.69] [1.38]
[-1.57] [-0.63] [0.18] [0.89]
-1.12* -0.32* 0.43* 1.13*
[-0.68] [-0.01] [0.68] [1.38]
[-1.58] [-0.64] [0.18] [0.90]
-1.13* -0.33* 0.43* 1.14*
[-0.69] [-0.01] [0.69] [1.38]
Cognitive ability*Cohort Bottom*ALSPAC 2nd*ALSPAC 4th*ALSPAC Top*ALSPAC
[-1.46] [-1.17] [-0.07] [-0.02]
-0.90* -0.78* 0.25 0.29
[-0.34] [-0.39] [0.56] [0.60]
[-0.56] [-0.37] [-0.22] [-0.15]
-0.06 -0.00 0.10 0.18
[0.43] [0.37] [0.42] [0.51]
[-0.83] [-0.60] [-0.31] [-0.22]
-0.33 -0.23 0.01 0.11
[0.17] [0.13] [0.32] [0.44]
Combined sample N 8,608 8,608 8,608 8,608 8,608 8,608

Social Origins, Cognitive Ability and Educational Attainment: A Birth Cohort and Life Course Perspective May 2016
25
The findings in Tables 28 and 29 suggest that inferences regarding the changing role of cognitive ability over time
are sensitive to choice of proxy. Key Stage 2 measures are found to overstate both the negative influence of being in
the lowest ability quintile as well as the positive influence of being in the highest ability quintile (though less so),
relative to WISC. Differences in the magnitude of estimates for cognitive ability measured via z-scores serves to
further highlight this discrepancy; put differently, Key Stage 2 has more predictive power. Coefficients for the
interaction between cognitive ability and cohort for those with the lowest scores are significant in the Key Stage
models: being in lower quintiles relative to the middle quintile is more damaging for those in the ALSPAC cohort than
it is for those in the BCS70 cohort. This goes contrary to the pattern of a general decline in the importance of
cognitive ability in predicting educational attainment shown by recent studies that have analysed the British birth
cohorts (e.g. Bukodi et al 2014; Richards et al 2009; Galindo-Rueda and Vignoles 2005). This is not, however,
shown to be true using WISC as a proxy, and the addition of income to the models in Table 29 does not alter either
of these conclusions.
Interactions between cognitive ability, measured via z-scores, and cohort are significant across all models and
suggest a general increase in its influence. Consistent across the Key Stage and WISC models, there is however no
evidence to suggest that demonstrating a high degree of intellectual capacity (relative to the mid-quintile group) in early
life is more beneficial for younger generations than it was for those born in the 1970s. In sum, WISC models using
quintiles suggest there has been no over-time change in the influence of early-life cognitive ability while Key Stage
models suggest that a significant trend can be identified, and it is one in which the role of cognitive ability is more
influential for younger generations but only if their intellectual capabilities are low. Figure 4 plots the interaction
effect (using quintile measures – models M4) using KS2emX2 and WISC-11 to illustrate this finding.
Figure 4. Cohort-by-Cognitive Ability Interaction Effects – BCS70 and ALSPAC
5.2 Assessing the Role of Cognitive Ability across Cohorts – Analyses using LSYPE and BCS70
In this section, LSYPE and BCS70 data are used to examine the changing role of cognitive ability over time, using
only the measure for Key Stage 2. Table 30 presents the results of a series of logistic regression models using these
data. The model specifications for M1–M4 are identical to those presented in Tables 28 and 29 above. Estimates
from the models using ALSPAC and BCS70 data are replicated again in the same table for ease of comparison. The
same estimates for LSYPE models with confidence intervals are given in Table C8, Appendix C.
0.2
.4.6
.8
Pr(P
ass T
hres
hold
)
BCS70 ALSPACCohort
1st quintile (bottom) 2nd quintile
3rd quintile 4th quintile
5th quintile (top)
Predictive Margins of Cohort#KS2emX2
0.2
.4.6
.8
Pr(P
ass T
hres
hold
)
BCS70 ALSPACCohort
1st quintile (bottom) 2nd quintile
3rd quintile 4th quintile
5th quintile (top)
Predictive Margins of Cohort#WISC-2

Social Origins, Cognitive Ability and Educational Attainment: A Birth Cohort and Life Course Perspective May 2016
26
Table 30. Binary Logistic Regression of Attaining the 2+ A-levels Educational Threshold on Cohort, Parental Class,
Status Education and Income, [KS2] Cognitive Ability, and Cognitive Ability-by-Cohort – LSYPE and BCS70 vs.
ALSPAC and BCS70
LSYPE and BCS70 ALSPAC and BCS70
M1 M2 M3 M4 M1 M2 M3 M4
Cohort (BCS70) LSYPE/ALSPAC
0.99*
1.00*
1.22*
1.23*
1.08*
1.35*
0.99*
1.26*
Parental class (5) 4. Semi-routine 3. 3+4+5† 2. Lower managerial 1. Higher managerial
-0.00 0.08 0.21 0.41*
-0.01 0.09 0.23 0.44*
-0.00 0.07 0.17 0.35*
-0.01 0.08 0.20 0.38*
-0.05 0.15 0.26* 0.40*
-0.06 0.17 0.26* 0.42*
-0.06 0.13 0.20 0.30*
-0.06 0.15 0.21 0.32*
Parental status 0–1
0.64*
0.67*
0.59*
0.62*
0.57*
0.61*
0.46*
0.48*
Parental education 0–1
1.05*
1.10*
1.00*
1.04*
1.27*
1.33*
1.14*
1.20*
Parental income 0–1
0.66*
0.68*
0.77*
0.82*
Self employed 0–1
0.21*
0.18*
0.20*
0.17*
-0.01
-0.03
-0.00
-0.03
Gender (male) Female
0.32*
0.32*
0.32*
0.32*
0.25*
0.25*
0.24*
0.24*
Cognitive ability z-scores
0.84*
0.82*
0.82*
0.80*
Cognitive ability*Cohort z-score*LSYPE/ALSPAC
0.69*
0.71*
0.61*
0.61*
Cognitive ability (3rd) Bottom 2nd 4th Top
-1.17* -0.35* 0.47* 1.18*
-1.14* -0.33* 0.45* 1.15*
-1.15* -0.34* 0.45* 1.16*
-1.13* -0.32* 0.43* 1.13*
Cognitive ability*Cohort Bottom*LSYPE/ALSPAC 2nd*LSYPE/ALSPAC 4th*LSYPE/ALSPAC Top*LSYPE/ALSPAC
-0.65* -0.34 0.41* 0.92*
-0.68* -0.36 0.44* 0.95*
-0.89* -0.76* 0.24 0.29
-0.90* -0.78* 0.25 0.29
Combined sample N 9,832 8,608 Notes:
The longitudinal wave 7 weight provided in the LSYPE dataset has been applied for these models (while assigning all BCS70 cohort members
a value equal to 1). The clustering variables provided (PSUs and Stratum) have not been applied (i.e. the svyset command was not used) because
this would involve assigning an arbitrary value to BCS70 cohort members.
Table 30 highlights some interesting differences between the LSYPE and ALSPAC samples. The interaction
between cohort and cognitive ability, as measured via z-scores, is larger for LSYPE, suggesting Key Stage scores are
a stronger predictor. Observing the quintiles-by-cohort interaction, the negative influence of being of low ability is
somewhat less substantial and the positive influence is markedly more substantial for the LSYPE sample than for the
ALSPAC sample. Further, LSYPE data suggest that the importance of early-life cognitive ability for later-life
educational attainment is statistically significant across the board: it has become more consequential not only for
those who demonstrate low ability, but also – and in fact most drastically – for those in the highest scoring quintiles.
Thus, on balance, while differing estimates are drawn regarding whether it is high- or low-ability respondents who
are affected most by their early-life capabilities, there is certainly no evidence to suggest that the role of cognitive
ability has in any way declined in importance for this younger generation.
Figure 5 plots the interaction effects using both pairs of data.

Social Origins, Cognitive Ability and Educational Attainment: A Birth Cohort and Life Course Perspective May 2016
27
Figure 5. Cohort-by-Cognitive Ability Interaction Effects – BCS70 and ALSPAC vs. BCS70 and LSYPE
6 Summary
Using ALSPAC data to examine the relationship between scores achieved in national Key Stage 2 assessments and
scores achieved on WISC-III tests of ability has shown that these two measures have a strong association. Table 4
shows that, using PCA to derive individuals’ ‘g’ score, each combination of measures is correlated above .70. The
strongest associations are shown between WISC-11 (which uses scores from each individual WISC item) and the
Key Stage measures (.75 for KS2ems and .74 for KS2em); however, comparing overall distributions by examining
the histograms, the variables displaying the largest degree of similarity appear to be WISC-2 and KS2em (see the top
left panel of Figure 2).
The main points of departure relate to the ‘spike’ in the left tail of the distribution of all Key Stage measures, which
represent those who failed the tests, as well as that the Key Stage distributions are slightly shifted to the right,
indicating that they may be overestimating cognitive ability relative to the WISC measures. This latter point is also
apparent by looking at Table 14, such that ~55% of cases (depending on the pairing considered) are in a higher Key
Stage than WISC decile and ~44% of cases are in a higher Key Stage than WISC quintile.
In an attempt to correct for this and to bring the distributions closer in alignment, an alternative approach was
considered for treating the 2.5% of cases who failed Key Stage English and Maths tests; these were either set to
missing (generating variable “KS2emX1”) or given a score from an alternative Key Stage test where available
(generating variable “KS2emX2”). Neither of these approaches served to improve the strength of association
between Key Stage scores and WISC scores, assessed via Pearsons correlations (Table 17), nor to increase the
proportions of cases found in the same Key Stage and WISC deciles or quintiles. These new measures did result in
slightly fewer cases being found in a higher Key Stage than WISC percentile, but only by a few percentage points at
best.
The right hand panel of Table 19, which gives mean scores by each social origin and educational attainment variable,
reinforces the finding that Key Stage scores generally overestimate cognitive ability relative to WISC (though this is
shown to be less so for the alternative measure that treats those with failed scores). The most notable point that
arises from Table 19 is that, while Key Stage 2 tends to overstate cognitive ability compared to WISC for those with
higher levels of educational attainment (as is so with all other social origin variables), it understates cognitive ability for
those with lower levels of educational attainment; this is reflected in both the mean normalised scores and the
proportions falling into the highest and lowest deciles (see beneath the dashed line, Table 19). Similarly, mean Key
0.2
.4.6
.8
Pro
bab
ilit
y o
f P
ass
ing T
hre
shold
BCS70 ALSPACCohort
Lowest 2
3 4
Highest
Predictive Margins of Cohort#KS2emX2
0.2
.4.6
.8
Pr(
Pass
Th
resh
old
)
BCS70 LSYPECohort - BCS70 and LSYPE
Lowest 2
3 4
Highest
Predictive Margins of Cohort#KS2emX2

Social Origins, Cognitive Ability and Educational Attainment: A Birth Cohort and Life Course Perspective May 2016
28
Stage scores are higher than mean WISC scores for those who made the A-level transition (though mean scores for
those who did not make the transition are broadly similar), the Key Stage 5 transition, and those that passed the 2+
A-levels threshold.
Assessing differences in associations between other focal variables and pairs of Key Stage and WISC measures (by
examining global log odds ratios in square contingency tables; see Table 24) served to further highlight divergences
between them in their relationship with educational attainment. No significant differences are apparent between Key
Stage 2 and WISC in their associations with social origin variables; however differences are relatively substantial and
are statistically significant when considering our dependent variable of educational attainment. Further analyses also
showed significant differences between them when considering performance at GCSE.
This finding is not out of keeping with the literature. Strand (2006), for example, assessed differences in the roles of
scores in a general Cognitive Abilities Test (CAT) and those in Key Stage 2 on later performance at GCSE,
concluding that while both measures were predictive of later educational performance and also highly correlated
with each other (~.75), they were ‘not measuring the same thing’ (2006:221). Nonetheless, and more encouraging
for our purposes, other studies have cited the high correlation between Key Stage and WISC measures as alone
being enough to claim that their ‘scores contain similar information about pupils’ cognitive development’ (e.g.
Crawford et al 2014:845).
Differences between Key Stage 2 and WISC measures in the context of various multivariate regression models
predicting the likelihood of passing the 2+ A-level threshold were then examined (see Tables 25 and 26). Notable
differences of the kinds found using descriptive statistics were apparent: in sum, Key Stage 2 is more predictive of
educational attainment. Various sensitivity analyses showed this finding to be robust. Another important finding is
that all of the different components of social origin have independent and significant effects on attainment, even
after controlling for cognitive ability (however operationalised), with the exception of social class once parental
income had been introduced (Table 26). LSYPE data were then used to run identical models (using only Key Stage
measures); this exercise suggested that Key Stage 2 scores were shown to be an even more powerful predictor for the
LSYPE sample than for the ALSPAC sample.
The final part of the document considered changes in the role of cognitive ability over time, comparing the
experiences of this younger generation to those born in the 1970s (BCS70), which flagged up further divergences.
Tables 28 and 29, which use ALSPAC data, suggest inferences are sensitive to choice of cognitive ability proxy. Key
Stage 2 measures are found to overstate both the negative influence of being in the lowest ability quintile as well as
the positive influence of being in the highest ability quintile, relative to WISC. WISC models (using quintile
measures) suggest there has been no over-time change in the influence of early-life cognitive ability while Key Stage
models suggest that the role of cognitive ability is significantly more influential for younger generations but only if
their scores are low.
Using LSYPE data, the negative influence of being of low ability is shown to be somewhat less substantial and the
positive influence is markedly more substantial than is the case for the ALSPAC sample. Further, LSYPE data suggest
that the importance of early-life cognitive ability is statistically significant across the board: it has become more
consequential not only for those who demonstrate low ability, but also – and in fact most drastically – for those in
the highest scoring quintiles.
In summary, this document has shown that, while Key Stage 2 and WISC-III scores are highly correlated, there are
notable differences, principally arising in their relation to educational attainment. The descriptive statistics presented,
along with preliminary multivariate modelling exercises, show Key Stage 2 to be more predictive of later-life
attainment. Supplementary analyses comparing ALSPAC and LSYPE data show that, for the latter (and nationally-
representative) sample, this is exacerbated. While it is not possible to directly compare Key Stage 2 and WISC scores

Social Origins, Cognitive Ability and Educational Attainment: A Birth Cohort and Life Course Perspective May 2016
29
for LSYPE respondents, the results imply that using the former as a proxy is likely to lead to an overestimation of
the influence of cognitive ability.
References
Bristol (2016) Cohort Profile [online] http://www.bristol.ac.uk/alspac/researchers/cohort-profile/ (accessed on
01.03.2016)
Bukodi, E., Erikson, R. and Goldthorpe, J. (2014) ‘The Effects of Social Origins and Cognitive Ability on
Educational Attainment: Evidence from Britain and Sweden’, Acta Sociologica 57(4) 293-310
Bukodi, E. and Goldthorpe, G. (2013) ‘Decomposing “Social Origins”: The Effects of Parents’ Class, Status and
Education on the Educational Attainment of their Children’, European Sociological Review 29(5) 1024–1039
Bynner, J. and Wadsworth, M. (2010) ‘Cognitive Capital: The Case for a Construct’, Longitudinal and Life Course
Studies 1(3) 297-304
Colom, R., Abad, F. J., Garcia, L. F. and Juan-Espinosa, M. (2002) ‘Education, Wechsler’s Full Scale and g’,
Intelligence 30, 449-462
Cox, D. and Jackson, M. (2009) ‘On Square Ordinal Contingency Tables: a Comparison of Social Class and Income
Mobility for the Same Individuals’, Journal of the Royal Statistical Society Series A 172(2) 483-493
Crawford, C., Dearden, L. and Greaves, E. (2014) ‘The Drivers of Month-of-Birth Differences in Children’s
Cognitive and Non-cognitive Skills’, Journal of the Royal Statistical Society, Series A 177(4) 829-860
Deary, I. J. (2001) Intelligence: A Very Short Introduction. Oxford: Oxford University Press
http://www.veryshortintroductions.com/view/10.1093/actrade/9780192893215.001.0001/actrade-
9780192893215-chapter-1
Duckworth, K. and Schoon, I. (2010) ‘Progress and Attainment during Primary School: The Roles of Literacy,
Numeracy and Self-Regulation’, Longitudinal and Life Course Studies 1(3) 223-240
Fraser, A., Macdonald-Wallis, C., Tilling, K., Boyd, A., Golding, J., Davey Smith, G., Henderson, J., Macleod, J.,
Molloy, L., Ness, A., Ring, S., Nelson, S. M. and Lawlor, D. A. (2012) ‘Cohort Profile: The Avon Longitudinal Study
of Parents and Children: ALSPAC Mothers Cohort’, International Journal of Epidemiology 42(1) 97-110
Galindo-Rueda, F. and Vignoles, A. (2005) ‘The Declining Relative Importance of Ability in Predicting Educational
Attainment’, The Journal of Human Resources 40(2) 335-353
Gregg, P. and Macmillan, L. (2010) ‘Family Income, Education and Cognitive Ability in the Next Generation:
Exploring Income Gradients in Education and Test Scores for Current Cohorts of Youth’, Longitudinal and Life
Course Studies 1(3) 259-280
Kamphaus, R. W. (1993) Clinical Assessment of Children’s Intelligence. Boston, MA: Allyn & Bacon
Kaufman, A. S. (1994) Intelligent Testing with the WISC-III. New York: John Wiley & Sons
National Foundation for Education Research (2006) Cognitive Ability and School Improvement [online]
https://www.nfer.ac.uk/nfer/PRE_PDF_Files/06_36_06.pdf (accessed on 12.01.2016)
National Pupil Database (NPD) (2011) Key Stage 2 User Guide [online] http://www.bristol.ac.uk/media-
library/sites/cmpo/migrated/documents/ks2userguide2011.pdf (accessed on 29.01.2016)

Social Origins, Cognitive Ability and Educational Attainment: A Birth Cohort and Life Course Perspective May 2016
30
Nunes, T., Bryant, P., Sylva, K. and Barros, R. (2009) Development of Maths Capabilities and Confidence in Primary School,
Research Report No. DCSF-RR118, Department of Education, University of Oxford
Nunes, T., Bryant, P., Barros, R. and Sylva, K. (2012) ‘The Relative Importance of Two Different Mathematical
Abilities to Mathematical Achievement’, British Journal of Educational Psychology 82(1) 136-156
Richards, M. and Deary, I. (2010) ‘Cognitive Capital in the British Birth Cohorts: An Introduction’, Longitudinal and
Life Course Studies 1(3) 197-200
Richards, M., Power, C. and Sacker, A. (2009) ‘Paths to Literacy and Numeracy Problems: Evidence from Two
British Birth Cohorts’, Journal of Epidemiology and Community Health 63(3) 239-244
Roid, G. H., Prifitera, A. and Weiss, L. G. (1993) ‘Replication of the WISC-III Factor Structure in an Independent
Sample’, in B. A. Bracken and R. S. McCallum (eds) Journal of Psychoeducational Assessment Monograph Series, Advances in
Psychoeducational Assessment: Wechsler Intelligence Scale for Children – Third Edition. Garmantown, TN: Psychoeducational
Corporation (pp 6-21).
Schoon, I. (2006) Risk and Resilience: Adaptions in Changing Times. Cambridge: Cambridge University Press
Schoon, I. (2008) ‘A Transgenerational Model of Status Attainment: The Potential Mediating Role of School
Motivation and Education’, National Institute Economic Review 205(1) 72-82
Schoon, I. (2010) ‘Childhood Cognitive Ability and Adult Academic Attainment: Evidence from Three British
Cohort Studies’, Longitudinal and Life Course Studies 1(3) 241-258
Spearman, C. (1904) ‘”General Intelligence”, Objectively Determined and Measured’, American Journal of Psychology 15,
201-293
Strand, S. (2006) ‘Comparing the Predictive Validity of Reasoning Tests and National End of Key Stage 2 Tests:
Which Tests are the Best?’, British Educational Research Journal 32(2) 209-225

Social Origins, Cognitive Ability and Educational Attainment: A Birth Cohort and Life Course Perspective May 2016
31
Appendix A: Cross-classifications
Table A1. Cross-Tabulation of KS2emX1 and WISC-2, Presented in Deciles, in ALSPAC (%)
1
2 3 4 5 6 7 8 9 10 Top
Total
1 47 34
26 16
10 6
7 4
4 2
3 2
2 2
1 1
1 1
0 0
100 6
2 29 25
23 17
17 13
12 9
7 5
5 4
2 2
3 3
1 1
0 0
100 8
3 18 16
21 16
18 14
15 11
12 10
7 6
4 3
4 3
1 1
0 0
100 8
4 10 10
18 15
19 16
16 14
13 11
7 6
7 7
7 6
2 2
1 1
100 9
5 7 7
14 14
14 14
13 13
14 14
15 14
9 8
8 8
5 5
1 2
100 10
6 3 4
8 7
14 13
15 15
14 14
15 15
13 13
7 7
7 7
2 2
100 10
7 2 2
8 8
10 11
11 11
14 14
15 16
13 14
12 13
11 12
5 6
100 11
8 1 1
3 3
8 9
9 10
12 13
14 16
17 20
16 20
12 15
9 12
100 12
9 1 1
2 2
4 4
8 9
8 10
12 14
13 16
17 21
21 26
16 22
100 12
10 Top
0 0
1 1
1 1
4 4
6 7
6 8
12 16
13 18
23 31
35 54
100 13
Total 9 100
11 100
11 100
11 100
10 100
11 100
10 100
10 100
9 100
9 100
100 100
Table A2. Cross-Tabulation of KS2emX1 and WISC-11, Presented in Deciles, in ALSPAC (%)
1 2 3 4 5 6 7 8 9 10 Top
Total
1 52 37
24 14
11 6
6 4
4 2
2 1
0 0
0 0
0 0
0 0
100 6
2 28 24
30 21
16 11
9 6
8 6
3 2
3 2
2 2
1 0
0 0
100 8
3 18 16
22 17
21 16
14 11
12 9
6 4
5 4
2 2
1 1
0 0
100 8
4 11 11
18 16
21 18
18 15
9 8
9 8
8 7
5 4
1 1
1 1
100 9
5 5 6
15 14
15 14
17 16
13 12
14 13
9 9
8 8
3 3
1 1
100 10
6 3 3
6 6
14 14
16 15
17 16
17 17
13 13
9 9
5 6
1 1
100 10
7 2 2
6 6
10 10
13 13
15 15
14 14
16 16
12 13
9 10
5 6
100 11
8 1 1
3 3
6 6
10 12
13 15
14 17
16 18
16 20
15 19
7 10
100 12
9 0 0
2 2
3 3
5 6
10 11
11 14
15 18
18 23
23 30
14 20
100 13
10 Top
0 0
0 0
1 1
2 2
5 6
7 9
11 14
15 20
21 30
39 61
100 14
Total 9 100
11 100
11 100
11 100
11 100
10 100
10 100
10 100
10 100
9 100
100 100

Social Origins, Cognitive Ability and Educational Attainment: A Birth Cohort and Life Course Perspective May 2016
32
Table A3. Cross-Tabulation of KS2emX2 and WISC-2, Presented in Deciles, in ALSPAC (%)
1 2 3 4 5 6 7 8 9 10 Top
Total
1 56 32
23 13
10 5
5 3
3 2
2 1
2 1
0 0
1 1
0 0
100 6
2 35 27
24 18
15 11
11 8
5 4
5 4
2 2
3 2
1 1
0 0
100 8
3 21 16
21 16
19 14
13 10
11 8
6 5
4 3
4 3
1 1
0 0
100 8
4 10 9
19 16
18 15
15 13
15 13
15 13
6 5
6 5
2 2
1 1
100 9
5 9 8
14 13
17 17
14 13
14 14
12 11
9 9
7 7
4 4
2 2
100 10
6 4 4
10 10
12 12
15 15
13 13
17 17
11 12
10 10
6 7
2 2
100 10
7 2 2
7 8
12 12
12 12
14 16
13 15
13 15
11 13
10 12
5 6
100 11
8 1 1
3 3
8 9
9 11
12 14
15 17
16 20
16 20
12 16
8 11
100 12
9 1 1
2 3
4 5
8 10
8 10
12 15
14 18
16 21
20 26
15 22
100 13
10 Top
0 0
1 1
1 1
4 5
6 8
7 9
12 16
13 18
23 32
35 56
100 14
Total 10 100
11 100
10 100
10 100
10 100
10 100
10 100
10 100
10 100
8 100
100 100
Table A4. Cross-Tabulation of KS2emX2 and WISC-11, Presented in Deciles, in ALSPAC (%)
1 2 3 4 5 6 7 8 9 10 Top
Total
1 61 33
24 12
8 4
4 2
2 1
2 1
0 0
0 0
0 0
0 0
100 6
2 38 28
28 19
14 10
8 6
6 5
2 1
2 2
1 1
0 0
0 0
100 8
3 21 16
24 18
20 15
14 10
11 8
5 4
4 3
2 2
0 0
0 0
100 8
4 12 10
19 16
21 18
17 14
11 10
9 8
7 6
3 3
2 2
0 0
100 9
5 8 7
16 15
16 15
17 16
12 11
13 12
9 9
6 6
2 2
1 1
100 10
6 3 3
8 7
14 14
17 17
15 15
15 15
13 13
9 10
6 6
1 1
100 10
7 2 2
6 6
11 12
13 13
16 17
15 16
15 16
12 13
8 9
4 5
100 11
8 1 1
3 4
6 7
10 12
12 15
15 18
16 19
16 20
15 19
7 9
100 12
9 0 0
2 2
3 4
6 7
10 13
11 14
15 18
18 24
23 31
13 19
100 13
10 Top
0 0
0 0
1 1
2 2
5 6
7 10
11 15
15 21
21 31
38 63
100 14
Total 10 100
11 100
10 100
11 100
10 100
10 100
10 100
10 100
9 100
8 100
100 100

Social Origins, Cognitive Ability and Educational Attainment: A Birth Cohort and Life Course Perspective May 2016
33
Table A5. Cross-Tabulation of KS2emX1 and WISC-2, Presented in Quintiles, in ALSPAC (%)
1 Bottom 2 3 4 5 Top Total
1 Bottom 61 45
23 16
10 7
4 3
1 1
100 14
2 33 29
34 27
20 16
11 10
2 2
100 17
3 16 17
28 27
29 28
19 19
8 8
100 20
4 6 8
19 20
27 30
29 33
19 23
100 23
5 Top 2 2
8 10
16 19
28 35
47 66
100 26
Total 19 100
21 100
21 100
20 100
19 100
100 100
Table A6. Cross-Tabulation of KS2emX1 and WISC-11, Presented in Quintiles, in ALSPAC (%)
1 Bottom 2 3 4 5 Top Total
1 Bottom 67 46
21 14
9 6
3 2
0 0
100 14
2 34 30
37 30
18 15
10 8
1 1
100 17
3 14 15
31 29
30 29
20 19
5 5
100 20
4 6 7
19 21
27 30
30 33
18 23
100 23
5 Top 1 1
5 6
16 20
29 37
49 70
100 26
Total 20 100
21 100
21 100
21 100
18 100
100 100
Table A7. Cross-Tabulation of KS2emX2 and WISC-2, Presented in Quintiles, in ALSPAC (%)
1 Bottom 2 3 4 5 Top Total
1 Bottom 67 44
21 14
7 5
4 3
1 1
100 10
2 36 29
33 26
20 16
9 8
2 2
100 17
3 19 18
29 28
28 27
18 19
7 8
100 20
4 7 7
20 22
28 31
29 34
18 22
100 23
5 Top 2 2
8 10
16 21
28 37
46 67
100 26
Total 21 100
21 100
21 100
20 100
18 100
100 100

Social Origins, Cognitive Ability and Educational Attainment: A Birth Cohort and Life Course Perspective May 2016
34
Table A8. Cross-Tabulation of KS2emX2 and WISC-11, Presented in Quintiles, in ALSPAC (%)
1 Bottom 2 3 4 5 Top Total
1 Bottom 74 46
18 11
6 4
2 1
0 0
100 13
2 37 30
36 29
18 15
8 7
1 1
100 17
3 17 16
32 31
27 27
19 19
5 5
100 20
4 6 7
20 22
29 33
29 34
17 22
100 23
5 Top 1 1
6 8
16 21
29 39
48 72
100 27
Total 21 100
21 100
20 100
20 100
18 100
100 100
Table A9. Cross-Tabulation of Parental Education (5-category) and KS2em Quintiles, in ALSPAC (%)
Quintiles
1 Bottom 2 3 4 5 Top Total
5. Degree 6 6
9 8
17 15
25 23
43 39
100 19
4. 8 3
16 5
17 6
27 9
32 10
100 7
3. 16 20
21 25
22 25
22 26
20 22
100 24
2. 26 67
24 60
22 53
17 42
12 29
100 49
1. No qualifications 52 5
20 2
15 1
10 1
4 0
100 2
Total 19 100
20 100
20 100
20 100
21 100
100 100
Table A10. Cross-Tabulation of Parental Education (5-category) and KS2emX2 Quintiles, in ALSPAC (%)
Quintiles
1 Bottom 2 3 4 5 Top Total
5. Degree 6 6
9 8
17 16
25 23
43 39
100 19
4. 8 3
16 5
18 6
27 9
32 10
100 7
3. 16 20
21 25
21 25
22 26
20 22
100 24
2. 26 67
24 59
21 52
17 42
12 28
100 49
1. No qualifications 48 5
23 2
16 1
10 1
4 0
100 2
Total 19 100
20 100
20 100
20 100
21 100
100 100

Social Origins, Cognitive Ability and Educational Attainment: A Birth Cohort and Life Course Perspective May 2016
35
Table A11. Cross-Tabulation of Parental Education (5-category) and WISC-2 Quintiles, in ALSPAC (%)
Quintiles
1 Bottom 2 3 4 5 Top Total
5. Degree 8 12
14 20
19 27
24 35
36 53
100 29
4. 13 6
17 7
22 9
25 11
24 10
100 9
3. 19 23
22 26
22 26
22 25
15 18
100 24
2. 30 57
24 46
20 38
16 29
10 19
100 38
1. No qualifications 56 3
28 1
7 0
6 0
3 0
100 1
Total 20 100
20 100
20 100
20 100
20 100
100 100
Table A12. Cross-Tabulation of Parental Education (5-category) and WISC-11 Quintiles, in ALSPAC (%)
Quintiles
1 Bottom 2 3 4 5 Top Total
5. Degree 7 11
13 19
19 28
23 34
38 56
100 30
4. 14 6
17 7
20 9
27 11
23 10
100 9
3. 19 23
21 24
23 26
23 27
15 17
100 23
2. 30 57
26 48
20 37
15 28
9 17
100 37
1. No qualifications 62 3
27 1
7 0
3 0
2 0
100 1
Total 20 100
20 100
20 100
20 100
20 100
100 100
Table A13. Cross-Tabulation of Parental Status Quintiles and KS2em Quintiles, in ALSPAC (%)
Quintiles
1 Bottom 2 3 4 5 Top Total
5. Top 8 7
13 10
18 14
25 19
36 26
100 15
4. 10 12
14 15
19 20
24 24
33 33
100 21
3. 15 17
22 23
22 23
23 24
19 19
100 21
2. 23 23
24 22
21 19
20 18
13 11
100 18
1. Bottom 32 42
24 30
20 25
13 16
10 11
100 24
Total 19 100
20 100
20 100
20 100
21 100
100 100
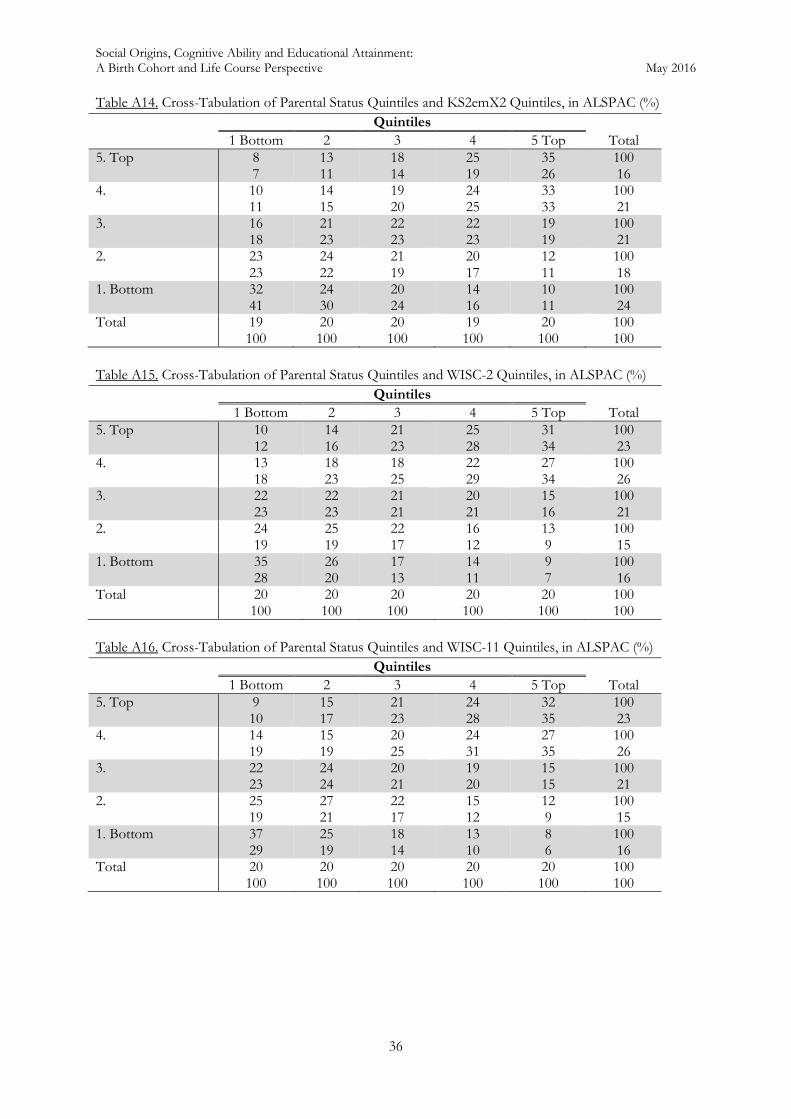
Social Origins, Cognitive Ability and Educational Attainment: A Birth Cohort and Life Course Perspective May 2016
36
Table A14. Cross-Tabulation of Parental Status Quintiles and KS2emX2 Quintiles, in ALSPAC (%)
Quintiles
1 Bottom 2 3 4 5 Top Total
5. Top 8 7
13 11
18 14
25 19
35 26
100 16
4. 10 11
14 15
19 20
24 25
33 33
100 21
3. 16 18
21 23
22 23
22 23
19 19
100 21
2. 23 23
24 22
21 19
20 17
12 11
100 18
1. Bottom 32 41
24 30
20 24
14 16
10 11
100 24
Total 19 100
20 100
20 100
19 100
20 100
100 100
Table A15. Cross-Tabulation of Parental Status Quintiles and WISC-2 Quintiles, in ALSPAC (%)
Quintiles
1 Bottom 2 3 4 5 Top Total
5. Top 10 12
14 16
21 23
25 28
31 34
100 23
4. 13 18
18 23
18 25
22 29
27 34
100 26
3. 22 23
22 23
21 21
20 21
15 16
100 21
2. 24 19
25 19
22 17
16 12
13 9
100 15
1. Bottom 35 28
26 20
17 13
14 11
9 7
100 16
Total 20 100
20 100
20 100
20 100
20 100
100 100
Table A16. Cross-Tabulation of Parental Status Quintiles and WISC-11 Quintiles, in ALSPAC (%)
Quintiles
1 Bottom 2 3 4 5 Top Total
5. Top 9 10
15 17
21 23
24 28
32 35
100 23
4. 14 19
15 19
20 25
24 31
27 35
100 26
3. 22 23
24 24
20 21
19 20
15 15
100 21
2. 25 19
27 21
22 17
15 12
12 9
100 15
1. Bottom 37 29
25 19
18 14
13 10
8 6
100 16
Total 20 100
20 100
20 100
20 100
20 100
100 100

Social Origins, Cognitive Ability and Educational Attainment: A Birth Cohort and Life Course Perspective May 2016
37
Table A17. Cross-Tabulation of Parental Income Quintiles and KS2em Quintiles, in ALSPAC (%)
Quintiles
1 Bottom 2 3 4 5 Top Total
5. Top 5 3
10 5
16 7
25 10
45 15
100 9
4. 10 18
15 23
18 25
25 31
32 37
100 28
3. 13 12
18 14
22 15
24 16
24 14
100 15
2. 17 30
21 30
23 29
22 25
18 19
100 26
1. Bottom 23 36
23 28
22 24
18 18
15 14
100 23
Total 15 100
18 100
20 100
22 100
24 100
100 100
Table A18. Cross-Tabulation of Parental Income Quintiles and KS2emX2 Quintiles, in ALSPAC (%)
Quintiles
1 Bottom 2 3 4 5 Top Total
5. Top 5 3
10 5
16 7
26 10
43 15
100 9
4. 10 19
15 23
18 25
25 32
32 37
100 28
3. 14 13
18 14
21 15
23 15
24 14
100 15
2. 17 29
21 30
23 29
22 25
18 19
100 26
1. Bottom 24 36
23 28
22 24
18 18
15 14
100 23
Total 15 100
18 100
20 100
22 100
24 100
100 100
Table A19. Cross-Tabulation of Parental Income Quintiles and WISC-2 Quintiles, in ALSPAC (%)
Quintiles
1 Bottom 2 3 4 5 Top Total
5. Top 7 5
15 10
18 12
25 16
35 23
100 13
4. 15 25
17 28
20 31
23 35
25 38
100 32
3. 17 12
20 13
25 16
20 13
19 12
100 13
2. 23 29
23 27
21 23
19 21
14 15
100 23
1. Bottom 28 29
23 23
19 18
16 15
13 12
100 19
Total 19 100
20 100
20 100
20 100
21 100
100 100

Social Origins, Cognitive Ability and Educational Attainment: A Birth Cohort and Life Course Perspective May 2016
38
Table A20. Cross-Tabulation of Parental Income Quintiles and WISC-11 Quintiles, in ALSPAC (%)
Quintiles
1 Bottom 2 3 4 5 Top Total
5. Top 7 5
14 10
18 12
25 16
37 24
100 14
4. 14 24
18 28
20 31
23 36
25 38
100 32
3. 18 13
22 15
21 14
21 13
19 12
100 13
2. 23 29
24 28
20 23
19 22
14 15
100 23
1. Bottom 29 29
22 21
21 20
15 14
13 11
100 19
Total 19 100
20 100
20 100
20 100
21 100
100 100
Table A21. Cross-Tabulation of Educational Attainment and KS2em Quintiles, in ALSPAC (%)
Quintiles
1 Bottom 2 3 4 5 Top Total
5. 2+A levels 2 4
9 16
19 35
30 56
41 77
100 38
4. 5 6
21 24
29 33
27 31
17 20
100 23
3. 30 33
36 39
22 24
9 10
3 3
100 22
2. 64 46
25 18
9 7
2 1
0 0
100 14
1. No qualifications 69 11
15 2
9 1
6 1
2 0
100 3
Total 20 100
20 100
20 100
20 100
20 100
100 100
Table A22. Cross-Tabulation of Educational Attainment and KS2emX2 Quintiles, in ALSPAC (%)
Quintiles
1 Bottom 2 3 4 5 Top Total
5. 2+A levels 3 5
9 16
19 36
30 56
41 77
100 38
4. 6 8
21 25
29 34
27 31
17 19
100 23
3. 33 36
35 38
21 23
9 10
3 3
100 22
2. 63 45
25 18
9 6
2 2
0 0
100 14
1. No qualifications 59 7
22 3
11 1
7 1
2 0
100 3
Total 20 100
20 100
20 100
20 100
20 100
100 100

Social Origins, Cognitive Ability and Educational Attainment: A Birth Cohort and Life Course Perspective May 2016
39
Table A23. Cross-Tabulation of Educational Attainment and WISC-2 Quintiles, in ALSPAC (%)
Quintiles
1 Bottom 2 3 4 5 Top Total
5. 2+A levels 7 18
15 37
20 50
26 66
31 82
100 50
4. 16 18
24 26
27 31
22 25
12 15
100 23
3. 39 32
31 26
18 15
9 8
3 3
100 17
2. 66 28
22 9
8 4
3 1
1 1
100 9
1. No qualifications 60 5
23 2
12 1
1 0
4 0
100 2
Total 21 100
20 100
20 100
20 100
19 100
100 100
Table A24. Cross-Tabulation of Educational Attainment and WISC-11 Quintiles, in ALSPAC (%)
Quintiles
1 Bottom 2 3 4 5 Top Total
5. 2+A levels 6 16
15 37
21 52
27 67
32 85
100 50
4. 16 18
23 26
27 31
23 26
11 13
100 23
3. 41 33
34 28
16 13
8 7
2 2
100 17
2. 71 28
18 8
8 3
2 1
1 0
100 8
1. No qualifications 63 5
22 2
9 1
4 0
2 0
100 2
Total 21 100
20 100
20 100
20 100
19 100
100 100
Table A25. Cross-Tabulation of GCSE Performance Quintiles and KS2em Quintiles, in ALSPAC (%)
Quintiles
1 Bottom 2 3 4 5 Top Total
5. Top 1 1
5 5
15 15
30 30
50 51
100 20
4. 1 1
10 8
21 16
33 26
36 28
100 16
3. 6 7
22 25
30 35
26 30
15 18
100 23
2. 24 19
37 30
24 19
12 9
3 3
100 16
1. Bottom 58 72
26 32
12 14
3 4
1 1
100 25
Total 20 100
20 100
20 100
20 100
20 100
100 100

Social Origins, Cognitive Ability and Educational Attainment: A Birth Cohort and Life Course Perspective May 2016
40
Table A26. Cross-Tabulation of GCSE Performance Quintiles and KS2emX2 Quintiles, in ALSPAC (%)
Quintiles
1 Bottom 2 3 4 5 Top Total
5. Top 1 1
5 5
15 16
30 31
50 51
100 21
4. 2 1
9 8
21 17
33 26
35 28
100 16
3. 7 9
22 26
30 35
26 30
15 17
100 24
2. 26 21
37 30
23 19
11 9
3 3
100 16
1. Bottom 57 68
27 32
12 14
3 4
1 1
100 24
Total 20 100
20 100
20 100
20 100
20 100
100 100
Table A27. Cross-Tabulation of GCSE Performance Quintiles and WISC-2 Quintiles, in ALSPAC (%)
Quintiles
1 Bottom 2 3 4 5 Top Total
5. Top 5 7
13 16
19 24
27 36
36 50
100 26
4. 8 8
16 17
24 25
25 27
27 30
100 21
3. 16 19
24 29
25 30
22 27
13 17
100 24
2. 36 22
31 20
19 12
11 7
3 2
100 13
1. Bottom 58 44
25 19
11 8
4 3
2 2
100 16
Total 21 100
20 100
20 100
20 100
19 100
100 100
Table A28. Cross-Tabulation of GCSE Performance Quintiles and WISC-11 Quintiles, in ALSPAC (%)
Quintiles
1 Bottom 2 3 4 5 Top Total
5. Top 5 6
12 16
19 25
28 36
37 52
100 26
4. 7 7
16 16
24 26
27 29
27 31
100 21
3. 16 19
25 29
26 31
22 26
12 15
100 24
2. 36 23
35 22
18 11
10 7
2 1
100 13
1. Bottom 63 46
23 17
9 7
4 3
2 1
100 15
Total 21 100
20 100
20 100
20 100
19 100
100 100

Social Origins, Cognitive Ability and Educational Attainment: A Birth Cohort and Life Course Perspective May 2016
41
Appendix B: Constructing Social Origin and Educational Attainment Variables in ALSPAC
The Avon Longitudinal Study of Parents and Children (ALSPAC)
The Avon Longitudinal Study of Parents and Children is an ongoing birth cohort study, which recruited more than
14,000 pregnant women from the former region of Avon (Bristol) between April 1991 and December 1992. The
study was initially designed to investigate environmental, genetic and other effects on children’s health outcomes,
though it also provides a wealth of information on other background characteristics, cognitive ability and, via
linkage with the National Pupil Database (NPD), details on formal educational achievements.
The ALSPAC sample was not randomly selected and thus is not representative of the national population, but
analyses of respondents’ demographic characteristics have shown that it is largely similar to that of the UK as a
whole (Bristol 2016). The whole cohort, plus new cases (children invited to join from the age of seven onwards), is
comprised of 15,445 children. 13,761 mothers completed at least one questionnaire (Fraser et al 2012).
Constructing Parental Class
The reduced approach was used to derive an NS-SeC category for each respondent, which required information on
parents’ SOC2000 codes and employment status. For mothers, the latest child age at which this information is
available is three and for partners it is eight. In attempts to create a social-class variable which is as similar as
possible to that created using LSYPE data (taken at age 14), partners’ information at age eight was prioritised (i.e.
this value was taken first, and was not subject to the dominance method).
All other information for partners at earlier waves was then used (ages 3, 2, 1, 8 months, and 32, 18 and 12 weeks
gestation) to create a separate measure. Information at age three was replaced with information at age two if
missing, and so on. An NS-SeC value was then derived. The same process was used to derive a value for mothers.
The dominance approach was then used to determine the highest NS-SeC value between mothers and partners at
age three or below. No information was available on full-time or part-time work status, so the dominance approach
did not include this but did consider partners’ class to dominate mothers’ class unless the latter was higher in the
ordering of the classes as 1, 2, 3–5, 6, 7 (Bukodi and Goldthorpe 2013). Finally, partners’ NS-SeC at age eight was
taken as the base variable, and then replaced with values from the measure using the dominance approach where
values were missing. The distribution of the parental social-class variable is given in Figure B1 below; the
proportions in each category found using LSYPE data are given in the notes, for comparative purposes.
Figure B1. Distribution of Parental Social Class (Reduced Method)
21
26
13
5
1214
9
0
5
10
15
20
25
30
Higher managerial(N=2838)
Lower managerial(N=3600)
Intermediate(N=1785)
Small employers(N=674)
Lower supervisory(N=1595)
Semi routine(N=1883)
Routine(N=1208)
%
Notes: Missing values: 1862Proportions found in LSYPE: Higher managerial (16%; N=1267); Lower managerial (29%; N=2364); Intermediate (7%; N=572); Small employers (9%; N=746); Lower supervisory (14%; N=966); Semi routine (13%; N=980); Routine (12%; 773)

Social Origins, Cognitive Ability and Educational Attainment: A Birth Cohort and Life Course Perspective May 2016
42
Constructing Parental Education
Mothers and their partners were asked for information on their highest level of education at child ages 13, 8, 5, and
32 and 18 weeks gestation. Each variable was recoded according to the seven ordered categories of parental
education given in Bukodi and Goldthorpe (2013). Following the approach taken to measuring class, information
was taken from as close to children’s age 10 as possible. Age eight information was therefore used as the base
variable, replaced with information at age 13 where this was missing, and then at age five and so on (for each
parent). Following this, a combined measure of parental education was created, which involved allocating cases to
each of the categories listed in Table B1 below (Bukodi and Goldthorpe 2013). This approach required an
assumption to be made regarding missing values where educational information was only available for one parent;
the assumption applied was that the value of the missing parent is equal to the modal value for partners
corresponding to the valid category. See Table B1 notes for the proportions found for the same variable in LSYPE.
Table B1. Distribution of Parental Education
% N
1. Neither parent has any qualification 2 268 2. One parent has secondary or lower qualification; other parent has no qualification 7 976 3. Both parents have secondary or lower qualification 39 5302 4. One parent has higher secondary or lower tertiary qualification; other parent has lower qualification 22 3027 5. Both parents have higher secondary or lower tertiary qualification 7 955 6. One parent has degree-level qualification; other parent has lower qualification 14 1884 7. Both parents have degree-level qualifications 10 1316 Missing -- 1717 Total
Notes:
Proportions found in LSYPE: 1. (10%; N=973); 2. (11%; N=868); 3. (38%; N=2534); 4. (19%; N=1428); 5. (4%; N=345); 6. (11%; N=915); 7. (7%;
N=605).
Constructing Parental Status
For the construction of the parental status variable, a similar approach was taken to that of social class described
above; that is, prioritising information taken from surveys when the child was aged eight for partners, and replacing
missing values with those from previous waves (the same was done for mothers, starting with information on SOC
codes available at age three). SOC90 codes were used in place of SOC2000 codes.17 These SOC codes were then
used to determine the social status of each parent using the Chan–Goldthorpe (CG) scale and the CAMSIS scale.18
The dominance approach was then used, taking the highest value between mothers and partners to determine the
parental status score. Table B2 below gives the means and standard deviations of normalised versions of each
measure, and also presents those found in LSYPE for comparison, which are very similar.
Table B2. Means and Standard Deviations of Mothers’, Fathers’ and Parental CG Status Scores (Variables
Normalised with range 0–1)
CG Status Scores CAMSIS Status Scores
Mothers Fathers Parental Mothers Fathers Parental
ALSPAC 0.56 (0.26) 0.44 (0.35) 0.62 (0.28) 0.45 (0.18) 0.46 (0.19) 0.52 (0.18) LSYPE 0.54 (0.25) 0.42 (0.34) 0.58 (0.28) 0.41 (0.19) 0.46 (0.18) 0.51 (0.17) Notes:
Sample sizes for each measure (CG and CAMSIS N are identical):
ALSPAC: Mothers N=12632; Fathers N=13014; Parental N=13583; Total parental CG status missing values: 1862
LSYPE: Mothers N=6944; Fathers N=6055; Parental N=7668
17 This is because SOC90 codes are required for conversion to social status scores using the Chan–Goldthorpe approach, and are also most reliable when using the CAMSIS approach. 18 CAMSIS variables were constructed primarily to determine how comparable they are with those in LSYPE, but were not used to examine relationships with cognitive ability measures in the main document (we expect to use CG status scores in analyses).

Social Origins, Cognitive Ability and Educational Attainment: A Birth Cohort and Life Course Perspective May 2016
43
The CG status score, derived using the dominance approach, is the measure which was used to derive the parental
status quintiles presented above. The distribution of this measure, given in quintiles, is presented in Table B3.
Table B3. Distribution of Parental CG Status Scores (Quintiles)
Parental CG Status
% N
1st Quintile 23 3099 2nd Quintile 17 2336 3rd Quintile 20 2722 4th Quintile 21 2905 5th Quintile 19 2521 Missing -- 1862 Total 100 15445
Constructing Parental Income
ALSPAC provides information on family ‘take-home’ income at various child ages. This is given in either weekly or
monthly amounts, in various different bands, and is asked of either the mother or the partner or both, depending on
the wave. Table B4 summarises the availability of information on income across all waves of ALSPAC.
Table B4. Availability of Information on Family Income in ALSPAC
Question wording Categories Asked at child ages
2y 9m 3y 11m 7y 1m 8y 1m 11y 2m ~19y
Average ‘take-home’ family income each week (including social benefits, etc.)
<100 100-199 200-299 300-399
400+ DK
Mother Mother Mother & Father
Mother & Father
Average ‘take-home’ family income each week (including social benefits, etc.)
<120 120-189 190-239 240-289 290-359 360-429
430-479 480-559 560-799
800+ DK
Mother & Father
Average ‘take-home’ family income each month (including all earnings, social benefits, tax credits, etc.)
<899 900-1149 1150-1549 1550-1849 1850-2099 2100-2399
2400-2799 2800-3399 3400-4000
4001+ DK
Mother
Since variables were not coded in the same way across waves it is not possible to simply replace missing values with
information from earlier (or later) time points (e.g. the top income category at age 11 is 800+, whereas the top
category at ages 2–8 is 400+). Information from the variable asked at children’s age 11 is used as the base variable,
as this is closest to the age used to derive information in the other datasets we consider in this study and it also
provides more fine-grained categories (10 as opposed to five in the age eight and earlier measures). Information on
income is asked of both parents at this age, so the two measures are combined, prioritising answers given by
partners as males are more likely to be in work and the assumption is that they are therefore more likely to provide
reliable estimates. For each case, banded values were then replaced with mid-point values.

Social Origins, Cognitive Ability and Educational Attainment: A Birth Cohort and Life Course Perspective May 2016
44
Separately, the same approach was used to create measures combining information from both parent questionnaires
at ages eight and seven. The mid-point values given at age eight (questionnaires administered in 2001) and age seven
(questionnaires administered in 2000) were replaced with these values adjusted to 2004 prices (age 11 questionnaires
were administered in 2004).19 Finally, information from questionnaires administered at children’s age 19 were used;
first, mid-points were taken from each band, then these were adjusted from monthly to weekly amounts (/4), and
finally these values were deflated from 2012 prices to 2004 prices. Measures from questionnaires administered at
children’s ages two and three were not used because parents with young children not yet of school age are likely to
be in a considerably different financial situation; these measures were therefore considered to provide unreliable
proxy information.
The base variable (age 11) was replaced with values from other waves where cases had missing information to derive
the final weekly take-home family income measure. This final variable is made up of 29 unique income values. 5847
cases have missing information. Figure B2 presents the percentile distribution of this variable, before and after log
transformation. The logged variable is negatively skewed due to the large number of cases in the highest income
categories; unlike LSYPE, ALSPAC does not provide a finer-grained breakdown of incomes in the highest band.
Figure B2. Histogram of Weekly Take-Home Family Income
Notes:
Missing values: 5847
The income variable from LSYPE is comprised of 91 categories and displays a very different distribution.20 The
ALSPAC variable has a range of 54–800, whereas the LSYPE has a range of 4.5–7693. Despite differences in the
overall distribution, however, the mean income values are broadly comparable: mean gross weekly income in
LSYPE is £567.59, compared with mean take-home weekly income in ALSPAC which is £455.85 (both amounts in
2004 prices); assuming a 20% rate of tax, 21 mean net weekly income in LSYPE would therefore be equal to £454.07.
19 Inflation calculator found at: http://www.bankofengland.co.uk/education/Pages/resources/inflationtools/calculator/flash/default.aspx 20 The variable in LSYPE also asks for combined information on both parents’ incomes, as opposed to family income. 21 Tax rates for incomes up to 31,400 in the year 2004/05 were 22% (incomes between £1–2,020 were taxed at 10%). The mean weekly income in LSYPE (£567.59) amounts to an annual income below the highest threshold (~£29,500), so an approximate 20% rate was assumed for this calculation. Source: https://www.gov.uk/government/uploads/system/uploads/attachment_data/file/418669/Table-a2.pdf
05
1015
Perc
ent
0 200 400 600 800Family weekly take-home income
05
1015
Perc
ent
4 5 6 7Log family weekly take-home income

Social Origins, Cognitive Ability and Educational Attainment: A Birth Cohort and Life Course Perspective May 2016
45
Constructing Educational Attainment
The ALSPAC data has been linked to the NPD in order to gain information about individuals’ educational
attainment. Data from the NPD, which provides details of all examinations taken and grades achieved up to and
including Key Stage 5, was used to determine individuals’ highest qualification attained. The distribution of this
variable is given in Table B5 below, with the proportions found using LSYPE also presented for comparison.
Table B5. Distribution of Respondents’ Educational Attainment Up To and Including Key Stage 5
ALSPAC LSYPE
% N % N
1. No qualifications 4 510 2 91 2. Below O-level, NVQ1 15 1735 15 775 3. 1–4 O-level passes, NVQ2 21 2523 16 943 4. 5+ O-level passes or 1 A-level pass, NVQ3 22 2684 28 2187 5. 2+ A-level passes 38 4623 39 3672 Missing 3361 Total 100 15445 100 7668
A number of other attainment variables were also created. The first determines simply whether the respondent
passed the 2+ A-level achievement threshold; the percentage passing this threshold is the same as given in Table B5
above: 38%. The second determines whether the respondent made the transition to further academic education; i.e.
the A-level transition. This measure uses a combination of information from the NPD files as well as from the
child-completed questionnaires at ages 17.5 and 18. To construct this measure, those who had achieved 2+ A-levels
(according to the NPD data) were coded as having made the transition (1), with others coded as not (0). Then, cases
with a value of 0 were recoded to having made the A-level transition if they were studying for AS or A-levels or had
achieved either of these qualifications at ages 17.5 or 18, according to the information given in their questionnaires.
Finally, further information from the NPD on respondents’ number of AS/A-level entries was used to recode cases
still taking a value of 0 to having made the A-level transition if they had 1 or more entries at this level. This resulted
in a change for 831 cases.
The third variable constructed determined whether cases had made the transition to Key Stage 5 at all, having opted
for either the academic or vocational route. This involved starting with the A-level transition variable, and then
recoding cases taking a value of 0 to having made the FE transition if there was any information available on these
respondents in the Key Stage 5 file (respondents who did not transition to Key Stage 5 at all would not be included).
This resulted in a change for a further 1883 cases. Table B6 presents the distribution of each of these measures, with
the proportions found using LSYPE data also given for comparison.
Table B6. Distribution of Respondents’ Transitions
ALSPAC LSYPE
% N % N
Passed 2+ A-level threshold No Yes
62 38
7443 4623
61 39
3996 3672
Transition to A-level No Yes
55 45
6612 5454
46 54
2749 4919
Transition to Key Stage 5 No Yes
39 61
4729 7337
36 64
1976 5692

Social Origins, Cognitive Ability and Educational Attainment: A Birth Cohort and Life Course Perspective May 2016
46
There are some notable differences using ALSPAC and LSYPE data; the LSYPE sample has a higher failure rate.
For ALSPAC respondents, 84% of those who made the transition to academic FE successfully completed their
study (attaining 2 or more A-levels), compared with 75% of LSYPE respondents.
Finally, a variable was created to assess performance at the lower secondary level (i.e. how many A*–C GCSEs were
attained). Table B7 summarises this measure, alongside the distribution from the same measure in LSYPE, which is
broadly similar.
Table B7. Performance at Lower Secondary Level (Number of A*–C GCSEs Attained)
ALSPAC LSYPE
% N % N
0 19 2241 18 918 0.5 1 76 1 31 1 7 783 6 366 1.5 1 80 1 39 2 4 529 4 260 2.5 1 85 1 59 3 4 443 3 223 3.5 1 118 1 56 4 4 444 5 311 4.5 1 139 1 91 5 4 425 4 274 5.5 1 157 1 80 6 4 489 3 304 6.5 2 203 1 110 7 5 538 4 333 7.5 3 299 2 141 8 5 636 5 414 8.5 4 453 2 207 9 7 885 6 538 9.5 5 642 5 412 10 8 969 9 809 10.5 4 430 5 418 11 3 402 6 515 11.5 2 192 2 207 12 1 149 2 196 12.5 1 83 1 86 13 1 99 1 99 13.5 0 24 1 55 14 0 42 1 49 14.5 0 7 OM OM 15 0 7 OM OM 15.5 0 2 OM OM 16 0 4 OM OM 16.5 0 0 OM OM 17 0 1 OM OM 19 0 0 OM OM Missing -- 3361 -- 3 Total 100 15445 100 7668 Notes: Values omitted to preserve anonymity.
Note that it is not possible to assess the transition to HE using ALSPAC data. There is information on
qualifications attained at age 20 (which is the latest possible age for which attainment information is available) but
most individuals do not start tertiary-level education until age 18–19, so are very unlikely to have completed a degree
by the age of 20. Further, only ~20% of the initial ALSPAC sample have valid information at this wave.

Social Origins, Cognitive Ability and Educational Attainment: A Birth Cohort and Life Course Perspective May 2016
47
Appendix C: Multivariate Analyses: Supplementary Material
Table C1. Sensitivity Analysis: Adjustments to Cognitive Ability Reference Group (Average Marginal Effects)
KS2emX2 WISC-2 WISC-11
Reference group Reference group Reference group
Bottom Top Bottom Top Bottom Top
ˇCI Est ˆCI ˇCI Est ˆCI ˇCI Est ˆCI ˇCI Est ˆCI ˇCI Est ˆCI ˇCI Est ˆCI
1st [-.68] -.64* [-.59] [-.54] -.50* [-.45] [-.58] -.54* [-.49] 2nd [.08] .12* [.17] [-.55] -.51* [-.47] [.13] .17* [.21] [-.37] -.33* [-.29] [.13] .17* [.22] [-.41] -.37* [-.32] 3rd [.30] .34* [.39] [-.33] -.29* [-.25] [.19] .23* [.28] [-.31] -.27* [-.22] [.25] .29* [.33] [-.29] -.25* [-.21] 4th [.45] .49* [.54] [-.18] -.14* [-.11] [.31] .35* [.39] [-.19] -.15* [-.11] [.34] .39* [.43] [-.19] -.15* [-.11] 5th [.59] .64* [.68] [.45] .50* [.54] [.49] .54* [.58]
N 4,644 4,644 4,644 Notes:
* p<0.05
Table C2. Sensitivity Analysis: Coding Variations I (Average Marginal Effects)
KS2emX2 WISC-2 WISC-11
Parental class (5 as ref) 4. Semi-routine 3. 3+4+5 2. Lower managerial 1. Higher managerial
0.01 0.03 0.05 0.06
0.01 0.04 0.06* 0.07*
0.01 0.04 0.06* 0.07*
Parental status Interval scale
0.12*
0.14*
0.13*
Parental education (1. No quals as ref) 2. 3. 4. 5. 6. 7. Both parents have degrees
-0.01 0.12 0.18 0.27* 0.31* 0.36*
0.01 0.13 0.21* 0.32* 0.36* 0.43*
-0.00 0.12 0.18 0.29* 0.33* 0.39*
Self-employed 0–1
-0.02
-0.04
-0.05
Gender (male) Female
0.06*
0.09*
0.09*
Cognitive ability (3rd as ref) Bottom 2nd 4th Top
-0.34* -0.22* 0.15* 0.29*
-0.23* -0.06* 0.12* 0.26*
-0.29* -0.11* 0.10* 0.24*
N 4,644 4,644 4,644 Notes:
* p<0.05

Social Origins, Cognitive Ability and Educational Attainment: A Birth Cohort and Life Course Perspective May 2016
48
Table C3. Sensitivity Analysis: Coding Variations II (Average Marginal Effects)
KS2emX2 WISC-2 WISC-11
Parental class (5 as ref) 4. Semi-routine 3. 3+4+5 2. Lower managerial 1. Higher managerial
0.01 0.03 0.06* 0.06*
0.01 0.04 0.06* 0.07*
0.01 0.04 0.06* 0.08*
Parental status (3rd as ref) Bottom 2nd 4th Top
-0.08* -0.05* -0.01 0.03
-0.09* -0.05* 0.00 0.04
-0.08* -0.05* 0.00 0.03
Parental education (1. No quals as ref) 2. 3. 4. 5. 6. 7. Both parents have degrees
-0.00 0.12 0.19 0.27* 0.32* 0.37*
0.01 0.14 0.21* 0.32* 0.37* 0.44*
0.00 0.12 0.19 0.30* 0.34* 0.40*
Self-employed 0–1
-0.02
-0.04
-0.05
Gender (male) Female
0.06*
0.09*
0.09*
Cognitive ability (3rd as ref) Bottom 2nd 4th Top
-0.34* -0.22* 0.15* 0.29*
-0.23* -0.06* 0.11* 0.26*
-0.29* -0.12* 0.10* 0.24*
N 4,644 4,644 4,644 Notes:
* p<0.05
Table C4. Sensitivity Analysis: Coding Variations III (Average Marginal Effects)
KS2emX2 WISC-2 WISC-11
Parental class (5 as ref) 4. Semi-routine 3. 3+4+5 2. Lower managerial 1. Higher managerial
0.01 0.03 0.04 0.05
0.01 0.03 0.05 0.06
0.01 0.04 0.05 0.06*
Parental status 0–1
0.13*
0.15*
0.13*
Parental education 0–1
0.22*
0.25*
0.24*
Parental income Linear (min=54; max=800)
0.0002*
0.0002*
0.0002*
Self-employed 0–1
-0.01
-0.03
-0.04
Gender (male) Female
0.06*
0.09*
0.08*
Cognitive ability (3rd as ref) Bottom 2nd 4th Top
-0.34* -0.22* 0.15* 0.29*
-0.23* -0.07* 0.11* 0.26*
-0.29* -0.12* 0.09* 0.24*
N 4,644 4,644 4,644

Social Origins, Cognitive Ability and Educational Attainment: A Birth Cohort and Life Course Perspective May 2016
49
Table C5. Sensitivity Analysis: Coding Variations IV (Average Marginal Effects)
KS2emX2 WISC-2 WISC-11
Parental class (5 as ref) 4. Semi-routine 3. 3+4+5 2. Lower managerial 1. Higher managerial
0.01 0.03 0.04 0.05
0.01 0.03 0.05 0.06*
0.01 0.03 0.05 0.06*
Parental status 0–1
0.13*
0.15*
0.13*
Parental education 0–1
0.22*
0.26*
0.24*
Parental income Bottom 2nd 4th Top
-0.06* -0.02 0.03 0.03
-0.08* -0.03 0.04 0.04
-0.08* -0.03 0.03 0.04
Self-employed 0–1
-0.01
-0.03
-0.04
Gender (male) Female
0.06*
0.09*
0.08*
Cognitive ability (3rd as ref) Bottom 2nd 4th Top
-0.34* -0.22* 0.15* 0.29*
-0.23* -0.06* 0.11* 0.26*
-0.29* -0.12* 0.09* 0.24*
N 4,644 4,644 4,644
Table C6. Table 27 LSYPE Estimates with Confidence Intervals
M0 M1 M2 M3 M4 M5
CI Est CI CI Est CI CI Est CI CI Est CI CI Est CI CI Est CI
Parental class (5) 4. Semi-routine 3. 3+4+5 2. Lower managerial 1. Higher managerial
[-.04] [-.01] [.01] [.05]
.02 .04 .06* .12*
[.07] [.08] [.12] [.18]
[-.03] [-.04] [-.02] [.00]
.02 .00 .03 .06*
[.07] [.05] [.07] [.11]
[-.03] [-.04] [-.01] [.01]
.01 .01 .03 .06*
[.06] [.05] [.08] [.12]
[-.04] [-.02] [-.01] [.03]
.02 .03 .05 .09*
[.07] [.08] [.10] [.16]
[-.03] [-.04] [-.02] [-.01]
.02 .00 .02 .05
[.07] [.05] [.07] [.10]
[-.03] [-.04] [-.02] [-.00]
.01 .00 .03 .05
[.06] [.05] [.07] [.11]
Parental status 0–1
[.20]
.27*
[.33]
[.08]
.13*
[.18]
[.08]
.14*
[.19]
[.19]
.25*
[.32]
[.07]
.13*
[.18]
[.08]
.13*
[.19]
Parental education 0–1
[.29]
.33*
[.37]
[.12]
.16*
[.20]
[.12]
.16*
[.20]
[.28]
.32*
[.36]
[.11]
.15*
[.19]
[.12]
.16*
[.20]
Parental income 0–1
[.21]
.45*
[.68]
[.01]
.19*
[.38]
[.02]
.20*
[.38]
Self employed (no) Yes
[.02]
.06*
[.11]
[.02]
.06*
[.09]
[.01]
.05*
[.09]
[.01]
.06*
[.10]
[.02]
.05*
[.09]
[.01]
.05*
[.09]
Gender (male) Female
[.06]
.08*
[.11]
[.05]
.07*
[.09]
[.05]
.07*
[.09]
[.06]
.09*
[.11]
[.05]
.07*
[.09]
[.05]
.07*
[.09]
Cognitive ability z-scores
[.22]
.23*
[.24]
[.22]
.23*
[.24]
Cognitive ability (3rd) Bottom 2nd 4th Top
[-.30] [-.17] [.15] [.39]
-.27* -.13* .20* .44*
[-.23] [-.09] [.24] [.48]
[-.30] [-.17] [.15] [.39]
-.27* -.13* .19* .43*
[-.23] [-.09] [.24] [.48]
N 5,868 5,868 5,868 5,868 5,868 5,868

Social Origins, Cognitive Ability and Educational Attainment: A Birth Cohort and Life Course Perspective May 2016
50
Table C8. Table 30 LSYPE Estimates with Confidence Intervals
M1 M2 M3 M4
CI Est CI CI Est CI CI Est CI CI Est CI
Cohort (BCS70) LSYPE
[0.87]
0.99
[1.12]
[0.77]
1.00*
[1.24]
[1.04]
1.22*
[1.40]
[0.96]
1.23*
[1.50]
Parental class (5) 4. Semi-routine 3. 3+4+5 2. Lower managerial 1. Higher managerial
[-0.26] [-0.15] [-0.04] [0.13]
-0.00 0.08 0.21 0.41*
[0.26] [0.30] [0.45] [0.68]
[-0.26] [-0.13] [-0.01] [0.17]
-0.01 0.09 0.23 0.44*
[0.25] [0.32] [0.47] [0.71]
[-0.26] [-0.16] [-0.08] [0.07]
-0.00 0.07 0.17 0.35*
[0.26] [0.29] [0.42] [0.63]
[-0.27] [-0.14] [-0.05] [0.10]
-0.01 0.08 0.20 0.38*
[0.25] [0.31] [0.44] [0.65]
Parental status 0–1
[0.36]
0.64*
[0.92]
[0.39]
0.67*
[0.95]
[0.31]
0.59*
[0.87]
[0.33]
0.62*
[0.90]
Parental education 0–1
[0.84]
1.05*
[1.26]
[0.89]
1.10*
[1.31]
[0.78]
1.00*
[1.21]
[0.83]
1.04*
[1.25]
Parental income 0–1
[0.28]
0.66*
[1.03]
[0.31]
0.68*
[1.05]
Self employed (no) Yes
[0.03]
0.21*
[0.39]
[0.00]
0.18*
[0.37]
[0.02]
0.20*
[0.38]
[-0.01]
0.17
[0.36]
Gender (male) Female
[0.21]
0.32*
[0.43]
[0.21]
0.32*
[0.43]
[0.21]
0.32*
[0.43]
[0.21]
0.32*
[0.43]
Cognitive ability z-scores
[0.74]
0.84*
[0.94]
[0.71]
0.82*
[0.92]
Cognitive ability*Cohort z-score*LSYPE
[0.55]
0.69*
[0.83]
[0.57]
0.71*
[0.85]
Cognitive ability (3rd) Bottom 2nd 4th Top
[-1.61] [-0.66] [0.22] [0.94]
-1.17* -0.35* 0.47* 1.18*
[-0.73] [-0.03] [0.72] [1.42]
[-1.59] [-0.65] [0.19] [0.91]
-1.14* -0.33* 0.45* 1.15*
[-0.70] [-0.02] [0.70] [1.39]
Cognitive ability*Cohort Bottom*LSYPE 2nd*LSYPE 4th*LSYPE Top*LSYPE
[-1.15] [-0.71] [0.10 [0.60]
-0.65* -0.34 0.41* 0.92*
[-0.14] [0.03] [0.73] [1.25]
[-1.19] [-0.73] [0.12] [0.63]
-0.68* -0.36 0.44* 0.95*
[-0.17] [0.02] [0.75] [1.28]
Combined sample N 9,832 9,832 9,832 9,832

Social Origins, Cognitive Ability and Educational Attainment: A Birth Cohort and Life Course Perspective May 2016
51
Appendix D: Constructing Alternative Cognitive Ability Measures in LSYPE
Table D1 presents the results of the PCAs run in constructing the measures KS2emX1 and KS2emX2
using LSYPE data. The steps followed before running the PCAs are identical to those used to construct
the corresponding measures using the ALSPAC data (see Section 3.1). (KS2emX1 N=7,278; KS2emX2
N=7,513.)
Table D1. PCA to Derive Alternative Cognitive Ability Measures in LSYPE
PCA New variable
Eigenvalue Loading % of variance Min Max Mean (sd)
English Maths Science
KS2emX1 1.69 0.71 0.71 -- 0.85 <-3.56 >2.60 0.00 (1.30) KS2emX2 1.72 0.71 0.71 -- 0.86 <-3.55 >2.60 0.00 (1.31) Notes:
Precise minimum and maximum values have been omitted to preserve anonymity.
Figure D1 displays the percentile distributions of the KS2emX1 and KS2emX2 measures.
Figure D1. Percentile Distributions of KS2emX1 and KS2emX2 in LSYPE
Appendix E
ALSPAC Study description
ALSPAC recruited 14,541 pregnant women resident in Avon, UK with expected dates of delivery 1st
April 1991 to 31st December 1992. 14,541 is the initial number of pregnancies for which the mother
enrolled in the ALSPAC study and had either returned at least one questionnaire or attended a “Children
in Focus” clinic by 19/07/99. Of these initial pregnancies, there was a total of 14,676 fetuses, resulting in
14,062 live births and 13,988 children who were alive at 1 year of age.
When the oldest children were approximately 7 years of age, an attempt was made to bolster the initial
sample with eligible cases who had failed to join the study originally. As a result, when considering
variables collected from the age of seven onwards (and potentially abstracted from obstetric notes) there
are data available for more than the 14,541 pregnancies mentioned above.
02
46
Per
cen
t
-4 -2 0 2 4LSYPE KS2emX1
02
46
Per
cen
t
-4 -2 0 2 4LSYPE KS2emX2

Social Origins, Cognitive Ability and Educational Attainment: A Birth Cohort and Life Course Perspective May 2016
52
The number of new pregnancies not in the initial sample (known as Phase I enrolment) that are currently
represented on the built files and reflecting enrolment status at the age of 18 is 706 (452 and 254 recruited
during Phases II and III respectively), resulting in an additional 713 children being enrolled. The phases
of enrolment are described in more detail in the ALSPAC cohort profile paper which should be used for
referencing purposes.
The total sample size for analyses using any data collected after the age of seven is therefore 15,247
pregnancies, resulting in 15,458 fetuses. Of this total sample of 15,458 fetuses, 14,775 were live births and
14,701 were alive at 1 year of age.
A 10% sample of the ALSPAC cohort, known as the Children in Focus (CiF) group, attended clinics at
the University of Bristol at various time intervals between 4 to 61 months of age. The CiF group were
chosen at random from the last 6 months of ALSPAC births (1432 families attended at least one clinic).
Excluded were those mothers who had moved out of the area or were lost to follow-up, and those
partaking in another study of infant development in Avon.
ALSPAC data dictionary
The ALSPAC website contains details of all the data that is available through a fully searchable data
dictionary: http://www.bris.ac.uk/alspac/researchers/data-access/data-dictionary.
Ethical approval
Ethical approval for the study was obtained from the ALSPAC Ethics and Law Committee and the Local
Research Ethics Committees.
Acknowledgements
This specific research for this paper was funded by the Nuffield Foundation. We are extremely grateful to
all the families who took part in the NCDS, BCS70, LSYPE and ALSPAC studies and all teams and
individuals involved in the development of these datasets, which include interviewers, computer and
laboratory technicians, clerical workers, research scientists, volunteers, managers, receptionists, nurses and
midwives. The UK Medical Research Council and Wellcome (Grant ref: 102215/2/13/2) and the
University of Bristol provide core support for ALSPAC. This publication is the work of the authors, who
take responsibility for the contents of this paper.
References
Betthaeuser, B. and M. Bourne (2016a) "Harmonizing the measurement of social origin, cognitive ability
and educational attainment in four British population surveys: NCDS, BCS70, LSYPE and
ALSPAC.", SOCED Project Data Note 2016-10-11
Betthaeuser, B. and M. Bourne (2016b) "Measuring social origin, cognitive ability and educational
attainment in the British Birth Cohort Study (BCS70).", SOCED Project Data Note 2016-10-04.
Betthaeuser, B. and M. Bourne (2016c) "Measuring social origin, cognitive ability and educational
attainment in the National Child Development Study (NCDS).", SOCED Project Data Note 2016-
08-09
Bourne, M. and Betthaeuser, B. (2016) "Measuring social origin, cognitive ability and educational
attainment in the Longitudinal Study of Young People in England (LSYPE).", SOCED Project
Data Note 2016-06-03
Social Origins, Cognitive Ability and Educational Attainment: A Birth Cohort and Life Course Perspective May 2016
53
Bourne, M. (2016) "Measuring cognitive ability in the National Child Development Study (NCDS), the
British Cohort Study (BCS70), the Longitudinal Study of Young People in England (LSYPE),
and the Avon Study of Parents and Children (ALSPAC)" SOCED Project Data Note 2016-07-24
Fraser, A., Macdonald-Wallis, C., Tilling, K., Boyd, A., Golding, J., Davey Smith, G., Henderson, J.,
Macleod, J., Molloy, L., Ness, A., Ring, S., Nelson, S. M. and Lawlor, D. A. (2012) ‘Cohort
Profile: The Avon Longitudinal Study of Parents and Children: ALSPAC Mothers Cohort’,
International Journal of Epidemiology 42(1) 97-110