measuring community-level point itn distribution dynamics...
TRANSCRIPT

1
Measuring community-level point ITN distribution dynamics
and the impact of CHW hang-up in rural Rufunsa District
Final End-of-Project Technical Report
15 July 2014
Prepared by:
Zambia Ministry of Health Zambia Ministry of Community Development
Zambia National Malaria Control Centre IDinsight
Clinton Health Access Initiative

2
Table of Contents
List of Acronyms ...................................................................................................................................... 3
Executive Summary ................................................................................................................................. 4
Background ............................................................................................................................................. 6
Methods .................................................................................................................................................. 7
Data Collection and Quality Checks ........................................................................................................ 9
Analytical Methods ............................................................................................................................... 11
Results ................................................................................................................................................... 12
Discussion.............................................................................................................................................. 22
Policy Recommendations ...................................................................................................................... 24
Sources .................................................................................................................................................. 26
Appendix A: Map of Study Area ............................................................................................................ 27
Appendix B: Study Timeline .................................................................................................................. 28
Appendix C: Analysis Equations ............................................................................................................ 29
Appendix D: Cost and Time Model Inputs ............................................................................................ 30
Appendix E: Household Participation Flowchart .................................................................................. 33
Appendix F: Regression Tables ............................................................................................................. 34
Appendix G: Sensitivity Analysis ........................................................................................................... 37
Appendix H: Study Limitations .............................................................................................................. 39
Appendix I: Model Sensitivities ............................................................................................................. 40

3
List of Acronyms 3DE Demand Driven Evaluations for Decisions
ACT Artemisinin-based combination therapy
ANC Antenatal care
BCC Behavioral change communication
CHW Community health worker
CHAI Clinton Health Access Initiative
DHO District Health Office
DMO District Medical Officer
EHT Environmental health technician
HR Human resources
IRS Indoor residual spraying
ITN Insecticide-treated net
LLIN Long-lasting insecticidal net
MoH Ministry of Health
MoCDMCH Ministry of Community Development, Mother and Child Health
NHC Neighbourhood Health Committee
NMCC National Malaria Control Centre
ODK Open Data Kit
RHC Rural Health Centre
UNDP United Nations Development Programme
4
Executive Summary Background Given the effectiveness of long-lasting insecticide treated bed nets (ITNs) to prevent malaria transmission, Zambia’s Ministry of Health (MoH), National Malaria Control Centre (NMCC), and partners will distribute approximately six million ITNs nationwide in 2014 with the goal of covering every sleeping space in Zambia.1,2 Zambia has never before distributed such a large volume of ITNs in one year, and limited information is available on the most efficient distribution approach that optimizes ITN ownership and use at minimal time and cost. Zambia’s current ITN distribution procedures prescribe the use of community health workers (CHWs) to distribute ITNs door-to-door and to hang each ITN over a sleeping space upon delivery (“door-to-door distribution”). However, this approach has been highly challenging in terms of time, cost, and CHW work burden in certain contexts. An alternative approach has been proposed that distributes ITNs from pre-defined fixed points in a community such as a clinic, school or church (“community point distribution”) and sends CHWs to households afterward to hang any un-hung ITNs. However, in the past, community point distributions were not actively promoted by Zambia’s NMCC due to uncertainty regarding the effectiveness of community point distributions to achieve high rates of ITN retention and use. Officials from Zambia’s MoH and NMCCi requested this evaluation to:
1. Measure household attendance rates at community point distributions. 2. Measure rates of ITN self-installation, retention, and use over time among ITN recipients via
community point distributions. 3. Measure the effect of using CHWs to hang ITNs in households on short- and medium-term
ITN use. 4. Calculate the cost-effectiveness of community point distribution.
Evaluation Design In this evaluation, households received ITNs by attending community point distributions which were conducted in three rural communities in Rufunsa District. These households were then randomly allocated into five groups to receive community health worker visits to hang any unhung ITNs at different intervals:
Group 1 (n=93): CHW ITN hang-up visit after 1-3 days
Group 2 (n=97): CHW ITN hang-up visit after 5-7 days
Group 3 (n=96): CHW ITN hang-up visit after 10-12 days
Group 4 (n=95): CHW ITN hang-up visit after 15-17 days
Group 5 (n=179): No CHW ITN hang-up visit
i Busiku Hamainza, National Malaria Control Center; Ndhlovu Ketty, National Malaria Control Center; Dr. Musunda Siyolwe, Rufunsa District Medical Officer Zambia MCDMCH
5
After the CHW ITN hang-up visits, surveys were conducted at all households at periods of 7-11 weeks and 5-6 months following the community point distribution to measure ITN use and retention rates. Finally, the cost-effectiveness of the community point distribution approach was calculated. Results This evaluation revealed that 1) the community point distributions achieved acceptable rates of short-term and medium-term ITN retention and use as compared to rates achieved by recently evaluated door-to-door distributions, 2) CHW hang-up visits had a small short-term impact on ITN use but no medium-term effect, and 3) community point distributions can yield sizable time and HR cost savings compared to the door-to-door approach. Specific findings include:
96% of pre-registered households attended community point distributions and received
allotted ITNs.
More than 70% of distributed ITNs were self-installed among the households visited 10 to 12
days following the community point distributions (Group 3), indicating that significant CHW
time savings can potentially be achieved by delaying post-distribution hang-up visits by at
least ten days after distribution.
90% of distributed ITNs remained in households 7-11 weeks following distribution and 86%
of distributed ITNs remained in households 5-6 months following distribution. Both of these
rates are comparable to rates recently achieved in Zambia door-to-door distributions.3
66% of distributed ITNs were reported hanging after 7-11 weeks and 63% of distributed ITNs
were reported hanging after 5-6 months. 74% of sleeping spaces were reported covered by
ITNs 7-11 weeks following distribution and 80% of sleeping spaces were reported covered by
ITNs 5-6 months following distribution.
CHW hang-up visits increased ITN use after 7-11 weeks by 13-14% (significant at 1% level).
However, CHW hang-up did not result in any difference in ITN use after 5-6 months.
Community point distribution with follow-up hang-up visits can reduce the time and human
resource (HR) cost required for a mass distribution by 25%, which could yield more than $1
million in HR cost savings for the planned 2014 ITN distributions. Community point
distribution without any follow-up hang-up visits could reduce the time and HR cost
required for a mass distribution by 59%, which could yield more than $2 million in HR cost
savings for the planned 2014 ITN distribution.ii
Recommendations After consultation and agreement with government and partner stakeholders through the NMCC’s ITN Technical Working Group, it is recommended that provinces and districts be given the option to conduct community point distributions in contexts judged by local officials to be appropriate for this distribution approach. In time- and resource-constrained contexts, community point distributions without CHW follow-up to hang ITNs can yield additional time and cost savings, although such a change has not yet been approved by Zambia’s MoH.
ii The time savings from community point distributions varies significantly depending on community size and
distance from health facility.

6
Background Despite improvements in malaria prevention and access to treatment over the last decade, malaria remains one of Zambia’s greatest public health challenges. In Zambia, malaria is endemic to every province and there are four million clinically diagnosed malaria cases per year.4 Nationally, malaria contributes to 36% of hospitalizations and outpatient visits, 8-14% of low birth weight babies, 3-8% of all infant deaths, and up to 20% of maternal mortality.4 Annually, 104 deaths per 100,000 people can be attributed to malaria, and the disease is a major contributor to Zambia’s high child mortality rate of 119 per 1,000 live births.5 Morbidity and mortality is especially high in immunocompromised individuals, such as children, pregnant women and those with HIV/AIDS.4 Furthermore, malaria has serious economic implications due to healthcare expenditures, reduced saving and investment, and decreased worker productivity.6 Zambia’s MoH and NMCC have overseen a number of malaria prevention and treatment activities including widespread indoor residual spraying (IRS), insecticide-treated bed net (ITN) distribution, and expanded access to artemisinin-based combination therapy (ACT). Due to these efforts, there was a 39% decline in malaria cases between 2006 and 2008 and a 60% decline in inpatient cases between 2001 and 2008.7 However, a resurgence of malaria cases in 2009-2010, especially in the Northern and Eastern Provinces, is a reminder of the fragility of gains in the absence of sustained malaria prevention efforts.8 Consistently sleeping under an ITN has been shown to decrease all-cause child mortality by 17-29%, and larger community-wide gains can be realized if a critical number of households use ITNs.9 Further, free distribution of ITNs has been shown to be the most effective way to ensure the broadest distribution of ITNs and the most lives saved with little difference in cost-effectiveness when compared with cost-sharing mechanisms and direct purchase.10 In Zambia, a rolling nation-wide ITN distribution campaign is underway, with the goal of covering every sleeping space in Zambia.1 ITN coverage has greatly increased in recent years, with the proportion of households with at least one ITN increasing from 38% to 64% from 2006 to 2010, and the proportion of pregnant women and children under five years of age using ITNs increasing from 25% to almost 50%.5 However, despite these gains, many more Zambians still remain to benefit from increased ITN ownership and use, bringing the question of the optimal ITN distribution strategy to the forefront of national malaria policy. In 2014, Zambia is set to receive approximately six million ITNs for immediate distribution.2 This influx of ITNs has the potential to cover every sleeping space in the country. However, critical to maximizing the benefits of these ITNs is establishing an effective and cost-effective strategy to distribute ITNs in a manner that achieves high ITN use and retention at the household level. Door-to-door distribution campaigns have been effective in some contexts, but have been notably burdensome and costly in many rural locations.2 Limited evidence exists on the effectiveness of community point distribution and hang-up strategies to increase ITN ownership and use. A study in Ghana indicates that community point distribution and hang-up activities can increase the speed and cost-efficiency of distribution activities while maintaining high levels of ITN use.11 The evidence on the impact of CHW hang-up is mixed. One study in Uganda revealed sizable impacts of CHW hang-up on use, but other studies in Ghana, Togo and Uganda reveal modest to no material impacts of CHW hang-up on ITN use.12, 13, 14

7
In order to directly inform the 2014 ITN distribution campaign in Zambia, this evaluation tested the dynamics of a community point distribution and hang-up strategy. The evaluation additionally aimed to generate evidence to inform ITN distribution practices throughout sub-Saharan Africa.
Methods Study Setting, Population, and Sample This study was conducted in three neighbourhood zones in rural Rufunsa District in Zambia’s Lusaka Province (Table 1).iii The main sample consisted of all households in these areas which were pre-registered by NMCC to receive ITNs. Households that were missed during registration activities but attended community point distributions received ITNs, as well as follow-up surveys, for sensitivity analyses.
Table 1. Location of Sample Households
Rural Health Centre
Zone Villages Number of Households
Lukwipa RHC
Lukwipa
Lukwipa Chaguluka Menyani Musompha
239 Households
Chipeketi
Chipeketi Nyamphandu Kamanula Kavimba Alick Kalola Mbelenga Kaoye
133 Households
Mukonka RHC
Mukonka
Mukonka Chipokolo White Nyeleti Lupenga Ntiba-Ntiba
221 Households
The specific sites within Rufunsa District were chosen in consultation with the Rufunsa District Medical Officer (DMO) and rural health centre (RHC) staff to encompass rural communities with varying distances from the nearest RHC and from Great East Road, the major paved road that runs through Rufunsa District.
iii See Appendix A for full map of the study area.
Includes households that were not pre-registered but attended ITN distributions

8
Community Point Distribution Components The community point distribution examined in this evaluation had three components. Component 1: Household Registration As part of normal door-to-door ITN distribution activities, households in a neighbourhood zone were surveyed by local CHWs several months prior to the approval of the evaluation with coordination from the Rufunsa DHO and World Vision. This survey collected information on household size, current ITN ownership, and number of sleeping spaces.iv All households in the catchment area were targeted for registration. This activity was conducted in anticipation of standard door-to-door ITN distributions, which were later changed to community point distributions for the purposes of this evaluation. Component 2: Community Point Distribution CHWs were trained to run the community point distribution process by evaluation staff and were consulted to establish the optimal time and location for the distribution event. CHWs then used any available communication channels (including Neighbourhood Health Committees (NHCs) and local schools, elders and headmen) to inform households in the communities to collect their allotted ITNs at the specified time and place. On the day of distribution, household representatives were gathered in a group at the distribution point and given a health talk from CHWs emphasizing the importance of malaria prevention and ITN use. v Household representatives were then individually called forward by name to collect their allotted ITNs. The group setting was advantageous for accountability, making it difficult for someone other than a true household representative to collect ITNs for a given household. The ITNs for households that did not attend the community point distribution were delivered by a CHW in a “mop-up” visit conducted within a day or two of the community point distribution. Households that were not pre-registered but attended the distribution event received ITNs as available after all registered households had received their ITNs. Component 3: CHW Hang-up The third component of the intervention was a CHW visit to households for a “hang-up visit.” After the ITN distribution, households that were pre-registered were stratified by the CHW who pre-registered them and then randomized into five groups to receive hang-up visits at different intervals.
Group 1 (n=93): CHW ITN hang-up visit after 1-3 days
Group 2 (n=97): CHW ITN hang-up visit after 5-7 days
Group 3 (n=96): CHW ITN hang-up visit after 10-12 days
Group 4 (n=95): CHW ITN hang-up visit after 15-17 days
Group 5 (n=179): No CHW ITN hang-up visit
These groups were constructed in order to examine the dynamics of ITN self-installation rates by households over time and to assess the impact of CHW hang-up on ITN use by using households that
iv Households were given the same number of ITNs as the number of sleeping spaces recorded for that
household during the preregistration. This registration is standard procedure for the door-to-door distribution method. v Distribution events took place at the Mukonka Community School (November 14
th), a local church in Lukwipa
(November 21st
), and the Chipeketi Community school (November 19th
). For a full timeline of the study, see Appendix B.

9
did not receive a hang-up visit (Group 5) as a comparison group. Trained CHWs visited households during the specified period to conduct a short survey recording how many new ITNs were found in the household, including how many were found hanging (“self-installed”).vi Afterwards, CHWs assisted household members in hanging any unhung ITNs. This visit was conducted separately from the post-distribution mop-up visit, except in cases when the mop-up visit coincided with the household’s hang-up day.
Data Collection and Quality Checks Distribution Attendance Before the evaluation was commissioned, CHWs collected household registration data using NMCC data collection tools that informed the allocation of ITNs for each community point distribution.vii Households who received ITNs but were not registered did not receive hang up visits but were included in the 7-11 week and the 5-6 month follow-up surveys to measure overall ITN retention and use.viii At each community point distribution, data for each household were recorded on attendance, number of ITNs collected, and registration status. The distribution was overseen and guided by CHWs, community leaders and evaluation staff to ensure quality data and distribution accuracy.ix CHW Hang-up Visit At each hang-up visit, CHWs recorded information on number of ITNs found in the household and number of ITNs found hanging. This information was used to assess ITN self-installation rates over time. Whenever possible, CHWs directly observed ITNs and sleeping spaces. Evaluation staff was present for approximately 25% of CHW visits in each zone to ensure the accuracy and quality of the surveys. Additionally, 10% of hang-up surveys were re-surveyed by evaluation staff within three days of the initial hang-up visit.x Nearly all (over 97%) of the back-check surveys recorded the same number of ITNs found in the households as the original hang-up survey.xi 7-11 Week Follow-up To measure ITN retention and use, all households were targeted for a follow-up survey by evaluation staff 7-11 weeks following the community point distribution.xii Surveyors collected information on household ITNs (both present and relinquishedxiii), sleeping spaces, malaria knowledge, and household assets. Surveyors requested to visually see all sleeping spaces and present ITNs.
vi Survey was conducted on paper by CHWs.
vii This is the same data source that would have been used to conduct door-to-door distributions in these
zones. viii
These households were included in the “no hang-up visit” group in a secondary analysis. ix The distribution event was run by community health workers. The current supervision mechanisms in place
are sufficient to replicate the distribution without IDinsight’s involvement or significant additional resources. x The same instrument was used for this re-survey.
xi Of the 41 households visited for back checks, 37 households were available for the back check visit. Of these
37 households, only one had a discrepancy in the number of ITNs present in the household. This household maintained that there was one extra net that they had, but surveyors were unable to verify this because it was locked in a bedroom. xii
Data were collected using Open Data Kit (ODK). All enumerators used the ODK Collect mobile application on Samsung Galaxy Y phones. xiii
A “relinquished ITN” is defined as an ITN that was either no longer in the household’s possession, or was taken away from the household area by a household member.

10
Five percent of these households (n= 28) were re-visited by study staff to conduct back-check surveys for data quality assurance. A comparison of ITN ownershipxiv was made between the original 7-11 week survey data and the back-check survey data. From the back-check surveys, 82% (n= 23) of households yielded ITN ownership numbers identical to those recorded in the 7-11 week follow-up survey. In the five remaining cases, discrepancies can largely be attributed to a difference in survey respondent and to the movement of household members and ITNs.xv There were no cases where inaccurate or fraudulent data was suspected after investigating these discrepancies. 5-6 Month Follow-up A second follow-up survey was administered by study staff 5-6 months after the community point distribution for these same households using a nearly identical survey to the 7-11 week survey.xvi Surveyors recorded all new and old household ITNs (both present and relinquished), and all sleeping spaces. ITNs present in the household were visually verified when possible. Surveyors also asked questions about ITN use. To check data quality, 10% of households were re-visited by study staff to conduct back-check surveys for data quality assurance. Among these back-check surveys, 73% (n = 41) of households had identical ITN ownership numbers to those recorded in the 5-6 month follow-up survey. An additional 20% of households were within one ITN of the amount recorded on the 5-6 month survey. These inconsistencies can largely be attributed to an abbreviated line of questioning in the back-check survey as compared to the full 5-6 month follow-up survey and a difference in survey respondent.xvii An analysis of these differences shows that the average discrepancy in retention rate between the 5-6 month follow-up survey and the corresponding back check survey was not statistically significantly different from zero and was unlikely to cause bias.xviii Comparisons of GPS data, household members, respondents’ surnames, and household assets were effectively compared to verify the identity of households. Operational Measurements
xiv
“ITN ownership” is defined as all ITNs owned by the household. This includes ITNs present in the household as well as those being used outside of the household. xv
In cases where the household head or spouse was unavailable, other household members were surveyed in their place. In some cases, these representatives had imperfect knowledge about household ITNs or did not have access to household rooms during the survey. The survey was also conducted during a busy farming period when household members oftentimes shifted to other locations bringing ITNs with them. Discrepancies in ITNs retained were 1 ITN for 3 households, 2 ITNs for 1 household and 5 ITNs for 1 household. The household with a 5 ITN discrepancy is likely due to movement of ITNs since other information such as ITNs reported to have received from the distribution was accurate. xvi
Data were collected using Open Data Kit (ODK). All enumerators used the ODK Collect mobile application on Samsung Galaxy Y phones. xvii
Questioning in this back-check survey was centered on respondent recall of the aggregate number of ITNs owned by the household, a potentially less accurate measure of ITN ownership than the original 5-6 month follow-up survey in which enumerators recorded these figures by separately asking to observe the present ITNs. Discrepancies in ITNs retained were 1 ITN for 11 households, 2 ITNs for 3 households, and 3 ITNs for 1 household. xviii
The mean difference in reported ITN ownership between the 5-6 month survey and back-check survey was compared using a two-sample t-test with unequal variances.

11
To enable estimation of the time and cost savings of the community point distribution approach, evaluation staff assessed the durations of various components of the community point distribution and hang-up visit activities including: time required for a community point distribution, time spent traveling between households, time spent surveying and time spent hanging ITNs. These measurements, along with cost projections from the United Nations Development Programme (UNDP) operational plan for the 2014 mass distribution and the NMCC micro-planning guidelines, were used to model the projected time and costs for community point and door-to-door distributions.
Analytical Methods The analysis of study data focused on understanding ITN self-installation, retention, and use.xix All statistical analyses were done using Stata 12 (Stata Corp LP, College Station, Texas, USA). A time and human resources cost model was also developed to estimate the time and cost required to distribute ITNs via different door-to-door and community point distribution approaches. ITN Self-installation The self-installation rate was calculated as the number of ITNs hanging in the household at the time of the hang-up survey divided by the number of ITNs distributed to the household at the community point distribution. This figure does not include households in the control group (Group 5) that did not receive a hang-up visit. A quadratic regression was used to estimate the effect of the squared number of days since the distribution event plus the number of days since the distribution on the self-installation rate, adjusting for household-level covariates (proximity to distribution site, household size, registering CHW, and whether a mop-up visit was required). Zone was not included in the regressions due to collinearity with CHW.xx ITN Retention ITNs “reported found” was defined as ITNs self-reported by households to currently be in the household during the follow-up surveys. The majority of these ITNs were also directly observed by the surveyors in the household (“verified”). Some ITNs were not observed, because the household member being surveyed did not have access to the rooms in which the ITNs were stored, or because household members were not willing to allow entry to evaluation staff in the absence of the household head. The ITN retention rate was calculated by dividing the number of ITNs reported in the household at the time of the survey by the number of ITNs distributed to that household. A bounds analysis was conducted to account for survey attrition. The lower bound estimate for ITN retention used only verified ITNs as its numerator, and assumed 0% retention in households that were not successfully surveyed. The upper bound estimate used all ITNs reported retained by the household as its numerator and assumed 100% retention in un-surveyed households. ITN Use Two metrics for ITN use were measured in this study using data from the follow-up surveys: 1) percent of sleeping spaces covered per household and 2) percent of ITNs hanging per household.
xix
See Appendix C for the full equations used in this section. xx
A logarithmic regression was also fitted to the data but was not chosen as the primary analysis as the quadratic regression had a higher adjusted R-squared.

12
The percent of sleeping spaces covered by an ITN was calculated by dividing the total number of sleeping spaces reported covered by an ITN at the time of the survey by the total number of sleeping spaces reported in the household. A linear regression was used to model the impact of CHW hang-up on the likelihood of a sleeping space being covered with an ITN in a household adjusting for household-level covariates. The percent of ITNs hanging was calculated by dividing the number of distributed ITNs reported hanging in the household at the time of the follow-up survey by the number of ITNs distributed to the household at the community point distribution.xxi A linear regression adjusted for household-level covariates was used to model the impact of CHW hang-up on the likelihood of an ITN being found hanging. Time and HR Cost Calculations Time and HR cost efficiency calculations were performed using measurements of typical ITN distribution and hang-up operations in the evaluation, as well as UNDP projections of costs associated with conducting door-to-door distributions.1 Distribution method costs were calculated as factors of the amount of time that the tasks occupied for particular health staff and their daily costs. Results on CHW time, supervisor time, and costs were calculated per ITN, per household, and per distribution in addition to a country-wide estimate. Assumptions are detailed in Appendix D.
Results CHWs pre-registered 562 households. xxii Two of these households permanently moved prior to distribution, leaving 560 households to be randomized into five hang-up visit groups:
Group 1 (n=93): CHW ITN hang-up visit after 1-3 days
Group 2 (n=97): CHW ITN hang-up visit after 5-7 days
Group 3 (n=96): CHW ITN hang-up visit after 10-12 days
Group 4 (n=95): CHW ITN hang-up visit after 15-17 days
Group 5 (n=179): No CHW ITN hang-up visit On average, households that were randomized to receive a hang-up visit were similar in household size, number of sleeping spaces, education level of the head of household, household distance to the clinic, and distance to the distribution site compared to households that did not receive a hang-up visit (Table 2). Households in each treatment group were also similarly distributed across zones. Community Point Distribution Attendance Of the 560 pre-registered households, 96% (n = 540) attended distributions or sent a representative to receive ITNs. An additional 31 households (5% of total attendees) attended the distribution but were missed in the original registration survey effort. Of those pre-registered households who attended the distribution, 55% were represented by heads of households or their spouses while another 39% were represented by other family members. Remaining households (6%) were represented by non-family members who were primarily neighbors.
xxi
This does not take into account the possibility that households received more ITNs than sleeping spaces and is thus a conservative estimate of the percent of ITNs hanging that should be hanging. xxii
See Appendix E for a flow chart of participation.

13
Table 2. Household Characteristics by Evaluation Group
Household Characteristics No Hang-up Visit
(N = 179) Hang-up Visit
(N = 381)
Mean (SD) Mean (SD)
Sleeping spaces 2.76 (1.25) 2.72 (1.27) Household size 5.18 (2.72) 5.11 (2.69) Distance to clinic (km) 5.00 (4.17) 4.69 (3.91) Distance to distribution site (km) 1.55 (1.28) 1.48 (1.21)
N (%) N (%) Zone
Lukwipa 74 (41.57) 156 (40.73) Mukonka 61 (34.27) 149 (38.9) Chipeketi 43 (24.16) 76 (20.37)
Education level of head of HH
No formal education 22 (16.3) 54 (18.82) Primary 84 (62.22) 171 (59.58) Secondary 29 (21.48) 54 (18.82) Professional training school 0 1 (0.35) College/university 0 7 (2.44)
Missing values: Household size - N = 3; Distance to clinic - N = 27; Distance to distribution site - N = 27; Education level of HH head - N = 149
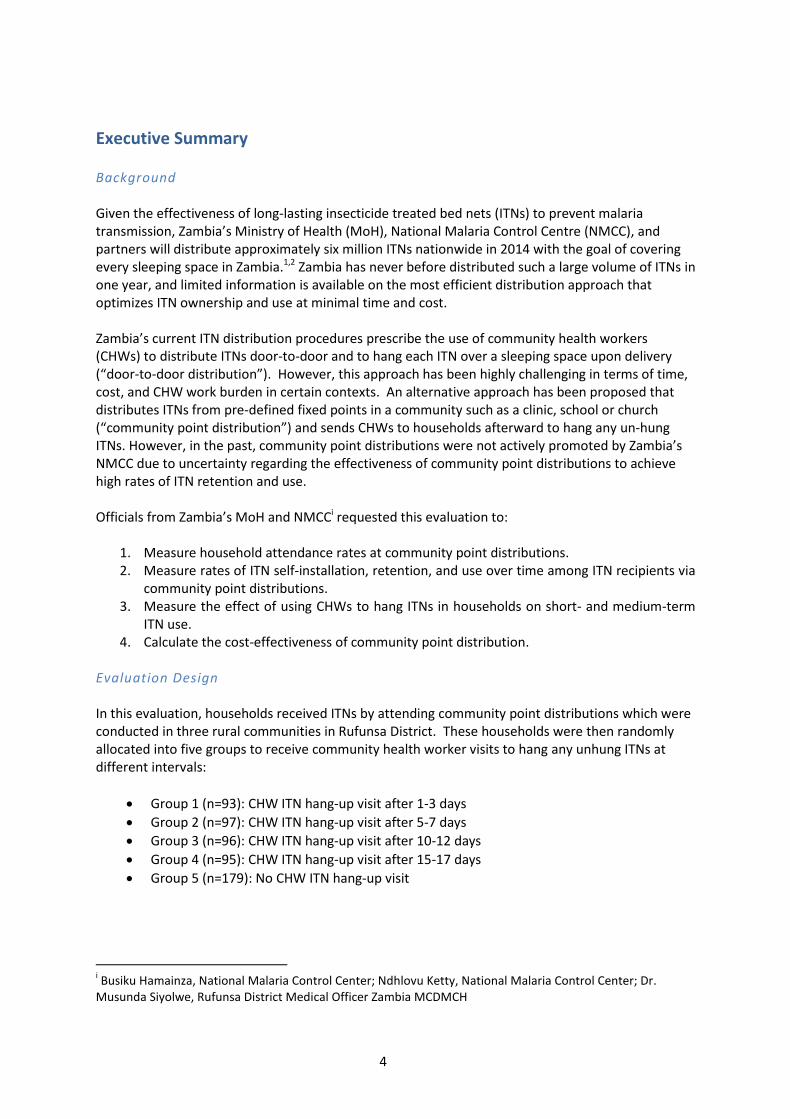
Self-installation Rate The self-installation rate generally increased with the number of days between the distribution and the hang-up visit (Figure 1). These results show that allowing ten or more days between the distribution and the CHW hang-up visit could decrease the number of ITNs that CHWs are asked to hang in households by more than 70%. While there was a slight decrease in the self-installation rate between the final two groups, the difference is within the 95% confidence interval (indicated by the black bar for each group) and subsequent follow-up surveys show that the hang up rate did not continue to decrease substantially over time. The quadratic regression confirmed a statistically significant relationship between the household self-installation rate and days since distribution. The regression results are included in Table 9 of Appendix F.
14
Figure 1. Self-Installation Rates among Treatment Groups in Households Visited at Hang-up Survey
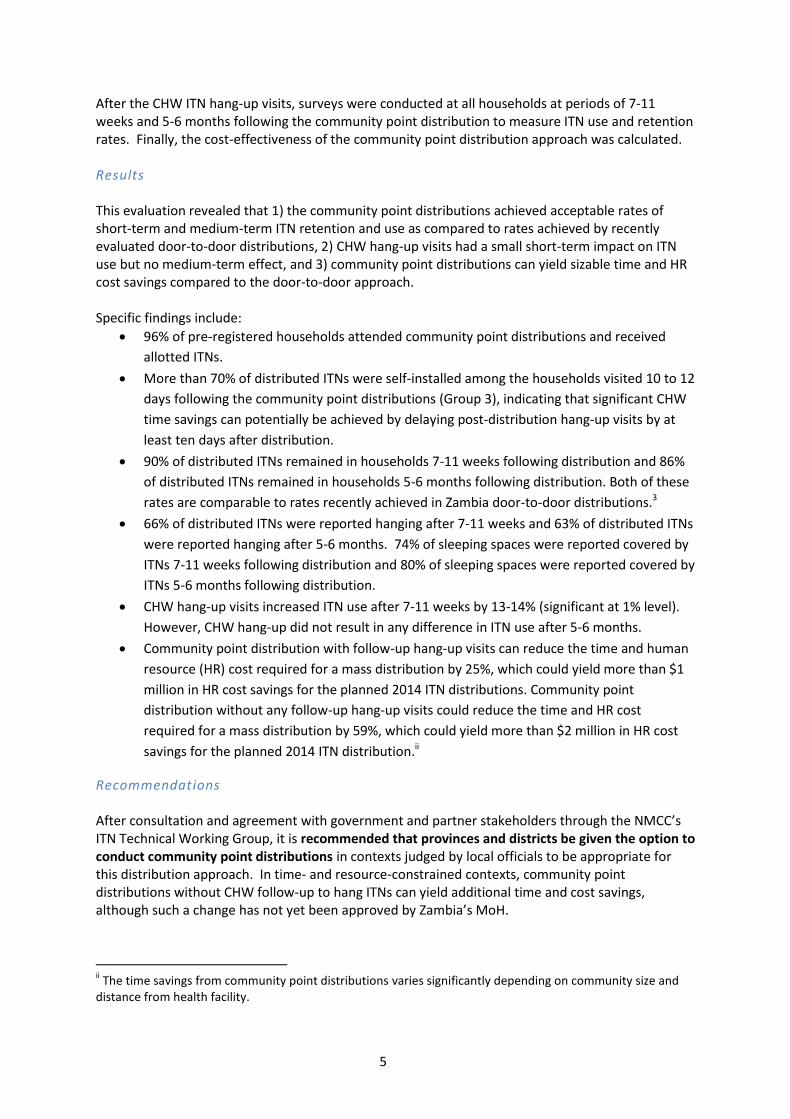
ITN Retention As shown in Figure 2, overall ITN retention 7-11 weeks following the distribution was 90% of distributed ITNs, with 75% visually verified by research staff. 5-6 months following the distribution, ITN retention was 86% of distributed ITNs, with 79% visually verified. There was no significant difference in retention rates between households who received a CHW hang-up visit after the distribution and those who did not. The bounds analysis indicated by the dashed lines in Figure 2 shows little increase in the retention rate with the upper bound assumption for un-surveyed households and unverified ITNs at 91% and 87% for the 7-11 week and 5-6 month follow-up surveys, respectively, and a lower bound of 71% and 73% respectively for the two follow-up periods.
Of the distributed ITNs not found in households, the primary explanations were:
Used elsewhere by household members
Given to another household after distribution
Sold to another household after distribution
Sold to shop after distribution
Kept by the representative who attended the distribution on behalf of a household
24%
46%
77% 71%
0%
25%
50%
75%
100%
1-3(n=86)
5-7(n=91)
10-12(n=87)
15-17(n=92)
Pe
rce
nta
ge o
f IT
Ns
han
gin
g*
Days between Distribution and Hang-up visit * Bars indicate 95% confidence intervals

15
Figure 2. ITN Retention Rate across Follow-up Periods.
ITN Use
Sleeping Space Coverage During the 7-11 week follow-up, the average percent of sleeping spaces covered per household was 74% (SD = 35%). The 5-6 month follow-up found an average of 80% (SD = 34%) of sleeping spaces covered per household. Both of these estimates are comparable to recent ITN distribution efforts in Zambia.3 After 7-11 weeks, the average percent of sleeping spaces covered per household was eight percentage points higher among households that received a CHW hang-up visit (Groups 1-4) compared to households that did not receive a CHW hang-up visit (Group 5).xxiii Sleeping space coverage was virtually identical between these two groups after 5-6 months. Overall, sleeping space coverage was greater in the 5-6 month survey, which could be explained by a difference in seasons or the end of the school year (Figure 3).xxiv
xxiii
When unregistered households who attended the distribution are counted in the control group, these figures remain the same with the exception of the treatment and control groups for the 7-11 week follow-up survey (n=591). Here, the control group coverage rate increases to 69% (n=194), decreasing the difference between treatment and control to 7% (statistically significant at p < 0.02, using a two-sample t-test with unequal variance). xxiv
The 7-11 week survey was conducted during the hotter, rainy season when households reported taking ITNs down because the roof was leaking or due to heat. Additionally, many of the ITNs that had been removed from the household were reported to be with children at school. Many of the 5-6 month surveys were conducted during a period of school leave when more students may have been at home with their ITNs.
0%
25%
50%
75%
100%
7-11 Week(n=528)
5-6 Month(n=504)
Ho
use
ho
ld N
et
Re
ten
tio
n*
Follow-up Survey
Total ITNs reported
Visually Verified
*Bars indicate upper and lower bounds for attrition analysis.

16
Figure 3. Average Percent of Sleeping Spaces Reported Covered per Household after Distribution by Treatment Group
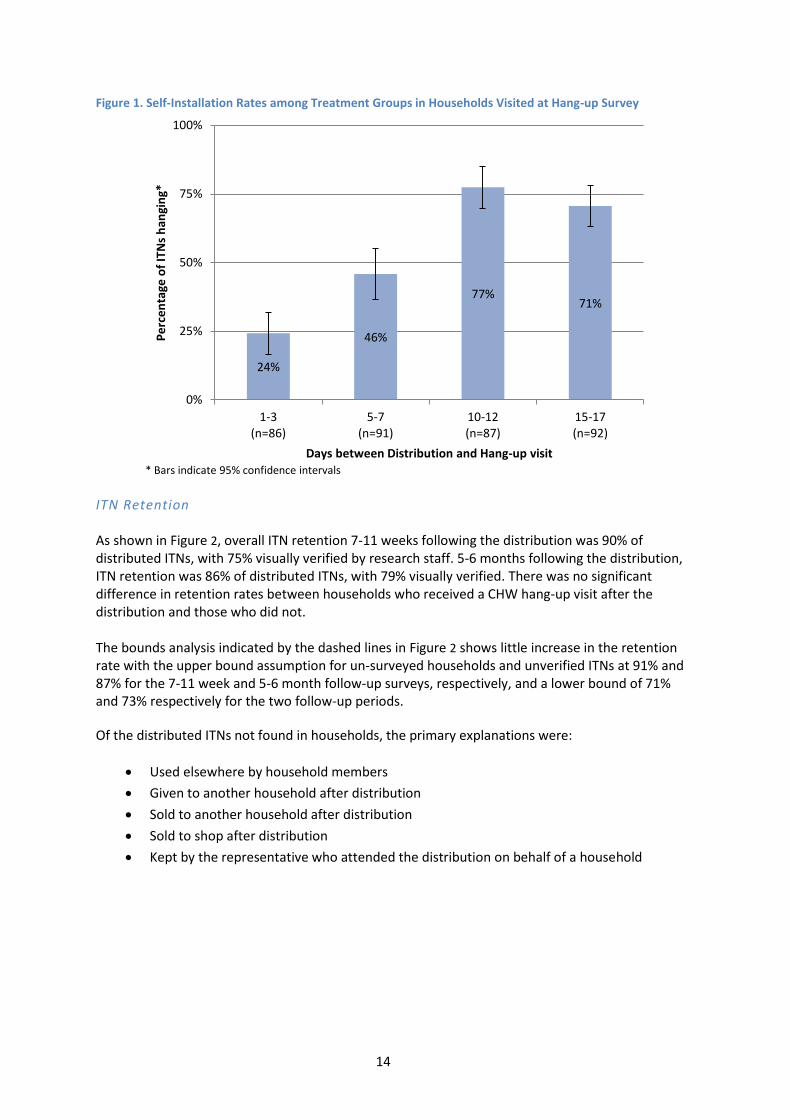
A linear regression was modeled on the percent of sleeping spaces covered by an ITN in a household accounting for the straight line distance from the household to the distribution site, the CHW who initially registered the household, the number of days between the community point distribution and the hang-up visit, and the household size. The results of the regressions for each follow-up period are shown in Table 3 (See Table 10 in Appendix F for the full regression output). A hang-up visit is associated with a nine percentage point increase in sleeping spaces covered (p-value <0.01) 7-11 weeks after distribution. There was no significant effect of the hang-up visit on sleeping spaces covered in the 5-6 month survey.
17
Table 3. Linear Regression Modeling the Effect of a CHW Hang-up Visit on the Percent of Sleeping Spaces Reported Covered in Surveyed Households
xxv
Covariates 7-11 Week Survey* 5-6 Month Survey^
Coefficient P-value [95% CI] Coefficient P-value [95% CI]
Hang-up Group
No Hang-up Visit Ref
Ref
Received Hang-up Visit 0.091 <0.01 [0.03,0.16] 0.022 0.50 [-0.04,0.09]
Distance to Distribution site (km) -0.001 0.93 [-0.04,0.04] 0.014 0.37 [-0.02,0.05] Days between visit and distribution -0.003 0.19 [-0.01,0.00] 0.000 0.81 [-0.00,0.00]
Household size 0.014 < 0.01 [0.00,0.02] 0.022 < 0.01 [0.01,0.03]
Constant 0.859 < 0.01 [0.49,1.23] 0.666 < 0.01 [0.54,0.80]
% Diff P-value [95% CI] % Diff P-value [95% CI]
Marginal percentage point diff for Hang-up vs. No Hang-up
9.10% < 0.01 [2.61, 15.51] 2.23% 0.50 [-4.19,8.65]
% Change 13.38% 2.83% *7-11 week survey - N = 514; Missing values in 7-11 week survey were: HH percent of covered sleeping spaces: 3; Household size: 3; Days since distribution: 8 ^5-6 month survey - N = 501; Missing values in 5-6 month survey were: Household size: 2; Distance btw HH and distribution site: 1 Both models were also adjusted for distributing community health worker, output not shown
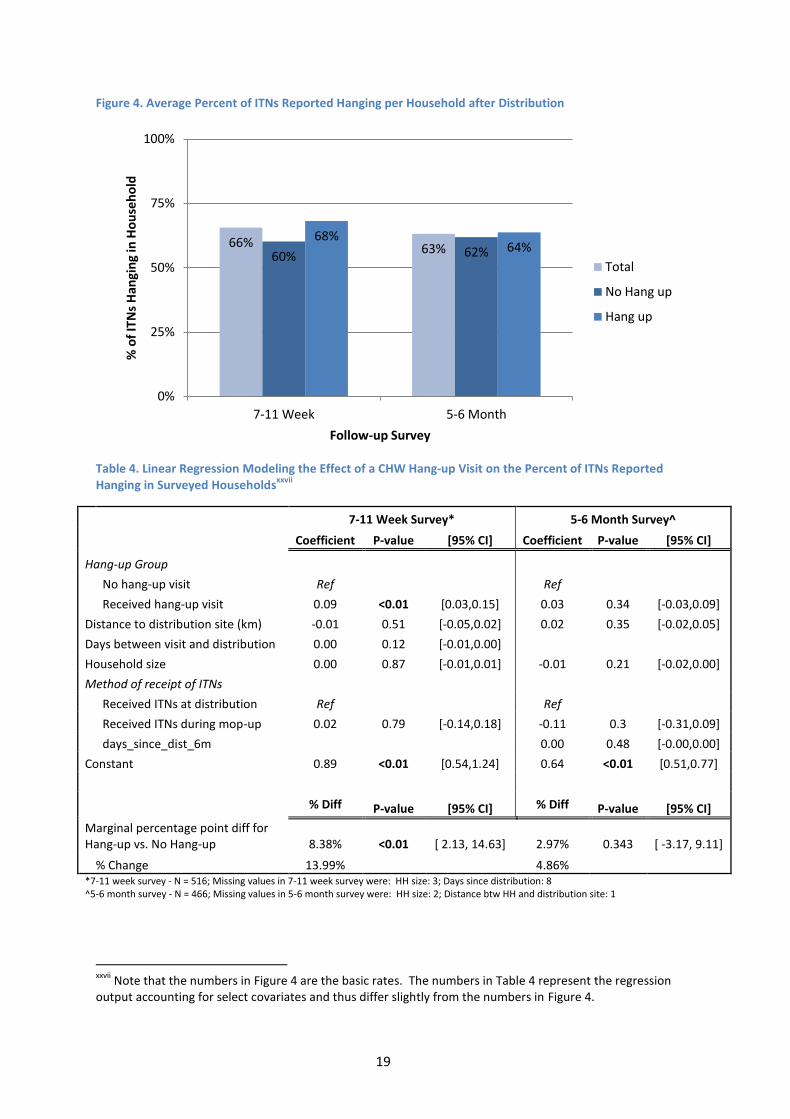
ITNs Hanging The average percent of ITNs hanging per household was 66% (SD = 34%) for households surveyed after 7-11 weeks and 63% (SD = 34%) for households surveyed after 5-6 months (Figure 4). After 7-11 weeks, the average percent of ITNs hanging per household was eight percentage points higher among households that received a CHW hang-up visit versus households that did not receive a CHW hang-up visit. The average percent of ITNs hanging per household was virtually identical across the two groups after 5-6 months.xxvi
Linear regressions were modeled for the percent of ITNs hanging accounting for the straight line distance from the distribution point, the number of days since the distribution, the household size, the CHW who initially registered the household, and whether the household required a mop-up delivery of ITNs. As seen in Table 4, regression results for the 7-11 week follow-up survey show that a hang-up visit is associated with an eight percentage point increase in reported ITNs hanging (p-value <0.01). There was no significant relationship between the percent of ITNs reported hanging among treatment groups in the 5-6 week follow-up period (See Table 11 in Appendix F for a full table of results).
xxv
Note that the numbers in Figure 3 are the basic rates. The numbers in Table 3 represent the regression output accounting for select covariates and thus differ slightly from the numbers in Figure 3. xxvi
Including households that were not preregistered in the control group, these figures remain unchanged.

18
19
Figure 4. Average Percent of ITNs Reported Hanging per Household after Distribution
Table 4. Linear Regression Modeling the Effect of a CHW Hang-up Visit on the Percent of ITNs Reported Hanging in Surveyed Households
xxvii
7-11 Week Survey* 5-6 Month Survey^
Coefficient P-value [95% CI] Coefficient P-value [95% CI]
Hang-up Group
No hang-up visit Ref
Ref
Received hang-up visit 0.09 <0.01 [0.03,0.15] 0.03 0.34 [-0.03,0.09]
Distance to distribution site (km) -0.01 0.51 [-0.05,0.02] 0.02 0.35 [-0.02,0.05]
Days between visit and distribution 0.00 0.12 [-0.01,0.00]
Household size 0.00 0.87 [-0.01,0.01] -0.01 0.21 [-0.02,0.00]
Method of receipt of ITNs
Received ITNs at distribution Ref
Ref
Received ITNs during mop-up 0.02 0.79 [-0.14,0.18] -0.11 0.3 [-0.31,0.09]
days_since_dist_6m
0.00 0.48 [-0.00,0.00]
Constant 0.89 <0.01 [0.54,1.24] 0.64 <0.01 [0.51,0.77]
% Diff P-value [95% CI] % Diff P-value [95% CI]
Marginal percentage point diff for Hang-up vs. No Hang-up 8.38% <0.01 [ 2.13, 14.63] 2.97% 0.343 [ -3.17, 9.11]
% Change 13.99% 4.86% *7-11 week survey - N = 516; Missing values in 7-11 week survey were: HH size: 3; Days since distribution: 8 ^5-6 month survey - N = 466; Missing values in 5-6 month survey were: HH size: 2; Distance btw HH and distribution site: 1
xxvii
Note that the numbers in Figure 4 are the basic rates. The numbers in Table 4 represent the regression output accounting for select covariates and thus differ slightly from the numbers in Figure 4.
66% 63% 60% 62%
68% 64%
0%
25%
50%
75%
100%
7-11 Week 5-6 Month
% o
f IT
Ns
Han
gin
g in
Ho
use
ho
ld
Follow-up Survey
Total
No Hang up
Hang up

20

21
Sensitivity Analysis
A sensitivity analysis was done for each regression using upper and lower bound assumptions for households that were not surveyed. An additional analysis was completed incorporating households that were not preregistered but who attended the distribution and were surveyed in both follow-up periods into the control group. Both of these analyses indicate no significant changes in the interpretation of the data. For the bounds regression results, see Appendix G. The analysis that included households that were not preregistered is not included in this report, but is available upon request. Time-Savings Analysis According to a model based on evaluation findings, the community point distribution method with CHW hang-up visits reduced the time required for an ITN distribution by approximately 25% when compared to door-to-door distribution method. Furthermore, the community point distribution method without hang-up visits (the control group in this study) reduced the time required for an ITN distribution by approximately 59% when compared to the door-to-door distribution method. Figure 5 shows the comparison of how CHW time is spent across these three distribution methods in areas that resemble the study area. Figure 5. CHW Time Required Per Distribution Method
Cost-Savings Analysis According to a model based on cost projections in the UNDP operational plan for the 2014 mass distribution, community point distribution could similarly yield sizable HR cost savings (Table 5). Across all ITNs allotted for distribution in Zambia in 2014, community point distribution with hang-up could yield more than $1 million in HR cost savings. These numbers are further magnified when no CHW hang-up visits are executed. As compared to the door-to-door distribution method, a community point distribution method without hang-up visits could yield more than $2 million in HR cost savings. As is evident from these comparisons, the primary source of savings in the community
0
5
10
15
20
25
30
35
40
D2D CPD with delayedhang-up visit
CPD with no hang-upvisit
CH
W d
ays
pe
r d
istr
ibu
tio
n z
on
e
Distribution method
Fetching nets from storage
HH Visit: Transport
HH Visit: Non hanging time
HH Visit: ITN hanging time
Distribution Event
Publicity
Pre-registration

22
point distribution model is the time spent by CHWs fetching and hanging ITNs in households. For a full list of the cost calculator outputs, see Table 8 in Appendix D.xxviii Table 5. Human Resources Costs Savings Comparison
xxix
Door – to – door
Distribution
Community Point Distribution with delayed
hang-up
Community Point Distribution with no hang-up
# of ITNs to be distributed to rural areas (Estimated 75% of total ITNs set for distribution)
4,312,725 4,312,725 4,312,725
HR cost per ITN (ZMW / ITN)
5.65 4.21 2.34
Total HR cost savings ZMW compared to door-to-door method
6,199,885.28
($1,033,314.21) 14,261,854.48
($2,376,975.75)
% Human resources cost savings
25% 59%
Discussion Summary of Results This evaluation revealed that 1) community point distributions can achieve short- and medium-term ITN retention and use levels comparable to those of a previously evaluated door-to-door distribution approach, 2) community point distributions can yield sizable time savings and HR cost savings versus door-to-door distributions, and 3) the impact ITN hang-up on ITN use was small after 7-11 weeks and non-existent after 5-6 months.3 Specific findings include:
96% of pre-registered households attended community point distributions and received
allotted ITNs.
The majority of distributed ITNs were self-installed within the first ten days following the
community point distributions. Significant CHW time savings can potentially be achieved by
delaying hang-up visits by at least ten days, when >70% of ITNs were self-installed in
households.
90% of distributed ITNs remained in households 7-11 weeks following distribution and 86%
of distributed ITNs remained in households 5-6 months following distribution. Both of these
xxviii
For percentage cost- and time-savings for different community sizes and distances to the clinic, see Appendix I. xxix
The exchange rate used for these calculations was 6 Zambian Kwacha = 1 U.S. Dollar.
23
rates are comparable to similar rates recently achieved in Zambia door-to-door
distributions.3
An average of 74% of sleeping spaces in surveyed households were found covered during
the 7-11 week survey, while an average of 80% of sleeping spaces were found covered
during the 5-6 month survey. CHW hang-up visits were associated with increased ITN use
after 7-11 weeks by 13-14% (significant at 1% level). However, CHW hang-up was not
associated with any difference in ITN use after 5-6 months.
Cost- and time-savings models indicate that community point distribution with follow-up
hang-up visits reduced the time and HR cost required for a mass distribution by 25%, which
could yield more than $1 million in HR cost savings for the planned 2014 ITN distributions.
Community point distribution without follow-up hang-up visits reduced the time and HR
cost required for a mass distribution by 59%, which could yield more than $2 million in HR
cost savings for the planned 2014 ITN distribution
Discussion of Results 96% of registered households attended the community point distributions, indicating that households are willing to travel to community centres to pick up ITNs. Anecdotal evidence in Zambia suggested that point distribution attendance suffered when RHCs were used as distribution points due to the long travel distances to reach the distribution sites (up to a full day of travel each way in some cases). The community point distributions studied in this evaluation were conducted at the neighbourhood zone level, one level below the RHC level. This ensured that no beneficiary had to travel more than four hours to attend a distribution, a reasonable travel time in the context of life in rural Zambia. Delaying CHW hang-up visits until ten days after the distribution event can generate significant time savings. Study results indicate that waiting at least ten days after the distribution event can achieve significant time and cost savings by decreasing the amount of time CHWs spend hanging ITNs without decreasing ITN retention or use. ITN retention and use rates were sustained across a period of 5-6 months and were comparable to a door-to-door distribution recently conducted in Zambia. There was no statistically significant change in ITN retention and use across the two follow-up periods. A door-to-door distribution in Luapula province in 2011 was widely referenced in stakeholder meetings as a key factor in guiding Zambia toward a policy of universal door-to-door distribution and hang-up. Using a limited sample of 138 ITNs, that distribution yielded 96% ITN retention with 79% of sleeping spaces covered after 8 weeks. These numbers are comparable to the 90% retention and 74% sleeping space coverage 7-11 weeks following distribution and the 86% retention and 80% sleeping space coverage 5-6 months following distribution found in this evaluation. Significant time and cost savings can be achieved with a community point distribution approach without harming ITN use and retention. The operational model outputs, combined with the ITN use and retention findings, reveal that the community point distribution approach can yield significant cost savings for mass ITN distribution without significantly sacrificing ITN use and retention. Furthermore, the finding that CHW hang-up impact on ITN use was modest after 7-11 weeks and non-existent after 5-6 months indicates that even larger savings can potentially be realized by limiting CHW hang-up visits without ITN use and retention drawbacks.

24
Given the constrained timeline to distribute ITNs before the 2014 rainy season, Zambia’s MoH may consider adjusting ITN distribution guidelines to allow for ITN distribution without CHW hang-up in time- or resource-constrained contexts where familiarity with ITNs is high. Evaluation Strengths Randomization of households into CHW follow-up groups enabled us to rigorously measure self-installation rates across time and cleanly estimate the impact of hang-up on ITN use. Additionally, we measured ITN retention and use in two time periods to give indications of both short-term and medium-term outcomes. Data from back-check surveys verified the reliability of the collected data. Finally, enumerators attempted to visually verify each ITN in the household, rather than relying fully on self-report. Evaluation Limitations This evaluation was completed in rural Rufunsa district of Zambia, and, therefore, does not purport to explore the effectiveness of community point distribution in urban or peri-urban settings. Also, these results might not be generalizable to rural settings that fit a different geographic or population density profile. The evaluation design does not directly compare community point distribution with the door-to-door distribution method. This direct comparison would have required randomization at the zone level, which is expensive and was deemed unnecessary by MOH officials for informing a policy recommendation and decision. Instead, the study makes use of recent door-to-door distribution campaigns and national malaria figures to draw comparisons between outcomes. For a more expansive explanation of limitations, see Appendix H.
Policy Recommendations Community point distribution in Rufunsa District was found to achieve similar ITN retention and use as the successful door-to-door distribution carried out in Luapula Province in 2011, while achieving significant time and cost savings.3 Contexts in which community point distribution might be an attractive option include:
Areas where villages are far away from the storage facility
Areas where villages are highly populated
Sparsely populated areas with long travel times or distances
Areas in which inhabitants are likely to be away from home when visited by CHW
Areas without established CHWs or NHCs who can deliver door-to-door
Contexts with strong community ties to ensure a well-monitored community point
distribution and effective community sensitization to ensure high attendance
Areas with high prior knowledge of malaria and ITNs
Resource constrained areas
Contexts in which ITNs must be delivered quickly and efficiently
The following local factors were critical for successful implementation of the community point distributions in this study:

25
High levels of communication between the distribution team and District and RHC staff, including facility in-charges, Environmental Health Technicians (EHTs), and CHWs.
CHW support through per diems of 20 Zambian Kwachaxxx was important to maintain effort and morale on the ground. Given the often strenuous work of traveling door-to-door to check and hang ITNs, it may be necessary to incentivize CHWs to do their work properly.
Careful record keeping ensured good organization of the distribution event and accountability during the CHW hang-up visits. It was critical that household registration records were stored in an organized manner prior to the evaluation. Registration activities should also utilize measures to avoid missing households and accurately assess ITN needs per household. During the distribution and evaluation, study staff – in collaboration with CHWs and local health officials – effectively tracked ITN figures and conducted household surveys. Attention to such record keeping is critical for future community point distributions to ensure accountability and effectiveness.
Given these findings, and after consultation and agreement through the NMCC’s ITN Technical Working Group, it is recommended that districts be given the option to conduct community point distributions in contexts judged by local officials to be appropriate for this distribution approach. Moreover, given the limited effectiveness of CHW hang-up in certain contexts, Zambia’s MoH may consider adjusting ITN distribution guidelines to allow for ITN distribution without CHW hang-up in time- or resource-constrained contexts where familiarity with ITNs is high.
xxx
Approximately $3 per day. The CHW per diem rate in the UNDP guidelines is 30 Kwacha per day.

26
Sources 1. Ministry of Health of Zambia. National Malaria Strategic Plan 2011-2015. (2011). at
<http://www.nmcc.org.zm/files/NMSP2011-2015_Final.pdf>
2. National Malaria Control Centre of Zambia. Stakeholder Meeting, National Malaria Control Centre of Zambia. (2013).
3. STEPS OVC Report. House to house distribution of insecticide-treated nets in nine Zambian districts, 2011-2012. (2013).
4. National Malaria Control Centre. Malaria Control in Zambia. at <nmcc.org.zm/malaria_control.htm>
5. President’s Malaria Initiative (PMI). Country Profile: Zambia. (2013). at <http://www.pmi.gov/docs/default-source/default-document-library/country-profiles/zambia_profile.pdf?sfvrsn=8>
6. Sachs, J. & Malaney, P. The economic and social burden of malaria. Nature 415, 680–685 (2002).
7. Chanda, E. et al. An Overview of the Malaria Control Programme in Zambia. Int. Sch. Res. Not. 2013, e495037 (2012).
8. Masaninga, F. et al. Review of the malaria epidemiology and trends in Zambia. Asian Pac. J. Trop. Biomed. 3, 89–94 (2013).
9. President’s Malaria Initiative. Fact Sheet on Insecticide-treated Mosquito Nets (ITNs). at <http://www.fightingmalaria.gov/news/pressreleases/itn_facts.html>
10. Cohen, J. & Dupas, P. Free Distribution or Cost-Sharing? Evidence from a Malaria Prevention Experiment. (National Bureau of Economic Research, 2008). at <http://www.nber.org/papers/w14406>
11. TAMTAM: Together Against Malaria 2011. Ghana LLIN study: Findings and Recommendations. 2011.
12. TAMTAM: Together Against Malaria. Insecticide treated net distribution: Boosting usage via home installation. 2010.
13. Health Bridge. Effectiveness of post-campaign door-to‐door hang-up and communication interventions to increase LLIN utilization in Togo: a cluster randomized control trial. Final Report. September 2012.
14. NetWorks. Uganda Culture of Mosquito Net Use Study. Phase One Findings. November 2012.

27
Appendix A: Map of Study Area

28
Appendix B: Study Timeline
Ethics Approval
Project Kick-off
Training and Distribution
CHW training
Community Sensitization
Point distributions
CHW ITN hang-up
Household Surveys
May Jun Jul
2013 2014
Nov Dec Jan Feb Mar Apr

29
Appendix C: Analysis Equations Table 6. Equations Used for Analysis
Variable Formula Data Source Community Point Distribution Dynamics
Event Attendance
Distribution data
Percent of Unregistered Attendees
Distribution data
Attendee Characteristics
Distribution data
Self-installation Rates
Self-install Rate
CHW hang-up survey
Self-installation Quadratic Regression
CHW hang-up survey
Follow-up Retention
ITN Retention
Follow-up survey data
ITN Use
Percent of Sleeping Space Coverage
Follow-up survey data
Percent of Sleeping Spaces Covered Linear Regression
[ ] [ ]
Follow-up survey data
Percent of ITNs Hanging
Follow-up survey data
Percent of ITNs Hanging Linear Regression
[ ]
Follow-up survey data

30
Appendix D: Cost and Time Model Inputs Table 7. Cost and Time Savings Calculator Inputs
Inputs Number Units Note
Nets
HH per zonal distribution 198 households
Point distribution attendance rate 96% percent
Percentage HHs requiring mop-up visit 4% percent
Nets per household 2.7 nets
Self-installation rate 74% percent
Number of Nets to be Distributed 5,750,300 nets
% of Available ITNs to be distributed to rural
areas
75% percent
Distances
Distance multiplier 1.5
Streighline distance from clinic to community 5.3 km
Travel distance from clinic to community 7.9 km
Times
Time for introductions 5 minutes
Avg. travel time between HH 11.51 minutes
Burden of carrying nets (time multiplier) 1.25 multiplier
Time to hang one net. 10 minutes
Workday Length 8 hours
Point distribution publicity CHW 1 man days
Point distribution 8 hours
Survey time 5 minutes
Averate trip time fetching nets 1.79 hours
CHW
Number of CHWs allocated by UNDP 6,945 CHW
CHWs day per supervisor day 22 CHW days
CHWs per point distribution 4 CHWs
Average # of HHs to visit per day (D2D) 7 HHs
Compensation
CHW per diem 30 ZMW
CHW supervisor daily cost 650 ZMW
Driver DSA (UNDP) 350 ZMW/day
Fuel per day 150 ZMW/day
Transport costs
Average walking speed 5.00 km/hr
Average cycling speed 10.00 km/hr
Average speed carrying nets 8.00 km/hr
Average # of nets distributing per day 18 nets
Average net transport capacity 100 nets
Straightline average distance between point distribution and clinic was 5.3 kmˡ
Based on field observationsˡ
Accounts for time fetching nets
# of nets distributed per CHW per day (factoring in time for one trip to storage to fetch
nets)
ˠ Zambia Ministry of Health, United Nations Development Program (UNDP), Churches Health Association of Zambia (CHAZ). 2014. Towards Universal Coverage of Long-Lasting
Insecticidal Nets (LLINs) in Zambia: Operational Distribution Plan for the Year 2014.
ˡ Demand Driven Evaluations for Development (3DE). February, 2014. ITNs 6-Week Follow-up Survey Data.
ᶲ ERB increases fuel prices. 17 April 2014. http://www.postzambia.com/post-read_article.php?articleId=47819.
ᵊ Based on calculation of average self install rate from Hang‐up survey
UNDP transport allowance
UNDP allowance
UNDP allowance
Assumption
Avg cycling speed
Incorporating ITN carrying multiplier
Maximum # of nets a CHW can transport per trip (via bicycle)
Average households per zone in our evaluationˡ
Average nets per household was 2.7ˡ
Mean self-installation rate 10-17 days after distribution
4,810,300 from the UNDP ITN Operational planˠ. TWG goal was 8,998,200, with 5,750,300
committed at time of plan publication
60% of Zambia population is rural (2012 figure, data.worldbank.org). Assume full
coverage for rural area but only 50% coverage for urban areas.
Based on Distribution event attendanceˡ
Based on Distribution event attendanceˡ
Avg walking speed
Transport w/ ITNs & fetching ITNs from storage
Introducing self, entry permission, fetching hh head
Mean travel‐time walking from evaluation: 15.35.ˡ Speed calculated using average walking
and cycling speeds
Conservative estimate based on field observation
Based on field observationsˡ
Based on field observationsˡ
Basic data collection a component of all HH visits
UNDP ITN Operational planˠ. 50 nets a day / CHW and 14 days to completeˠ
Assumption
Distances are measured using GPS coordinates. This accounts for the indirectness of

31
Table 8. Cost Calculator Output
OutputsCost Calculations
D2D
Point w/immediate
hang-up
Point w/delayed
hang-up
Point with no
hang-up
Pre-registration survey time / zonal distribution
CHW time (days) 8.86 8.86 8.86 8.86
CHW cost (ZMW) 265.77 265.77 265.77 265.77
Supervisor time (days) 0.40 0.40 0.40 0.40
Supervisor cost (ZMW) 261.74 261.74 261.74 261.74
Supervisor transport cost (ZMW) 201.34 201.34 201.34 201.34
Point distribution publicity
CHW time (days) - 1.00 1.00 1.00
CHW cost (ZMW) - 30.00 30.00 30.00
Supervisor time (days) - 0.05 0.05 0.05
Supervisor cost (ZMW) - 29.55 29.55 29.55
Supervisor transport cost (ZMW) - 22.73 22.73 22.73
Point distribution
CHW time (days) - 4.00 4.00 4.00
CHW cost (ZMW) - 120.00 120.00 120.00 CHW time transporting nets for distribution
(days) - 1.07 1.07 1.07
CHW cost transporting nets for distribution
(ZMW) - 32.03 32.03 32.03
Supervisor time (days) - 0.23 0.23 0.23
Supervisor cost (ZMW) - 149.73 149.73 149.73
Supervisor transport cost (ZMW) - 115.18 115.18 115.18
HH visits / distributionᵛ
CHW HH time hanging (minutes) 5,337.00 5,337.00 1,545.60 0.00
CHW HH time hanging (days) 11.12 11.12 3.22 0.00
CHW HH cost hanging (ZMW) 333.56 333.56 96.60 0.00
CHW HH time non-hanging (minutes) 1,976.67 1,976.67 1,976.67 0.00
CHW HH time non-hanging (days) 4.12 4.12 4.12 0.00
CHW HH cost non-hanging (ZMW) 123.54 123.54 123.54 0.00
CHW transport between households (minutes) 2,844.55 2,298.39 2,298.39 0.00
CHW transport between households (days) 5.93 4.79 4.79 0.00
CHW transport between households (ZMW) 177.78 143.65 143.65 0.00
CHW transport fetching nets from storage
(minutes) 3,178.38 127.14 127.14 127.14
CHW transport fetching nets from storage
(days) 6.62 0.26 0.26 0.26
CHW transport fetching nets from storage
(ZMW) 198.65 7.95 7.95 7.95
CHW total cost (ZMW) 833.54 608.70 371.74 7.95
Total supervisor time (days) 1.26 0.92 0.56 0.01
Supervisor total transport cost (ZMW) 631.47 461.14 281.62 6.02
Supervisor total time cost (ZMW) 820.91 599.48 366.10 7.83
ᵛPoint distribution estimates include mop-up visits for households who did not attend the distribution
Distribution Methods

32
Cost Totals
Cost per ITNCHW costs / ITN (ZMW) 2.06 1.92 1.54 0.85
Supervisor time costs / ITN (ZMW) 2.03 1.95 1.51 0.84 Supervisor transport / ITN (ZMW) 1.56 1.50 1.16 0.65
Total cost / ITN (ZMW) 5.65 5.37 4.21 2.34
Total Cost Savings / ITN (ZMW) 1.44 3.31
Total Cost Savings / ITN (%) 25% 59%
Cost per HHTotal cost / HH (ZMW) 15.25 14.50 11.37 6.32
Total Cost Savings / HH (ZMW) 3.88 8.93
Total Cost Savings / HH (%) 25% 59%
Cost per Distribution AreaTotal cost / Area (ZMW) 3014.76 2865.35 2247.53 1249.86
Total Cost Savings / Area (ZMW) 767.24 1764.91
Total Cost Savings / Area (%) 25% 59%
Country-wide Distribution CostsTotal cost for rural areas (ZMW) 24,361,719.62 23,154,298.92 18,161,834.34 10,099,865.15
Total Cost Savings (ZMW) 6,199,885.28 14,261,854.48
Total Cost Savings (USD) 1,033,314.21 2,376,975.75Total Cost savings (%) 25% 59%
Distribution timeCHW days / distribution 36.64 35.22 27.32 15.19Supervisor days / distribution 1.67 1.60 1.24 0.69
Point distribution time saving percentage 25% 59%
33
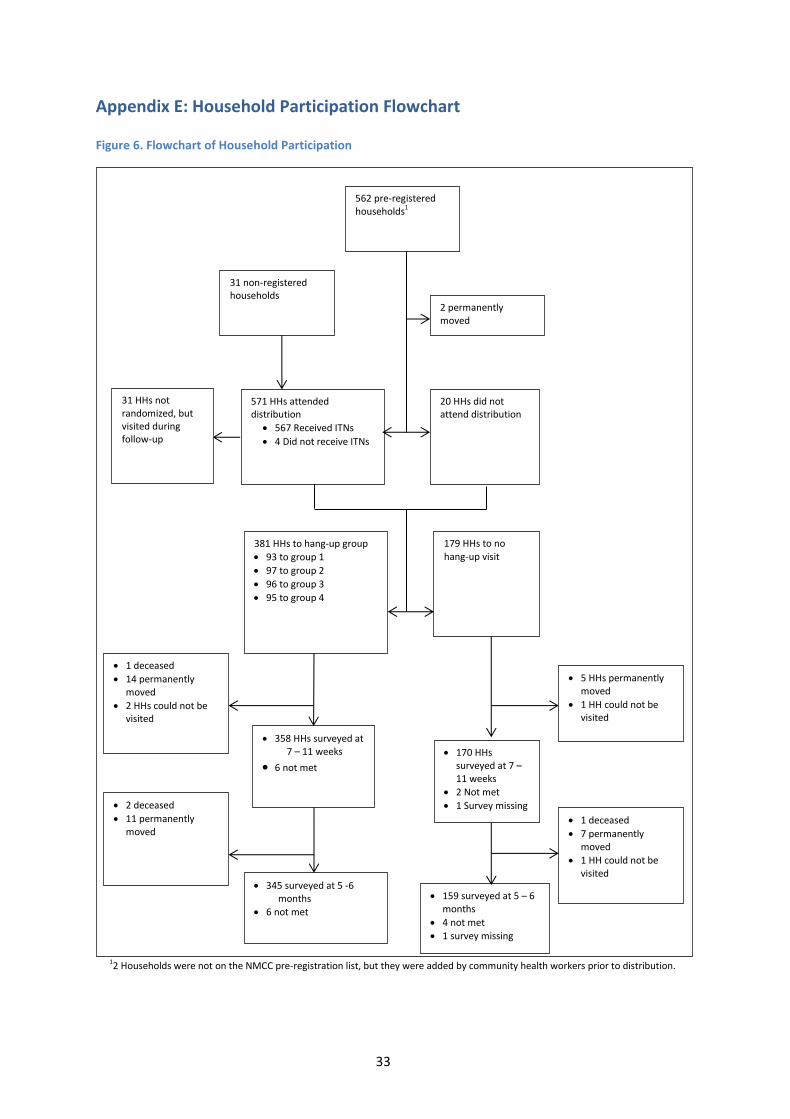
Appendix E: Household Participation Flowchart
Figure 6. Flowchart of Household Participation
562 pre-registered households1
31 non-registered households
2 permanently moved
571 HHs attended distribution
567 Received ITNs
4 Did not receive ITNs
20 HHs did not attend distribution
381 HHs to hang-up group
93 to group 1
97 to group 2
96 to group 3
95 to group 4
179 HHs to no hang-up visit
1 deceased
14 permanently moved
2 HHs could not be visited
5 HHs permanently moved
1 HH could not be visited
358 HHs surveyed at
7 – 11 weeks
6 not met 170 HHs
surveyed at 7 – 11 weeks
2 Not met
1 Survey missing 1 deceased
7 permanently moved
1 HH could not be visited
159 surveyed at 5 – 6
months
4 not met
1 survey missing
345 surveyed at 5 -6 months
6 not met
2 deceased
11 permanently moved
12 Households were not on the NMCC pre-registration list, but they were added by community health workers prior to distribution.
31 HHs not randomized, but visited during follow-up

34
Appendix F: Regression Tables Table 9. Full Quadratic Regression Results for ITN Self-Installation Rates
Covariate Coefficient Standard Error P-value [95% CI]
(Days since distribution)2 -0.004 0.00 < 0.01 [-0.01,-0.00]
Days since distribution 0.109 0.02 < 0.01 [0.08,0.14]
Household size 0.016 0.01 0.03 [0.00,0.03]
Distance to distribution site (km) -0.027 0.02 0.23 [-0.07,0.02]
Day of group
Day 1 of group Ref
Day 2 of group 0.032 0.05 0.53 [-0.07,0.13]
Day 3 of group -0.035 0.07 0.60 [-0.17,0.10]
Day 4 or more of group -0.306 0.12 0.01 [-0.54,-0.07]
Registering CHW
W.B. Ref
G.W.B. 0.03 0.09 0.74 [-0.15,0.21]
C.M. -0.056 0.09 0.54 [-0.24,0.12]
S.B. -0.035 0.09 0.69 [-0.21,0.14]
J.B. -0.005 0.09 0.95 [-0.17,0.16]
J.P. 0.085 0.08 0.31 [-0.08,0.25]
D.M. 0.106 0.08 0.20 [-0.05,0.27]
R.L. 0.308 0.09 < 0.01 [0.13,0.48]
F.N. 0.253 0.12 0.04 [0.01,0.49]
P.P. 0.019 0.09 0.83 [-0.16,0.20]
Y.M. 0.059 0.13 0.64 [-0.19,0.31]
N.M. 0.324 0.1 < 0.01 [0.13,0.52]
Method of receipt of ITNs
Received ITNs in mop-up Ref
Received ITNs at distribution -0.039 0.14 0.78 [-0.31,0.23]
_cons -0.082 0.09 0.37 [-0.26,0.10]
N = 345 - Missing values: ; 10 missing values for Distance btw HH and distribution site

35
Table 10. Full Model of Linear Regression Modeling the Effect of CHW Hang-up on Percent of Sleeping Spaces Covered
Covariates 7-11 Week Survey* 5-6 Month Survey^
Coefficient P-value [95% CI] Coefficient P-value [95% CI]
Hang-up Group
No Hang-up Visit Ref
Ref
Received Hang-up Visit 0.09 0.01 [0.03,0.16] 0.02 0.50 [-0.04,0.09] Distance to distribution site (km) 0.00 0.93 [-0.04,0.04] 0.01 0.37 [-0.02,0.04] Days between visit and distribution 0.00 0.19 [-0.01,0.00] 0.00 0.81 [-0.00,0.00]
Registering CHW
W.B. Ref
Ref
G.W.B. -0.10 0.13 [-0.23,0.03] -0.13 0.05 [-0.27,0.00]
C.M. -0.13 0.09 [-0.29,0.02] -0.08 0.33 [-0.23,0.08]
S.B. -0.25 < 0.01 [-0.39,-0.10] 0.01 0.87 [-0.12,0.14]
J.B. 0.13 0.03 [0.01,0.24] 0.04 0.57 [-0.09,0.16]
J.P. -0.01 0.88 [-0.13,0.11] -0.00 0.94 [-0.13,0.12]
D.M. -0.02 0.74 [-0.15,0.10] -0.07 0.27 [-0.21,0.06]
R.L. -0.11 0.16 [-0.27,0.05] -0.09 0.25 [-0.24,0.06]
F.N. -0.01 0.91 [-0.21,0.18] 0.02 0.75 [-0.13,0.18]
P.P. 0.14 < 0.01 [0.04,0.23] 0.13 < 0.01 [0.04,0.21]
Y.M. 0.11 0.08 [-0.01,0.24] -0.03 0.74 [-0.24,0.17]
N.M. -0.02 0.84 [-0.16,0.13] 0.07 0.26 [-0.05,0.18]
Household size 0.01 < 0.01 [0.00,0.02] 0.02 < 0.01 [0.01,0.03]
_cons 0.86 < 0.01 [0.49,1.23] 0.66 < 0.01 [0.54,0.80]
*7-11 week survey - N = 516; Missing values in 7-11 week survey were: Household size: 3; Days since distribution: 8
^5-6 month survey - N = 501; Missing values in 5-6 month survey were: Household size: 2; Distance btw HH and distribution site: 1
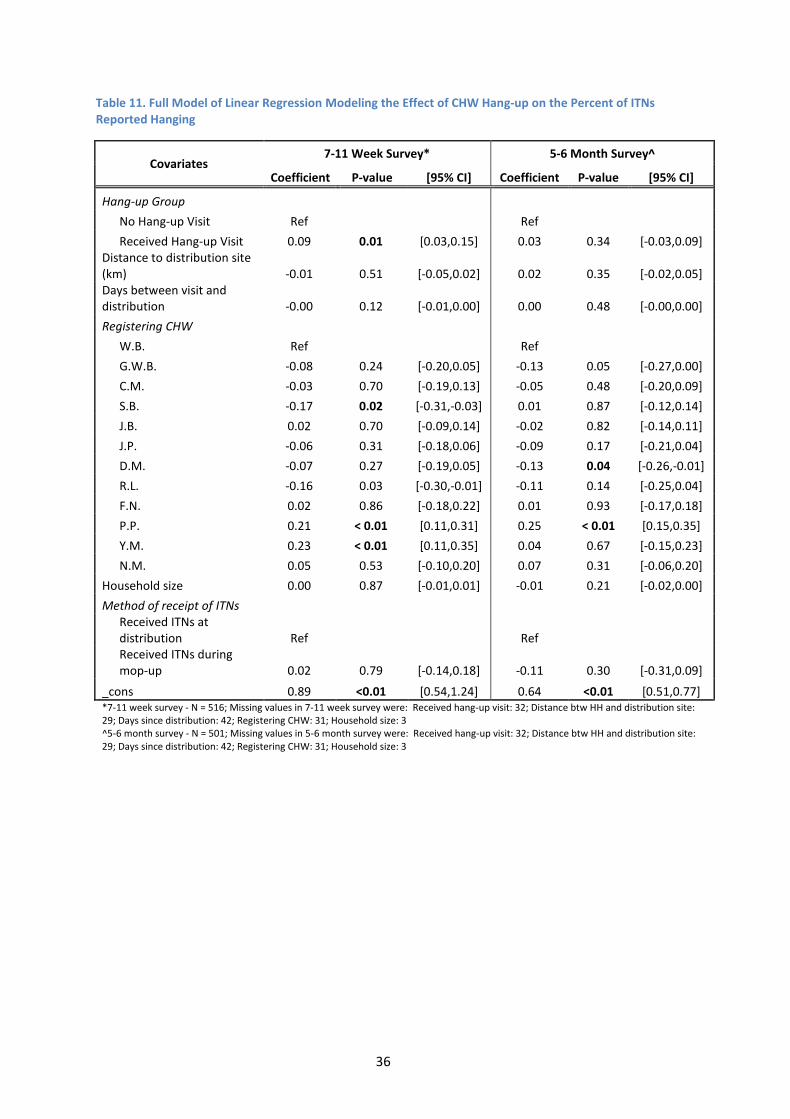
36
Table 11. Full Model of Linear Regression Modeling the Effect of CHW Hang-up on the Percent of ITNs Reported Hanging
Covariates 7-11 Week Survey* 5-6 Month Survey^
Coefficient P-value [95% CI] Coefficient P-value [95% CI]
Hang-up Group
No Hang-up Visit Ref
Ref
Received Hang-up Visit 0.09 0.01 [0.03,0.15] 0.03 0.34 [-0.03,0.09] Distance to distribution site (km) -0.01 0.51 [-0.05,0.02] 0.02 0.35 [-0.02,0.05] Days between visit and distribution -0.00 0.12 [-0.01,0.00] 0.00 0.48 [-0.00,0.00]
Registering CHW
W.B. Ref
Ref
G.W.B. -0.08 0.24 [-0.20,0.05] -0.13 0.05 [-0.27,0.00]
C.M. -0.03 0.70 [-0.19,0.13] -0.05 0.48 [-0.20,0.09]
S.B. -0.17 0.02 [-0.31,-0.03] 0.01 0.87 [-0.12,0.14]
J.B. 0.02 0.70 [-0.09,0.14] -0.02 0.82 [-0.14,0.11]
J.P. -0.06 0.31 [-0.18,0.06] -0.09 0.17 [-0.21,0.04]
D.M. -0.07 0.27 [-0.19,0.05] -0.13 0.04 [-0.26,-0.01]
R.L. -0.16 0.03 [-0.30,-0.01] -0.11 0.14 [-0.25,0.04]
F.N. 0.02 0.86 [-0.18,0.22] 0.01 0.93 [-0.17,0.18]
P.P. 0.21 < 0.01 [0.11,0.31] 0.25 < 0.01 [0.15,0.35]
Y.M. 0.23 < 0.01 [0.11,0.35] 0.04 0.67 [-0.15,0.23]
N.M. 0.05 0.53 [-0.10,0.20] 0.07 0.31 [-0.06,0.20]
Household size 0.00 0.87 [-0.01,0.01] -0.01 0.21 [-0.02,0.00]
Method of receipt of ITNs
Received ITNs at distribution Ref
Ref
Received ITNs during mop-up 0.02 0.79 [-0.14,0.18] -0.11 0.30 [-0.31,0.09]
_cons 0.89 <0.01 [0.54,1.24] 0.64 <0.01 [0.51,0.77] *7-11 week survey - N = 516; Missing values in 7-11 week survey were: Received hang-up visit: 32; Distance btw HH and distribution site: 29; Days since distribution: 42; Registering CHW: 31; Household size: 3 ^5-6 month survey - N = 501; Missing values in 5-6 month survey were: Received hang-up visit: 32; Distance btw HH and distribution site: 29; Days since distribution: 42; Registering CHW: 31; Household size: 3

37
Appendix G: Sensitivity Analysis For both outcomes of percent of sleeping spaces covered and percent of ITNs hanging in a household, a bounds analysis for attrition was performed for each survey by running a linear regression using two assumptions about un-surveyed households (a lower bound estimate assuming 0% of sleeping spaces covered in un-surveyed households and an upper bound estimate assuming 100% of the sleeping spaces covered in un-surveyed households). For both surveys the significance of the outcome does not change. Table 12. Attrition Analysis for Linear Regression Modeling the Effect of a CHW Hang-up Visit on the Percent of Sleeping Spaces Covered
Follow-up Period 7-11 Week Survey 5-6 Month Survey
Attrition Assumptions % Diff P-
value [95% CI] % Diff P-
value [95% CI]
Marginal percentage point increase for Hang-up vs. No Hang-up
Assuming 0% sleeping spaces covered in un-surveyed households
8.88% < 0.01 [-2.45%, 15.31%] 1.42% 0.67 [-5.18% ,8.02%]
% Change 13.20% 1.82%
Assuming 100% sleeping spaces covered in un-surveyed households
9.04% < 0.01 [2.56%, 15.52%] 2.40% 0.46 [-3.95%,8.75%]
% Change 13.3% 3.03%

38
Table 13. Attrition Analysis for Linear Regression Modeling the Effect of a CHW Hang-up Visit on the Percent of ITNs Reported Hanging
Follow-up Period 7-11 Week Survey 5-6 Month Survey
Attrition Assumptions % Diff P-value [95% CI] % Diff P-
value [95% CI]
Marginal percentage point increase for Hang-up vs. No Hang-up
Assuming 0% ITNs hanging in un-surveyed households
8.74% <0.01 [2.50%, 14.99%] 2.36% 0.46 [-3.87%,8.59%]
% Change 14.76% 3.92%
Assuming 100% ITNs hanging in un-surveyed households
8.73% <0.01 [2.45%, 15.02%] 3.29% 0.29 [-2.81%,9.40%]
% Change 14.55% 5.35%

39
Appendix H: Study Limitations Context This study was conducted in rural Rufunsa district and, therefore, did not explore the effectiveness or limitations of community point distribution in the urban or peri-urban setting. Many of the cost and time-effectiveness advantages of community-point distribution are hypothesized to accrue primarily in rural areas, where the burden of door-to-door distribution on CHWs is assumed to be greatest due to the vast distances and sparse populations. In this regard, the sparse village configuration in Rufunsa may have particularly lent itself to the advantages of community point distribution. Finally, meaningful malaria sensitization activities (including radio messages) had been conducted in Rufunsa prior to the evaluation. Community point distribution dynamics may differ if conducted in areas with less prior knowledge about malaria and ITNs. Indirect Comparison to Door-to-door Distribution This study only measured the dynamics of community point distribution and did not directly compare community point distribution to door-to-door distribution; this would have required randomization at the community level which has high costs. Furthermore, the direct comparison was deemed unnecessary given the recent evaluation of the door-to-door distribution method in Zambia in 2011. Instead, the purpose of the study focused on 1) comparing ITN retention and use rates to those found in the 2011 door-to-door distribution study and 2) gauging self-installation rates in the two weeks following ITN distribution to predict the cost savings associated with delayed
CHW hang-up. Definition of Use Given the obvious difficulty of monitoring actual ITN use at night, this study defines use as ITNs hanging in the household at the time of the survey. This may be a more conservative proxy than self-reported “use” at night, as many respondents are aware that they should use the ITNs and are likely to give the “correct” answer to surveyors. While some ITNs that are hanging may not actually be used at night, we also encountered respondents who reported using ITNs at night then taking down ITNs during the day in order to free up space in the home. Use estimates under different assumptions for ITNs not directly observed were calculated to provide bounds on the main estimate (see discussion of attrition above, as well as the results section). Spillover effects Because randomization occurred at the household level and not the village level, there is a possibility that self-installation rates could be artificially high due to households observing CHW visits to other nearby households. This might imply that CHW visits are pre-requisites for replicating the achieved self-installation rates at scale. Similarly, retention and spaces covered could be affected by households hearing or seeing surveyors in the area and wanting to exhibit the correct behavior. While this is a possibility, distances between households were generally so great (~15 minute walk from each other) that these effects are not a major concern for this study. Follow-up Length The first follow-up period at which ITN retention and use were measured was 7-11 weeks following the distribution. This corresponded to the end of January and most of February—a rainy period in which malaria transmission is high— which may affect the rates of ITN retention and use and the comparison between this survey and the 5-6 month follow-up survey. A one-year survey, done in the rainy season a year following the distribution, would be most informative at gauging long-term ITN retention and use.

40
Appendix I: Model Sensitivities Table 14. Percent Savings of a Community Point Distribution with Delayed CHW ITN Hang-Up versus a Door-to-Door Distribution
Nu
mb
er o
f h
ou
seh
old
s in
co
mm
un
ity
400 15% 18% 22% 26% 29% 33% 37% 42% 46% 51%
350 13% 17% 21% 24% 28% 33% 36% 41% 46% 51%
300 12% 15% 19% 23% 27% 31% 35% 39% 44% 49%
250 9% 13% 17% 21% 25% 29% 34% 38% 43% 48%
200 6% 10% 14% 18% 21% 26% 31% 36% 41% 46%
150 0% 4% 8% 13% 17% 22% 27% 31% 36% 42%
100 -12% -7% -3% 2% 7% 13% 18% 24% 30% 37%
50 -47% -42% -36% -30% -23% -16% -9% -1% 7% 15%
2 4 6 8 10 12 14 16 18 20
Straight-Line Distance to the Community from the Clinic (km)