measuring coral calcification under considerations for the ... · calcification dynamics sink m...
TRANSCRIPT

Submitted 24 May 2017Accepted 8 August 2017Published 1 September 2017
Corresponding authorStephanie Cohen,[email protected]
Academic editorFederica Ragazzola
Additional Information andDeclarations can be found onpage 16
DOI 10.7717/peerj.3749
Copyright2017 Cohen et al.
Distributed underCreative Commons CC-BY 4.0
OPEN ACCESS
Measuring coral calcification underocean acidification: methodologicalconsiderations for the 45Ca-uptake andtotal alkalinity anomaly techniqueStephanie Cohen1,2,3, Thomas Krueger3 and Maoz Fine1,2
1The Interuniversity Institute for Marine Science, Eilat, Israel2The Mina & Everard Goodman Faculty of Life Sciences, Bar-Ilan University, Ramat Gan, Israel3 Laboratory for Biological Geochemistry, School of Architecture, Civil and Environmental Engineering,École Polytechnique Federale de Lausanne, Lausanne, Switzerland
ABSTRACTAs the oceans become less alkaline due to rising CO2 levels, deleterious consequencesare expected for calcifying corals. Predicting how coral calcification will be affectedby on-going ocean acidification (OA) requires an accurate assessment of CaCO3deposition and an understanding of the relative importance that decreasing calcificationand/or increasing dissolution play for the overall calcification budget of individualcorals. Here, we assessed the compatibility of the 45Ca-uptake and total alkalinity (TA)anomaly techniques as measures of gross and net calcification (GC, NC), respectively,to determine coral calcification at pHT 8.1 and 7.5. Considering the differing bufferingcapacity of seawater at both pH values, we were also interested in how strongly coralcalcification alters the seawater carbonate chemistry under prolonged incubationin sealed chambers, potentially interfering with physiological functioning. Our dataindicate that NC estimates by TA are erroneously ∼5% and ∼21% higher than GCestimates from 45Ca for ambient and reduced pH, respectively. Considering alsoprevious data, we show that the consistent discrepancy between both techniques acrossstudies is not constant, but largely depends on the absolute value of CaCO3 deposition.Deriving rates of coral dissolution from the difference between NC and GC was notpossible and we advocate a more direct approach for the future by simultaneouslymeasuring skeletal calcium influx and efflux. Substantial changes in carbonate systemparameters for incubation times beyond two hours in our experiment demonstrate thenecessity to test and optimize experimental incubation setups when measuring coralcalcification in closed systems, especially under OA conditions.
Subjects Ecology, Marine BiologyKeywords Gross calcification, Net calcification, Coral dissolution, Biomineralisation, Coral reefs
INTRODUCTIONContinual increases in atmospheric CO2-concentration has led to measurable changesin the carbonate chemistry of the oceanic system, summarized under the term oceanacidification (OA; Kleypas et al., 2006). These changes involve an increase in total dissolvedinorganic carbon (DIC) and a shift in the carbon equilibrium towards CO2, which lead to
How to cite this article Cohen et al. (2017), Measuring coral calcification under ocean acidification: methodological considerations forthe 45Ca-uptake and total alkalinity anomaly technique. PeerJ 5:e3749; DOI 10.7717/peerj.3749

a reduction in overall aragonite saturation state (�arag) and pH (Kleypas et al., 1999; Zeebe& Wolf-Gladrow, 2001). Current worst case climate models project a further decrease ofsurface seawater pH by 0.3−0.4 pH units until the end of the 21st century (IPCC, 2013).These continuing shifts in seawater pH and aragonite saturation state affect many marineorganisms that form biogenic aragonite; the modern day form of calcium carbonate inscleractinian reef-building corals (Anthony et al., 2008; McCulloch et al., 2012; Orr et al.,2005; Ries, Cohen & McCorkle, 2009).
Coral calcification is the fundamental biological process that provides the physicalthree-dimensional platform for the existence of coral reef communities.However, depositedskeleton in a reef is subject to various forms of physical, chemical and biologically-mediatederosion, which causes the dissolution of reef sediments and skeleton. This dissolution ispart of the natural turnover of matter in the reef community and can offset 20–30%of reef calcification (Barnes, 1988; Silverman, Lazar & Erez, 2007). It is widely acceptedthat OA will increase overall calcium carbonate dissolution of coral reef communities(e.g., Andersson, Mackenzie & Gattuso, 2011; Eyre, Andersson & Cyronak, 2014; Silvermanet al., 2009). With scleractinian corals as major reef builders, a large body of research hasthus been dedicated to the performance of individual coral species under varying degreesof OA. While studies generally demonstrate a decline in net calcification (NC) to varyingdegrees, a few show also insensitivity of some species to OA conditions (reviewed in TableS1; Chan & Connolly, 2013). The variety in the calcification-dependent growth response tolow seawater pH may reflect the true variability/plasticity in the ability of some corals tomaintain calcification rates over a broad range of seawater �arag (McCulloch et al., 2012).On the other hand, there is also a high degree of methodological variation in design, choiceof pH lowering agents, interaction of one or multiple environmental factors along withpH (e.g., temperature, light), animal acclimation period, experimental incubation period,and employed techniques to determine calcification rates that contribute to the observedvariability. Recognizing the fundamental impact that OA has on calcifying organisms, thereis now a renewed interest for calcification studies of corals.
While the occurrence of net dissolution under OA conditions and during the night hasbeen observed for some species (cf. Table S1), the contribution of skeleton dissolution(gross dissolution; GD) to changes in NC remains unknown. Commonly, it is assumed thatchanges of NC can be the result of a decrease in gross calcification (GC, the calcification ratebefore any deductions for dissolution), increased GD, or a combination of both followingthe equation NC = GC-GD (Fig. 1; Andersson & Mackenzie, 2012; Comeau et al., 2014;Langdon, Gattuso & Andersson, 2010). However, this conceptual relationship has neverbeen experimentally validated to see to what extent it is possible to quantify dissolutionfrom measurements of NC and GC.
The most common methods that are widely used to measure NC in living corals are the‘‘buoyant weight’’ and ‘‘total alkalinity’’ technique (Table 1; Langdon, Gattuso & Andersson,2010). While the total alkalinity (TA) anomaly technique is based on tracking changes inTA in the incubationmedium (Chisholm & Gattuso, 1991; Smith & Key, 1975), the buoyantweight (BW) technique is a direct measure of colony growth via repeated determinations
Cohen et al. (2017), PeerJ, DOI 10.7717/peerj.3749 2/21

calcification dynamics sink
metabolic DIC
Ca2+
seawater DIC
CaCO3 skeleton
source
net dissolution
net calcification
gross
calcification
gross
dissolution
alkalinity or
complexometric
titration; buoyant
weight
isotopic or visual
skeletal labelling
(short time periods)
Figure 1 Conceptual framework of calcification in isolated coral colonies. The specific calcification ratethat determines the transition of calcium carbonate from its source to its sink is affected by the opposingeffects of the biologically determined gross calcification rate and the dissolution rate. Depending on theirrespective magnitudes, the coral experiences net calcification or net dissolution of skeletal material. Quan-tifying net calcification in corals is commonly achieved by monitoring the change in source (via forms oftitration) or sink (e.g., buoyant weight) material. When assessed over short time periods, where gross dis-solution is negligible/not detectable, sensitive methods that can detect incorporated labels provide an es-timate for gross calcification. Note that changes in skeletal density and porosity under low pH might altergross calcification without involving processes of dissolution.
of overall weight (Jokiel & Maragos, 1978). The TA is measured by acidimetric titrationof the total inorganic carbon in the seawater sample. From the TA equation one caninfer the calcification and dissolution of CaCO3: precipitation of 1 mole CaCO3 leads toa 2 moles decrease in TA, whereas dissolution causes the reverse effect (Wolf-Gladrowet al., 2007). While these two methods are generally considered to give estimates of NCand provide comparable calcification rates (Schoepf et al., 2017), the only method likelyto provide measurements of gross calcification (GC) over short incubation periods is the45Ca-labelling technique. GC is commonly determined by direct incorporation of the radio-isotope 45Ca into the skeleton using fully covered microcolonies (Goreau, 1959; Goreau &Goreau, 1960; Tambutté et al., 1995). The procedure involves incubation in 45Ca-labeledseawater, dissolving the skeleton in acid and measuring the incorporated radioactivity witha liquid scintillation counter. The TA and 45Ca techniques are the only ones consideredto have sufficient resolution to detect small changes in calcification (Chisholm & Gattuso,1991; Langdon, Gattuso & Andersson, 2010) and to our knowledge, Smith and Roth (inSmith & Kinsey, 1978) and Tambutté et al. (1995) are the only studies to date to provide adirect comparison of the TA and 45Ca techniques for corals under ambient pH conditions.The accurateness and compatibility of both methods for incubations under reduced pHconditions has not yet been experimentally tested.
In the present study, the 45Ca and TA anomaly technique for estimating NC and GC,respectively, were compared on long-term acclimated (16 months) Stylophora pistillatamicrocolonies under ambient and reduced pH in order to test their compatibility in
Cohen et al. (2017), PeerJ, DOI 10.7717/peerj.3749 3/21

Table 1 Methods for measuring calcification in tropical corals.Overview of the most common methodsand their employed acclimation and incubation times for measuring OA effects on calcification in tropi-cal hermatypic corals. The detailed summary for each species and its approximate change in calcificationis provided in Table S1. The number of studies using the mentioned acclimation and incubation time pe-riods is given in brackets. Note that this number might not add up to the given total number, since somestudies might have used different acclimation times when performing multiple experiments or involvingdifferent species. BW, buoyant weight; TA, total alkalinity.
Method No. of species No. of studies Acclimation timea Incubation time
BW 32 26 <1 month (10) –1–2 month (13) –3–12 month (5) –>1 year (2) –
TA 17 13 No acclimation (5; 2b) <2.5 h (7)Several hours (2) 3–7 h (3)<1 month (4) >12 h (2)1–2 months (2)
Ca isotopes 1 3 No acclimation (1) 3–7 h (2; 45Ca)1–2 months (2 ) >12 h (1; 43Cac)
Other methodsc 3 5 No acclimation (2; 1b) 1–2 months (2)>1 year (3) >1 year (1)
Notes.aTime required for acclimation and incubation time were summed up for coral calcification measured via BW.bCorals were already naturally exposed to low pH conditions.ce.g., lateral and cross-sectional growth, linear extension, skeletal density.
providing consistent calcification estimates even in the context of OA research. Since TAcalcification measurements are commonly combined with respiration measurements usingclosed (sealed) vessels, it was furthermore tested to what degree incubation time affectsthe stability of carbonate system parameters and the calcification rates, because especiallyat reduced pH, biological processes might amplify changes in these parameters due to thereduced buffering capacity of seawater.
MATERIALS AND PROCEDURESCoral preparation and acclimation to pH treatmentStylophora pistillata was collected by scuba diving from a depth of 4–8 m near theInteruniversity Institute for Marine Sciences (IUI) in the Red Sea, Eilat, Israel (29◦30′N34◦55′E), in an area supervised by the Israel Nature and Parks Authority. Only a singlecolony was used for the calcification measurements in order to remove the effect of geneticvariability for the tested treatments. The colony was fragmented into 36 fragments andthese were suspended on nylon threads in flow-through water tables supplied with naturalseawater under a constant temperature of 25 ± 0.5 ◦C, regulated by an array of 300 WBluClima aquarium heaters (Ferplast Spa, Vicenza, Italy) in an air-conditioned room.This setting allowed the tissue to grow over the exposed skeleton, creating microcolonies(definition sensu Almoghrabi, Allemand & Jaubert, 1993). All pieces were checked to be freeof boring organisms. Light was provided by ametal halide lamp (14,000 K, 400W/D, OsramGmBH, Germany) and photosynthetically active radiation (PAR) measured as∼170 µmol
Cohen et al. (2017), PeerJ, DOI 10.7717/peerj.3749 4/21

Table 2 Seawater carbonate chemistry in both pH treatments over the 16 months acclimation period. TA and pH were measured, while the in-organic carbon speciation and aragonite saturation state (�arag) were calculated using the software CO2SYS version 1.03 (Lewis, Wallace & Allison,1998; Pierrot, Lewis & Wallace, 2006). Values are means± SD (N = 5).
pHT TA(µeq kg−1)
DIC(µmol kg−1)
pCO2
(µatm)CO2(aq)
(µmol kg−1)HCO−
3(µmol kg−1)
CO2−3
(µmol kg−1)�arag
8.08± 0.03 2,496± 9 2,120± 26 396± 39 10.9± 1.1 1,846± 40 263± 15 3.96± 0.237.46± 0.04 2,494± 11 2,436± 23 2,057± 211 56.4± 5.8 2,301± 23 79± 6 1.19± 0.10
photons m−2 s−1 (10 h L:14 h D photoperiod; quantum irradiance meter LiCor, Lincoln,Nebraska, USA). Microcolonies were either exposed to present day ambient pHT 8.1 (pHin total scale; 8.08 ± 0.03; pCO2 = 396 µatm) or pHT 7.5 (7.46 ± 0.04; pCO2 = 2,057µatm; Table 2), which corresponds to a predicted pCO2 level for 2,300 with �arag close to1 (Caldeira & Wickett, 2005) and was chosen to provoke some degree of coral dissolution.The microcolonies were maintained under these conditions for over 16 months (thus,relative to most other studies acclimation time was very long, cf. Table 1; Table S1). pHwas tightly regulated and monitored over the acclimation period (see below). Corals werefed each week with freshly hatched Artemia sp. nauplii and a mixture of crushed fish.
Control of seawater pCO2Seawater was pumped from a depth of 30 m into 1,000 L tanks, where the pH wasmanipulated to reach a fixed value. The incoming seawater presented a very stablechemistry during the whole experiment period: salinity of 40 ± 0.2h, pHT of 8.09 ±0.02, total alkalinity of 2,505± 0 µeq kg−1, as reported by the Israel National MonitoringProgram (NMP) of the Gulf of Eilat (NMP, 2016). A pH electrode (S-200C, Sensorex,CA, USA) located in each water table was connected to a pH controller (Aquastar, IKSComputerSysteme GmbH, Karlsbad, Germany), monitoring the pH (software Timo,Matuta, Germany) and adjusting the bubbling of CO2 (from a CO2 cylinder) accordingly.Well-mixed water from each tank flowed continuously into the corresponding section(150 L) of the water table and pH was monitored daily. Seawater samples from the watertables were taken five times over the acclimation period to monitor TA (TA was stable with2,494 ± 11 and 2,496 ± 9 µeq kg−1 for pHT 7.5 and 8.1, respectively; Table 2).
Incubation procedure for measurements of calcificationAfter 16 months of pH acclimation in water tables, microcolonies (2.5–3.0 cm in length,N = 6 per treatment and time point) were incubated in sealed (no gas exchange; noheadspace) incubation vessels (40 mL Septa vials with additional paraffin wrap, clearborosilicate glass; 2.5 ×10 cm; Thomas Scientific, Inc, Swedesboro, NJ, USA) containing∼40 mL filtered seawater (FSW; 0.45 µm) at the two pH levels for 2 h, 4 h, and 6 h.Temperature and light intensity during the incubation were similar to those providedduring the preceding 16 months of acclimation (see above), while an orbital shakerprovided constant water motion. Applicability of the shaker in contrast to conventionallyused stir bars was tested in a preliminary experiment (Fig. S1). Prior to the incubation,the colony surface and attached nylon strings were carefully cleaned of epiphytes and
Cohen et al. (2017), PeerJ, DOI 10.7717/peerj.3749 5/21
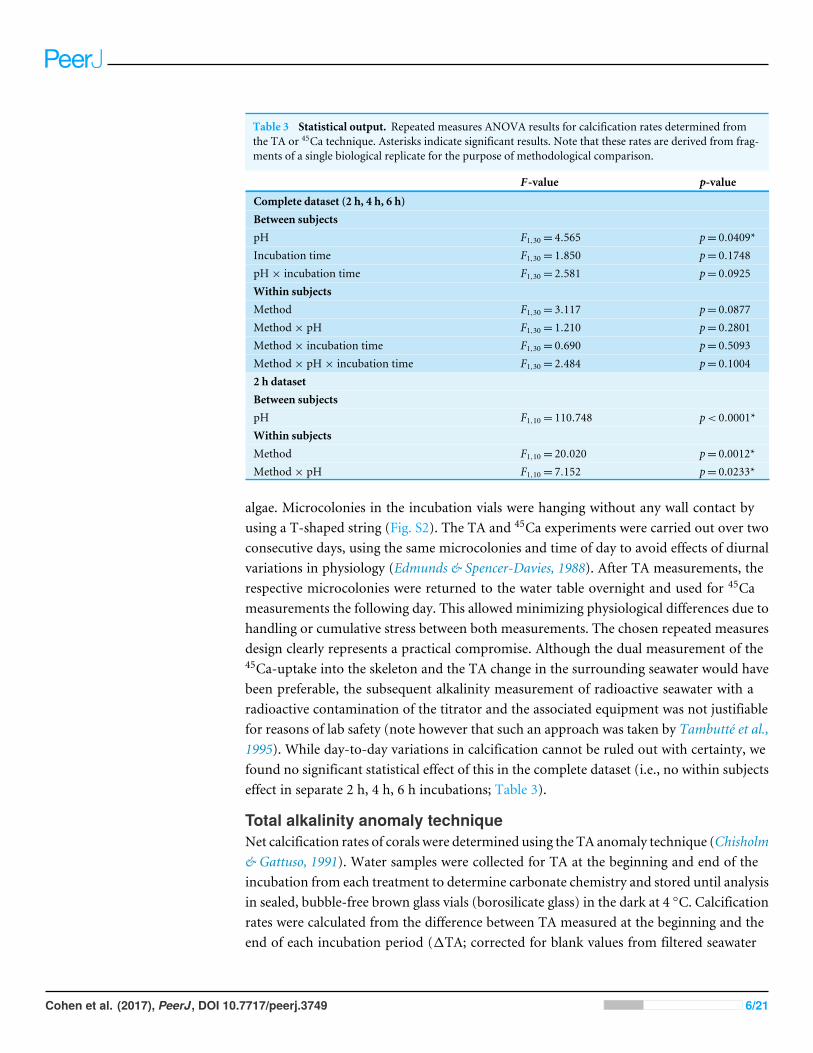
Table 3 Statistical output. Repeated measures ANOVA results for calcification rates determined fromthe TA or 45Ca technique. Asterisks indicate significant results. Note that these rates are derived from frag-ments of a single biological replicate for the purpose of methodological comparison.
F -value p-value
Complete dataset (2 h, 4 h, 6 h)Between subjectspH F1,30= 4.565 p= 0.0409*Incubation time F1,30= 1.850 p= 0.1748pH× incubation time F1,30= 2.581 p= 0.0925Within subjectsMethod F1,30= 3.117 p= 0.0877Method× pH F1,30= 1.210 p= 0.2801Method× incubation time F1,30= 0.690 p= 0.5093Method× pH× incubation time F1,30= 2.484 p= 0.10042 h datasetBetween subjectspH F1,10= 110.748 p< 0.0001*Within subjectsMethod F1,10= 20.020 p= 0.0012*Method× pH F1,10= 7.152 p= 0.0233*
algae. Microcolonies in the incubation vials were hanging without any wall contact byusing a T-shaped string (Fig. S2). The TA and 45Ca experiments were carried out over twoconsecutive days, using the same microcolonies and time of day to avoid effects of diurnalvariations in physiology (Edmunds & Spencer-Davies, 1988). After TA measurements, therespective microcolonies were returned to the water table overnight and used for 45Cameasurements the following day. This allowed minimizing physiological differences due tohandling or cumulative stress between both measurements. The chosen repeated measuresdesign clearly represents a practical compromise. Although the dual measurement of the45Ca-uptake into the skeleton and the TA change in the surrounding seawater would havebeen preferable, the subsequent alkalinity measurement of radioactive seawater with aradioactive contamination of the titrator and the associated equipment was not justifiablefor reasons of lab safety (note however that such an approach was taken by Tambutté et al.,1995). While day-to-day variations in calcification cannot be ruled out with certainty, wefound no significant statistical effect of this in the complete dataset (i.e., no within subjectseffect in separate 2 h, 4 h, 6 h incubations; Table 3).
Total alkalinity anomaly techniqueNet calcification rates of corals were determined using the TA anomaly technique (Chisholm& Gattuso, 1991). Water samples were collected for TA at the beginning and end of theincubation from each treatment to determine carbonate chemistry and stored until analysisin sealed, bubble-free brown glass vials (borosilicate glass) in the dark at 4 ◦C. Calcificationrates were calculated from the difference between TA measured at the beginning and theend of each incubation period (1TA; corrected for blank values from filtered seawater
Cohen et al. (2017), PeerJ, DOI 10.7717/peerj.3749 6/21
only incubations with N = 3), according to the equation by Schneider & Erez (2006). Rateswere normalized to skeleton dry weight:
Calcification(µmol CaCO3 h−1 g−1 dry skeleton
)=
1TA2 ×(Vvessel−Vcoral)×1,000×1.028
W×T1TA (in meq kg−1); Vvessel is the volume of the experimental vessel (in mL); Vcoral is thedisplacement volume of the coral (in mL); 1.028 is the density of seawater in the northernGulf of Eilat (in g mL−1); W is skeleton dry weight (in g) and T is the incubation duration(in hours).
45Ca techniqueMeasurements of GC were based on the improved 45Ca protocol (Tambutté et al., 1995).Microcolonies were placed in filtered seawater (FSW; 0.45 µm) with a total activity of360 kBq (as 45CaCl2, 1958.18 MBq mL−1, Perkin-Elmer Life and Analytical Sciences).Dead microcolonies, killed with 2% formaldehyde, were included in the experiment as acontrol for isotopic exchange (Al-Horani et al., 2005) and three incubation vessels wereleft without microcolonies to serve as a seawater-only control. To determine the specificactivity, 100 µL aliquots were taken at the beginning and end of each incubation period.Following the labelling period, specimens were immersed in 600 mL FSW for 1 min, andthen rinsed (5 ×1 min) with 10 mL of ice-cold glycine-high calcium medium (50 mMCaCl2, 950 mM Glycine, pH 8.2). Labelled specimens were then incubated for 30 minin vessels containing 20 mL of FSW. Water motion was provided by a shaker. Followingefflux incubation, microcolony tissue was removed using 2 M NaOH for 20 min at 90 ◦C.Following tissue hydrolysis, the skeleton was first rinsed with 1 mL NaOH (Houlbrèque,Tambutté & Ferrier-Pagès, 2003), then thoroughly rinsed with FSW, followed by doubledistilled water. The solution from the first rinse was added to the tissue hydrolysate, whilethe remaining rinsing solutions were discarded. Finally, skeletons were dried at 70 ◦C,weighed, and subsequently dissolved in 12 M HCl. Samples (500 µL) of skeleton digest ortissue hydrolysate were added to 10 mL Ultima Gold AB (PerkinElmer) scintillation liquidand measured on a scintillation counter (Tri-carb 1600TR, Packard). Sample count rates(CPM, total counts per minute) were obtained several times over two days and the averagedifference between readings was 0.8 ± 0.54%. Total calcification was then calculated fromthe activity recorded in the skeleton digest and seawater control samples and normalizedas µmol CaCO3 per skeleton dry weight using the formula:
Calcification(µmol CaCO3 h−1 g−1 dry skeleton
)=
(Activitysample×
1.17Activityseawater
)W×T
where Activitysample is the total counts per minute (CPM) in the dissolved skeleton sample;Activityseawater is the total CPM in 100 µL seawater sample (control); 1.17 is the amount ofCa2+ in 100 µL ambient seawater (in µmol); W is skeleton dry weight (in g) and T is theincubation duration (in hours). The amount of 45Ca uptake by dead specimens (coveredwith tissue) was subtracted from the amount measured in intact (live) specimens.
Cohen et al. (2017), PeerJ, DOI 10.7717/peerj.3749 7/21

Calculation of seawater carbonate systemValue of TA of accurately weighed seawater samples (12.3 g) were measured to the secondend point (Almgren, Dyrssen & Fonselius, 1983) using an automatic potentiometric titration(Mettler-Toledo GmbH, DL67 titrator; resolution of burette volume: 1/5,000). The TAwas determined in triplicate and computed using the Gran equation (DOE, 1994) with pHvalues lower than 3.9 for creating theGran plot. Accuracy of TA analysis was checked againstcertified seawater reference material prepared by Andrew Dickson (Scripps Institution ofOceanography). The differences between triplicate samples were less than 6 µeq kg−1. ThepH electrodes (Mettler-Toledo DG-111–SC; Stockholm, Sweden) were calibrated dailybefore using the titrator (the manufacturer’s technical specifications are±0.03 pH for bothprecision and accuracy). The acid concentration was 0.049 N HCl (JT Baker, Phillipsburg,NJ). In the series of experiments that compared gross and net calcification, a new titratorwas utilized: a Metrohm 862 compact Titrosampler that uses at least 35 g seawater samples(autosampler combined with titrator; potentiometric measuring accuracy of ±0.003 withresolution of 0.001; resolution of burette volume: 1/10,000). Hence, experimental samplescontaining only 40 mL, were diluted by a factor of three (to have enough water for triplicatemeasurements of TA) and the acid concentration was set to 0.025 M. TA was calculatedusing the first derivative of the curve for the evaluation of the exact end point. Prior tomeasurements, water samples were filtered (0.22 µm EMDMillipore Millex sterile syringefilters). Water samples for analysis were stored in darkness at 4 ◦C in brown glass bottles,filled up to the top with a gas tight screw, and processed within two weeks of collection.
pH measurements were carried out using a CyberScan pH meter (pH/Ion 510 EutechInstruments with automatic temperature compensation) and CyberScan gel-filled pHcombination electrode. Prior to experiments, the pH electrode was calibrated againstNational Bureau of Standards (NBS) scale buffers of 4.01, 7.00 and 10.00 (Mettler Toledo)at 25 ◦C andwas soaked in seawater for at least 1 h beforemeasurement. Themanufacturer’stechnical specifications of the pH meter were 0.01 pH for resolution and ±0.01 (standarderror) for accuracy.
Components of the carbonate system (pCO2, CO2−3 , HCO−3 , DIC concentrations
and �arag) were calculated from TA along with pH values, temperature and salinityusing the CO2SYS program, version 1.03 (Lewis, Wallace & Allison, 1998; Pierrot, Lewis& Wallace, 2006). The pHNBS were shifted onto the total pH scale (pHT ) by subtracting−0.11 (Zeebe & Wolf-Gladrow, 2001), which includes a minor correction for [SO2−
4 ]and the stability constant of HSO−4 at a salinity of 40.7h. The thermodynamic carbonatedissociation constants for activity scales (K1= 5.845± 0.008 and K2= 8.945± 0.013) wereattained fromMehrbach et al. (1973) and the refit fromDickson & Millero (1987). The inputparameters for pressure (10 dbar), total P (0.03 µmol kg−1) and total Si (0.68 µmol kg−1)were obtained from the NMP of the Gulf of Eilat (NMP, 2016).
Data normalizationFor accurate determination of TA changes in the incubation volume, coral volume wasdetermined by measuring its displacement weight in seawater following Archimedes’principle and assuming an approximate density of 1.028 g cm−3 for Red Sea seawater.
Cohen et al. (2017), PeerJ, DOI 10.7717/peerj.3749 8/21
Normalized calcification rates were obtained by determining skeleton dry weight, using avibra balance (Shinko Denshi Co., Ltd., Japan; accuracy ∼1 mg).
Statistical analysisDue to the paired nature of the measurements, the overall dataset was analysed with arepeated measures ANOVA. This way, the within subjects effects allow to test for consistentdifferences in calcification rates between both estimation methods (TA vs. 45Ca) as afunction of incubation time (2 h, 4 h, 6 h), seawater pHT (8.1 vs. 7.5) and the combinationof both, whereas the between subject effects test whether overall calcification rates differbetween pH and incubation time. All calcification rates were cube root transformed toachieve normality as tested by the Shapiro–Wilk test. Differences between estimationmethods due to seawater pH were also tested for the 2 h time point, using the overall fittedmodel (repeated measures ANOVA as above) as well as a paired t -test for each pH.
The relationship between absolute estimates of calcification (in nmol) between TA and45Ca was evaluated using geometric regression fitting and by directly comparing 45Ca/TAratios over a range of calcification values. Geometric regression was preferred over linearregression since no causality can be established between both variables and both have aninherent measurement error. Note that geometric regression equations still depend on theassignment of x and y . To test whether the relationship between both methods is affectedby seawater pH, 45Ca/TA-ratios from both treatments after 2 h were tested with a t -test.All statistical analyses were performed in JMP 11.2.1 (SAS Institute, Cary, NC, USA).
For comparison with literature data from Smith & Kinsey (1978) and Tambutté et al.(1995), the software WebPlotDigitizer (Rohatgi, 2015) was employed to extract the datapoints from the original publication graphs, since the raw data is no longer available (SSmith & E Tambutté, pers. comm., 2015). The extracted data is provided as supplementaryinformation for future reference (Table S2).
RESULTS AND DISCUSSIONEffect of incubation time and estimation method on derivedcalcification rateDuring the 16 months of acclimation at both pH treatments all coral microcoloniessurvived and remained visibly healthy (extended polyps; no bleaching; substantial increasein size). Considering data from all incubation periods, calcification rate estimates fromboth techniques were not significantly different, nor were there consistent differencesbetween both techniques related to pH or incubation time (Fig. 2 and Table 3). Overall,calcification rates were significantly higher at reduced pH with no significant effect ofincubation time (Fig. 2 and Table 3). Since only a single biological replicate was tested, thisecological finding is not of significance and will not be further discussed here.
Considering only the calcification rates obtained from2hof incubation as physiologicallyuseful data (see later discussion) shows that absolute estimates of calcification differedbetween both methods depending on pH (Fig. 2 and Table 3). Calcification estimates fromthe TA anomaly technique were on average 5% and 21% higher than the 45Ca estimate,for ambient and reduced pH, respectively. However, this difference was only statistically
Cohen et al. (2017), PeerJ, DOI 10.7717/peerj.3749 9/21
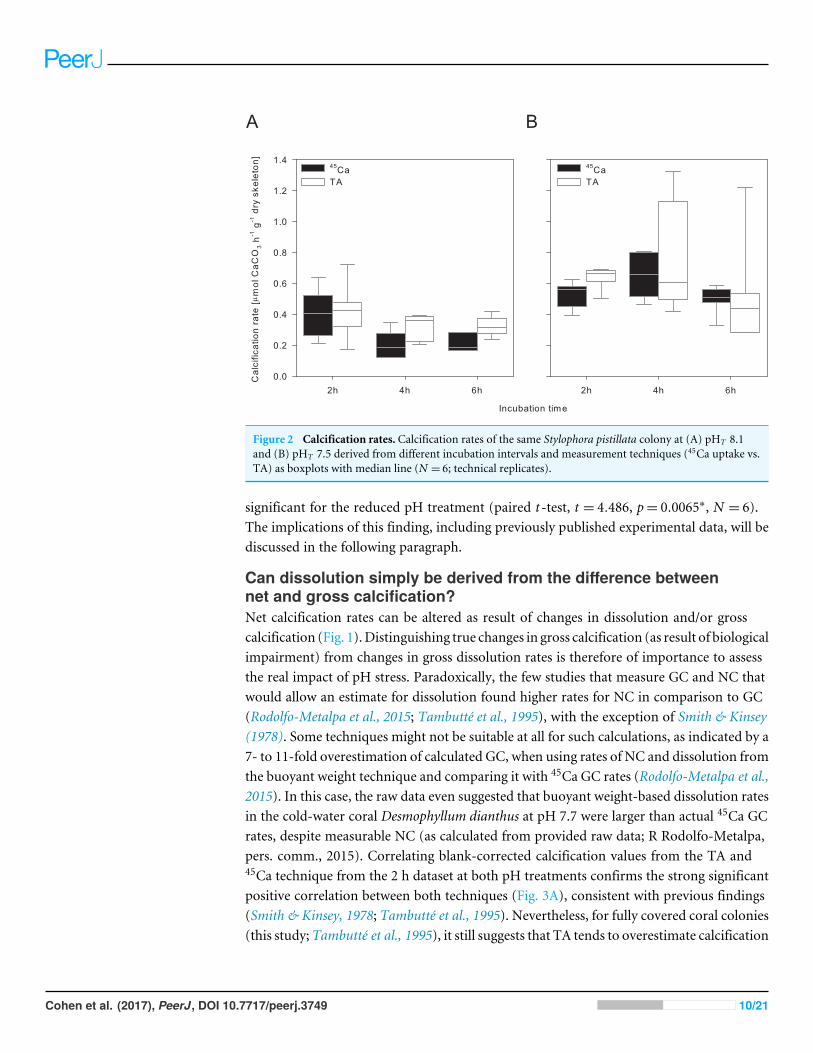
Figure 2 Calcification rates. Calcification rates of the same Stylophora pistillata colony at (A) pHT 8.1and (B) pHT 7.5 derived from different incubation intervals and measurement techniques (45Ca uptake vs.TA) as boxplots with median line (N = 6; technical replicates).
significant for the reduced pH treatment (paired t -test, t = 4.486, p= 0.0065∗, N = 6).The implications of this finding, including previously published experimental data, will bediscussed in the following paragraph.
Can dissolution simply be derived from the difference betweennet and gross calcification?Net calcification rates can be altered as result of changes in dissolution and/or grosscalcification (Fig. 1).Distinguishing true changes in gross calcification (as result of biologicalimpairment) from changes in gross dissolution rates is therefore of importance to assessthe real impact of pH stress. Paradoxically, the few studies that measure GC and NC thatwould allow an estimate for dissolution found higher rates for NC in comparison to GC(Rodolfo-Metalpa et al., 2015; Tambutté et al., 1995), with the exception of Smith & Kinsey(1978). Some techniques might not be suitable at all for such calculations, as indicated by a7- to 11-fold overestimation of calculated GC, when using rates of NC and dissolution fromthe buoyant weight technique and comparing it with 45Ca GC rates (Rodolfo-Metalpa et al.,2015). In this case, the raw data even suggested that buoyant weight-based dissolution ratesin the cold-water coral Desmophyllum dianthus at pH 7.7 were larger than actual 45Ca GCrates, despite measurable NC (as calculated from provided raw data; R Rodolfo-Metalpa,pers. comm., 2015). Correlating blank-corrected calcification values from the TA and45Ca technique from the 2 h dataset at both pH treatments confirms the strong significantpositive correlation between both techniques (Fig. 3A), consistent with previous findings(Smith & Kinsey, 1978; Tambutté et al., 1995). Nevertheless, for fully covered coral colonies(this study;Tambutté et al., 1995), it still suggests that TA tends to overestimate calcification
Cohen et al. (2017), PeerJ, DOI 10.7717/peerj.3749 10/21

Figure 3 TA vs 45Ca calcification estimates. Relationship between calcification estimates based on TAtitration and 45Ca fixation for Stylophora pistillata (triangles; white and grey this study, black from Tam-butté et al., 1995) and Acropora formosa (circle, Smith & Kinsey, 1978). (A) Geometric regressions andpairwise correlations are indicated for all datasets (Table S1) based on Smith & Kinsey (1978) (solid; after30 min of incubation with A. formosa), Tambutté et al. (1995) (long dash 0.25–3 h incubation with S. pis-tillata) and this study (short dash after 2 h with S. pistillata pHT 8.1, dash-dot pHT 7.5). (B) Agreementof both methods in relation to absolute calcification value (here based on TA). Data points show ratiosof values shown in 3A. Statistical significance of pairwise correlations indicated by asterisks. Double dag-ger indicates excluded replicate point in the pHT 7.5 data set. Note that it is assumed that Smith & Kinsey(1978) and Tambutté et al. (1995) used blank-corrected calcification estimates.
values relative to the 45Ca technique because 45Ca/TA estimate ratios tend to be below 1(Fig. 3B).
Previous work by Smith and Roth (in Smith & Kinsey, 1978) incubated tips of Acroporaformosa for 30 min in test tubes containing 45Ca-labelled seawater, whereas Tambutté et al.(1995) improved this 45Ca protocol and labelled microcolonies of S. pistillata in seawaterfor up to 3 h. Both studies confirmed a strong correlation (r = 0.95–0.99) between theTA and 45Ca estimates, but found opposing results with regard to absolute calcificationestimates between these two methods. While the slope of the geometric regression wassimilar between both studies and similar to the obtained values here (Fig. 3A), the regressionand its extrapolated intercepts relative to the 1:1 line suggested opposite findings: (1) thepresence of 45Ca in the skeleton even without measurable changes in TA (Smith & Kinsey,1978; Figs. 3A and 3B) and (2) changes in TA without detectable 45Ca incorporation in theskeleton (Tambutté et al., 1995; Figs. 3A and 3B). Physical adsorption of 45Ca to the exposedskeleton surface at the fracture site, rather than biologically mediated incorporation, wassuggested as the source for the overestimation by the 45Ca method by Smith & Kinsey(1978). The use of completely tissue-covered microcolonies was intended to minimizethis effect in the study of Tambutté et al. (1995) and the resulting negative intercept was
Cohen et al. (2017), PeerJ, DOI 10.7717/peerj.3749 11/21
interpreted as loss of radioactivity during washing steps or general time lag due to the45Ca loading of extracellular and tissue compartments. Since both studies chose an overallline-fitting method to compare TA and 45Ca estimates instead of comparing the valuesdirectly, it was not apparent that the absolute level of over- or underestimation of eithermethod was not constant, but largely dependent on the absolute amount of depositedCaCO3 (Fig. 3B). This is expected given that the relative overestimation of 45Ca adsorptionat exposed skeletal parts, or underestimation due to 45Ca loss, should represent a small,constant value that is related to surface and porosity of the skeleton and is not proportionalto the amount of deposited CaCO3. Thus, the influence of such artefacts on the 45Ca/TArelationship becomes less important for larger calcification values (as can be seen in Fig.3B). We confirmed that the 45Ca isotopic equilibration of dead, covered skeletons (usedas blanks) was rather constant after 2 h and 6 h, with 0.14 ± 0.03 and 0.19 ± 0.02 µmolCaCO3 g−1 dry skeleton (mean ± SD; N = 3), respectively. Figure 3B illustrates thatfor a sufficiently high CaCO3 deposition (>1,500 nmol from TA estimate), the 45Ca/TAratio approaches a rather constant value in each study with 1.19 ± 0.02 (mean ± SE,N = 3, Smith & Kinsey, 1978), 0.77 ± 0.01 (N = 10; Tambutté et al., 1995), 0.94 ± 0.06(N = 5; this study pHT 8.1), and 0.85± 0.03 (N = 5; this study pHT 7.5). Using only thesevalues and considering only the studies with fully-covered microcolonies, TA estimates areconsistently larger than 45Ca estimates. Furthermore, this ratio is not significantly differentbetween the pH treatments in our study (One-Way ANOVA, F1,8= 1.930, p= 0.2022).
When interpreting the relationship between the 45Ca and TA anomaly technique onemust consider two important aspects: (1) the correlational strength, which demonstratesthe linear relationship between both methods over a range of values, and (2) the numericalratio itself, which represents the relative difference in the calcification estimate betweenboth methods and is assumed to provide an estimate for the occurrence of dissolution. Forthe first aspect, we conclude that both methods correlate well in both pH treatments. Forthe second point however, we have to conclude that the apparent tendency for GC/NCratios to be <1 in the relevant studies that used fully covered microcolonies contradictsthe generally assumed relationship of NC ≤ GC. This is furthermore problematic since TAestimates in our experiment are factually a measure of GC, because we demonstrated ina separate experiment, that dissolution (if occurring) was not detectable. We tested bareskeletons of similar size in the same vials over a slightly longer period of time (3 h) andeven lower pH (pH 8.1, 7.6, and 7.3 with N = 9 each) and found that 25 of the obtained 271TA values were less than 18 µeq kg−1 and therefore below the recommended detectionlimit of at least three times the precision of the used titrator (Table S4). Thus, for thecase of no detectable dissolution, both methods would represent measures of GC here,but still provide different estimates for gross calcification, especially at reduced pH. Evenif dissolution occurred under reduced pH conditions, the 45Ca/TA ratio shifted in thewrong direction, erroneously indicating that NC increases relative to GC. This violatesthe assumed relationship of NC = GC–GD and the similar results of this study and thestudy of Tambutté et al. (1995) raises the general question of whether a comparison of thesetwo sensitive methods is really appropriate to provide accurate values for GD. Limited
Cohen et al. (2017), PeerJ, DOI 10.7717/peerj.3749 12/21

Table 4 Changes in seawater carbonate chemistry over incubation time.Values show absolute changes from the initial conditions (mean± SD,N = 6). Values in brackets indicate relative changes to initial values to account for the shifted carbon equilibrium between both pH treatments. Su-perscript letters indicate post hoc Tukey HSD test results for detected significant interactions between pH and time in all variables, except alkalinity(Two Way ANOVA results cf. Table S5). Levels not connected by the same letter are significantly different.
pH 8.1 pH 7.5
2 h 4 h 6 h 2 h 4 h 6 h
Alkalinity (µeq kg−1) −106± 36 −152± 48 −198± 30 −164± 37 −310± 115 −345± 98(−4%) (−6%) (−8%) (−7%) (−12%) (−14%)
DIC (µmol kg−1) −215± 32 −458± 59 −537± 82 −277± 76 −564± 124 −791± 103(−10%)A (−21%)B (−25%)B (−11%)A (−23%)B (−32%)C
pH +0.17± 0.04 +0.41± 0.06 +0.46± 0.10 +0.29± 0.11 +0.59± 0.09 +0.89± 0.06(+2%)A (+5%)B,C (+6%)C,D (+4%)B (+8%)D (+12%)E
CO2(aq) (µmol kg−1) −4.5± 0.7 −8.0± 0.6 −8.5± 0.8 −34.6± 10.9 −52.6± 2.9 −60.0± 1.2(−42%)A (−74%)A (−78%)A (−53%)B (−81%)C (−92%)C
HCO3− (µmol kg−1) −276± 42 −636± 80 −730± 134 −293± 87 −640± 132 −974± 109
(−15%)A (−34%)B (−39%)B (−13%)A (−27%)B (−42%)C
CO2−3 (µmol kg−1) +65± 21 +185± 33 +201± 54 +51± 22 +129± 31 +244± 30
(+25%)A (+70%)B,C (+76%)C (+73%)A (+186%)B (+352%)C
by sensitivity of common methods, assessing gross dissolution and its relation to netcalcification simultaneously is clearly a challenge.
Changes in seawater chemistrySubstantial changes in the carbonate chemistry (TA, DIC, pH, pCO2, HCO−3 , CO
2−3 and
�arag) were recorded inside the incubation vessels during the time course of the experimentat both pH treatments (Table 4, Table S3). A general decline in DIC was correlated withan increase in seawater pH and a shift within the carbon equilibrium. For an incubationperiod beyond two hours, a substantial pH shift (+0.4–0.9 units) with CO2(aq) depletionof more than 70%, as well as considerable changes (≥10%) in seawater DIC were observedirrespective of pH (Table 4).
At constant temperature and salinity, alterations in carbonate system parameters suchas pH and TA are driven mainly by biological activities of the coral holobiont such asphotosynthesis, respiration, and calcification (Schulz & Riebesell, 2013). Photosynthesisand calcification decrease the seawater DIC, while respiration and dissolution increasethe DIC. However, only calcification and dissolution alter the TA (Chisholm & Gattuso,1991; Zeebe & Wolf-Gladrow, 2001). The photosynthetic activity of the dinoflagellatesymbiont is the main driver for the observed changes in total DIC and DIC speciation(with subsequent pH shift) as CO2 is removed and fixed in biomass at a much higher ratethan HCO−3 /CO
2−3 incorporation into the skeleton. The stronger changes in carbonate
chemistry at reduced pH are likely to be the result of two interacting factors: (1) Potentiallyaltered photosynthetic/respiratory rates at reduced pH (Jury et al., 2013; Page et al., 2016),and (2) a generally lower buffering capacity of CO2-enriched seawater, specifically at pHT
7.5, where seawater reaches its minimum buffering capacity (Delille et al., 2005; Egleston,Sabine & Morel, 2010; Riebesell et al., 2007; Suzuki, 1998). Near pHT 7.5, where DIC∼TA,
Cohen et al. (2017), PeerJ, DOI 10.7717/peerj.3749 13/21

any changes in DIC and TA will cause a similar magnitude change in [CO2], [H+], and �
and a sharp change in pH (Egleston, Sabine & Morel, 2010).Best practice guidelines recommended changes in TA should be at least 3- to 10-fold
(Langdon, Gattuso & Andersson, 2010) the analytical precision of the instrument (e.g.,1TA ∼ 6−20 µmol kg−1 seawater), but these changes along with changes in DIC shouldnot exceed 3% (Schulz et al., 2009) or 10% (Langdon, Gattuso & Andersson, 2010) of theabsolute values. Given the observed stronger changes in seawater chemistry at lowerpH over time in our experiment, one can see that the trade-off between using a smallincubation volume to accurately measure changes in TA versus using a large volume tominimize changes in carbonate chemistry becomes a crucial issue for measurements underOA conditions, especially in closed systems. For calcification measurements with symbioticcorals at reduced pH in closed vessels, incubation time must be minimized as long asthe seawater carbonate parameters are not kept constant. In addition, increasing oxygensaturation in closed vessels due to photosynthesis is also an important factor to considerwhen measuring zooxanthellate corals in the light. In a similar experiment, very high pO2
levels (200–250%) were recorded after 4 h and 6 h of incubation, at both pH treatmentsand overall O2-productivity significantly declined with prolonged incubation (Fig. S3A,S3B) likely due to a negative feedback of high oxygen levels on photosynthesis and generalphysiology. Hyperoxic conditions promote the generation and accumulation of reactiveoxygen species (Gerschman et al., 1954) with potentially negative effects that interfere withthe normal physiological performance and the subsequent estimate of calcification rate.
The problem of fundamental changes in seawater chemistry and their negative feedbackfor coral physiology can essentially be captured in the relationship between coral biomass,chamber volume, and incubation time. The presented experimental data clearly confirmthat these factors define the applicability and limits of closed chamber incubations ashighlighted previously, but become especially important in the context of measurementsunder OA conditions (Chisholm & Gattuso, 1991; Langdon & Atkinson, 2005; Langdon,Gattuso & Andersson, 2010; Schulz et al., 2009). Note that coral size rather than coralsurface area is used in the following, since surface area as a size proxy was not alwaysavailable from the below discussed studies. For comparison, in the present experiment, theratio between incubation volume (mL) and coral size (cm) was 13−16 (the correspondingVvessel/Vcoral-ratios for this branching species were 20 to 44) and incubations beyond 2 halready caused large shifts in carbonate parameters and pO2. This should be a generalpoint of consideration, since previous studies that used the same coral species, similarconditions of temperature and light intensity (∼25 ◦C;∼150–170 µmol photons m−2 s−1),and used similar (10–17; Furla et al., 2000) or even smaller (6–8; Tambutté et al., 1995)incubation volume/coral size-ratios, incubated corals for up to 3 h (incubation volumes:7–10 mL), thus most likely experiencing similar shifts in the carbonate species and/or O2
concentration. The other extreme, employing very large incubation volumes relative tocoral size, bears the risk of approaching the detection limit of the TA titration method,even with longer incubation times. For example, 1TA over 2 h approached less thanthree times the analytical precision for most of the treatments for a volume/size ratioof 225 in the study of Takahashi & Kurihara (2013). It should be favourably noted that
Cohen et al. (2017), PeerJ, DOI 10.7717/peerj.3749 14/21

the studies that experienced this issue and used alkalinity changes as low as 3 µmol kg−1
to calculate calcification rates belong to the few publications that explicitly report themeasured changes in the carbonic acid system in the incubation vessels (Hossain & Ohde,2006;Ohde & Hossain, 2004; Takahashi & Kurihara, 2013). Our experimental data reaffirmthe necessity of reporting changes in the carbonic-acid system parameters not only forpre-experimental pH acclimation, but also for actual incubation experiments that yieldcalcification data, following previously suggested best practice guidelines (Andersson &Mackenzie, 2012; Langdon, Gattuso & Andersson, 2010). The need for a valid descriptionof the whole carbonate system is further emphasised by the study of Hoppe et al. (2012)on the uncertainties in the calculated carbonate chemistry when using only two measuredparameters.
In order to avoid substantial changes in the seawater chemistry in incubation vessels, itmight be useful to estimate the maximum permissible coral size based on known estimatesof the species-specific calcification rate, the known incubation volume and by applying the3–10% rule for the permitted absolute TA change. For our case, given a Red Sea seawaterTA of ∼2,500 µeq/kg, TA must not change by more than ∼75 µmol L−1 (3%-rule) overthe total incubation time, corresponding to ∼3,000 nmol in a 40 mL chamber (notethat the real incubation volume is actually Vchamber–Vcoral). For an expected calcificationrate of ∼250 nmol CaCO3 cm−2 h−1 for a Northern Red Sea Stylophora pistillata (e.g.,Krueger et al., 2017), the maximal permitted coral surface area of the fragment used fora 1 h incubation must be smaller than 12 cm2 (3,000 nmol/250 nmol) or 6 cm2 for a2 h incubation. Considering the varying performance in calcification, photosynthesis,and respiration between coral species and environmental conditions (e.g., pH, light,temperature), preliminary experiments might also benefit in determining minimal vesselvolumes, depending on coral size and respective incubation time in closed systems.
CONCLUSIONStating that reduced pH decreases coral calcification based on measurements of netcalcification alone fails to identify whether there is a reduced biological capability toform a new skeleton or whether skeletal dissolution outweighs the biologically-mediateddeposition (see Fig. 1). We demonstrated the significance of potential changes in TA andDIC speciation as a function of incubation time when using photosynthetically active coralsfor two common techniques that provide estimates for NC and GC. Given the remaininguncertainties about deriving gross dissolution from different NC-GC comparisons (BW/TAvs. 45Ca), further experiments are clearly required to provide an explicit value for grossdissolution of skeletal material in living corals. One experimental approach that waspreviously suggested, but to our knowledge has not yet been experimentally tested, is toincubate a coral in 45Ca-spiked seawater for a few hours/days in order to sufficiently labelthe skeleton so that a subsequent incubation in seawater would allow the direct assessmentof 45Ca-dissolution from the skeleton (after correcting for the isotopic equilibration)(Langdon, Gattuso & Andersson, 2010). Simultaneous incubation with a different detectablecalcium isotope or a dye such as alizarin as employed by Lamberts (1974) would provide
Cohen et al. (2017), PeerJ, DOI 10.7717/peerj.3749 15/21
an estimate for gross calcification. This dual approach could allow the simultaneous anddirect assessment of rates for GC and dissolution on the same coral by quantifying Cainflux and efflux simultaneously. The importance of accurately measuring these processes,while considering the different factors that can affect the physiological response duringincubation, emphasises the need for additional comparative studies to test the compatibilityand accuracy of calcification estimates based on the TA and 45Ca techniques in the contextof OA research.
ACKNOWLEDGEMENTSThe authors thank J Erez and K Schneider for comments and ideas throughout theexperiments, R Rodolfo-Metalpa for critical discussion on certain aspects of themanuscript,S Krief and L Hazanov for technical assistance and the staff of the Interuniversity Institutefor Marine Science in Eilat.
ADDITIONAL INFORMATION AND DECLARATIONS
FundingThis study was funded by an Israel Science Foundation grant to M Fine. There was noadditional external funding received for this study. The funders had no role in study design,data collection and analysis, decision to publish, or preparation of the manuscript.
Grant DisclosuresThe following grant information was disclosed by the authors:Israel Science Foundation.
Competing InterestsThe authors declare there are no competing interests.
Author Contributions• Stephanie Cohen conceived and designed the experiments, performed the experiments,analyzed the data, wrote the paper, prepared figures and/or tables, reviewed drafts of thepaper.• Thomas Krueger analyzed the data, wrote the paper, prepared figures and/or tables,reviewed drafts of the paper.• Maoz Fine conceived and designed the experiments, performed the experiments,contributed reagents/materials/analysis tools, wrote the paper, reviewed drafts of thepaper.
Data AvailabilityThe following information was supplied regarding data availability:
The raw data has been supplied as Supplemental Files.
Supplemental InformationSupplemental information for this article can be found online at http://dx.doi.org/10.7717/peerj.3749#supplemental-information.
Cohen et al. (2017), PeerJ, DOI 10.7717/peerj.3749 16/21

REFERENCESAl-Horani FA, Al-Rousan SA, Manasrah RS, RasheedMY. 2005. Coral calcifica-
tion: use of radioactive isotopes and metabolic inhibitors to study the interac-tions with photosynthesis and respiration. Chemistry and Ecology 21:325–335DOI 10.1080/02757540500258724.
Almgren T, Dyrssen D, Fonselius S. 1983. Determination of alkalinity and totalcarbonate. In: Grasshoff K, Ehrhardt M, Kremling K, eds.Methods of seawateranalysis. Weinheim: Verlag Chemie GmbH, 99–107.
Almoghrabi S, Allemand D, Jaubert J. 1993. Valine uptake by the scleractinian coralGalaxea fascicularis–characterization and effect of light and nutritional status. Journalof Comparative Physiology B-Biochemical Systemic and Environmental Physiology163:355–362.
Andersson AJ, Mackenzie FT. 2012. Revisiting four scientific debates in ocean acidifica-tion research. Biogeosciences 9:893–905 DOI 10.5194/bg-9-893-2012.
Andersson AJ, Mackenzie FT, Gattuso J-P. 2011. Effects of ocean acidification onbenthic processes, organisms, and ecosystems. In: Gattuso J-P, Hansson L, eds.Ocean acidification. New York: Oxford University Press, 122–153.
Anthony KRN, Kline DI, Diaz-Pulido G, Dove S, Hoegh-Guldberg O. 2008. Oceanacidification causes bleaching and productivity loss in coral reef builders. Proceedingsof the National Academy of Sciences of the United States of America 105:17442–17446DOI 10.1073/pnas.0804478105.
Barnes DD. 1988. Seasonality in community productivity and calcification at DaviesReef, central Great Barrier Reef. In: Proceedings of the 6th international coral reefsymposium. Townsville, Australia, 8–12 August 1988, 521–527.
Caldeira K,Wickett ME. 2005. Ocean model predictions of chemistry changes fromcarbon dioxide emissions to the atmosphere and ocean. Journal of GeophysicalResearch-Oceans 110:Article C09S04 DOI 10.1029/2004JC002671.
Chan N, Connolly SR. 2013. Sensitivity of coral calcification to ocean acidification: ameta-analysis. Global Change Biology 19:282–290 DOI 10.1111/gcb.12011.
Chisholm JRM, Gattuso JP. 1991. Validation of the alkalinity anomaly technique forinvestigating calcification of photosynthesis in coral reef communities. Limnologyand Oceanography 36:1232–1239 DOI 10.4319/lo.1991.36.6.1232.
Comeau S, Edmunds P, Spindel N, Carpenter R. 2014. Fast coral reef calcifiers are moresensitive to ocean acidification in short-term laboratory incubations. Limnology andOceanography 59:1081–1091 DOI 10.4319/lo.2014.59.3.1081.
Delille B, Harlay J, Zondervan I, Jacquet S, Chou L,Wollast R, Bellerby RGJ, Frankig-noulle M, Borges AV, Riebesell U, Gattuso JP. 2005. Response of primary pro-duction and calcification to changes of pCO2 during experimental blooms of thecoccolithophorid Emiliania huxleyi. Global Biogeochemical Cycles 19:Article GB2023DOI 10.1029/2004GB002318.
Cohen et al. (2017), PeerJ, DOI 10.7717/peerj.3749 17/21

Dickson A, Millero FJ. 1987. A comparison of the equilibrium constants for the disso-ciation of carbonic acid in seawater media. Deep Sea Research Part A OceanographicResearch Papers 34:1733–1743 DOI 10.1016/0198-0149(87)90021-5.
DOE. 1994. In: Dickson AG, Goyet C, eds. Handbook of methods for the analysisof the various parameters of the carbon dioxide system in sea water. version 2:ORNL/CDIAC-74. US Department of Energy.
Edmunds PJ, Spencer-Davies P. 1988. Post-illumination stimulation of respiration ratein the coral Porites porites. Coral Reefs 7:7–9 DOI 10.1007/BF00301975.
Egleston ES, Sabine CL, Morel FM. 2010. Revelle revisited: buffer factors that quantifythe response of ocean chemistry to changes in DIC and alkalinity. Global Biogeo-chemical Cycles 24:Article GB1002 DOI 10.1029/2008GB003407.
Eyre BD, Andersson AJ, Cyronak T. 2014. Benthic coral reef calcium carbon-ate dissolution in an acidifying ocean. Nature Climate Change 4:969–976DOI 10.1038/nclimate2380.
Furla P, Galgani I, Durand I, Allemand D. 2000. Sources and mechanisms of inorganiccarbon transport for coral calcification and photosynthesis. Journal of ExperimentalBiology 203:3445–3457.
Gerschman R, Gilbert DL, Nye SW, Dwyer P, FennWO. 1954. Oxygen poi-soning and X-irradiation: a mechanism in common. Science 119:623–626DOI 10.1126/science.119.3097.623.
Goreau TF. 1959. The physiology of skeleton formation in corals. I. A method formeasuring the rate of calcium deposition by corals under different conditions. TheBiological Bulletin 116:59–75 DOI 10.2307/1539156.
Goreau TF, Goreau NI. 1960. The physiology of skeleton formation in corals. IV. Onisotopic equilibrium exchange of calcium between corallum and environmentin living and dead reef-building corals. The Biological Bulletin 119:416–427DOI 10.2307/1539259.
Hoppe CJM, Langer G, Rokitta SD,Wolf-GladrowDA, Rost B. 2012. Implicationsof observed inconsistencies in carbonate chemistry measurements for oceanacidification studies. Biogeosciences 9:2401–2405 DOI 10.5194/bg-9-2401-2012.
HossainMMM, Ohde S. 2006. Calcification of cultured Porites and Fungia under differ-ent aragonite saturation states of seawater. In: Proceedings of the 10th internationalcoral reef symposium. Okinawa, Japan, 28 June-2 July 2004, 597–606.
Houlbrèque F, Tambutté E, Ferrier-Pagès C. 2003. Effect of zooplankton availabilityon the rates of photosynthesis, and tissue and skeletal growth in the scleractiniancoral Stylophora pistillata. Journal of Experimental Marine Biology and Ecology296:145–166 DOI 10.1016/S0022-0981(03)00259-4.
IPCC. 2013. Climate change 2013: the physical science basis. In: Contribution of workinggroup I to the fifth assessment report of the intergovernmental panel on climate change.Cambridge, United Kingdom and New York: Cambridge University Press.
Jokiel PL, Maragos JE. 1978. Coral growth: buoyant weight technique. In: Stoddart DR,Johannes RE, eds. Coral reefs: research methods. Paris: UNESCO, 529–541.
Cohen et al. (2017), PeerJ, DOI 10.7717/peerj.3749 18/21

Jury CP, Thomas FI, AtkinsonMJ, Toonen RJ. 2013. Buffer capacity, ecosystemfeedbacks, and seawater chemistry under global change.Water 5:1303–1325DOI 10.3390/w5031303.
Kleypas JA, Buddemeier RW, Archer D, Gattuso JP, Langdon C, Opdyke BN. 1999.Geochemical consequences of increased atmospheric carbon dioxide on coral reefs.Science 284:118–120 DOI 10.1126/science.284.5411.118.
Kleypas JA, Feely RA, Fabry VJ, Langdon C, Sabine CL, Robbins LL. 2006. Impactsof ocean acidification on coral reefs and other marine calcifiers: a guide for futureresearch. Report of a workshop sponsored by NSF, NOAA, and the US GeologicalSurvey. 18–20 April 2005. St. Petersburg, FL, USA, 88.
Krueger T, Horwitz N, Bodin J, Giovani M-E, Escrig S, Meibom A, FineM. 2017. Com-mon reef-building coral in the Northern Red Sea resistant to elevated temperatureand acidification. Royal Society Open Science 4:170038 DOI 10.1098/rsos.170038.
Lamberts AE. 1974.Measurement of alizarin deposited by coral. In: Cameron AM,Cambell BM, eds. Proceedings of the 2nd international coral reef symposium. Brisbane,Australia, 22 June-02 July 1974. 241–244.
Langdon C, AtkinsonMJ. 2005. Effect of elevated pCO2 on photosynthesis and calcifica-tion of corals and interactions with seasonal change in temperature/irradiance andnutrient enrichment. Journal of Geophysical Research: Oceans 110:Article C09S07DOI 10.1029/2004JC002576.
Langdon C, Gattuso J-P, Andersson A. 2010. Measurements of calcification anddissolution of benthic organisms and communities. In: Riebesell U, Fabry VJ,Hansson L, Gattuso J-P, eds. Guide to best practices for ocean acidification research anddata reporting. Luxembourg: Publications Office of the European Union, 213–228.
Lewis E, Wallace D, Allison LJ. 1998. Program developed for CO2 system calculations.ORNL/CDIAC-105. Oak Ridge, TN, Carbon Dioxide Information Analysis Center,Oak Ridge National Laboratory, US Department of Energy.
McCullochM, Falter J, Trotter J, Montagna P. 2012. Coral resilience to ocean acid-ification and global warming through pH up-regulation. Nature Climate Change2:623–627 DOI 10.1038/nclimate1473.
Mehrbach C, Culberson CH, Hawley JE, Pytkowicz RM. 1973.Measurement of theapparent dissociation constants of carbonic acid in seawater at atmospheric pressure.Limnology and Oceanography 18:897–907 DOI 10.4319/lo.1973.18.6.0897.
NMP. 2016. The Israel National Monitoring Program (NMP) at the Gulf of Eilat.Available at http://www.iui-eilat.ac.il/Research/NMPmeteodata.aspx (accessed on15 November 2016).
Ohde S, HossainMMM. 2004. Effect of CaCO3 (aragonite) saturation state ofseawater on calcification of Porites coral. Geochemical Journal 38:613–621DOI 10.2343/geochemj.38.613.
Orr JC, Fabry VJ, Aumont O, Bopp L, Doney SC, Feely RA, Gnanadesikan A,Gruber N, Ishida A, Joos F. 2005. Anthropogenic ocean acidification over thetwenty-first century and its impact on calcifying organisms. Nature 437:681–686DOI 10.1038/nature04095.
Cohen et al. (2017), PeerJ, DOI 10.7717/peerj.3749 19/21

Page HN, Andersson AJ, Jokiel PL, Ku’ulei SR, LebratoM, Yeakel K, Davidson C,D’Angelo S, Bahr KD. 2016. Differential modification of seawater carbonatechemistry by major coral reef benthic communities. Coral Reefs 35:1311–1325DOI 10.1007/s00338-016-1490-4.
Pierrot D, Lewis E, Wallace D. 2006. MS Excel program developed for CO2 systemcalculations. ORNL/CDIAC-105a. Oak Ridge, TN, Carbon Dioxide InformationAnalysis Center, Oak Ridge National Laboratory, US Department of Energy.
Riebesell U, Schulz KG, Bellerby RGJ, Botros M, Fritsche P, Meyerhofer M, Neill C,Nondal G, Oschlies A,Wohlers J, Zollner E. 2007. Enhanced biological carbonconsumption in a high CO2 ocean. Nature 450:545–U510 DOI 10.1038/nature06267.
Ries JB, Cohen AL, McCorkle DC. 2009.Marine calcifiers exhibit mixed responses toCO2-induced ocean acidification. Geology 37:1131–1134 DOI 10.1130/G30210A.1.
Rodolfo-Metalpa R, Montagna P, Aliani S, Borghini M, Canese S, Hall-Spencer JM,Foggo A, MilazzoM, Taviani M, Houlbrèque F. 2015. Calcification is not theAchilles’ heel of cold-water corals in an acidifying ocean. Global Change Biology21:2238–2248 DOI 10.1111/gcb.12867.
Rohatgi A. 2015.WebPlotDigitalizer: web based tool to extract data from plots, images, andmaps. 3.9 edition. Available at http:// arohatgi.info/WebPlotDigitizer .
Schneider K, Erez J. 2006. The effect of carbonate chemistry on calcification and photo-synthesis in the hermatypic coral Acropora eurystoma. Limnology and Oceanography51:1284–1293 DOI 10.4319/lo.2006.51.3.1284.
Schoepf V, Hu X, HolcombM, CaiW-J, Li Q,Wang Y, Xu H,Warner ME, MelmanTF, Hoadley KD. 2017. Coral calcification under environmental change: a directcomparison of the alkalinity anomaly and buoyant weight techniques. Coral Reefs36:1–13 DOI 10.1007/s00338-016-1535-8.
Schulz KG, Ramos JBE, Zeebe RE, Riebesell U. 2009. CO2 perturbation experiments:similarities and differences between dissolved inorganic carbon and total alkalinitymanipulations. Biogeosciences 6:2145–2153 DOI 10.5194/bg-6-2145-2009.
Schulz KG, Riebesell U. 2013. Diurnal changes in seawater carbonate chemistry spe-ciation at increasing atmospheric carbon dioxide.Marine Biology 160:1889–1899DOI 10.1007/s00227-012-1965-y.
Silverman J, Lazar B, Cao L, Caldeira K, Erez J. 2009. Coral reefs may start dissolvingwhen atmospheric CO2 doubles. Geophysical Research Letters 36:Article L05606DOI 10.1029/2008GL036282.
Silverman J, Lazar B, Erez J. 2007. Effect of aragonite saturation, temperature, andnutrients on the community calcification rate of a coral reef. Journal of GeophysicalResearch: Oceans 112:Article C05004 DOI 10.1029/2006JC003770.
Smith S, Key G. 1975. Carbon dioxide and metabolism in marine environments.Limnology and Oceanography 20:493–495 DOI 10.4319/lo.1975.20.3.0493.
Smith SV, Kinsey DW. 1978. Calcification and organic carbon metabolism as indicatedby carbon dioxide. In: Stoddart DR, Johannes RE, eds. Coral reefs: research methods.Paris: UNESCOMonographs on oceanographic methodology, 469–484.
Cohen et al. (2017), PeerJ, DOI 10.7717/peerj.3749 20/21

Suzuki A. 1998. Combined effects of photosynthesis and calcification on the par-tial pressure of carbon dioxide in seawater. Journal of Oceanography 54:1–7DOI 10.1007/BF02744376.
Takahashi A, Kurihara H. 2013. Ocean acidification does not affect the physiologyof the tropical coral Acropora digitifera during a 5-week experiment. Coral Reefs32:305–314 DOI 10.1007/s00338-012-0979-8.
Tambutté E, Allemand D, Bourge I, Gattuso JP, Jaubert J. 1995. An improved 45Caprotocol for investigating physiological mechanisms in coral calcification.MarineBiology 122:453–459 DOI 10.1007/BF00350879.
Wolf-GladrowDA, Zeebe RE, Klaas C, Körtzinger A, Dickson AG. 2007. Total alka-linity: the explicit conservative expression and its application to biogeochemicalprocesses.Marine Chemistry 106:287–300 DOI 10.1016/j.marchem.2007.01.006.
Zeebe RE,Wolf-GladrowD. 2001. CO2 in seawater: equilibrium, kinetics, isotopes.Amsterdam: Elsevier Science, B.V.
Cohen et al. (2017), PeerJ, DOI 10.7717/peerj.3749 21/21