measuring - csiac · distribution statement a approved for public release; distribution is...
TRANSCRIPT

Distribution Statement A
Approved for public release; distribution is unlimited.
State-of-the-Art Report (SOAR) May 8, 2009
Information Assurance
Technology Analysis Center (IATAC)SOAR09
Measuring Cyber Security and
Information Assurance
Measu
ring C
yber S
ecurity
and
Info
rmatio
n A
ssuran
ceState-of-the-A
rt Report (SOA
R) M
ay 8, 2009Inform
ation Assurance Technology Analysis Center (IATAC)
This State-of-the-Art Report is published by the Information Assurance Technology Analysis
Center (IATAC). IATAC is a DoD-sponsored Information Analysis Center, administratively
managed by the Defense Technical Information Center (DTIC), and the Director, Defense
Research and Engineering (DDR&E).


Information Assurance Technology Analysis Center (IATAC)
Measuring Cyber Security and Information AssuranceState-of-the-Art Report (SOAR) May 8, 2009


Acknowledgements
This SOAR was planned and executed under the guidance of:
Steven King, Ph.D., Associate Director for Information Assurance, Office of the Deputy Under Secretary of Defense (Science and Technology) [DUSD(S&T)], representing the Steering Committee of the Information Assurance Technology Analysis Center (IATAC)
John Frink, Office of the Deputy Under Secretary of Defense (Science and Technology)
Paul Repak, Air Force Research Laboratory/RIGA, the IATAC Contracting Office Representative (COR)
This SOAR was provided for review to a number of organizations across DoD and the civil agencies, industry, and academia. We would also like to thank the following individuals for their incisive and extremely helpful comments on the drafts of this document:
Lee Badger, Ph.D., Computer Scientist, Computer Security Division (CSD), National Institute of Standards and Technology (NIST)
Wayne F. Boyer, Ph.D., Advisory Engineer/Scientist, Idaho National Laboratory
Shari Lawrence Pfleeger, Ph.D., Senior Information Scientist, RAND Corporation
Ronald Ritchey, Ph.D., Booz Allen Hamilton
Angela Orebaugh, Booz Allen Hamilton

Acknowledgements
AuthorsNadya BartolBrian BatesKaren Mercedes GoertzelTheodore Winograd
Coordinating EditorCynthia Karon
Copy EditorLindsay MartiJennifer Swartz
Creative DirectorChristina P. McNemar
Art Direction and Book DesignDon Rowe
Cover DesignHolly Walton
IllustrationsTammy BlackDon Rowe
ProductionTammy BlackKathryn CummingsMichelle DePrengerAzadeh PajouheshRicardo RealDon Rowe

Measuring Cyber Security and Information Assurance State-of-the-Art Report (SOAR) i
About the Authors
Nadya Bartol, CISSP, CGEIT, ISSPCSNadya Bartol has worked with multiple government and industry organizations to develop and implement information security measurement programs. She co-authored National Institute of Standards and Technology (NIST) guidelines on security measurement, and is one of the primary experts working on ISO/IEC 27004, Information Security Management Measurement. Ms. Bartol is serving as Co-Chair of the Department of Homeland Security (DHS) Software Assurance Measurement Working Group (SwA WG), and was the primary author of the group’s Practical Measurement Framework for Software Assurance and Information Security. She is an active member of the ISO standards community developing information security and privacy standards.
Brian J. Bates, PMPBrian J. Bates possesses more than 13 years of progressive leadership and experience in the fields of performance measurement and dashboards, project and program management, data center management, and information assurance/security. Mr. Bates possesses a MBA focused on IT Program Management, Human Resources, and Marketing Research, and a BA in Economics and Employment Relations. He received his PMP certification in 2006. Mr. Bates serves the leaders of higher education, commercial, and

Measuring Cyber Security and Information Assurance State-of-the-Art Report (SOAR)ii
About the Authors
government by providing guidance and support to their respective projects and programs. Since 2002, he has been a key lead in efforts to build and support security program offices for federal agencies focusing heavily on security performance measurement and monitoring.
Karen Mercedes Goertzel, CISSPKaren Mercedes Goertzel leads Booz Allen Hamilton’s Security Research Service. She is a subject matter expert in software assurance, cyber security, and information assurance. She was lead author of Software Security Assurance: A State-of-the-Art Report (July 2007) and The Insider Threat to Information Systems (October 2008), published by the Defense Technical Information Cener (DTIC). Ms. Goertzel has advised the Naval Sea Systems Command (NAVSEA) and the DHS Software Assurance Program; for the latter, she was lead author of Enhancing the Development Life Cycle to Produce Secure Software (October 2008). Ms. Goertzel was also a contributing author of the National Security Agency’s (NSA) Guidance for Addressing Malicious Code Risk, and chief technologist of the Defense Information Systems Agency (DISA) Application Security Program, for which she co-authored a number of secure application developer guides. She contributed to several NIST Special Publications including SP 800-95, Guide to Secure Web Services. She also tracks emerging technologies, trends, and research in information assurance, cyber security, software assurance, information quality, and privacy. Before joining Booz Allen (as an employee of what is now BAE Systems), Ms. Goertzel was a requirements analyst and architect of high-assurance trusted systems and cross-domain solutions for defense and civilian establishments in the United States, NATO, Canada, and Australia.
Theodore Winograd, CISSPTheodore Winograd has been involved in software security assurance and information assurance for over five years, particularly service-oriented architecture security and application security. He has supported the DHS Software Assurance Program, the DISA Application Security Program, and the DISA Net-Centric Enterprise Services project. Mr. Winograd has also supported security engineering efforts for multiple government organizations. Mr. Winograd has served as lead author for multiple NIST Special Publications (SP), including SP 800-95, Guide to Secure Web Services, and has served as a contributing author for SOARs for the DoD IATAC.

Measuring Cyber Security and Information Assurance State-of-the-Art Report (SOAR) iii
About IATAC
The Information Assurance Technology Analysis Center (IATAC) provides the Department of Defense (DoD) with emerging scientific and technical information to support information assurance (IA) and defensive information operations. IATAC’s mission is to provide DoD with a central point of access for information on emerging technologies in IA and cyber security. These include technologies, tools, and associated techniques for detection of, protection against, reaction to, and recovery from information warfare and cyber attacks that target information, information-based processes, information systems (IS), and information technology (IT). Specific areas of study include IA and cyber security threats and vulnerabilities, scientific and technological research and development, and technologies, standards, methods, and tools through which IA and cyber security objectives are being or may be accomplished.
As one of 10 Information Analysis Centers (IAC) sponsored by DoD and managed by the Defense Technical Information Center (DTIC), IATAC’s basic services include collecting, analyzing, and disseminating IA scientific and technical information; responding to user inquiries; database operations; current awareness activities (e.g., the IAnewsletter, IA Digest, IA/IO Events Scheduler, Tools Reports, and IA Research Update); and publishing critical review and technology assessments (CR/TA) reports and state-of-the-art reports (SOAR).

Measuring Cyber Security and Information Assurance State-of-the-Art Report (SOAR)iv
About IATAC
SOARs provide in-depth analyses of current and emerging technologies and technological trends; based on analyses and syntheses of the latest information produced by research and development activities, SOARs provide comprehensive assessments of those technologies and trends. Topic areas for SOARs are solicited from the DoD IA community to ensure applicability to warfighter needs.
Inquiries about IATAC capabilities, products, and services may be addressed to:
Gene Tyler, Director 13200 Woodland Park Road, Suite 6031 Herndon, VA 20171 Phone: 703/984-0775 Fax: 703/984-0773 Email: [email protected] URL: http://iac.dtic.mil/iatac SIPRNET: https://iatac.dtic.mil

Measuring Cyber Security and Information Assurance State-of-the-Art Report (SOAR) v
Table of Contents
About the Authors ........................................................................................ iAbout IATAC ................................................................................................. iiiExecutive Summary .................................................................................... xi
Section 1 Introduction ................................................................................. 11.1 Scope .................................................................................................................................... 21.2 Audience .............................................................................................................................. 31.3 Assumptions and Constraints .............................................................................................. 31.4 Terms and Definitions ........................................................................................................... 41.5 Document Structure ............................................................................................................. 6
Section 2 Background .................................................................................. 102.1 Progress Made Since 2000 .................................................................................................. 122.2 Perceptions of IA Measurement: Skeptics and Detractors ................................................. 152.3 Research and Emerging Methods ........................................................................................ 16
Section 3 Laws, Regulations, Standards, and Guidelines ........................ 203.1 Legal, Regulatory, and Policy-Driven Requirements for Measurement .............................. 22
3.1.1 FISMA ........................................................................................................................ 223.1.2 FEA ............................................................................................................................. 233.1.3 GPRA and Security Reporting ................................................................................... 243.1.4 CJCSI 6510.04 and 3401.03 ....................................................................................... 243.1.5 Other Security and Privacy-Relevant Legislation Requiring
Compliance Verification ............................................................................................. 253.2 NIST SP 800-55 Rev 1: Performance Measurement Guide
for Information Security ....................................................................................................... 253.3 ISO/IEC 27004 – Information Security Management – Measurement ............................... 303.4 ISO/IEC 21827, SSE-CMM .................................................................................................... 313.5 ISO/IEC 15408, Evaluation Criteria for Information Technology Security ........................... 333.6 FIPS 140 Evaluation............................................................................................................... 343.7 NSA INFOSEC Assurance – IA-CMM ................................................................................... 353.8 ISA ISA99 – Manufacturing and Control Systems Security ................................................ 36
Section 4 Best Practices ............................................................................... 404.1 Practical Measurement Framework for Software Assurance
and Information Security ...................................................................................................... 414.2 Assurance for CMMI ............................................................................................................ 43

Measuring Cyber Security and Information Assurance State-of-the-Art Report (SOAR)vi
Table of Contents
Section 5 Government Initiatives and Programs ...................................... 465.1 DoD IA Metrics Program ...................................................................................................... 47
5.1.1 OASD(NII) Efforts ....................................................................................................... 485.1.2 DON CIO Efforts ......................................................................................................... 495.1.3 Mission Oriented Risk and Design Analysis (MORDA) ............................................. 49
5.2 DHS ....................................................................................................................................... 515.2.1 DHS NIPP and Cyber Security Metrics...................................................................... 515.2.2 DHS/DoD/NIST Software Assurance Measurement Working Group ...................... 525.2.3 US-CERT Cyber Security Metrics for Control Systems ............................................ 54
5.3 NIST ....................................................................................................................................... 545.3.1 SAMATE ..................................................................................................................... 545.3.2 Attack-Based Measures ............................................................................................ 555.3.3 SCAP .......................................................................................................................... 56
5.4 OMB FISMA Measures ......................................................................................................... 575.5 NASA Metrics Programs ...................................................................................................... 60
5.5.1 NASA JPL Information Security Metrics Program ................................................... 605.5.2 Comparison of NASA and DoD IA Metrics Programs ............................................... 605.5.3 NASA Deputy CIO Information Security Performance Measures ............................ 61
5.6 BJS NCSS ............................................................................................................................. 62
Section 6 Industry Initiatives ...................................................................... 666.1 CISWG Metrics ..................................................................................................................... 676.2 OWASP Efforts ..................................................................................................................... 68
6.2.1 OWASP Top Ten ......................................................................................................... 686.2.2 Application Security Metrics Project ........................................................................ 696.2.3 ASVS .......................................................................................................................... 69
6.3 CIS Security Metrics Initiative ............................................................................................. 716.4 ISACA .................................................................................................................................... 726.5 Securitymetrics.org .............................................................................................................. 756.6 Security Knowledge and Awareness Measures ................................................................. 766.7 PSM Security Measurement ................................................................................................ 806.8 Microsoft Security Measures .............................................................................................. 81
6.8.1 DREAD ........................................................................................................................ 816.8.2 RASQ .......................................................................................................................... 82
6.9 ISECOM RAVs ....................................................................................................................... 836.10 @Stake BAR.......................................................................................................................... 846.11 EDUCAUSE/Internet 2 Security Task Force Sub-Working Group
on Security Metrics .............................................................................................................. 846.12 JCIAC: Statistics for Computer-Related Crime .................................................................... 856.13 DRM Effectiveness and Impact Measures .......................................................................... 866.14 Web Application Security Metrics Framework ................................................................... 866.15 SecMet .................................................................................................................................. 876.16 Surveys of “Real World” CS/IA Measurement Usage ........................................................ 88

Measuring Cyber Security and Information Assurance State-of-the-Art Report (SOAR) vii
Table of Contents
6.16.1 Frost & Sullivan 2005 Survey of Private Sector IT Security Metrics Usage ............ 886.16.2 Forrester Research 2007 and 2008 CISO Surveys .................................................... 89
6.17 Commercial Providers of CS/IA Measurement Services ..................................................... 90
Section 7 Measurable Data .......................................................................... 947.1 Red/Blue Team Evaluations .................................................................................................. 957.2 Network Management and Security Measures .................................................................. 987.3 Software Testing Output ...................................................................................................... 997.4 Scoring Schemes .................................................................................................................. 101
7.4.1 CVSS........................................................................................................................... 1017.4.2 Chris Wysopal’s CWE System Scoring ...................................................................... 1057.4.3 CCSS........................................................................................................................... 1057.4.4 CMSS ......................................................................................................................... 1067.4.5 CWSS ......................................................................................................................... 1067.4.6 Software Vendor Vulnerability Severity Ratings ...................................................... 1077.4.7 Vulnerability Reporting/Advisory Service Ratings ................................................... 1077.4.8 Attack and Threat Scoring Systems .......................................................................... 108
7.5 Vulnerability Assessment and Management ....................................................................... 1097.5.1 IAVA Statistics ........................................................................................................... 1097.5.2 US-CERT Vulnerability Note ..................................................................................... 110
7.6 Risk Management and Compliance Outputs ........................................................................ 1107.6.1 CNDSP C&A ............................................................................................................... 1117.6.2 NIST FDCC Compliance Metrics Initiative ................................................................ 1137.6.3 C&A Risk Measures ................................................................................................... 1147.6.4 Risk Measures from Event-Driven Security Products ............................................... 115
7.7 Measures Categorization and Taxonomy Efforts ................................................................ 1157.7.1 WISSSR Structure ..................................................................................................... 1167.7.2 NIST Types of Measures ........................................................................................... 1177.7.3 I3P Taxonomy of Security Metrics for Process Control Systems [154] .................... 1187.7.4 Department of Public Safety and Emergency Preparedness
Canada Taxonomy [155] ............................................................................................. 1207.7.5 VTT Technical Research Centre of Finland Security Metrics
Taxonomy for R&D Organizations [156] ..................................................................... 1217.7.6 Daniel Geer’s Balanced Scorecard-based Taxonomy ............................................... 122
7.8 Quantifying the Economic Value of Security and Assurance .............................................. 123
Section 8 Tools and Technologies ............................................................... 1308.1 Integration............................................................................................................................. 1328.2 Collection/Storage ................................................................................................................ 1338.3 Analysis/Assessment ........................................................................................................... 1348.4 Reporting .............................................................................................................................. 137

Measuring Cyber Security and Information Assurance State-of-the-Art Report (SOAR)viii
Table of Contents
Section 9 Recommendations ....................................................................... 1429.1 Stakeholder Expectations..................................................................................................... 1439.2 Success Factors .................................................................................................................... 1449.3 Methodology Gaps ............................................................................................................... 1469.4 Technology Gaps ................................................................................................................... 1479.5 Knowledge Base Gaps .......................................................................................................... 148
Appendix A Abbreviations, Acronyms, and Definitions ........................... 150
Appendix B Resources .................................................................................. 158B.1 Materials Used in Developing this SOAR............................................................................. 158B.2 Additional Print Sources of Information for Suggested Reading ........................................ 170B.3 Additional Online Sources of Information for Further Reading ........................................... 170B.4 Publicly Available CS/IA Measures Lists ............................................................................. 172
Appendix C CS/IA Measurement Before 2000 ............................................ 174C.1 Background ........................................................................................................................... 174C.2 Annualized Loss Expectancy as a CS/IA Measure .............................................................. 175C.3 DARPA IASET Measures of Assurance Research: Value-Focused Thinking ....................... 177C.4 RAI ......................................................................................................................................... 178C.5 D-IART ................................................................................................................................... 178C.6 SM Framework [180] ............................................................................................................. 179
Appendix D Conferences and Workshops ................................................... 180D.1 Workshop on Information Security System Scoring and Ranking (WISSSR) ...................... 180D.2 Fourth Workshop on Assurance Cases for Security “The Metrics Challenge” .................. 181D.3 Workshop on “Measuring Assurance in Cyberspace” ........................................................ 181D.4 MetriCon and Mini-MetriCon ............................................................................................... 182D.5 International Workshop on Quality of Protection
“Security Measurements and Metrics” ............................................................................... 182
Appendix E Research and Emerging Methods Summary ......................... 184
Appendix F Why is CS/IA Measurement Challenging ............................... 212F.1 IRC Hard Problem No. 8 Enterprise-Level Security Metrics Definition: .............................. 212F.2 NSTC IWG on Cyber Security and Information Assurance Federal Plan
for Cyber Security and Information Assurance Research and Development ..................... 216

Measuring Cyber Security and Information Assurance State-of-the-Art Report (SOAR) ix
List of Figures
Figure 3-1 Information Security Measurement Program Implementation Process [26] .............27Figure 3-2 Information Security Measures Development Process [27] ......................................27Figure 3-3 ISO/IEC 21827 Architecture [33] .................................................................................32Figure 4-1 Practical Measurement Framework for Software Assurance
and InformationSecurity [44] ......................................................................................43Figure 5-1 Software Assurance Measure Example [55] .............................................................53Figure 6-1 Most Prevalent Measures Reported to Non-IT Managers [120] ...............................89Figure 7-1 CVSS Framework [136] ..............................................................................................102Figure 8-1 Security Dashboard Example [169] ...........................................................................140Figure 9-1 Information Security Measurement Program Maturity Path [171] ..........................145
List of Tables
Table 1-1 Audience and Uses of the Measuring Cyber Security and Information Assurance SOAR .................................................................................3
Table 1-2 CS/IA Measurement Terminology Summary ................................................................4Table 1-3 Definitions of “Metrics,” “Measures,” and “Measurement”.......................................5Table 2-1 Surveys of CS/IA Measurement “State-of-the-Art” ..................................................12Table 2-2 CS/IA Measurement Discipline Progress Summary ..................................................13Table 3-1 NIST SP 800-55 Rev. 1 Document Structure ..............................................................26Table 3-2 Measures Template and Instructions [28] ..................................................................28Table 5-1 Selected DoD IA Metrics Working Group Metrics [50] .............................................49Table 5-2 Set of 10 Core Technical Security Metrics with Corresponding Ideals [57]..............54Table 5-3 SCAP Components [65] ...............................................................................................56Table 5-4 Government-wide Security Status and Progress
from Fiscal Years 2002 to 2007 [74] ...........................................................................58Table 5-5 FISMA IG Assessments Government-Wide
in Fiscal Year 2007 Results Excerpt [76] ....................................................................59Table 5-6 Comparison of DoD, USAF, and NASA JPL IA Metrics Programs [80] ......................61Table 6-1 CIS Consensus Security Metrics ................................................................................71Table 6-2 IsecT Information Security Awareness Metric ..........................................................78Table 6-3 Gartner Group Metrics for Information Security Awarenes ......................................79Table 6-4 Example of DREAD Rating of Two Attacks ................................................................82Table 6-5 EDUCASE/Internet 2 Security Metrics .......................................................................85Table 6-6 IA Measurement Service Providers............................................................................90Table 7-1 Metrics Data Captured by IDART Red Team Activities .............................................96Table 7-2 Categories of IDART Red Team Metrics ....................................................................97

Measuring Cyber Security and Information Assurance State-of-the-Art Report (SOAR)x
Table of Tables
Table 7-3 Software Testing Measures .....................................................................................100Table 7-4 CVSS Metrics by Metric Group ................................................................................103Table 7-5 DISA Vulnerability Compliance Tracking System Measures ...................................109Table 7-6 WISSSR Measures ................................................................................................... 116Table 7-7 NIST Types of Measures .......................................................................................... 117Table 7-8 Mapping of Measurable Security Elements to Metrics Categories........................ 119Table 7-9 I3P Taxonomy of Security Metrics for Process Control Systems ............................120Table 7-10 Department of Public Safety and Emergency Preparedness Taxonomy ................. 121Table 7-11 VTT Technical Research Centre of Finland Security
Metrics Taxonomy for R&D ...................................................................................... 121Table 7-12 Daniel Geer’s Balanced Scorecard Taxonomy with Sample Metrics ......................123Table 8-1 CS/IA Measurement Integration (Frameworks/Platforms) Tools ............................132Table 8-2 CS/IA Measurement Collection/Storage Tools ........................................................133Table 8-3 CS/IA Measurement Analysis and Assessment Tools .............................................134Table 8-4 CS/IA Measures Reporting Tools .............................................................................138Table 9-1 Common CS/IA Measurement Stakeholder Expectations .......................................143Table C-1 Renowned Existing CS/IA Measures .......................................................................175Table E-1 CS/IA Measurement Research .................................................................................185

Measuring Cyber Security and Information Assurance State-of-the-Art Report (SOAR) xi
Executive Summary
The rapid growth of connections, processing, bandwidth, users, and global dependence on the Internet has greatly increased vulnerabilities of information technology (IT) infrastructure to increasingly sophisticated and motivated attacks. Despite significantly increased funding for research, development, and deployment of information assurance (IA) defenses, reports of attacks on, and damage to the IT infrastructure are growing at an accelerated rate.
While a number of cyber security/IA (CS/IA) strategies, methods, and tools exist for protecting IT assets, there are no universally recognized, reliable, and scalable methods to measure the “security” of those assets. CS/IA practitioners’ success in protecting and defending an uninterrupted flow of information on IT systems and networks is critically dependent upon their ability to accurately measure in real time the security status of the local system as well as on their understanding of the security status of regional, national, and international networks.
This report assesses the current “state of the art” in CS/IA measurement to facilitate further research into this subject. Progress has been made, but much remains to be done to achieve the goal of real-time, accurate CS/IA measurement. Enabling such measurement would make it is possible to understand, improve, and predict the state of CS/IA.

Measuring Cyber Security and Information Assurance State-of-the-Art Report (SOAR)xii
Executive Summary
While the CS/IA measurement discipline—which encompasses a number of associated areas of interest, including system security, software assurance, and privacy—is still evolving, progress has been made since the Defense Technical Information Center’s (DTIC) Information Assurance Technical Analysis Center (IATAC) published its IA Metrics Critical Review/Technology Assessment (CR/TA) Report nearly 10 years ago. Clear themes and success factors have emerged as a result of research, publication of standards and guidelines, and a number of government and industry initiatives. However, further efforts are needed to advance the CS/IA measurement discipline, including new policy, processes, and research.
Increasing awareness is needed within the stakeholder community about what is required to make measures useful for quantifying and improving CS/IA. This shared understanding is critical to defining and mounting successful research and implementation efforts in this field.
The following are critical success factors for organizations that embark on implementing CS/IA measures—
f Management commitment to provide appropriate resources for CS/IA measurement programs, to use CS/IA measures produced by these programs for decision making, and to mature those programs over time;
f Investment in obtaining solid data that can support increased fidelity of and confidence in produced results;
f Continuous use of CS/IA measures to proactively determine and implement CS/IA improvements;
f Establishment of meaningful and easy to use measures to ensure maximum usability and cost-effectiveness of CS/IA measurement.
BackgroundThe CS/IA measurement discipline has experienced significant positive change since 2000, when debates raged about whether measuring CS/IA was even possible, how measurement could be performed (i.e., what processes should be used, what should be measured), and whether measuring “it” would even be useful. Today, many building blocks are in place to enable further progress and research, and IA practitioners mostly agree that CS/IA measurement is valuable and desirable.
In July 2003, the National Institute of Standards and Technology (NIST) published its Special Publication (SP) 800-55, Security Metrics Guide for Information Technology Systems, which represented one of the first major efforts to define CS/IA measurement, and to provide a methodology for implementing CS/IA measurement across the federal government. The SP was revised in July 2008 to bring it into closer alignment with legislative and regulatory requirements and with emerging best practices in the CS/IA measurement field.

Measuring Cyber Security and Information Assurance State-of-the-Art Report (SOAR) xiii
Executive Summary
State of the ArtThe current state of the art for CS/IA measurement is characterized briefly below.
Standards, Guidelines, and Best Practices DocumentsStandards, guidelines, and best practices documents have emerged to define and describe processes, frameworks, and metamodels for CS/IA measurement. Those interested in embarking upon CS/IA measurement can use and tailor these standards and guidelines to structure their programs and processes in a robust and repeatable way to facilitate long-term viability and success. Generally, these standards and guidelines fall into the following categories—
f Processes for developing information security measures to assess effectiveness of enterprise or system-level security controls and implementing the measures (These types of documents often include example measures, such as “percentage of high impact vulnerabilities mitigated within organizationally defined time periods after discovery,” “percentage of users with access to shared accounts,” and “number of relevant attack patterns covered by executed test cases”);
f Maturity model frameworks that provide a method for evaluating IA processes and assigning a maturity level to a grouping of security processes, based on specific criteria (These frameworks provide a means for benchmarking of IA aspects of projects and organizations against these criteria.);
f Product evaluation frameworks that assess the level of assurance CS/IA products provide against specific criteria, and assigning a product evaluation level based on these criteria.
“Measurable” DataAn abundance of CS/IA data can now be collected, analyzed, and presented via a variety of manual, and semi- and fully automated techniques and tools. The resulting measurable data can be used to combine, correlate CS/IA data and report status to decision makers, and to create and employ increasingly sophisticated, complex CS/IA measures to advance overall understanding of CS/IA status and health. Emerging enumeration and scoring systems, such as Common Vulnerabilities and Exposures (CVE), Common Weakness Enumeration (CWE), and Common Vulnerabilities Common Scoring System (CVSS), provide uniform means for quantification, ranking, and evaluation of CS/IA, and enable identification, prioritization, and targeted remediation of specific weaknesses or vulnerabilities, based on severity and impact.

Measuring Cyber Security and Information Assurance State-of-the-Art Report (SOAR)xiv
Executive Summary
Regulatory Drivers and Federal Government ActivityNumerous laws, rules, and regulations include or imply requirements for CS/IA performance measurement; for example, most IA compliance verification requirements are best satisfied using measurement techniques. Many CS/IA measurement tools and measures are being generated as a means of demonstrating compliance with legislation, regulation, and policy, such as the Federal Information Security Management Act (FISMA) and the President’s Management Agenda (PMA).
The federal government has become increasingly active in pursuit of CS/IA measurement, and has established a number of programs to—
f Provide guidance for implementing measurement programs within the government,
f Research additional measures for future programs, f Provide oversight by measuring the security posture of different
government systems and agencies.
Industry InitiativesA multiplicity of industry consortia are working to create, implement, and deploy CS/IA measures of various sorts, including the Center for Internet Security (CIS), Open Web Application Security Project (OWASP), securitymetrics.org, and others. The goal of these industry initiatives is to improve CS/IA measurement programs throughout both industry and government; much of their work is publicly accessible.
Research LandscapeResearch abounds within academic, industrial, and government research organizations to define meaningful measures and measurement methodologies of the security and assurance of technologies and processes, criticality of vulnerabilities, and severity of threats and attacks. Government research efforts have most notably focused on context-specific approaches to measurement of software assurance, control system security, and attack-based measurement.
Industry research has also focused on specific CS/IA measurement approaches and lists of measures, and on providing community forums for practitioners and others interested in the CS/IA measurement discipline.
Automation through ToolsAutomated tools are available that provide a means to non-intrusively collect quantifiable data that can facilitate better quality of measurement. However, aside from some compliance and analytical tools, few commercial software products are being actively marketed as CS/IA measurement tools. Most tools that serve this purpose are purpose-built custom applications, which may or may not incorporate commercial technologies. While there is much

Measuring Cyber Security and Information Assurance State-of-the-Art Report (SOAR) xv
Executive Summary
information posted on the Web about CS/IA measurement methodologies, lessons learned, sound practices, and examples, there is little available public information regarding CS/IA measurement tools.
Recommendations for Further ResearchWork continues in the CS/IA community to define what exactly is measurable, which measures are most useful and meaningful, and how to maximize the value of measurement. However, those in the CS/IA stakeholder community still vary in their expectations and opinions regarding the feasibility of CS/IA measurement, and the value that CS/IA measurement can provide.
Further progress is required to reach the desired end state that has been defined by many stakeholders, including researchers and users of CS/IA measures and measurement methodologies. The following are areas in which further effort is needed to advance the state of the art—
f A standard set of converged definitions and vocabulary needs to be adopted for discussions of CS/IA measurement and measures.
f Common data formats for expressing CS/IA measures information need to be developed and adopted across commercial CS/IA measurement tools and methodologies.
f Existing CS/IA measurement efforts need to be actively sustained and advanced.
f Organizations need to define and adopt standardized sets of minimum measures and standardized techniques for measurement.
f Methodologies for creating real-time measures need to be researched and implemented to provide immediate feedback and diagnosis of security events (e.g., intrusions).
f Methodologies for creating “self-healing” measures need to be developed, whereby a measurement threshold would trigger the autonomic response, correction, etc., of the condition that tripped the threshold.
f There needs to be investment into data modeling of CS/IA measures and measurable outcomes associated with CS/IA activities.
f Measurement expertise and lessons learned from other disciplines, such as quality and safety, should be leveraged to refine and improve CS/IA measurement.
f Training/education and, ultimately, professional certification need to be made available to create a skilled/trained labor force that is expert in and dedicated to CS/IA measurement.

1Introduction
“Without measurement and metrics, the level of information security hinges on guesswork and estimates.”
Anni Sademies, VTT Technical Research Centre of Finland [1]

Measuring Cyber Security and Information Assurance State-of-the-Art Report (SOAR) 1
Section 1 Introduction
Measuring information assurance (IA) and cyber security has occupied the minds of information security practitioners for a
long time. Enabling such measurement would mean that it is possible to understand, improve, and predict the state of IA and cyber security, which is still an elusive objective.
While cyber security and information assurance (CS/IA) measurement is an evolving discipline, much progress has been made in the last 10 years. Clear themes and success factors have emerged as a result of research, publication of standards and guidelines, and a number of United States (US) government and industry initiatives.
This State of the Art Report (SOAR) presents the current state of the CS/IA measurement discipline and associated areas of interest, such as system security, software assurance, and privacy. It summarizes the progress made in the CS/IA measurement discipline since the publication by the Defense Technical Information Center’s (DTIC) Information Assurance Technical Analysis Center (IATAC) of its Critical Review/Technology Assessment (CR/TA) Report, titled IA Metrics (available for download from .gov and .mil at: http://iac.dtic.mil/iatac/pdf/ia_metrics.pdf).
This SOAR also identifies gaps in the current efforts and proposes areas of focus for the future to enable further progress in the CS/IA measurement discipline.

Measuring Cyber Security and Information Assurance State-of-the-Art Report (SOAR)2
Section 1 Introduction
1.1 ScopeThis Measuring Cyber Security and Information Assurance SOAR includes a broad set of subjects, from current CS/IA measures development methodologies and the multitude of definitions of CS/IA measures, to research on attack-based measures and software assurance measurement. The report lists currently used terms and definitions that describe CS/IA measurement activities found in national and international standards and best practices documents, including those addressing IA, cyber security, and information security.
The SOAR summarizes existing standards, guidelines, and best practices for development and implementation of CS/IA measurement, including those defined by the National Institute of Standards and Technology (NIST), International Organization for Standardization (ISO), Department of Homeland Security (DHS) Software Assurance (SwA) Measurement Working Group (WG), Open Web Application Security Project (OWASP), securitymetrics.org, and others. The SOAR addresses both quantitative and qualitative measures, such as maturity model rankings and other ratings methods.
This report describes a variety of CS/IA activities that provide measurable data and statistics on IA, which are sometimes referred to as
“measures” or “metrics,” such as blue team/red team evaluations, Computer Network Defense (CND) assessments, static and dynamic code reviews, vulnerability and network management, Federal Information Security Management Act (FISMA) evaluations, Certification and Accreditation (C&A), and other activities.
The SOAR also describes current efforts to make security more measurable through a variety of protocols and enumerations as well as through activities that leverage these protocols and enumerations. These activities include the National Vulnerabilities Database (NVD), Common Vulnerabilities and Exposures (CVE), Common Weakness Enumeration (CWE), Common Configurations Enumeration (CCE), Common Vulnerabilities Common Scoring System (CVSS), Common Configurations Scoring System (CCSS), and Secure Content Automation Protocol (SCAP) Program. This SOAR provides pointers and links to publicly available CS/IA measures lists, including those available from NIST Special Publication (SP) 800-55 Revision (Rev.) 1, Performance Measurement Guide for Information Security, July 2008, DHS SwA Measurement WG, and others.
The SOAR summarizes existing research within and outside of the Department of Defense (DoD) and the federal government on the subject of CS/IA measurement, and identifies gaps in the research. The report also summarizes current views and existing approaches to quantifying economic value of security, such as return on investment (ROI) and other economic indicators, and identifies linkages with CS/IA measurement activities required to support creation of these economic indicators.

Measuring Cyber Security and Information Assurance State-of-the-Art Report (SOAR) 3
Section 1 Introduction
Finally, the SOAR also addresses the reasons why so many CS/IA measurement efforts fall short of the expectations that stakeholders place on these efforts, and describes characteristics of successful efforts. The SOAR identifies existing gaps between expectations and the state of the art, and provides recommendations for filling the identified gaps, where appropriate.
This SOAR is not intended to provide a comprehensive or exhaustive depiction of the entire CS/IA measurement discipline. Rather, it seeks to provide enough information to accurately represent the current state of the art in CS/IA measurement and associated research, without covering every single set of CS/IA measures, CS/IA measurement model or methodology, or CS/IA measurement activity or research project undertaken in the past decade.
1.2 Audience This Measuring Cyber Security and Information Assurance SOAR is intended to speak to a broad audience of CS/IA practitioners, researchers, and government officials. The authors of the report hope that its readers will use the SOAR for a number of purposes, as depicted in Table 1-1.
Table 1-1 Audience and Uses of the Measuring Cyber Security and Information Assurance SOAR
Educ
atio
n an
d A
war
enes
s
Futu
re R
esea
rch
Less
ons
Lear
ned
Valu
e an
d A
ppro
pria
te
Expe
ctat
ions
Government and industry CS/IA practitioners 4 4 4 4
Science and technology/research and development community, including DoD and civil agency Science and Technology (S&T) organizations and Research and Development (R&D) labs, and academic and industry research organizations that support the government
4 4 4 4
Senior DoD and civil agency officials responsible for governance, compliance, certification, accreditation, risk management, and/or any aspect of CS/IA or Information Technology (IT)-related metrics/ measurement
4 4 4 4
1.3 Assumptions and ConstraintsIn this document, “CS/IA” is used in the broadest possible sense to include the following disciplines: IA, computer security, cyber security, network security, information technology security, system security, system assurance, software security, software assurance, application security, privacy, and quality of protection. CS/IA is also used to address security, privacy, and related assurance concerns, activities, and practices within business and technical processes.

Measuring Cyber Security and Information Assurance State-of-the-Art Report (SOAR)4
Section 1 Introduction
The authors of this SOAR assume that the reader is well-versed in CS/IA concepts and terminology. The authors also assume that the reader has a basic understanding of measurement concepts before undertaking to read this SOAR.
The source material used by the authors in preparing this SOAR was limited to publicly accessible and open source information that is unclassified and without distribution restriction.
The time frame covered by this SOAR, and considered to represent the current “state of the art,” is 2000 to the present.
1.4 Terms and Definitions
“There is often confusion with the words we use when discussing measurement—metrics, measures, indicators, and predictors are frequently used interchangeably.” [2]
The terms “metric,” “measure,” and “measurement” tend to be considered interchangeable across the CS/IA community. Based on the research performed for this SOAR, there is a distinction between how these terms are viewed, as illustrated in Table 1-2.
Table 1-2 CS/IA Measurement Terminology Summary
Term Definition
A measurement Raw data that quantifies a single dimension of the thing to be measured, e.g., the number of vulnerabilities in a software module
Metric Data processed from two or more measurements to demonstrate a significant correlation between them; for example the correlation between “number of vulnerabilities” (measurement #1) and “number of lines of code” (measurement #2)—a metric that demonstrates a direct relationship between the size of a software module and the number of vulnerabilities it contains. Metrics can, in this way, be used to quantify the degree to which a system, component, or process possesses a given security attribute.
Measure Same as metric. Adopted by national and international standards and guidelines in lieu of “metric.”
Measurement The act (or process) of measuring
Many IA-focused standards and documents define “metrics,” “measures,” and/or “measurement” generically, without qualifying that their
definitions apply to IA metrics/measures/measurement. It is expected that because these standards/documents are IA-focused, readers understand that IA is the intended context for these definitions.
Various measurement scales should be considered for CS/IA measurement: nominal, ordinal, interval, and ratio. It is important to note that CS/IA measures tend to be ordinal.
The word “metric,” used by many in the industry, has been slowly disappearing from national and international standards and guidelines, which increasingly favor the term “measure” (in lieu of “metric”) to indicate a quantifiable statement, with “measurement” being the process of obtaining a

Measuring Cyber Security and Information Assurance State-of-the-Art Report (SOAR) 5
Section 1 Introduction
measure. For example, while the original NIST SP 800-55, Performance Measurement Guide for Information Security, published in July 2003, used the word “metric,” Rev. 1 of this Special Publication, published in July 2008, uses the word “measure.” International Organization for Standardization/International Electrotechnical Commission (ISO/IEC) 27004, Information technology – Security techniques – information security management – Measurement, [3] and ISO/IEC 15939, Systems and software engineering – Measurement process, [4] use the word “measures” as well.
Regardless of specific terminology, there appears to be near-universal agreement that the ability to quantify the effectiveness of security protections/countermeasures and the security of processes are highly desirable.
Table 1-3 lists leading definitions of “metric(s),” “measure(s),” and “measurement,” specifically those presented in documents about IA (in the
broad sense in which it is used in this document), and those that directly pertain to quantification or measurement in the context of IA.
Table 1-3 Definitions of “Metrics,” “Measures,” and “Measurement”
Definition Source
Metrics—Data used to facilitate decision-making and improve performance and accountability through collection, analysis, and reporting of relevant performance-related data
Elizabeth Chew, Marianne Swanson, Kevin Stine, Nadya Bartol, Anthony Brown, and Will Robinson. NIST SP 800-55 Rev. 1, Performance Measurement Guide for Information Security. Accessed 19 December 2009 at: http://csrc.nist.gov/publications/nistpubs/800-55-Rev. 1/SP800-55-rev1.pdf.
Measure—[5] A variable to which a value is assigned as the result of measurement
ISO/IEC 27004, Information Technology – IT Security Techniques – Information Security Management – Measurement and ISO/IEC 15939, Systems and software engineering – Measurement process. [6]
Measurement—The process of obtaining information about the effectiveness of Information Security Management Systems (ISMS) and controls using a measurement method, a measurement function, an analytical model, and decision criteria
ISO/IEC 27004, Information technology – Security techniques – Information security management – Measurement
Security Metrics—A set of key indicators that tell [organizations] how healthy their security operations are, on a stand-alone basis and with respect to peers
Andrew Jaquith. Security Metrics: Replacing Fear, Uncertainty, and Doubt. (Upper Saddle River, NJ: Addison-Wesley, 2007)
Security Metric—A measurement that is coupled with a scale or benchmarks to evaluate security performance
Institute for Information Infrastructure Protection
Security Metric—The standard measurement of computer security
Rosenblatt, Joel. “Security Metrics: A Solution in Search of a Problem,” in EDUCAUSE Quarterly, Vol. 31 No. 3, July-September 2008. Accessed 22 December 2008 at: http://connect.educause.edu/Library/EDUCAUSE+Quarterly/SecurityMetricsASolutioni/47083

Measuring Cyber Security and Information Assurance State-of-the-Art Report (SOAR)6
Section 1 Introduction
Definition Source
Metric—A system of related measures enabling quantification of some characteristic. A measure is a dimension compared against a standard.
Security metric—A system of related dimensions (compared against a standard) enabling quantification of the degree of freedom from possibility of suffering damage or loss from malicious attack
Abbadi, Zed, The Public Company Accounting Oversight Board. “Security Metrics: What Can We Measure?” Presented at OWASP Northern Virginia Chapter Meeting, Herndon, Virginia, 19 April 2007. Accessed 2 January 2009 at: http://www.owasp.org/images/b/b2/Security_Metics-_What_can_we_measure-_Zed_Abbadi.pdf
Metrics—Quantifiable measurements of some aspect of a system or enterprise. For an entity (system, product, or other) for which security is a meaningful concept, there are some identifiable attributes that collectively characterize the security of that entity.
Security metric (or combination of security metrics)—A quantitative measure of how much of that attribute the entity possesses. A security metric can be built from lower-level physical measures. Security metrics focus on the actions (and results of those actions) that organizations take to reduce and manage the risks of loss of reputation, theft of information or money, and business discontinuities that arise when security defenses are breached.
SSE-CMM Security Metrics. Accessed 6 January 2009 at: http://www.sse-cmm.org/metric/metric.asp
IA Metrics—(1) Standards of measurements used in IA; (2) evaluation of overall security “goodness” or quality, or the quality of some specific attribute; (3) measures that gauge an organization’s ability to protect against, detect and respond to IA attacks; and/or (4) IA performance trends over time based on repeatable measurements at regular intervals
Participants in the 2001 Workshop on Information Security System Scoring and Ranking (WISSSR) [7]
The remainder of the SOAR uses the terms used in the original materials summarized in this SOAR. When no term is used, the SOAR uses the term
“measure” to the maximum possible extent.
1.5 Document StructureIn addition to the executive summary, this SOAR is composed of nine sections and six appendices, described below—
f Section 1. Introduction—Provides the rationale for publishing this SOAR and describes the intended audience and content. In addition, the Introduction describes several definitions of the terms “metric,”
“measure,” and “measurement” that are in use. f Section 2. Background—Provides an overview of the progress of CS/IA
measurement research and practice since 2000, cross-referencing the rest of the document where applicable. It summarizes background information on previous surveys of the CS/IA measurement state of the art, in particular, the IATAC IA Metrics CR/TA released in 2000. This section also provides insight into criticism of CS/IA measurement as well as a brief discussion of ongoing CS/IA measurement research.

Measuring Cyber Security and Information Assurance State-of-the-Art Report (SOAR) 7
Section 1 Introduction
f Section 3. Laws, Regulations, Standards, and Guidelines—Provides an overview of relevant laws and regulations as well as major standards and guidelines published at the time of this writing.
f Section 4. Best Practices—Provides a general overview of published best practices that describe the development and implementation of CS/IA measurement programs and activities.
f Section 5. Government Initiatives and Programs—Provides an overview of CS/IA measurement initiatives and programs run by the federal government. Specifically, this section focuses on activities underway at DoD, DHS, NIST, Office of Management and Budget (OMB) and National Aeronautics and Space Administration (NASA).
f Section 6. Industry Initiatives—Provides an overview of CS/IA measurement initiatives and programs within industry, illustrating the large number of efforts underway for creating, implementing, and deploying measures. There is a wide range of interest in CS/IA measurement throughout industry, including security consulting firms, commercial off-the-shelf (COTS) product vendors, and security consortia as well as organizations dedicated solely to the advancement and development of CS/IA measures and measurement techniques.
f Section 7. Measurable Data—Provides an overview of various activities that collect and capture IA-related data that can be used to produce CS/IA measures.
f Section 8. Tools and Technologies—Provides an overview of the tools and technologies available for gathering, processing, and reporting CS/IA measures within an organization. Specifically, this section provides lists of tools needed to support CS/IA measurement: integration, collection/storage, analysis, and reporting.
f Section 9. Recommendations—Provides observations and recommendations that resulted from the analysis of the data gathered for this report, specifically regarding common CS/IA stakeholder expectations, success factors, gaps in current approaches, and areas for additional investment and research.
f Appendix A. Abbreviations, Acronyms, Definitions—Lists and amplifies all abbreviations, acronyms, and definitions used in this SOAR.
f Appendix B. Resources—Lists online and print works and other resources cited and suggested for further investigation by interested readers.
f Appendix C. CS/IA Measurement Before 2000—Summarizes CS/IA measurement efforts performed prior to the period addressed in this SOAR. Specifically, this appendix describes the use of Annualized Loss Expectancy, Value-focused Thinking, Resilience Assurance Index, Defense Information Assurance Red Team Methodology, and the Security Measurement Framework.

Measuring Cyber Security and Information Assurance State-of-the-Art Report (SOAR)8
Section 1 Introduction
f Appendix D. Conferences and Workshops—Lists conferences and workshops for further investigation by interested readers.
f Appendix E. Research and Emerging Methods Summary—Lists current CS/IA measurement research activities with short summaries of these efforts.
f Appendix F. Why Is CS/IA Measurement Challenging—Discusses the Information Security (INFOSEC) Research Council’s Hard Problems List and National Science and Technology Council Interagency Working Group on Cyber Security and Information Assurance’s Federal Plan for Cyber Security and Information Assurance Research and Development, which describe the difficulties associated with CS/IA measurement research.
References1 Anni Sademies, VTT Technical Research Centre of Finland. Process Approach to Information Security
Metrics in Finnish Industry and State Institutions. Thesis for University of Oulu, Finland; published as VTT Publication 544, 2004. Accessed 6 January 2009 at: http://www.vtt.fi/inf/pdf/publications/2004/P544.pdf
2 Rayford B. Vaughn and Ambareen Siraj, Mississippi State University, and Ronda Henning, Harris Corporation, Government Communications Systems Division. “Information Assurance Measures and Metrics—State of Practice and Proposed Taxonomy,” in Proceedings of the 36th Hawaii International Conference on System Sciences (HICSS-36), 6-9 January 2003. Accessed 19 January 2008 at: http://citeseerx.ist.psu.edu/viewdoc/summary?doi=10.1.1.71.184
-and- Rayford B. Vaughn, Ambareen Siraj, and David A. Dampier, Mississippi State University. “Information Security System Rating and Ranking.” CrossTalk: The Journal of Defense Software Engineering, May 2002. Accessed 19 January 2009 at: http://www.stsc.hill.af.mil/crosstalk/2002/05/vaughn.html
3 IsecT Ltd. International Organization for Standardization/International Electrotechnical Commission (ISO/IEC) 27004, Information Technology – IT Security Techniques – Information Security Management – Measurement (Draft). Accessed 20 April 2009 at: http://www.iso27001security.com/html/27004.html
4 International Organization for Standardization. Abstract available at: http://www.iso.org/iso/catalogue_detail.htm?csnumber=44344 (accessed 20 April 2009).
5 This definition applies to what some sources refer to as “a measurement,” not to be confused with “measurement,” which is the act of measuring. Note that the term “measures” is used to refer
collectively to base measures, derived measures, and indicators. For example, the comparison of a measured defect rate to a planned defect rather, along with the assessment of whether or not the discrepancy between them indicates a problem.
6 The source documents avoid the term “metrics” altogether. However, the document’s definition of the term “measurement results,” i.e., “one or more indicators and their associated interpretations that address an information need,” makes it clear that “measurement results” is a new term intended to replace to what many sources refer to as “metrics.”
7 Applied Computer Security Associates and The MITRE Corporation (co-sponsors) Proceedings: Workshop on Information Security System Scoring and Ranking Information System Security Attribute Quantification or Ordering (Commonly but improperly known as security metrics), Williamsburg, Virginia, May 21-23, 2001, (commonly referred to as the Workshop on Information Security System Scoring and Ranking [WISSRR]). Accessed 8 April 2009 at: http://www.acsac.org/measurement/proceedings/wisssr1-proceedings.pdf

Measuring Cyber Security and Information Assurance State-of-the-Art Report (SOAR) 9
Section 1 Introduction

“The dearth of quantitative methods for measuring, forecasting, and improving computer security has left those of us who depend on information systems in a precarious state…. Because quantitative metrics have not been available, our security decisions have instead relied upon the opinions of those believed to be experts, anecdotal evidence, and other heuristics.”
Stuart Edward Schechter, Harvard University [8]
2Background

Measuring Cyber Security and Information Assurance State-of-the-Art Report (SOAR) 11
Section 2 Background
In 2000, IATAC released its CR/TA entitled IA Metrics, [9] which intended to engender and facilitate the discussion of measurement
within the IA community, and to provide guidance to organizations in the development of IA metrics and the establishment of organizational IA metrics programs. Specifically, the CR/TA described a metrics development methodology (with specific examples of metrics that could be derived when the methodology was used) that later formed the basis for NIST SP 800-55, Security Metrics Guide for Information Technology Systems, [10] published in July 2003.
To some extent, the CR/TA also provided a “snapshot” of the state of the art of the CS/IA measurement discipline in the late 1990s, including descriptions of ongoing initiatives at that time to develop, collect, and use CS/IA measures.
In terms of depicting the state of the art, this SOAR picks up where that CR/TA left off, providing a more extensive and detailed depiction of the state of the art of CS/IA measurement since the CR/TA’s publication in 2000.
In addition to the IA Metrics CR/TA, a number of research reports, papers, and books predating this SOAR have attempted to characterize the state of the art of CS/IA measurement. Appendix C provides a more detailed description of some of the concepts and research produced before 2000 when the CR/TA was published.
Since 2000, further reports, papers, and books have been published that are dedicated to the study of CS/IA measurement and proposing ways and means for implementing it. The most noteworthy among these surveys are listed in Table 2-1.

Measuring Cyber Security and Information Assurance State-of-the-Art Report (SOAR)12
Section 2 Background
Table 2-1 Surveys of CS/IA Measurement “State-of-the-Art”
Reference CS/IA Measurement Content
Martin Stoddard, Deborah Bodeau, Rolf Carlson, Cliff Glantz, Yacov Haimes, Chenyang Lian, Joost Santos, James Shaw. “Process Control System Security Metrics—State of Practice,” I3P Research Report No. 1, August 2005. Accessed 1 April 2009 at: http://www.thei3p.org/docs/publications/ResearchReport1.pdf
Appendix A provides an extensive survey of security measurement activities and resources, with matrices describing the scope of each activity/resource and commenting on its relevance to process control system security.
Adam R. Bryant, Capt. USAF. Developing a Framework for Evaluating Organizational Information Assurance Metrics Programs. Master of Science Thesis for Air Force Institute of Technology, Dept. of the Air Force Air University. AFIT/GIR/ENV/07-M5, March 2007. Accessed 1 April 2009 at: https://www.afresearch.org/skins/rims/q_mod_be0e99f3-fc56-4ccb-8dfe-670c0822a153/q_act_downloadpaper/q_obj_217f0dc1-baf2-47c8-a458-60956d23bc05/display.aspx?rs=enginespage
Includes an extensive review of existing CS/IA measurement literature
Anni Sademies, VTT Electronics. Process Approach to Information Security Metrics in Finnish Industry and State Institutions. Thesis for University of Oulu, Finland; published as VTT Publication 544, 2004. Accessed 6 January 2009 at: http://www.vtt.fi/inf/pdf/publications/2004/P544.pdf
Includes a survey of literature on CS/IA measurement as well as a survey of information security metrics used in Finnish industrial companies and state institutions, with the rationales behind their use
Nabil Seddigh, Peter Pieda, Ashraf Matrawy, Biswajit Nandy, John Lambadaris, and Adam Hatfield (for Dept. of Public Safety and Emergency Preparedness Canada). “Current Trends and Advances in Information Assurance Metrics.” Accessed 1 April 1, 2009 at: http://dev.hil.unb.ca/Texts/PST/pdf/seddigh.pdf -and- Solana Networks. “Evaluating the Information Assurance of IT Networks Using Quantitative Metrics,” in Proceedings of the 2nd Annual Conference on Privacy, Security, and Trust, New Brunswick, Canada, 13-15 October 2004 (paper dated 22 September 2004).
Includes an overview of existing CS/IA measurement studies, trends, tools, and taxonomies
Andrew Jaquith. Security Metrics: Replacing Fear, Uncertainty, and Doubt (Upper Saddle River, New Jersey: Addison-Wesley/Pearson Education, 2007).
Integrated throughout are informative discussions of many existing metrics, measurement methodologies, and related standards
Debra S. Hermann. Complete Guide to Security and Privacy Metrics: Measuring Regulatory Compliance, Operational Resilience, and ROI (Boca Raton, Florida: Auerbach Publications, 2007).
A comprehensive study of security and privacy metrics with proposed lists of metrics for a number of areas
Victor-Valeriu Patriciu and Iustin Priescu, Military Technical Academy, Bucharest, Romania, and Sebastian Nicolaescu, Verizon. “Security Metrics for Enterprise Information Systems,” in Journal of Applied Quantitative Methods, Volume 1, Issue 2, 30 December 2006. Accessed 23 March 2009 at: http://jaqm.ro/issues/volume-1,issue-2/4-SecurityMetricsForEIS.php; also http://jaqm.ro/issues/volume-1,issue-2/pdfs/patriciu_priescu_nicolaescu.pdf
A presentation of existing standards and measures from across numerous sources, including Jaquith and NIST SP 800-55
2.1 Progress Made Since 2000The CS/IA measurement discipline has experienced significant positive change since 2000. Then, the debate was about whether measuring CS/IA was possible, how measurement was to be performed, what processes should be used, what should be measured, and whether measuring “it” would ever be useful.

Measuring Cyber Security and Information Assurance State-of-the-Art Report (SOAR) 13
Section 2 Background
Today, there is no doubt—CS/IA measurement is possible, there are plenty of processes and methodologies to do it, and it is definitely valuable. While work continues in defining what exactly is measurable, which measures are most useful, and how to maximize the value of measurement, there has been significant forward movement.
The current “state of the art” period for CS/IA measurement (i.e., the period covered by this SOAR) could be said to have begun with the 2001 WISSSR, [11] which was the first such gathering devoted solely to the discussion, by IA and measurement practitioners, of the state of the CS/IA measurement discipline. Participants in the workshop submitted position papers regarding the state of the discipline and, in many cases, describing the work they had done to define CS/IA measures, measurement techniques, and measures definition methods. Participants discussed (and often debated) the relative merits of different approaches and emphases in the subject matter addressed by the workshop.
Since then, through research, standardization, and technological advancements, a number of building blocks have been put in place that can be used today to begin measuring CS/IA. While these building blocks are not perfect, they are sufficient to start the process, provide useful information about the status of CS/IA to their users, and evolve CS/IA measurement toward measuring outcomes and the value of CS/IA. Table 2-2 lists the most noteworthy efforts and activities that facilitate advancement of CS/IA measurement discipline. The table also provides references to sections in this SOAR where particular CS/IA measurement efforts are addressed. Sections 3 through 8 provide further information on these and other relevant efforts.
Table 2-2 CS/IA Measurement Discipline Progress Summary
Description ReferenceSOAR Section
Standards, guidelines, and best practices documents that provide processes, frameworks, and metamodels for CS/IA measurement. Those interested in embarking upon CS/IA measurement can use these standards and guidelines to structure their programs and processes in a robust and repeatable way to facilitate long term viability and success.
NIST SP 800-55 Rev. 1, Performance Measurement Guide for Information Security, July 2008
Section 3.2
ISO/IEC 27004, Information technology – Security techniques – Information security management – Measurement (draft)
Section 3.3
SwA Measurement Working Group. Practical Measurement Framework for Software Assurance and Information Security, Version 1.0, October 2008
Section 4.1
Automated tools focused on specific challenges that gather quantifiable data. These tools provide ways of gathering data that can be quantified in a more exact and less intrusive way than widely spread manual data collection to facilitate better quality of data and less disruption to operations for the sake of measurement.
Static and dynamic code analyzers Section 8.3
FISMA tools Section 8.2
Reporting and dashboard tools Section 8.4

Measuring Cyber Security and Information Assurance State-of-the-Art Report (SOAR)14
Section 2 Background
Description ReferenceSOAR Section
US Government research efforts focusing on specific aspects of CS/IA measurement. These efforts explore context-specific approaches for CS/IA measurement that address software assurance, control systems, attack-based measures, and other applications of the broader CS/IA measurement question.
DHS/DoD/NIST SwA Measurement WG Section 5.2.2
United Statement Computer Emergency Response Team (US-CERT) Cyber Security Metrics for Control Systems
Section 5.2.3
NIST Software Assurance Metrics And Tool Evaluation (SAMATE) Program
Section 5.3.1
Attack-Based Measures Section 5.3.2
NIST SCAP Program Section 5.3.3
Industry efforts focusing on specific aspects of CS/IA measurement. These efforts provide specific approaches for measuring, lists of measures as well as community forums for those interested in this subject to learn about and contribute to progression of the discipline.
Corporate Information Security Working Group (CISWG) Section 6.1
OWASP Section 6.2
Center for Internet Security (CIS) Section 6.3
Securitymetrics.org Section 6.5
Security knowledge and awareness measures Section 6.6
CS/IA data collected by a variety of manual, automated, and semi-automated efforts that can be leveraged to collect, analyze, and report complex Certified Information Systems Auditor (CISA) measures. These efforts provide valuable data that can be used to—
f Combine, correlate, and report CS/IA status to decision makers;
f Create and use sophisticated CS/IA measures to advance overall understanding of CS/IA heath and status.
IA Assessments Section 7.1
Network management and security measures Section 7.2
Software testing output Section 7.3
Vulnerability assessment and management Section 7.5
Emergence of enumerations and scoring systems. Enumerations and scoring systems provide means of uniform counting, ranking, and evaluating CS/IA that were not possible in 2000.
CVSS Section 7.4.1
CCSS Section 7.3.3
Common Misuse Scoring System (CMSS) Section 7.4.4
Common Weakness Scoring System (CWSS) Section 7.4.5
Several categorizations or taxonomies of CS/IA measures have emerged to focus analysis and interpretation of data.
Section 7.7
The legislative and regulatory environment is now requiring measures or proof of accomplishment, providing motivation for organizations to establish CS/IA measurement activities.
Section 3.1

Measuring Cyber Security and Information Assurance State-of-the-Art Report (SOAR) 15
Section 2 Background
2.2 Perceptions of IA Measurement: Skeptics and Detractors
“I would like to believe that metrics relating to security are possible, but there is little evidence to support this view at present.” [12]
As with many technologies that are still in the conceptual phase or the early adoption phase, CS/IA measurement is considered with skepticism by some. Most of the skeptics do not doubt the value of CS/IA measurement in theory; they simply question whether anything approaching a set of useful CS/IA measures has−or can−be defined; or, if defined, whether such measures have any real utilitarian value, given what they see as the current “unmeasurable” state of security technology and process.
These detractors share several assumptions in common that motivate their skepticism—
f They all assume that what is to be measured is security or assurance of technical security (e.g., defense in depth protections, computer security controls) rather than process effectiveness.
f They all agree that measurement of security assurance is a laudable goal in theory.
f They all consider the current state of the art of security technology so poor and/or unpredictable that any attempt to measure its assurance would be a waste of time.
Security “guru” Steven Bellovin of Columbia University is one such detractor. In his presentation, “On the Brittleness of Software and the Infeasibility of Security Metrics,” [13] Bellovin argues that security metrics for security mechanisms implemented by software are simply not possible for the following reasons—
f All software is inherently vulnerable, due to the unavoidable presence of numerous design weaknesses and implementation flaws. These weaknesses and flaws are not recognized or detected by the software’s developer. They are, however, fairly easily discovered by software-knowledgeable adversaries.
f An adversary needs only exploit a single significant undetected weakness or flaw to render a software-based security mechanism ineffective.
f The assumption that a “defense-in-depth” security architecture composed of aggregate layers of software-based protections will be stronger than any individual layer’s protections is false. Individual software-based protections are so “brittle” that it is impossible for them to be adequately robust or resilient, even in aggregate.

Measuring Cyber Security and Information Assurance State-of-the-Art Report (SOAR)16
Section 2 Background
f Until the engineering of software is radically improved to the extent that software is no longer inherently riddled with weaknesses and flaws, attempting to measure the strength of fatally “brittle” software-based protections will remain a waste of time.
Other factors Bellovin cites as militating against meaningful, useful security strength metrics are—
f The fact that there has not yet been devised a metric for accurately measuring the amount of effort a skilled adversary requires to locate and exploit a software bug;
f The lack of a science of security mechanism composition that can avoid the problem of an incommensurately weak protective layer interfering with the strength of the other layers and the aggregate strength of all layers in a defense-in-depth layered architecture.
Bellovin concludes that current defense-in-depth-based security architectures are not amenable to metrics, and “very reluctantly conclude[s] that security metrics are chimeras for the foreseeable future. We can develop probabilities of vulnerability, based on things like Microsoft’s Relative Attack Surface Quotient, the effort expended in code audits, and the like, but we cannot measure strength until we overcome brittleness.” [14]
Nguyen Pham et al. [15] question the practical usefulness of security evaluations based on tree-based metrics taxonomies. After providing a brief survey of efforts to do so, they conclude that—
f Many such metrics are meant to be applied over long periods of time, making their utility for real-time evaluations infeasible.
f The limitation of some measurement systems to predefine a single weighted value to each metric, to reflect the metric’s relative importance, is too inflexible in real-world systems for which the importance of metrics changes over time.
f There are no modeling techniques or tools to support the evaluation of system assurance based on the 75 strategic metrics that Andrew Jaquith [16] reports organizations use to assess their security postures, diagnose security issues, and measure infrastructure security activities.
2.3 Research and Emerging MethodsActive research into CS/IA measurement methods and techniques really began with the measurement of the robustness of cryptographic systems. However, R&D of measurement methods for security, privacy, and associated assurance across the broader domain of technical and non-technical measures, processes, knowledge/awareness, etc., really emerged in the

Measuring Cyber Security and Information Assurance State-of-the-Art Report (SOAR) 17
Section 2 Background
mid-to-late 1990s. The results of that earlier research have, in many cases, made the transition into practical use, and have formed the basis for much of what is discussed in Sections 2 to 8 of this SOAR.
There are a number of efforts within academic, industrial, and government research organizations to define meaningful CS/IA measurement methodologies as well as the specific measures to quantify, for instance, criticality of vulnerabilities, severity of threats and attacks, and other aspects of CS/IA.
Increasingly, over the past few years, members of the CS/IA measurement community are discussing existing and emerging approaches and, in some cases, collaborating to come up with common approaches. The cooperation between Microsoft and Carnegie Mellon University (CMU), for example, in refining the Relative Attack Surface Quotient (RASQ) (discussed in Section 6.8.2) is one example of such collaboration. In Europe, the collaboration of research institutions, not just within academia, but across academia, industry, and government, has led to a breaking down of competitive barriers that, in the past, may have explained some of the lack of success of measurement and, indeed, many other technology initiatives.
Current and emerging CS/IA measurement research tends to focus in one of the following areas—
f Quantification of the economic value of security and assurance; f Quantification of robustness of technical security measures; f Measurement for non-technical security (e.g., process security); f Measurement in support of risk assessment; f Measurement focusing on attacks; f Measurement focusing on vulnerabilities and weaknesses; f Measurement of the security properties, attack exposure/resistance, etc.,
of software; f Control system security measurement; f Privacy measurement.
References8 Stuart Edward Schechter. “Toward Econometric Models of the Security Risk from Remote Attack,”
in IEEE Security & Privacy, Vol. 3, No. 1, January/February 2005, pp. 40-44. Digital Object Identifier: 10.1109/MSP.2005.30; Earlier version published in Proceedings of the Third Workshop on Economics and Information Security, Minneapolis, MN, May 2004, Accessed 25 March 2009 at: http://www.eecs.harvard.edu/~stuart/papers/eis04.pdf
9 IATAC. IA Metrics CR/TA. 2000. Available to .mil and .gov at: http://iac.dtic.mil/iatac/reports.jsp#CR/TA
10 Marianne Swanson, Nadya Bartol, John Sabato, Joan Hash and Laurie Graffo. NIST Special Publication 800-55, Security Metrics Guide for Information Technology Systems, July 2003. Accessed 26 March 2009 at: http://webharvest.gov/peth04/20041027033844/csrc.nist.gov/publications/nistpubs/800-55/sp800-55.pdf
11 Vaughn, Siraj, and Henning, “Information Assurance Measures and Metrics—State of Practice and Proposed Taxonomy,” op cit.
Measuring Cyber Security and Information Assurance State-of-the-Art Report (SOAR)18
Section 2 Background
12 John McHugh, Carnegie Mellon University Center for Survivable Systems. “Information Assurance Metrics: Prophecy, Process, or Pipedream?,” in Proceedings of the 23rd National Information Systems Security Conference, Baltimore, Maryland, 16-19 October 2000. Accessed 20 January 2009 at: http://csrc.nist.gov/nissc/2000/proceedings/papers/201.pdf
13 Steven M. Bellovin, Columbia University. “On the Brittleness of Software and the Infeasibility of Security Metrics.” Keynote presentation at Metricon 1.0, Vancouver, BC, Canada, 1 August 2006 (slides revised 21 November 2006). Accessed 10 December 2008 at: http://www.cs.columbia.edu/~smb/talks/brittle-metricon.pdf; original version accessed 7 January 2009 at: http://www.securitymetrics.org/content/Wiki.jsp?page=Metricon1.0Keynote#section-Metricon1.0Keynote-OnTheBrittlenessOfSoftwareAndTheInfeasibilityOfSecurityMetricsStevenBellovinColumbiaUniversity
14 Ibid.
15 Nguyen Pham, Loic Baud, Patrick Bellot, and Michel Riguidel, Telecom ParisTech. “A Near Real-time System for Security Assurance Assessment,” in Proceedings of the Third International Conference on Internet Monitoring and Protection (ICIMP 2008). Bucharest, Romania, 29 June-5 July 2008. Accessed 1 April 2009 at: http://www.infres.enst.fr/~bellot/publis/ICIMP2008.pdf
16 Andrew Jaquith. Security Metrics: Replacing Fear, Uncertainty, and Doubt. (Indianapolis, IN: Addison-Wesley Professional, 2007).

Measuring Cyber Security and Information Assurance State-of-the-Art Report (SOAR) 19
Section 2 Background

“Security metrics programs are still driven largely by compliance concerns.”
Khalid Kark and Paul Stamp, Forrester Research [17]
3Laws, Regulations, Standards, and Guidelines

Measuring Cyber Security and Information Assurance State-of-the-Art Report (SOAR) 21
Section 3 Laws, Regulations, Standards, and Guidelines
There are numerous laws, rules, and regulations that include or imply requirements for information security performance measurement,
including IA compliance verification requirements that are best met through measurement techniques. While some organizations may choose to design, implement, and deploy their own security measures, the adoption of standards and guidelines for security measurement greatly improves the quality of an organization’s measurement program, and allows organizations to better share and improve their security postures.
Several standards and guidelines documents have emerged over the last eight years to address the challenge that many organizations face in developing CS/IA measurement programs. Generally, these standards and guidelines fall into the following categories—
f Processes for developing information security measures to assess effectiveness of enterprise or system-level security controls and implementing the measures (These types of documents often include example measures.);
f Maturity model frameworks that provide a framework for assigning a maturity level to a grouping of security processes, based on specific criteria;
f Product evaluation frameworks that assess the level of assurance the products provide against specific criteria, and assigning a product evaluation level based on this criteria.
This section provides an overview of relevant laws and regulations as well as the major standards and guidelines that are currently available to organizations seeking to deploy or improve CS/IA measurement programs. It is important to note that a majority of these

Measuring Cyber Security and Information Assurance State-of-the-Art Report (SOAR)22
Section 3 Laws, Regulations, Standards, and Guidelines
documents were developed by the federal government (i.e., NIST and National Security Agency [NSA]) and by ISO.
3.1 Legal, Regulatory, and Policy-Driven Requirements for MeasurementA number of laws, regulations, and policies include compliance verification requirements that mandate the use of measurement for verifying compliance or, at a minimum, suggest the use of or imply a preference for measurement as the best approach to verification of compliance.
A wide variety of tools and methodologies are available for verifying the compliance of information systems and applications of various sorts with the relevant legislative and regulatory mandates. Most of these tools and methodologies generate measures for compliance verification. Indeed, there appears to be an entire set of tools devoted to verifying compliance with Sarbanes-Oxley, FISMA, the Health Insurance Portability and Accountability Act (HIPAA), and other legislative and regulatory mandates with CS/IA elements. [18]
With compliance verification comes the need to generate data for measuring compliance; in the case of compliance with CS/IA-relevant mandates, this combination results in CS/IA measures. The following sections describe a cross-section of such mandates, and some associated measurement-based compliance verification efforts of note. These examples are meant to be representative only, and are not intended to be exhaustive.
3.1.1 FISMAFISMA provides a comprehensive framework for securing federal government IT resources by defining key federal government and agency roles and responsibilities, and by requiring agencies to integrate information security into their capital planning and enterprise architecture processes. FISMA requires that agencies conduct annual information security reviews of all programs and systems, and report the results of those reviews to OMB. [19]
FISMA has a number of key provisions, including— f Delegating to NIST the responsibility to develop detailed information
security standards and guidance for federal information systems, with the exception of national security systems;
f Designating OMB to oversee federal agencies’ information security implementation.
OMB publishes annual FISMA guidance that includes specific performance measures to be reported as a part of annual and quarterly reporting. In Fiscal Year ( FY) 2007, OMB added a requirement that agencies describe three performance metrics that agencies use to measure the effectiveness or efficiency of security policies and procedures. OMB guidance required that these metrics are different from the ones agencies already report for FISMA, and suggested using NIST SP 800-80, Guide for Developing

Measuring Cyber Security and Information Assurance State-of-the-Art Report (SOAR) 23
Section 3 Laws, Regulations, Standards, and Guidelines
Performance Metrics for Information Security, as a source of metrics to tailor. In FY 2008, OMB modified its guidance to point to NIST SP 800-55, Performance Measurement Guide for Information Security, as NIST SP 800-80 did not progress from its draft stage. Instead, the content from NIST SP 800-80 was folded into the revision of NIST SP 800-55 Rev. 1, July 2008. OMB also specified that the three metrics to be reported must be outcome/ output-based.
3.1.2 FEAThe Federal Enterprise Architecture (FEA) is a business-based framework for government-wide improvement. The purpose of the FEA is to facilitate cross-agency analyses, and to identify duplicative investments, gaps, and opportunities for collaboration within and across federal agencies. [20]
The FEA defines five reference models— f Performance Reference Model (PRM), f Business Reference Model (BRM), f Service-Component Reference Model (SRM), f Technology Reference Model (TRM), f Data Reference Model (DRM). [21]
Collectively, these reference models identify the set of performance, business, capability, technical, and data handling requirements as well as standardized measures for measuring the organization’s success in achieving these objectives.
According to the FEA Security and Privacy Profile (SPP) [22]—
“The Security and Privacy category falls under PRM Measurement Area ‘Process and Activities.’ Measurement Indicators show the extent to which security is improved and privacy addressed.”
The FEA SPP identifies the federal legislative and policy source documents from which a minimum set of security and privacy objectives should be derived. These objectives include—
f Security—FISMA, as implemented in accordance with OMB Circular A-130, Management of Federal Information Resources (OMB A-130) and relevant NIST guidance;
f Privacy—The Privacy Act of 1974 (Privacy Act) and the E-Government Act of 2002, as implemented in accordance with OMB Memorandum 03-22 [23] as well as OMB’s specific guidance on the implementation of the Privacy Act and agency responsibilities for protecting privacy.
The FEA SPP also provides the following examples of quantifiable security and privacy indicators for PRM measurement, which appeared in the FY 2005 FISMA report—

Measuring Cyber Security and Information Assurance State-of-the-Art Report (SOAR)24
Section 3 Laws, Regulations, Standards, and Guidelines
f Percentage of employees who received annual security awareness training,
f Percentage of agency Web sites with a machine-readable privacy policy,
f Percentage of systems that have obtained C&A, f Percentage of applicable systems that have received a privacy
impact assessment.
The FEA SPP also explains which measures in the other reference models are directly relevant to the Security and Privacy category, and describes the activities that the organization should undertake to identify its business-related performance, business, and data security and privacy requirements. These activities include—
f Assessment of the FEA descriptions of performance objectives to ensure that they can support the measurement of compliance;
f Assessment of performance adequacy; f Establishment of Service Level Agreements (SLA).
Specifically, the organization is instructed to document its performance objectives and the metrics associated with each of its requirements. These performance metrics must then be evaluated to ensure that they are consistent with NIST SP 800-55 Rev. 1 or “a comparable agency methodology.”
3.1.3 GPRA and Security ReportingThe Government Performance Results Act (GPRA) does not explicitly mandate security planning, measurement, or reporting. However, it is desired that federal government agencies tie all their activities to their strategic and performance planning processes. NIST SP 800-55 Rev. 1 suggests that agencies tie their information security goals and objectives to the overall agency goals and objectives, and that agencies use information security measures to track accomplishment of their information security goals and objectives.
3.1.4 CJCSI 6510.04 and 3401.03Chairman of the Joint Chiefs of Staff Instruction (CJCSI) 6510.04,
“Information Assurance Readiness Metrics,” published on 15 May 2000, provided a set of metrics for use by DoD organizations in preparing their Joint Monthly Readiness Reports (JMRR). This instruction was cancelled on 15 October 2002 with the publication of the first version of CJCSI 3401.03,
“Information Assurance (IA) and Computer Network Defense (CND) Joint Quarterly Readiness Review (JQRR) Metrics,” which defined a comparable set of IA and CND metrics for use by DoD organizations in preparing Joint

Measuring Cyber Security and Information Assurance State-of-the-Art Report (SOAR) 25
Section 3 Laws, Regulations, Standards, and Guidelines
Quarterly Readiness Reports (JQRR). The most recent version of this instruction, CJCSI 3401.03A, published on 15 July 2003, was cancelled on 6 August 2008. No subsequent CJCSIs devoted to metrics have been published.
3.1.5 Other Security and Privacy-Relevant Legislation Requiring Compliance VerificationBecause there are some commonalities between security and privacy, responsibility for assuring both—and measuring compliance with and effectiveness of both—often falls to the same individuals. Indeed, this single focal point for responsibility is strongly implied by HIPAA, which includes both security and privacy rules; by the federal government’s capital planning process, which requires an accounting of both security and privacy controls and costs; and by the requirement that FISMA reports to OMB include both security and privacy performance data.
As noted earlier, the FEA SPP identifies the Privacy Act and the E-Government Act of 2002 as the key privacy legislation from which a minimum set of measurable privacy objectives should be derived. The FEA SPP also suggests that “privacy is more complex than just an application of security.” For this reason, privacy includes controls that may not be familiar to security practitioners, such as requirements for public disclosure, notice, and consent.
Debra S. Herrmann [24] identifies the key security and privacy legislation for which compliance metrics have been defined—
f Privacy Act of 1974; f E-Government Act of 2002; f HIPAA; f Electronic Communications Privacy Act (ECPA); f Computer Fraud and Abuse Act; f Organization for Economic Cooperation and Development in
Europe (OECD) Security and Privacy Guidelines; f Financial Modernization Act of 1999 (also known as the
Gramm-Leach-Bliley Act; Pub.L. 106-102, 113 Stat. 1338): specifically, the act’s Financial Privacy Rule, Safeguards Rule, and Pretext Protection;
f USA Patriot Act.
3.2 NIST SP 800-55 Rev 1: Performance Measurement Guide for Information SecurityNIST published NIST SP 800-55 Rev. 1, Performance Measurement Guide for Information Security, [25] in July 2008 to update NIST SP 800-55, Security Metrics Guides for Information Technology Systems, July 2003, by aligning the content of the guidance with information security controls in NIST SP 800-53, Recommended Security Controls for Federal Information Systems, and to expand the document contents from addressing systems to covering

Measuring Cyber Security and Information Assurance State-of-the-Art Report (SOAR)26
Section 3 Laws, Regulations, Standards, and Guidelines
information security programs. NIST SP 800-55 Rev. 1 merged the content of the original NIST SP 800-55 and Draft NIST SP 800-80, Guide to Performance Measures for Information Security, May 2006.
The processes and methodologies described in NIST SP 800-55 Rev. 1 link information system security performance to agency performance by leveraging agency-level strategic planning processes. By doing so, these processes and methodologies help demonstrate how information security contributes to accomplishing agency strategic goals and objectives. Performance measures developed according to NIST SP 800-55 Rev. 1 will enhance the ability of agencies to respond to a variety of federal government mandates and initiatives, including FISMA, FEA’s PRM requirements, and any other enterprise-specific requirements for reporting quantifiable information about information security performance.
NIST SP 800-55 Rev. 1 focuses on three key measurement categories: (1) implementation measures, (2) effectiveness/efficiency measures, and (3) impact measures, described in greater detail in Section 7.7.2. NIST SP 800-55 Rev. 1 is structured to provide a comprehensive view of information security measurement, as illustrated in Table 3-1.
Table 3-1 NIST SP 800-55 Rev. 1 Document Structure
Section Description
1.0 Introduction Introduces the document and discusses the purpose, scope, audience, history, and critical success factors of information security performance measurement
2.0 Roles and Responsibilities Describes the roles and responsibilities of agency staff that have a direct interest in the success of the information security program, and in the establishment of an information security measurement program
3.0 Information Security Measures Background
Provides background and context for information security measures, the benefits of implementation, various types of information security measures, and the factors that directly affect information security measurement program success
4.0 Legislative and Strategic Drivers Links information security measurement to strategic planning through relevant legislation and guidelines
5.0 Measures Development Process Presents the approach and processes used for development of information security measures
6.0 Information Security Measurement Implementation
Discusses those factors that can affect the implementation of an information security measurement program
Appendix A: Candidate Measures Provides practical examples of information security measures that can be used or modified to meet specific agency requirements
NIST SP 800-55 Rev. 1 describes two primary processes: (1) the measures implementation process (depicted in Figure 3-1), discussed in Section 6 of the Special Publication, and (2) the measures development process (depicted in Figure 3-2), discussed in Section 5 of the Special Publication, which serves as the first phase of measures implementation process.

Measuring Cyber Security and Information Assurance State-of-the-Art Report (SOAR) 27
Section 3 Laws, Regulations, Standards, and Guidelines
Figure 3-1 Information Security Measurement Program Implementation Process [26]
Figure 3-2 Information Security Measures Development Process [27]
Section 3 of NIST SP 800-55 Rev. 1 contains an extensive discussion about the benefits of using measures, types of measures, and the relationship of the types of measures to the maturity of security program being measured. The authors state that the difficulty of implementing information security measures and the level of sophistication that can be expected from the measures is directly proportional to the maturity of information security program.
1
2 3 4
56
Collect Data andAnalyze Results
Prepare forData Collection
Identify CorrectiveActions
DevelopBusiness Case
ObtainResults
Apply CorrectiveActions
1
2 3 4
567
Process Implementation Implementation level of established security standards, policies, and procedures
Effectiveness / Efficiency Timeliness of security service delivery Operational results experienced by security program implementation
Business Impact Business Value gained or lost Acceptable loss estimate
Identification and Definition
Measures Development and Selection
Goals and Objectives
Goal/ObjectiveRedefinition
PolicyUpdate
ContinuousImplementation
Stakeholdersand Interests
Information SecurityPolicies, Guidelines,
and Procedures
Information SystemsSecurity ProgramImplementation
Level of Implementation
ProgramResults
BusinessMission Impact

Measuring Cyber Security and Information Assurance State-of-the-Art Report (SOAR)28
Section 3 Laws, Regulations, Standards, and Guidelines
Security programs that do not have established processes and procedures, and where data needs to be collected manually, are likely to have greater difficulty collecting effectiveness/ efficiency and impact measures. These programs are advised to focus on implementation measures. NIST SP 800-55 Rev. 1 also advises its audience to limit a number of measures to two to three per individual stakeholder to ensure that the stakeholders are able to focus on improving the status of CS/IA in a meaningful way. As CS/IA measurement programs mature, old measures that are no longer useful can be phased out and new measures can be introduced to continue monitoring and improving the status of CS/IA.
Programs with a greater number of institutionalized processes and some level of automated data collection tools are likely to be more successful in leveraging effectiveness/efficiency measures. These programs are also better equipped to move toward the business impact measures, which are more sophisticated then the other types of measures.
NIST SP 800-55 Rev. 1 proposes a measures development template, depicted in Table 3-2, to specify individual measures and provide the corresponding detail that will be required to implement such a measure program.
Table 3-2 Measures Template and Instructions [28]
Field Data
Measure ID Statement of the unique identifier used for measure tracking and sorting. The unique identifier can be from an organization-specific naming convention or can directly reference another source.
Goal Statement of strategic goal and/or information security goal. For system-level security control measures, the goal would guide security control implementation for that information system. For program-level measures, both strategic goals and information security goals can be included. For example, information security goals can be derived from enterprise-level goals in support of the organization’s mission. These goals are usually articulated in strategic and performance plans. When possible, include both the enterprise-level goal and the specific information security goal extracted from agency documentation, or identify an information security program goal that would contribute to the accomplishment of the selected strategic goal.
Measure Statement of measurement. Use a numeric statement that begins with the word “percentage,” “number,” “frequency,” “average,” or a similar term.If applicable, list the NIST SP 800-53 security control(s) being measured. Security controls that provide supporting data should be stated in Implementation Evidence. If the measure is applicable to a specific FIPS 199 impact level (high, moderate, or low), state this level within the measure.
Type Statement of whether the measure is implementation, effectiveness/efficiency, or impact
Formula Calculation to be performed that result in a numeric expression of a measure. The information gathered through listing implementation evidence serves as an input into the formula for calculating the measure.
Target Threshold for a satisfactory rating for the measure, such as milestone completion or a statistical measure. Target can be expressed in percentages, time, dollars, or other appropriate units of measure. Target may be tied to a required completion time frame. Select final and interim target to enable tracking of progress toward stated goal.

Measuring Cyber Security and Information Assurance State-of-the-Art Report (SOAR) 29
Section 3 Laws, Regulations, Standards, and Guidelines
Field Data
Implementation Evidence
Implementation evidence is used to compute the measure, validate that the activity is performed, and identify probable causes of unsatisfactory results for a specific measure.
f For manual data collection, identify questions and data elements that would provide the data inputs necessary to calculate the measure’s formula, qualify the measure for acceptance, and validate provided information.
f For each question or query, state the security control number from NIST SP 800-53 that provides information, if applicable.
f If the measure is applicable to a specific FIPS 199 impact level, questions should state the impact level.
f For automated data collection, identify data elements that would be required for the formula, qualify the measure for acceptance, and validate the information provided.
Frequency Indication of how often the data is collected and analyzed, and how often the data is reported. Select the frequency of data collection based on a rate of change in a particular security control that is being evaluated. Select the frequency of data reporting based on external reporting requirements and internal customer preferences.
Responsible Parties
Indicate the following key stakeholders: f Information Owner: Identify organizational component and individual who owns required pieces of information;
f Information Collector: Identify the organizational component and individual responsible for collecting the data. (Note: If possible, Information Collector should be a different individual or even a representative of a different organizational unit than the Information Owner, to avoid the possibility of conflict of interest and ensure separation of duties. Smaller organizations will need to determine whether it is feasible to separate these two responsibilities.);
f Information Customer: Identify the organizational component and individual who will receive the data.
Data Source Location of the data to be used in calculating the measure. Include databases, tracking tools, organizations, or specific roles within organizations that can provide required information.
Reporting Format
Indication of how the measure will be reported, such as a pie chart, line chart, bar graph, or other format. State the type of format or provide a sample.
Guidance contained in NIST SP 800-55 Rev. 1 suggests the following actions for implementing measures within organizations—
f Map measures addressing overall information security program performance to information security goals and objectives that may encompass performance of information security across the spectrum of security controls.
f Map measures corresponding to security control families or individual security controls directly to the individual security control(s).
f Use the data describing the security control’s implementation and security program performance, such as that found in Plans of Action & Milestones (POA&M), testing, and project tracking to generate required measures.
Appendix A of Draft NIST SP 800-55 Rev. 1 provides sample programmatic and system level measures with explicit links to NIST SP 800-53 security controls.

Measuring Cyber Security and Information Assurance State-of-the-Art Report (SOAR)30
Section 3 Laws, Regulations, Standards, and Guidelines
3.3 ISO/IEC 27004 – Information Security Management – MeasurementISO/International Electrotechnical Commission (IEC) 27004, Information technology – Security techniques – Information security management – Measurement, is an emerging ISO standard that addresses information security measurement. ISO/IEC 27004 is currently a Final Committee Draft (FCD), and is projected to be published by the end of 2009.
ISO/IEC 27004 is being developed in response to a requirement in ISO/IEC 27001, Information technology – Security techniques – Information security management systems – Requirements requirement, to measure effectiveness of Information Security Management System (ISMS) controls.
ISO/IEC 27004 does not contain requirements; rather, it contains recommendations. That means it is a guidance document and is not intended to serve as a set of requirements for conducting conformance assessments. ISO/IEC 27004 contains several annexes that provide a sample template for constructing measures and example measures that are using the template.
As an international standard, ISO/IEC 27004 is being developed by a group of experts from across the globe. Many national standards bodies have provided contributions and inputs to amalgamate into a comprehensive solution for measuring the effectiveness of ISMS controls and of ISMSs. Among these inputs, ISO/IEC 27004 incorporates materials from NIST SP 800-55 Rev. 1 and other nations’ standards and guidelines on information security measurement. The measures development and implementation processes used by ISO/IEC 27004 are very similar to processes detailed in NIST SP 800-55 Rev. 1, but the document uses ISMS terminology, rather then NIST terminology.
ISO/IEC 27004 is also harmonized with ISO/IEC 15939, System and software engineering – Measurement process, and uses the overall measurement process and the measurement model originally published in ISO/IEC 15939. The measurement process used in ISO/IEC 27004 consists of the steps of—
f Developing measures, f Operating measurement program, f Analyzing and reporting results, f Evaluating and improving the measurement program itself.
The evaluation and improvement of the measurement program ensures that the program continues to be effective, and is refreshed regularly or when the needs or operating environment change.
The measurement model in ISO/IEC 27004 provides a detailed top-down and bottom-up structure for identifying the information that is being sought from the measures, the individual attributes required to construct individual measures, and a hierarchical structure for rolling up and consolidating the data with increasing complexity.
Several layers of measures are described, including—

Measuring Cyber Security and Information Assurance State-of-the-Art Report (SOAR) 31
Section 3 Laws, Regulations, Standards, and Guidelines
f Base measures that are quantifying individual attributes, f Derived measures that are based on one or more base measures, f Indicators to consolidate derived measures into a result that is
presented to management.
The hierarchical method of a vertical structure that provides for top-down and bottom-up definition of measures allows for consolidation of information about different aspects of information security into a coherent picture that helps assess effectiveness of individual ISMS controls and processes as well as the overall ISMS effectiveness. The ISO/IEC 27004 template contains fields that are similar to those in the NIST SP 800-55 Rev. 1 template and the ISO/IEC 15939 template.
Once published, ISO/IEC 27004 can be used as a part of ISO/IEC 27001 implementation as well as a standalone guidance that assists organizations in measuring the effectiveness of their information security processes and controls. Within US government context, it could be useful for measuring effectiveness of information security programs, processes, and controls in conjunction with NIST SP 800-55 Rev. 1.
3.4 ISO/IEC 21827, SSE-CMM
“Security metrics focus on the actions (and results of those actions) that organizations take to reduce and manage the risks of loss of reputation, theft of information or money, and business discontinuities that arise when security defenses are breached.” [29]
ISO/IEC 21827, Information technology – Systems security engineering – Capability Maturity Model Capability Maturity Model (SSE-CMM) [30], provides a structured approach for the implementation and assessment of the institutionalization of systems security engineering practices. This standard provides a framework for security engineering practices that covers the system life cycle, including identification of security risks, development, operation, and maintenance activities. [31] It includes project, organizational, and security engineering activities.
ISO/IEC 21827 can be used in conjunction with Capability Maturity Model Integration (CMMI). [32] Similar to CMMI, ISO/IEC 21827 has two dimensions—
f Generic Practices (GP) that define the characteristics of the different capability levels,
f Process Areas (PA) that describe security engineering goals and base practices.

Measuring Cyber Security and Information Assurance State-of-the-Art Report (SOAR)32
Section 3 Laws, Regulations, Standards, and Guidelines
ISO published a revised version of ISO/IEC 21827 in 2008 that includes greater detail for incorporating measurement activities into the SSE-CMM. The SSE-CMM model architecture consists of five capability levels, similarly to CMMI, and is depicted in Figure 3-3.
Figure 3-3 ISO/IEC 21827 Architecture [33]
Multiple aspects of SSE-CMM can be useful for measurement— f The goals and practices can be used for developing, implementing, and
using measures for security engineering efforts. These measures can be repeated over time. They provide relevant performance trends over time, and support security improvement and budget recommendations.
f The Build Assurance Argument PA identifies the base practices associated with collecting measurement and other data to support system security engineering claims made about the system. The PA defines the base practices to produce evidence that substantiates assurance cases, and can be used as guidance for implementing measures.
f SSE-CMM ratings can be used to provide understanding of the expected consistency in the products of security engineering efforts by providing distinct criteria for evaluating the institutionalization of security engineering efforts, and by categorizing them into five capability levels.
The International System Security Engineering Association (ISSEA), which sponsored ISO/IEC 21827, has developed a list of measures intended to use in conjunction with the SSE-CMM to assess whether PAs have been implemented and are effective. These metrics can also be useful for quantifying security
Domain(Process Areas)
Organization
Security Engineering
Project
Capability Level(Common Features)
5. Optimizing
4. Managed
3. Defined
2. Repeatable
1. Initial

Measuring Cyber Security and Information Assurance State-of-the-Art Report (SOAR) 33
Section 3 Laws, Regulations, Standards, and Guidelines
engineering activities, even when not included in SSE-CMM implementation. These metrics were finalized in 2004 and 2005 by the ISSEA Metrics Working Group that used the NIST SP 800-55 Rev. 1 process and template.
It should be noted that, while multiple attempts to implement SSE-CMM have been made and it is regularly mentioned in papers and presentations, SSE-CMM has not been widely implemented due to its complexity and the level of effort required to achieve, evaluate, and maintain Level 2 and above. However, the existence of SSE-CMM has generated several follow-on efforts, one of which, the development of the Assurance Focus Area for CMMI, is getting traction with the software assurance and IA communities. This effort is described in Section 4.2.
For Further Reading
Bartol, Nadya. “IA Metrics—Why and How to Measure Goodness of Information Assurance.” Presented to ISSEA PSM User’s Group Conference, July 2005. Accessed 29 December 2008 at: http://www.psmsc.com/UG2005/Presentations/15_Bartol_IA_Metrics.pdf
US-CERT. “Briefings from Workshop on Assurance with CMMI,” August 2007. BuildSecurityIn. Accessed 10 February 2009 at: https://buildsecurityin.us-cert.gov/swa/procresrc.html
David A. Chapin and Steven Akridge. “How Can Security be Measured?,” in Information Systems Control Journal, Volume 2, 2005. http://www.isaca.org/Template.cfm?Section= Home&Template=/ ContentManagement/ContentDisplay.cfm&ContentID=24173. Also: http://www.isaca.org/Content/ContentGroups/Journal1/20058/How_Can_Security_Be_Measured_.htm
Lora Shinn. “Instituting Security Metrics,” in Inc. Technology, June 2008. Accessed 13 April 2009 at: http://technology.inc.com/security/articles/200806/metrics.html
3.5 ISO/IEC 15408, Evaluation Criteria for Information Technology SecurityISO/IEC 15408, Information technology – Security techniques – Evaluation criteria for IT security [34] (commonly referred to as the Common Criteria), is a multi-part standard that provides a framework for defining and evaluating the level of assurance for individual hardware and software IT products. It allows for comparisons between different products by providing a common set of requirements for security functions and assurance techniques applied to these products during security evaluation.
There are seven Evaluation Assurance Levels (EAL) defined in the Common Criteria. These EALs are intended to indicate the level of assurance that the Target of Evaluation (TOE) (i.e., the product to be evaluated) has satisfied the requirements in its Security Target (ST). Acquirers of products may describe sets of security requirements for specific types of solutions in a Protection Profile (PP), which provides a consolidated point of reference for product vendors.
Product vendors submitting their products to be evaluated describe the security functionality provided by the product in an ST. The ST describes the security functionality provided by the product, either by referencing a PP;

Measuring Cyber Security and Information Assurance State-of-the-Art Report (SOAR)34
Section 3 Laws, Regulations, Standards, and Guidelines
pointing to Common Criteria components; or stating the functionality explicitly. As such, the ST sets expectations for the acquirer on what those claims are and in what environment the product can operate as tested.
Under the US Common Criteria Evaluation and Validation Scheme, companies submit their product to Common Criteria Testing Laboratories (CCTL), where the products are evaluated.
The Common Criteria Recognition Arrangement is a multi-lateral agreement accepted by a number of countries to recognize evaluations conducted in the member countries up to the EAL4 level. A subgroup of European countries recognizes higher level evaluations as well, while in the United States, NSA will participate in evaluations above EAL4.
In terms of measurement, the Common Criteria assesses a measurable level of assurance for individual security products that enables consumers of these products to make educated decisions about suitability of these products to the consumers’ security requirements and their operating environment. The Common Criteria provides the basis for benchmarking products in terms of assurance that they provide. Application of this standard allows for comparison of products providing similar functionality as well as for making decisions about integrating different products into the system based on the level of assurance that each individual product provides.
3.6 FIPS 140 EvaluationNIST operates the Cryptographic Algorithm Validation Program (CAVP) and the Cryptographic Module Validation Program (CMVP). Together, these programs serve to provide organizations with a framework for validating cryptographic devices against the Federal Information Processing Standard (FIPS) 140 standard, Security Requirements for Cryptographic Modules, as well as against other NIST cryptography standards, including FIPS 180-3, the Secure Hash Standard; FIPS 186-2, the Digital Signature Standard; and FIPS 197, the Advanced Encryption Standard.
The CAVP is a prerequisite to the CVMP, ensuring cryptographic modules are implemented correctly prior to validating their security properties. The CAVP provides guidelines for each algorithm validation suite. [35] For example, the Advanced Encryption Standard (AES) validation suite guidelines describe the procedures used to verify that a particular AES implementation complies with FIPS 197.
FIPS 140-2 [36] defines four security levels against which a cryptographic module can be validated. Similarly, the draft of FIPS 140-3 [37] defines five security levels. Each level has specific security requirements that a cryptographic module must meet in order to receive certification, including—
f Identification, authentication and authorization—Each level specifies how access control and authentication should be performed within the module.
Measuring Cyber Security and Information Assurance State-of-the-Art Report (SOAR) 35
Section 3 Laws, Regulations, Standards, and Guidelines
f Physical security—Each level specifies how much physical security must be in place to protect the integrity of the cryptographic module.
f Operational environment—Each level specifies what Common Criteria evaluation the overall environment should have.
f Design assurance—Each level specifies an increasingly strict review of the cryptographic module’s design and implementation.
FIPS 140-3 will define additional security requirements, including resistance to non-invasive attacks, and more in-depth analysis of the module’s design and implementation.
Because cryptographic modules must adhere to very specific requirements (e.g., implementing one or more of the FIPS-approved algorithms) with well-defined input and output, they are better suited to rigorous analysis than are general purpose computing systems. As such, a cryptographic module’s FIPS 140 rating provides a distinct measurement of the security controls in place for a given cryptographic module. The CAVP certificates associated with a cryptographic module will also provide full evidence of which specific algorithms have been FIPS-validated within the cryptographic module. Nevertheless, one of the primary drawbacks of the measurement provided by FIPS 140 validation is that it only applies to a specific component within an organization’s enterprise.
3.7 NSA INFOSEC Assurance – IA-CMM
“The first step of any successful INFOSEC Program is the understanding of the missions, critical information supporting the missions, and the information flow throughout the IT infrastructure. Too many organizations spend tremendous amounts of resources implementing ‘secure’ hardware, only to have their information exploited by a lack of proper security procedure.” [38]
The NSA INFOSEC Assurance Training and Rating Program (IATRP) establishes standards for INFOSEC assurance services through the INFOSEC Assurance Methodologies, the INFOSEC Assessment Methodology (IAM), and the INFOSEC Evaluation Methodology (IEM). The organization also trains and certifies individuals in these methodologies, and rates the “IA maturity” of INFOSEC assurance organizations through the use of a standard IA Capability Maturity Model (IA-CMM). This information is provided to consumers so they are better informed when working with INFOSEC assurance providers.
IATRP heavily leverages CS/IA measures in its IAM, IEM, and IA-CMM programs. Data generated from these programs can also be used for additional CS/IA measures. Due to IATRP having a specific purpose with a structured methodology, its programs can serve as a standard or guideline for other operational CS/IA measurement programs.

Measuring Cyber Security and Information Assurance State-of-the-Art Report (SOAR)36
Section 3 Laws, Regulations, Standards, and Guidelines
An IAM or IEM assessment or an IA-CMM Appraisal can be requested by contacting any one of the companies listed on the IATRP Web site, which can be accessed at: http://www.iatrp.com/companies.php
3.8 ISA ISA99 – Manufacturing and Control Systems SecurityFounded in 1945, the International Society for Automation (ISA) is a professional association that publishes standards pertaining to safety and productivity of industrial automation and control systems. ISA also issues professional certifications and licenses to industrial control and automation system designers, managers, technicians, and mechanics; and performs education, training, awareness, and outreach.
In its capacity as a standards body, ISA has drafted two standards, ISA99.03.01 and ISA99.03.02 (titles not yet finalized), [39] that are intended to provide a basis for specifying the allocation of system-level security requirements to subsystems and components of Manufacturing Process Control System data repositories and data storage devices. Both standards define metrics to support the verification of such a system’s compliance with its specified security requirements.
Specifically, ISA99.03.01 defines a set of subjective security assurance levels, while ISA99.03.02 uses the methodology described by Andrew Jaquith [40] to translate the subjective security assurance levels in ISA99.03.01 into a set of quantitative system security metrics for measuring system compliance with a set of derived requirements that ISA intends to publish in future specifications in its
“99.03 series” of standards (i.e., ISA99.03.03, ISA-DS99.03.04, and others).
References17 Khalid Kark and Paul Stamp, Forrester Research. “Defining an Effective Security Metrics Program,”
16 May 2007. Accessed 29 December 2008 at: http://www.scribd.com/doc/2935458/best-practices-defining-an-effective-security-metrics-program
18 The firm Unified Compliance has published online an extensive matrix of requirements for various security monitoring, or measurement controls (including individual metrics), cross-referenced against the numerous laws, regulations, standards, and configuration guides that mandate those requirements. The matrix can be used to identify which laws/regulations/standards (identified down to the section or paragraph level) call out requirements for various security-relevant compliance metrics. Among the laws and regulations in the matrix are: Sarbanes Oxley, HIPAA, NERC, PCI, FIPS 140-2, Clinger-Cohen, FISMA, NIST 800-53A and NIST 800-55, the Privacy Act, and DISA STIGs as well as dozens of other Federal, state, and private sector mandates. Of all of those references, only three include significant mandates for metrics: CISWIG2, NIST SP 800-55, and NIST SP 800-55. The Unified Compliance matrix can be accessed at: http://www.unifiedcompliance.com/matrices/MonitoringandMeasurement_United_States.html
19 US Congress. H.R. 2458–48, “Federal Information Security Management Act,” 2002. Accessed 8 April 2009 at: http://csrc.nist.gov/groups/SMA/fisma/index.html
20 Pauline Bowen, Joan Hash, and Mark Wilson. NIST SP 800-100, Information Security Handbook: A Guide for Managers, October 2006.

Measuring Cyber Security and Information Assurance State-of-the-Art Report (SOAR) 37
Section 3 Laws, Regulations, Standards, and Guidelines
21 These various reference models, including their constituent categories, domains, etc., are identified and defined in OMB FY07 Budget Formulation: FEA Consolidated Reference Model Document, Version 2.3, October 2007. Accessed 8 April 2009 at: http://www.whitehouse.gov/omb/assets/fea_docs/FEA_CRM_v23_Final_Oct_2007_Revised.pdf
22 CIO Council, Federal Information Architecture Program Management Office. FEA Security and Privacy Profile, Version, Version 2.0, 1 June 2006. Accessed 9 April 2009 at: http://www.cio.gov/documents/Security_and_Privacy_Profile_v2.pdf
23 OMB Memorandum M-03-22, “OMB Guidance for Implementing the Privacy Provisions of the E-Government Act of 2002,” 26 September 2003. Accessed on 15 April 2009 at: http://www.whitehouse.gov/omb/memoranda/m03-22.html
24 Debra S. Hermann, US Nuclear Regulatory Commission. Complete Guide to Security and Privacy Metrics (Boca Raton, Florida: Auerbach Publications, 2007). A number of information privacy and security experts suggest a far more extensive list of security- and privacy-relevant laws and regulations for which compliance must be verified. These experts include the following: Daniel J. Solove, Marc Rotenberg, and Paul M. Schwartz. Privacy, Information, and Technology (New York, New York: Aspen Publishers, 2006). Joel Rosenblatt. “Security Metrics: A Solution in Search of a Problem,” in EDUCAUSE Quarterly, Vol. 31, No. 3, July-September 2008. Accessed 22 December 2008 at: http://connect.educause.edu/Library/EDUCAUSE+Quarterly/SecurityMetricsASolutioni/47083. A subset of their list is directly relevant for defining security and privacy requirements for information systems and networks as they address how information must be handled by such systems/networks. Examples include: the Controlling the Assault of Non-Solicited Pornography And Marketing (CAN-SPAM) Act of 2003; the Children’s Online Privacy Act; the Identity Theft Assumption and Deterrence Act; US Securities and Exchange Commission (SEC) Regulation S-P (22 June 2000); the Digital Millennium Copyright Act (DCMA); and others. However beneficial these laws and regulations may be in expanding the criminal and civil recourses available to victims of privacy and security violations, identity theft, etc., the rules and protections these laws mandate for confidentiality and privacy of information do not explicitly include requirements for the automated systems and networks that process, transmit, and/or store the affected information. Therefore, use of metrics in verifying compliance to these laws is not discussed here. Nor is use of metrics in verifying compliance to the non-US privacy and security laws, regulations, directives, etc., identified by Herrmann, i.e., the European Union Data Protection Directive 95/46/EC (1998; also known as the Safe Harbour Act), the United Kingdom’s Data Protection Act, and the Canadian Personal Information and Electronic Documents Act (PIPEDA), or the Personal Health Information Act.
25 Chew, et al., Performance Measurement Guide for Information Security, op cit.
26 Ibid, Figure 6-1.
27 Ibid, Figure 5-1.
28 Ibid, Table 2.
29 Systems Security Engineering Capability Maturity Model (SSE-CMM), Version 3. Accessed 1 April 2009 at: http://www.sse-cmm.org/model/model.asp
30 ISO/IEC 21827:2008, Information technology – Systems security engineering – Capability Maturity Model Capability Maturity Model® (SSE-CMM®). Accessed 1 April 2009 at: http://www.iso.org/iso/iso_catalogue/catalogue_tc/catalogue_detail.htm?csnumber=44716
31 Nadya Bartol and Joyce Richardson. “Measuring Capability-Based Assurance,” in Proceedings of the Fifth Annual Information System Security Engineering Association (ISSEA) Conference, Arlington, Virginia, 13-15 Oct. 2004
32 Capability Maturity Model, Capability Maturity Modeling, Capability Maturity Model Integration, CMM and CMMI are registered in the US Patent & Trademark Office.
33 Ibid.

Measuring Cyber Security and Information Assurance State-of-the-Art Report (SOAR)38
Section 3 Laws, Regulations, Standards, and Guidelines
34 Paraphrased from ISO/IEC 15408-1:2005(E), Information technology – Security techniques – Evaluation criteria for IT Security, which can be downloaded at no cost from the Common Criteria Portal. Accessed 10 February 2009 at: http://www.commoncriteriaportal.org/thecc.html
35 Lawrence E. Bassham III., NIST Information Technology Laboratory Computer Security Division. “Advanced Encryption Standard Algorithm Evaluation Suite (AESAVS).” 15 November 2002. Accessed
4 February 2009 at: http://csrc.nist.gov/groups/STM/cavp/documents/aes/AESAVS.pdf
36 NIST. Security Requirements for Cryptographic Modules (Federal Information Processing Standards Publication [FIPS PUB] 140-2). 25 May 2001. Accessed 4 February 2009 at: http://csrc.nist.gov/publications/fips/fips140-2/fips1402.pdf
37 NIST. Security Requirements for Cryptographic Modules (FIPS PUB 140-3 (DRAFT); will supersede FIPS PUB 140-2, 2001 May 25). Accessed 9 February 2009 at: http://csrc.nist.gov/publications/fips/fips140-3/fips1403Draft.pdf
38 INFOSEC Assurance Training and Rating Program. “INFOSEC Vulnerabilities Technical and Non-Technical Solutions.” Accessed 8 February 2009 at: http://www.iatrp.com/infosec.php
39 Nicholas Sheble, ISA. “Control system security occupies time, cyberspace,” in InTech, 15 October 2008. Accessed 11 December 2008 at: http://www.isa.org/InTechTemplate.cfm?Section=Industry_News&template=/ContentManagement/ContentDisplay.cfm&ContentID=72373
40 Jaquith, Security Metrics, op cit.

Measuring Cyber Security and Information Assurance State-of-the-Art Report (SOAR) 39
Section 3 Laws, Regulations, Standards, and Guidelines

“Security measurement is a challenging area and in its infancy, especially in terms of practice.”
John Murdoch, University of York [41]
4Best Practices

Measuring Cyber Security and Information Assurance State-of-the-Art Report (SOAR) 41
Section 4 Best Practices
This section presents a general overview of best practices that are being adopted in government and industry for the development
and operation of CS/IA measurement efforts within organizations. These measurement practices leverage the concepts introduced by the guidelines and standards discussed in Section 3, and provide a more hands-on approach for developing and running a CS/IA measurement program within an organization.
It is important to note that these practices are procedural in nature, and do not rely on specific tools or technologies—nor do they require the use of specific CS/IA measures. The goal of these best practices is to define a repeatable process that organizations may use to measure and assess the performance of their security processes and controls.
This section discusses the most widely distributed best practices. The Practical Measurement Framework for Software Assurance and Information Security, [42] sponsored by the SwA Measurement WG, provides a comprehensive discussion of the processes and practices required to develop an effective security measurement program. This section also discusses ongoing work to integrate security into the CMMI framework to provide benchmarking of assurance throughout system and software development efforts.
4.1 Practical Measurement Framework for Software Assurance and Information SecurityThe Practical Measurement Framework for Software Assurance and Information Security (the Framework) was developed by the SwA Measurement Working Group under the auspices of SwA Forum. The SwA Forum and its SwA Measurement WG, which are co-sponsored by DHS, DoD, and NIST, provide a forum for joint government, industry, and academia experts to work together on solving a challenging problem of software

Measuring Cyber Security and Information Assurance State-of-the-Art Report (SOAR)42
Section 4 Best Practices
assurance. The Framework was recently published by the Practical Software and the Systems Measurement (PSM) Support Center. According to the SwA Measurement WG Web site, it—
“…provides an approach for measuring the effectiveness of achieving Software Assurance (SwA) goals and objectives at an organizational, program or project level. It addresses how to assess the degree of assurance provided by software, using quantitative and qualitative methodologies and techniques. This framework incorporates existing measurement methodologies and is intended to help organizations and projects integrate SwA measurement into their existing programs.” [43]
The Framework does not create a new process for developing and implementing SwA measures; rather, it leverages existing measurement approaches in information security and in system and software measurement to propose a harmonized approach that can be used by practitioners in both the information security industry and the system and software development and integration industry. The following approaches were used as the basis for developing the Framework—
f NIST SP 800-55 Rev. 1, f ISO/IEC 27004, f ISO/IEC 15939, f CMMI Measurement and Analysis PA, f CMMI Goal, Question, Indicator, Measure (GQIM) methodology.
In the process of developing the Framework, the SwA Measurement WG identified similarities and differences among these five methodologies, and created a harmonized measurement process and template. As shown in Figure 4-1, the process and the template summarize and generalize the base methodologies, and proposes a high-level process applicable to many contexts in the information security industry and in the system and software development and integration industry. The Framework also advises the audience on how to begin integrating software assurance and security measures into the organization’s or project’s existing measurement programs, which may not be covering these subjects.

Measuring Cyber Security and Information Assurance State-of-the-Art Report (SOAR) 43
Section 4 Best Practices
Figure 4-1 Practical Measurement Framework for Software Assurance and Information Security [44]
The Framework identifies common stakeholders for software assurance and information security, and acknowledges a variety of roles within acquirer and supplier organizations that, at a minimum, include executive decision makers and practitioners. The Framework lists examples of information needs (i.e., a high-level goal statement of what measurement aims to accomplish). It also provides examples of measures for different types of common stakeholders. Examples include—
f Executive—Cost to correct vulnerabilities in operational applications;
f Supplier—Number and percent of tests that evaluate application response to misuse, abuse, or threats;
f Practitioner—Number and percent of relevant high impact vulnerabilities (i.e., CVEs) present in the system.
These measures can be tailored to the specific needs of the individual organizations that intend to use them.
4.2 Assurance for CMMIMany organizations have worked on the problem of integrating assurance into CMMI. The purpose of this integration is twofold—
f To use process improvement techniques available from CMMI to address security challenges that fall outside technical mechanisms or controls frameworks;
f To gauge the level of assurance provided by the projects and organizations that are implementing CMMI.
Support decisions
Allocate resources
Prioritize improvements
Communicate to executives and external stakeholders
Document measures in appropriate reporting formats
Report measures to stakeholders
Analyze collected data
Compile and aggregate into measures
Interpret data
Identify causes of findings
Document / store data in an appropriate repository
Gather data from available data sources
State goals
Identify data sources and elements
Analyze how goals and data elements relate
Create a series of measures
Analyzeand Complie
Data
ReportMeasures
Create /Update
Measures
CollectData
StoreData
Continuous Improvement
UseMeasures
Refresh measures to ensure they are still relevant to the project, program, or organization
Train measurement staff

Measuring Cyber Security and Information Assurance State-of-the-Art Report (SOAR)44
Section 4 Best Practices
In terms of measurement, integration of assurance into CMMI provides a benchmarking capability for assessing how well and how extensively assurance activities are integrated into system and software development and integration activities of individual projects or larger organizational units.
Currently, the CMMI approach does not specifically address security. The security track at the Software Engineering Process Group (SEPG) 2007 conference was developed to provide a forum for identifying the appropriate ties between process improvement and security.
As a result of a Security Birds of a Feather (BOF) Session at SEPG 2007, coordinated by a speaker from Motorola, an industry group was stood up with participants from Lockheed Martin, Motorola, DHS, and Booz Allen Hamilton to develop a set of consolidated assurance practices compatible with CMMI, and to provide a basis for projects and organizations to evaluate their assurance efforts as a part of their CMMI efforts. The goal of this working group is a harmonization of existing security standards with CMMI, so that an increased focus on security and assurance will be easy for CMMI users to implement. [45]
Since May 2007, the industry group has briefed its progress at a number of industry conferences, including SEPG, the National Defense Industrial Association (NDIA), and the SwA Forum. The group developed two sets of products to help address the challenges of developing more secure software and systems—
f A draft set of assurance goals and practices that harmonize and enhance existing Security CMMs (i.e., MSSDM, SSE-CMM);
f A mapping of the draft set of assurance goals and practices to the CMMI-DEV v1.2.
The group is currently using the mapping of the practices to CMMI-DEV v1.2 to create an Assurance Focus Topic as a third work product. This work product will document the assurance thread within the CMMI. The Assurance Focus Area can be used by organizations to benchmark the existence and institutionalization of their integrated assurance practices. While the original purpose of the Assurance Focus Area is to integrate assurance into CMMI, the materials are being created in such way that they will be useful with or without CMMI for those organizations that are integrating assurance into their business goals and would like a way to guide and benchmark their efforts.

Measuring Cyber Security and Information Assurance State-of-the-Art Report (SOAR) 45
Section 4 Best Practices
References41 John Murdoch, University of York. “Security Measurement White Paper,” 13 January 2006. Accessed
3 April 2009 at: http://www.psmsc.com/Downloads/TechnologyPapers/SecurityWhitePaper_v3.0.pdf
42 SwA Measurement Working Group. Practical Measurement Framework for Software Assurance and Information Security, Version 1.0, October 2008. Accessed 7 April 2009 at: https://buildsecurityin.us-cert.gov/swa/downloads/SwA_Measurement.pdf
43 Software Assurance Community Resource and Information Clearinghouse Measurement Working Group. Accessed 1 April 2009 at: https://buildsecurityin.us-cert.gov/swa/measwg.html
44 SwA Measurement Working Group. Practical Measurement Framework for Software Assurance and Information Security, Version 1.0, October 2008, op cit.
45 Carol Woody, CMU SEI CERT/CC. “Strengthening Ties between Process and Security,” on DHS National Cyber Security Division’s BuildSecurityIn Web portal, 1 Aug 2008. Accessed 2 April 2009 at: https://buildsecurityin.US-CERT.gov/daisy/bsi/articles/knowledge/sdlc/1049-bsi.html#dsy1049-bsi_harm
-and- Carol Woody. “Process Improvement Should Link to Security: SEPG 2007 Security Track Recap.” Technical Note CMU/SEI-2007-TN-025, September 2007. Accessed 6 April 2009 at: http://www.sei.cmu.edu/publications/documents/07.reports/07tn025.html

“For federal agencies, a number of existing laws, rules, and regulations cite IT performance measurement in general, and IT security performance measurement in particular, as a requirement.”
Elizabeth B. Lennon, NIST [46]
5Government Initiatives and Programs

Measuring Cyber Security and Information Assurance State-of-the-Art Report (SOAR) 47
Section 5 Government Initiatives and Programs
Over the past eight years, the federal government has become increasingly active in pursuit of CS/IA measurement. To this end,
it has established a number of programs to provide guidance for implementing CS/IA measurement programs within the government, researching additional measures for future programs as well as providing oversight by measuring the security posture of different government agencies.
This section outlines the major CS/IA measurement initiatives in place throughout the federal government, including DoD, DHS, NIST, OMB, NASA, and the Department of Justice. The scope of DHS and NIST measurement efforts addressed in this section extend beyond their respective agencies, with the goal of improving CS/IA measurement programs throughout government, academia, and industry. OMB’s measurement efforts are unique in that they encompass CS/IA measurement programs for the federal government as a whole—providing insight into the effectiveness of security controls within various government agencies and departments.
5.1 DoD IA Metrics ProgramIA metrics and associated programs exist at all levels within DoD—from the executive and policy-making organizations to the various branches of service and their commands—in various shapes and forms. Each organizational unit may have different metrics, tools, and processes for IA metrics. All have focused on the identification and development of IA metrics to be used to assess performance of selected missions within DoD. Common key goals and challenges have included—
f Difficulty assessing IA performance and effectiveness; f Need to qualify IA costs for budget development;

Measuring Cyber Security and Information Assurance State-of-the-Art Report (SOAR)48
Section 5 Government Initiatives and Programs
f Determination of budget area focus and investment, high cost of compliance, and the need to develop an efficient strategy to achieve and maintain compliance;
f POA&M identification and mitigation.
DoD components report compliance statistics and other measures up the chain on a regular basis in common reporting formats, but the processes and tools used within each individual component are left to their discretion.
5.1.1 OASD(NII) EffortsIA metrics efforts in the Office of the Assistant Secretary of Defense (Network and Information Integration) (OASD(NII)) are based on specific goals and objectives derived from the organization’s mission. IA metrics are a means to uniformly monitor and objectively document the organization’s security posture, and to determine appropriate corrective actions for specific “needs improvement” areas, including justifying investments in those areas.
OASD(NII) is focusing on providing a means to track IA investments and effectiveness; metrics provide an objective way of comparing strategies for deploying security solutions, and of instituting and implementing security processes, policies, and procedures. The interpretation of metrics results leads to the determination of appropriate remedial actions and, ultimately, to improvements in organizational goals. [47]
In 2005, OASD(NII) articulated the following goals for DoD’s IA metrics initiative—
f Determine what measurements were being collected at present. f Evaluate the quality of metrics in terms of their ability to measure
alignment to objectives. f Generate increased awareness of the use of/need for metrics. [48]
Over 700 metrics from existing DoD metrics efforts (e.g., Joint Task Force-Global Network Operations [JTF-GNO], Defense Information Systems Agency [DISA], NSA, JQRR, Director, Operational Test & Evaluation [DOTE] metrics, FISMA, and CND assessments) were collected, documented, and categorized by the DoD IA Metrics Working Group (DIAP WG). These metrics were analyzed to determine how effective they are in providing knowledge needed for assessing each goal area of the IA Strategic Plan. Existing metrics were analyses from two perspectives—
f Which ones supported knowledge needed in assessing progress toward IA goals?
f What was the quality of each metric in terms of objectivity vs. subjectivity? (The more reliable the data on which the metric was based, the more objective it was considered.)

Measuring Cyber Security and Information Assurance State-of-the-Art Report (SOAR) 49
Section 5 Government Initiatives and Programs
Ultimately, “quality” metrics were those considered adequate for use in assessing strategic plan goals.
DIAP WG findings indicated that over 200 existing metrics were inadequate for these purposes (as they were implementation metrics, rather than effectiveness metrics), and that more metrics were needed to fill in gaps in knowledge base. ASD(NII) suggested some metrics that may fill in these gaps: JTF-GNO incident metrics, red team result metrics, and vulnerability assessment results. [49] Selected metrics generated by the DIAP WG are described in Table 5-1.
Table 5-1 Selected DoD IA Metrics Working Group Metrics [50]
Metrics Data Generated by DIAP included the following:
f Critical Issue to be measured: Are We (Getting) Ready? f Approach: Link program outputs to mission outcomes
Metrics data generated by Joint Staff:
f Critical Issue to be measured: Network impacts to mission accomplishment f Approach: Link systems to specific missions to determine risk
Metrics data generated by GIG IA Portfolio (GIAP) program:
f Critical Issue to be measured: What mix of investments get the most results? f Approach: Link programs/investments to capability threads
Metrics data generated by USSTRATCOM/JTF-GNO:
f Critical Issue to be measured: What issues need immediate solutions? f Approach: Broad survey of available parameters
5.1.2 DON CIO EffortsSince earlier in the decade, the Department of the Navy Chief Information Officer (DON CIO) has been maintaining and implementing IA performance management efforts to comply with the DON IA Strategy and FISMA. DON CIO has performed gap analyses of the DON CIO IA Strategy and DON IA Strategy against NIST SP 800-55 Rev. 1. The resulting gap analysis findings allowed DON CIO to augment and improve its FISMA Action Plan.
Once the analysis was complete, DON CIO compiled IA performance measures needed to comply with governance, and to satisfy stakeholders additional information requests; established a process for retrieving data from various data sources, including mapping measures to those data sources; and created detailed reports of measurement results in dashboard views. [51]
5.1.3 Mission Oriented Risk and Design Analysis (MORDA)The MORDA methodology was developed for DoD’s Cyber Defense Agency by NSA-sponsored researchers at Johns Hopkins University’s Applied Physics Laboratory (JHU APL) to provide a quantitative risk assessment and management methodology that leverages state-of-the-art security modeling, analysis, and measurement techniques. To this end, MORDA employs a variety of tools, including attack trees and other IA models and multiple-

Measuring Cyber Security and Information Assurance State-of-the-Art Report (SOAR)50
Section 5 Government Initiatives and Programs
objective decision analysis. Each model yields mathematical outputs that express measures, such as estimated losses from attacks, predicted attack frequency, and effectiveness of countermeasures. Collectively, these quantitative outputs are intended to drive investment decisions associated with enhancement of security controls and reengineering, upgrading, or downgrading of existing system features.
The MORDA process is implemented according to the Security Optimization Countermeasure Risk and Threat Evaluation System (SOCRATES) model, also developed by JHU APL. The model, which is supported by the SOCRATES tool, enables teams of subject matter experts and analysts to define the assumptions under which three MORDA models—(1) an adversary model; (2) a user model; (3) a service provider model—will be developed, and then to identify and characterize the data needed to generate those models.
For the adversary model, such data includes identified adversaries, their preferred attack functions, and their specific attack patterns. For the service provider model, data includes characterizations of the countermeasures and design alternatives needed to resist the identified attack patterns, and an explicit description of the security requirements for each design alternative.
Also to be considered are user and service provider concerns (e.g., functionality, interoperability, usability) that could be affected by the attacks or the countermeasures/design alternatives, a characterization of decision-maker functionality preferences, and the complex interdependencies among countermeasures, among attacks, and between countermeasures and attacks.
Based on the three MORDA models, the SOCRATES tool enables the analyst to—
f Qualitatively label attacks and use a quantitative scale to evaluate their potential impact, in terms of loss of value (SOCRATES differs from many quantitative risk assessment methodologies in that it does not rely on adversary probability of attack to quantify attack impact.);
f Capture and quantify each countermeasure’s ability to enhance the security of the network/system under consideration;
f Quantify the loss of value to the network/system operator that would result from a degradation of the network’s/system’s user functions as a result of failed security.
As a result of the quantitative evaluation of countermeasure effectiveness (using aggregated value, optimization, and cost-benefit analysis), decision-makers can more effectively allocate risk-reducing resources.
According to MORDA’s developers, [52] its main shortcomings are its reliance on significant access to subject matter experts and large data sets for providing the input needed to generate the MORDA models. These onerous data gathering requirements really make MORDA practical only for critical information systems that require thorough, accurate risk analyses.

Measuring Cyber Security and Information Assurance State-of-the-Art Report (SOAR) 51
Section 5 Government Initiatives and Programs
For Further Reading
DON CIO, Department of the Navy Federal Information Security Management Act (FISMA) Guidance, March 2006. Accessed 1 April 2009 at: http://www.doncio.navy.mil/Download.aspx?AttachID=294
DON CIO Blog. Accessed 1 April 2009 at: http://www.doncio.navy.mil/tagresults.aspx?ID=28
Government Accountability Office (GAO) Report to Congressional Addressees. Information Technology: DOD Needs To Ensure That Navy Marine Corps Intranet Program Is Meeting Goals And Satisfying Customers, December 2006. Accessed 1 April 2009 at: http://www.gao.gov/new.items/d0751.pdf
United States Marine Corps. Initial Capabilities Document (ICD) for Marine Corps Enterprise Information Technology Services (MCEITS), Version 3.4, 20 May 2005. Accessed 1 April 2009 at: http://www.mceits.usmc.mil/docs/05-05-20_MCEITS_ICD_(v3.4).pdf
Secretary of the Navy. Federal Managers’ Financial Integrity Act. FY 2008 Statement of Assurance, 28 August 2008. Accessed 1 April 1, 2009 at: www.fmo.navy.mil/mic/docs/SOA_Final_WEB.pdf
5.2 DHSDHS is a unique government entity in this document as it was created after the publication of the IA Metrics CR/TA.
5.2.1 DHS NIPP and Cyber Security MetricsThe DHS National Infrastructure Protection Program (NIPP) addresses cyber security metrics to the extent that it addresses performance, process, and outcome metrics for all Critical Infrastructure Protection (CIP) programs and activities. Within its definition of Critical Infrastructure and Key Resources (CI/KR), the NIPP includes the national cyber infrastructure, which encompasses the networks, computer systems, and other elements that critical infrastructure activities rely upon to perform their missions. Therefore, the metrics prescribed by the NIPP apply to the performance, processes, and outcomes related to the national cyber infrastructure.
The National CIP Program defined in the NIPP is based on a risk-management approach that includes the use of metrics to “measure and communicate program effectiveness,” including the effectiveness of the National CIP Program itself as well as the degree to which goals of CIP Plans undertaken by the individual CI/KR sectors are satisfied. In addition to these performance metrics, individual activities within CIP programs and plans (e.g., vulnerability assessments) are to be measured by a combination of process metrics (e.g., the number of assessments performed by a certain date) and outcome metrics (e.g., the number of facilities assessed as high risk before vs. after instituting protective controls.)
While it is understood by DHS that selecting meaningful outcome metrics for protection programs is challenging because risk reduction is not directly observable (i.e., it is difficult to determine whether a terrorist attack has been prevented), DHS also recognizes that process metrics alone are not sufficient to measure the value of CIP activities.

Measuring Cyber Security and Information Assurance State-of-the-Art Report (SOAR)52
Section 5 Government Initiatives and Programs
The NIPP’s Guidance for Developing Sector-Specific Plans as input to the National Infrastructure Protection Plan [53] includes extensive guidance for completing Section V of the sector-specific plans, which describes the methodology—consistent with the Government Performance and Results Act (GPRA)—that will be used to measure CIP program progress. The guidance also cites NIST SP 800-55 Rev. 1 as the recommended source for cyber security performance measurement.
5.2.2 DHS/DoD/NIST Software Assurance Measurement Working GroupThe DHS/DoD/NIST SwA Measurement WG, introduced in Section 4.1, has been in existence since 2005. The WG meets several times a year to work on common deliverables and provide an opportunity to SwA and information security practitioners to share lessons learned implementing or developing measures. Specifically, its goals [54] are to—
f Provide practical SwA measurement framework and resources to the community;
f Encourage integration of SwA practices into software and system development through integrated measurement approach;
f Make SwA measurement resources, including case studies, articles, methods, measures examples, etc., available to the community;
f Create SwA measurement community of practice that shares its experiences and lessons learned;
f Collaborate with other SwA WGs to integrate measurement into their activities.
Up until recently, the SwA Measurement WG has been focusing on developing and publishing Practical Measurement Framework for Software Assurance and Information Security. (See Section 4.1 for more details.)
One of the recent efforts of the SwA Measurement WG is to create a series of case studies of measurement constructs that projects and organizations can use to create useful measures and use them to improve software assurance, security, and quality. An example of such a mini-case study is illustrated in Figure 5-1.

Measuring Cyber Security and Information Assurance State-of-the-Art Report (SOAR) 53
Section 5 Government Initiatives and Programs
Figure 5-1 Software Assurance Measure Example [55]
The example presented in Figure 5-1 leverages one of the measurement models (adopted from ISO/IEC 15939) used by the Practical Measurement Framework for Software Assurance and Information Security, and assigns a specific software assurance-related item to each item within the model. The purpose of this mini-case study is to satisfy stakeholders’ need to
“understand the impact of improved assurance practices” by leveraging a number of measures, such as numbers of defects and lines of code, numbers of weaknesses, EAL ratings, CMMI maturity levels, and comparison and correlation of these measures combined into a trend. While this mini-case study has not yet been tested, it has been well received by the WG and published among the proceedings of the DHS SwA Forum.
The SwA Measurement WG is also in the process of creating a Web-based community of interest that includes a repository of SwA and security measurement resources. This community of interest is envisioned as a place where SwA and information security measurement practitioners can exchange ideas, post generic measures that they find useful, and find
InformationNeeds
Entities
Estimate or evaluationthat provides a basis fordecision making
Algorithm combiningmeasures and
decision criteria
Algorithm combiningtwo or morebase measures
A measure of asingle attribute bya specific method
Property relevantto information needs
Operations quantifyingan attribute againsta scale
Quantity definedas a function of twoor more measures
InformationProduct
Indicator
DerivedMeasure
DerivedMeasure
AnalysisModel
BaseMeasure
BaseMeasure
Attribute Attribute
MeasurementFunction
MeasurementMethod
MeasurementMethod
InterpretationInterpretation
Trend of CVEs with highCVSS scores against maturitylevels indicates a relationship
between maturity level andCVSS scores
Number of or CWEsper set number of
lines of code
EAL Rating
CVEs present onthe system with CVSS
score above 7
Measurement
Line of code
MeasurementProcess
Understand the impactof improved
assurance practices
CVSS Score
Measured Artifact
CVE/CWE/defect
CMMIMaturity Level
Number oflines of code
Number of CVEsor CWEs
Comparison of CVEswith CVSS scores
above 7 compared withproject’s Maturity Level

Measuring Cyber Security and Information Assurance State-of-the-Art Report (SOAR)54
Section 5 Government Initiatives and Programs
measurement resources. SwA Measurement WG resources available on the site include pointers to standards, guidelines, books, articles, and community-posted examples. These resources can be found at https://buildsecurityin.us-cert.gov/swa/measresrc.html
5.2.3 US-CERT Cyber Security Metrics for Control SystemsIdaho National Laboratory, under contract to DHS’s US-CERT Control Systems Security Center, developed a security framework with associated metrics for Supervisory Control and Data Acquisition (SCADA) system security, based on a set of seven security “ideals.” [56] The implementation of this framework and the use of the ideal-based metrics were then published by US-CERT and briefed at S4: SCADA Security Scientific Symposium 23 January 2008.
The metrics themselves and the security ideals to which they are mapped are depicted in Table 5-2.
Table 5-2 Set of 10 Core Technical Security Metrics with Corresponding Ideals [57]
Security Ideal Metric
1. Security Group (SG) knows current control system perfectly. Rogue Change Days
Security Evaluation Deficiency Count
2. Attack Group (AG) knows nothing about the control system. Data Transmission Exposure
3. The control system is inaccessible to AGs. Reachability Count
Attack Path Depth
4. The control system has no vulnerabilities. Known Vulnerability Days
Password Crack Time
5. The control system cannot cause damage. Worst Case Loss
6. SG detects any attack instantly. Detection Mechanism Deficiency Count
7. SG can restore control system integrity instantly. Restoration Time
5.3 NISTThe mission of NIST is to “promote US innovation and industrial competitiveness by advancing measurement science, standards, and technology in ways that enhance economic security and improve our quality of life.” [58] Researching ways to measure is a core part of NIST’s mission. Several NIST projects that are dedicated to advancing the state of practice and state of the art for measuring software security, information security, and other relate disciplines are discussed in the following subsections.
5.3.1 SAMATELaunched in summer 2005, NIST’s SAMATE project aims to improve the state of the art of existing software assurance methodologies and tools. The project’s primary objectives include—

Measuring Cyber Security and Information Assurance State-of-the-Art Report (SOAR) 55
Section 5 Government Initiatives and Programs
f Developing metrics to gauge the effectiveness of existing software assurance tools,
f Assessing current software assurance methodologies and tools to identify deficiencies that may introduce software vulnerabilities or contribute to software failures.
SAMATE’s activities in the software assurance realm are outlined in the 2007 IATAC Software Security Assurance: A State-of-the-Art Report (SOAR). [59]
One of SAMATE’s primary goals is to provide a metric against which individual software assurance tools can be measured. Initially, this is a measurement of how well a specific tool performs against the SAMATE Reference Dataset (SRD), a collection of source code with known security flaws. In the long run, SAMATE plans to support laboratories that can be used to assess software assurance tools.
A future SAMATE goal is to identify effective metrics against which the security of software can be measured. [60] Most software assurance tools provide their own proprietary measurement that represents the security of assessed software against “other” software. Eventually, these metrics could be incorporated into software assurance tools—and verified by SAMATE laboratories. With these metrics in place, organizations could deploy such tools (e.g., source code scanners, binary scanners, Web application scanners) and produce robust, well-understood measures of the software’s security posture.
5.3.2 Attack-Based MeasuresNIST is currently funding a research effort on attack-based measures, led by researchers at NIST, members of the George Mason University (GMU) Center for Secure Information Systems (CSIS), and the Concordia Institute for Information Systems Engineering. Researchers from these organizations have been developing a security metric based on attack graphs, which are sets of “actions that increase adversaries’ capabilities.” [61]
By analyzing attack graphs, researchers explore different techniques that can be used to quantify the potential success of an attack on the system—providing a metric that can gauge the relative attack resistance among multiple networks.
One of the primary features of the attack resistance metric under development is that it provides a general framework under which other, similar metrics still apply (e.g., the weakest-adversary metric). [62] In 2008, research on the attack-resistance metric was extended to generate a probabilistic metric that can be used to identify the potential damage of a successful attack as well as the effects of possible mitigation strategies. [63]

Measuring Cyber Security and Information Assurance State-of-the-Art Report (SOAR)56
Section 5 Government Initiatives and Programs
5.3.3 SCAPThe Security Content Automation Protocol (SCAP) [64] is “a suite of vulnerability management standards that together enable standardization and automation of vulnerability management, measurement, and technical policy compliance checking (soon remediation) along with enhanced product and database integration capabilities with machine readable reporting.”
While the SCAP is not directly associated with generating security measures, many of the standards within the SCAP suite provide well-documented measures than can be accessed through SCAP-enabled products. SCAP components are as described in Table 5-3.
Table 5-3 SCAP Components [65]
SCAP Components Description
Common Vulnerabilities and Exposures (CVE) [66]
Provides a standard name and identifier for individual vulnerabilities and exposures that have been publicly identified
Common Configuration Enumeration (CCE) [67]
Provides a standard name and identifier for individual configuration issues associated with software components
Common Platform Enumeration (CPE) [68]
Provides a standard name and identifier for specific systems, platforms and packages
Common Vulnerability Scoring System (CVSS) [69]
Provides a metric for quantitatively communicating the impact of a specific vulnerability. CVSS is discussed in-depth in Section 7.4.1
Extensible Configuration Checklist Description Format (XCCDF) [70]
Provides a language for writing security checklists, benchmarks, and related documents
Open Vulnerability and Assessment Language (OVAL) [71]
Provides a language for describing system information, including its current state as well as the results of a vulnerability assessment
The CVE, CCE, and CPE are essential in producing machine-readable information that can, in turn, produce security metrics. The CVSS, XCCDF, and OVAL can be used to produce useful security metrics within an organization. The CVSS provides explicit metrics as defined in Section 7.4. While the XCCDF and OVAL do not provide such metrics, they provide a framework against which organizations can measure their systems’ compliance to organizationally defined configurations or information, based on systems’ assessment results.
The OSD Computer Network Defense (CND) pilot [72] aims to leverage the SCAP standards to produce a better understanding of DoD’s networks. The expected benefit is to provide—
f An architecture that leverages the SCAP standards to correlate asset data, event data, policy, and vulnerability data;
f The ability to generate metrics based on these values.
Within the scope of the pilot, the SCAP serves as an important building block for generating DoD-wide security metrics. Using the OVAL and CVE, DoD can identify how well assets have performed during vulnerability assessments and Information Assurance Vulnerability Alert (IAVA) patch

Measuring Cyber Security and Information Assurance State-of-the-Art Report (SOAR) 57
Section 5 Government Initiatives and Programs
compliance. Using the XCCDF, OVAL, CCE, and CPE, DoD can identify whether systems have followed appropriate configuration checklists, and whether users and roles have the correct, assigned permissions. Additionally, DoD can leverage the XCCDF and OVAL to identify whether certain systems manifest artifacts indicating malicious activity. As of September 2008, the CND Pilot interface can answer the following metrics questions—
f What vulnerabilities affect my assets? f How many assets are affected by each vulnerability? f What patches are available? f What patches have been applied?
It is expected that the SCAP will provide a robust framework for automating these metrics for organizations of a variety of sizes; by doing so, it will help greatly improve the security posture of organizations as large as DoD.
5.4 OMB FISMA MeasuresThe interest of OMB in CS/IA measures is a direct result of its role in verifying government agencies’ compliance with FISMA. The following is an excerpt from an article focused on the plain truth for finding success with FISMA.
“The key element in demonstrating FISMA compliance is the comprehensive annual report that the CIO and the head of each agency provide to Congress and to the Office of Management and Budget (OMB). This report includes evaluations of the effectiveness of the information security programs, including providing evidence that the agency has developed a coordinated strategy of analyzing security threats and responding accordingly. If an agency implements a technology solution to boost their score in one year, they may score lower following year if they fail to demonstrate how the solution fits into the agency’s overall information security strategy.” [73]
Ongoing changes in federal laws, standards, and requirements continue to focus federal agencies on measurement and monitoring. Public security events/incidents also drive the need for security to improve through measurement and monitoring efforts. As described in Section 3.1.1, OMB releases new reporting requirements for agencies to follow and delivers an annual report to the US Congress on government-wide status and progress. Current OMB FISMA guidance requires agencies to report security performance measures provided by OMB as well as three outcome/output security performance measures developed by agencies, based on NIST SP 800-55 Rev. 1. Proposed new FISMA legislation requires Chief Information Security Officers (CISO) to “create, maintain, and manage an information security performance measurement system that aligns with agency goals and budget process.”

Measuring Cyber Security and Information Assurance State-of-the-Art Report (SOAR)58
Section 5 Government Initiatives and Programs
Currently, FISMA evaluation information security performance measures focus on—
f Tracking system boundaries and configuration of the FISMA systems inventory,
f C&A of systems, f Testing of security controls and contingency plans, f Mitigating weaknesses using a POA&M, f Training employees and security specialists, f Privacy and protection of personally identifiable information.
Part of the annual process is the OMB annual Computer Security Report Card for federal departments and agencies. The most recent annual report shows strong progress toward implementation. Table 5-4 summarizes overall progress in meeting selected government-wide IT security goals from fiscal years 2002 to 2007, based on input for each agency’s CIO.
Table 5-4 Government-wide Security Status and Progress from Fiscal Years 2002 to 2007 [74]
Percentage of Systems with a: FY 2002 FY 2003 FY 2004 FY 2005 FY 2006 FY 2007
Certification and Accreditation 47% 62% 77% 85% 88% 92%
Tested Contingency Plan 35% 48% 57% 61% 77% 86%
Tested Security Controls 60% 64% 76% 72% 88% 95%
Total Systems Reported 7,957 7,998 8,623 10,289 10,595 10,304
Since FY 2002, security measures have been a key function of the OMB annual Computer Security Report Card. Through security measures, federal departments and agencies have been able to show improvement in their compliance programs.
“The 25 major agencies of the Federal government continue to improve information security performance relative to C&A rates and testing of contingency plans and security controls. Several larger agencies reported especially notable progress regarding these measures, including the National Aeronautics and Space Administration (NASA), the Departments of State, Treasury, and the Department of Defense (DOD). Agencies have also maintained or improved performance relative to IG qualitative assessments of IT security processes. Federal agencies also showed improvement in IG assessments of the quality of their C&A processes.” [75]
Each agency report consists of the— f CIO part, which is compiled and submitted by the CIO; f Inspector General (IG) part, which is independently compiled and
submitted by the agency IG.

Measuring Cyber Security and Information Assurance State-of-the-Art Report (SOAR) 59
Section 5 Government Initiatives and Programs
Each agency’s IG also contributes an equal part to the FISMA report. Table 5-5 shows an excerpt from government-wide findings for FY 2007.
Table 5-5 FISMA IG Assessments Government-Wide in Fiscal Year 2007 Results Excerpt [76]
AgencyEffective POA&M
Certification and Accreditation
Process Quality
System Inventory
Completeness
Privacy Impact Assessment
Process Quality
Agency for International Development
Yes Excellent 96–100% Good
Department of Agriculture
No Poor 71–80% Poor
Department of Commerce Yes Poor 96–100% Unaudited
Department of Defense Unaudited Unaudited Unable to Determine
Failing
Department of Education Yes Satisfactory 96–100% Satisfactory
Department of Energy Yes Satisfactory 96–100% Satisfactory
Environmental Protection Agency
Yes Satisfactory 96–100% Satisfactory
General Services Administration
Yes Satisfactory 96–100% Satisfactory
Department of Health and Human Services
Yes Good 96–100% Excellent
Department of Homeland Security
Yes Satisfactory 96–100% Good
Department of Housing and Urban Development
Yes Satisfactory 96–100% Good
Department of the Interior
No Poor 96–100% Poor
Based on the suggested changes associated with the newly proposed FISMA legislation, these performance measures are expected to evolve. The following article excerpt highlights a common status of how FISMA is working, and what elements of the act may need improvements.
“Even without something like FISMA, improvements will continuously be added as new uses for technology open new attack surfaces, say experts. But FISMA brings structure to what would otherwise be a chaotic, voluntary process. What many would like to lose is the FISMA scorecard, which experts say is not an accurate representation of the true security posture of an organization. Many have seen organizations get an A when they believe they should have received an F, and vice versa. Weaknesses identified in certification and accreditation activities remain to be mitigated and corrected,” says Howard. “Additionally, FISMA reporting emphasizes the existence of processes and does not focus on the quality of those processes.” [77]

Measuring Cyber Security and Information Assurance State-of-the-Art Report (SOAR)60
Section 5 Government Initiatives and Programs
5.5 NASA Metrics ProgramsAs an organization devoted to ensuring the safety of its personnel and the success of its missions, NASA has a long-standing tradition of using metrics to illustrate its internal status. Traditionally, these metrics have been focused specifically on safety (i.e., metrics developed by the NASA Software Assurance Program), but the administration has increasingly been developing security-oriented measures. This section describes metrics programs underway at NASA’s Jet Propulsion Laboratory (JPL) and by the NASA CIO. Section 5.5.2 also discusses an analysis performed by Captain Adam Bryant (US Air Force), comparing NASA’s metrics programs to DoD’s.
5.5.1 NASA JPL Information Security Metrics ProgramThe Security Metrics Program [78] at NASA JPL has defined three categories of security metrics for reporting to JPL management—
f Compliance, f Incident response, f Risk assessment.
Within each category, the JPL Security Metrics Program has defined only nine metrics to be collected because, while more data is available, the program has chosen to focus on those elements that have a significant impact on organizational security, and which thus need to be considered by managers.
Whenever possible, JPL Security Metrics Program managers automate the collection of metrics data; this is particularly true for data in the incident response and risk assessment categories. However, compliance metrics data is virtually always collected manually through database queries and/or by data calls to the information owner or the responsible individual or department.
5.5.2 Comparison of NASA and DoD IA Metrics ProgramsIn his Masters thesis, Developing a Framework for Evaluating Organizational Information Assurance Metrics Programs, [79] Captain Adam Bryant (US Air Force) did an extensive comparison of three IA metrics programs: those of DoD, the US Air Force (USAF), and NASA JPL. Table 5-6 provides Capt. Bryant’s summary of the key similarities and differences between these three IA metrics programs.

Measuring Cyber Security and Information Assurance State-of-the-Art Report (SOAR) 61
Section 5 Government Initiatives and Programs
Table 5-6 Comparison of DoD, USAF, and NASA JPL IA Metrics Programs [80]
DoD Air Force NASA JPL
Motivations Return on investment, mission readiness (surrogate for effectiveness)
Return on investment, mission accomplishment
Process improvement, implicit return on investment
Primary Objectives Determine how to measure strategic objectives, re-use existing data
Determine how to measure strategic objectives, re-use existing data
Improve control over processes
Challenges Disparity between numerous data sources, too much time spent “cleaning” data, not enough personnel doing analysis, difficult to use massive amount of data collected
Problems managing issues discovered, risks accepted at lower levels make risk unmanageable from enterprise perspective, difficult to use massive amount of data collected
Management intervention still required to enforce policy
Process Complexity Extremely high High Medium to Low
Drivers FISMA, congress, other budget and effectiveness questions
FISMA, congress, DoD questions, improvement of IA posture
Process improvement, responsibility to sponsors
Orientation Bottom-up, attempting to tie toward high objectives
Bottom-up Top-down
Strengths and Keys to Program
Long history – co-developed most standards, many data sources
Air Force has increasing role in cyberspace so program should be put at forefront, many data sources
Track record of success, credibility with leadership as well as other agencies like NIST, asset control
Approach to Automation Desired but not there yet Desired but not there yet In place and successful
Time to Market from Policy to Implementation
Very slow Very slow Moderate
Type of Metrics Collected Heavily technical but also containing operational and management metrics
Heavily technical but also containing operational and management metrics
Mix of technical, operational, and management-related
Style of Data for Majority of Metrics
Nominal. Boolean checklist-oriented questions
Nominal. Boolean checklist-oriented questions
Ratio
Program Success as Perceived by Organization
Not yet successful Not yet successful Successful and improving
5.5.3 NASA Deputy CIO Information Security Performance MeasuresIn 2002, NASA Deputy CIO presented a case study on how information security performance measures were being leveraged for NASA headquarters. [81] NASA CIO viewed IT security and measurement as part of mission accomplishment. A focal point of the philosophy was to identify good metrics that do not impede progress toward the goals. Key process steps included—
f Stakeholder group reviews success of previous-year measures;

Measuring Cyber Security and Information Assurance State-of-the-Art Report (SOAR)62
Section 5 Government Initiatives and Programs
f Review, debate, and approval of proposed modifications by IT Security Managers;
f Approval of metrics by department CIOs, and brief presentation of the measures to the NASA Security Council;
f Quarterly measures data collection and analysis, identification of trends, and identification and communication of corrective actions, as required.
The NASA CIO program discovered a way, not only to meet compliance goals, but to reuse information for more advanced measures, including—
f Ratio of observed vulnerabilities to systems to the total number of systems,
f Ratio of penetration rate to attack rate.
Once the baseline implementation of the security program was completed and stable, the organization moved to act smarter without spending more money; increase intelligence through better data, analysis, and increased automated processes; and more tightly integrate security measures into program and capital planning.
5.6 BJS NCSSIn 2001, the Bureau of Justice Statistics (BJS) in the US Department of Justice’s Office of Justice Programs (OJP) conducted a pilot Computer Security Survey (CSS) to gather information from 500 US businesses on their computer infrastructure and security measures. Based on the pilot-survey results, BJS, in collaboration with the DHS National Cyber Security Division (NCSD), decided to field a far more extensive National Computer Security Survey (NCSS) of “a nationally representative sample” that constituted 36,000 US businesses across 36 different industry sectors.
In 2004, the RAND Corporation was contracted to develop the survey methodology for the NCSS, which it then applied when the survey was fielded in 2006. The purpose of the survey was to collect statistics intended to be comparable to traditional FBI crime statistics that would enable BJS and NCSD “to produce reliable national- and industry-level estimates of the prevalence of computer security incidents (such as denial of service attacks, fraud, or theft of information) against businesses and the resulting losses incurred by businesses.” [82] The statistical data captured by the NCSS could also form the basis for defining key cyber security and computer crime measures; indeed, RAND performed a number of analyses to generate such measures, which are included in the survey report.
In the end, the more than 7,000 businesses that participated in the survey were offered feedback intended to “allow them to benchmark themselves against the rest of their industry sectors.” [83]

Measuring Cyber Security and Information Assurance State-of-the-Art Report (SOAR) 63
Section 5 Government Initiatives and Programs
The report is available online at: http://www.ojp.usdoj.gov/bjs/pub/pdf/cb05.pdf (accessed 10 March 2009).
RAND also published a report detailing the methodology it used to develop and field the NCSS as well as its sampling design and weighting methodology; this RAND report is available for purchase online at: http://www.rand.org/pubs/technical_reports/TR544/ (accessed 10 March 2009).
References 46 Elizabeth B. Lennon. “IT Security Metrics,” in NIST Information Technology Laboratory (ITL) Bulletin,
August 2003. Accessed 8 May 2009 at: http://www.itl.nist.gov/lab/bulletns/bltnaug03.htm
47 IAnewsletter, Volume 7, Number 3, Winter 2004. Accessed 2 February 2006 at: iac.dtic.mil/iatac/IA_newsletter.html
48 Vivian A. Cocca, OSD(NII). “DoD’s Approach to IA Metrics.” Presentation at PSM Technical Working Group meeting, 23 March 2005. Accessed 28 December 2008 at: http://www.psmsc.com/Downloads/TWGMarch05/05_Cocca_DoD_Metrics_Initiative.pdf
49 Ibid.
50 Dave Aland, Johns Hopkins APL, supporting the OSD DOT&E Deputy Director of Naval and C4ISR Systems. “Metrics Lessons Learned from Conducting Operational Assessments of Networks.” Briefing at the MORS Workshop on Transforming IA for Netcentric Operations, March 2007. Accessed 10 December 2008 at: http://www.mors.org/meetings/2007_tia/pres/aland.pdf
51 DON CIO Blog. Accessed 1 April 2009 at: http://www.doncio.navy.mil/tagresults.aspx?ID=28
-and-
US Congress. FISMA, op cit.
-and-
Department of the Navy. CHIPS - The Department of the Navy Information Technology Magazine. Accessed 2 April 2009 at: http://www.chips.navy.mil/archives/06_Jul/web_pages/FISMA.htm
52 Donald L. Buckshaw, Gregory S. Parnell, Willard L. Unkenholz, Donald L. Parks, James M. Wallner, and O. Sami Saydjari, “Mission Oriented Risk and Design Analysis of Critical Information Systems,” in Military Operations Research, Volume 10 Number 2, November 2005. Accessed 14 April 2009 at: http://www.mors.org/awards/mor/2006.pdf
53 DHS. “Guidance for Developing Sector-Specific Plans as input to the National Infrastructure Protection Plan,” 2 April 2004. Accessed 4 February 2009 at: http://cees.tamiu.edu/covertheborder/TOOLS/SSAGuidance.pdf
54 DHS-DoD-DoC. “Software Assurance Forum Measurement Working Group Status Briefing,” May 2008
55 ISO/IEC 15939, Systems and software engineering—Measurement process. Accessed on 15 April 2009 at: http://www.psmsc.com/ISO.asp
56 Miles McQueen, Wayne Boyer, Sean McBride, Marie Farrar, Zachary Tudor. Measurable Control System Security through Ideal Driven Technical Metrics, January 2008. Presented at SCADA Security Scientific Symposium, January 23, 2008. Accessed 6 April 2009 at: http://www.inl.gov/technicalpublications/Documents/3881671.pdf
57 Ibid.
58 NIST. “NIST Mission, Vision, Core Competencies, and Core Values.” Accessed 2 April 2009 at: http://www.nist.gov/public_affairs/nist_mission.htm

Measuring Cyber Security and Information Assurance State-of-the-Art Report (SOAR)64
Section 5 Government Initiatives and Programs
59 IATAC. Software Security Assurance: A State of the Art Report (SOAR), 31 July 2007. Accessed 1 April 2009 at: http://iac.dtic.mil/iatac/download/security.pdf
60 NIST SAMATE. “Metrics and Measures.” Accessed 6 January 2009 at: http://samate.nist.gov/index.php/Metrics_and_Measures
61 Todd Heberlein, Senthil Ebina, Melissa Danforth, and Tye Stallard, University of California at Davis. “Attack Graphs: Identifying Critical Vulnerabilities within An Organization.” Seminar presented by
University of California-Davis Computer Security Lab, 10 March 2004. Accessed 6 February 2009 at: http://seclab.cs.ucdavis.edu/seminars/AttackGraphs.pdf
62 Joseph Pamula, Sushil Jajodia, Paul Ammann, and Vipin Swarup. “A weakest-adversary security metric for network configuration security analysis,” in Proceedings of the 2nd ACM workshop on Quality of Protection (QoP ’06), New York, NY, USA, 2006, pp. 31–38.
63 Lingyu Wang, Tania Islam, Tao Long, Anoop Singhal, and Sushil Jajodia. “An attack graph-based probabilistic security metric,” in 22nd Annual IFIP WG 11.3 Working Conference on Data and Applications Security, London, UK, 13-16 July 2008
-and-
Lingyu Wang, Anoop Singhal, and Sushil Jajodia. “Measuring the overall security of network configurations using attack graphs,” in Data and Applications Security XXI (Berlin/Heidelberg, Germany: Springer Verlag, 2007), pp. 98–11.
64 NIST. “The Information Security Automation Program and The Security Content Automation Protocol.” Accessed 26 March 2009 at: http://nvd.nist.gov/scap.cfm
65 Ibid.
66 The MITRE Corporation. “Common Vulnerabilities and Exposures (CVE).” Accessed 26 March 2009 at: http://cve.mitre.org
67 The MITRE Corporation. “Common Configuration Enumeration (CCE).” Accessed 26 March 2009 at: http://cce.mitre.org
68 The MITRE Corporation. “Common Platform Enumeration (CPE).” Accessed 26 March 2009 at: http://cpe.mitre.org
69 NIST. “NVD Common Vulnerability Scoring System Support v2.” Accessed 26 March 2009 at: http://nvd.nist.gov/cvss.cfm
70 NIST. “XCCDF - The Extensible Configuration Checklist Description Format.” Accessed 26 March 2009 at: http://nvd.nist.gov/xccdf.cfm
71 The MITRE Corporation. “OVAL Open Vulnerability and Assessment Language.” Accessed 26 March 2009 at: http://oval.mitre.org
72 NIST. “CND Data Strategy and Security Configuration Management.” September 2008. Accessed 26 March 2009 at: http://nvd.nist.gov/scap/docs/2008-conf-presentations/day1/CM-and-Data-Strategy-Brief-NIST-2008-SCAP-Conf-Final-Slides.pdf
73 Cyber Security Industry Alliance. “FISMA: Get the Facts.” Accessed 3 February 2009 at: http://www.csialliance.org/issues/fisma/index.html
74 OMB. “Fiscal Year 2007 Report to Congress on Implementation of the Federal Information Security Management Act of 2002.” Accessed 3 February 2009 at: http://www.whitehouse.gov/omb/inforeg/reports/2007_fisma_report.pdf
75 Ibid.
76 Ibid.

Measuring Cyber Security and Information Assurance State-of-the-Art Report (SOAR) 65
Section 5 Government Initiatives and Programs
77 Deb Radcliff. “Government Vertical: Is FISMA Working?,” in SC Magazine, 1 November 2007. Accessed 3 February 2009 at: http://www.scmagazineus.com/Government-vertical-Is-FISMA-working/article/58396
78 Described in: Adam R. Bryant, Capt. USAF. Developing a Framework for Evaluating Organizational Information Assurance Metrics Programs. Master of Science Thesis for Air Force Institute of Technology. AFIT/GIR/ENV/07-M5, March 2007. Accessed 11 December 2008 at: https://www.afresearch.org/skins/rims/q_mod_be0e99f3-fc56-4ccb-8dfe-670c0822a153/q_act_downloadpaper/q_obj_217f0dc1-baf2-47c8-a458-60956d23bc05/display.aspx?rs=enginespage
-and-
Corporate Information Security Working Group. “Report of the Best Practices and Metrics Team,” 17 November 2004 (Revised 10 January 2005). Accessed 3 February 2009 at: http://infotech.aicpa.org/NR/rdonlyres/9C87179C-7F68-4EA0-8FA6-1B8A2EF2768A/0/CISWG_Report_of_best_practices_and_metrics_teams.pdf (also at: http://educause.edu/ir/library/pdf/CSD3661.pdf)
79 Bryant, Developing a Framework for Evaluating Organizational Information Assurance Metrics Programs, op cit.
80 Ibid.
81 Dr. David B. Nelson, CISSP Deputy CIO, NASA. “Performance Measures for Information Security: NASA Case Study,” April 22, 2002, in SecurIT, Spring 2002.
82 US Department of Justice, Bureau of Justice Statistics. “National Computer Security Survey.” Accessed 10 March 2009 at: http://www.ojp.usdoj.gov/bjs/survey/ncss/ncss.htm
83 RAND Corporation. “DOJ/DHS National Computer Security Survey.” Accessed 10 March 2009 at: http://www.ncss.rand.org/index.html

“As they become aware of the increasing security threats and the implications of these threats to their organizations, executives are asking for security metrics that talk about business impact….CISOs today have no choice but to arm themselves with the right security metrics to address the concerns of their executive management.”
Khalid Kark and Paul Stamp, Forrester Research [84]
6Industry Initiatives

Measuring Cyber Security and Information Assurance State-of-the-Art Report (SOAR) 67
Section 6 Industry Initiatives
This section provides an overview of CS/IA measurement initiatives and programs within industry. This section covers efforts underway
for creating, implementing, and deploying CS/IA measures from a range of entities within industry. Efforts are underway from security industry consortia, including the CISWG, OWASP, and CIS as well as ISACA, which is not a security-focused organization. Other initiatives are described from Microsoft, @stake, and EDUCAUSE/Internet2. This section also describes the activities put forth by CS/IA measurement-focused organizations: securitymetrics.org and the Security Metrics Consortium.
Like many of the initiatives discussed in Section 5, the goal of these industry initiatives is to improve security measurement programs throughout industry and government. To this end, much of the work described in this section is publicly accessible. (See Appendix B for more information.)
6.1 CISWG MetricsCISWG was established in 2004 by Representative Adam Putnam (R-FL), under the auspices of the Government Reform Committee’s Subcommittee on Technology, Information Policy, Intergovernmental Relations, and the Census. CISWG included four subgroups, one of which was devoted to promoting Best Practices and Guiding Principles. Within this subgroup, a Metrics Team was established.
On 17 November 2004, the CISWG Metrics Team, along with the Best Practices Team, issued a report [85] for use by executives, managers, and technical staff in large and small organizations, as the basis for defining their own comprehensive sets of performance metrics for measuring the people, process, and technology aspects of information security.
The CISWG Metrics Team’s report specifically described a set of Information Security Program Elements and Supporting Metrics. The Security Program elements include—

Measuring Cyber Security and Information Assurance State-of-the-Art Report (SOAR)68
Section 6 Industry Initiatives
f Governance (Board of Directors/Trustees)—With seven activities that those responsible for this element should perform;
f Management—With 10 activities that those responsible for this element should perform;
f Technical—With 13 sub-elements that those responsible for this element need to address.
For each activity associated with the Governance and Management elements, and each sub-element of the Technical element, the report defines a set of metrics to be used in determining how well those responsible have performed with regard to those activities/sub-elements.
For example, within the Governance element, one activity is “Oversee Risk Management and Compliance Programs Pertaining to Information Security (e.g., Sarbanes-Oxley, HIPAA, Gramm-Leach-Bliley, etc.).” Three metrics are defined for this activity, one of which is “Percentage of key external requirements for which the organization has been deemed by objective audit or other means to be in compliance.”
In the Management element, the activity “Identify and Classify Information Assets” has three metrics, one of which is “Percentage of information assets with defined access privileges that have been assigned based on role and in accordance with policy.”
In the Technical element, the sub-element “Malicious Code Protection” has three metrics, including “Percentage of mobile devices with automatic protection in accordance with policy.”
6.2 OWASP EffortsOWASP [86] defines itself as “an open source community” of software and application security practitioners dedicated to helping organizations in the private and public sectors develop, purchase, and maintain trustworthy application software. OWASP produces tools and documents, and sponsors forums, chapters, and development projects. Its products are available under open source licenses to any interested party.
OWASP projects are organized as collections of related tasks with a single defined roadmap and team leader. The team leader is responsible for defining the vision, roadmap, and tasking for the project. OWASP projects have produced artifacts ranging from guidance documents, to tools, teaching environments, checklists, and other materials. [87]
6.2.1 OWASP Top TenOne of the most well-known OWASP projects is the OWASP Top Ten. Released in 2004 and updated in 2007, the OWASP Top Ten project identifies the most critical application security flaws at the time of release. Since its original release in 2004, the OWASP Top Ten has become a security “floor” against which many organizations are assessing their applications.

Measuring Cyber Security and Information Assurance State-of-the-Art Report (SOAR) 69
Section 6 Industry Initiatives
Many application security analysis tools (e.g., Web application vulnerability scanners or source code analysis scanners) provide OWASP Top Ten compliance reports out-of-the-box. To this end, Gunnar Peterson and other security researchers have identified security metrics for each of the OWASP Top Ten vulnerabilities so that organizations can better gauge their security postures. A paper edited by John Steven and Peterson [88] defines a design-time, deployment-time and run-time metric that organizations may use to rate their systems against the OWASP Top Ten over a period of time. (See Section 6.14 of this report for a discussion of these metrics.)
6.2.2 Application Security Metrics ProjectIn August 2006, OWASP launched the Application Security Metrics project. [89] This project was intended to shed light on the state of the art in application security metrics. During the first phase, project participants developed an application security metrics survey to be distributed to various organizations. The survey solicited information about the organization’s existing Web application security metrics programs. Specifically, project members were interested in the following information—
f Security standards or regulations used to shape the metrics program; f The use of trending metrics, ROI, and process metrics within
each organization; f Information on discarded metrics; f Tools used to generate the data for the metrics; f Tools used to store and track metrics; f Detailed information about each metric, including how it is created
and disseminated.
The Application Security Metrics Project has been on hiatus since April 2007, due primarily to a lack of survey participants. In the second phase of the project, members intended to take the information from the surveys to identify gaps in current metric reporting and begin research into new metrics that would be beneficial to participating organizations.
For Further Reading
Blake Causey. “Why Application Security Metrics are broken.” 22 December 2008 on the “Hancock”/Attack Vectors blog. Accessed 2 February 2009 at: http://attackvectors.com/~/blog/index.php?m=12&y=08&entry=entry081222-141210
6.2.3 ASVSStarted in April 2008 as an OWASP Summer of Code project, the Application Security Verification Standard (ASVS) aims to provide a comprehensive assessment framework for Web applications. The ASVS was developed by

Measuring Cyber Security and Information Assurance State-of-the-Art Report (SOAR)70
Section 6 Industry Initiatives
OWASP as an evaluation framework that incorporates lessons learned from performing product evaluations using the Trusted Computer System Evaluation Criteria (TCSEC), Common Criteria framework, and FIPS 140 framework.
The need for the ASVS arose from the fact that the Common Criteria and FIPS 140 evaluation methodologies are targeted for Web applications. FIPS 140 evaluation can only be performed on the cryptographic modules used by a Web application. In contrast, the Common Criteria provides a very generic framework, through which Web applications can be evaluated, but the level of rigor and coverage, the portions of the application that are physically verified, will very for each Web application, as the Common Criteria STs and PPs may vary with each evaluation.
The ASVS identifies four “levels” against which a Web application can be evaluated. Each level signifies the amount of coverage and rigor that goes into the evaluation, based on documentation and verification procedures outlined in the standard. ASVS defines sets of documentation and verification requirements of three different types—
f Level requirements—Define the high-level Web application implementation and verification requirements;
f Derived verification requirements—Identify specific items within the Web application implementation to verify;
f Derived reporting requirements—Describe how the verification should be documented.
The ASVS levels are themselves composed of multiple component levels. Web applications can be evaluated against a specific component level, but cannot receive the level rating until all component levels have been evaluated (similar to FIPS 140 and Common Criteria evaluation levels).
Each ASVS component level describes a single verification procedure that must be performed. For example, Level 2B requires a manual code review while Level 1A requires a Web application vulnerability scan. As the level increases, the effort associated with the review also increases. For example, Level 4 requires verification that the internal security controls behave correctly. The specific verification requirements for an application are defined and broken down by level. This ensures a minimum set of tests have been performed for each level.
As with FIPS 140 verification, the thoroughness of the ASVS ensures that Web applications evaluated at a specific ASVS level provide an objective measurement of the specific verifications requirements and testing techniques that have been performed on a specific Web application. Measures based on ASVS can illustrate what specific testing techniques have been applied to an ASVS-evaluated Web application as well as what specific verification requirements have been met by the application.

Measuring Cyber Security and Information Assurance State-of-the-Art Report (SOAR) 71
Section 6 Industry Initiatives
6.3 CIS Security Metrics InitiativeSponsored by CIS, the Security Metrics Initiative [90] was undertaken by a
“consensus team” of CIS members, including representatives from Fortune 50 and smaller commercial and non-profit organizations (with special focus on the banking and finance sector); federal, state, and local governments; security and other vendors; industry experts; universities; independent researchers, mathematicians, statisticians, actuaries, CISOs, and security managers; and other institutions and individuals that specialize in information security.
The goals of the Security Metrics Initiative are to reach consensus on an initial small set of (10 or fewer) unambiguous security metrics, and to facilitate their widespread adoption among CIS members. In addition, the initiative seeks to establish an operational benchmarking service to facilitate—
f Communication of internal security status over time, f Inter-enterprise benchmarking of security status, f Development of a database from which security practice/outcome
correlations can be derived.
The initiative intended, by the end of 2008, to reach consensus on final definitions of those metrics (to populate the security metrics schema also developed by the initiative), and to develop the benchmarking technology platform that would enable CIS to launch its Security Metrics and Benchmarking Service, with CIS members contributing data and producing benchmark reports. [91]
In Spring 2009, CIS published The CIS Security Metrics [92] that provided 21 definitions of security control metrics for six business functions. The metrics presented in this document were developed through a consensus-building process working with industry stakeholders. The business functions and the associated metrics are listed in Table 6-1.
Table 6-1 CIS Consensus Security Metrics
Business Function Consensus Metrics
Incident management f Meantime to incident discovery f Number of incidents f Percentage of incidents detected by internal controls f Meantime between security incidents f Meantime from discovery to containment f Meantime to recover
Vulnerability management f Vulnerability scanning coverage f Percentage of systems with no known severe vulnerabilities f Number of known vulnerabilities
Patch management f Patch policy compliance f Patch management coverage f Meantime to patch f Meantime to deploy critical patches

Measuring Cyber Security and Information Assurance State-of-the-Art Report (SOAR)72
Section 6 Industry Initiatives
Business Function Consensus Metrics
Application security f Number of applications f Percentage of applications that are critical f Risk assessment coverage f Security testing coverage
Configuration management f Meantime to complete changes f Percentage of changes with security reviews f Percentage of changes with security exceptions
Finance f IT security spending as percentage of IT budget f IT security budget allocation
The metrics and their definitions were arrived at by the consensus of a group of subject matter experts in the business function areas, a group that included consultants, software developers, audit and compliance professionals, security researchers, operational security experts, and government and legal sector representatives. This consensus group’s objective was to identify a set of standard metrics that could be used in a wide range of organizations for measurement of effectiveness and value of common security functions and concepts, such as data availability, security management, and security performance.
In addition to the metrics themselves, the consensus group identified a full set of data attributes about security incidents that need to be collected to provide the raw data for determining the values for many of the consensus metrics.
According to CIS, additional consensus metrics are still being defined for these and other business functions. These functions include—
f Anti-malware controls, f Authentication and authorization, f Data and network security, f Software development life cycle, f Remediation efforts, f Third-party risk management.
6.4 ISACAISACA [93] is an international industry association that counts more then 85,000 members worldwide. Its members work in many IT positions, including consultants, educators, security professionals, regulators, CIOs, and internal auditors. [94]
Over the last several years, ISACA has published several articles dedicated to the subject of security metrics and return on security investment (ROSI) as well as broader documents, substantial portions of which are dedicated to security measurement. One such document is Information Security Governance: Guidance for Boards and Executive Management. [95] ISACA has an ongoing Information Security Program Metrics project that intends to expand on the information in this document, and to provide a

Measuring Cyber Security and Information Assurance State-of-the-Art Report (SOAR) 73
Section 6 Industry Initiatives
guide for information security managers on how to develop business- and performance-focused security program measures and reports. The results of these projects will be available in the second quarter of 2009.
Section 6 of ISACA’s Information Security Governance document provides a useful overview of issues and challenges associated with establishing an information security metrics and monitoring capability to support information security governance. The section indicates that measurement is essential for effective governance, and addresses a number of challenges associated with measuring information security, including the fact that traditional measures, such as annualized loss expectancy (ALE), downtime due to security incidents, and numbers of patched servers, have limited utility in providing an overall indicator of how secure the enterprise is.
It goes further to state that an absence of an adverse event is not a useful indicator of whether an organization is secure, and that using
“simulated” exercises, such as penetration testing, also has limited use. The section concludes that—
f Some organizations are attacked more frequently and/or suffer greater losses than others.
f There is a strong correlation between good information security management and practices, and relatively fewer incidents and losses.
The rest of the section of ISACA’s Information Security Governance document discusses the fact that, while measuring governance is equally challenging to measuring security, it is nevertheless essential for organizations to attempt to measure security governance to gauge their progress in governing the security program with the ultimate purpose of reducing the security risk to the enterprise. The document states that, while there is no universal method for measuring information security governance, each organization needs to establish its own method and scale based on its business objectives. It proposes several ways to look at measuring information security governance, including some indicators in the following areas1 [96]—
f Governance implementation to gauge implementation of governance framework (The report suggests that while information security is too far removed from governance, Key Goal Indicators [KGIs] and Key Performance Indicators [KPIs] can be used to provide information about the achievement of processes and goals.);
f Strategic alignment of information security activities with business or organizational goals and objectives;
f Risk management and its success at performing against defined objectives;
f Value delivery to evaluate whether acceptable risk posture is achieved at a the lowest possible cost;
f Resource management that assesses whether the organization has effectively allocated its information security resources;

Measuring Cyber Security and Information Assurance State-of-the-Art Report (SOAR)74
Section 6 Industry Initiatives
f Performance management that monitors whether the organizational objectives are achieved;
f Assurance process integration that gauges the level of integration of a variety of assurance processes that have traditionally been operating in silos.
These themes are further developed in another article posted by ISACA, “Developing Metrics for Effective Information Security Governance,” by John P. Pironti. [97] Several key principles are articulated in this article, including—
f Use of KPIs, f Clearly defining individual measures, f Tailoring measures to the audience, f Keeping the measures simple and consistent, f Aligning the measures with the business goals.
Pironti states that creating a baseline framework for information security measurement is key to success, and proposes use of a business value-based metric that measure security governance in people, process, procedures, technology, and compliance areas.
He further proposes to break down the information security measurement framework by organizational and performance metrics, operational metrics, technological metrics, business process metrics, business value metrics, and compliance metrics, with examples within each vertical. The examples occasionally overlap, demonstrating that a single measure may be useful across multiple dimensions.
Pironti also mentions that meaningful reporting, tailored to different audiences, is key to making the measures useful. He recommends a tiered reporting model, where the top tier would be of more interest to the executives, the middle tier to business process owners and managers, and the lowest tier to the operational stakeholders, such as system administrators.
Pironti also indicates that benchmark reporting in a variety of graphs and charts might be useful for those occasions when stakeholders want to see their organization’s performance against available industry information. The author concludes with a call for flexible and adaptable information security governance measures that will be an asset to an organization by providing meaningful reporting for management.
Another article on security measurement available from the ISACA Web site is “How Can Security Be Measured?” [98] by David A. Chapin and Steven Akridge. This article’s authors propose a security program maturity model to provide a venue for measuring progress in achieving security program maturity. Chapin and Akridge point out the fact that traditional security metrics have limited utility, as they do not address the overall improvement

Measuring Cyber Security and Information Assurance State-of-the-Art Report (SOAR) 75
Section 6 Industry Initiatives
in security, but rather focus on individual aspects of security, such as number and cost of incidents, time, and materials assigned to security, and compliance with policy.
Chapin and Akridge’s proposed maturity model is based on ISO/IEC 17799, Information technology – Code of practice for information security (which has been renumbered to ISO/IEC 27002, Information technology – Security techniques – Code of practice for information security management). Chapin and Akridge’s security program maturity model has two dimensions—
f The first one, which lays out the activities that the security program would undertake in a natural progression;
f The second one, which assesses the maturity of each activity.
The structure of this model is similar to that of traditional CMMs, but the content focuses on specific steps that are required to establish an information security program, based on ISO/IEC 17799 information security controls. The authors demonstrate examples of a variety of visual representations of the measurement, including bar charts, pie charts, and a score card that combines the graphics with verbal representation and interpretation of the results.
6.5 Securitymetrics.orgSecuritymetrics.org [99] is a community Web site set up by Andrew Jaquith in 2004. The goal of securitymetrics.org is to foster a community of security metrics professionals. In the words of its founder—
“This Web site offers a rational, empirical alternative for decision-makers and security practitioners. Through the efforts of its members, securitymetrics.org intends to put the sword to the failed legacy of squeamish, squishy, non-metrics-based security decision-making. With luck and a bit of hard work, fear will yield to facts, and statistics will supplant scare tactics.” [100]
Securitymetrics.org offers a number of services to its members, including— f An exclusive mailing list, through which security metrics
practitioners can share knowledge and collaborate; f MetriCon and Mini-MetriCon, conventions co-located at the USENIX
and RSA conferences; f Posts pointing users to articles and other information published
by members; f An additional source for members to publish original research.
Several projects fostered by securitymetrics.org have grown to be important aspects of the security metrics community. The most notable example is the MetriCon conference, launched in 2006, which has provided a

Measuring Cyber Security and Information Assurance State-of-the-Art Report (SOAR)76
Section 6 Industry Initiatives
venue for security metrics practitioners to gather, share knowledge, and collaborate. (It is important to note that MetriCon is not the only security metrics convention available to practitioners.)
Another project currently under development at securitymetrics.org is the Metrics Catalog Project, [101] a repository for organizing and sharing metrics definitions. These resources include a database of information to completely define specific metrics, editors for submitting metrics, metric versioning, metric ratings, metric rankings, and metric licensing. The goal of the Metrics Catalog Project is to provide a central location where organizations and researchers can locate, define, and choose metrics for use within their own organizations. In its current form, the Metrics Catalog provides information about the following metrics—
f PCI Data Security Standard (DSS)-1.1, f NIST metrics, f NIST 800-53 security controls, f ISO/IEC 27002, f CISWG.
While the current list is limited, the Metrics Catalog has the potential to be an important resource for information about various metrics available to organizations.
6.6 Security Knowledge and Awareness Measures
“While measuring the impact of information security education and training, one is actually trying to measure the resulting change in human behaviour and its impact on the organisation’s ability to reach its goal. One problem with such measurements is the discrepancy between what people say and what they do. There is a possibility that some employees won’t state the truth about their own attitudes or level of awareness. Therefore, the focus should not be on what an employee knows but on what he or she does with this knowledge.” [102]
Several efforts have been made to measure the level of security-awareness within organizations (or by the individuals that constitute them), and to determine whether such awareness results in improved security (expressed in terms of improvements in user behavior, resulting in fewer user-instigated security breaches). Appendix B of NIST SP 800-50 [103] includes a sample awareness and training metric that focuses specifically on measuring direct aspects of security training/awareness programs, such as number of employees trained, and percentage of those trained who have security-related responsibilities or roles.

Measuring Cyber Security and Information Assurance State-of-the-Art Report (SOAR) 77
Section 6 Industry Initiatives
Other efforts to define security awareness measures focus on measuring actual awareness and knowledge vs. effectiveness of awareness/training programs, usually by measuring the direct or indirect evidence of changed user behavior, such as fewer user-originated security policy violations, or fewer malicious code incidents (implying a decrease in risky user behaviors that lead to malicious code entering the IT infrastructure). For example, the United Kingdom (UK) Chapter of the Information Systems Security Association (ISSA) has published a short list of metrics [104] indicating increased employee security knowledge as well as changed employee behaviors as a result of security awareness. These metrics are—
f Percentage of employees that passes information security tests, certification exams, etc.;
f Percentage of employees that signs security awareness statements, memoranda of understanding, etc.;
f Number of disciplinary actions for security violations; f Number of employee-originated security incidents; f Number of serious employee-originated security incidents.
In his Master of Science thesis, Measuring Information Security Awareness, [105] Johnny Mathisen suggests a set of nine metrics that are intended to provide inspiration for others to define similar metrics for assessing security awareness. (The thesis also describes the methodology used to come up with these metrics.) These metrics also focus on measuring direct and indirect evidence of changes in the behavior of those who receive security awareness training—
f Percentage of employees that have finished the necessary security training;
f Number of reported security incidents; f Percentage of employees leaving their desks clean at the end
of the day; f Percentage of waste paper that is shredded; f Percentage of illicit traffic on the internal computer network; f Percentage of weak user passwords; f Number of hits on Web pages about security; f Number of requests for information or assistance received by
the security department; f Customer satisfaction.
In Appendix I of his thesis, Mathisen provides complete explanatory details on each of these metrics, including how the metric demonstrates employee security awareness.

Measuring Cyber Security and Information Assurance State-of-the-Art Report (SOAR)78
Section 6 Industry Initiatives
According to Mathisen, the Internet Security Forum (ISF) also defined metrics for awareness based on suggestions from its members. These metrics were described in the ISF “Effective Security Awareness: Workshop Report,” published in April 2002. The report is, however, only available to ISF members.
Most commercial firms in the business of security awareness program consulting and/or awareness training have developed their own sets of awareness metrics. (These examples represent only a sampling of such metrics, and are no way intended to provide an exhaustive listing.)
Gary Hinson of IsecT, Ltd. has identified 10 potential information security awareness metrics, [106] which are described in Table 6-2.
Table 6-2 IsecT Information Security Awareness Metric
Metrics Examples of Statistics to be Collected What Metric Indicates
IT change f Relative proportions of emergency-high-medium-low risk changes
f Numbers/trends of rolled-back/reversed/rejected changes vs. successful changes
Increased awareness results in fewer overall changes, fewer emergency and high risk changes, and fewer changes that need to be undone or rejected.
Security-related IT process maturity
f “Half life” for applying patches Increased awareness leads to more timely patching.
Malware f Number of viruses, worms, Trojans, spams, etc., detected and stopped
f Number of malware incidents overall
Increased awareness leads to greater vigilance and faster, more effective response to malware incidents, and reduction of risky behaviors that introduce malware into the environment.
Computer audit f Closed-open-new-overdue f High-medium-low risk
Increased awareness reduces the number of pending audit issues, and the number of high-risk issues.
Control self-assessment and other risk management
f [Not provided by source] Increased awareness will lead to better assessment results and lower quantified risk.
IT Help Desk f Calls relating to information security (e.g., password retrieval/change requests, queries about risks and controls) as a proportion of all calls
Increased awareness will reduce the proportion of Help Desk calls on security topics/issues.
IT incident f Number and seriousness of breaches f Costs to analyze, contain, and recover from breaches
f Tangible losses incurred
Increased awareness will help reduce number and seriousness of breaches, and associated costs impacts.
Firewall f Proportion of outbound packets/sessions blocked (e.g., attempts to access blacklisted Web sites)
f Number of potential trivial/moderate/critical hacking attacks repelled
Increased awareness will reduce the number of internally originated firewall policy breaches, and enable the tuning of firewall policy to increase the number of externally-originated breaches.

Measuring Cyber Security and Information Assurance State-of-the-Art Report (SOAR) 79
Section 6 Industry Initiatives
Metrics Examples of Statistics to be Collected What Metric Indicates
System/network vulnerability
f Number of known open, closed, or novel vulnerabilities
f Average time to patch
Increased awareness will enable more secure configuration and more timely patching of systems/networks.
Response to security awareness activities
f Number of emails/calls pertaining to individual awareness initiatives
This metric provides a direct measure of the interest generated by awareness initiatives. It may also indicate effectiveness of outcomes.
Additional security awareness metrics are reported by K. Rudolph of Native Intelligence, Inc., a security awareness and training firm, [107] including metrics suggested by Chad Robinson of the Robert Frances Group—
f Number of attempts to access unauthorized Web site content, f Number of invalid login attempts, f Number of incidents of storage of unauthorized file content
(e.g., audio, video), f Number of unauthorized attempts to access controlled
resources (e.g., VPN), f Number of incidents of disclosure of sensitive information, f Number of incidents of data or intellectual property theft, f Number of incidents of unauthorized use of administrator privileges.
The implication for all of these metrics is that increased security awareness will lead to a decrease in the number of such incidents/breaches.
Rudolph also cites awareness metrics from the Gartner Group’s “Metrics for Information Security Awareness,” which fall into the categories of Process Improvement, Attack Resistance, Efficiency/Effectiveness, and Internal
“Crunchiness” (i.e., hardness). These metrics are summarized in Table 6-3.
Table 6-3 Gartner Group Metrics for Information Security Awarenes
Category of Metrics Examples of Metrics in Category
Process Improvement Metrics f Percentage of staff that knows that the security policy exists f Percentage of staff that has seen or read the security policy f Percentage of individuals tested on the policy (passing and failing) f Are internal and external security audits showing improvement?
Attack Resistance Metrics f Percentage of surveyed individuals recognizing a security event scenario
f Percentage of surveyed or tested individuals susceptible to social engineering
f Percentage of users tested that revealed their passwords f Percentage of administrators tested that failed an improper password change attempt
f Percentage of users activating a test virus
Efficiency/Effectiveness Metrics f Percentage of security incidents having human behavior as a major factor

Measuring Cyber Security and Information Assurance State-of-the-Art Report (SOAR)80
Section 6 Industry Initiatives
Category of Metrics Examples of Metrics in Category
Internal “Crunchiness” Metrics f Percentage of corporate software, partners, and suppliers reviewed for security
f Percentage of critical data that is strongly protected f Percentage of critical data not protected according to security standards
f Percentage of systems having malware and/or unapproved software installed
Native Intelligence also offers its own four-page listing of potential security awareness program metrics [108] in two categories—
f Internal User Behaviors: Ranked as “Good,” “Bad,” and/or “Ugly;” f End User Knowledge and Perceptions of IT Security.
Native Intelligence also provides suggestions on how and from what source(s) to collect data for each metric.
6.7 PSM Security MeasurementThe PSM is a US Army-sponsored measurement process for use in software and system acquisition and development projects. The PSM defines a process that includes four activities—
f Measurement planning; f Measurement performance; f Ongoing evaluation and enhancement of measures and
measurement process; f Establishment and sustainment of management commitment.
The PSM measurement approach was adopted by the CMMI community, and formed the basis for the ISO/IEC15939 Software Engineering Software Measurement Process.
In 2006, the PSM Safety and Security Technical Working Group published a Security Measurement Whitepaper [109] that described research on existing security measurement methodologies and the attempt to measure security properties of software-intensive systems. The objective of the white paper, which proposes a PSM-based “system-theoretic” model for security measurement, is to integrate security measurement principles into the general measurement principles of PSM, consistent with its related standard: ISO/IEC 15939:2002.

Measuring Cyber Security and Information Assurance State-of-the-Art Report (SOAR) 81
Section 6 Industry Initiatives
For Further Reading
Fred Hall. “Measurement of Security Processes.” Presentations from workshop presented at PSM Technical Working Group Meeting, Herndon, Virginia, March 2006. Accessed 2 February 2009 at: http://www.psmsc.com/Downloads/TWGMarch06/3%20-%20Measurement%20of%20Security%20Processes.Hall.zip
Cheryl Jones, USA. “Making Measurement Work,” in CrossTalk: The Journal of Defense Software Engineering, January 2003. Accessed 2 February 2009 at: http://www.stsc.hill.af.mil/Crosstalk/2003/01/jones.html
Cheryl Jones, CIV USA AMC, and John Murdoch, University of York. “Security Measurement: Applying PSM Principles.” Presented at Practical Software and Systems Measurement Users’ Group Conference, 14-18 July 2008, Mystic, CT. Accessed 3 February 2009 at: http://www.psmsc.com/UG2008/Presentations/14%20-%20Murdoch-Security%20Measurement-17Jul08.pdf
6.8 Microsoft Security MeasuresAs part of its Trustworthy Computing initiative, Microsoft published its Security Development Lifecycle Threat Modeling methodology, in the context of which were defined two levels of security measures: the DREAD vulnerability rating system, and the RASQ. (Note that the Microsoft Security Bulletin Severity Rating System is not discussed here because it is covered in Section 7.4.6.)
6.8.1 DREADThe DREAD model is used, and promoted, by Microsoft as a means to prioritize risks associated with exploitable vulnerabilities, and to do so with a greater granularity than is possible with a simple numerical or red-yellow-green type rating system. “DREAD” is an acronym made up of the first letters of five attributes that threat modeling uses to “measure” each vulnerability in the system being assessed—
f Damage potential—How much damage will result if the vulnerability is exploited?
f Reproducibility—How easy would it be reproduce the exploit? f Exploitability—How easy is it to exploit the vulnerability? f Affected users—How many users (rough percentage) would be
affected by the exploit if it were successful? f Discoverability—How easy is it to find the vulnerability?
Microsoft suggests using a simple priority rating scale to enable a consistent “sense” of priorities across all the exploits (“threats”) to be assessed. For example, it uses a rating scale as simple as “High = 3, Medium = 2, Low = 1” for individual DREAD attributes, plus the assignment of “High,” “Medium,” and
“Low” to the aggregation of the DREAD ratings for each exploit, as illustrated in the example in Table 6-4.

Measuring Cyber Security and Information Assurance State-of-the-Art Report (SOAR)82
Section 6 Industry Initiatives
Table 6-4 Example of DREAD Rating of Two Attacks
Threat D R E A D Total Rating
Man-in-the-middle capture of authentication credentials sent in an unencrypted HTTP session
3 2 3 2 2 12 High
SQL injection attack against Web portal front-end to legacy database
2 3 3 3 1 12 High
To be meaningful as a measure, the DREAD rating for a given exploit should be calculated for both the unmitigated and mitigated vulnerability. For example, the rating for the first exploit in Table 6-4 would be repeated with the variation that secure socket layer was used to encrypt the HTTP session over which the credentials were transmitted, thus eliminating the vulnerability.
In this way, DREAD ratings can be used not just to prioritize vulnerabilities but to help assess the anticipated effectiveness of countermeasures to those vulnerabilities.
6.8.2 RASQThe RASQ is a measure for determining whether one version of a system is more secure than another with respect to a fixed set of dimensions. Rather than count flaws at the code level or vulnerability reports at the system level, Microsoft has defined a measure for quantifying the “attack opportunities” presented by a system. The RASQ model computes the attack opportunities of a system by identifying and describing all of its potential exploit points, then assigning each of them a relative vulnerability level, based on exploits that have been observed in the real world.
RASQ provides a means to demonstrate what seems to be logically intuitive, i.e., that the number of attack opportunities will increase with the increased exposure of the system’s “attack surface,” [110] with increased exposure increasing the likelihood that the system will become a target of attack. The RASQ thus provides a mechanism for measuring attack surface (and its exposure), and also for gauging whether and by how much attack surface/exposure is reduced by applied countermeasures.
In March 2003, Microsoft hired Ernst & Young to validate its RASQ model for each of the company’s Window server platforms. Ernst & Young’s assessment included a review of the RASQ model, plus tests of the model against specific configurations of the different Windows server operating systems, to obtain their RASQ rankings.
Microsoft has also collaborated with researchers at CMU to improve the RASQ model. The progress of this collaboration inspired CMU to go even further in efforts to extend and refine attack surface measurement, using the RASQ as a starting point, in hopes of defining a methodology and measures superior to the RASQ. This research is summarized in Table E-1 of this SOAR.

Measuring Cyber Security and Information Assurance State-of-the-Art Report (SOAR) 83
Section 6 Industry Initiatives
For Further Reading
Michael Howard, Microsoft Corporation, and Jon Pincus and Jeannette M. Wing, Carnegie Mellon University. “Measuring Relative Attack Surfaces,” in Proceedings of Workshop on Advanced Developments in Software and Systems Security, Taipei, December 2003. Accessed 29 January 2009 at: http://www.cs.cmu.edu/~wing/publications/Howard-Wing03.pdf
6.9 ISECOM RAVsThe Institute for Security and Open Methodologies (ISECOM) is best known for publishing the Open Source Security Testing Methodology Manual (OSSTMM). [111] The OSSTMM refers to security measures as Risk Assessment Values (RAVs). A RAV calculates “base numbers” (which are percentages of risk) to influencing factors in three categories—
1. Operational Security (OpSec)—In essence, security design, including such factors as system visibility, access, and trust relationships;
2. Actual Security (ActSec)—Characterizes the current security situation, comprising vulnerabilities, weaknesses, exposures, anomalies, and other security concerns;
3. Loss Controls (LCs)—Security measures derived from best practices, such as authentication, non-repudiation, confidentiality, privacy, indemnification, integrity, safety, usability, continuity of operation, and alarms.
The OpSec base number represents the percentage of risk mitigation the OpSec requires. The ActSec base number represents the level of risk caused by the unmitigated ActSec. The LC base number represents the amount of risk mitigation provided by the LC.
The RAV represents a calculation of the system’s security level in relation to a level of “perfect security” (defined based on best practices), and also a
“degradation curve,” depicting the system’s ability to continue reacting securely and appropriately to unexpected events (anomalies and security incidents) over time (expressed as a percentage of full control [100%], with a sliding scale beneath, ranging from weak control down to deficient control and ultimately to non-existent control). [112]
The OSSTMM provides the set of equations necessary for performing these calculations, from calculating these base numbers from relevant data obtained from interviews, security tests, and vulnerability scans (specified in the OSSTMM); to assumptions based on system configurations; and security problems identified (and manually verified) by auditors.
According to the BNET Business Wire, “RAV is increasingly the most common security measure demanded by regulatory bodies.” [113]

Measuring Cyber Security and Information Assurance State-of-the-Art Report (SOAR)84
Section 6 Industry Initiatives
6.10 @Stake BARBusiness Adjusted Risk (BAR) [114] is an intentionally simple technique for classifying security defects (or vulnerabilities) by their associated risk of exploitation (rated from 1-5, depending on the business context in which the system exists) and potential business impact (also rated from 1-5), then assigning an overall score to each defect that represents the combination of these two factors.
A “risk of exploitation” score of 5 denotes a high-risk, well-known defect that an attacker can exploit through use of off-the-shelf tools or canned attack scripts. A score of 3 indicates a defect that can only be exploited by an attacker with intermediate-level skills and knowledge, such as the ability to write simple scripts. Finally, a score of 1 indicates a defect that only a professional-caliber expert malicious attacker can exploit.
A “business impact” score of 5 would be assigned to a defect which, if exploited, could result in significant financial damage, negative media exposure, and damage to the organization’s reputation. A business impact score of 3 would be assigned to a defect wherein a successful exploit could cause limited or quantifiable financial damage, and possible negative media exposure. Defects that would have no significant impact, financial or otherwise, would be assigned a score of 1.
The BAR is then calculated simply by multiplying the risk score together with the business impact score. The resulting BAR score is intended to be interpreted similarly to an ALE calculation, e.g., a BAR rating of 20 would be understood to denote an order of magnitude more risk than a rating of 2.
6.11 EDUCAUSE/Internet 2 Security Task Force Sub-Working Group on Security MetricsIn July 2000, EDUCAUSE and Internet2 formed the EDUCAUSE/Internet2 Computer and Network Security Task Force to improve information security and privacy across the higher education sector. Within the Security Task Force, a number of working groups and committees pursue projects and initiatives to develop and promote best practices and solutions for achieving security and privacy of IT assets and infrastructures in the higher education sector.
In mid-2007, the EDUCAUSE/Internet 2 Security Task Force established a Security Metrics Sub-Working Group within its Effective Practices and Solutions Working Group. The Security Metrics Sub-Working Group’s stated goal is to identify and promote practices, tools, and procedures that will lead to the development of metrics that can provide a comprehensive picture of a security environment. The resulting best practices will be compiled and shared with institutions of higher education, to help them develop their own security metrics and measurement practices.
The subgroup evaluated and ranked the importance of a number of metrics in the four categories indicated in Table 6-5.

Measuring Cyber Security and Information Assurance State-of-the-Art Report (SOAR) 85
Section 6 Industry Initiatives
Table 6-5 EDUCASE/Internet 2 Security Metrics
Metrics CategoryNumber of
Metrics in Category Intended Use of Metrics in Category
Operational Metrics 3+ Intended to be useful to technologists
Incident Metrics 3+ Enable academic institutions to communicate to each other data about incident detection and response, such as number of new incidents discovered or number of incidents responded to in a given timeframe
Compliance Metrics 3+ Demonstrate IT organizations’ compliance with security policy
Executive Metrics TBD Communicate security information to administrative leaders of educational institutions
The sub-working group also began work on a “cookbook” to specify what an academic institution needs to do to build and implement each metric as well as methods for diagnosing problems. The Security Metrics Sub-Working Group also plans to develop a benchmark process, in which institutions begin running metrics and share the results in a way that is independent of their specific systems and environments.
These resources will be made available to EDUCAUSE and Internet 2 members via a Web site that contains all of the tools for building and implementing the metric tools. The metrics themselves are being tested by a committee composed of EDUCAUSE member institutions.
6.12 JCIAC: Statistics for Computer-Related CrimeIn 2003 and 2004, the Joint Council on Information Age Crime (JCIAC) [115] undertook a study in which it used statistics collected from multiple computer crime surveys to depict the current state of computer-related crime, and to identify a set of desirable standard measures that could be used to
“ascertain the incidence and impact of computer-related crime in the United States.” These measures were intended to be applied to specific types of information systems and network security incidents and specific types of industries and organizations. The proposed measures included—
f Gross annual losses and average annual number of incidents; f Losses and number of incidents by category; f Losses and number of incidents by industry and size of organization; f Gross and categorical annual expenditures on computer
systems security; f Expenditures on computer systems security by category, industry,
and size of organization; f Increases or reductions in losses and incident counts over previous
year by category, industry, and size of organization; f Disposition of incidents (investigation, administrative action, civil or
criminal prosecution, recoveries, if any).

Measuring Cyber Security and Information Assurance State-of-the-Art Report (SOAR)86
Section 6 Industry Initiatives
The study report [116] also called for the development of a measurement process for collecting computer-related security incident and crime data that could be used to measure this type of crime.
6.13 DRM Effectiveness and Impact MeasuresIn 2006, the Center for Democracy and Technology (CDT) published a white paper [117] proposing four categories of measures that it encourages evaluators of Digital Rights Management (DRM) services and device capabilities to consider. These categories include—
f Transparency—Presence of a clear disclosure to users of the impact DRM may have on their uses of a work, and the functioning/interoperability of their digital devices;
f Effect on use—Clear statement of the specific parameters and limitations DRM enforces on the possible use of a work;
f Collateral impact—Any other potential impact DRM technology may have on the user;
f Purpose and consumer benefit—Evidence that DRM is being used innovatively, to facilitate new business models and satisfy previously unaddressed demands, provide new consumer choices, etc., rather than locking consumers into old business models, limiting their choices, etc.
The CDT white paper further described a robust set of specific measures within each category, and proposed a methodology for DRM evaluators to implement these metrics.
6.14 Web Application Security Metrics FrameworkIn 2007, Elizabeth Nichols and Gunnar Peterson described the Web Application Security Metrics Framework. [118] In their initial discussion of the framework, Nichols and Peterson define a set of metrics based on the OWASP Top Ten and the three phases of the software development life cycle: design, development, and runtime. The metrics at each phase of the life cycle will provide the following benefits—
f Design-time metrics—Can aid in identifying weaknesses early in the application life cycle, decreasing the cost to mitigate them.
f Deployment-time metrics—Quantify the change that occurs to the system over time to establish baselines for anomaly detection.
f Runtime metrics—Quantify the application’s behavior and identified vulnerabilities.
With this baseline, Nichols and Peterson identify design-time, deployment-time, and run-time metrics that can be associated with each of the OWASP Top Ten. Example metrics include—

Measuring Cyber Security and Information Assurance State-of-the-Art Report (SOAR) 87
Section 6 Industry Initiatives
f Unvalidated input—The authors identify the design-time metric V/T, where T equals the number of POSTs and GETs in the application, and V equals the number of those fields with input validation enabled.
f Cross-site scripting—The authors identify the run-time metric XsiteVulnCount, which is the number of cross-site scripting vulnerabilities found during penetration testing.
f Buffer overflow—The authors identify the deployment-time metric OverflowVulnCount, which is based on the patching latency of buffer overflows vulnerabilities for the components of the system.
Using these relatively simple metrics, organizations can easily calculate scorecards against which their Web applications can be measured. In addition, organizations can use these metrics to gauge the performance of their organization over time.
Nichols and Peterson acknowledge that the OWASP Top Ten—or the metrics identified in the examples—may not meet the needs of a particular organization. As such, they include a series of steps inspired by Six Sigma that organizations can use to generate their own metrics and scorecards—
1. Express each metric in terms of defects divided by opportunities.2. Map values to colors by comparing each value to thresholds.3. Aggregate all individual Web application scores into a single
summary score.
Using these steps as a starting point, organizations can develop their own scorecards using relatively easy to calculate metrics early on, with the goal of including more robust and well-understood metrics. According to the authors, a simple automated scorecard can be developed with two weeks.
6.15 SecMetThe establishment of the Security Metrics Consortium (SecMet) was announced at the RSA Conference in February 2004. Founded by a group of Chief Security Officers (CSO) and CISOs from major corporations, including Motorola, Macromedia, and McKesson Corporation, SecMet hoped to transform the “black-magic art” of security measurement “into more of a science” by analyzing existing risk models developed by NIST, CMU, and others to derive a set of quantifiable security measurements, to include security policy compliance measurements. SecMet’s hope was that the identified measurements could then be used to create a security “dashboard.”
SecMet began its work with the assistance of technology vendors, though the consortium leadership was clear that vendors were welcome only as advisers to the consortium, and not as active members (although Scott McClure of McAfee appears to have been a founding member, contrary to this policy).

Measuring Cyber Security and Information Assurance State-of-the-Art Report (SOAR)88
Section 6 Industry Initiatives
SecMet was a short-lived effort, however. As there has been no news of SecMet since the end of 2005, it is impossible to know why the consortium failed, and why the group never published or released any products.
6.16 Surveys of “Real World” CS/IA Measurement UsageThis section highlights two surveys taken of IT managers and executives, to determine to what extent and how CS/IA measures of various types are actually being used to drive decision-making about security in “the real world.”
6.16.1 Frost & Sullivan 2005 Survey of Private Sector IT Security Metrics UsageIn a recent survey conducted by Frost & Sullivan, [119] top IT decision makers at over 80 companies were polled for input on their interest in measuring security value, and their current practices for generating and communicating such measures. Several findings of the report were of particular interest—
f 75% of respondents indicated that IT security teams provide reports to business partners and other functional managers outside of IT.
f Of those respondents who replied that IT security reports are provided to partners and other functional business managers, nearly 90% indicated that those reports are provided at least monthly and, in some cases, weekly and even daily.
f Almost 90% of organizations that produce periodic reports use those reports to describe their current security posture. 46% have already begun using measures to articulate security value. Approximately 43% plan to do so in 2006.
f Nearly 60% of respondents answered that they use reports or measures to justify security spending—almost 80% believed demonstrating IT security effectiveness to non-IT functional managers helps IT to justify its actions and budgets.
f 50% of companies surveyed had begun to realize the importance of trending as a tool for measuring security. Over 66% of respondents had already implemented or were planning to implement (within the coming year) different forms of trending data.
Figure 6-1 quantifies the types of measures most often reported to non-IT managers, as indicated by the Frost & Sullivan survey findings.

Measuring Cyber Security and Information Assurance State-of-the-Art Report (SOAR) 89
Section 6 Industry Initiatives
Figure 6-1 Most Prevalent Measures Reported to Non-IT Managers [120]
6.16.2 Forrester Research 2007 and 2008 CISO SurveysSince 2006, Forrester Research has done significant research on security performance measures, with particular focus on best practices for security performance measurement, and case studies of CS/IA measures usage. Some examples of the firm’s research reports in this area include: “Case Study: Verizon Business Builds an Asset-Based Security Metrics Program,” “Best Practices: Security Metrics,” “How to Measure what Matters in Security,” “Are We Secure Yet? Defining Business-Centric Metrics for Information Security,” and “Trends 2006: Information Security Reporting.” [121]
In 2007, Forrester Research interviewed 19 CISOs about their current IT security practices. The survey [122] revealed that, in the area of security measurement, only five of the 19 respondents had a formal security measurement program in place, while 10 more respondents reported plans to develop such a program within six to 12 months.
The top challenges to establishing a good measurement program were perceived to be: (1) finding the right metrics (13 respondents) and (2) translating security metrics into “business language” (10 respondents). Forrester’s analysts made the following observations—
f The security metrics in use focused on operational and project status, and were still largely driven by compliance concerns.
f Many people still confuse security measurements with security metrics. f Many security metrics collected are not useful for their intended
purpose or audience.
Forrester followed up this survey on 22 July 2008 with its report entitled “Best Practices: Security Metrics,” [123] in which 20 CISOs were interviewed
more extensively about their firms’ security metrics programs, and the best
Number of incidents
100 20 30 40 50 60
Periodic measures of the risk posture of the enterprise
Business impact or cost of incidents
Departmental achievement of security related behaviors
Top 10 vulnerabilities list
Productivity of security personnel and technologies
Financial losses due to security incidents
Average duration of an incident
Other

Measuring Cyber Security and Information Assurance State-of-the-Art Report (SOAR)90
Section 6 Industry Initiatives
measurement practices and lessons learned that emerged from them. According to the report, “The three main themes that came out of this research are: Be very selective in picking your security metrics, think beyond the security organization, and focus on reporting and presentation.”
6.17 Commercial Providers of CS/IA Measurement ServicesThe need for CS/IA measurement has engendered an industry in services to assist IT organizations in establishing their own measurement programs, or in providing such programs to organizations under a “fee for service” type arrangement. In September 2007, Forrester Research identified “developing dashboards to streamline security measurement and reporting” as one of four security consulting service areas in the third quarter of 2007 that yielded the highest revenues from among all security consulting services. [124]
The majority of companies providing CS/IA measurement services fall into one of two categories—
f Companies that provide regulatory compliance consulting/services, and that have extended their capabilities to include measures in support of compliance assessment for security and/or privacy mandates, such as FISMA, HIPAA, and ISO/IEC 27001;
f Companies that provide other IA-related services, and that have extended their capabilities to include measurement.
In a few cases, these companies provide other types of services, such as business intelligence reporting based on CS/IA measures (e.g., Trust Informatics). Table 6-6 provides a representative listing of commercial CS/IA measurement service providers. Excluded are service providers that simply use others’ measures to perform security audit, compliance assessments, and other such services; and consulting services specific to a single product or product set. Again, this listing is intended to be representative/illustrative only, and not exhaustive.
Table 6-6 IA Measurement Service Providers
Company Context URL Specific Offering/Focus
Certified Security Solutions
Security performance management
http://www.css-security.com/securitymetricdvlpmt.html
“Security Metric Development” (offered as a component of “Security Performance Management” service)
Fred Cohen & Associates
CS/IA measurement research
http://all.net/resume/papers.html Security measurement guidance development and training
Metrus Group Measurement consulting
http://www.metrus.com/products/security-strategy.html
“Strategic Measurement Services for Security Professionals”
Orange Parachute
ISO 27001/27002 compliance
http://www.orangeparachute.com/infosec_security_metrics.aspx
Information security measures definition and measurement

Measuring Cyber Security and Information Assurance State-of-the-Art Report (SOAR) 91
Section 6 Industry Initiatives
Company Context URL Specific Offering/Focus
Security Leadership Solutions Executive Council
Business intelligence for security/risk executives
https://www.securityexecutivecouncil.com/research
Customer-targeted research reports and benchmarks with strong security measurement focus/content
Sify ASSURE Security and risk management consulting
http://www.sifyassure.com/scripts/iaconsult_iss_enterpriseINFO.asp
Information security measures development
Treadstone 71 IA and risk management consulting
http://www.treadstone71.com/corpinfo/T71_Security_Metrics.html
“Security Metrics Service”
Trust Informatics
Business intelligence
http://www.trustinform.com “Managed Security Metrics Program”
References84 Op cit. Kark and Stamp.
85 CISWG. “Report of the Best Practices and Metrics Team,” op cit.
86 OWASP. Accessed 25 March 2009 at http://www.owasp.org/index.php/Main_Page
87 IATAC. SOAR: Software Security Assurance, op cit.
88 John Steven and Gunnar Peterson, Editors. “A Metrics Framework to Drive Application Security Improvement,” in Building Security In, IEEE Security and Privacy, 2007. Accessed 25 March 2007 at http://www.arctecgroup.net/pdf/0703-OWASPMetrics.pdf
89 OWASP Web page. “OWASP Application Security Metrics Project.” Accessed 13 January 2008 at: http://www.owasp.org/index.php/Category:OWASP_Application_Security_Metrics_Project
90 Clint Kreitner, CIS. “The CIS Security Metrics and Benchmarking Service.” Presented at Metricon 3.0, San Jose, California, 29 July 2008. Accessed 30 January 2009 at: http://www.securitymetrics.org/content/attach/Metricon3.0/metricon3-kreitner.pdf
91 Ibid.
92 CIS. The CIS Security Metrics, May 2009.
93 ISACA was known previously as the Information Systems Audit and Control Association; the organization now goes by its acronym only.
94 ISACA. Accessed 10 February 2009 at: www.isaca.org
95 W. Krag Brotby, IT Governance Institute. Information Security Governance: Guidance for Boards of Directors and Executive Management, 2nd Edition. (Rolling Meadows, IL: ISACA, 2006.) Complimentary PowerPoint presentation and book order information available at: http://www.isaca.org/Template.cfm?Section=Research2&CONTENTID=21462&TEMPLATE=/ContentManagement/ContentDisplay.cfm (accessed 8 April 2009).
96 Ibid.
97 John P. Pironti. “Developing Metrics for Effective Information Security Governance,” in Information Systems Control Journal, Volume 2, 2007. Accessed 2 April 2009 at: http://www.isaca.org/Template.cfm?Section=Home&CONTENTID=35913&TEMPLATE=/ContentManagement/ContentDisplay.cfm

Measuring Cyber Security and Information Assurance State-of-the-Art Report (SOAR)92
Section 6 Industry Initiatives
98 David A. Chapin, CISA, CISM, CISSP, IAM, and Akridge, Steven, JD, CISM, CM, CISSP, IAM. “How Can Security Be Measured,” in Information Systems Control Journal, Volume 2, 2005. Accessed 8
February 2009 at http://www.isaca.org/Content/ContentGroups/Journal1/20058/How_Can_Security_Be_Measured_.htm
99 Andrew Jaquith. “Securitymetrics.org: Who We Are Wiki.” Accessed 5 February 2009 at: http://www.securitymetrics.org/content/Wiki.jsp?page=WhoWeAre
100 Ibid.
101 Metrics Center. Metrics Catalog Project. Accessed 5 February 2009 at: http://www.metricscenter.org (Log-in required)
102 Johnny Mathisen. Measuring Information Security Awareness. Gjøvik University College Master of Science Thesis, 17 June 2004. Accessed 30 January 2009 at: http://www.dsv.su.se/en/seclab/pages/pdf-files/2005-x-213.pdf
103 Mark Wilson and Joan Hash. NIST SP 800-50, Building an Information Technology Security Awareness and Training Program, October 2003. Accessed 30 January 2009 at: http://csrc.nist.gov/publications/nistpubs/800-50/NIST-SP800-50.pdf
104 ISSA, UK Chapter. “Is Security Awareness wasted on End Users?,” 13 March 2008, pg. 12. Accessed 29 January 2009 at: http://www.issa-uk.org/downloads/Security%2520awareness%2520presentation.pdf
105 J. Mathisen, Measuring Information Security Awareness, op cit.
106 Gary Hinson, IsecT Ltd. “Seven myths about information security metrics,” in ISSA Journal, July 2006. Accessed at: http://www.noticebored.com/IsecT_paper_on_7_myths_of_infosec_metrics.pdf
107 K. Rudolf, Native Intelligence, Inc. “Security Awareness Metrics: Measure What Matters.” Accessed 29 January 2009 at: http://www.nativeintelligence.com/ni-programs/metrics-01.asp
108 Native Intelligence, Inc. “Security Awareness Program Metrics.” Accessed 30 January 2009 at: http://www.nativeintelligence.com/ni-programs/ni-program-metrics-4pg.pdf
109 PSM Safety and Security Technical Working Group. “Security Measurement Whitepaper,” Version 3.0, 13 January 2006. Accessed 2 February 2008 at:
http://www.psmsc.com/Downloads/TechnologyPapers/SecurityWhitePaper_v3.0.pdf
110 For an explanation of the concept of “attack surface,” see Michael Howard. “Attack Surface: Mitigate Security Risks by Minimizing the Code You Expose to Untrusted Users,” in MSDN Magazine, November 2004. Accessed 30 January 2009 at: http://msdn.microsoft.com/en-us/magazine/cc163882.aspx
111 ISECOM. Open Source Security Testing Methodology Manual (OSSTMM). Accessed 2 April 2009 at: http://www.isecom.org/osstmm
112 Pete Herzog, ISECOM. “Calculating Risk Assessment Values.” ISECOM Whitepaper. Accessed 29 January 2009 at: http://isecom.securenetltd.com/RAVs.pdf -and- Dreamland Technologies. “OSSTMM: measurable security.” Corporate brochure. Accessed 30 January 2009 at: http://www.dreamlab.net/download/documents/dlt_OSSTMM_engl.pdf
113 BNET Business Wire. “CIOview Delivers SecurityNOW!: Provides Financial Transparency for IT Security; Increases Security Auditor Productivity 90%,” 14 September 2004. Accessed 30 January 2009 at: http://findarticles.com/p/articles/mi_m0EIN/is_/ai_n6193303
114 Introduced in: Daniel Geer, Kevin Soo Hoo, and Andrew Jaquith. “Information security: Why the future belongs to the quants,” in IEEE Security and Privacy, Volume 1 Issue 4, July/August 2003, pp. 24-32. Digital Object Identifier: 10.1109/MSECP.2003.1219053

Measuring Cyber Security and Information Assurance State-of-the-Art Report (SOAR) 93
Section 6 Industry Initiatives
115 JCIAC was established in January 2001 to coordinate public-private sector prevention of high-tech crime, including computer-related crime. Its activities ended in 2006. The council included: The International Association of Chiefs of Police, High Tech Crime Investigation Association, Transported Asset Protection Association, International Electronic Security Group, National White Collar Crime Center and ASIS International. JCIAC research was funded, for the most part, by the US Department of Justice’s National Institute of Justice.
116 JCIAC. “Computer-Related Crime Impact: Measuring the Incidence and Cost.” White Paper, January 2004. Accessed 25 March 2009 at: http://www.jciac.org/JCIAC%20docs/Computer-Related%20Crime%20Impact%20010904.pdf
117 CDT. “Evaluating DRM: Building a Marketplace for the Convergent World,” Version 1.0, September 2006. Accessed 19 January 2009 at: http://www.cdt.org/copyright/20060907drm.pdf
118 Gunnar Peterson and Elizabeth Nichols. “Web Application Security Metrics Framework,” in IEEE Security & Privacy, March/April 2007.
119 Described in: Robert Ayoub, Frost & Sullivan. “Analysis of Business Driven Metrics: Measuring for Security Value,” in DM Review, March 2006. Accessed 10 December 2008 at: http://www.dmreview.com/white_papers/2290613-1.html (requires online registration to download)
120 Ibid.
121 Executive summaries for these articles are available at http://www.forrester.com (accessed 13 April 2009). Full access to articles available only to Forrester Research clients.
122 Described in: Khalid Kark and Paul Stamp. “Defining an Effective Security Metrics Program,” 16 May 2007. Accessed 29 December 2008 at: http://www.scribd.com/doc/2935458/best-practices-defining-an-effective-security-metrics-program
123 Khalid Kark, Forrester Research. “Best Practices: Security Metrics,” July 22, 2008. Accessed 8 February 2009 at: http://www.forrester.com/Research/Document/Excerpt/0,7211,45787,00.html (Executive summary; full access to articles available only to Forrester Research clients.)
124 Khalid Kark and Chris McClean, Forrester Research. “The Forrester Wave: Security Consulting, Q3 2007,” 25 September 2007. Accessed 2 February 2009 at: http://www.wipro.com/analyst_reports/pdf/Forrester_Security_Consulting_Wave_07.pdf (Executive summary; full access to articles available only to Forrester Research clients.)

“It is surprising how many security-related metrics are already collected for various purposes in the average corporation…. With a bit of creative thinking, there is probably a large amount of interesting data available to you at little or no cost.”
Dr. Gary Hinson, IsecT, Ltd. [125]
7Measurable Data

Measuring Cyber Security and Information Assurance State-of-the-Art Report (SOAR) 95
Section 7 Measurable Data
Measurable data come in a variety of forms. In fact, CS/IA measures can be generated from any IA activity within an
organization. When selecting data to support CS/IA measurement, organizations must ensure that the selected measures are meaningful and repeatable, and can be generated with reasonable effort. (For example, the amount of time it takes a penetration tester to break into a network may be a meaningful measure, but it may not be repeatable with different testers and the costs associated with it may be prohibitive.)
This section summarizes activities that collect and capture CS/IA measurement data that can be rolled up into measures as well as those activities that define data attributes that can be measured. [126] It also summarizes taxonomies of CS/IA measures that have emerged since 2000, and presents some representative research on quantifying the value of CS/IA.
7.1 Red/Blue Team EvaluationsRed and blue team evaluations simulate potential real-world scenarios. Skilled attackers (the red team) attempt to subvert a target system or network, while systems administrators and incident response specialists (the blue team) attempt to minimize the red team’s effects on the system or network. These simulations can provide organizations with valuable information about their procedures and methodologies, in addition to identifying potential vulnerabilities within their systems and networks. In a well-prepared organization, effective IA procedures, methodologies, and personnel may be able to successfully mitigate the risks introduced by identified vulnerabilities with the organization’s systems or networks.
However, because red and blue team evaluations are far more complex and interactive than traditional IA assessments, organizations may have difficulty defining and collecting meaningful measures based on these simulations. By developing, testing, and modifying methodologies

Measuring Cyber Security and Information Assurance State-of-the-Art Report (SOAR)96
Section 7 Measurable Data
specifically for red and blue team evaluations, researchers aim to improve both the repeatability of these exercises as well as provide a better understanding of the types of measures that can be collected and used to gain insight into the status of CS/IA in organizations undergoing red/blue team evaluations.
The Information Design Assurance Red Team (IDART) at Sandia National Laboratories has developed a methodology for Information Operations Red Team and Assessments (IORTA) that includes a methodology for capturing data that can be quantified as a product of red team assessments. IDART’s IORTA methodology captures the following data, listed in Table 7-1.
Table 7-1 Metrics Data Captured by IDART Red Team Activities
Source of Metric Data Types of Metric Data Captured
Design Assurance Red Teaming f Attack f Adversary f Protection f Threat
Hypothesis Testing f Attack f Adversary
Red Team Benchmarking f Vulnerability f Consequence f Adversary f Protection f Threat
Behavioral Red Teaming f Consequence f Adversary f Threat
Red Team Gaming f Attack f Consequence f Adversary f Threat
Operational Red Teaming f Attack f Vulnerability f Adversary f Protection f Threat
Penetration Testing f Attack f Vulnerability f Protection
Analytical Red Teaming f Consequence f Adversary f Protection f Threat
The actual data/values captured during attack simulations, exercises, or actual incidents fall into the categories described in Table 7-2. [127]

Measuring Cyber Security and Information Assurance State-of-the-Art Report (SOAR) 97
Section 7 Measurable Data
Table 7-2 Categories of IDART Red Team Metrics
Types of Metrics Purpose Examples
Attack-based metrics Describe capabilities and commitment required to undertake a successful attack
f Knowledge/skill required f Time required f Probability of detection (i.e., Likelihood that defender will detect the attack)
Vulnerability-based metrics Count or measure vulnerabilities or weaknesses discovered
f Boolean existence (i.e., Is there a vulnerability?)
f Percentage of platforms with the vulnerability
f Reachability (i.e., Can the attacker access the vulnerability?)
Consequence-based metrics Describe or measure consequences of a successful attack
f Number of deaths f Downtime f Nightmare consequences
Adversary-based metrics Describe the adversary model(s) used by the red team; the model may pertain to external (“outsider”) or insider adversaries
f Knowledge or skill level f Number of team members f Tools or techniques
Protection-based metrics Count or measure protection systems (existing or planned countermeasures)
f Percentage of systems protected f Number of protections/layers of protections
f Number of incidents/compromises
Threat-based metrics Describe the degree of threat as calculated from combinations of the other metrics
f Expected cost to repair damage f Expected number of systems affected
f Mean time to restore services
As it specified the IORTA metrics, the IDART team considered other possible metrics, but rejected them as problematic for various reasons.
Among these other possible metrics was Red Team Work Factor, a metric researched at DARPA from 1999 to 2003, and rejected by IDART as being too unstable, difficult to reproduce, and inaccurate in capturing true adversary costs. Instead, the IDART team chose to use adversary-based metrics.
Other metrics considered and rejected by the IDART team included Information Warfare Intensity (another DARPA-researched metric, considered conceptually useful, but incomplete), and Value-Driven Measures (developed by the Air Force Institute of Technology).
The IDART team also developed an IORTA tool for producing attack graphs and capturing metrics, and a training course, “Red Team Metrics,” that complements the IDART course “Red Teaming for Program Managers.” [128]

Measuring Cyber Security and Information Assurance State-of-the-Art Report (SOAR)98
Section 7 Measurable Data
7.2 Network Management and Security Measures
“Evaluation of network security is an essential step in securing any network. This evaluation can help security professionals in making optimal decisions about how to design security countermeasures, to choose between alternative security architectures, and to systematically modify security configurations in order to improve security. However, the security of a network depends on a number of dynamically changing factors such as emergence of new vulnerabilities and threats, policy structure and network traffic. Identifying, quantifying and validating these factors using security metrics is a major challenge in this area. In this paper, we propose a novel security metric framework that identifies and quantifies objectively the most significant security risk factors, which include existing vulnerabilities, historical trend of vulnerability of the remotely accessible services, prediction of potential vulnerabilities for any general network service and their estimated severity and finally policy resistance to attack propagation within the network. We then describe our rigorous validation experiments using real-life vulnerability data of the past 6 years from National Vulnerability Database (NVD) to show the high accuracy and confidence of the proposed metrics. Some previous works have considered vulnerabilities using code analysis. However, as far as we know, this is the first work to study and analyze these metrics for network security evaluation using publicly available vulnerability information and security policy configuration.” [129]
Data from network security devices, like Intrusion Detection Systems (IDS) and Intrusion Prevention Systems (IPS), can be used as primary sources for CS/IA measures. For example, IDS data can be used to populate measures on incoming and outgoing network traffic. As IPSs are designed to block or prevent malicious or unwanted behavior in real-time, their use can facilitate the ability for real-time measures calculation. Criteria for selection of IDSs can be found in “A Metrics-Based Approach to Intrusion Detection System Evaluation for Distributed Real-Time Systems.” [130]

Measuring Cyber Security and Information Assurance State-of-the-Art Report (SOAR) 99
Section 7 Measurable Data
SecurityMetrics, Inc. [131] has IDSs, IPSs, and Vulnerability Assessment appliances that quantify the following—
f Attack recognition, f Attack prevention, f Real-time attack notification, f Recent attacks, f Recent attackers, f Recent attacked IPs, f Rank of attack types, f Information leakage, f Open shares, f Password problems.
Users of these appliances can have their own secure results Web pages to review their network checks.
Aladdin’s Attack Intelligence Research Center [132] contains over 20 additional network security statistics, including those that can be used to design, monitor, and quantify network security. Through Aladdin’s Research Center, several key findings based on the have been calculated as follows—
f 55% of online users have been infected with spyware. f For 52% of networks, the perimeter is the only defense. f There are 651 million email users globally.
7.3 Software Testing OutputMany COTS tools provide users with a score, indicating the security of the underlying system. In most cases, these scores are loosely generated by aggregating the weighted severity of the vulnerabilities discovered by the tool.
While these scores are not necessarily generated against a published methodology—nor can they truly be compared across multiple COTS tools—these scores can be used as an initial step or, more likely, an input into an organization’s overall CS/IA measurement methodology.
In addition, organizations can develop CS/IA measures based on the results of their own software testing and analysis. These techniques can provide reproducible and comparable measures that can be used to quantify and monitor the organization’s security posture over time.
The types of software testing measures available are listed and described in Table 7-3.

Measuring Cyber Security and Information Assurance State-of-the-Art Report (SOAR)100
Section 7 Measurable Data
Table 7-3 Software Testing Measures
Category Focus/Key Data Source Examples
Severity-based Vulnerability severity or quantity f NIST risk matrix: Finding of high- severity vulnerability produces high vulnerability rating
f Number of high-severity vulnerabilities: Commonly used in certification and accreditation programs wherein presence of one or more high severity vulnerabilities prevents the system from being certified
Mitigation-based Amount of time or effort involved in mitigating the vulnerability
f Amount of time it takes for defects within an organization to be mitigated after the vulnerability is identified
f Comparison of “time to patch” averages for proprietary commercial software vs. open source software
Category-based Trending of vulnerability types identified in an organization’s systems: useful for identifying aspects of an organization or system that may be the primary cause of many of the vulnerabilities of a given type. Resources deployed to mitigate the systemic risk indicated by the measure would likely greatly improve the organization’s security posture.
f Number of cross-site scripting vulnerabilities within an organization’s Web applications—a high number indicating the systemic inadequacy or lack of input and/or output validation by the applications
Organizations have been using these types of measures for assessing the quality of software for a number of years. In fact, modern development methodologies (e.g., agile methods and extreme programming) focus exclusively on testing results to determine the progress and quality of software being developed. The majority of testing involved in these development processes is unit testing, which focuses exclusively on ensuring that the functionality of a specific component meets the defined requirements. However, organizations taking advantage of these development methodologies can easily include software security-related testing, resulting in security measures that can be based on and calculated using the same methodologies used to determine the quality and completeness of the software.
For Further Reading
Satish Chandra and R.A. Khan. “Software security metric identification framework (SSM),” in Proceedings of the ACM International Conference on Advances in Computing, Communication and Control (ICAC3 ‘09), Mumbai, India, 23–24 January 2009, pp. 725–731. Digital Object Identifier: http://doi.acm.org/10.1145/1523103.1523250

Measuring Cyber Security and Information Assurance State-of-the-Art Report (SOAR) 101
Section 7 Measurable Data
7.4 Scoring SchemesSignificant advances have been made in creating units for counting CS/IA-related items to begin developing means for uniform measurement and comparison of CS/IA across applications, platforms, and organizations. This section describes the development of scoring systems that have allowed for these advances. The scoring and ranking systems described in this section are all intended to apply quantitative or qualitative rankings of priority, severity, or impact to reported vulnerabilities. The sources of the vulnerability data are also indicated in the descriptions of these different scoring systems.
7.4.1 CVSSThe CVSS is a free, open standard maintained by the Forum of Incident Response and Security Teams (FIRST), and defined by the CVSS Special Interest Group (SIG). The latest version, CVSS Version 2, was published jointly by FIRST and the CVSS SIG in Summer 2007.
In essence, the CVSS is a scoring system for vulnerabilities, specifically those vulnerabilities described by the CVE, [133] a dictionary of publicly known information security vulnerabilities and exposures. In this system, each vulnerability is assigned a CVE Identifier comprising—
f A unique CVE number (e.g., “CVE-1999-0067”); f An indication of the status of the CVE entry (“entry,” meaning it has been
approved for inclusion in the dictionary, or “candidate,” meaning its inclusion is still under consideration pending technical analysis);
f A brief description of the security vulnerability or exposure; f Any pertinent references (i.e., vulnerability reports and
advisories or Open Vulnerability and Assessment Language Identifier [OVAL-ID]). [134]
A CVSS score represents an overall composite of the severity and risk associated with a given vulnerability. The score is derived by performing certain calculations (based on defined equations) of values in three different categories or groups.
The CVSS “framework” consists of the three metric groups of which the CVSS is composed, and their component metrics. [135] This framework is depicted in Figure 7-1.

Measuring Cyber Security and Information Assurance State-of-the-Art Report (SOAR)102
Section 7 Measurable Data
Figure 7-1 CVSS Framework [136]
The three CVSS metric groups are—1. Base metrics: Express those innate fundamental characteristics
of a vulnerability that remain constant over time and across user environments. Base metrics are the most widely used of the three CVSS metrics groups. Those who use only base metrics to the exclusion of temporal and environmental metrics generally do so because they wish to avoid the additional effort and uncertainty involved in defining metrics specific to their own systems; they feel that base metrics, by contrast, are unchanging and thus easier to use and/or more reliable. Within the base metrics group, seven metrics (described in Table 7-4) represent the most fundamental characteristics of a vulnerability.
2. Temporal metrics: Express those characteristics of a vulnerability that change over time, but which remain constant across user environments. Within the temporal metrics group, three metrics (described in Table 7-4) represent the time-dependent characteristics of the vulnerability.
Impact Bias
AccessComplexity
ConfidentialityImpact
AuthenticationIntegrityImpact
AccessVector
Exploitability
TemporalMetric Group
RemediationLevel
ReportConfidence
EnvironmentalMetric Group
Base Metric Group
CollateralDamage Potential
TargetDistribution
AvailabilityImpact
Environ.Formula
Temp.Formula
BaseFormula
OverallVulnerability
Score

Measuring Cyber Security and Information Assurance State-of-the-Art Report (SOAR) 103
Section 7 Measurable Data
3. Environmental metrics: Express the characteristics of a vulnerability that are specifically relevant and unique to how that vulnerability manifests in a particular environment. Within the environmental metrics group, two metrics (described in Table 7-4) represent implementation- and environment-specific characteristics of the vulnerability.
The metrics within each of the three metric groups and their possible values are described in Table 7-4.
Table 7-4 CVSS Metrics by Metric Group
Metric Group Metrics Description Possible Values
Base Metrics Access vector Indicates how the vulnerability can be reached by an attacker, i.e., through remote (distant or nearby) or local access
f Local f Adjacent f Network
Access complexity Measures how complex an attack would have to be to exploit the vulnerability once that attacker gained access to the target
f High f Low
Authentication Indicates whether or not authentication of the attacker by the target is required before he/she can access the vulnerability
f Required f Not required
Confidentiality impact Indicates whether a successful exploit of the vulnerability will have any impact on the confidentiality property of the target, and if so how much impact
f None f Partial f Complete
Integrity impact Indicates whether a successful exploit of the vulnerability will have any impact on the integrity property of the target, and if so how much impact
f None f Partial f Complete
Availability impact Indicates whether a successful exploit of the vulnerability will have any impact on the availability property of the target, and if so how much impact
f None f Partial f Complete
Impact bias Indicates whether any of the three impact metrics is of greater importance (i.e., needs to be assigned a greater weight) than the other two
f Normal (all three impacts are of equal importance)
f Confidentiality f Integrity f Availability

Measuring Cyber Security and Information Assurance State-of-the-Art Report (SOAR)104
Section 7 Measurable Data
Metric Group Metrics Description Possible Values
Temporal Metrics Exploitability Indicates the complexity of the process required to exploit the vulnerability in the target
f Unproven f Proof of concept f Functional f High
Remediation level Indicates the level of an available countermeasure to the vulnerability
f Official fix f Temporary fix f Workaround f Unavailable
Report confidence Indicates the degree of confidence that the vulnerability exists/the credibility in the report of that vulnerability
f Unconfirmed f Uncorroborated f Confirmed
Environmental Metrics
Collateral damage potential
Indicates the potential/likelihood that an exploitation of the vulnerability could result in loss of physical equipment, damage to property, loss of human life, or major physical injury to human
f None f Low f Medium f High
Target distribution Indicates the relative size (quantity, dispersion) of the field of targets susceptible to the vulnerability
f None f Low f Medium f High
Each of the non-numeric values is assigned a numeric value, which is then used in the calculation of the score for the vulnerability. The base metric values are combined to calculate the base score of 0 to 10. Once calculated, the base score for a given vulnerability is not expected to change. The base score is further refined by combining that score with the values assigned the vulnerability’s temporal and environmental metrics, and calculating the temporal score and environmental score respectively (each also a number from 0 to 10).
In addition to the base score, CVSS includes temporal and environmental scoring vectors. A scoring vector is a text string that contains the values assigned to the base metrics that are calculated to produce the base score. In this way, the scoring vector clarifies the meaning of the base metrics by making it clear how those metrics were ranked before being combined to produce that score. Designers of the CVSS intend for the scoring vector to always be displayed with the base score.
According to its developers, the CVSS has advantages over other scoring systems in that it is an open standard, and it ranks vulnerabilities in a consistent fashion, while also allowing for customization to express metrics for specific user environments.
Several organizations have made online and offline calculators available to assist in the calculation of CVSS scores. Examples of such calculators are available at the following Web sites—
f NIST CVSS Version 2 Calculator. Accessed 27 March 2009 at: http://nvd.nist.gov/cvss.cfm?calculator&adv&version=2

Measuring Cyber Security and Information Assurance State-of-the-Art Report (SOAR) 105
Section 7 Measurable Data
f Information-Technology Promotion Agency of Japan, CVSS 2.0 Calculator. Accessed 27 March 2009 at: http://jvnrss.ise.chuo-u.ac.jp/jtg/cvss/en/index.02.html
f ERNW CVSS Calculator. Accessed 27 March 2009 at: http://www.ernw.de/content/e6/e180/e1043/ernw-cvsscalc_ger.zip
7.4.2 Chris Wysopal’s CWE System ScoringRecognizing that the CVSS was not directly applicable to software applications and systems, Chris Wysopal, Chief Technology Officer of source code analysis tool company Veracode, devised a CWE scoring system, [137] whereby he assigned CVSS-type equations to scoring of metrics for the weaknesses enumerated in the CWE. The intent of his scoring system was to provide a means of scoring weaknesses discovered by software security analysis techniques (automated static, automated dynamic, manual code review).
Wysopal felt that the CVSS environmental score could be used unchanged, but that the process for generating the base score and temporal score were too complex. He specifically proposed the following simplified, four-step calculation process to produce Weakness Base Scores and Weakness Likelihood Scores for CWE entries—
1. At the class level, assign the CVSS values for impact metrics to the CWE entry’s “Common Consequences.” These values are: Confidentiality, Integrity, and Availability. The resulting computation will be a numerical impact metric for the entry.
2. At the code context level, use the CVSS values for Access Vector, Access Complexity, and Authentication to calculate the CWE entry’s exploitability metric.
3. Combine the new Impact and Exploitability metrics to calculate the CWE entry’s Weakness Base Score.
4. Calculate a Weakness Likelihood Score for the CWE entry by applying the CVSS temporal score equation to the CWE entry. The resulting Weakness Likelihood Score will express the perceived potential that
“bad things will come” from a given weakness.
A critic of Wysopal’s CWE Scoring System observes that the “CVSS was created to score vulnerabilities, not weaknesses. In the end, these two things exist at differing levels of abstraction and require scoring systems of differing complexity and levels of abstraction.” This critic goes on to state that “there is still a need for a true Common Weakness Scoring System.”
7.4.3 CCSSUnder development by NIST, the CCSS [138] defines a set of measures for security configuration issues, and a formula to combine those measures into scores for each issue. The CCSS is derived from the CVSS, but adjusts the basic components of the CVSS to focus on security configuration issues, rather than

Measuring Cyber Security and Information Assurance State-of-the-Art Report (SOAR)106
Section 7 Measurable Data
software flaws. The CCSS uses six of the seven base metrics from the CVSS—Access Vector, Access Complexity, Authentication, Confidentiality Impact, Integrity Impact, and Availability Impact (Impact Bias is not used)—to compute the CCSS base score. Like the CVSS scores of CVE vulnerabilities, CCSS scores are intended to indicate how readily CCE weaknesses and vulnerabilities can be exploited, and how such exploitations may affect the targets.
At present, the CCSS addresses only base metrics; NIST plans to expand the scoring system to include support for environmental metrics as well. Nothing has been said by NIST of plans to add support for temporal metrics.
7.4.4 CMSSUnder development by NIST, the CMSS [139] defines a set of measures for software feature misuse vulnerabilities (in contrast to software implementation vulnerabilities), along with a formula to combine those measures into scores for each issue.
Like CCSS, the CMSS is derived from the CVSS to complement its sister scoring systems. The CMSS adjusts the components of the CVSS to focus on software misuse vulnerabilities, rather than on software flaws or configuration issues.
The CMSS uses the same six core measures as both the CVSS and CCSS (i.e., Access Vector, Access Complexity, Authentication, Confidentiality Impact, Integrity Impact, Availability Impact) to compute the base score.
As noted in the draft specification, the CMSS does not have a misuse dictionary available to it, whereas the CVSS and CCSS rely on the CVE and CCE, respectively. However, developing a CMSS score does not require a misuse dictionary. An organization can successfully deploy the CMSS against its own internal misuse dictionary.
CMSS scores are intended to indicate how readily software misuse weaknesses and vulnerabilities can be exploited, and how such exploitations may affect the target system. The CMSS does not yet address temporal or environmental metrics in its current draft, but these will be developed in the future.
7.4.5 CWSSCWE users quickly determined that the CVSS does not work well for scoring weaknesses enumerated in the CWE, and initiated development of the CWSS [140] to address this deficiency. This deficiency is mainly because the amount and depth of information available is different for weaknesses in the CWE than it is for vulnerabilities in the CVE.
The CVSS is linked to known vulnerabilities, i.e., those reported and captured in the CVE. By contrast, the CWE includes both general (potential) and specific (discovered) weaknesses—

Measuring Cyber Security and Information Assurance State-of-the-Art Report (SOAR) 107
Section 7 Measurable Data
f General weaknesses are weaknesses, such as those enumerated in the CWE/ SysAdmin, Audit, Network, Security (SANS) Top 25 Most Dangerous Programming Errors, to which most or all software is prone.
f Specific weaknesses are those discovered in specific software products but which have yet to be exploited as vulnerabilities (and thus they remain weaknesses in CWE rather than being added to CVE as reported vulnerabilities).
In many cases, there is little or no knowledge of how specific weaknesses were discovered (e.g., by automated scanning or manual code review, or in what environment/under what conditions).
Recognizing this disconnect between the CVSS and CWE, an effort has been undertaken to define a CWSS comparable to, but distinct from, the CVSS. The effort began with the development of a mapping of the CWE to the SANS Top 25, in hopes that this mapping would clarify the best approach for developing a CWSS. The SANS Top 25 was used as the basis for determining weakness prevalence and severity.
The developers of the CWSS are also considering ways in which to link the weakness scores more closely to business/mission context; they feel this context is only partly addressed by the CVSS environment score (which is not widely used).
Development of the CWSS is in early days yet, and there is little information available as to what it will involve. This said, there is a Web page devoted to the CWSS in the CWE section of The MITRE Corporation’s
“Making Security Measurable” Web portal. [141] Progress on CWSS definition is expected to be reported there. The Web page can be found at: http://cwe.mitre.org/cwss/index.html (accessed 13 March 2009).
7.4.6 Software Vendor Vulnerability Severity RatingsMany software vendors have instituted their own rating systems for the vulnerabilities they discover and report—
f Microsoft uses a Security Bulletin Severity Rating System of four ratings (“Critical,” ”Important,” “Moderate,” “Low”).
f Oracle uses CVEs to characterize all vulnerabilities in its Security Alerts, and provides the CVSS base score for each vulnerability (thereby, leveraging the CVE and CVSS as their designers intended).
f McAfee reports the Microsoft Security Bulletin number and severity rating, although the CVE (if there is one) is also identified.
7.4.7 Vulnerability Reporting/Advisory Service RatingsThere are a number of commercial organizations, including security services/consulting firms, vulnerability scanner vendors, and penetration test service providers, that issue reports or advisories about vulnerabilities discovered by their own analysts and/or reported to them by their customers.

Measuring Cyber Security and Information Assurance State-of-the-Art Report (SOAR)108
Section 7 Measurable Data
These organizations all apply some methodology for rating the vulnerabilities they report by severity, with severity in some cases indicating likelihood or ease of exploitation and, in other cases, importance of applying a patch.
Some of these rating systems are numeric; more often, they are qualitative (e.g., “high risk,” “low risk”). Some organizations use a color-coded graphical scale instead of, or in addition to, a numeric or qualitative rating; the colors are most often based on red-yellow-green traffic signals (red = major, yellow = moderate, green = minor). Secunia, for example, assigns both qualitative (“critical,” “moderately critical,” etc.) and color-scale indicators to its vulnerability severity ratings.
While many of these organizations also identify the CVEs for the vulnerabilities they report, few, if any, appear to use the CVSS as the basis for their various rating systems.
7.4.8 Attack and Threat Scoring SystemsAs with vulnerability scoring systems, these scoring systems attempt to apply quantitative or qualitative rankings of likelihood, severity, impact, or priority to various threats or attack types. The sources of the threats/attack types thus scored are indicated in the descriptions of these different scoring systems.
For example, DShield.org, a volunteer effort supported by the SANS Institute, was officially launched in November 2000. Since then, it has developed into an Internet attack correlation engine with worldwide coverage. DShield.org uses an Internet Threat Level scoring system in which
“ThreatCon” levels of red, yellow, and green (traffic signal colors) are assigned to different attacks to indicate their relative severity.
Cisco Systems uses a metric it calls an Attack Relevance Rating (ARR). The ARR quantifies attacks detected by its IPS. The ARR is then used as a data point to calculate an overall Risk Rating for each intrusion to be dealt with by the Cisco Security Manager, of which the IPS is a component.
MyNetWatchman.com is a service for monitoring Internet activity on behalf of Internet Service Providers (ISPs) that subscribe to the MyNetWatchman service. Each day, MyNetWatchman automatically collects and aggregates firewall logs from a very large number of ISP computers, analyzes these logs for evidence of hacker or worm attacks, and notifies the ISPs of the originations of the attacks are coming from. The two measures generated by the MyNetWatchman service are—
f Ports Rising in Attack Rates—Indicates ports on which the number of detected attacks has increased since the previous day’s collection and aggregation.
f Ports Being Attacked Most—Indicates the absolute metric of number of attacks by Internet port type.

Measuring Cyber Security and Information Assurance State-of-the-Art Report (SOAR) 109
Section 7 Measurable Data
7.5 Vulnerability Assessment and ManagementVulnerability assessments are a longstanding aspect of IA. In fact, many organizations already have some form of vulnerability assessment process in place, ranging from identifying the patches that need to be applied to systems, to performing active vulnerability scans on a regular basis. To this end, vulnerability assessment results can form an important aspect of a CS/IA measurement program.
This section identifies two popular CS/IA measurement approaches employed by DoD and US-CERT that organizations may leverage—either as a whole or as a basis for their own customized CS/IA measures.
7.5.1 IAVA StatisticsDoD publishes and maintains the IAVA database, which aggregates the vulnerability reporting performed by various external organizations (e.g., Bugtraq bulletins, Microsoft bulletins, US-CERT announcements). Because IAVAs require acknowledgement and compliance on the part of IAVA bulletin recipients, DoD can maintain measures on the number of systems that are in compliance with the latest IAVA bulletin.
The Vulnerability Compliance Tracking System provides information on all DISA IT assets that are affected by IAVAs. DISA can generate measures on the current security posture of its IT systems by measuring their compliance status, which can be one of seven states, [142] as shown in Table 7-5.
Table 7-5 DISA Vulnerability Compliance Tracking System Measures
State Definition
Open An asset is currently affected by an alert, but mitigations have not been applied
Not Applicable An asset has been determined to not be affected by the alert
Fixed/In Compliance The accepted mitigation strategy has been applied
Extension Requested An extension beyond the 30-day compliance deadline has been filed
Extension Approved An asset is currently affected by an alert, but the deadline for mitigation has been extended
Extension Denied An extension has been denied and the mitigation strategy must be implemented immediately
Extension Expired An extension has expired and the asset is still affected by the alert
By assessing the number of systems in each possible state, DoD can determine how efficiently it is handling a specific alert. In aggregate, DoD can determine how long IAVAs take, on average, to be addressed within the organization, which helps gauge the level of risk posed by open vulnerabilities. Similarly, this information can be used to identify specific “problem systems” that may lag behind the rest of the network in complying with IAVAs.

Measuring Cyber Security and Information Assurance State-of-the-Art Report (SOAR)110
Section 7 Measurable Data
7.5.2 US-CERT Vulnerability Note US-CERT maintains what it calls its Vulnerability Notes Database, which is comparable to the NIST National Vulnerability Database and the CVE database.
Each entry in the Vulnerability Notes Database is called a Vulnerability Note. Vulnerability Notes “generally describe vulnerabilities independent of a particular vendor,” and include a number of data fields describing the vulnerability [143] and providing information about it. One of these data fields is
“Metric,” which forms the basis for rating the vulnerability according to its severity.Similar in intent to a CVSS score, the Metric is, in fact, determined based
on a different set of component metrics, which are quantified answers to questions about the vulnerability. The component metrics used to compute the Vulnerability Note Metric include the following—
f Is information about the vulnerability widely available or known? f Is the vulnerability being exploited? f Is the Internet Infrastructure at risk because of this vulnerability? f How many systems on the Internet are at risk from this vulnerability? f What is the impact of exploiting the vulnerability? f How easy is it to exploit the vulnerability? f What are the preconditions required to exploit the vulnerability?
The answer to each question is assigned an approximate numeric value; the value is approximate in recognition of the fact that different sites may assign different values, based on differences in their environment and their perceptions of the vulnerability given that environment. The component metrics are then calculated together to produce an overall numeric metric score for the vulnerability; this is a number from 0-180, with 180 representing the highest possible severity. Vulnerabilities with a metric score of 40 or greater merit issuance of US-CERT Technical Alerts (TA).
Because the component metrics are not all given equal weight (priority), US-CERT warns that composite vulnerability scores should not be considered linear; that is, a vulnerability with a score of 40 should not be considered twice as severe as one with a score of 20.
7.6 Risk Management and Compliance Outputs
“The most significant challenge is validating results from the risk management process. Demonstrating due diligence is key. However, the inadequacy of traditional risk management methodologies make this essentially impossible. Thus, security metrics (in various forms) have become the emerging methodology to assess and demonstrate compliance with industry standard security practices and procedures. The HIPAA Security regulations, ISO 17799, and other similar standards are useful taxonomies to organize a security program;

Measuring Cyber Security and Information Assurance State-of-the-Art Report (SOAR) 111
Section 7 Measurable Data
however, these standards do not provide a basis to quantify particular security activities and their results within [an] organization.” [144]
“…We need to adopt a risk-based approach in both our operations and our philosophy. Risk management is fundamental to managing the threat, while retaining our quality of life and living in freedom. Risk management must guide our decision-making as we examine how we can best organize to prevent, respond and recover from an attack.” [145]
DHS has developed a range of risk assessment tools for different types of assets, systems, or sectors (e.g., the Maritime Security Risk Analysis Model [MSRAM]). Data from these tool-driven assessments are intended to be used by government and critical infrastructure sector organizations to populate IA risk and compliance metrics, and to show performance improvements.
7.6.1 CNDSP C&AIn early 2001, DoD Directive (DoDD) O-8530.1, “Computer Network Defense (CND),” 8 January 2001, designated a new term Computer Network Defense Services Provider (CNDSP). Implementation of the Directive within DoD began in 2003. This term is used to describe the providers of CND and incident response services in DoD that incorporate services similar to those provided by CERTs and Computer Security Incident Response Teams (CSIRT). Along with this new directive, DoD also published a supporting manual, DoD Manual O-8530.1-M, “Information Assurance Workforce Improvement Program,” 19 December 2005, defining a measurement-driven C&A process for evaluating the performance of DoD CNDSPs.
Unlike traditional C&A, which calculates the security risk for a given system and certifies that the security controls in place for that system adequately mitigate that risk, the C&A of a CNDSP assesses the degree to which that provider assures a minimum standard of service to its DoD subscribers.
All general services CNDSPs are held to the same standard of minimum acceptable level of service and assessed using the same set of criteria. These criteria are captured in over 100 metrics that are used to measure the adequacy of the services the CNDSPs provide in four main categories, or “goal areas”—
f Protect—Includes vulnerability analysis and assessment, CND red teaming, virus protection, subscriber protection and training, information operations condition implementation, and IA vulnerability management;
f Monitor, Analyze, and Detect—Includes network security monitoring and intrusion detection, attack sensing and warning, and indications and warnings and situational awareness;
f Respond—Includes incident reporting, response, and analysis;

Measuring Cyber Security and Information Assurance State-of-the-Art Report (SOAR)112
Section 7 Measurable Data
f Sustain Capability—Includes memoranda of understanding and contracts, CND policies and procedures, CND technology development, evaluation, and implementation, personnel levels and training/certification, security administration, and the primary information systems that support the CNDSP.
The metrics used to measure the adequacy of CNDSP services are based on IA best practices, self-assessment tools, and DoD requirements. Some examples of metrics used in the CNDSP assessment include verifying the establishment of policy and procedures for, and the performance of intrusion detection, vulnerability scanning, etc., on subscriber networks.
Since the establishment by DARPA in 1988 of the Computer Emergency Response Team/Coordination Center (CERT/CC) at CMU’s Software Engineering Institute, CERT/CC and DoD have worked closely together. CERT/CC that was used as the model for DoD’s definition of the CNDSP and many CERT/CC practices have been included in the CNDSP C&A methodology.
The CERT/CC defined a system for prioritizing CNDSP C&A according to the criticality of the services being measured—
1. Priority I metrics—Those used to measure adequacy of services critical to an incident management capability.
2. Priority II metrics—Those used to measure the adequacy of the next most important services. These metrics address traditional operational concerns.
3. Priority III and Priority IV metrics—Those used to measure best practices that support operational effectiveness and quality.
The CERT/CC then applies a scoring system to rate how well the CNDSP is doing with regard to each metric—
f Not applicable—The metric does not apply to the organization, so was excluded from the total “score”;
f Not observed—The metric was not observed during the assessment; f Yes—The metric was met; f Partial—The metric was partially met; f No—The metric was not met.
The assessor’s job, then, is to analyze data collected during the CNDSP’s initial self-assessment (which precedes the C&A inspection by DISA) and during the C&A inspection to determine—
f Has the CNDSP met the required indicators for each metric? f Has the metric been satisfied? f What is the quality of performance for the metric
(if this can be determined)?

Measuring Cyber Security and Information Assurance State-of-the-Art Report (SOAR) 113
Section 7 Measurable Data
According to the CERT/CC, the measurement results are intended to (1) enable the calculation of a risk exposure based on the number and prioritization of unmet and partially-met metrics; (2) drive an improvement plan to be undertaken by the CNDSP, with metrics’ priorities driving the prioritization of remediations for the unmet and partially-met metrics.
Since the CNDSP C&A program began in 2003, all DoD CNDSP are required to undergo C&A inspection by DISA certifiers every three years; based on their findings during the inspection, the certifiers recommend a certification level to US Strategic Command, which is responsible for making the final accreditation determination. [146]
In 2005, DHS’s US-CERT announced its intention to establish a federal CNDSP program, modeled closely on the DoD program, and to include a measurement-based CNDSP performance assessment process using
“federalized” metrics adapted from those in DoDD O-8530.1.
For Further Reading
Buzz Walsh and Ralph Ghent. “The Road Ahead for Computer Network Defense Service Providers,” in IAnewsletter, Volume 6 Number 3, Winter 2003/2004, pp. 6-11. Accessed 11 May 2009 at: http://iac.dtic.mil/iatac/download/Vol6_No3.pdf
Audrey Dorofee, Chris Alberts, and Robin Ruefle Carnegie Mellon University CERT/CC. “Evaluating CSIRT Operations,” presented at the 18th Annual FIRST Conference, Baltimore, Maryland, 25-30 June 2006. Accessed 11 May 2009 at: http://www.first.org/conference/2006/program/presentations.html#p210
7.6.2 NIST FDCC Compliance Metrics InitiativeInitiated by OMB, the Federal Desktop Common Configuration (FDCC) attempts to define a single configuration for all federal government desktop and laptop computers that run some version of Microsoft Windows. By standardizing on a single enterprise-wide configuration, the FDCC is intended to reduce the costs associated with support and application compatibility while also improving security. [147]
The FDCC Compliance Metrics Initiative was undertaken by NIST to provide the guidance and tools needed to support the effective implementation and verification of the FDCC. Publicly accessible FDCC Compliance Metrics resources, including Frequently Asked Questions (FAQ) and an FDCC checklist, are maintained as part of the NIST SCAP program. [148]
Through the FDCC Web site, organizations can identify SCAP-validated tools. [149] Many of these tools are capable of scanning personal computers against FDCC machine-readable checklists. NIST describes an FDCC scanner as “a product with the ability to audit and assess a target system in order to determine its compliance with the FDCC requirements. By default, any product validated as an FDCC Scanner is automatically awarded the

Measuring Cyber Security and Information Assurance State-of-the-Art Report (SOAR)114
Section 7 Measurable Data
Authenticated Configuration Scanner validation.” [150] Using these tools, organizations can automate the process of verifying whether systems meet the organization’s configuration requirements.
7.6.3 C&A Risk MeasuresSecurity C&A is a common priority for any IA program. The activity of performing Security Test & Evaluation (ST&E) on systems and program components as part of C&A drives the ability to document the status of security controls, discovered weaknesses, and, ultimately, the Authority to Operate (ATO). Data collected from the process can and is frequently used to calculate CS/IA measures.
The annual FISMA report documents the roll-up of the number and percentage of federal systems that have a C&A. C&A measures can also be found at more detailed levels during the fourth phase of C&A, Enterprise Continuous Monitoring. [151] Examples of these metrics include number and percentage of—
f Systems tested; f Test results reviewed; f Scheduled milestones for the relevant FISMA reporting cycle
completed on time; f Security Project Management Officers (SPMO) and system test
teams offered training; f Systems that use mandated methods and formats for testing
and reporting; f Controls selected and tested that are applicable and appropriate; f Controls that are tested as “In Place”; f Controls that are tested as “Risk Based Decision” or “Not Applicable”; f Systems that have the appropriate level of justification and evidence; f Program units that enter all appropriate information into the FISMA
repository by FISMA reporting deadlines.
Another example of these C&A measures can be found in the Defense Logistics Agency (DLA) document, How to Perform Information Systems Security C&A within the Defense Logistics Agency (DLA) using Metrics and Controls for Defense-in-Depth (McDiD). [152] Metrics for the McDiD approach are based on an assessment or rating that serves as an indicator of compliance with the control. Testing of individual controls is generally defined using the four readiness “C-Levels” with progress toward full compliance with each control noted as follows—
f C1—The security control has been fully implemented and the security profile achieved by the control is being actively maintained. Full compliance indicates that only minor IA deficiencies with a negligible impact on mission capabilities may be expected.

Measuring Cyber Security and Information Assurance State-of-the-Art Report (SOAR) 115
Section 7 Measurable Data
f C2—The IT organization is in the process of deploying or implementing the security control. This level of compliance indicates that some IA deficiencies with a limited impact on mission capabilities may be expected.
f C3—The IT organization is aware of the control and is in a planning phase for compliance. This level of compliance indicates that significant IA deficiencies preventing the performance of some portions of required missions may be expected.
f C4—No awareness of the control or progress toward compliance is evident. This level of compliance indicates that major IA deficiencies that preclude satisfactory mission accomplishment may be expected.
7.6.4 Risk Measures from Event-Driven Security ProductsVendors of IDSs, IPSs, data leakage detection systems, anomaly detection systems, firewalls, and other event-driven security products often collect and generate CS/IA measures pertaining to—
f The findings of their systems—e.g., quantification and severity rankings of detected security incidents or violations;
f Potential response(s) to those findings—Including level of risk associated with various automatic and administrator responses, such as automatic blocking of anomalous traffic, or administrator shutdown of firewall monitoring of certain Internet ports/protocols/IP addresses.
Cisco’s Security Manager, for example, generates measures indicating the level of risk (ranked from 1 to 100) associated with the configuration setting of each of the system’s Event Action Filters. This risk rating is informed, to a degree, by the attack relevance rating or threat rating that Cisco uses to quantify the significance of various attacks to a particular event action filter. Security Manager also generates measures for the perceived value of the target being protected/monitored; in this case, system rankings are qualitative rather than quantitative (i.e., “low,” “medium,” “high,” “mission critical”). In most cases, these measures are intended to assist the administrator in decision-making when configuring the product or responding to its output.
7.7 Measures Categorization and Taxonomy Efforts
“The arguments over metrics are overstated, but to the extent they are contentious, it is because ‘metrics’ means different things to different people. For some people, who take a risk-centric view of security, metrics are about estimating risk based on a model…For those with an IT operations background, metrics are what you get when you

Measuring Cyber Security and Information Assurance State-of-the-Art Report (SOAR)116
Section 7 Measurable Data
measure ongoing activities…And there is a third camp that feels metrics should be all about financial measures…” [153]
Along with the numerous efforts to define CS/IA measures of various sorts, there have been a number of efforts to categorize or, more formally, taxonomize, the various types of CS/IA measures that can be collected.
Several attempts have been made to define taxonomies of CS/IA measures categories. Some of these taxonomies are extremely simple, while others are extensive and “deep” in terms of levels of hierarchy. What all these taxonomies share is a categorization that accommodates both technical and non-technical measures.
A few of these taxonomies are said by their creators to have been derived from, based upon, or inspired by the implied taxonomy is CS/IA measures proposed at the 2001 WISSSR Workshop.
7.7.1 WISSSR StructureParticipants in the WISSSR Workshop elected to structure their discussion around certain aspects of information security. As a result, this subject matter fell into a categorization that has been interpreted by some of the WISSSR attendees, and others who later read about the outcomes of the workshop, as an implied taxonomy for CS/IA measures—an implied taxonomy that has, in fact, formed the basis for some of the taxonomies described below. The subject matter addressed in the WISSSR Workshop fell into two main categories, as shown in Table 7-6.
Table 7-6 WISSSR Measures
Group Measures Description Additional Information
Organizational Security
IA Program Developmental
Measures the extent to which an organization has effectively implemented IA policies and processes
f Policy Management f Process Maturity
Support Measures the organization’s support for security programs and processes
f Personnel f Resource Support
Operational Measures the organization’s operational readiness and effectiveness in providing IA
f Management and Technical Readiness
f Operational Practice f Operational Environment
Effectiveness Measure how effective the organization’s IA program is in actually providing “defense-in-depth assurance”
f N/A

Measuring Cyber Security and Information Assurance State-of-the-Art Report (SOAR) 117
Section 7 Measurable Data
Group Measures Description Additional Information
Technical Target of Assessment (TTOA)
Strength Assessment
Measures the strength of the TTOA in terms of its features when used under normal circumstances and under abnormal circumstances, such as attacks and denial of service
f Work Factor f Survivability
Weakness Assessment
Measures the susceptibility of the TTOA to threats, vulnerabilities, risks, and anticipated losses in the face of attack, and any operational limitations
f Risk f Operational Limitation
7.7.2 NIST Types of MeasuresNIST SP 800-55 Rev. 1 provides an informal taxonomy in Section 3.3,
“Types of Measures.” The publication identifies three categories of measures shown in Table 7-7.
Table 7-7 NIST Types of Measures
Categories of Measures Examples of Measures
Implementation measures—Used to demonstrate the organization’s progress in implementing information security programs, specific security controls, security of system-level areas, and policies and procedures associated with any of these.
f Percentage of information systems with approved system security plans
f Percentage of information systems with password policies that are configured as required
f Percentage of servers in a system that have been configured to conform with a standard configuration
f Percentage of assets identified and prioritized as critical
f Existence of documented assurance objectives
Effectiveness/Efficiency measures—Used to determine whether program-level processes and system-level security controls have been implemented correctly, operate as intended, and achieve their intended (desired) outcomes. Effectiveness/efficiency measures reflect two aspects of the results of security control implementation: the robustness of the result itself (i.e., its effectiveness), and the timeliness of the result (i.e., its efficiency).
Examples of effectiveness measures— f Percentage of information security incidents caused by improperly-configured access controls,
f Percentage of unexpected and unwarranted events that have been registered.
Examples of efficiency measures are— f Percentage of system components that undergo maintenance on schedule
f Length of time it took to react to an incident (speed of incident response)
f Length of time it took to regain full operational capacity after unscheduled downtime

Measuring Cyber Security and Information Assurance State-of-the-Art Report (SOAR)118
Section 7 Measurable Data
Categories of Measures Examples of Measures
Impact measures—Articulate the impact (i.e., business or mission impact) of information security on the organization’s ability to accomplish its mission. Depending on the organization’s mission, impact measures may quantify such factors as—
f Cost savings that result from the information security f Cost of response per incident f Costs incurred by addressing security incidents f Degree of public trust gained or maintained by the information security program
f Variance between planned and actual spending on IA training
f Return on investment on costs of security protections/countermeasures vs. expected losses from security exposures/compromises that would be possible if the target of attack were not protected
f Any other mission-related impact of information security
f Percentage of the agency’s IT budget devoted to security f Number of information security investments reported to OMB in an Exhibit 300
7.7.3 I3P Taxonomy of Security Metrics for Process Control Systems [154]The purpose of the Institute for Information Infrastructure Protection (13P) taxonomy is to categorize measurement of security of process control systems, e.g., SCADA systems. The developers of this taxonomy used as a starting point three implied IA metrics taxonomies—
f Categorization of CS/IA measurement subject matter at the WISSSR; f Control objectives in ISO/IEC 17799, Information technology – Security
techniques – Code of practice for information security management; f Categories of technologies in American National Standards Institute
(ANSI)/International Society of Automation (ISA)-TR99.00.01-2004, Security Technologies for Manufacturing and Control Systems.
The I3P taxonomy divides metrics into the three categories: (1) Organizational, (2) Operational, and (3) Technical—then adds two further categories to capture security controls designated in ISO/IEC 17799 and ANSI/ISA-TR99.00.01-2004. The taxonomists suggest that the following measurable aspects of an information security activity or system can be mapped to measures in one or more of the five high-level categories, as depicted in Table 7-8.

Measuring Cyber Security and Information Assurance State-of-the-Art Report (SOAR) 119
Section 7 Measurable Data
Table 7-8 Mapping of Measurable Security Elements to Metrics Categories
ISO
/IEC
177
99
ISA
TR
99.1
Org
aniz
atio
nal M
etric
s
Ope
ratio
nal M
etric
s
Tech
nica
l Met
rics
Security Policy 4 4 4
Vulnerability and Risk Assessment 4 4
Organizational Security 4 4
Asset Clarification and Control 4 4 4
Personnel Security 4 4 4
Physical and Environmental Security 4 4 4
Communications and Operations Management 4 4
Access Control 4 4 4
Systems Development and Maintenance 4 4 4
Business Continuity Management 4 4 4
Compliance 4 4
I3P had not, at the time of proposing its taxonomy, defined a more complete hierarchy of metrics categories and subcategories, nor had it populated its proposed taxonomy. The I3P researchers had, however, identified an extensive list of potential sources for such metrics, and categorized these within the first three categories of their taxonomy; they had also surveyed and evaluated the potential usefulness of the metrics in each source for measuring security attributes of process control systems.
In doing this survey, the researchers actually implied a more complete taxonomy of relevant security metrics than is indicated by their formally proposed taxonomy. Table 7-9 depicts that implied taxonomy of security metrics.

Measuring Cyber Security and Information Assurance State-of-the-Art Report (SOAR)120
Section 7 Measurable Data
Table 7-9 I3P Taxonomy of Security Metrics for Process Control Systems
Metric Group Metrics Sub Metrics Description/Examples
Organizational Security Program
Security Process
Security Program Maturity
Operational Operational Readiness/Security Posture
Measures used in Risk Management
Security Performance f Reflect current/recent system behavior
Compliance
Risk f Describe the threat environment
f Support the incident response
f Support vulnerability management
Security Relevant
Technical Technology Security Standards, such as the Common Criteria
Other Security Products/Services
Technical Measures of Risk, such as those generated from DREAD or through implementation OUST
Process Control System-specific
f Sandia National Laboratories Framework for SCADA Security Policy
f NIST’s emerging definition of SCADA security controls, based on NIST SP 800-53
f NERC Cyber Security Standards CIP-002 through CIP-009
7.7.4 Department of Public Safety and Emergency Preparedness Canada Taxonomy [155]This CS/IA measures taxonomy was defined for the Department of Public Safety and Emergency Preparedness to measure results of network assessments. Its measures fall into three categories, with the same three sub-categories within each category, as illustrated in Table 7-10.

Measuring Cyber Security and Information Assurance State-of-the-Art Report (SOAR) 121
Section 7 Measurable Data
Table 7-10 Department of Public Safety and Emergency Preparedness Taxonomy
Security Metrics Quality of Service Metrics Availability Metrics
Technical
Organizational
Operational
Technical
Organizational
Operational
Technical
Organizational
Operational
7.7.5 VTT Technical Research Centre of Finland Security Metrics Taxonomy for R&D Organizations [156]Researchers at the Valtion Teknillinen Tutkimuskeskus (Government Technical Research Center)—commonly known as the VTT Technical Research Centre—in Otaniemi, Finland, proposed another taxonomy, intended to “bridge the gaps between business management, information security management, and information and communication technology product security measurement practices.” The proposed taxonomy is shown in Table 7-11.
Table 7-11 VTT Technical Research Centre of Finland Security Metrics Taxonomy for R&D
Metric Group Metrics Sub Metrics Description
Business Level Security
Security metrics for cost- benefit analysis
Trust metrics for business collaboration
Security metrics for business-level risk management
Security metrics for organization’s Information Security Management (ISM)
Management Security f ISM Process f ISM-level risk management
f Resource and awareness management
Operational Security f Susceptibility of operational controls
f Effectiveness of operational controls
f Reflect current/recent system behavior
Information System Technical Security
f Technical Security f Dependability f Trust f Technical Control, including logs/audit trails

Measuring Cyber Security and Information Assurance State-of-the-Art Report (SOAR)122
Section 7 Measurable Data
Metric Group Metrics Sub Metrics Description
Security, Dependability, and Trust Metrics for Products, Systems, and Services
Product/System/Service Life Cycle Management
f System conception f System design f System realization f System service
Product/System/Service Security Rating or Assurance
f Evaluation f Testing f Verification f Certification
Product/System/Service Security Engineering
f System-level technical security solution
f Software/hardware platform design-level technical security solution
f Application design-level technical security solution
f Network design-level technical security solution
f Software/hardware platform implementation-level technical security solution
f Application implementation-level technical security solution metrics
f Network implementation-level technical security solution
f System-level technical risk management
7.7.6 Daniel Geer’s Balanced Scorecard-based TaxonomyIn his tutorial Measuring Security, [157] IA metrics expert Daniel Geer suggests a taxonomy based on the four corners of a balanced scorecard:
1. Financial vs. Security,2. Internal Business Process vs. Security,3. Learning and Growth vs. Security,4. Customer vs. Security.
Geer then provides examples of metrics that might fall under each of the four categories in Table 7-12.

Measuring Cyber Security and Information Assurance State-of-the-Art Report (SOAR) 123
Section 7 Measurable Data
Table 7-12 Daniel Geer’s Balanced Scorecard Taxonomy with Sample Metrics
Aspects to be Compared Based on Metrics Metrics to Use for Comparison
Financial vs. Security f Cost of security per transaction f Denial of service and other attack-related downtimes f Data flow per transaction and per source f Budget correlation with risk measures f Comparison with similar organizations
Internal Business Process vs. Security
f Percentage of critical systems addressed in disaster recovery plan f Percentage of systems obeying Policy X f Mean Time-Between-Failure (MTBF) and Mean Time-To-Repair (MTTR) for security incidents
f Number of security team consultations f Latency to address X [quantity] change orders
Learning and Growth vs. Security
f Percentage of job reviews involving security f Percentage of security workers with training f Ratio of business unit security staff to central staff f New system timely security consultations f Percentage of programs with budgeted security
Customer vs. Security f Percentage of Service Level Agreements with security standards f Percentage of tested external-facing applications f Number of non-employees with access f Percentage of data that is secure-by-default f Percentage of customer data residing outside the data center
7.8 Quantifying the Economic Value of Security and Assurance
“Metrics provide a mechanism to accurately measure the success of security initiatives and investments in the context of the business.” [158]
“Just about every security certification course (SANS, CISSP) talks about ALE, for reasons I cannot fathom…When we focus just on dollars, ALE, and ‘security ROI [Return on Investment],’ we make things too simple.” [159]
A key function of CS/IA measurement can be to quantify economic value of security, such as ROSI and other economic indicators. Through true measurement, monitoring, and verification, IA can be executed accurately, efficiently, and effectively, to create maximum value for every IA investment. CS/IA measurement can help answer the following questions—
f Are the demands of information security capital planning overwhelming?
f Does your organization have an overall strategy to fund information security investments?
f How do I know what to invest in to strengthen the agency’s security posture?
f Do your information security investments fail to deliver the benefits you anticipated?

Measuring Cyber Security and Information Assurance State-of-the-Art Report (SOAR)124
Section 7 Measurable Data
f How can I reasonably estimate information security benefits? f How can I communicate the value of my investments to
decision makers?
Karen Evans, OMB Administrator for Electronic Government and Information Technology, in testimony before the Committee on Government Reform, Subcommittee on Technology, Information Policy, Intergovernmental Relations, and the Census, stated—
“There continues to be a failure to adequately prioritize IT function decisions to ensure that remediation of significant security weaknesses are funded prior to proceeding with new development…Agencies must—1. Report security costs for IT investments;2. Document in their business cases that adequate security
controls have been incorporated into the lifecycle planning for each IT investment;
3. Reflect the agency’s security priorities as reported separately in their plans of action and milestones for fixing programs and systems found to have security vulnerabilities;
4. Tie those plans of action and milestones for an IT investment directly to the business case for that investment.” [160]
Ms. Evans’ comments echo the need to identify and justify the economic value of security through the use of CS/IA measurement. Information security investments should be rank-ordered against security criteria to create a prioritized investment strategy using CS/IA measurement. Once investments are prioritized, business cases can be developed to communicate their value to the agency. The value of the prioritized information security investments can then be communicated in management terms.
NIST SP 800-55 Rev. 1 refers to the value of security through the use of impact measures, which are used to articulate the impact of information security on an organization’s mission. For example, the percentage of the agency’s information system budget focused toward information security is a key indicator of the organization’s probability to protect its mission. Appendix A of NIST SP 800-55 Rev. 1 contains the detail for this CS/IA measure. The document’s measures creation process and implementation process facilitate the creation of more value-based and impact measures.
The ultimate value of security is typically measured through breaches, when the security fails or bypassed, and through the resulting economic fallout. Economic models can be applied to calculating the value of security versus the prior and theoretical cost of incidents.

Measuring Cyber Security and Information Assurance State-of-the-Art Report (SOAR) 125
Section 7 Measurable Data
The Burton Group recently published a paper on the measurement of IT’s business value. [161] The focus of the article is that IT metrics typically measure activities that are easy to measure, such as project completion, system defects, and operational uptime, but unsuccessfully measure the quality and usefulness of the information that IT systems produce for the business. The paper outlines suggestions for how IT leaders can use metrics to provide a more accurate view of the IT business value.
Another article, “An ounce of prevention vs. a pound of cure: how can we measure the value of IT security solutions?,” [162] focuses on how the integration of a company’s risk profile can be used to determine costs and benefits of IT security solutions. Two crucial concepts of the article are—
f Incident type—Refers to the various types of cyber incident that can happen to an organization;
f Bypass rate of a security solution—The rate at which an attack results in actual damage to the organization.
The article concluded by proposing to focus on the need for more risk-based structured cost-benefit methods for evaluating and comparing IT security solutions.
A study entitled, “The economic cost of publicly announced information security breaches: empirical evidence from the stock market,” [163] goes beyond just identifying the direct costs of breaches to examine the economic effect of information security breaches reported in newspapers or publicly traded US corporations—
“We find limited evidence of an overall negative stock market reaction to public announcements of information security breaches. However, further investigation reveals that the nature of the breach affects this result. We find a highly significant negative market reaction for information security breaches involving unauthorized access to confidential data, but no significant reaction when the breach does not involve confidential information. Thus, stock market participants appear to discriminate across types of breaches when assessing their economic impact on affected firms. These findings are consistent with the argument that the economic consequences of information security breaches vary according to the nature of the underlying assets affected by the breach.” [164]
Quantifying the return of information security investments through traditional ROI justification models is often challenging because these investments provide more benefits than just bottom-line savings. Information security investments do not always lend themselves to ROI calculations because they cannot always be quantified.

Measuring Cyber Security and Information Assurance State-of-the-Art Report (SOAR)126
Section 7 Measurable Data
Use of models and simulations can help qualitatively and quantitatively measure direct and indirect benefits by assessing the probability of program success, analyzing investment risks, and reasonably predicting outcomes, and focusing on certainty, rather than specificity to provide probability and ranges of outcomes.
The Economics and Security Resource Page [165] is dedicated to this topic and includes links to a number of key papers, conferences, the home pages of active researchers, relevant books, and other resources. These resources can assist in identifying and leveraging useful potential CS/IA measures.
For Further Reading
Ashish Arora, Dennis Hall, C. Ariel Pinto, Dwayne Ramsey, and Rahul Telang. “Measuring the Risk-Based Value of IT Security Solutions,” in IT Professional, Vol. 6, No. 6, Nov./Dec. 2004, pp. 35–42. Digital Object Identifier: 10.1109/MITP.2004.89 Accessed 7 April 2009 at: http://ieeexplore.ieee.org/Xplore/login.jsp?url=http%3A%2F%2Fieeexplore.ieee.org%2Fiel5%2F6294%2F30282%2F01390871.pdf&authDecision=-203
S. Chandra and R.A. Khan. “Object Oriented Software Security Estimation Life Cycle-Design Phase Perspective,” in Journal of Software Engineering, Volume 2 Issue 1, 2008, pp. 39–46. Accessed 13 April 2009 at: http://www.scialert.net/fulltext/?doi=jse.2008.39.46
Tony Coulson, Jake Zhu, and C.E. Tapie Rohm, California State University-San Bernardino, and Shan Miyuan, Hunan University-Changsha. “The Price of Security: The Challenge of Measuring Business Value Investments in Securing Information Systems,” in Communications of the IIMA, Volume 5, Issue 4, 2005. Accessed 25 March 2009 at: http://www.iima.org/CIIMA/8%205.4_Coulson_19_24.pdf
Tony Coulson, Jake Zhu, Kurt Collins, Walter Stewart, C.E. Tapie Rohm, Jr., California State University-San Bernardino. “Security: Valuing Increased Overhead Costs,” in Proceedings of the 10th Colloquium for Information Systems Security Education, Adelphi, MD, 5–8 June 2006. Accessed 25 March 2009 at: http://www.cisse.info/colloquia/cisse10/proceedings10/pdfs/papers/S05P03.pdf
Raph Levien. “Advogato’s trust metric,” 22 February 2000. Accessed 6 April 2009 at: http://www.advogato.org/trust-metric.html
Raph Levien. “Attack Resistant Trust Metric Metadata HOWTO,” 3 July 2002. Accessed 6 April 2009 at: http://www.levien.com/free/tmetric-HOWTO.html
Shaun Remnant. “Counting the cost of IT security,” in ITadviser, Issue 38, July/August 2005. Accessed 25 March 2009 at: http://www.nccmembership.co.uk/pooled/articles/BF_WEBART/view.asp?Q=BF_WEBART_171149
Stuart Edward Schechter. “Toward Econometric Models of the Security Risk from Remote Attack,” in IEEE Security & Privacy, Vol. 3, No. 1, January/February 2005, pp. 40–44. Digital Object Identifier: 10.1109/MSP.2005.30; Earlier version published in Proceedings of the Third Workshop on Economics and Information Security, Minneapolis, MN, May 2004, Accessed 25 March 2009 at: http://www.eecs.harvard.edu/~stuart/papers/eis04.pdf
Trustcomp Yahoo Group. “Welcome to Trustcomp.org!” Accessed 25 March 25, 2009 at: http://www.trustcomp.org

Measuring Cyber Security and Information Assurance State-of-the-Art Report (SOAR) 127
Section 7 Measurable Data
References125 Gary Hinson, IsecT Ltd. “Seven myths about information security metrics,” in ISSA Journal, July 2006.
Accessed 13 April 2009 at: http://www.noticebored.com/IsecT_paper_on_7_myths_of_infosec_metrics.pdf
126 Nadya Bartol. “IA Metrics—Why and How to Measure Goodness of Information Assurance.” Presented to ISSEA PSM User’s Group Conference, July 2005. Accessed 29 December 2008 at: http://www.psmsc.com/UG2005/Presentations/15_Bartol_IA_Metrics.pdf
127 Sandia National Laboratories. “IDART Red Team Metrics Quick Reference Sheet.” Accessed 6 January 2009 at: http://www.idart.sandia.gov/research.html
128 Michael J. Scroch, Sandia National Laboratories. “IORTA Red Team Metrics 101” (Incomplete Beta Version). Lecture slides for Information Operations Red Team and Assessments Training Program, 19 May 2005.
129 M.S. Ahmed, E. Al-Shaer, L. Khan. “A Novel Quantitative Approach For Measuring Network Security, INFOCOM 2008,” in The 27th Conference on Computer Communications. IEEE, April 2008 Page(s):1957–1965, Digital Object Identifier 10.1109/INFOCOM.2008.260. NIST National Vulnerability Database Web page. Accessed 25 March 25, 2009 at: http://ieeexplore.ieee.org/xpl/freeabs_all.jsp?arnumber=4509855
130 Glenn Fink and Brett Chappell, Naval Sea Systems Command (NAVSEA) Information Transfer Technology (ITT) Group, B30 Combat Systems Technology Division. “A Metrics-Based Approach to Intrusion Detection System Evaluation for Distributed Real-Time Systems.” Accessed 8 February 2009 at: http://people.cs.vt.edu/~finkga/ids/IDS-Briefing-09Apr02.ppt
131 Security Metrics, Inc. Accessed 12 February 2008 at: http://SecurityMetrics.com
132 Aladdin. “Attack Intelligence Research Center: Security Statistics.” Accessed 7 April 2009 at: http://www.aladdin.com/airc/security-statistics.aspx.
133 The MITRE Corporation. “Common Vulnerabilities and Exposures (CVE),” op cit.
134 The MITRE Corporation. “OVAL FAQ.” Accessed 3 February 2009 at: http://oval.mitre.org/oval/about/faqs.html#a16
135 Peter Mell and Karen Scarfone, NIST, and Sasha Romanosky, CMU. CVSS: A Complete Guide to the Common Vulnerability Scoring System Version 2.0. Accessed 29 January 2009 at: http://www.first.org/cvss/cvss-guide.pdf
136 Victor-Valeriu Patriciu, Iustin Priescu, and Sebastian Nicolaescu. “Security Metrics for Enterprise Information Systems,” in Journal of Applied Quantitative Methods (JAQM), Vol. 1, No. 2, Winter 2006. Accessed 6 January 2009 at: http://jaqm.ro/issues/volume-1,issue-2/pdfs/patriciu_priescu_nicolaescu.pdf
137 Chris Wysopal, Veracode, Inc. “Software Security Weakness Scoring.” Presented at MetriCon 2.0, Boston, Massachusetts, 7 August 2007. Accessed 16 February 2009 at: http://www.securitymetrics.org/content/attach/Metricon2.0/Wysopal-metricon2.0-software-weakness-scoring.ppt
138 Karen Scarfone and Peter Mell. The Common Configuration Scoring System (CCSS) (DRAFT), NIST Interagency Report 7502 (Draft), May 2008. Accessed 2 February 2009 at: http://csrc.nist.gov/publications/drafts/nistir-7502/Draft-NISTIR-7502.pdf
139 Elizabeth Van Ruitenbeek and Karen Scarfone. The Common Misuse Scoring System (CMSS) (DRAFT), NIST Interagency Report 7517 (Draft), February 2009. Accessed 26 March 2009 at: http://csrc.nist.gov/publications/drafts/nistir-7517/Draft-NISTIR-7517.pdf
140 National Cyber Security Division (Hosted by The MITRE Corporation.) “CWSS—Common Weakness Scoring System,” Common Weakness Enumeration. Accessed 6 April 2009 at: http://cwe.mitre.org/cwss/index.html
141 The MITRE Corporation. “Making Security Measurable.” Accessed 16 February 2009 at: http://measurablesecurity.mitre.org

Measuring Cyber Security and Information Assurance State-of-the-Art Report (SOAR)128
Section 7 Measurable Data
142 Edgar Sibley, George Mason University. “National Information Assurance Training Standard for System Administrators.” Lecture slides for course on IAVA, Summer 2008. Accessed 5 February 2009 at: http://mason.gmu.edu/~esibley/ISA562SU08/Slide/11%2520cont%25202%2520IAVA%2520.ppt
143 US-CERT. “Vulnerability Notes Database Field Descriptions.” Accessed 4 February 2009 at: http://www.kb.cert.org/vuls/html/fieldhelp
144 Robert Hudock. “Why Security Metrics Must Replace Traditional Risk Analysis Methodologies,” Computer Security Law, 6 March 2008. Accessed 19 January 2009 at: http://computersecuritylaw.us/2008/03/06/why-security-metrics-must-replace-traditional-risk-analysis-methodologies.aspx
145 Michael Chertoff, DHS Secretary. Speech at the George Washington University Homeland Security Policy Institute, 16 March 2005. Accessed 7 April 2009 at: http://www.dhs.gov/xnews/speeches/speech_0245.shtm
146 Darlene Goodwin, “NCDOC Garners Network Defense Accreditation Milestone,” in INFODOMAIN, Fall 2008, pg. 7. Accessed 11 May 2009 at: http://www.netwarcom.navy.mil/pao/infodomain/010-InfoDomain-Fall2008.pdf
147 NetIQ Corporation, Inc. “SCAP and FDCC.” Accessed 8 February 2009 at: http://www.netiq.com/solutions/regulatory/fdcc/default.asp
148 NIST NVD program. “Managing Security Risk by Using Common Security Configurations.” Accessed 8 February 2009 at: http://nvd.nist.gov/fdcc/faq-common_security_configurations.cfm
149 NIST. “Security Content Automation Protocol Validated Products.” Accessed 6 April 2009 at: http://nvd.nist.gov/scapproducts.cfm
150 NIST. “Security Content Automation Protocol (SCAP) Validation Program.” Accessed 6 April 2009 at: http://nvd.nist.gov/validation.cfm#fdcc_scanner
151 Ron Ross, Stu Katzke, Arnold Johnson, Marianne Swanson, Gary Stoneburner, and George Rogers. NIST. SP 800-53 Rev. 2, Recommended Security Controls for Federal Information Systems, December 2007. Accessed 3 April 2009 at: http://www.csrc.nist.gov
152 Defense Logistics Agency (DLA). “Certification and Accreditation: the DLA Approach.” Accessed 26 March 2009 at: http://csrc.nist.gov/groups/SMA/fasp/documents/c&a/DLABSP/DLABSP.htm
153 Christofer Hoff, Rational Security. “Take5 (Episode #6)—Five Questions for Andy Jaquith, Yankee Group Analyst and Metrician…,” Rational Survivability Blog, 13 September 2007. Accessed 29 January 2009 at: http://rationalsecurity.typepad.com/blog/2007/09/take5-episode-6.html
154 Described in M. Stoddard, et al. “An Initial Metrics Taxonomy,” in Process Control System Security Metrics—State of Practice, I3P Institute for Information Infrastructure Protection Research Report No. 1, August 2005. Accessed 19 January 2009 at: http://www.thei3p.org/docs/publications/ResearchReport1.pdf
155 Described in Nabil Seddigh, Peter Pieda, Ashraf Matrawy, Biswajit Nandy, John Lambadaris, and Adam Hatfield. “Current Trends and Advances in Information Assurance Metrics,” in Proceedings of Second Annual Conference on Privacy, Security, and Trust (PST 2004), Fredericton, NB, Canada, 13–15 October 2004. Accessed 19 January 2008 at: http://dev.hil.unb.ca/Texts/PST/pdf/seddigh.pdf
156 Described in: Reijo Savola, VTT Technical Research Centre of Finland. “A Novel Security Metrics Taxonomy for R&D Organisations,” in Proceedings of the Information Security South Africa (ISSA) 2008 Innovative Minds Conference, Johannesburg, South Africa, 7–9 July 2008. Accessed 2 January 2009 at: http://icsa.cs.up.ac.za/issa/2008/Proceedings/Full/2.pdf. Also described in Reijo M. Savola, VTT Technical Research Center of Finland. “Towards a Taxonomy for Information Security Metrics,” Proceedings of ACM Workshop on Quality of Protection (QoP ‘07), Alexandria, Virginia, 29 October 2007. DOI: http://doi.acm.org/10.1145/1314257.1314266
157 Daniel E Geer. Measuring Security, Version 2.1:16x07. Accessed 30 January 2009 at: http://geer.tinho.net/measuringsecurity.tutorial.pdf
158 Ayoub, Frost & Sullivan. “Analysis of Business Driven Metrics: Measuring for Security Value,” op cit.

Measuring Cyber Security and Information Assurance State-of-the-Art Report (SOAR) 129
Section 7 Measurable Data
159 Hoff, “Take5 (Episode #6)—Five Questions for Andy Jaquith, Yankee Group Analyst and Metrician…” op cit.
160 Karen Evans, OMB. Testimony before the Committee on Government Reform, Subcommittee on Technology, Information Policy, Intergovernmental Relations, and the Census, 16 March 2004. Accessed 22 January 2009 at: http://www.whitehouse.gov/omb/assets/omb/legislative/testimony/evans/karen_evans031604.pdf
161 Lyn Robison, The Burton Group. IT Metrics: Measuring IT’s Business Value, 27 February 2009. Accessed 13 March 2009 at https://www.burtongroup.com
162 Ashish Aroral, Dennis Hall, C. Ariel Pinto, Dwayne Ramsey, and Rahul Telang1. An ounce of prevention vs. a pound of cure: how can we measure the value of IT security solutions, 2004. Accessed 26 March 2009 at: http://www.osti.gov/energycitations/product.biblio.jsp?osti_id=842753
163 Katherine Campbell, Lawrence A. Gordon, Martin P. Loeb, and Lei Zhou. “The economic cost of publicly announced information security breaches: empirical evidence from the stock market,” in Journal of Computer Security Archive, Volume 11, Issue 3 (March 2003), Table of Contents IFIP 2000, Pages: 431 to 448, 2003, ISSN:0926-227X. Accessed 26 March 2009 at: http://portal.acm.org/citation.cfm?id=876669
164 Ibid.
165 Ross Anderson, University of Cambridge Computer Laboratory. “Economics and Security Resource Page.” Accessed 26 March 2009 at: http://www.cl.cam.ac.uk/~rja14/econsec.html

“Efficient measurement means automating metric production, consolidation, analysis and presentation.”
Robert Ayoub, Frost & Sullivan [166]
8Tools and Technologies

Measuring Cyber Security and Information Assurance State-of-the-Art Report (SOAR) 131
Section 8 Tools and Technologies
There is much information posted on the Web on the topics of IA measurement methodologies, lessons learned, sound measurement
practices, and examples. However, there is little public information regarding CS/IA measurement tools.
Few COTS software products are being marketed as CS/IA measurement tools, although some compliance and analytical tools note CS/IA measurement as a component of the tools’ functionality.
Most tools that serve this purpose are homegrown government off-the-shelf (GOTS) applications, using existing vendor technologies, created to meet organizations’ needs to respond to compliance legislation, such as FISMA, and other directives, such as the President’s Management Agenda (PMA). Examples and components of CS/IA measurement tools typically fall into the following four groups—
f Integration (frameworks/platforms), f Collection/storage, f Analysis/assessment, f Reporting.
When building or selecting a CS/IA measurement tool, it is important to perform requirements, gap, and selection processes to see which tool would best fit the organization or even to see if the organization already owns a tool that could be leveraged.
For CS/IA measurement tools to be successful, the following sound measurement practices should be considered—
f Tools and dashboards should be vetted through all appropriate approval channels.

Measuring Cyber Security and Information Assurance State-of-the-Art Report (SOAR)132
Section 8 Tools and Technologies
f Policy, procedures, and risk priorities should be used to derive measurable performance goals and objectives prior to selection and implementation of tools.
f Tools should allow CS/IA measures to be more quantitatively focused to increase the objectivity and validity of data.
f Tools should enable CS/IA measurement data to be easily collected, accessed, and stored.
f Tools and process should be repeatable with the ability to identify performance trends over time.
f Tools should display CS/IA measurement results in the appropriate format to the appropriate stakeholder level.
f Tools should enable CS/IA measures to be useful to stakeholders and yield information that is important in the decision-making process.
This section does not aim to provide a comprehensive view of the tools available for generating and processing CS/IA measures. Instead, it provides the reader with a sampling of tools that can serve as a starting point for any organization intending to acquire or deploy CS/IA measurement tools.
8.1 IntegrationFor CS/IA measures to be successful, some infrastructure should be leveraged for the integration, sharing, and publishing of CS/IA measurement results using tools like the ones identified in Table 8-1. CS/IA measurement data should be stored in a secure shared network space for appropriate protection.
Table 8-1 CS/IA Measurement Integration (Frameworks/Platforms) Tools
Name Description For More Information
Microsoft Sharepoint Browser-based collaboration and a document-management that provides a platform for CS/IA measures collection, sharing, and storage
http://www.microsoft.com/Sharepoint/default.mspx
Plumtree Portal Modular portal in which portlets can be used to store and display CS/IA measures
http://www.plumtree.com
Opensims Framework for linking open source tools together for security management into a common infrastructure with real-time CS/IA measures
http://www.opensims.org
Symbiot Security Risk Metrics Appliances—dynamic, real-time, interactive interface displaying CS/IA measurement output from its appliances used with virtually any Web browser on any platform
http://www.symbiot.com/riskmetricsolutions.html
OpenService Collects, stores, and scores CS/IA measures from a wide range of devices and events
http://www.openservice.com

Measuring Cyber Security and Information Assurance State-of-the-Art Report (SOAR) 133
Section 8 Tools and Technologies
Name Description For More Information
Intellitactics SAM Tool
Provides CS/IA measures that dynamically update with the enterprise specific data
http://www.intellitactics.com/int
NetIQ Risk and Compliance Center
Aligns CS/IA measures gathered from IT systems to demonstrate compliance with IT-related policies and regulations and displays them in a customizable dashboard
http://www.netiq.com/products/rcc/default.asp
Elemental Security, Inc.
Elemental Security Platform is integrated system for enterprise policy and risk management
http://www.elementalsecurity.com
8.2 Collection/StorageIt is common for organizations to be using Microsoft Excel or Access to collect and store CS/IA measurement data.
Table 8-2 lists examples of automated tools that emerged since 2000 to handle a variety of IA compliance activities. Though the tool examples described in Table 8-2 can perform additional functions, they are focused primarily on collection and storage of CS/IA data.
Table 8-2 CS/IA Measurement Collection/Storage Tools
Name Description For More Information
CSAM and ASSERT OMB Security Line of Business Solutions
Allow users to browse the catalog of security controls, display the controls in selected views, and export information from the database into a variety of popular data formats that may be needed for automated tool support
http://csrc.nist.gov/groups/SMA/fisma/support_tools.html
Trusted Agent FISMA (TAF)
Enables users to automate, document, and report information security performance through relational database and Web interfaces to demonstrate FISMA compliance
http://www.trustedintegration.com
Prosight This portfolio management software solution can be used to capture and track IA assets, and derive data that can be used to calculate CS/IA measures
http://www.primavera.com/products/prosight/index.asp
Splunk Enables compliance with explicit requirements to monitor, review, and retain audit trails; demonstrate compliance across all other information protection controls; and capture and retain IT data for extended periods, per NIST standards
http://www.splunk.com/article/2307
IBM/Tivoli TCIM’s FISMA Management Module maintains the security of federal information systems, and facilitates compliance with FISMA requirements by proactively monitoring access to sensitive data and reporting on IT security policy enforcement
http://www-01.ibm.com/support/docview.wss?uid=swg21300129

Measuring Cyber Security and Information Assurance State-of-the-Art Report (SOAR)134
Section 8 Tools and Technologies
Name Description For More Information
Telos/Xacta Enables continuous monitoring and managing information security risks, and automates and enforces processes for governance, risk, and compliance
http://www.telos.com/solutions/information%20assurance
MASE Consulting Ltd. Information Security Metrics Spreadsheets
Developed to record and track the Information Security (IS) Program measures listed in the Information Security Objectives and Metrics document, and detailed in the IS program strategy
http://www.maseconsulting.com/Metrics-Road-Map-s/6.htm
8.3 Analysis/AssessmentSecurity analysis and assessment tools are directed at a variety of capabilities, including finding vulnerabilities in networks and code, analysis of log-based data, assessing the overall status of CS/IA, evaluating IA risks, or IA compliance. Some of these analysis tools are described in Table 8-3.
Table 8-3 CS/IA Measurement Analysis and Assessment Tools
Name Description For More Information
Coverity Coverity offers a suite of tools to perform security analysis of software architecture, code and running applications. The Coverity Integrity Center can provide organization with measures based on the results of the Coverity suite to aid in determining the risk associated with their applications.
http://www.coverity.com/products/
Klocwork Insight Klocwork Insight performs source code analysis to identify vulnerabilities within an organization’s source code. Insight offers reporting capabilities that generate measures based on the results of the tool, including the number of vulnerabilities detected and fixed on the developers’ desktops, and comparisons of the number of defects over time.
http://www.klocwork.com/products/insight.asp
Ounce Suite Ounce Labs provides a suite of tools for scanning the source code of applications and providing measures based on the number and severity of vulnerabilities identified. The Ounce Portfolio Manger provides measures at an organizational level based on the results of Ounce Las Tools.
http://www.ouncelabs.com/products
Fortify Suite The Fortify suite of tools supports scanning the source code and performing run-time analysis of applications, allowing organizations to compare the health of their applications over time. Fortify offers a Web portal that organizations can use to disseminate the results from Fortify-based tools.
http://www.fortify.com/products/detect

Measuring Cyber Security and Information Assurance State-of-the-Art Report (SOAR) 135
Section 8 Tools and Technologies
Name Description For More Information
BogoSec BogoSec is an open source tool that scans code using three popular open source code scanning tools and generates security measures based on the results.
http://bogosec.sourceforge.net
MOPS MOPS is an example of a static (compile-time) analysis tool, which can check whether the program violates specified security properties. The security properties that MOPS checks are temporal, properties that are required to perform certain security-related operations in a certain order. While the primary function of these tools is not measures, the properties being checked are relevant to security and the data points can be used to populate a measure.
Hao Chen, Drew Dean, and David Wagner. “Model checking one million lines of C code,” Proceedings of the 11th Annual Network and Distributed System Security Symposium, 2004, pp 171–185. Accessed on 7 April 2009 at: http://www.cs.ucdavis.edu/~hchen/paper/ndss04.pdf
Daikon Daikon performs dynamic invariant detection, which runs a program, observes the values that the program computes, and then reports properties that were true over the observed executions. Dynamic invariant detection is a machine learning technique that can be applied to arbitrary data. The Daikon system detects invariants in code-based programs and in data sources. The output of the system has been used for predicting incompatibilities in component integration, generating test cases, repairing inconsistent data structures, and checking the validity of data streams, and could be seen as a data source for populating CS/IA measures.
Michael D. Ernst, Jeff H. Perkins, Philip J. Guo, Stephen McCamant, Carlos Pacheco, Matthew S. Tschantz, and Chen Xiao. “The Daikon system for dynamic detection of likely invariants.” Science of Computer Programming, vol. 69, no. 1–3, Dec. 2007, pp. 35–45.
Cenzic Hailstorm Cenzic Hailstorm performs a scan of organization’s Web applications to detect vulnerabilities. Organizations may generate reports from the tool that generate measures based on the results of Hailstorm scans over time and across multiple systems within an organization, providing a high level overview of the organization’s security posture.
http://www.cenzic.com/products/overview
HP WebInspect HP WebInspect performs a scan of organization’s Web applications to detect vulnerabilities. Organizations may generate reports from the tool that generate measures based on the results of WebInspect scans over time and across multiple systems within an organization, providing a high-level overview of the organization’s security posture.
https://h10078.www1.hp.com/cda/hpms/display/main/hpms_content.jsp?zn=bto&cp=1-11-201-200^9570_4000_100__
LogLogic Compliance Suites
Provides a real-time view of adherence to multiple regulations and standards using Log data
http://www.loglogic.com/products/compliance-management/compliance.php (accessed 25 March 2009)

Measuring Cyber Security and Information Assurance State-of-the-Art Report (SOAR)136
Section 8 Tools and Technologies
Name Description For More Information
The Bug Isolation Project
A research effort designed to monitor a collective of software applications, record behavior while they run, and report back how they work (or how they fail to work) in the hands of real end-users. The monitoring is transparent, low overhead with minimal impact on application behavior or performance, and the system is engineered to protect your privacy and ensure the security of the data collected. Data values and decisions within the application are scanned periodically and tested to see if unusual patterns are discovered. The instrumentation is not active all the time and turns on and off randomly while applications run. The approach is called statistical debugging, which is finding bugs in programs via automated statistical analysis instead of laborious manual inspection. This approach could be applied to security and also used as a data source for populating CS/IA measures.
Benjamin R Liblit. Cooperative Bug Isolation, University of California, Berkeley, PhD Thesis, December 2004
vsRisk vsRisk is a risk assessment tool that measures compliance against ISO 27001:2005, assessing confidentiality, integrity and availability for each of business, legal, and contractual aspects of information assets
http://www.itgovernance.co.uk/products/744
OCTAVE The Operationally Critical Threat, Asset, and Vulnerability Evaluation (OCTAVE) project provides tools, techniques and methods for performing security evaluations.
http://www.cert.org/octave
MSAT Microsoft Security Assessment Tool (MSAT) aids organizations in assessing the weaknesses in their current IT security environment. MSAT provides a Business Risk Profile (BRP) that measures the risks associated with their business while the Defense-in-Depth Index (DiDI) describes how the organization’s security measures are deployed. The tool uses this information to calculate risk.
http://technet.microsoft.com/en-us/security/cc185712.aspx
DISA IA Portal The DISA IA Portal provides access to IA assessment and analysis tools that are available throughout DoD, including anti-virus software, host-based security systems, compliance validation, and other tools.
http://iase.disa.mil/tools/index.html
Information Security Assessment Tool for State Agencies
The Assessment Tool for State Agencies aids agencies in determining the degree to which they have implemented an information security program or framework at the strategic level within their agency.
http://www.oispp.ca.gov/government/documents/docs/RA_Tool_State_Agencies.doc

Measuring Cyber Security and Information Assurance State-of-the-Art Report (SOAR) 137
Section 8 Tools and Technologies
Name Description For More Information
I3P Tools for Assessing SCADA/Control Systems Security
I3P developed a number of tools, including Risk-to-Mission Assessment Process (RiskMAP), PCS Security Technology Evaluation Tool (P-STET), 21 Steps Security Metrics Tool for performing security assessments of SCADA/Control System deployments. Their paper also identifies a number of commercially available assessment tools, including Control System Cyber Security Self Assessment Tool (CS2SAT), the I3P Security Metrics Starter Kit, the Skybox View Suite, and the ClearPoint Metrics Accelerator.
http://www.thei3p.org/docs/publications/ResearchReport12.pdf
CIS-CAT Center for Internet Security—Configuration Audit Tool (CIS-SAT) reports the configuration status of individual systems against to the configuration settings defined in CIS Benchmark XML files, which are available for a large number of operating systems and applications.
http://www.cisecurity.org/ngtoolmembers.html
VMinformer VMinformer assesses the security of VMware environments based on VMware’s security recommendations, the DISA STIG for VMware ESX Server, and the CIS VMware guide, providing organizations with an indication of how well their ESX deployment complies with these available best-practices.
http://www.vminformer.com
NRAT The Network Risk Assessment Tool (NRAT) is an analysis tool prototype developed through IATAC that considers the architecture, protection strategy, and attacks that a system may be affected by. NRAT assesses how attacks to the system would compromise the confidentiality, integrity and availability of the system and determines the effectiveness of the protections build into the information system.
http://iac.dtic.mil/iatac/download/Vol11_No1.pdf
8.4 ReportingCollected and stored CS/IA measurement data provide the information necessary to populate security dashboards and other reports enabling “near real-time” status monitoring of the organization’s security posture. When selecting dashboards formats, organizations should allow for information in the security repositories to be accessed, reused, displayed, and refreshed quickly and efficiently.
Examples of CS/IA measures reporting tools are described in Table 8-4.

Measuring Cyber Security and Information Assurance State-of-the-Art Report (SOAR)138
Section 8 Tools and Technologies
Table 8-4 CS/IA Measures Reporting Tools
Name Description For More Information
IBM/Cognos High-volume production reports, individual ad hoc queries, widely distributed business reports, and centrally authored reports with self-service customization that can be used to report CS/IA measures
http://www.cognos.com
Business Objects/Crystal Reports/Xcelsius
Complete report management solutions, and dynamic and customizable data visualization software to report CS/IA measures
http://www.businessobjects.com/product
Oracle/Hyperion Balanced scorecard collaborative certified application that helps companies clearly articulate strategy and goals
http://www.oracle.com/appserver/business-intelligence/hyperion-financial-performance-management/hyperion-performance-scorecard.html
Corda Real-time access to enterprise data, via performance dashboards from any location
http://www.corda.com
MicroStrategy Enterprise reporting engine with fully integrated reporting, analysis, and monitoring, allowing business users to interact with the tool and design reports in familiar and intuitive ways
http://www.microstrategy.com/Software/Products/Service_Modules/Report_Services
Clear Point Metrics Security Performance Manager is an integrated software and best practices content solution that enables IT and security executives and their teams to successfully measure, monitor, and communicate the state, quality, and effectiveness of their information security investments.
http://www.clearpointmetrics.com
Security Executive Council Performance Dashboard Tool
The Security Executive Council tool, available to members, aids in the presentation of measures data to senior management within an organization. Security program data is fed into a “dashboard dial” that provides indicators of success based on enterprise risk concerns.
https://www.securityexecutivecouncil.com/knowledge/index.html?mlc=507
Balanced Scorecard Designer
Security Metrics Balanced Scorecard is a tree of security metrics useful in designing an IT security measurement scorecard.
http://www.strategy2act.com/solutions/IT_security_metrics.htm
Dashboards are especially critical to CS/IA measurement programs as they are the visualization of the CS/IA measurement results.
Supporting evidence of security activities should also be collected, analyzed, and stored using the other activities documented in case of audit.
Security data and documentation produced from all planning, evaluation, and reporting activities should be maintained in a centralized repository. This coordinated recordkeeping enables security management, auditors, future assessment teams, and system owners to cross-reference raw and analyzed security data, findings, and subsequent mitigation

Measuring Cyber Security and Information Assurance State-of-the-Art Report (SOAR) 139
Section 8 Tools and Technologies
recommendations from the variety of sources creating such information. Such a repository mitigates the risks of “stove piping,” which risks data loss through scattered organization and duplicative data calls—
“Efficient measurement means automating metric production, consolidation, analysis and presentation. Dashboards provide a fast way to promote security measures, and easy to understand measurement can be quickly achieved using popular dashboard technology.” [167]
Robust security assessment and monitoring capabilities allow for greater access to data and more accurate reporting. Such capabilities provide the information necessary to populate security dashboards and other analytical tools. Mature programs have the capability to deliver these kinds of information, utilizing innovative and interactive security dashboards that can be published to multiple media formats in “near real-time.”
As the organization works to improve/maintain its security performance, a customized dashboard, tailored to organizational concerns as well as to FISMA baselines, allows the identification of areas that require work, improving the ability to properly allocate resources. Flexible dashboard technology provides the ability to rapidly transform any data into meaningful, visually intuitive, and interactive business intelligence.
The initial status contained in the dashboard should include all of the required FISMA/Privacy Act compliance measures along with any available security data necessary to respond to any request for status on an as required basis.
Figure 8-1 is a sample of interactive security dashboards that can be used to visualize CS/IA measures. [168]

Measuring Cyber Security and Information Assurance State-of-the-Art Report (SOAR)140
Section 8 Tools and Technologies
Figure 8-1 Security Dashboard Example [169]
References166 Robert Ayoub, Frost & Sullivan. “Analysis of Business Driven Metrics: Measuring for
Security Value,” in DM Review, March 2006. Accessed 10 December 2008 at: http://www.dmreview.com/white_papers/2290613-1.html (requires online registration to download)
167 Ayoub, Frost & Sullivan. “Analysis of Business Driven Metrics: Measuring for Security Value,” op cit.
168 Nadya Bartol and Brian Bates, Booz Allen Hamilton. “FISMA & beyond: Collection, analysis, and reporting on the status of information security at the executive level,” in Lessons Learned in Security Measurement, 27 December 2008. Annual Computer Security Applications Conference (ACSAC), December 2008. Accessed 7 April 2009 at: http://www.acsac.org/2008/program/case-studies/Bartol_Bates.pdf
169 Ibid.

Measuring Cyber Security and Information Assurance State-of-the-Art Report (SOAR) 141
Section 8 Tools and Technologies

“Managing the security of enterprise information systems has become a critical issue in the era of Internet economy. As with any other process, security can not be managed if it can not be measured. The need for metrics is important for assessing the current security status, to develop operational best practices, and also for guiding future security research.”
Victor-Valeriu Patriciu, et al., Military Technical Academy (Bucharest, Romania) [170]
9Recommendations

Measuring Cyber Security and Information Assurance State-of-the-Art Report (SOAR) 143
Section 9 Recommendations
This section identifies common expectations that exist in the CS/IA stakeholder community regarding the value that CS/IA measures
can provide. It also summarizes the gaps that were identified during the research conducted for this SOAR, and recommends several approaches for closing these gaps by either leveraging existing CS/IA measures techniques and approaches or through additional research.
9.1 Stakeholder ExpectationsAuthors of this report identified a number of stakeholder expectations that contribute to the mixed success of many CS/IA measurement efforts. These expectations center around the feasibility and expected value from CS/IA measurement efforts, based on the research conducted for this report and the authors’ experience implementing CS/IA measures for multiple federal and commercial organizations. Understanding these expectations and moving forward in addressing the expectations can help organizations embarking on CS/IA measurement efforts achieve success.
Common stakeholder expectations that present challenges for successful CS/IA measurement efforts are illustrated in Table 9-1.
Table 9-1 Common CS/IA Measurement Stakeholder Expectations
Common Expectation Associated Challenge
CS/IA measures are a finite effort that will be completed within a short time period.
CS/IA measures are most effective when they are a part of continual improvement efforts aimed at monitoring and improving IA status and posture long term.
Short-term expectations are counterproductive to CS/IA measures success.
Data to support CS/IA measures exist in the form that is conducive to measurement; therefore, minimal investment is required to collect the data.
To be useful, data supporting CS/IA measures need to be identified, collected, stored, and leveraged for analysis in specific formats that are rarely available from existing data sources.
Expectations of minimal changes to data collection and analysis processes will undermine the quality of data needed to support CS/IA measures and, therefore, undermine the ability of CS/IA measures to provide useful information for decision making.

Measuring Cyber Security and Information Assurance State-of-the-Art Report (SOAR)144
Section 9 Recommendations
Common Expectation Associated Challenge
Setting unrealistic goals for CS/IA measures, such as identifying outcome measures when an organization does not have mature IA processes, and sufficient data to support outcome measures. “How soon will I see the return from CS/IA measures?” is a common stakeholder question.
The gap between stakeholder expectations and what can realistically be delivered creates adverse conditions for CS/IA measures success.
Desire to automate measures to become self-calculating too early in the life cycle of CS/IA measurement program.
“How soon can I automate my measurement process?” is a common question. Automating measurement to self-calculate too early in the life cycle can be a counterproductive activity until measures have been tested, and been proven to be reliable and successful.
CS/IA measures need to be correctly designed with accurate data and thoroughly tested to trust the automated process to achieve the desired results.
Measures should help ensure the maximum ROI of CS/IA, and generate a timely return on their cost. Senior level executives typically want to leverage measures to measure ROI of their security programs.
A common hurdle in doing so is the lack of emphasis placed on the other foundational types of measures, such as implementation and efficiency/effectiveness.
Measuring impact or outcome is not usually a simple calculation and requires a mature measurement program to be in place before these measures can be produced with a high degree of accuracy.
These expectations can be managed and overcome by educating organizations on the success factors for CS/IA measurement, and by focusing on small successes, progressing toward identified long-term objectives.
9.2 Success FactorsA number of success factors are critical for meeting stakeholder expectations on what CS/IA measurement efforts will deliver. Understanding the following expectations and moving forward in addressing the expectations can help organizations embarking on CS/IA measurement efforts achieve success —
1. Management commitment is often the primary driver behind successful CS/IA measurement programs. Measurement programs have a higher rate of success when they are supported by a management commitment, combined with achievable expectations. As measurement programs are never “done,” and are a critical component in organizations’ efforts to improve information assurance, management commitment must be reaffirmed regularly to ensure continued success.
2. Availability of solid data is the second primary driver of successful CS/IA measurement programs. Without good data, measurement programs are unreliable and are not able to satisfy stakeholder expectations.
3. Easy to use measures that are easy to understand are a key success factor. Easy to use and understandable CS/IA measures require use of a common data collection, analysis, and reporting methodology; and the presence of aware and educated stakeholders who create, use,

Measuring Cyber Security and Information Assurance State-of-the-Art Report (SOAR) 145
Section 9 Recommendations
and refine these measures. Complex and cumbersome measures are often created when the reality of how the measures will be used or calculated is not properly considered early in the CS/IA measures development process.
4. Proactive and preventative measures that can be used to predict the future are challenging, because most measurement data is based in the recent past. The ability to proactively determine a course of action of prevent adverse events, based on CS/IA measures, depends on the organization’s ability to process and analyze CS/IA measurement data and extrapolate meaning.
Figure 9-1 shows the maturity path that should be followed to truly achieving the full benefits of CS/IA measurement.
Figure 9-1 Information Security Measurement Program Maturity Path [171]
Full
High
Medium
Low
Collection
Automation
Integral to
Business Processes
Low
Medium
High
Collection
Difficulty
In Standardized
Repository
Available
Can Be Collected
Non-Existent
Data
Availability
Self-Adjusting
Institutionalize
d
Stabilizing
Being Defined
Operating
Procedures
Self-Regenerating
Well Established
Defined and
Documented
Evolving
Processes
IT Security Goals
Implementation
Efficiency and
Effectiveness
Business
Impact

Measuring Cyber Security and Information Assurance State-of-the-Art Report (SOAR)146
Section 9 Recommendations
9.3 Methodology GapsCS/IA measurement efforts could benefit by addressing the following gaps—
1. Standardized set of minimum measures—Adopting a minimum tailorable set of measures that should be used as a starting point for CS/IA measurement efforts. Standardized statistics, like those for major sports, could be applied for this purpose and would generate a new level of interest in CS/IA measurement. New measures can and would be added over time, but the core list of measures could remain fixed if created in a fashion to surmount technology changes.
2. Number-driven risk measures “‘fundamentally broken’”—[172] As risk is an inherent and crucial component of CS/IA programs, this specific gap is thoroughly outlined in a recent article that described why numerical risk measures are no longer functioning as designed. Former National Cyber Security Division Director Amit Yoran is quoted in the article that—
“‘When you try to boil down complex network traffic into a traffic light or some number to present to management—which understands only traffic lights—you’re driving organizations toward bad metrics versus the task at hand,’ Yoran said. ‘We’re struggling to present number-driven metrics to people who struggle to understand all this complexity.’” [173]
By having organizations refocus energy on measuring the impact of data loss, versus a singular focus on systems or infrastructure security, organizations will be able to understand the impact and value of personally identifiable data, intellectual property or other business critical data.
3. Sustaining and maintaining CS/IA measurement efforts—The sustainability of a CS/IA measurement program is typically linked to the organization’s leadership. As long as a strong proponent of the program remains in charge, the CS/IA measurement program will be healthy. Maintenance is another aspect that can impact the health of measurement efforts. Stagnant measurement programs that are not refreshed on a continual basis are not operating at optimal performance. The CS/IA measurement maintenance plan should be documented as part of the organization’s SOPs and/or performance management plan.
4. Definitions and Vocabulary—The CS/IA industry is moving toward consensus for what CS/IA measures mean, including a common set of definitions and vocabulary. However, more work needs to be done to increase the level of consensus and common understanding among CS/IA practitioners. Broad agreement to adopt existing standards

Measuring Cyber Security and Information Assurance State-of-the-Art Report (SOAR) 147
Section 9 Recommendations
and definitions (i.e., NIST SP 800-55 Rev.1, ISO/IEC 27004, DHS SwA Framework) would provide much-needed consistency among a variety of CS/IA measurement efforts.
5. Combining existing approaches to create a solution—A number of approaches and measurement methodologies described in this SOAR can be used to facilitate progress in CS/IA measurement. None of these approaches is complete, but many have merit. Exploring the combination of existing approaches with additional features that have not yet been identified could help advance the progress in solving the puzzle of CS/IA measurement, and would help the community improve the quality of existing and emerging CS/IA measures implementations. Achieving consensus regarding common definition and broad awareness of existing measurement methodologies and solutions is key for addressing this gap.
6. Creating measures case studies that demonstrate how to roll up individual pieces of data into consistent executive-level measures—ISO/IEC 15939 and ISO/IEC 27004 provide useful models for rolling up individual data points to compose indicators that can be described in plain English for a variety of audiences. Using these models for creating examples that pertain to hard questions that can be answered by measurement will provide help for many in the industry who do not know how to start their CS/IA measurement efforts, as well as articulate dependencies among CS/IA activities that impact CS/IA posture.
9.4 Technology GapsBridging the technology gap is critical for achieving the next generation of stable CS/IA measures. Addressing the gaps discussed below would help improve the efficiency, effectiveness, and impact of CS/IA measures programs on improving CS/IA posture of systems and networks throughout the community—
1. Real-time and/or self-healing measures—Modern professionals thrive on instant feedback and immediate diagnostics. Providing real-time measures has been elusive in the CS/IA industry, except in heavily funded environments. “Self-healing” measures is a new term for measures that would cause an improvement action to be performed automatically, based on the current or projected value registered by an automated tool.
2. Improving commonality of data formats provided by the COTS vendors—Encouraging the industry to design and sell commercial products that collect and compile data in standard formats would be conducive to the creation and comparison of measures originating from different systems and organizations. Such solutions would facilitate flexible reporting that would provide CISA practitioners

Measuring Cyber Security and Information Assurance State-of-the-Art Report (SOAR)148
Section 9 Recommendations
increasingly useful insight into the state of systems and networks. The US Government and industry are moving in this direction through the SCAP program and other efforts. Further research as well as incentives are required to facilitate success in this area.
3. Investing in data modeling of CS/IA measures and measurable outcomes associated with CS/IA activities—Few organizations have sufficient resources to invest in long-term projects to test cause and effect theories about CS/IA that can be proven through measurement. For example, it appears that, after IA training, users would be more diligent in selecting better passwords (i.e., passwords that comply with the password policy and are more difficult to crack with a password cracker). Correlating the data from awareness training statistics, help desk calls, and password-cracking tools could prove or disprove this hypothesis. Many similar hypothesis require modeling to demonstrate what really works and what does not.
9.5 Knowledge Base GapsA number of actions that could help bridge the gaps listed in the previous three sections are focused on increasing the knowledge base of CS/IA measurement practitioners by—
1. Leveraging measurement expertise and lessons learned from other industries—Common expectations, challenges, and success factors, articulated in Sections 9.1 and 9.2, are not unique to the CS/IA industry. While many challenges are specific to CS/IA, many are of an organizational nature. Measurement experts in other industries have successfully managed and overcome many of these challenges. Knowledge that exists within other industries can increase the cost-effectiveness and success rate of CS/IA measurement efforts.
2. Creating a skilled/trained labor force dedicated to CS/IA measures—Building the CS/IA measurement knowledge base and resource pool is critical to the success of CS/IA measurement efforts. The current workforce is knowledgeable about IA or about measurement, but it is rare that both skill sets are present. Investing in training IA practitioners in measurement methods and techniques would increase cost-effectiveness and success ratio of current and future CS/IA measurement efforts.

Measuring Cyber Security and Information Assurance State-of-the-Art Report (SOAR) 149
Section 9 Recommendations
References170 Victor-Valeriu Patriciu, Iustin Priescu, and Sebastian Nicolaescu. “Security Metrics for Enterprise
Information Systems,” in Journal of Applied Quantitative Methods (JAQM), Vol. 1, No. 2, Winter 2006. Accessed 6 January 2009 at: http://jaqm.ro/issues/volume-1,issue-2/pdfs/patriciu_priescu_nicolaescu.pdf
171 Chew, et al. Performance Measurement Guide for Information Security, op cit.
172 Michael S. Mimoso, Editor. “Number-driven risk metrics ‘fundamentally broken’,” in Information Security, 12 March 2009. Accessed March 26, 2009 at: http://searchsecurity.techtarget.com/news/article/0,289142,sid14_gci1350658,00.html#
173 Ibid.

Measuring Cyber Security and Information Assurance State-of-the-Art Report (SOAR)150
AAbbreviations, Acronyms, and Definitions
Acronym DefinitionACSAC Annual Computer Security Applications ConferenceActSec Actual SecurityAES Advanced Encryption StandardAFCA Air Force Communication AgencyAFIT Air Force Information TechnologyAG Attack GroupALE Annualized Loss ExpectancyAMBER Assessing, Measuring, and Benchmarking ResilienceAmI Ambient IntelligenceANSI American National Standards InstituteARO Annualized Rate of OccurrenceARO Army Research OfficeARR Attack Relevance RatingAS&W Attack Sensing and WarningASVS Application Security Verification StandardAT/SPI Anti-Tamper/Software Protection InitiativeATO Authorization to OperateBAR Business Adjusted RiskBJS Bureau of Justice StatisticsBOF Birds of a Feather

Measuring Cyber Security and Information Assurance State-of-the-Art Report (SOAR) 151
Appendix A Abbreviations, Acronyms, and Definitions
BRM Business Reference ModelC&A Certification and AccreditationCAVP Cryptographic Algorithm Validation ProgramCC Common CriteriaCCE Common Configurations EnumerationCCSS Common Configurations Scoring SystemCHACS Center for High Assurance Computer SystemsCI/KR Critical Infrastructure and Key ResourcesCCTL Common Criteria Testing LaboratoriesCIO Chief Information OfficerCIP Critical Infrastructure ProtectionCIS Center for Internet SecurityCISO Chief Information Security OfficerCISWG Corporate Information Security Working GroupCJCSI Chairman of the Joint Chiefs of Staff InstructionCMM Capability Maturity ModelsCMMI Capability Maturity Model IntegrationCMSS Common Misuse Scoring SystemCMU Carnegie Mellon UniversityCMVP Cryptographic Module Validation ProgramCND Computer Network Defense CNDSP Computer Network Defense Service ProviderCNO Computer Network OperationsCNRS-LAAS Université de Toulouse Centre Nationale de la
Recherche Scientifique Laboratoire d’Analyse et d’Architecture Systemès
COTS Commercial Off the ShelfCPE Common Platform EnumerationCR/TA Critical Review/Technology AssessmentCS/IA Cyber Security and Information AssuranceCSIS Center for Secure Information SystemsCSO Chief Security OfficerCSR Critical Security RatingCSS Computer Security SurveyCVE Common Vulnerabilities and Exposures CVSS Common Vulnerabilities Common Scoring SystemCWE Common Weakness EnumerationCWSS Common Weakness Scoring SystemDARPA Defense Advanced Research Projects AgencyDEPEND Design and Validation of Reliable Networked SystemsDESEREC Dependability and Security by Enhanced ReConfigurabilityDHS Department of Homeland DIACAP Defense Information Assurance Certification and
Accreditation Process
Measuring Cyber Security and Information Assurance State-of-the-Art Report (SOAR)152
Appendix A Abbreviations, Acronyms, and Definitions
DIAP Defense-wide Information Assurance ProgramD-IART Defense-Information Assurance Red TeamDISA Defense Information Systems AgencyDITSCAP Defense Technology Security Certification
and AccreditationDLA Defense Logistics AgencyDoD Department of DefenseDON Department of NavyDON CIO Department of Navy Chief Information Officer DREAD Damage potential, Reproducibility, Exploitability,
Affected users, DiscoverabilityDRM Data Reference ModelDRM Digital Rights ManagementDSS Data Security StandardDTIC Defense Technical Information Center EAL Evaluation Assurance LevelsENST Telecom ParisTechEPRI Electric Power Research InstituteERIM Erasmus Research Institute of ManagementESOPE Evaluation de la Sécurité OperationnelleESM Evaluator’s Scoring MetricsEU European UnionFAQ Frequently Asked QuestionsFBI Federal Bureau of InvestigationFCD Final Committee DraftFDCC Federal Desktop Common ConfigurationFEA Federal Enterprise ArchitectureFIPS Federal Information Processing StandardFIRST Forum of Incident Response and Security TeamsFISMA Federal Information Security Management ActFITSAF Federal Information Technology Security
Assessment FrameworkFWP Sixth Framework ProgramFWP7 Seventh Framework ProgramGIAP GIG IA Portfolio programGMU George Mason UniversityGNOSC Global Network Operation and Security CenterGOTS Government Off the ShelfGP Generic PracticesGPRA Government Performance Results ActGQIM Goal, Question, Indicator, MethodologyHIPAA Health Insurance Portability and Accountability ActI3P Institute for Information Infrastructure Protection

Measuring Cyber Security and Information Assurance State-of-the-Art Report (SOAR) 153
Appendix A Abbreviations, Acronyms, and Definitions
IA Information AssuranceIA-CMM IA Capability Maturity ModelIAM INFOSEC Assessment MethodologyIASET Information Assurance Science and Engineering ToolsIASM Information Assurance and Security ManagementIATAC Information Assurance Technical Analysis Center IATRP INFOSEC Assurance Training and Rating ProgramIAVA Information Assurance Vulnerability AlertICT Information and Community TechnologiesIDART Information Design Assurance Red TeamIDS Intrusion Detection SystemsIEC International Electrotechnical CommissionIG Inspector GeneralINFOSEC Information SecurityINFRES Institut TELECOM Computer Science and
Networking DepartmentIORTA Information Operational Red Team AssessmentIPS Intrusion Protection SystemsIRC Information Security Research CouncilISA International Society of AutomationISECOM Institute for Security and Open MethodologiesISMS Information Security Management SystemsISO International Organization for StandardizationISOT Information Security and Object TechnologyISP Internet Service ProviderISSA Information Systems Security AssociationISSEA International System Security Engineering AssociationISSRR Information Security System Rating and RankingIT Information TechnologyITSEC Information Technology Security Evaluation CriteriaITUA Intrusion Tolerance by Unpredictable AdaptionJCIAC Joint Council on Information Age CrimeJMRR Joint Monthly Readiness ReportsJPL Jet Propulsion LaboratoryJQRR Joint Quarterly Readiness ReportsKGI Key Goal IndicatorsKPI Key Performance IndicatorsJTF-GNO Joint Task Force Global Network OperationsLC Loss ControlsLOE Level of EffortMcDiD Metrics and Controls for Defense-in-DepthMAIS Major Automated Information SystemsMDAP Major Defense Acquisition Programs

Measuring Cyber Security and Information Assurance State-of-the-Art Report (SOAR)154
Appendix A Abbreviations, Acronyms, and Definitions
METF Mean Effort to Security FailureMHS Military Health SystemMOA Memorandum of AgreementMSRAM Maritime Security Risk Analysis Model MTBF Mean Time-Between-FailureMTTR Mean Time-to-RepairNASA National Aeronautics and Space AdministrationNCSD National Cyber Security DivisionNCSS National Computer Security SurveyNDIA National Defense Industrial AssociationNII Network and Information IntegrationNIPP National Infrastructure Protection ProgramNIST National Institute of Standards and TechnologyNMCI Navy Marine Corps InternetNRL Naval Research LaboratoryNSA National Security AgencyNSF National Science FoundationNSTAC National Security Telecommunications Advisory CommitteeNVD National Vulnerabilities DatabaseOASD Office of the Assistant Secretary of DefenseOECD Organization for Economic Cooperation and
Development in EuropeOJP Office of Justice ProgramsOMB Office of Management and BudgetOpSec Operational SecurityOSD Office of the Secretary of DefenseOSSTMM Open Source Security Testing Methodology ManualOVAL Open Vulnerability and Assessment LanguageOVAL-ID Open Vulnerability and Assessment Language IdentifierOWASP Open Web Application Security Project PA Process AreasPEPA Performance Evaluation Process AlgebraPERFORM Performability Engineering Research GroupPLA Protection Level AgreementsPOA&M Plan of Action and MilestonesPP Protection ProfilePRM Performance Reference ModelPSM Practical Software and Systems Measurement
Support CenterQoS Quality of ServiceQUERIES Quantitative Evaluation of Risk for Investment
Efficient StrategiesRAI Resiliency Assurance Index

Measuring Cyber Security and Information Assurance State-of-the-Art Report (SOAR) 155
Appendix A Abbreviations, Acronyms, and Definitions
RASQ Relative Attack Surface QuotientRAV Risk Assessment ValueR&D Research and DevelopmentRDX R&D ExchangeReSIST Resilience for Survivability in IST ROI Return on Investment ROSI Return on Security InvestmentRTWF Red Team Work FactorSAMATE Software Assurance Metrics and Tool EvaluationSANS SysAdmin, Audit, Network, SecuritySCADA Supervisory Control and Data AcquisitionSCAP Secure Content Automation ProtocolSCARE Source Code Analysis Risk EvaluationSDLC Software Development Life CycleSEAS Structured Evidential Argumentation SystemSecLab Security LabSecMet Security Metrics ConsortiumSEPG Software Engineering Process GroupSERENITY System Engineering for Security and DependabilitySG Security GroupSIG Special Interest GroupsSLA Service Level AgreementSLE Single Loss ExpectancySM Security ManagementSOAR State of the Art Report SOP Standard Operational ProceduresSP Special Publication SPMO Security Project Management OfficersSPP Security and Privacy ProfileSQUALE Security, Safety, and Quality Evaluation for
Dependable SystemsSRD SAMATE Reference DatasetSRM Service-Component Reference ModelSSAA System Security Authorization AgreementSSE CMM System Security Engineering Capability Maturity ModelS&T Science and TechnologyST Security TargetST&E Security Test and EvaluationSTEM Security Testing and Engineering Using MetricsS-Vector Scoring VectorSwA Software Assurance (SwA)TA Technical AlertsTAF Trusted Agent FISMA

Measuring Cyber Security and Information Assurance State-of-the-Art Report (SOAR)156
Appendix A Abbreviations, Acronyms, and Definitions
TCSEC Trusted Computer System Evaluation CriteriaTMA TRICARE Management ActivityT-MAP Threat Modeling framework based on Attack Path AnalysisTOE Target of EvaluationTRM Technology Reference ModelTSABI Top Secret and Below InformationTSF Tolérance aux Fautes et Sûreté de Fonctionnement
InformatiqueTTOA Technical Target of Assessment UK United KingdomUML Unified Modeling LanguageUSAF United States Air ForceUS-CERT United States Computer Emergency Response TeamUSMC/MCNOSC United States Marine Corps/Marine Corps
Network Operations and Security CommandUSSTRATCOM/JTF-GNO United States Strategic Command/Joint Task Force
Global Network OperationsVA/RM Vulnerability Assessment/Risk ManagementVFT Value-Focused ThinkingVMS Vulnerability Management SystemVPN Virtual Private NetworkVTT Valtion Teknillinen TutkimuskeskusWISSSR Workshop on Information Security System
Scoring and RankingWG Working GroupXCCDF Extensible Configuration Checklist Description FormatYTD Year to Date

Measuring Cyber Security and Information Assurance State-of-the-Art Report (SOAR) 157
Appendix A Abbreviations, Acronyms, and Definitions

Measuring Cyber Security and Information Assurance State-of-the-Art Report (SOAR)158
BResources
B.1 Materials Used in Developing this SOARM.S. Ahmed, E. Al-Shaer, L. Khan. “A Novel Quantitative Approach For Measuring Network Security, INFOCOM 2008,” in The 27th Conference on Computer Communications. IEEE, April 2008 Page(s): 1957 – 1965, Digital Object Identifier 10.1109/INFOCOM.2008.260.
Aladdin Knowledge Systems Ltd. “Attack Intelligence Research Center: Security Statistics.” Accessed 7 April 2009 at: http://www.aladdin.com/airc/security-statistics.aspx
Dave Aland, Johns Hopkins APL (supporting OSD DOT&E Deputy Director of Naval and C4ISR Systems). “Metrics Lessons Learned from Conducting Operational Assessments of Networks,” in Proceedings
of the MORS Workshop on Transforming IA for Netcentric Operations: Providing Assured Information for National Security, Laurel, Maryland, March 2007. Accessed 10 December 2008 at: http://www.mors.org/meetings/2007_tia/pres/aland.pdf
John I. Alger. “On Assurance, Measures, and Metrics: Definitions and Approaches,” in Proceedings of the Workshop on Information Security System Scoring and Ranking Information System Security Attribute Quantification or Ordering (commonly but improperly known as Security Metrics), Williamsburg, Virginia, 21-23 May 2001 (commonly referred to as the Workshop on Information Security System Scoring and Ranking [WISSRR]). Accessed 8 April 2009 at: http://www.acsac.org/measurement/proceedings/wisssr1-proceedings.pdf
Ross Anderson, University of Cambridge Computer Laboratory. “Economics and Security Resource Page.” Accessed 26 March 2009 at: http://www.cl.cam.ac.uk/~rja14/econsec.html
Applied Computer Security Associates and The MITRE Corporation. Proceedings of the Workshop on Information Security System Scoring and Ranking Information System Security Attribute Quantification or Ordering (Commonly but improperly known as “Security Metrics”), Williamsburg, Virginia, 21-23 May 2001 (commonly referred to as the Workshop on Information Security System Scoring and Ranking [WISSRR]). Accessed 8 April 2009 at: http://www.acsac.org/measurement/proceedings/wisssr1-proceedings.pdf

Measuring Cyber Security and Information Assurance State-of-the-Art Report (SOAR) 159
Appendix B Resources
Army Global Network Operations and Security Center (GNOSC). Accessed 7 April 2009 at: https://gnosc.army.mil
Ashish Aroral, Dennis Hall, C. Ariel Pinto, Dwayne Ramsey, and Rahul Telang, Lawrence Berkeley National Laboratory. An ounce of prevention vs. a pound of cure: how can we measure the value of IT security solutions. Paper LBNL-54549, November 2004. Accessed 26 March 2009 at: http://repositories.cdlib.org/lbnl/LBNL-54549
-also-
13 April 2009 at: http://www.courant.nyu.edu/ComplexSystems/literature/Arora,etal.pdf
Robert Ayoub, Frost & Sullivan. “Analysis of Business Driven Metrics: Measuring for Security Value,” in DM Review, March 2006. Accessed 10 December 2008 at: http://www.dmreview.com/white_papers/2290613-1.html (requires online registration to download)
Nadya Bartol, Booz Allen Hamilton. “IA Metrics—Why and How to Measure Goodness of Information Assurance.” Presented to ISSEA Ninth Annual PSM Users’ Group Conference: Measurement in Support of System and Process Integrity, Keystone, Colorado, 18-22 July 2005. Accessed 29 December 2008 at: http://www.psmsc.com/UG2005/Presentations/15_Bartol_IA_Metrics.pdf
Nadya Bartol and Brian Bates, Booz Allen Hamilton. “FISMA and beyond: Collection, analysis, and reporting on the status of information security at the executive level,” in Proceedings of the 24th Annual Computer Security Applications Conference (ACSAC 24), Anaheim, California, 27 December 2008. Accessed 7 April 2009 at: http://www.acsac.org/2008/program/case-studies/Bartol_Bates.pdf
Nadya Bartol and Joyce Richardson. “Measuring Capability-Based Assurance,” in Proceedings of the Fifth Annual Information System Security Engineering Association (ISSEA) Conference, Arlington, Virginia, 13-15 October 2004
Lawrence E. Bassham III., NIST Information Technology Laboratory Computer Security Division. “Advanced Encryption Standard Algorithm Evaluation Suite (AESAVS).” 15 November 2002. Accessed 4 February 2009 at: http://csrc.nist.gov/groups/STM/cavp/documents/aes/AESAVS.pdf
Jennifer L. Bayuk. “Information Security Metrics: An Audited-based Approach.” NIST and CSSPAB Workshop, Washington, D.C., 14 June 2000.
Steven M. Bellovin, Columbia University. “On the Brittleness of Software and the Infeasibility of Security Metrics.” Keynote presentation at Metricon 1.0, Vancouver, BC, Canada, 1 August 2006 (slides revised 21 November 2006). Accessed 10 December 2008 at: http://www.cs.columbia.edu/~smb/talks/brittle-metricon.pdf
-also-
Original version, accessed 7 January 2009 at: http://www.securitymetrics.org/content/Wiki.jsp?page=Metricon1.0Keynote#section-Metricon1.0Keynote-OnTheBrittlenessOfSoftwareAndTheInfeasibilityOfSecurityMetricsStevenBellovinColumbiaUniversity
Scott Berinato. “A Few Good Metrics,” in CSO Magazine, 1 July 2005. Accessed 13 April 2009 at: http://www.csoonline.com/article/220462/A_Few_Good_Information_Security_Metrics
Paul Bicknell. “Security Assertions, Criteria and Metrics Developed for the IRS,” MITRE Technical Report, May 2001. Accessed 13 April 2009 at: http://www.mitre.org/work/tech_papers/tech_papers_01/bicknell_security/index.html
D.J. Bodeau, “Information assurance assessment: Lessons-learned and challenges,” in Proceedings of the 1st Workshop on Information-Security-System Rating and Ranking (WISSSR), Williamsburg, Virginia, 21-23 May 2001. Full proceedings accessed 13 April 2009 at: http://www.acsac.org/measurement/proceedings/wisssr1-proceedings.pdf
BNET Business Wire. “CIOview Delivers SecurityNOW!: Provides Financial Transparency for IT Security; Increases Security Auditor Productivity 90%,” 14 September 2004. Accessed 30 January 2009 at: http://findarticles.com/p/articles/mi_m0EIN/is_/ai_n6193303

Measuring Cyber Security and Information Assurance State-of-the-Art Report (SOAR)160
Appendix B Resources
Pauline Bowen, Joan Hash, and Mark Wilson. NIST Special Publication 800-100, Information Security Handbook: A Guide for Managers, October 2006. Accessed 13 April 2009 at: http://csrc.nist.gov/publications/nistpubs/800-100/SP800-100-Mar07-2007.pdf
W. Krag Brotby, IT Governance Institute. Information Security Governance: Guidance for Boards of Directors and Executive Management, 2nd Edition. (Rolling Meadows, Ilinois: ISACA, 2006).
Adam R. Bryant, Capt. USAF. Developing a Framework for Evaluating Organizational Information Assurance Metrics Programs. Master of Science Thesis for Air Force Institute of Technology. AFIT/GIR/ENV/07-M5, March 2007. Accessed 11 December 2008 at: https://www.afresearch.org/skins/rims/q_mod_be0e99f3-fc56-4ccb-8dfe-670c0822a153/q_act_downloadpaper/q_obj_217f0dc1-baf2-47c8-a458-60956d23bc05/display.aspx?rs=enginespage
Peter Burris and Chris King. “A Few Good Security Metrics.” METAGroup, Inc. audio, 11 Oct. 2000. URL: http://www.metagroup.com/metaview/mv0314/mv0314.html (10 July 2001).
Christian Byrnes, Gartner Group. “Security Metrics.” Podcast of presentation made to Gartner IT Security Summit, 4-6 June 2007.
Linda Tracy, Jamie K. Guevara, Oliver Harcourt, and Eric Stegman, The Gartner Group. IT Key Metrics Data 2008: Key Information Security Measures: Spending & Staffing Excluding Disaster Recovery, 10 December 2007.
George K Campbell. “Measures and Metrics in Corporate Security: Communicating Business Value.” CSO Executive Council, 2006. Accessed 13 April 2009 at: https://www.csoexecutivecouncil.com/content/Metrics_Mini_Update_060706.pdf
Katherine Campbell, Lawrence A. Gordon, Martin P. Loeb, and Lei Zhou. “The economic cost of publicly announced information security breaches: empirical evidence from the stock market,” in Journal of Computer Security Archive, Volume 11 Issue 3, March 2003, pp. 431-448.
CDT. “Evaluating DRM: Building a Marketplace for the Convergent World,” Version 1.0, September 2006. Accessed 19 January 2009 at: http://www.cdt.org/copyright/20060907drm.pdf
David A. Chapin and Steven Akridge. “How Can Security be Measured?,” in Information Systems Control Journal, Volume 2, 2005. http://www.isaca.org/Template.cfm?Section= Home&Template=/ ContentManagement/ContentDisplay.cfm&ContentID=24173. Also: http://www.isaca.org/Content/ContentGroups/Journal1/20058/How_Can_Security_Be_Measured_.htm
Hao Chen, Drew Dean, and David Wagner. “Model checking one million lines of C code,” in Proceedings of the 11th Annual Network and Distributed System Security Symposium, 2004, pp. 171—185. Accessed 7 April 2009 at: http://www.cs.ucdavis.edu/~hchen/paper/ndss04.pdf
Michael Chertoff, DHS Secretary. Speech at the George Washington University Homeland Security Policy Institute, 16 March 2005. Accessed 7 April 2009 at: http://www.dhs.gov/xnews/speeches/speech_0245.shtm
Elizabeth Chew, Marianne Swanson, Kevin Stine, Nadya Bartol, Anthony Brown, and Will Robinson. NIST SP 800-55 Rev. 1, Performance Measurement Guide for Information Security, July 2008. Accessed 13 April 2009 at: http://csrc.nist.gov/publications/nistpubs/800-55-Rev1/SP800-55-rev1.pdf
CIS. The CIS Security Metrics, May 2009.
K. Clark, J. Dawkins, and J. Hale. “Security Risk Metrics: Fusing Enterprise Objectives and Vulnerabilities,” in Proceedings of the 2005 IEEE Workshop on Information Assurance and Security, West Point, New York, 2005. Digital Object Identifier: 10.1109/IAW.2005.1495978.
CIO Council, Federal Information Architecture Program Management Office. FEA Security and Privacy Profile, Version 2.0, 1 June 2006. Accessed 9 April 2009 at: http://www.cio.gov/documents/Security_and_Privacy_Profile_v2.pdf
Vivian A. Cocca, OSD(NII). “DoD’s Approach to IA Metrics.” Presented at PSM Technical Working Group meeting, 23 March 2005. Accessed 28 December 2008 at: http://www.psmsc.com/Downloads/TWGMarch05/05_Cocca_DoD_Metrics_Initiative.pdf

Measuring Cyber Security and Information Assurance State-of-the-Art Report (SOAR) 161
Appendix B Resources
Center for Internet Security (CIS). “Security Metrics Initiative.” Accessed 13 April 2009 at: http://members.cisecurity.org/kb/category.php?id=24
CIS. The CIS Security Metrics, April 2009.
ComputerWorld Security Knowledge Center. “Security Statistics,” 9 July 2001. Accessed 7 April 2009 at: http://www.computerworld.com/securitytopics/security/story/0,10801,62002,00.html
Corporate Information Security Working Group. “Report of the Best Practices and Metrics Team,” 17 November 2004 (Revised 10 January 2005). Accessed 3 February 2009 at: http://infotech.aicpa.org/NR/rdonlyres/9C87179C-7F68-4EA0-8FA6-1B8A2EF2768A/0/CISWG_Report_of_best_practices_and_metrics_teams.pdf (also at: http://educause.edu/ir/library/pdf/CSD3661.pdf)
James P. Craft. “Metrics and the USAID Model Information Systems Security Program.” NIST and CSSPAB Workshop, Washington, DC, 14 June 2000.
CSO. “The Security Metrics Collection,” Security Leadership. 27 October 2008. Accessed 13 April 2009 at: http://www.csoonline.com/article/455463/The_Security_Metrics_Collection
Department of Public Safety and Emergency Preparedness Canada. “Information Assurance Metrics for Security, QoS, and Availability,” in Proceedings of the Second Annual Conference on Privacy, Security, Trust, New Brunswick, Canada, 13-15 October 2004. Accessed 11 December 2008 at: http://dev.hil.unb.ca/Texts/PST/pdf/seddigh.pdf
DHS. “Guidance for Developing Sector-Specific Plans as input to the National Infrastructure Protection Plan,” 2 April 2004. Accessed 4 February 2009 at: http://cees.tamiu.edu/covertheborder/TOOLS/SSAGuidance.pdf
Department of the Navy Chief Information Officer blog. Accessed 1 April 2009 at: http://www.doncio.navy.mil/tagresults.aspx?ID=28
Dreamland Technologies. “OSSTMM: measurable security.” Corporate brochure. Accessed 30 January 2009 at: http://www.dreamlab.net/download/documents/dlt_OSSTMM_engl.pdf
Cezar Drugescu and Rafael Etges. “Maximizing the Return on Investment of Information Security Programs: Program Governance and Metrics,” in Information Systems Security Journal, December 2006. Accessed 13 April 2009 at: http://www.ist-llc.com/joomla/pdfs/industry-articles/information-security-roi.pdf
Irene Eusgeld, Felix C. Freiling, and Ralf Reussner, Editors. Dependability Metrics: Advanced Lectures (specifically: Introduction to Section III, “Security Metrics”). (Berlin/Heidelberg, Germany: Springer-Verlag, 2008).
Karen Evans, OMB. Testimony on FISMA Reporting before the Committee on Government Reform, Subcommittee on Technology, Information Policy, Intergovernmental Relations, and the Census, 16 March 2004. Accessed 22 January 2009 at: http://www.whitehouse.gov/omb/assets/omb/legislative/testimony/evans/karen_evans031604.pdf
S. Evans, S. Bush, and J. Hershey. “Information Assurance through Kolmogorov Complexity,” in Proceedings of the DARPA Information Survivability Conference and Exposition II (DISCEX-II-2001), Anaheim, California, 12-14 June 2001. Accessed 13 April 2009 at: http://www.research.ge.com/~bushsf/ia/discex.pdf
Glenn Fink and Brett Chappell, Naval Sea Systems Command (NAVSEA) Information Transfer Technology (ITT) Group, B30 Combat Systems Technology Division. “A Metrics-Based Approach to Intrusion Detection System Evaluation for Distributed Real-Time Systems.” Accessed 8 February 2009 at: http://people.cs.vt.edu/~finkga/ids/IDS-Briefing-09Apr02.ppt
Federal Information Security Management Act of 2002 (FISMA), 44 USC. § 3541, et seq., enacted as Title III of the E-Government Act of 2002 (Pub.L. 107-347, 116 Stat. 2899). Accessed 13 April 2009 at: http://csrc.nist.gov/drivers/documents/FISMA-final.pdf
Diane Frank. “Agencies Seek Security Metrics,” in Federal Computer Week. 19 June 2000. URL: http://www.fcw.com/article70756 (16 June 2006).

Measuring Cyber Security and Information Assurance State-of-the-Art Report (SOAR)162
Appendix B Resources
Felix C. Freiling. “Introduction to Security Metrics,” in Dependability Metrics (Lecture Notes in Computer Science, Volume 4909/2008), pp. 129-132 (Berlin/Heidelberg, Germany: Springer-Verlag, 2008). Digital Object Identifier: 10.1007/978-3-540-68947-8
Daniel E Geer. “Measuring Security,” Version 2.1:16x07. Accessed 30 January 2009 at: http://geer.tinho.net/measuringsecurity.tutorial.pdf
Daniel Geer, Kevin Soo Hoo, and Andrew Jaquith. “Information security: Why the future belongs to the quants,” in IEEE Security and Privacy, Volume 1 Issue 4, July/August 2003, pp. 24-32. Digital Object Identifier: 10.1109/MSECP.2003.1219053
Larry Gordon, Ph.D. University of Maryland. “Empirical Research Related to Economic Aspects of Cyber/Information Security.” Accessed 15 April 2009 at: http://www.rhsmith.umd.edu/faculty/lgordon/cybersecurity/Gordon,%20Slides%20for%20Panel%20Presentation%20on%20Empirical%20Research%20at%20WESII,%20October%202006.ppt
Kelly J. Harris and Todd G. Shipley, SEARCH, The National Consortium for Justice Information and Statistics (for the US Department of Justice Office of Community Oriented Policing Services). Law Enforcement Tech Guide for Information Technology Security (specifically, Chapter 6,
“Phase IV - Measure Your Security Controls”), 2006. Accessed 13 April 2009 at: http://www.cops.usdoj.gov/files/RIC/Publications/e01071252_itsecurity.pdf
Todd Heberlein, Senthil Ebina, Melissa Danforth, and Tye Stallard, University of California at Davis. Attack Graphs: Identifying Critical Vulnerabilities within An Organization. Seminar presented by University of California-Davis Computer Security Lab, 10 March 2004. Accessed 6 February 2009 at: http://seclab.cs.ucdavis.edu/seminars/AttackGraphs.pdf
Arthur Hecker, TELECOMParisTech (ENST). “On System Security Metrics and the Definition Approaches,” in Proceedings of the Second International Conference on Emerging Security Information, Systems, and Technologies (SECUREWARE ’08), Cap Esterel, France, 23-31 August 2008, pp.412-419. DOI Bookmark: http://doi.ieeecomputersociety.org/10.1109/SECURWARE.2008.37
Debra S. Hermann, US Nuclear Regulatory Commission. Complete Guide to Security and Privacy Metrics (Boca Raton, Florida: Auerbach Publications, 2007).
S.O.S. Herrera. “Information security management metrics development,” in Proceedings of the 39th Annual 2005 International Carnahan Conference on Security Technology (CCST ’05), 11-14 October 2005, pp. 51-56 Digital Object Identifier: 10.1109/CCST.2005.1594818
Pete Herzog, ISECOM. “Calculating Risk Assessment Values.” ISECOM Whitepaper. Accessed 29 January 2009 at: http://isecom.securenetltd.com/RAVs.pdf
Gary Hinson, IsecT Ltd. “Seven myths about information security metrics,” in ISSA Journal, July 2006. Accessed 13 April 2009 at: http://www.noticebored.com/IsecT_paper_on_7_myths_of_infosec_metrics.pdf
Christofer Hoff, Rational Security. “Take5 (Episode #6) - Five Questions for Andy Jaquith, Yankee Group Analyst and Metrician....” Rational Survivability Blog, 13 September 2007. Accessed 29 January 2009 at: http://rationalsecurity.typepad.com/blog/2007/09/take5-episode-6.html
Michael Howard. “Attack Surface: Mitigate Security Risks by Minimizing the Code You Expose to Untrusted Users,” in MSDN Magazine, November 2004. Accessed 30 January 2009 at: http://msdn.microsoft.com/en-us/magazine/cc163882.aspx
Robert Hudock. “Why Security Metrics Must Replace Traditional Risk Analysis Methodologies,” in Computer Security Law, 6 March 2008. Accessed 19 January 2009 at: http://computersecuritylaw.us/2008/03/06/why-security-metrics-must-replace-traditional-risk-analysis-methodologies.aspx
A. Hunstad, J. Halberg, and R. Andersson, “Measuring IT security—a method based on common criteria’s security functional requirements,” in Proceedings of the Fifth IEEE Systems, Man and Cybernetics (SMC) Information Assurance Workshop, West Point, New York, 9-14 June 2004, pp. 226-233. Digital Object Identifier: 10.1109/IAW.2004.1437821

Measuring Cyber Security and Information Assurance State-of-the-Art Report (SOAR) 163
Appendix B Resources
IATAC. IAnewsletter, Volume 7 Number 3, Winter 2004. Accessed 2 February 2006 at: http://iac.dtic.mil/iatac/IA_newsletter.html
IATAC. IA Metrics Critical Review and Technology Assessment (CR/TA) Report, 2000. May be requested from .mil and .gov domains at: http://iac.dtic.mil/iatac/reports.jsp#CR/TA
IATAC. State-of-the-Art Report (SOAR): Software Security Assurance, 31 July 2007. Accessed 1 April 2009 at: http://iac.dtic.mil/iatac/download/security.pdf
INFOSEC Assurance Training and Rating Program. “INFOSEC Vulnerabilities Technical and Non-Technical Solutions.” Accessed 8 February 2009 at: http://www.iatrp.com/infosec.php
Information Technology Association of America. Federal Information Security Resources. Accessed 13 April 2009 at: http://www.itaa.org/policy/infosec/policy.cfm?ID=86.
ISACA. Accessed 10 February 2009 at: www.isaca.org
ISECOM. Open Source Security Testing Methodology Manual (OSSTMM). Accessed 2 April 2009 at: http://www.isecom.org/osstmm/
ISO/IEC 15408-1:2005(E), Information technology – Security techniques – Evaluation criteria for IT Security. May be downloaded at no cost from the Common Criteria Portal at: http://www.commoncriteriaportal.org/thecc.html (accessed 10 February 2009).
ISO/IEC 21827:2008, Information technology – Systems security engineering – Capability Maturity Model Capability Maturity Model® (SSE-CMM®). Accessed 1 April 2009 at: http://www.iso.org/iso/iso_catalogue/catalogue_tc/catalogue_detail.htm?csnumber=44716
ISSA, UK Chapter IT Advisory. “Is Security Awareness Wasted on End Users?” 13 March 2008, pg. 12. Accessed 29 January 2009 at: http://www.issa-uk.org/downloads/Security%2520awareness%2520presentation.pdf
Andrew Jaquith. Security Metrics: Replacing Fear, Uncertainty, and Doubt. (Indianapolis, IN: Addison-Wesley Professional, 2007).
JCIAC. “Computer-Related Crime Impact: Measuring the Incidence and Cost.” White Paper, January 2004. Accessed 25 March 2009 at: http://www.jciac.org/JCIAC%20docs/Computer-Related%20Crime%20Impact%20010904.pdf
Joe Jarzombek, Director for Software Assurance, National Cyber Security Division, DHS. “Considerations in Advancing the National Strategy in Cyberspace.” Presentation at DHS Software Assurance Measurement Workshop, 18 July 2006. Accessed 13 April 2009 at: http://www.psmsc.com/UG2006/Presentations/11_DHS_SwA_Overview_for_PSM.pdf
George Jelen. “SSE-CMM Security Metrics.” NIST and CSSPAB Workshop, Washington, D.C., 13-14 June 2000. URL: http://csrc.nist.gov/csspab/june13-15/jelen.pdf
(US Department of) Justice, Bureau of Justice Statistics. “National Computer Security Survey.” Accessed 10 March 2009 at: http://www.ojp.usdoj.gov/bjs/survey/ncss/ncss.htm
Erkan Kahraman, DSV SU/KTH, Institutionen for Data-och Systemvetenskap. Evaluating IT security performance with quantifiable metrics. Stockholm University and Royal Institute of Technology Master of Science Thesis, February 2005. Accessed 15 April 2009 at: http://www.dsv.su.se/en/seclab/pages/pdf-files/2005-x-245.pdf
Khalid Kark and Paul Stamp. “Defining an Effective Security Metrics Program,” 16 May 2007. Accessed 29 December 2008 at: http://www.scribd.com/doc/2935458/best-practices-defining-an-effective-security-metrics-program
Khalid Kark, Forrester Research. “Best Practices: Security Metrics,” July 22, 2008. Accessed 8 February 2009 at: http://www.forrester.com/Research/Document/Excerpt/0,7211,45787,00.html (Executive summary; full access to articles available only to Forrester Research clients.)

Measuring Cyber Security and Information Assurance State-of-the-Art Report (SOAR)164
Appendix B Resources
Khalid Kark and Chris McClean, Forrester Research. “The Forrester Wave: Security Consulting, Q3 2007,” 25 September 2007. Accessed 2 February 2009 at: http://www.wipro.com/analyst_reports/pdf/Forrester_Security_Consulting_Wave_07.pdf (Executive summary; full access to articles available only to Forrester Research clients.)
C.W. Kirkwood. Strategic Decision Making: Multiobjective Decision Analysis with Spreadsheets. (Belmont, California: Duxbury Press, 1997).
Abe Kleinfeld, nCircle. “Measuring Security,” in IT Backbones: Computer Security News, 28 November 2006. Accessed 15 April 2009 at: http://www.itbsecurity.com/pr/11424
Ahmet H. Koltuksuz, Izmir Institute of Technology. “On Defining Security Metrics for Information Systems,” in Proceedings of the International Conference of Computational Methods in Sciences and Engineering (ICCMSE 2005), Crete, Greece, 21-26 October 2005. Accessed 29 December 2008 at: http://wireless.iyte.edu.tr/documents/ahmetkoltuksuz_text.pdf
KoreLogic, Inc. “Information Security Metrics.” Presented to Central Virginia Chapter of ISSA, 11 October 2006. Accessed 15 April 2009 at: http://www.issa-centralva.org/documents/SecurityMetricISSA_101106.pdf
Clint Kreitner, CIS. “The CIS Security Metrics and Benchmarking Service.” Presented at Metricon 3.0, San Jose, California, 29 July 2008. Accessed 30 January 2009 at: http://www.securitymetrics.org/content/attach/Metricon3.0/metricon3-kreitner.pdf
B.S. Littlewood, et al. “Towards Operational Measures of Computer Security.” Accessed on 13 April 2009 at: http://www.csr.city.ac.uk/people/bev.littlewood/bl_public_papers/Measurement_of_security/Quantitative_security.pdf
Robert D. Materna and Peter S. Greis. Assessing the Value of Information Technology: Creating Value. (Dayton, Ohio: NCR Corporation Strategic Consulting Group, March 1992).
Johnny Mathisen. Measuring Information Security Awareness. Gjøvik University College Master of Science Thesis, 17 June 2004. Accessed 30 January 2009 at: http://www.dsv.su.se/en/seclab/pages/pdf-files/2005-x-213.pdf
Johnny Mathisen. “Measuring the effect of an information security awareness drive.” M.Sc. Project Plan, December 2003.
Dennis McCallam. “The case against numerical measures for information assurance,” in Proceedings of the First Workshop on Information Security System Rating and Ranking (WISSRR), Williamsburg, Virginia, 23 May 2001. Accessed 8 January 2009 at: http://www.seeeach.com/doc/189512_Position_Paper_The_Case_Against_Numerical_Measures_for_Information_. The entire WISSRR Proceedings can be downloaded from: http://www.acsac.org/measurement/proceedings/wisssr1-proceedings.pdf (Accessed 20 January 2009).
James McCurley, Software Engineering Institute; John Zebrow, Software Engineering Institute; and Carol Dekkers, Quality Plus Technologies, Inc. “Measures and Measurement for Secure Software Development.” Accessed 15 April 2009 at: https://buildsecurityin.us-cert.gov/daisy/bsi/articles/best-practices/measurement/227-BSI.html
John McHugh, “Quantitative measures of assurance: Prophecy, process, or pipedream?,” in Proceedings of the 1st ISSRR Workshop, ACSAC, May 2001.
John McHugh, Carnegie Mellon University Center for Survivable Systems. “Information Assurance Metrics: Prophecy, Process, or Pipedream?,” in Proceedings of the 23rd National Information Systems Security Conference, Baltimore, Maryland, 16-19 October 2000. Accessed 20 January 2009 at: http://csrc.nist.gov/nissc/2000/proceedings/papers/201.pdf
Miles McQueen, Wayne Boyer, Sean McBride, Marie Farrar, Zachary Tudor. Measurable Control System Security through Ideal Driven Technical Metrics, January 2008. Presented at SCADA Security Scientific Symposium, January 23, 2008. Accessed 6 April 2009 at: http://www.inl.gov/technicalpublications/Documents/3881671.pdf

Measuring Cyber Security and Information Assurance State-of-the-Art Report (SOAR) 165
Appendix B Resources
Peter Mell and Karen Scarfone, NIST, and Sasha Romanosky, CMU. CVSS: A Complete Guide to the Common Vulnerability Scoring System Version 2.0. Accessed 29 January 2009 at: http://www.first.org/cvss/cvss-guide.pdf
R.T. Mercuri, “Analyzing security costs,” in Communications of the ACM, Vol. 46, pp. 15 – 18, June 2003.
Metrics Center. Metrics Catalog Project. Accessed 5 February 2009 at: http://www.metricscenter.org (Log-in required)
Michael S. Mimoso, Editor. “Number-driven risk metrics ‘fundamentally broken’,” in Information Security, 12 March 2009. Accessed March 26, 2009 at: http://searchsecurity.techtarget.com/news/article/0,289142,sid14_gci1350658,00.html
securitymetrics.org. Metrics Catalog Project Page. Accessed 15 April 2009 at: http://www.securitymetrics.org/content/Wiki.jsp?page=MetricsCatalogProject
The MITRE Corporation. “Common Configuration Enumeration (CCE).” Accessed 26 March 2009 at: http://cce.mitre.org
The MITRE Corporation. “Common Platform Enumeration (CPE).” Accessed 26 March 2009 at: http://cpe.mitre.org
The MITRE Corporation. “Common Vulnerabilities and Exposures (CVE).” Accessed 26 March 2009 at: http://cve.mitre.org
The MITRE Corporation. “Making Security Measurable.” Accessed 16 February 2009 at: http://measurablesecurity.mitre.org/
The MITRE Corporation. “OVAL Open Vulnerability and Assessment Language.” Accessed 26 March 2009 at: http://oval.mitre.org
The MITRE Corporation. “OVAL FAQ.” Accessed 3 February 2009 at: http://oval.mitre.org/oval/about/faqs.html#a16
Mozilla Security Metrics Project. http://blog.mozilla.com/security/2008/07/02/mozilla-security-metrics-project/ (12/22/08)
John Murdoch, Computer Science Department, University of York. Security Measurement White Paper, 13 January 2006. Accessed 3 April 2009 at: http://www.psmsc.com/Downloads/TechnologyPapers/SecurityWhitePaper_v3.0.pdf
B. Nandy, P. Pieda, N. Seddigh, J. Lambadaris, A. Matrawy, and A. Hatfield. “Current Trends and Advances in Information Assurance Metrics.” Technical Report prepared for the Canadian Federal Government Department of Public Safety and Emergency Preparedness Office of Critical Infrastructure Protection and Emergency Preparedness (OCIPEP), March 2004. Accessed 15 April 2009 at: http://dev.hil.unb.ca/Texts/PST/pdf/seddigh.pdf
National Cyber Security Division (hosted by The MITRE Corporation.) “CWSS—Common Weakness Scoring System,” Common Weakness Enumeration. Accessed 6 April 2009 at: http://cwe.mitre.org/cwss/index.html
Native Intelligence, Inc. “Security Awareness Program Metrics.” Accessed 30 January 2009 at: http://www.nativeintelligence.com/ni-programs/ni-program-metrics-4pg.pdf
(Department of the) Navy. CHIPS - The Department of the Navy Information Technology Magazine. Accessed 2 April 2009 at: https://www.chips.navy.mil/archives/06_Jul/web_pages/FISMA.htm
David B. Nelson, NASA. “Performance Measures for Information Security: NASA Case Study,” in SecurIT, Spring 2002 (22 April 2002).
NetIQ Corporation, Inc. “SCAP and FDCC.” Accessed 8 February 2009 at: http://www.netiq.com/solutions/regulatory/fdcc/default.asp
Fran Nielsen. “Approaches to Security Metrics.” NIST and CSSPAB Workshop, Washington, D.C., 13-14 June 2000.
DLA. “Certification and Accreditation: the DLA Approach.” Accessed 26 March 2009 at: http://csrc.nist.gov/groups/SMA/fasp/documents/c&a/DLABSP/DLABSP.htm

Measuring Cyber Security and Information Assurance State-of-the-Art Report (SOAR)166
Appendix B Resources
NIST. “CND Data Strategy and Security Configuration Management.” September 2008. Accessed 26 March 2009 at: http://nvd.nist.gov/scap/docs/2008-conf-presentations/day1/CM-and-Data-Strategy-Brief-NIST-2008-SCAP-Conf-Final-Slides.pdf
NIST. “The Information Security Automation Program and The Security Content Automation Protocol.” Accessed 26 March 2009 at: http://nvd.nist.gov/scap.cfm
NIST. “National Vulnerability Database.” Accessed 25 March 2009 at http://nvd.nist.gov
NIST. “NIST Mission, Vision, Core Competencies, and Core Values.” Accessed 2 April 2009 at: http://www.nist.gov/public_affairs/nist_mission.htm
NIST. Security Requirements for Cryptographic Modules (Federal Information Processing Standards Publication [FIPS PUB] 140-2). 25 May 2001. Accessed 4 February 2009 at: http://csrc.nist.gov/publications/fips/fips140-2/fips1402.pdf
NIST. Security Requirements for Cryptographic Modules (FIPS PUB 140-3 (DRAFT); will supersede FIPS PUB 140-2, 2001 May 25). Accessed 9 February 2009 at: http://csrc.nist.gov/publications/fips/fips140-3/fips1403Draft.pdf
NIST. “NVD Common Vulnerability Scoring System Support v2.” Accessed 26 March 2009 at: http://nvd.nist.gov/cvss.cfm
NIST. “Security Content Automation Protocol Validated Products.” Accessed 6 April 2009 at: http://nvd.nist.gov/scapproducts.cfm
NIST. “Security Content Automation Protocol (SCAP) Validation Program.” Accessed 6 April 2009 at: http://nvd.nist.gov/validation.cfm#fdcc_scanner
NIST. “XCCDF - The Extensible Configuration Checklist Description Format.” Accessed 26 March 2009 at: http://nvd.nist.gov/xccdf.cfm
NIST NVD program. “Managing Security Risk by Using Common Security Configurations.” Accessed 8 February 2009 at: http://nvd.nist.gov/fdcc/faq-common_security_configurations.cfm
NIST SAMATE program. “Metrics and Measures.” Accessed 6 January 2009 at: https://samate.nist.gov/index.php/Metrics_and_Measures
NSTAC.“Research and Development (R&D) Exchange Workshop September 28 - September 29, 2000 Tulsa, Oklahoma.” Accessed 2 February 2009 at: http://www.ncs.gov/nstac/rd/nstac_rdexchange_ok.html
Arne R. Nygard. “Security Metrics in SCADA Networks.” Thesis proposal, 2003.
Arne R. Nygard. “Metrics for Software Resistance Against Trojan Horse Attacks.” Project proposal, Norwegian Information Security Laboratory, 2003.
OMB. “FY07 Budget Formulation: FEA Consolidated Reference Model Document,” Version 2.3, October 2007. Accessed 8 April 2009 at: http://www.whitehouse.gov/omb/assets/fea_docs/FEA_CRM_v23_Final_Oct_2007_Revised.pdf
OMB. “Fiscal Year 2007 Report to Congress on Implementation of The Federal Information Security Management Act of 2002.” Accessed 3 February 2009 at: http://www.whitehouse.gov/omb/inforeg/reports/2007_fisma_report.pdf
OMB Memorandum M-03-22, “OMB Guidance for Implementing the Privacy Provisions of the E-Government Act of 2002,” 26 September 2003. Accessed 15 April 2009 at: http://www.whitehouse.gov/omb/memoranda/m03-22.html
OSD DOT&E Deputy Director of Naval and C4ISR Systems. “Metrics Lessons Learned from Conducting Operational Assessments of Networks.” Accessed 11 December 2008 at: http://www.mors.org/meetings/2007_tia/pres/aland.pdf
OWASP. Accessed 25 March 2009 at: http://www.owasp.org/index.php/Main_Page

Measuring Cyber Security and Information Assurance State-of-the-Art Report (SOAR) 167
Appendix B Resources
OWASP. “OWASP Application Security Metrics Project.” Accessed 13 January 2008 at: http://www.owasp.org/index.php/Category:OWASP_Application_Security_Metrics_Project
OWASP. “Types of Application Security Metrics.” Accessed 15 April 2009 at: http://www.owasp.org/index.php/Types_of_application_security_metrics
J. Pamula, P. Ammann, S. Jajodia, George Mason University; and V. Swarup, The MITRE Corporation. “A weakest-adversary security metric for network configuration security analysis,” in Proceedings of the 2nd ACM Quality of Protection Workshop—Security Measurements and Metrics (QoP’06), Alexandria, Virginia, 30 October-3 November 2006. Accessed 15 April 2009 at: http://portal.acm.org/citation.cfm?id=1179494.1179502&coll=GUIDE&dl=GUIDE&type=series&idx=SERIES320&part=series&WantType=Proceedings&title=CCS&CFID=30508145&CFTOKEN=96888592
Victor-Valeriu Patriciu, Iustin Priescu, and Sebastian Nicolaescu. “Security Metrics for Enterprise Information Systems,” in Journal of Applied Quantitative Methods (JAQM), Vol. 1, No. 2, Winter 2006. Accessed 6 January 2009 at: http://jaqm.ro/issues/volume-1,issue-2/pdfs/patriciu_priescu_nicolaescu.pdf
Shirley C. Payne. “A Guide to Security Metrics,” in ISACA Newsletter, November 2006. Accessed 13 April 2009 at: http://www.sans.org/reading_room/whitepapers/auditing/a_guide_to_security_metrics_55?show=55.php&cat=auditing
Gunnar Peterson and Elizabeth Nichols. “Web Application Security Metrics Framework,” in IEEE Security & Privacy, March/April 2007.
Nguyen Pham, Loic Baud, Patrick Bellot, and Michel Riguidel, Telecom ParisTech. “A Near Real-time System for Security Assurance Assessment,” in Proceedings of the Third International Conference on Internet Monitoring and Protection (ICIMP 2008). Bucharest, Romania, 29 June-5 July 2008. Accessed 1 April 2009 at: http://www.infres.enst.fr/~bellot/publis/ICIMP2008.pdf
John P. Pironti. “Developing Metrics for Effective Information Security Governance,” in Information Systems Control Journal, Volume 2, 2007. Accessed 2 April 2009 at: http://www.isaca.org/Template.cfm?Section=Home&CONTENTID=35913&TEMPLATE=/ContentManagement/ContentDisplay.cfm
PSM Safety and Security Technical Working Group. “Security Measurement Whitepaper,” Version 3.0, 13 January 2006. Accessed 2 February 2008 at: http://www.psmsc.com/Downloads/TechnologyPapers/SecurityWhitePaper
Deb Radcliff. “Government Vertical: Is FISMA Working?,” in SC Magazine, 1 November 2007. Accessed 3 February 2009 at: http://www.scmagazineus.com/Government-vertical-Is-FISMA-working/article/58396
RAND Corporation. “DOJ/DHS National Computer Security Survey.” Accessed 10 March 2009 at: http://www.ncss.rand.org/index.html
“Research and Development (R&D) Exchange Workshop October 28 - October 29, 2004 Monterey, California.” Accessed 2 February 2009 at: http://www.ncs.gov/nstac/rd/nstac_04_bos.html
Lyn Robison, The Burton Group. IT Metrics: Measuring IT’s Business Value, 27 February 2009. Accessed 13 March 2009 at: https://www.burtongroup.com
G. Rogers and B. Stauffer. “An approach to InfoSec program metrics,” in Proceedings of the 1st ISSRR Workshop, ACSAC, March 26 2001.
Ron Ross, Stu Katzke, Arnold Johnson, Marianne Swanson, Gary Stoneburner, and George Rogers. NIST SP 800-53 Rev. 2, Recommended Security Controls for Federal Information Systems, December 2007. Accessed 3 April 2009 at: http://www.csrc.nist.gov
K. Rudolf, Native Intelligence, Inc. “Security Awareness Metrics: Measure What Matters.” Accessed 29 January 2009 at: http://www.nativeintelligence.com/ni-programs/metrics-01.asp_v3.0.pdf
Elizabeth Van Ruitenbeek and Karen Scarfone. The Common Misuse Scoring System (CMSS) (DRAFT), NIST Interagency Report 7517 (Draft), February 2009. Accessed 26 March 2009 at: http://csrc.nist.gov/publications/drafts/nistir-7517/Draft-NISTIR-7517.pdf

Measuring Cyber Security and Information Assurance State-of-the-Art Report (SOAR)168
Appendix B Resources
Sandia National Laboratories. “IDART Red Team Metrics Quick Reference Sheet.” Accessed 6 January 2009 at: http://www.idart.sandia.gov/research.html
Reijo Savola, VTT Technical Research Centre of Finland. “A Novel Security Metrics Taxonomy for R&D Organisations,” in Proceedings of the Information Security South Africa (ISSA) 2008 Innovative Minds Conference, Johannesburg, South Africa, 7-9 July 2008. Accessed 2 January 2009 at: http://icsa.cs.up.ac.za/issa/2008/Proceedings/Full/2.pdf. Also described in Reijo M. Savola, VTT Technical Research Center of Finland. “Towards a Taxonomy for Information Security Metrics,” in Proceedings of ACM Workshop on Quality of Protection (QoP ‘07), Alexandria, Virginia, 29 October 2007. DOI: http://doi.acm.org/10.1145/1314257.1314266
Karen Scarfone and Peter Mell. The Common Configuration Scoring System (CCSS) (DRAFT), NIST Interagency Report 7502 (Draft), May 2008. Accessed 2 February 2009 at: http://csrc.nist.gov/publications/drafts/nistir-7502/Draft-NISTIR-7502.pdf
E.A. Schneider, “Measurements of system security,” in Proceedings of the 1st ISSRR Workshop, ACSAC, May 2001.
Stuart Edward Schechter. Computer Security Strength & Risk: A Quantitative Approach. Harvard University Ph.D. Thesis, May 2004. Accessed 13 April 2009 at: http://www.eecs.harvard.edu/~stuart/papers/thesis.pdf
Michael J. Scroch, Sandia National Laboratories. “IORTA Red Team Metrics 101” (Incomplete Beta Version). Lecture.
Michael J. Scroch, J. McHugh, and J.M. Williams. “Information Assurance Metrics: Prophecy, Process or Pipedream.” Panel Workshop, National Information Systems Security Conference (NISSC 2000), Baltimore, Maryland, October 2000.
Securitymetrics.org. Accessed 13 April 2009 at: http://www.securitymetrics.org/content/Wiki.jsp
Nabil Seddigh, Peter Pieda, Biswajit Nandy, and John Lambadaris, Solana Networks; and Ashraf Matrawy and Adam Hatfield, Department of Public Safety and Emergency Preparedness Canada. “Current Trends and Advances in Information Assurance Metrics.” Accessed 10 December 2008 at: http://dev.hil.unb.ca/Texts/PST/pdf/seddigh.pdf
Nabil Seddigh, Peter Pieda, Ashraf Matrawy, Biswajit Nandy, John Lambadaris, and Adam Hatfield. “Current Trends and Advances in Information Assurance Metrics,” in Proceedings of Second Annual
Conference on Privacy, Security, and Trust (PST 2004), Fredericton, NB, Canada, 13-15 October 2004. Accessed 19 January 2008 at: http://dev.hil.unb.ca/Texts/PST/pdf/seddigh.pdf
Nicholas Sheble, ISA. “Control system security occupies time, cyberspace,” InTech, 15 October 2008. Accessed 11 December 2008 at: http://www.isa.org/InTechTemplate.cfm?Section=Industry_News&template=/ContentManagement/ContentDisplay.cfm&ContentID=72373
Edgar Sibley, George Mason University. “National Information Assurance Training Standard for System Administrators.” Lecture slides for course on IAVA, Summer 2008. Accessed 5 February 2009 at: http:// mason.gmu.edu/~esibley/ISA562SU08/Slide/11%2520cont%25202%2520IAVA%2520.ppt
Daniel J. Solove, Marc Rotenberg, and Paul M. Schwartz. Privacy, Information, and Technology (New York, New York: Aspen Publishers, 2006)
-and-
Joel Rosenblatt. “Security Metrics: A Solution in Search of a Problem,” in EDUCAUSE Quarterly, Vol. 31, No. 3, July-September 2008. Accessed 22 December 2008 at: http://connect.educause.edu/Library/EDUCAUSE+Quarterly/SecurityMetricsASolutioni/47083
Kevin Soo Hoo, PacketMotion. Economic Incentives & Metrics of Cybersecurity. Lecture slides for Stanford University course on US National Cybersecurity, 2 November 2006. Accessed 19 January 2009 at: http://www.stanford.edu/class/msande91si/slides/lecture_6_soohoo.pdf
Derek Slater. “Security Budget Benchmarks: Inside the Sausage Factory,” in CIO, 9 December 2002. Accessed 13 April 2009 at: http://www.cio.com/article/217728/Security_Budget_Benchmarks_Inside_the_Sausage_Factory

Measuring Cyber Security and Information Assurance State-of-the-Art Report (SOAR) 169
Appendix B Resources
M. Stoddard, et al. “An Initial Metrics Taxonomy,” in Process Control System Security Metrics—State of Practice, I3P Institute for Information Infrastructure Protection Research Report No. 1, August 2005. Accessed 19 January 2009 at: http://www.thei3p.org/docs/publications/ResearchReport1.pdf
Marianne Swanson, Nadya Bartol, John Sabato, Joan Hash and Laurie Graffo. NIST Special Publication 800-55, Security Metrics Guide for Information Technology Systems, July 2003. Accessed 26 March 2009 at: http://webharvest.gov/peth04/20041027033844/csrc.nist.gov/publications/nistpubs/800-55/sp800-55.pdf
Software Assurance Community Resource and Information Clearinghouse Measurement Working Group. Accessed 1 April 2009 at: https://buildsecurityin.us-cert.gov/swa/measwg.html
SSE-CMM. “Systems Security Engineering Capability Maturity Model (SSE-CMM), Version 3.” Accessed 1 April 2009 at: http://www.sse-cmm.org/model/model.asp
SwA Measurement Working Group. Practical Measurement Framework for Software Assurance and Information Security, Version 1.0, October 2008. Accessed 7 April 2009 at: https://buildsecurityin.us-cert.gov/swa/downloads/SwA_Measurement.pdf
US-CERT. “Vulnerability Notes Database Field Descriptions.” Accessed 4 February 2009 at: http://www.kb.cert.org/vuls/html/fieldhelp
United States Congress. Federal Information Security Act, DON CIO Website H.R. 2458–48. Accessed 1 April 2009 at: http://csrc.nist.gov/groups/SMA/fisma/index.html
Rayford B. Vaughn and Ambareen Siraj, Mississippi State University, and Ronda Henning, Harris Corporation, Government Communications Systems Division. “Information Assurance Measures and Metrics—State of Practice and Proposed Taxonomy,” Proceedings of the 36th Hawaii International Conference on System Sciences (HICSS-36), 6-9 January 2003. Accessed 19 January 2008 at: http://citeseerx.ist.psu.edu/viewdoc/summary?doi=10.1.1.71.184
R. B. Vaughn, “Are measures and metrics for trusted information systems possible?,” in Proceedings of the 1st ISSRR Workshop, ACSAC, May 2001.
Rayford B. Vaughn, Ambareen Siraj, and David A. Dampier, Mississippi State University. “Information Security System Rating and Ranking,” in CrossTalk: The Journal of Defense Software Engineering, May 2002. Accessed 19 January 2009 at: http://www.stsc.hill.af.mil/crosstalk/2002/05/vaughn.html
Chenxi Wang and William A. Wulf, University of Virginia. “Towards a Framework for Security Measurement.” Proceedings of the National Information Systems Security Conference (NISSC), Baltimore, Maryland, 7-10 October 1997. Accessed 8 January 2009 at: http://csrc.nist.gov/nissc/1997/proceedings/522.pdf
Lingyu Wang, Tania Islam, Tao Long, Anoop Singhal, and Sushil Jajodia. “An attack graph-based probabilistic security metric,” in 22nd Annual IFIP WG 11.3 Working Conference on Data and Applications Security, London, UK, 13-16 July 2008
Lingyu Wang, Anoop Singhal, and Sushil Jajodia. “Measuring the overall security of network configurations using attack graphs,” in Data and Applications Security XXI (Berlin/Heidelberg, Germany: Springer Verlag, 2007), pp. 98–11.
Mark Wilson and Joan Hash. NIST SP 800-50, Building an Information Technology Security Awareness and Training Program. October 2003. Accessed 30 January 2009 at: http://csrc.nist.gov/publications/nistpubs/800-50/NIST-SP800-50.pdf
G. Wold. “Is use of security metrics expedient to measure performance of an implemented organizational security policy?” M.SC. Project Plan, Dec. 2003.
Carol Woody, CMU SEI CERT/CC. “Strengthening Ties between Process and Security,” on DHS National Cyber Security Division’s BuildSecurityIn Web portal, 1 Aug 2008. Accessed 2 April 2009 at: https://buildsecurityin.US-CERT.gov/daisy/bsi/articles/knowledge/sdlc/1049-bsi.html#dsy1049-bsi_harm

Measuring Cyber Security and Information Assurance State-of-the-Art Report (SOAR)170
Appendix B Resources
Carol Woody. “Process Improvement Should Link to Security: SEPG 2007 Security Track Recap.” Technical Note CMU/SEI-2007-TN-025, September 2007. Accessed 6 April 2009 at: http://www.sei.cmu.edu/publications/documents/07.reports/07tn025.html
Chris Wysopal, Veracode, Inc. “Software Security Weakness Scoring.” Presented at MetriCon 2.0, Boston, Massachusetts, 7 August 2007. Accessed 16 February 2009 at: http://www.securitymetrics.org/content/attach/Metricon2.0/Wysopal-metricon2.0-software-weakness-scoring.ppt
B.2 Additional Print Sources of Information for Suggested ReadingRichard B. Cole. Measuring Security Performance and Productivity. (Alexandria, Virginia: ASIS International, 2003).
Lisa Witzig Davidson, Advanced Performance Consulting Group. “US Department of State’s Overseas Wireless Program: Measuring Performance, Measuring Security,” in Proceedings of the 5th International Command and Control Research and Technology Symposium (ICCRTS), Canberra, Australia, October 2000. Accessed 7 February 2009 at: http://www.dodccrp.org/events/5th_ICCRTS/papers/Track6/033.pdf
Dieter Gollmann, Fabio Massacci, and Artsiom Yautsiukhin, Editors. Quality of Protection: Security Measurements and Metrics (City, Country: Springer-Verlag, 2006).
Debra S. Hermann. Complete Guide to Security and Privacy Metrics: Measuring Regulatory Compliance, Operational Resilience, and ROI (Boca Raton, Florida: Auerbach Publications, 2007).
Andrew Jaquith. Security Metrics: Replacing Fear, Uncertainty, and Doubt (City, State: Addison-Wesley Professional, 2007).
Gerald L. Kovacich and Edward Halibozek. Security Metrics Management: How to Manage the Costs of an Assets Protection Program (Oxford, England: Butterworth-Heinemann, 2006).
Timothy P. Layton. Information Security: Design, Implementation, Measurement, and Compliance (Boca Raton, Florida: Auerbach Publications, 2006)
Overseas Economic Co-operation and Development (OECD) Directorate for Science, Technology, and Industry. “Measuring Security and Trust in the Online Environment: A View Using Official Data.” OECD Digital Economy Paper No. 140, DSTI/ICCP/IIS(2007)4/FINAL, 29 January 2008. Accessed 7 February 2009 at: http://www.sourceoecd.org/10.1787/230551666100
B.3 Additional Online Sources of Information for Further ReadingAshish Arora, Dennis Hall, C. Ariel Pinto, Dwayne Ramsey, and Rahul Telang. “Measuring the Risk-Based Value of IT Security Solutions,” in IT Professional, Vol. 6 No. 6, November/December 2004, pp. 35-42. Digital Object Identifier: 10.1109/MITP.2004.89 Accessed 7 April 2009 at: http://ieeexplore.ieee.org/Xplore/login.jsp?url=http%3A%2F%2Fieeexplore.ieee.org%2Fiel5%2F6294%2F30282%2F01390871.pdf&authDecision=-203
Nadya Bartol. “IA Metrics—Why and How to Measure Goodness of Information Assurance.” Presented to ISSEA PSM User’s Group Conference, July 2005. Accessed 29 December 2008 at: metrics http://www.psmsc.com/UG2005/Presentations/15_Bartol_IA_Metrics.pdf
Blake Causey. “Why Application Security Metrics are broken.” 22 December 2008 on the “Hancock”/Attack Vectors blog. Accessed 2 February 2009 at: http://attackvectors.com/~/blog/index.php?m=12&y=08&entry=entry081222-141210
S. Chandra and R.A. Khan. “Object Oriented Software Security Estimation Life Cycle-Design Phase Perspective”, in Journal of Software Engineering, Volume 2 Issue 1, 2008, pp. 39-46. Accessed 13 April 2009 at: http://www.scialert.net/fulltext/?doi=jse.2008.39.46
Tony Coulson, Jake Zhu, and C.E. Tapie Rohm, California State University-San Bernardino; and Shan Miyuan, Hunan University-Changsha. “The Price of Security: The Challenge of Measuring Business Value Investments in Securing Information Systems,” in Communications of the IIMA, Volume 5, Issue 4, 2005. Accessed 25 March 2009 at: http://www.iima.org/CIIMA/8%205.4_Coulson_19_24.pdf

Measuring Cyber Security and Information Assurance State-of-the-Art Report (SOAR) 171
Appendix B Resources
Tony Coulson, Jake Zhu, Kurt Collins, Walter Stewart, C.E. Tapie Rohm, Jr., California State University-San Bernardino. “Security: Valuing Increased Overhead Costs,” in Proceedings of the 10th Colloquium for Information Systems Security Education, Adelphi, MD, 5-8 June 2006. Accessed 25 March 2009 at: http://www.cisse.info/colloquia/cisse10/proceedings10/pdfs/papers/S05P03.pdf
DHS. “Measurement,” in DHS BuildSecurityIn. Accessed 3 April 2009 at: https://buildsecurityin.us-cert.gov/daisy/bsi/articles/best-practices/measurement.html
DON CIO, Department of the Navy Federal Information Security Management Act (FISMA) Guidance, March 2006. Accessed 1 April 2009 at: http://www.doncio.navy.mil/Download.aspx?AttachID=294
DON CIO Blog. Accessed 1 April 2009 at: http://www.doncio.navy.mil/tagresults.aspx?ID=28
Government Accountability Office (GAO) Report to Congressional Addressees. Information Technology: DOD Needs To Ensure That Navy Marine Corps Intranet Program Is Meeting Goals And Satisfying Customers, December 2006. Accessed 1 April 2009 at: http://www.gao.gov/new.items/d0751.pdf
Fred Hall. “Measurement of Security Processes.” Presentations from workshop presented at PSM Technical Working Group Meeting, Herndon, Virginia, March 2006. Accessed 2 February 2009 at: http://www.psmsc.com/Downloads/TWGMarch06/3%20-%20Measurement%20of%20Security%20Processes.Hall.zip
Michael Howard, Microsoft Corporation; and Jon Pincus and Jeannette M. Wing, Carnegie Mellon University. “Measuring Relative Attack Surfaces,” in Proceedings of Workshop on Advanced Developments in Software and Systems Security, Taipei, December 2003. Accessed 29 January 2009 at: http://www.cs.cmu.edu/~wing/publications/Howard-Wing03.pdf
Vivian Cocca (OSD/NII), Steven Skolochenko, and Jonathan Smith. “The Importance of High Quality IA Metrics,” in IAnewsletter, Volume 7 Number 2, pg. 22. Accessed 13 April 2009 at: http://iac.dtic.mil/iatac/download/Vol7_No3.pdf
Cheryl Jones, USA. “Making Measurement Work,” in CrossTalk: The Journal of Defense Software Engineering, January 2003. Accessed 2 February 2009 at: http://www.stsc.hill.af.mil/Crosstalk/2003/01/jones.html
Cheryl Jones, CIV USA AMC, and John Murdoch, University of York. “Security Measurement: Applying PSM Principles.” Presented at Practical Software and Systems Measurement Users’ Group Conference, 14-18 July 2008, Mystic, CT. Accessed 3 February 2009 at: http://www.psmsc.com/UG2008/Presentations/14%20-%20Murdoch-Security%20Measurement-17Jul08.pdf
Raph Levien. “Advogato’s trust metric,” 22 February 2000. Accessed 6 April 2009 at: http://www.advogato.org/trust-metric.html
Raph Levien. “Attack Resistant Trust Metric Metadata HOWTO,” 3 July 2002. Accessed 6 April 2009 at: http://www.levien.com/free/tmetric-HOWTO.html
(United States) Marine Corps. Initial Capabilities Document (ICD) for Marine Corps Enterprise Information Technology Services (MCEITS), Version 3.4, 20 May 2005. Accessed 1 April 2009 at: http://www.mceits.usmc.mil/docs/05-05-20_MCEITS_ICD_(v3.4).pdf
(Secretary of the) Navy. Federal Managers’ Financial Integrity Act. FY 2008 Statement of Assurance, 28 August 2008. Accessed 1 April 1, 2009 at: www.fmo.navy.mil/mic/docs/SOA_Final_WEB.pdf
securitymetrics.org, Community Web site for Security Practitioners. Accessed 9 April 2009 at: http://www.securitymetrics.org/content/Wiki.jsp
Andy Ozment, University of Cambridge. “Software Security Growth Modeling: Examining Vulnerabilities with Reliability Growth Models,” in Quality of Protection: Security Measurements and Metrics (Dieter Gollman, Fabio Massacci and Artsiom Yautsiukhin, editors). Accessed 3 April 2009 at: http://www.cl.cam.ac.uk/~jo262/papers/qop2005-ozment-security_growth_modeling.pdf
SecurityStats.com. Latest Computer Security News. Accessed 9 April 2009 at: http://www.securitystats.com

Measuring Cyber Security and Information Assurance State-of-the-Art Report (SOAR)172
Appendix B Resources
Shaun Remnant. “Counting the cost of IT security,” in ITadviser, Issue 38, July/August 2005. Accessed 25 March 2009 at: http://www.nccmembership.co.uk/pooled/articles/BF_WEBART/view.asp?Q=BF_WEBART_171149
SANS Institute. “Twenty Most Important Controls and Metrics for Effective Cyber Defense and Continuous FISMA Compliance.” Accessed 15 April 2009 at: http://www.sans.org/cag
Lora Shinn. “Instituting Security Metrics,” in Inc. Technology, June 2008. Accessed 13 April 2009 at: http://technology.inc.com/security/articles/200806/metrics.html
John Steven and Gunnar Peterson. “A Metrics Framework to Drive Application Security Improvement,” in Building Security In, IEEE Security and Privacy, 2007. Accessed 25 March 2007 at: http://www.arctecgroup.net/pdf/0703-OWASPMetrics.pdf
Trustcomp Yahoo Group. “Welcome to Trustcomp.org!” Accessed 25 March 25, 2009 at: http://www.trustcomp.org
US-CERT. “Briefings from Workshop on Assurance with CMMI,” August 2007, in BuildSecurityIn. Accessed 10 February 2009 at: https://buildsecurityin.us-cert.gov/swa/procresrc.html
B.4 Publicly Available CS/IA Measures ListsA number of CS/IA measures lists are available from books, guidelines, articles, and other sources. The following is a representative list of those sources:
NIST SP 800-55 Rev. 1, Performance Measurement Guide for Information Security, Appendix A, Candidate Measures
SwA Measurement Working Group. Practical Measurement Framework for Software Assurance and Information Security
CIS. The CIS Security Metrics
Debra S. Hermann, Complete Guide to Security and Privacy Metrics
Andrew Jaquith. Security Metrics: Replacing Fear, Uncertainty, and Doubt.
ISSA, UK Chapter. Is Security Awareness wasted on End Users?,
Gary Hinson, Seven myths about information security metrics, in ISSA Journal
K. Rudolf, Security Awareness Metrics: Measure What Matters.

Measuring Cyber Security and Information Assurance State-of-the-Art Report (SOAR) 173
Appendix B Resources

Measuring Cyber Security and Information Assurance State-of-the-Art Report (SOAR)174
CCS/IA Measurement Before 2000
This Appendix describes some leading CS/IA measures that were defined prior to the period addressed in this SOAR.
C.1 BackgroundIn the outbrief of its third R&D Exchange (RDX) Workshop in October 1998, the President’s National Security Telecommunications Advisory Committee (NSTAC), a component of the National Communications System, identified and discussed the need for research in the area of CS/IA measurement. Five years later, at NSTAC’s 2003 RDX Workshop, “technical metrics that measure the strength of security” was again identified as recommended Cyber Security Research focus that deserved funding by the Office of Science and Technology Policy. The 2003 RDX outbrief at RDX 2004 specifically called for development and verification of “security metrics for use on a national level.” [174]
Significant work on the definition of CS/IA measures and measurement techniques began in the mid-late 1990s. In their presentation, “A Report on the Information System Information System Security Rating and Ranking Workshop,” at the 14th Annual Software Technology Conference (Salt Lake City, Utah, 29 April–2 May 2002), Ray Vaughn of Mississippi State University and Ronda Henning of Harris Corporation, identified a number of “renowned existing IA metrics,” many of which emerged during that period. These metrics are listed in Table C-1.

Measuring Cyber Security and Information Assurance State-of-the-Art Report (SOAR) 175
Appendix C CS/IA Measurement Before 2000
Table C-1 Renowned Existing CS/IA Measures
Defining Organization Initiative Title
Air Force Communications Agency (AFCA)
Information Protection Metrics and Measurement Program
CVE Editorial Board and Advisory Council
Common Vulnerabilities and Exposures (CVE) Vulnerability Scanner Coverage Metric (expressed as number of CVE entries)
DISA Information Assurance Vulnerability Alerts (IAVA) metrics
DoD Defense Technology Security Certification and Accreditation Process (DITSCAP) Certification Levels (now Defense Information Assurance Certification and Accreditation Process [DIACAP] Certification levels)
ESC/DIW IA Vulnerability Assessment/Risk Management (VA/RM) metrics
Federal CIO Council/NIST Federal Information Technology Security Assessment Framework (FITSAF)
Information Systems Security Engineering Association (ISSEA)
System Security Engineering Capability Maturity Model (SSE-CMM)
Intelligence Community Top Secret and Below Information (TSABI) Initiative
INFOSEC Risk Management metrics
ISO/IEC Common Criteria Evaluation Assurance Level
LAAS-CNRS Attacker success measures
Lincoln Labs (for DARPA) Intrusion Detection algorithm performance metrics
Logicon Resiliency Assurance Index
The MITRE Corporation (for OSD(C3I)/I&IA)
Defense-Information Assurance Red Team (D-IART)
Sandia National Laboratories Information Design and Assurance Red Team (IDART) metrics (see Section 7.1.1.1)
SANS SANS Institute Certification Levels
Sparta IA Risk Metric Tree
SRI (for DARPA) Red Team Work Factor (RTWF)
A number of these efforts are still in active use or under development; these are discussed elsewhere in this document. Of those that appear to be obsolete, a representative sampling is described below.
C.2 Annualized Loss Expectancy as a CS/IA MeasureUntil the late 1990s, the main measures used by traditional security risk analysis methodologies was Annualized Loss Expectancy (ALE). While it is not specifically an CS/IA measure per se, ALE was used by risk analysts to express the level of security risk posed to an organization in terms of potential monetary loss accruing from a security incident. Specifically, ALE was the result of the calculation of the expected monetary loss that would result from an asset being lost in a security incident. This monetary loss was expressed in terms of a Single Loss Expectancy (SLE) measure. The SLE

Measuring Cyber Security and Information Assurance State-of-the-Art Report (SOAR)176
Appendix C CS/IA Measurement Before 2000
measure was then multiplied by a second measure, the Annualized Rate of Occurrence (ARO), which expressed the probability of the security incident occurring within a given one year period, [175] as follows:
SLE * ARO = ALE
The ALE was intended to provide the basis for estimating the reasonable annualized cost of the countermeasure(s) (e.g., security product, architecture, policy) that could mitigate the risk (of loss posed by the security incident); the cost of mitigation was considered reasonable if it was less than or equal to the ALE.
The credibility of ALE as a meaningful measure for CS/IA has been increasingly questioned. On his “Practical Risk Management” blog, security consultant Bryan Fish neatly summed up ALE skeptics’ concerns:
“ALE is fundamentally wrong for information security. I’ll concede that ALE can be useful as a simple conceptual model for risk because it requires us to think about both of the factors that generally influence risk: Likelihood and Impact. But literal use of ALE for information security decisions is problematic to say the least.
The problem with ALE is that the numbers we plug into that formula are so baseless that the resulting calculation has no credibility.... How does one calculate the financial impact of a security breach? Here’s a hint: the amount of money you paid for the server that was just compromised is wrong. There’s a whole bunch of things that go into it: the cost of employees and consultants to restore order after the breach, the potential legal liability, the cost of business you may have lost when the system went down, the opportunity cost of things you couldn’t do because you had to spend time and resources responding to the incident, and the impact of lost goodwill and reputation damage that you suffer in the market. All of these factors are either immeasurable or unpredictable, which makes them poor candidates for mathematical calculations.
How does one calculate the likelihood of a security breach? The spectrum of threats is too broad and too unpredictable to have any hope of doing this. If you were just hacked by an outsider, or fell victim to a disgruntled employee, or made a simple mistake and exposed a bunch of sensitive information on a Web site, chances are you never saw it coming, and sure couldn’t have sat at your desk six months ago and said ‘there’s a 20% chance that this will happen in the next year’.” [176]

Measuring Cyber Security and Information Assurance State-of-the-Art Report (SOAR) 177
Appendix C CS/IA Measurement Before 2000
C. 3 DARPA IASET Measures of Assurance Research: Value-Focused ThinkingDefense Advanced Research Projects Agency (DARPA) ISO’s Information Assurance Science and Engineering Tools (IASET) Program undertook management of several research projects to “develop quantifiable measures of assurance.”
The goal of IASET’s measures research was to first identify measures that are measurable, testable, and useful for the quantification and comparison of IA components over time, for the comparison between similar systems, for the comparison of systems to requirements, and for measuring the utility of a system in a particular environment. The ultimate objective was to produce useful measures for designers, assessors, planners, and users.
DARPA’s priority was for as many of these measures as possible to be quantitative, but also recognized that qualitative measures were unavoidable; therefore, their meaning must be consistent and defined. IASET promoted the development of a common frame of reference and language for measures to ensure they would be universally understood by designers, assessors, and operators.
DARPA was also interested in the definition of benchmarks or touchstones for IA, recognizing the limitations of measures which, while they could provide standards of measure, might not provide insight that humans could readily understand and use. DARPA’s measures research focused also on the development of comparative benchmark measures, measurable against a standard scale, in recognition that absolute measures are not available.
In summary, IASET sought to develop an integrated environment for measures by defining their purpose, meaning, units, range of values, inherent taxonomies, and relationship to other measures and calculations for IA.
Among the most promising research efforts funded by the DARPA/IO/IASET Program was the Value-Focused Thinking (VFT) methodology, developed by researchers at the Air Force Institute of Technology. Adapted from a methodology described by Kirkwood, [177] VFT was formulated as an analytical framework for facilitating development and evaluation of IA strategies. The framework enabled the analyst to evaluate the merits of alternative IA strategies (a “strategy” being the collection of technical—hardware, software, firmware—and non-technical—policies, procedures—countermeasures used to achieve IA objectives), based on the analysis and comparison of the perceived quantified value of each strategy in terms of its effectiveness in achieving a desired (or required) level of assurance while imposing the least possible operational impact, at the most reasonable cost.
The VFT framework included several sets of measures that allocated values to the IA, operational capability, and resource factors that must be considered to—
f Measure the attainment of IA objectives,

Measuring Cyber Security and Information Assurance State-of-the-Art Report (SOAR)178
Appendix C CS/IA Measurement Before 2000
f Determine the meaningful balance between a required/desired level of IA against the operational and resource costs associated with attaining that level of assurance.
Using these measures, the AFIT researchers defined three different value models—
f An IA model, f An Operational Capability model, f A Resource Costs model.
Each model quantifies the values of the strategy’s various components (the methodology providing a technique for balancing the relative value
“weights” of each model). In this way, the analyst can compare the values of multiple candidate strategies to determine which of them provides the greatest overall value.
Building upon concepts described by Materna, [178] the AFIT researchers produced a Microsoft Excel-based decision support tool that enabled the user to define the value models and provide them the necessary inputs, evaluation measures, and weighting criteria via a semi-automated input process implemented by Visual Basic macros, which are also used to generate the tool’s summary of the analysis results.
C.4 RAIResearchers at Logicon felt that numerical “measures of merit,” such as “80% secure,” “95% secure,” “99% secure,” etc., were of dubious value for quantifying levels of IA protection or gauging the true security posture of a system.
To address their concern, the Logicon researchers developed a quantitative (10-level) Resiliency Assurance Index (RAI) [179] for use in rating the ability of a system to resist, contain and minimize damage, and recover from an attack.
The Logicon researchers failed, however, to clarify why they believed that a 10-level system of resilience ratings produced more meaningful measures than a system that assigned percentage ratings to a system’s perceived security strength.
C.5 D-IARTDeveloped at the end of the 1990s for the Office of the Assistant Secretary of Defense for Command, Control, Communications, and Intelligence/Information Assurance (OSD(NII)), the Defense-Information Assurance Red Team Methodology (D-IART) is a red teaming methodology based on red teaming best practices from across DoD and within The MITRE Corporation.

Measuring Cyber Security and Information Assurance State-of-the-Art Report (SOAR) 179
Appendix C CS/IA Measurement Before 2000
The methodology was designed to guide red teamers through the specific steps required to organize, tailor, and conduct red team activities, and to aid in after-action analysis. Recognizing that lessons learned from read teaming activities are maximized if the red team results can be quantified and used as a basis of comparison, the methodology also provides measures for data collection and analysis.
C.6 SM Framework [180]Developed by researchers at University of Virginia, the Security Measurement (SM) framework applies the theory and practice of formal measurements to assist the user in defining adequate security measures, then to determine the values of such measurements. The SM framework comprises—
f A definition of computer security (i.e., the thing to be measured, derived from the TCSEC);
f An approach for selection of units and scales of measurement; f A specification of an estimation methodology; f An approach for formal validation of the defined measures.
References174 NSTAC. “Research and Development (R&D) Exchange Workshop September 28 - September 29, 2000
Tulsa, Oklahoma.” Accessed 2 February 2009 at: http://www.ncs.gov/nstac/rd/nstac_rdexchange_ok.html
-and-
“Research and Development (R&D) Exchange Workshop October 28 - October 29, 2004 Monterey, California.” Accessed 2 February 2009 at: http://www.ncs.gov/nstac/rd/nstac_04_bos.html
175 Robert Hudock. “Why Security Metrics Must Replace Traditional Risk Analysis Methodologies,” in Computer Security Law Updates, 6 March 2006. Accessed 30 January 2009 at: http://computersecuritylaw.us/2008/03/06/why-security-metrics-must-replace-traditional-risk-analysis-methodologies.aspx?ref=rss
176 Bryan Fish, Securityworks. “Is Risk-Based Security Really Possible?,” Practical Risk Management Blog, 21 July 2008. Accessed 30 January 2009 at: http://www.security-works.com/blog/labels/risk.html
177 As described in C.W. Kirkwood. Strategic Decision Making: Multiobjective Decision Analysis with Spreadsheets. (Belmont, California: Duxbury Press, 1997).
178 As described in Robert D. Materna and Peter S. Greis. Assessing the Value of Information Technology: Creating Value. (Dayton, Ohio: NCR Corporation Strategic Consulting Group, March 1992).
179 Dennis McCallam. “The case against numerical measures for information assurance,” in Proceedings of the First Workshop on Information Security System Rating and Ranking (WISSR), Williamsburg, Virginia, 23 May 2001. Accessed 8 January 2009 at: http://www.seeeach.com/doc/189512_Position_Paper_The_Case_Against_Numerical_Measures_for_Information_. The entire WISSR Proceedings can be downloaded from: http://www.acsac.org/measurement/proceedings/wisssr1-proceedings.pdf (Accessed 20 January 2009).
180 Chenxi Wang and William A. Wulf, University of Virginia. “Towards a Framework for Security Measurement.” Proceedings of the National Information Systems Security Conference (NISSC), Baltimore, Maryland, 7-10 October 1997. Accessed 8 January 2009 at: http://csrc.nist.gov/nissc/1997/proceedings/522.pdf

Measuring Cyber Security and Information Assurance State-of-the-Art Report (SOAR)180
DConferences and Workshops
A number of conferences on IA, cyber security, application security, and related disciplines have included tracks on measures and measurement. However, an emerging trend has been “specialist” conferences and workshops that focus on the problems associated with definition and use of CS/IA measures and measurement techniques and tools.
The following are conferences and workshops that devoted predominantly or entirely to CS/IA measurement.
D.1 Workshop on Information Security System Scoring and Ranking (WISSSR)Also referred to as: 1st Workshop on Information Security System Rating and Ranking (ISSRR) Workshop. Williamsburg, Virginia, 21-23 May 2001. Co-sponsored by Applied Computer Security Associates and The MITRE Corporation.
The goals of the workshop were to characterize the information security measurement problem domain, identify “good practices,” focus needs, and determine potential research directions. Common themes that emerged included—
f No single information security measure will successfully quantify the assurance of a system. Multiple measures will be needed and will need to be refreshed frequently.

Measuring Cyber Security and Information Assurance State-of-the-Art Report (SOAR) 181
Appendix D Conferences and Workshops
f Software and systems engineering (e.g., the quality of software delivered, the architectures and designs chosen, the tools used to build systems, and the requirements specified) are related to the assurance to be quantified.
f Penetration testing is an imperfect way of generating measurable data and is, to some extent, non-repeatable.
f Government and commercial sectors have different agendas: the former is policy-driven, the latter is profit-driven. Thus, the two sectors may place different values on security measures.
f Measuring defense in depth and breadth is a critical area that warrants further research.
f Past attempts to quantify and obtain partial ordering of systems’ security attributes (e.g., TCSEC, Common Criteria) have been unsuccessful to a large degree.
Processes, procedures, tools, and people all interact to produce assurance in systems. Measures need to incorporate all of these aspects.
For more information: http://www.acsac.org/measurement(Accessed 3 February 2009)
D.2 Fourth Workshop on Assurance Cases for Security “The Metrics Challenge”Edinburgh, Scotland, June 2007. Sponsored by International Working Group on Assurance Cases (for Security).
The focus of this workshop was on metrics for assurance cases for security.For more information: http://www.csr.city.ac.uk/AssuranceCases/
dsn2007workshop.html (Accessed 3 February 2009)
D.3 Workshop on “Measuring Assurance in Cyberspace”Monterey, California, 26 June 2003. Sponsored by IFIP Working Group 10.4.
The stated challenges to be addressed at the workshop included— f Inability to quantify how assured systems and networks are; f Inability to quantify the ability of protective measures to keep
intruders out; f Difficulty characterizing capabilities of intrusion detection systems
in detecting novel attacks; f Inability to measure benefits of novel response mechanisms
comparatively or absolutely.
The goals of this one-day workshop were to— f Assess the state of the art for quantifying system assurance; f Discuss recent research results; f Formulate the challenges that obstruct forward movement;

Measuring Cyber Security and Information Assurance State-of-the-Art Report (SOAR)182
Appendix D Conferences and Workshops
f Formulate potential new technical approaches to address the challenges above.
For more information: http://www2.laas.fr/IFIPWG/Workshops&Meetings/44 (Accessed 3 February 2009)
D.4 MetriCon and Mini-MetriConRecurring, semi-annually (MetriCon: usually co-located with USENIX Security; Mini-MetriCon: usually co-located with RSA Conference). Sponsored by Securitymetrics.org.
The focus of this workshop was on metrics for security assurance cases. The workshop was divided into four presentations on security assurance cases and security metrics followed by two talks on the topic and an afternoon of discussion.
According to its Web site, “The workshop reported on some progress on assurance cases but, for this organiser at least, its value was in highlighting the enormous gaps in our ability to measure, model and communicate security risks. Progress on assurance cases for security will require more rigorous work on the underlying problems.”
For more information: http://www.securitymetrics.org (Accessed 3 February 2009)
D.5 International Workshop on Quality of Protection “Security Measurements and Metrics”
Recurring. Sponsored by the Association for Computing Machinery (ACM).The goal of the QoP Workshop is to help security research progress
toward a notion of Quality of Protection in Security comparable to the notion of Quality of Service in Networking, Software Reliability, or measures in Empirical Software Engineering.
Information Security has gained numerous standards, industrial certifications, and risk analysis methodologies. However, the field still lacks the strong, quantitative, measurement-based assurance found in other fields. For example—
f Networking researchers have created and utilize Quality of Service (QoS), SLAs, and performance evaluation measures.
f Empirical Software Engineering has made similar advances with software measures: processes to measure the quality and reliability of software exist and are appreciated in industry.
f Even a fairly sophisticated standard, such as ISO17799, has an intrinsically qualitative nature. Notions, such as Security Metrics, Quality of Protection (QoP) and Protection Level Agreements (PLA), have surfaced in the literature, but they still have a qualitative flavor. Furthermore, many recorded security incidents have a non-IT cause.

Measuring Cyber Security and Information Assurance State-of-the-Art Report (SOAR) 183
Appendix D Conferences and Workshops
As a result, security requires a much wider notion of “system” than do most other fields in computer science. In addition to the IT infrastructure, the “system” in security includes users, work processes, and organizational structures.
For more information: http://qop-workshop.org (Accessed 3 February 2009)

Measuring Cyber Security and Information Assurance State-of-the-Art Report (SOAR)184
EResearch and Emerging Methods Summary
Table E-1 provides an extensive listing of current CS/IA measurement research activities. Excluded from this table are research activities about which conference papers were published, but about which no additional information (e.g., sponsorship of the research) could be discovered. This table should not be interpreted as an exhaustive listing of research, but rather as representative of the types of research activities that have been underway in the years 2000 to 2008.

Measuring Cyber Security and Information Assurance State-of-the-Art Report (SOAR) 185
Appendix E Research and Emerging Methods Summary
Tabl
e E-
1 C
S/IA
Mea
sure
men
t Res
earc
h
Inst
itutio
nPr
ojec
t/Pr
ogra
mD
escr
iptio
nU
RL o
r Ref
eren
ce
Air
Forc
e Re
sear
ch L
abor
ator
y A
nti-T
ampe
r/So
ftw
are
Prot
ectio
n In
itiat
ive
(ATS
PI)
Tech
nolo
gy O
ffice
A Th
reat
-Driv
en, S
yste
m
Desi
gn/A
sses
smen
t Hyp
othe
sis
for C
yber
Sec
urity
: The
Thr
ee
Tene
ts A
lgor
ithm
Deve
lope
d ba
sed
on a
heu
ristic
sec
ure
syst
em d
evel
opm
ent a
lgor
ithm
use
d by
the
ATSP
I Tec
hnol
ogy
Offic
e fo
r the
last
sev
en y
ears
, the
Thr
ee T
enet
s Al
gorit
hm is
ba
sed
on a
fram
ewor
k in
whi
ch a
ll sy
stem
thre
ats
are
deco
mpo
sed
into
the
follo
win
g th
ree
elem
ents
: (1)
sus
cept
ibili
ties
(logi
cal a
nd p
hysi
cal s
yste
m a
cces
s po
ints
); (2
) acc
essi
bilit
y by
thre
ats
to th
ose
acce
ss p
oint
s (“t
hrea
t” b
eing
defi
ned
as
the
user
in a
giv
en u
se c
ase)
; (3)
abi
lity
of th
e th
reat
to e
xplo
it th
ose
acce
ss p
oint
s.
The
Thre
e Te
nets
, whi
ch a
re a
pplie
d du
ring
syst
em d
esig
n to
add
ress
thes
e th
ree
elem
ents
of t
he th
reat
dec
ompo
sitio
n, a
re: (
1) In
clud
e on
ly m
issi
on-e
ssen
tial
func
tions
, the
reby
min
imizi
ng in
here
nt s
usce
ptib
ilitie
s, a
nd e
num
erat
e cr
itica
l se
curit
y co
ntro
ls fo
r tho
se m
issi
on fu
nctio
ns. (
2) L
ogic
ally
and
/or p
hysi
cally
mov
e da
ta/p
roce
sses
for e
ssen
tial m
issi
on e
lem
ents
and
thei
r ass
ocia
ted
secu
rity
cont
rols
“out
-of-b
and”
to e
limin
ate
thre
at a
cces
s to
thos
e da
ta/p
roce
sses
and
thei
r as
soci
ated
con
trol
s; (3
) Em
ploy
det
ectio
n, re
actio
n, a
nd a
dapt
atio
n te
chno
logi
es
that
use
aut
omat
ic/a
uton
omic
sys
tem
resp
onse
to m
itiga
te th
reat
exp
loita
tion
atte
mpt
s. A
dher
ence
to th
e Th
ree
Tene
ts is
exp
ecte
d to
resu
lt in
(1) a
bilit
y to
as
sem
ble
secu
re s
yste
ms
from
com
mer
cial
com
pone
nts
(the
Thre
e Te
nets
hol
d pr
omis
e as
an
algo
rithm
to a
ssis
t in
secu
re s
yste
m c
ompo
sabi
lity)
, and
(2) s
uper
ior
miti
gatio
n of
nat
ion
stat
e cl
ass
thre
ats.
Ext
ensi
ve re
sear
ch a
nd e
xper
imen
tatio
n (in
clud
ing
sim
ulat
ions
usi
ng Q
uERI
ES, “
blac
k ha
ttin
g,”
and
red
team
ing)
are
un
derw
ay to
det
ect a
nd e
xam
ine
cond
ition
s th
at in
valid
ate
the
eith
er o
f the
se
expe
cted
resu
lts, a
nd to
iden
tify
whi
ch T
enet
s ar
e ne
cess
ary
but n
ot s
uffic
ient
on
thei
r ow
n to
miti
gate
nat
ion
stat
e th
reat
s. Q
uant
itativ
e m
easu
rem
ents
of a
dher
ence
to
the
Thre
e Te
nets
are
bei
ng re
fined
; the
se m
easu
rem
ents
are
app
licab
le b
oth
durin
g th
e sy
stem
des
ign
phas
e an
d du
ring
afte
r-the
-fact
sys
tem
ass
essm
ents
.
http
://sp
i.dod
.mil/
tene
ts.h
tm

Measuring Cyber Security and Information Assurance State-of-the-Art Report (SOAR)186
Appendix E Research and Emerging Methods Summary
Inst
itutio
nPr
ojec
t/Pr
ogra
mD
escr
iptio
nU
RL o
r Ref
eren
ce
AM
BER
Con
sort
ium
(F
acul
dad
de C
ienc
ias
e Te
cnol
ogia
da
Uni
vers
idad
e de
Coi
mbr
a,
Bud
apes
t Uni
vers
ity
of
Tech
nolo
gy a
nd E
cono
mic
s,
City
, Cha
lmer
s U
nive
rsit
y of
Te
chno
logy
, Uni
vers
ity
of
Flor
ence
, Uni
vers
ity
of
New
cast
le u
pon
Tyne
, Re
silT
ech
S.R.
L.
Spon
sore
d un
der E
urop
ean
Uni
on In
form
atio
n an
d Co
mm
unic
atio
n Te
chno
logi
es
(ICT)
Sev
enth
Fra
mew
ork
Prog
ram
(FW
P 7)
ICT-
2007
.1.4
“S
ecur
e, D
epen
dabl
e
and
Trus
ted
Infr
astr
uctu
res
Re
sear
ch A
rea”
Asse
ssin
g, M
easu
ring,
an
d Be
nchm
arki
ng R
esili
ence
(A
MBE
R)
Defin
e m
easu
rem
ent a
nd b
ench
mar
king
tech
niqu
es a
nd m
etric
s fo
r com
para
tivel
y ev
alua
ting
the
resi
lienc
e an
d de
term
inin
g th
e tr
ustw
orth
ines
s of
com
pute
r sy
stem
s, n
etw
orks
, inf
orm
atio
n in
fras
truc
ture
s, a
nd th
eir c
ompo
nent
s.
AMBE
R pr
ojec
t Web
pag
e. A
cces
sed
7 Fe
brua
ry 2
009
at:
http
://am
ber.d
ei.u
c.pt
/inde
x.ph
p

Measuring Cyber Security and Information Assurance State-of-the-Art Report (SOAR) 187
Appendix E Research and Emerging Methods Summary
Inst
itutio
nPr
ojec
t/Pr
ogra
mD
escr
iptio
nU
RL o
r Ref
eren
ce
ATSP
I Tec
hnol
ogy
Offi
ce,
Air
Forc
e Re
sear
ch L
abor
ator
y,
Wrig
ht-P
atte
rson
Air
Forc
e B
ase,
Ohi
o.
A Th
reat
Driv
en, S
yste
m
Desi
gn/A
sses
smen
t Hyp
othe
sis
for C
yber
Sec
urity
: The
Thr
ee
Tene
ts A
lgor
ithm
.
A th
reat
driv
en, s
ecur
e sy
stem
des
ign/
asse
ssm
ent h
ypot
hesi
s ha
s be
en d
evel
oped
ba
sed
on a
heu
ristic
alg
orith
m u
sed
by th
e AT
SPI T
echn
olog
y Of
fice
in s
ecur
e sy
stem
dev
elop
men
t for
the
last
sev
en y
ears
. Firs
t, a
thre
e-pa
rt s
yste
m o
rient
ed
thre
at d
ecom
posi
tion
is d
efine
d as
: (1)
sys
tem
sus
cept
ibili
ties
(axi
omat
ical
ly
desc
ribed
as
logi
cal a
nd p
hysi
cal s
yste
m a
cces
s po
ints
); (2
) thr
eat a
cces
sibi
lity
to
thos
e ac
cess
poi
nts
(thre
at =
user
for a
giv
en u
se c
ase)
; and
(3) t
hrea
t cap
abili
ty to
ex
ploi
t tho
se a
cces
s po
ints
. Thi
s de
com
posi
tion
is u
sed
as th
e th
reat
fram
ewor
k fo
r the
Thr
ee T
enet
s. D
urin
g se
cure
sys
tem
des
ign,
the
Thre
e Te
nets
are
app
lied
indi
vidu
ally
to ta
rget
the
thre
e el
emen
ts o
f the
thre
at d
ecom
posi
tion.
The
Thr
ee
Tene
ts: (
1) ze
alou
sly
focu
s on
incl
udin
g on
ly m
issi
on e
ssen
tial f
unct
ions
in th
e sy
stem
und
er d
evel
opm
ent t
o m
inim
ize in
here
nt s
usce
ptib
ilitie
s an
d en
umer
ate
criti
cal s
ecur
ity c
ontr
ols
asso
ciat
ed w
ith th
ose
mis
sion
func
tions
; (2)
mov
e da
ta/
proc
esse
s fo
r the
ess
entia
l mis
sion
ele
men
ts a
nd e
spec
ially
sec
urity
con
trol
s as
soci
ated
with
thos
e fu
nctio
ns ‘o
ut-o
f-ban
d’ e
ither
logi
cally
, phy
sica
lly, o
r bot
h (e
limin
ate
thre
at a
cces
s fo
r a g
iven
use
cas
e); a
nd, fi
nally
(3) e
mpl
oy d
etec
t, re
act,
and
adap
t tec
hnol
ogie
s th
at m
itiga
te th
reat
exp
loita
tion
atte
mpt
s vi
a au
tom
atic
/au
tono
mic
sys
tem
resp
onse
. The
hyp
othe
sis
is th
at a
dher
ence
to th
e Th
ree
Tene
ts
resu
lts in
sec
ure
syst
ems
that
are
com
patib
le w
ith th
e en
terp
rise,
can
be
built
from
co
mm
erci
al c
ompo
nent
s, a
nd re
sult
in s
uper
ior n
atio
n st
ate
clas
s th
reat
miti
gatio
n.
Quan
titat
ive
mea
sure
men
ts o
f Ten
et a
dher
ence
are
bei
ng re
fined
that
can
be
appl
ied
in e
ither
the
syst
em d
esig
n ph
ase
or a
fter
the
fact
in a
sys
tem
ass
essm
ent
proc
ess.
Ext
ensi
ve re
sear
ch a
nd e
xper
imen
tatio
n (in
clud
ing
sim
ulat
ions
suc
h as
Qu
ERIE
S, b
lack
hat
ting,
and
red
team
ing)
are
und
erw
ay to
look
for c
ondi
tions
that
in
valid
ate
the
hypo
thes
is. I
nves
tigat
ions
into
whi
ch te
nets
are
nec
essa
ry, b
ut n
ot
suffi
cien
t con
ditio
ns fo
r nat
ion/
stat
e th
reat
miti
gatio
n, a
re o
ngoi
ng. T
he T
hree
Te
nets
als
o ho
ld p
rom
ise
as a
n al
gorit
hm to
ass
ist i
n se
cure
sys
tem
com
posa
bilit
y.
ATPS
I. “T
he T
hree
Ten
ets
of C
yber
Se
curit
y.” A
cces
sed
20 A
pril
2009
at:
http
://sp
i.dod
.mil/
tene
ts.h
tm

Measuring Cyber Security and Information Assurance State-of-the-Art Report (SOAR)188
Appendix E Research and Emerging Methods Summary
Inst
itutio
nPr
ojec
t/Pr
ogra
mD
escr
iptio
nU
RL o
r Ref
eren
ce
Carle
ton
Uni
vers
ity
Dep
artm
ent o
f Sys
tem
and
Co
mpu
ter E
ngin
eerin
g (fu
nded
by
Sol
ana
Net
wor
ks a
nd C
ITO)
Quan
titat
ive
Eval
uatio
n
of N
etw
ork
Secu
rity
This
pro
ject
inve
stig
ates
the
eval
uatio
n of
net
wor
k se
curit
y us
ing
quan
titat
ive
met
rics.
The
mai
n co
ntrib
utio
n is
the
expe
rimen
tal s
tudy
car
ried
out w
ith re
al
netw
ork
traf
fic. T
he s
tudy
is b
ased
on
our H
iera
rchi
cal Q
uant
itativ
e M
etric
s (H
QM)
mod
el th
at e
nabl
es th
e re
pres
enta
tion
of im
port
ant a
spec
ts o
f net
wor
k se
curit
y us
ing
quan
titat
ive
met
rics.
The
HQM
mod
el w
as e
xper
imen
tally
dem
onst
rate
d th
roug
h an
exa
mpl
e se
t of I
ntru
sion
Det
ectio
n m
etric
s.
F. El
-Has
san,
A. M
atra
wy,
N. S
eddi
gh,
and
B. N
andy
. “Ex
perim
enta
l Eva
luat
ion
of
Net
wor
k Se
curit
y th
roug
h a
Hier
arch
ical
Qu
antit
ativ
e M
etric
s M
odel
”, in
Pr
ocee
ding
s of
the
Inte
rnat
iona
l Con
fere
nce
on C
omm
unic
atio
n, N
etw
ork,
and
Info
rmat
ion
Secu
rity,
Cam
brid
ge,
Mas
sach
uset
ts, O
ctob
er 2
006.
Carn
egie
Mel
lon
Uni
vers
ity
(P
raty
usa
K. M
anad
hata
and
Je
anne
tte
M. W
ing)
Spon
sore
d by
Arm
y Re
sear
ch
Offi
ce (A
RO),
Nat
iona
l Sci
ence
Fo
unda
tion
(NSF
), an
d CM
U
Soft
war
e En
gine
erin
g In
stitu
te
Atta
ck S
urfa
ce M
easu
rem
ent
Exte
nd C
MU’
s w
ork
on M
icro
soft
RAS
Q to
pro
duce
a m
etric
to d
eter
min
e w
heth
er
one
vers
ion
of a
sof
twar
e sy
stem
is m
ore
secu
re th
an a
noth
er w
ith re
spec
t to
the
syst
em’s
atta
ck s
urfa
ce (d
efini
ng th
e at
tack
sur
face
of a
sys
tem
in te
rms
of th
e sy
stem
’s at
tack
abili
ty a
long
thre
e ab
stra
ct d
imen
sion
s: m
etho
d, d
ata,
and
cha
nnel
). Un
like
RASQ
, thi
s At
tack
Sur
face
Met
ric w
ill n
ot re
quire
exp
licit
iden
tifica
tion
of
atta
ck v
ecto
rs. F
orm
ally
defi
ne a
nd g
ener
alize
rela
tive
atta
ck s
urfa
ce m
etric
acr
oss
mul
tiple
sof
twar
e sy
stem
s us
ing
entr
y an
d ex
it po
ints
inst
ead
of ro
ot a
ttac
k ve
ctor
s to
iden
tify
the
reso
urce
s th
at c
ontr
ibut
e to
sof
twar
e at
tack
sur
face
. Pr
oduc
e a
sem
i-for
mal
mat
hem
atic
al m
odel
with
litt
le s
ubje
ctiv
e an
alys
is a
s th
e ba
sis
for p
rodu
cing
a m
etric
that
is c
onsi
sten
t acr
oss
mul
tiple
type
s of
sof
twar
e.
Deliv
ery
to d
ate:
plu
g-in
for t
he E
clip
se ID
E th
at p
erfo
rms
maj
ority
of t
he
calc
ulat
ions
requ
ired
for t
he n
ew m
etric
. The
rese
arch
ers
expe
ct to
the
met
ric to
de
mon
stra
te w
hat a
ppea
rs in
tuiti
ve: t
he la
rger
the
atta
ck s
urfa
ce, t
he m
ore
likel
y th
e sy
stem
will
be
atta
cked
, and
hen
ce th
e m
ore
inse
cure
it is
.
CMU
Atta
ck S
urfa
ce M
easu
rem
ent p
roje
ct
Web
pag
e. A
cces
sed
29 J
anua
ry 2
009
at:
http
://w
ww
.cs.
cmu.
edu/
~pra
tyus
/as.
htm
l-a
nd-
Prat
yusa
K. M
anad
hata
and
Jea
nnet
te M
. W
ing,
CM
U. A
n At
tack
Sur
face
Met
ric.
Tech
nica
l Rep
ort C
MU
-CS-
05-1
55,
July
200
5. A
cces
sed
29 J
anua
ry 2
009
at:
http
://re
port
s-ar
chiv
e.ad
m.c
s.cm
u.ed
u/an
on/2
005/
CMU
-CS-
05-1
55.p
df-a
nd-
Man
adha
ta, P
raty
usa
K. a
nd J
eann
ette
M.
Win
g, C
MU.
An
Atta
ck S
urfa
ce M
etric
. Pr
ocee
ding
s of t
he U
SEN
IX S
ecur
ity W
orks
hop
on S
ecur
ity M
etric
s (M
etriC
on), V
anco
uver
, Br
itish
Col
umbi
a, C
anad
a, A
ugus
t 200
6.
Acce
ssed
29
Janu
ary 2
009
at: h
ttp://
ww
w.
cs.c
mu.
edu/
~pra
tyus
/met
ricon
-a
nd-
Prat
yusa
K. M
anad
hata
, Yue
cel K
arab
ulut
, an
d Je
anne
tte M
. Win
g. “M
easu
ring
the
Atta
ck S
urfa
ces o
f Ent
erpr
ise
Soft
war
e,” in
Pr
ocee
ding
s of
the
Inte
rnat
iona
l Sym
posi
um
on E
ngin
eerin
g Se
cure
Sof
twar
e an
d Sy
stem
s, L
euve
n, B
elgi
um, F
ebru
ary 2
009.

Measuring Cyber Security and Information Assurance State-of-the-Art Report (SOAR) 189
Appendix E Research and Emerging Methods Summary
Inst
itutio
nPr
ojec
t/Pr
ogra
mD
escr
iptio
nU
RL o
r Ref
eren
ce
Carn
egie
Mel
lon
Uni
vers
ity
So
ftw
are
Engi
neer
ing
Inst
itute
Ente
rpris
e Se
curit
y M
etric
sDe
fine
requ
irem
ents
for e
nter
pris
e se
curit
y m
etric
s, to
incl
ude:
(1
) The
y sh
ould
iden
tify
the
‘sec
ure
stat
e’ o
f the
ent
erpr
ise.
(2) T
hey
shou
ld in
dica
te
whe
ther
the
secu
rity
stra
tegy
is a
ligne
d w
ith o
rgan
izat
iona
l driv
ers.
(3) T
hey
shou
ld
indi
cate
whe
ther
ther
e is
an
equi
libriu
m b
etw
een
requ
irem
ents
, eff
orts
, ass
et
valu
es a
nd c
ontr
ols.
(4) T
hey
shou
ld re
veal
whe
ther
risk
man
agem
ent i
s dr
ivin
g de
cisi
ons.
(5) T
hey
shou
ld re
veal
whe
ther
inte
rnal
con
trol
s ar
e su
ppor
ting
secu
rity
stra
tegy
. (6)
The
y sh
ould
reve
al w
heth
er re
sidu
al ri
sk is
in li
ne w
ith ri
sk to
lera
nce.
Ex
ampl
e m
etric
s in
clud
e: n
umbe
r of a
sset
s fo
r whi
ch ri
sk a
sses
smen
ts h
ave
been
co
nduc
ted;
num
ber o
f vio
latio
ns b
y st
aff w
ho h
ave
take
n se
curit
y tr
aini
ng; n
umbe
r of
per
sonn
el w
ith p
erfo
rman
ce c
riter
ia re
late
d to
IA; n
umbe
r of i
nves
tigat
ed
secu
rity
inci
dent
s; n
umbe
r of u
nmiti
gate
d vu
lner
abili
ties
pres
ent i
n ke
y sy
stem
s.
Jam
es F.
Ste
ven
and
Brad
ford
Will
ke,
Carn
egie
Mel
lon
Univ
ersi
ty S
oftw
are
Engi
neer
ing
Inst
itute
. “En
terp
rise
Secu
rity
Met
rics:
Tak
ing
a M
easu
re o
f Wha
t M
atte
rs.”
Pres
ente
d at
Thi
rd A
nnua
l In
form
atio
n Te
chno
logy
and
Net
wor
k Se
curit
y Co
nfer
ence
(Sec
ureI
T 20
05),
Sa
n Di
ego,
Cal
iforn
ia, 1
9-22
Apr
il 20
05
(pre
sent
atio
n re
vise
d Ap
ril 2
006)
. ht
tp://
ww
w.s
ecur
eitc
onf.c
om/O
LD/2
005/
pres
enta
tions
/Ent
erpr
ise%
20Se
curit
y.pdf
Cath
olic
Uni
vers
ity
of L
euve
n (L
ouva
in, B
elgi
um)
Spon
sore
d by
the
Flem
ish
gove
rnm
ent’s
SoB
eNet
pro
ject
Mea
surin
g Fr
amew
ork
for
Soft
war
e Se
curit
y Pr
oper
ties
Defin
e a
stru
ctur
ed fr
amew
ork
of p
rope
rtie
s ad
apte
d fr
om th
e lis
t of s
ecur
ity
prin
cipl
es a
nd m
easu
rem
ent p
ract
ices
in G
. Sto
nebu
rner
’s,
C. H
ayde
n’s,
and
A. F
erin
ga’s
“Eng
inee
ring
prin
cipl
es fo
r inf
orm
atio
n te
chno
logy
se
curit
y,” N
IST
SP 8
00-2
7 Re
v A
(Jun
e 20
04),
M. G
raff
’s an
d
K. v
an W
yk’s
Secu
re c
odin
g: p
rinci
ples
and
pra
ctic
es (O
’Rei
lly, 2
003)
, SSE
-CM
M, a
nd
ISO
1779
9. M
ap th
e de
rived
prin
cipl
es to
the
corr
espo
ndin
g So
ftw
are
Deve
lopm
ent
Life
Cyc
le (S
DLC)
pro
cess
pha
ses
to w
hich
they
app
ly. A
naly
ze th
e se
curit
y pr
inci
ples
that
are
rele
vant
to th
e m
easu
rem
ent o
f sof
twar
e se
curit
y pr
oper
ties,
an
d pr
opos
e su
itabl
e m
etric
s to
mea
sure
them
. Thi
s w
ork
falls
und
er S
oBeN
et’s
Soft
war
e Se
curit
y fo
r Net
wor
k Ap
plic
atio
ns p
roje
ct.
Ricc
ardo
Sca
ndar
iato
, Bar
t De
Win
, and
W
oute
r Joo
sen,
Kat
holie
ke U
nive
rsite
it Le
uven
. “To
war
ds a
Mea
surin
g Fr
amew
ork
for S
ecur
ity P
rope
rtie
s of
Sof
twar
e,”
in
Proc
eedi
ngs
of th
e 2n
d AC
M W
orks
hop
on
Qual
ity o
f Pro
tect
ion
(QOP
200
6),
Alex
andr
ia, V
irgin
ia, 3
0 Oc
tobe
r 200
6.
Acce
ssed
8 J
anua
ry 2
009a
at:
ht
tp://
ww
w.c
s.ku
leuv
en.b
e/~r
icca
rdo/
uplo
ads/
docs
/qop
2006

Measuring Cyber Security and Information Assurance State-of-the-Art Report (SOAR)190
Appendix E Research and Emerging Methods Summary
Inst
itutio
nPr
ojec
t/Pr
ogra
mD
escr
iptio
nU
RL o
r Ref
eren
ce
Cath
olic
Uni
vers
ity
of L
euve
n (T
hom
as H
eym
an a
nd
Chris
toph
e H
uyge
ns)
Met
rics
Asso
ciat
ed
with
Sec
urity
Pat
tern
sIn
vest
igat
e w
ays
in w
hich
sec
urity
met
rics
can
be d
irect
ly a
ssoc
iate
d w
ith
soft
war
e se
curit
y pa
tter
ns to
mea
sure
the
effe
ctiv
enes
s of
thos
e pa
tter
ns in
se
curin
g th
e so
ftw
are
syst
em. T
he s
ecur
ity p
atte
rns
unde
r con
side
ratio
n de
scrib
e so
ftw
are
secu
rity
func
tiona
lity,
so it
is li
kely
that
the
defin
ed m
etric
s w
ill m
easu
re
effe
ctiv
enes
s of
thos
e se
curit
y fu
nctio
ns in
term
s of
pol
icy
enfo
rcem
ent a
nd/o
r in
trus
ion/
com
prom
ise
prev
entio
n.
Thom
as H
eym
an, R
icca
rdo
Scan
daria
to,
Chris
toph
e Hu
ygen
s, an
d W
oute
r Joo
sen,
Ca
thol
ic Un
iver
sity
of L
euve
n. “
Usin
g Se
curit
y Pat
tern
s to
Com
bine
Sec
urity
M
etric
s,” in
Pro
ceed
ings
of t
he Th
ird
Inte
rnat
iona
l IEE
E Co
nfer
ence
on
Avai
labi
lity,
Relia
bilit
y, an
d Se
curit
y, Ba
rcel
ona,
Spa
in, 4
-7
Mar
ch 2
008,
pp.
1156
-1163
. Dig
ital O
bjec
t Id
entifi
er: 1
0.11
09/A
RES.
2008
.54
-and
-Th
omas
Hey
man
, Chr
isto
phe
Huyg
ens,
and
W
oute
r Joo
sen,
Cat
holic
Uni
vers
ity o
f Le
uven
. “De
velo
ping
sec
ure
appl
icat
ions
w
ith m
etric
s in
min
d.”
Pres
ente
d at
M
etric
on 2
.0, B
osto
n, M
assa
chus
etts
, 7
Augu
st 2
007.
Acc
esse
d 16
Feb
ruar
y 20
09
at: h
ttp:
//w
ww
.sec
urity
met
rics.
org/
cont
ent/
atta
ch/M
etric
on2.
0/he
yman
-m
etric
on2-
prin
t.pdf
-a
lso-
ht
tp://
ww
w.s
inte
f.no/
uplo
ad/I
KT/9
013/
secu
rity/
heym
an-s
ecse
08.p
df
Colo
rado
Sta
te U
nive
rsit
y
(O.H
. Alh
azm
i, Y.
K. M
alai
ya, I
. Ra
y)
Pred
ictiv
e Un
disc
over
ed
Vuln
erab
ility
Den
sity
Met
ricAd
apt q
uant
itativ
e re
liabi
lity
met
rics
to p
redi
ctio
n of
vul
nera
bilit
y de
nsity
in fu
ture
so
ftw
are
rele
ases
. Ana
lyze
dat
a on
vul
nera
bilit
ies
foun
d in
pop
ular
ope
ratin
g sy
stem
s to
det
erm
ine
whe
ther
“vul
nera
bilit
y de
nsity
” is
eve
n us
eful
as
a m
etric
and
, if
so, w
heth
er it
is p
ossi
ble
to p
inpo
int t
he fr
actio
n of
all
soft
war
e de
fect
s th
at h
ave
secu
rity
impl
icat
ions
. Pro
duce
a “v
ulne
rabi
lity
disc
over
y ra
te”
met
ric th
at q
uant
ifies
di
scov
ered
vul
nera
bilit
ies,
and
extra
pola
te fr
om th
is a
met
ric fo
r est
imat
ing
the
num
ber o
f und
isco
vere
d ( i.e
., hyp
othe
tical
) vul
nera
bilit
ies
in fu
ture
sof
twar
e.
O. H
. Alh
azm
i, Y.
K. M
alai
ya, a
nd I.
Ray
. Co
lora
do S
tate
Uni
vers
ity. “
Secu
rity
Vuln
erab
ilitie
s in
Sof
twar
e Sy
stem
s:
A Qu
antit
ativ
e Pe
rspe
ctiv
e.”
http
://w
eb.
arch
ive.
org/
web
/200
7060
9151
527
-and
-ht
tp://
ww
w.c
s.co
lost
ate.
edu/
~mal
aiya
/635
/IFI
P-10

Measuring Cyber Security and Information Assurance State-of-the-Art Report (SOAR) 191
Appendix E Research and Emerging Methods Summary
Inst
itutio
nPr
ojec
t/Pr
ogra
mD
escr
iptio
nU
RL o
r Ref
eren
ce
Cris
pin
Cow
an
Spon
sore
d by
DA
RPA
Rela
tive
Vuln
erab
ility
Met
ricDe
velo
p a
met
ric th
at c
ompa
res
the
ratio
of e
xplo
itabl
e vu
lner
abili
ties
in a
sys
tem
’s co
mpo
nent
s to
thos
e m
itiga
ted
by s
ecur
ity e
xten
sion
s, th
ereb
y ca
lcul
atin
g th
e pe
rcen
tage
of v
ulne
rabi
litie
s th
at a
re p
rote
cted
by
thos
e ex
tens
ions
and
qua
ntify
ing
the
effe
ctiv
enes
s of
a p
artic
ular
sec
urity
ext
ensi
on/s
olut
ion.
Thi
s m
etric
is o
nly
appl
icab
le to
sec
urity
ext
ensi
ons
in th
at it
mea
sure
s re
lativ
e im
prov
emen
ts o
ver t
he
base
(unp
rote
cted
) sys
tem
s.
Cris
pin
Cow
an. “
Rela
tive
Vuln
erab
ility
: An
Empi
rical
Ass
uran
ce M
etric
.” Pr
esen
ted
at
the
Wor
ksho
p on
Mea
surin
g As
sura
nce
in
Cybe
rspa
ce, 4
4th
IFP
Wor
king
Gro
up, J
une
2003
. Acc
esse
d 3
Febr
uary
200
9 at
: ht
tp://
ww
w2.
laas
.fr/I
FIPW
G/W
orks
hops
&M
eetin
gs/4
4-a
lso-
ht
tp://
ww
w.h
omep
ort.o
rg/~
adam
/sh
moo
con/
shm
ooco
n-co
wan
Eras
mus
Res
earc
h In
stitu
te o
f M
anag
emen
t (ER
IM),
Eras
mus
U
nive
rsit
y Ro
tter
dam
Priv
acy
Met
rics
Defin
e a
set o
f qua
litat
ive
and
quan
titat
ive
priv
acy
met
rics
(qua
ntita
tive
and
qual
itativ
e) p
erta
inin
g to
the
rela
tions
hips
bet
wee
n th
e pr
ivac
y pr
otec
tor a
nd th
e in
form
atio
n ga
ther
er. T
he m
etric
s sh
ould
(1) e
nabl
e th
e as
sess
men
t and
com
paris
on
of u
ser s
cena
rios
and
thei
r diff
eren
ces;
(2) d
efine
a n
otio
n of
a p
rivac
y bo
unda
ry
enco
mpa
ssin
g a
give
n se
t of i
nfor
mat
ion,
beh
avio
rs, a
ctio
ns, a
nd p
roce
sses
to b
e co
vere
d by
a p
rivac
y ag
reem
ent b
etw
een
the
priv
acy
prot
ecto
r and
the
info
rmat
ion
gath
erer
; (3)
cha
ract
erize
the
cont
ribut
ion
of p
rivac
y en
hanc
ing
tech
nolo
gies
(PET
). Th
e re
sear
cher
s ha
ve d
evel
oped
a u
se c
ase
whe
rein
the
qual
itativ
e an
d qu
antit
ativ
e pr
ivac
y m
etric
s ar
e us
ed to
eva
luat
e th
e Ci
sco
Inc.
priv
acy
agre
emen
t.
Loui
s F.
Pau.
“Pr
ivac
y M
etric
s an
d Bo
unda
ries.”
Pub
lishe
d by
Era
smus
Re
sear
ch In
stitu
te o
f Man
agem
ent (
ERIM
) of
Era
smus
Uni
vers
ity R
otte
rdam
, 4
Mar
ch 2
005.
Acc
esse
d 11
Dec
embe
r 20
08 a
t: ht
tp://
repu
b.eu
r.nl/p
ublic
atio
ns/
inde
x/78
3244
873
-als
o-
Acce
ssed
06
Febr
uary
200
9 at
: ht
tp://
publ
ishi
ng.e
ur.n
l/ir/r
epub
/as
set/
1935
/ERS
%20
2005
%20
013%
20LI
S.pd
f
Foun
dsto
ne (P
ravi
r Cha
ndra
)Fl
aw S
ever
ity M
etric
s an
d Se
verit
y-to
-Com
plex
ity M
etric
sRe
sear
ch a
set
of m
etric
s for
: (1)
ratin
g se
verit
y of r
epor
ted
soft
war
e fla
ws (
criti
cal,
high
, med
ium
, low
); (2
) det
erm
inin
g w
heth
er fl
aw re
port
s aff
ect a
pro
duct
’s m
arke
t sh
are,
and
if s
o w
heth
er re
port
s of l
ow s
ever
ity fl
aws r
educ
e m
arke
t sha
re le
ss th
an
repo
rts o
f hig
h se
verit
y flaw
s; (3
) det
erm
inin
g w
heth
er it
is it
pos
sible
to d
irect
ly
corre
late
num
ber a
nd s
ever
ity o
f det
ecte
d fla
ws a
nd v
ulne
rabi
litie
s with
the
com
plex
ity o
f the
cod
e th
at c
onta
ins t
hem
.
Prav
ir Ch
andr
a. “
Code
Met
rics.”
M
etriC
on 1
.0. A
cces
sed
20 A
pril
2009
at:
ht
tp://
ww
w.s
ecur
itym
etric
s.or
g/co
nten
t/at
tach
/Wel
com
e_bl
ogen
try_
0108
06_1
/so
ftw
are_
chan
dra.
ppt

Measuring Cyber Security and Information Assurance State-of-the-Art Report (SOAR)192
Appendix E Research and Emerging Methods Summary
Inst
itutio
nPr
ojec
t/Pr
ogra
mD
escr
iptio
nU
RL o
r Ref
eren
ce
Gjø
vik
Uni
vers
ity
Colle
ge
(Gjø
vik,
Nor
way
) Nor
weg
ian
Info
rmat
ion
Secu
rity
la
bora
tory
(NIS
lab)
Secu
rity
Repo
rtin
gIn
vest
igat
e ho
w re
port
ing
secu
rity
indi
cato
rs to
man
agem
ent c
an c
ontri
bute
to
redu
ctio
n of
vul
nera
bilit
ies
in c
ritic
al in
frast
ruct
ure.
Mod
el/ p
roto
type
a s
ecur
ity
met
rics
Bala
nced
Sco
reca
rd th
at c
an “c
ontin
uous
ly”
valid
ate
the
secu
rity
leve
l of
Proc
ess
Cont
rol S
yste
ms
and
SCAD
A ne
twor
ks. D
escr
ibe
a m
odel
or p
roto
type
of
such
a S
core
card
for s
ecur
ity m
etric
s in
a S
CADA
net
wor
k. C
reat
e a
tool
kit o
f CI/K
R se
curit
y m
etric
s fro
m ri
sk m
anag
emen
t, la
ws,
regu
latio
ns, e
tc.,
rela
ted
to in
form
atio
n se
curit
y in
the
chos
en a
rea
of C
I/KR.
Est
ablis
h a
met
rics
libra
ry, a
tool
for s
ettin
g up
a
met
rics
prog
ram
, stra
tegi
es fo
r aut
omat
ed c
olle
ctio
n of
par
amet
ers,
indi
cato
rs, a
nd
met
rics,
and
stra
tegi
es fo
r rep
rese
ntin
g th
e m
etric
s in
tabl
es, g
raph
s, fi
gure
s, a
nd
Scor
ecar
ds. O
rgan
ize, a
naly
ze, a
nd u
se d
ata
to v
alid
ate
the
usef
ulne
ss o
f the
se
stra
tegi
es, t
ool,
and
libra
ry. D
efine
stra
tegi
es fo
r val
idat
ing
the
accu
racy
of m
etric
s an
d fo
r util
ity c
ompa
ny re
med
iatio
n to
miti
gate
risk
.
Finn
Ola
v Sv
een,
Jos
e M
. Sar
riegi
, Elio
t Ri
ch, a
nd J
ose
J. G
onza
lez,
Gjøv
ik
Univ
ersi
ty C
olle
ge. “
Tow
ard
viab
le
info
rmat
ion
secu
rity
repo
rtin
g sy
stem
s,” in
In
form
atio
n M
anag
emen
t and
Com
pute
r Se
curit
y, Vo
l. 15
Issu
e 5,
200
7, pp
. 408
-419
. Di
gita
l Obj
ect I
dent
ifier
: 10
.1108
/096
8522
0710
8311
43-a
nd-
NIS
lab
Secu
rity
Repo
rtin
g pr
ojec
t Web
pa
ge. A
cces
sed
3 Ap
ril 2
009
at:
http
://w
ww
.nis
lab.
no/r
esea
rch/
proj
ects
/hi
g437
06/li
ve
I3P
Spon
sore
d by
DH
S an
d N
IST
I3P
Proc
ess
Cont
rol S
yste
ms
Secu
rity
Rese
arch
Pro
ject
Inve
stig
ate
way
s to
adv
ance
the
secu
rity
of p
roce
ss c
ontr
ol s
yste
ms
(PCS
), in
clud
ing
thro
ugh
deve
lopm
ent o
f sec
urity
met
rics
for P
CS s
ecur
ity b
y:
(1) i
dent
ifyin
g ex
istin
g m
etric
s an
d st
anda
rds
that
are
or c
an b
e im
med
iate
ly
appl
ied
to o
il an
d ga
s in
dust
ry P
CS; (
2) d
efini
ng s
peci
fic m
etric
s re
quire
men
ts fo
r PC
S se
curit
y m
etric
s; (3
) dev
elop
ing
met
rics
tool
s th
at s
atis
fy th
ese
requ
irem
ents
fo
r use
by
the
oil a
nd g
as in
dust
ry
Inst
itute
for I
nfor
mat
ion
Infr
astr
uctu
re
Prot
ectio
n (I3
P). “
Proc
ess
Cont
rol S
yste
ms
Secu
rity
Rese
arch
Pro
ject
.” Ac
cess
ed 2
2 De
cem
ber 2
008
at:
-and
- M
artin
Sto
ddar
d, C
liff G
lant
z, an
d Ja
mes
Sh
aw, P
acifi
c N
orth
wes
t Nat
iona
l La
bora
tory
, Deb
orah
Bod
eau,
The
MIT
RE
Corp
orat
ion,
Rol
f Car
lson
, San
dia
Nat
iona
l La
bora
torie
s, a
nd Y
acov
Hai
mes
, Che
nyan
g Li
an, a
nd J
oost
San
tos,
Uni
vers
ity o
f Vi
rgin
ia. “
Proc
ess
Cont
rol S
yste
m S
ecur
ity
Met
rics—
Stat
e of
Pra
ctic
e.”
I3P
Rese
arch
Re
port
No.
1, 3
1 Au
gust
200
5. A
cces
sed
3 Ap
ril 2
009
at: h
ttp:
//st
uweb
.ee.
mtu
.ed
u/~s
smoi
ly/s
ectio
n_4.

Measuring Cyber Security and Information Assurance State-of-the-Art Report (SOAR) 193
Appendix E Research and Emerging Methods Summary
Inst
itutio
nPr
ojec
t/Pr
ogra
mD
escr
iptio
nU
RL o
r Ref
eren
ce
Idah
o N
atio
nal L
abor
ator
y,
Sand
ia N
atio
nal L
abor
ator
y,
Secu
ricon
, Geo
rge
Mas
on
Uni
vers
ity
Spon
sore
d by
DH
S N
CSD
Secu
rity
Met
rics
for P
roce
ss
Cont
rol S
yste
ms
Dete
rmin
e th
e ap
plic
abili
ty o
f met
rics
to c
ontr
ol s
yste
ms,
dev
elop
a m
etric
s ta
xono
my
that
bui
lds
on th
e Au
tom
ated
Sys
tem
s Re
fere
nce
Mod
el (A
SRM
) to
clar
ify d
ifficu
lt as
pect
s of
wha
t typ
es o
f met
rics
are
usef
ul a
nd w
here
they
sho
uld
be a
pplie
d, a
nd a
ddre
ss th
e us
e of
met
rics
to b
ench
mar
k co
ntro
l sys
tem
s se
curit
y.
Ron
Halb
gew
achs
and
Ann
ie M
cInt
yre,
Sa
ndia
Nat
iona
l Lab
orat
orie
s. “
Secu
rity
Met
rics
for C
ontr
ol S
yste
ms,”
pre
sent
ed
at 2
006
Nat
iona
l SCA
DA T
est B
ed
Visu
aliz
atio
n an
d Co
ntro
ls P
rogr
am P
eer
Revi
ew. A
cces
sed
11 D
ecem
ber 2
008
at:
http
://w
ww
.oe.
ener
gy.g
ov/
Docu
men
tsan
dMed
ia/S
ecur
ity_M
etric
s_fo
r_Co
ntro
l_Sy
stem
s_Ha
lbge
wac
hs.p
df-a
nd-
McI
ntyr
e, A
nnie
, Bla
ir Be
cker
, Ron
Ha
lbge
wac
hs, S
andi
a N
atio
nal
Labo
rato
ries.
“Se
curit
y M
etric
s fo
r Pr
oces
s Co
ntro
l Sys
tem
s.” S
andi
a Re
port
SA
ND2
007-
2070
P, Se
ptem
ber 2
007.
Ac
cess
ed 1
1 De
cem
ber 2
008
at:
http
://w
ww
.san
dia.
gov/
scad
a/do
cum
ents
/M
cInt
yre-
SAN
D200
7-20
70P.p
df
Inst
itute
for I
nfor
mat
ion
Infr
astr
uctu
re P
rote
ctio
n (I
3P)
Bett
er S
ecur
ity th
roug
h
Risk
Pric
ing
Exte
nds
scor
ing
met
rics
used
in ri
sk-b
ased
mar
kets
, CM
MI,
and
ISO
stan
dard
s th
at
show
the
effe
ctiv
enes
s of
tech
nolo
gies
that
redu
ce a
ttac
k lik
elih
ood
and
orga
niza
tiona
l res
pons
e ca
pabi
litie
s.
Bett
er S
ecur
ity th
roug
h Ri
sk P
ricin
g pr
ojec
t Web
pag
e. A
cces
sed
7 Fe
brua
ry
2009
at:
http
://w
ww
.thei
3p.o
rg/r
esea
rch/
risk_
pric
ing.
htm
l

Measuring Cyber Security and Information Assurance State-of-the-Art Report (SOAR)194
Appendix E Research and Emerging Methods Summary
Inst
itutio
nPr
ojec
t/Pr
ogra
mD
escr
iptio
nU
RL o
r Ref
eren
ce
ISEC
OM
Sour
ce C
ode
Anal
ysis
Ris
k Ev
alua
tion
(SCA
RE) s
ecur
ity
com
plex
ity m
etric
for
mea
surin
g th
e se
curit
y co
mpl
exity
of s
ourc
e co
de
Crea
te a
sec
urity
com
plex
ity m
etric
that
will
ana
lyze
sou
rce
code
and
pro
vide
a
real
istic
and
fact
ual r
epre
sent
atio
n of
the
pote
ntia
l of t
hat s
ourc
e co
de to
cre
ate
a pr
oble
mat
ic b
inar
y by
flag
ging
cod
e fo
r a p
artic
ular
inte
ract
ion
type
or c
ontr
ol a
nd
allo
win
g th
e de
velo
per t
o un
ders
tand
whi
ch O
pera
tiona
l Sec
urity
(OpS
ec) h
oles
are
no
t pro
tect
ed. T
he g
oal o
f thi
s st
udy
is to
app
ly th
e re
sear
ch fi
ndin
gs to
use
OpS
ec
(“ho
les”
in th
e la
yers
of p
rote
ctio
n), C
ontr
ols
(miti
gatio
ns fo
r tho
se h
oles
), an
d Li
mita
tions
(pro
blem
s/fa
ilure
s w
ithin
OpS
ec a
nd C
ontr
ols)
to c
alcu
late
a S
CARE
va
lue,
that
is c
ompa
rabl
e to
a R
AV, w
hich
refle
cts
the
degr
ee (p
erce
ntag
e) o
f eq
uilib
rium
exi
stin
g be
twee
n Op
Sec
hole
s, C
ontr
ols,
and
lack
of L
imita
tions
. The
SC
ARE
is in
tend
ed to
wor
k w
ith c
ode
in a
ny p
rogr
amm
ing
lang
uage
, but
has
onl
y be
en d
emon
stra
ted
agai
nst C
sou
rce
code
.
Acce
ssed
29
Janu
ary
2009
at:
http
://w
ww
.isec
om.in
fo/m
irror
/SCA
RE.0
.3.p
df-a
nd-
Pete
Her
zog.
SCA
RE -
The
Sour
ce C
ode
Anal
ysis
Ris
k Ev
alua
tion.
Acc
esse
d 29
Ja
nuar
y 20
09 a
t: ht
tp://
ww
w.is
ecom
.org
/re
sear
ch/s
care
.sht
ml
MA
STE
R Co
nsor
tium
(ATO
S O
rigin
Soc
ieda
d A
nóni
ma
Espa
ñola
, SA
P, U
nive
rsità
di
Tren
to, E
ngin
eerin
g In
gegn
eria
In
form
atic
a S.
p.A
., B
ritis
h Te
leco
m, E
TH, U
nive
rsit
y of
St
uttg
art,
LERO
, AN
ECT,
D
eloi
tte,
IBM
, CES
CE,
Fond
azio
ne S
an R
afae
le,
Stift
else
n SI
NTE
F)
Spon
sore
d un
der E
urop
ean
Uni
on In
form
atio
n an
d Co
mm
unic
atio
n Te
chno
logi
es
(ICT)
Sev
enth
Fra
mew
ork
Prog
ram
(FW
P 7)
ICT-
2007
.1.4
“S
ecur
e, d
epen
dabl
e
and
trus
ted
infr
astr
uctu
res
Re
sear
ch A
rea”
Man
agin
g As
sura
nce,
Sec
urity
an
d Tr
ust f
or s
ERvi
ces (
MAS
TER)
Deve
lop
met
hodo
logi
es a
nd in
fras
truc
ture
s to
faci
litat
e m
onito
ring,
enf
orce
men
t, au
dit o
f qua
ntifi
able
ass
uran
ce a
nd s
ecur
ity in
dica
tors
, pro
tect
ion
and
regu
lato
ry
mod
els,
mod
el tr
ansf
orm
atio
ns, b
usin
ess
proc
ess
asse
ssm
ent m
etho
d, a
nd
verifi
catio
n to
ols
for u
se w
ith d
ynam
ic s
ervi
ce o
rient
ed a
rchi
tect
ures
(SOA
); ob
ject
ive:
to a
ssur
e th
e se
curit
y le
vels
, tru
st le
vels
, reg
ulat
ory
com
plia
nce
of th
ose
SOAs
. Res
ults
of t
his
rese
arch
: a s
trat
egic
com
pone
nt o
f Eur
opea
n Te
chno
logy
Pl
atfo
rm N
ESSI
Sec
urity
and
Tru
st p
illar
.
MAS
TER
proj
ect W
eb p
age.
Acc
esse
d
7 Fe
brua
ry 2
009
at:
http
://w
ww
.mas
ter-f
p7.e
u/

Measuring Cyber Security and Information Assurance State-of-the-Art Report (SOAR) 195
Appendix E Research and Emerging Methods Summary
Inst
itutio
nPr
ojec
t/Pr
ogra
mD
escr
iptio
nU
RL o
r Ref
eren
ce
Nav
al R
esea
rch
Labo
rato
ry
(NRL
) Cen
ter f
or H
igh
Ass
uran
ce C
ompu
ter S
yste
ms
(CH
ACS
) (Jo
hn M
cDer
mot
t)
Quan
titat
ive
Atta
ck P
oten
tial
Base
d Su
rviv
abili
ty M
odel
ing
for H
igh
Cons
eque
nce
Syst
ems
Defin
e a
met
hodo
logy
for u
sing
Per
form
ance
Eva
luat
ion
Proc
ess
Alge
bra
(PEP
A) to
m
athe
mat
ical
ly m
odel
and
qua
ntify
the
surv
ivab
ility
of a
sof
twar
e-ba
sed
syst
em to
w
hat h
e te
rms
“hum
an s
pons
ored
” (ra
ther
than
sto
chas
tic) f
aults
. Qua
ntifi
catio
n is
ac
hiev
ed u
sing
mea
n tim
e to
dis
cove
ry o
f a v
ulne
rabi
lity
as th
e m
etric
, i.e
., th
e lo
nger
a v
ulne
rabi
lity
goes
und
isco
vere
d du
e to
lack
of a
ctiv
atio
n of
the
asso
ciat
ed
faul
t, th
e lo
nger
the
soft
war
e sy
stem
is c
onsi
dere
d to
hav
e su
rviv
ed in
the
unde
tect
ed p
rese
nce
of th
at fa
ult.
John
McD
erm
ott,
NRL
CHA
CS. “
Atta
ck-
Pote
ntia
l-bas
ed S
urvi
vabi
lity
Mod
elin
g fo
r Hi
gh-C
onse
quen
ce S
yste
ms,”
in
Proc
eedi
ngs
of th
e Th
ird In
tern
atio
nal
Info
rmat
ion
Assu
ranc
e W
orks
hop,
Mar
ch
2005
, 119
–130
. Acc
esse
d 31
Jul
y 20
07 a
t:
http
://ch
acs.
nrl.n
avy.m
il/pu
blic
atio
ns/
CHAC
S/20
05/2
005m
cder
mot
t-IW
IA05
prep
rint.p
df
Offi
ce o
f the
Dep
uty
Und
er
Secr
etar
y D
efen
se
(Sci
ence
& T
echn
olog
y)
Ant
i-Tam
per/
Soft
war
e Pr
otec
tion
Initi
ativ
e (A
T/SP
I)
Quan
titat
ive
Eval
uatio
n of
Ris
k fo
r Inv
estm
ent E
ffici
ent
Stra
tegi
es (Q
uERI
ES)
Deve
lop
an a
dapt
able
met
hodo
logy
for q
uant
itativ
e cy
ber s
ecur
ity ri
sk a
sses
smen
t, us
ing
quan
titat
ive
tech
niqu
es fr
om c
ompu
ter s
cien
ce, g
ame
theo
ry, c
ontro
l the
ory,
and
econ
omic
s. In
itial
test
ing
of Q
uERI
ES h
as b
een
perf
orm
ed in
sm
all-s
cale
but
re
alis
tic re
ad te
amin
g, b
lack
hat
ana
lysi
s, an
d cy
ber s
ecur
ity ri
sk a
sses
smen
t sc
enar
ios
focu
sed
on p
rote
ctio
n of
hig
h-va
lue
DoD
inte
llect
ual p
rope
rty
( e.g
., w
eapo
ns s
yste
m a
nd c
hip
desi
gns,
com
plex
sof
twar
e de
sign
s) fo
r whi
ch a
sin
gle
loss
w
ould
be
cata
stro
phic
.
Law
renc
e Ca
rin, D
uke
Univ
ersi
ty, G
eorg
e Cy
benk
o, D
artm
outh
Col
lege
, and
Jef
f Hu
ghes
, Air
Forc
e Re
sear
ch L
abor
ator
y (A
FRL)
. “Qu
antit
ativ
e Ev
alua
tion
of R
isk
for
Inve
stm
ent E
ffici
ent S
trat
egie
s in
Cy
bers
ecur
ity: T
he Q
uERI
ES
Met
hodo
logy
.” AF
RL/W
S-07
-214
5,
Sept
embe
r 200
7 Ac
cess
ed 1
6 Fe
brua
ry
2009
at:
http
://w
ww
.sec
urity
met
rics.
org/
cont
ent/
atta
ch/M
etric
on3.
0/m
etric
on3-
cybe
nko%
20ar
ticle
Penn
sylv
ania
Sta
te U
nive
rsit
y,
Poly
tech
nic
Uni
vers
ity,
SA
PSe
curit
y Sc
orin
g Ve
ctor
(S
-Vec
tor)
for W
eb A
pplic
atio
nsDe
velo
p “a
mea
ns to
com
pare
the
secu
rity o
f diff
eren
t app
licat
ions
, and
the
basis
for
asse
ssin
g if
an a
pplic
atio
n m
eets
a s
et o
f pre
scrib
ed s
ecur
ity re
quire
men
ts.”
The
S-ve
ctor
mea
sure
will
rate
a W
eb a
pplic
atio
n’s im
plem
enta
tion
agai
nst i
ts re
quire
men
ts
for:
(1) te
chni
cal c
apab
ilitie
s (i.e
., sec
urity
func
tions
); (2
) stru
ctur
al p
rote
ctio
n ( i.e
., se
curit
y pro
perti
es);
(3) p
roce
dura
l met
hods
( i.e.,
pro
cess
es u
sed
in d
evel
opin
g,
valid
atin
g, a
nd d
eplo
ying
/con
figur
ing
the
appl
icat
ion)
. Tog
ethe
r the
se ra
tings
will
be
used
to p
rodu
ce a
n ov
eral
l sec
urity
sco
re ( i.
e., th
e S-
vect
or) f
or th
e ap
plic
atio
n.
Russ
el B
arto
n, W
illia
m H
ery,
and
Peng
Liu
. “A
n S-
vect
or fo
r Web
App
licat
ion
Secu
rity
Man
agem
ent.”
Pen
n St
ate
Univ
ersi
ty.
Acce
ssed
9 F
ebru
ary
2009
at:
ht
tp://
ww
w.s
mea
l.psu
.edu
/cdt
/ebr
cpub
s/re
s_pa
pers
/200
4_01

Measuring Cyber Security and Information Assurance State-of-the-Art Report (SOAR)196
Appendix E Research and Emerging Methods Summary
Inst
itutio
nPr
ojec
t/Pr
ogra
mD
escr
iptio
nU
RL o
r Ref
eren
ce
Polit
ecni
co d
i Tor
ino
(Ita
ly),
Wro
claw
Uni
vers
ity
of
Tech
nolo
gy (P
olan
d), S
tiftu
ng
Secu
re In
form
atio
n an
d Co
mm
unic
atio
n Te
chno
logi
es
(Aus
tria
), Vo
dafo
ne O
mni
tel
NV
(Ita
ly),
Bul
l SA
(Fra
nce)
, Sa
int P
eter
sbur
g (R
ussi
a)
Inst
itute
for I
nfor
mat
ics
and
Aut
omat
ion
of th
e Ru
ssia
n A
cade
my
of S
cien
ces,
M
inis
tero
del
la G
iust
izia
(I
taly
), U
nive
rsid
ad d
e M
urci
a (S
pain
), PR
ESEC
URE
Co
nsul
ting
Gm
bH (G
erm
any)
, B
earin
gPoi
nt IN
FON
OVA
G
mbH
(Ger
man
y; u
ntil
2005
Spon
sore
d by
the
Euro
pean
Co
mm
issi
on
Polic
y-ba
sed
Secu
rity
Tool
s
and
Fram
ewor
k (P
OSIT
IF)
A m
ajor
asp
ect o
f POS
ITIF
’s re
sear
ch fo
cuse
s on
defi
ning
and
usi
ng fo
rmal
mod
els,
at
tack
gra
phs,
and
sim
ulat
ions
to e
nabl
e se
curit
y m
easu
rem
ent.
POSI
TIF
Proj
ect O
verv
iew
. Acc
esse
d
16 F
ebru
ary
2009
at:
http
://w
ww
.pos
itif.o
rg

Measuring Cyber Security and Information Assurance State-of-the-Art Report (SOAR) 197
Appendix E Research and Emerging Methods Summary
Inst
itutio
nPr
ojec
t/Pr
ogra
mD
escr
iptio
nU
RL o
r Ref
eren
ce
St. P
eter
sbur
g In
stitu
te fo
r In
form
atic
s an
d A
utom
atio
n (S
PIIR
AS)
Com
pute
r Sec
urit
y Re
sear
ch G
roup
Spon
sore
d by
Rus
sian
Fo
unda
tion
of B
asic
Res
earc
h,
2004
-200
6
Mod
elin
g of
info
rmat
ion
secu
rity
proc
esse
s in
com
pute
r ne
twor
ks in
adv
ersa
rial
envi
ronm
ent:
form
al fr
amew
ork,
m
athe
mat
ical
mod
els,
m
ulti-
agen
t arc
hite
ctur
e,
soft
war
e pr
otot
ype
and
expe
rimen
tal e
valu
atio
n
Rese
arch
resu
lts in
clud
e: (1
) dev
elop
men
t of m
odel
s of
com
pute
r att
acks
and
m
alef
acto
r, at
tack
tree
form
atio
n an
d an
est
imat
ion
of c
ompu
ter n
etw
ork
secu
rity
leve
l; (2
) dev
elop
men
t of s
uppo
rtin
g au
tom
ated
tech
niqu
e an
d so
ftw
are
tool
for
deta
iled
anal
ysis
of c
ompu
ter n
etw
ork
secu
rity
base
d on
the
mal
efac
tor m
odel
s.
Igor
Kot
enko
and
Mik
hail
Step
ashk
in.
“Att
ack G
raph
Bas
ed E
valu
atio
n of
Net
wor
k Se
curit
y”, i
n Pr
ocee
ding
s of t
he 1
0th
IFIP
Conf
eren
ce o
n Co
mm
unic
atio
ns a
nd
Mul
timed
ia S
ecur
ity (C
MS
2006
), Her
aklio
n,
Gree
ce, 1
9-21
Oct
ober
200
6, p
p. 2
16-2
27.
Acce
ssed
13
April
200
9 at
: htt
p://c
omse
c.sp
b.ru
/en/
pape
rs/3
1/ge
tfile
-and
- Ig
or K
oten
ko a
nd M
ikha
il St
epas
hkin
. “N
etw
ork
Secu
rity
Eval
uatio
n Ba
sed
on
Sim
ulat
ion
of M
alef
acto
r’s B
ehav
ior,”
in
Pro
ceed
ings
of t
he In
tern
atio
nal
Conf
eren
ce o
n Se
curit
y an
d Cr
ypto
grap
hy
(SEC
RYPT
200
6), P
ortu
gal,
7-10
Aug
ust
2006
, pp.
339
-344
. Acc
esse
d 13
Apr
il 20
09
at: h
ttp:
//st
epas
hkin
.com
/pub
s/20
06/
secr
ypt-0
6-pa
per.p
df-a
lso-
ht
tp://
com
sec.
spb.
ru/e
n/pa
pers
/67/
getfi
le-a
nd-
Igor
Kot
enko
and
Mik
hail
Step
ashk
in.
“Ana
lyzin
g ne
twor
k se
curit
y us
ing
mal
efac
tor a
ctio
n gr
aphs
,” in
Inte
rnat
iona
l Jo
urna
l of C
ompu
ter S
cien
ce a
nd N
etw
ork
Secu
rity,
Volu
me
6 N
umbe
r 6, J
une
2006
, pp
. 226
-235
. Acc
esse
d 13
Apr
il 20
09 a
t:
http
://co
mse
c.sp
b.ru
/en/
pape
rs/3
6/ge
tfile

Measuring Cyber Security and Information Assurance State-of-the-Art Report (SOAR)198
Appendix E Research and Emerging Methods Summary
Inst
itutio
nPr
ojec
t/Pr
ogra
mD
escr
iptio
nU
RL o
r Ref
eren
ce
Sand
ia N
atio
nal L
abor
ator
ies
Nat
iona
l SCA
DA T
est B
ed
Visu
aliz
atio
n an
d Co
ntro
ls
Prog
ram
: Sec
urity
Met
rics
fo
r Con
trol
Sys
tem
s
Deve
lop
an a
ppro
ach
to s
ecur
ity m
etric
s as
they
per
tain
to c
ontro
l sys
tem
s, in
clud
ing
deve
lopm
ent o
f a m
etric
s ta
xono
my
and
guid
elin
es fo
r usi
ng m
etric
s. T
his
appr
oach
is
targ
eted
at t
he o
rgan
izatio
nal l
evel
for a
n au
dien
ce o
f ass
et o
wne
rs a
nd c
ontro
l sy
stem
s m
anag
emen
t. Fo
r ass
et o
wne
rs, t
his
mea
ns th
ere
shou
ld b
e a
way
to
mea
sure
and
det
erm
ine
thei
r cur
rent
sec
urity
pos
ture
and
the
impr
ovem
ents
that
will
be
att
aine
d up
on im
plem
enta
tion
of s
tand
ards
for t
hose
con
trol s
yste
ms.
The
fina
l pr
oduc
ts o
f thi
s pr
ojec
t inc
lude
d th
e ta
xono
my,
a re
port
, and
a p
rese
ntat
ion
to
stak
ehol
ders
(if r
equi
red)
. It i
s an
ticip
ated
ass
et o
wne
rs w
ill u
se th
ese
prod
ucts
to
assi
st in
arri
ving
at a
sec
urity
pla
n th
at in
volv
es id
entifi
catio
n of
crit
ical
are
as w
ithin
th
e ar
chite
ctur
e, th
e se
lect
ion
of a
pplic
able
bes
t pra
ctic
es, a
nd th
e de
finiti
on a
nd
appl
icat
ion
of re
leva
nt m
etric
s in
thos
e ar
eas.
Anni
e M
cInt
yre,
Bla
ir Be
cker
, and
Ron
Ha
lbge
wac
hs, S
andi
a N
atio
nal
Labo
rato
ries.
“Se
curit
y M
etric
s fo
r Pr
oces
s Co
ntro
l Sys
tem
s.” S
andi
a Re
port
SA
ND2
007-
2070
P, Se
ptem
ber 2
007.
Ac
cess
ed 7
Feb
ruar
y 20
09 a
t:
http
://w
ww
.san
dia.
gov/
scad
a/do
cum
ents
/M
cInt
yre-
SAN
D200
7-20
70P.p
df

Measuring Cyber Security and Information Assurance State-of-the-Art Report (SOAR) 199
Appendix E Research and Emerging Methods Summary
Inst
itutio
nPr
ojec
t/Pr
ogra
mD
escr
iptio
nU
RL o
r Ref
eren
ce
SERE
NIT
Y Co
nsor
tium
(Ath
ens
Tech
nolo
gy C
ente
r, AT
OS,
Cit
y U
nive
rsit
y of
Lon
don,
Dee
p B
lue,
Eng
inee
ring
Inge
gner
ia
Info
rmat
ica
S.p.
A, F
raun
hofe
r SI
T, C
atho
lic U
nive
rsity
of L
euve
n,*
Tele
foni
ca I+
D, S
AP,
Sec
urit
y Te
chno
logy
Com
pete
nce
Cent
re, S
trat
egie
s Te
leco
ms
&
Mul
timed
ia, T
hale
s, U
nive
rsity
of
Tre
nto,*
Uni
vers
ity
of
Aeg
ean,
Uni
vers
ity
of M
alag
a)
Spon
sore
d un
der E
urop
ean
Com
mis
sion
IST
6th
Fram
ewor
k Pr
ogra
mm
e
* kn
own
to b
e en
gage
d in
SE
REN
ITY m
etric
s-re
late
d re
sear
ch
Syst
em E
ngin
eerin
g fo
r Se
curit
y an
d De
pend
abili
ty
(SER
ENIT
Y)
SERE
NIT
Y ai
ms
at p
rovi
ding
sec
urity
and
dep
enda
bilit
y in
Am
bien
t Int
ellig
ence
sy
stem
s (A
mI).
Wor
k pa
ckag
e 1.
5 of
the
proj
ect f
ocus
es o
n Id
entifi
catio
n of
Se
curit
y &
Priv
acy
thre
ats,
risk
s, a
nd m
etric
s fo
r pat
tern
s in
hig
h-le
vel b
usin
ess,
m
anag
emen
t, an
d or
gani
zatio
nal p
olic
ies
for p
rivac
y an
d se
curit
y at
ent
erpr
ise
leve
l. An
othe
r res
earc
h ac
tivity
focu
sed
on e
xten
ding
a m
odel
-bas
ed a
ppro
ach
to
secu
rity
man
agem
ent t
o in
clud
e co
ncep
ts a
nd m
etho
ds th
at e
nabl
e qu
antit
ativ
e as
sess
men
ts b
ased
on
secu
rity
met
rics
aggr
egat
ed w
ithin
the
fram
ewor
k of
the
unde
rlyin
g m
odel
. Spe
cific
ally
, the
met
rics
are
deriv
ed b
y m
easu
ring
num
bers
of
atta
cks
by c
erta
in th
reat
s, th
en e
stim
atin
g th
eir l
ikel
ihoo
d of
pro
paga
tion
alon
g th
e de
pend
enci
es in
the
unde
rlyin
g m
odel
. Thi
s ap
proa
ch e
nabl
es th
e id
entifi
catio
n of
w
hich
thre
ats
have
the
grea
test
impa
ct o
n bu
sine
ss s
ecur
ity o
bjec
tives
, and
how
va
rious
sec
urity
con
trol
s di
ffer
in th
eir e
ffec
tiven
ess
miti
gatin
g th
ese
thre
ats.
An
othe
r res
earc
h ac
tivity
focu
sed
on in
vest
igat
ing
way
s in
whi
ch s
ecur
ity m
etric
s ca
n be
dire
ctly
ass
ocia
ted
with
sof
twar
e se
curit
y pa
tter
ns to
mea
sure
the
effe
ctiv
enes
s of
thos
e pa
tter
ns in
sec
urin
g th
e so
ftw
are
syst
em. T
he s
ecur
ity
patt
erns
und
er c
onsi
dera
tion
desc
ribe
soft
war
e se
curit
y fu
nctio
nalit
y, so
it is
like
ly
that
the
defin
ed m
etric
s w
ill m
easu
re e
ffec
tiven
ess
of th
ose
secu
rity
func
tions
in
term
s of
pol
icy
enfo
rcem
ent a
nd/o
r int
rusi
on/c
ompr
omis
e pr
even
tion.
Als
o w
ithin
th
is a
ctiv
ity is
an
effo
rt to
defi
ne a
qua
ntita
tive
appr
oach
to a
sses
sing
the
secu
rity
of a
pat
tern
-bas
ed s
oftw
are
arch
itect
ure,
with
sec
urity
pat
tern
s us
ed to
mea
sure
th
e ex
tent
to w
hich
the
arch
itect
ure
is p
rote
cted
aga
inst
rele
vant
thre
ats.
Thr
eat
cove
rage
met
rics
are
asso
ciat
ed w
ith th
e se
curit
y pa
tter
ns, a
nd a
n ag
greg
atio
n al
gorit
hm is
use
d to
com
pute
an
over
all s
ecur
ity in
dica
tor f
or th
e so
ftw
are
desi
gn.
With
suc
h in
dica
tors
app
lied
to d
iffer
ent p
atte
rn-b
ased
des
igns
, the
app
roac
h ai
ds
in c
ompa
ring
the
secu
rity
of d
esig
n al
tern
ativ
es.
SERE
NIT
Y pr
ojec
t. Ac
cess
ed 7
Feb
ruar
y 20
09 a
t: ht
tp://
ww
w.s
eren
ity-p
roje
ct.o
rg-a
nd-
Breu
, Rut
h, F
rank
Inne
rhof
er–O
berp
erfle
r, Fa
bio
Mas
sacc
i, an
d Ar
tsio
m Y
auts
iukh
in.
“Qua
ntita
tive
asse
ssm
ent o
f ent
erpr
ise
secu
rity
syst
em,”
in P
roce
edin
gs o
f the
1st
In
tern
atio
nal W
orks
hop
on P
rivac
y an
d As
sura
nce
(WPA
-200
8), B
arce
lona
, Sp
ain,
4-7
Mar
ch 2
008.
Acc
esse
d 7
Febr
uary
200
9 at
: htt
p://
ww
w.d
it.un
itn.
it/~e
vtiu
khi/R
esou
rces
/BRE
U-0
8-W
PA.p
df
-and
-Ar
tsio
m Y
auts
iukh
in, T
hom
as H
eym
an,
Ricc
ardo
Sca
ndar
iato
, Fab
io M
assa
cci,
and
Wou
ter J
oose
n. “
Tow
ards
a q
uant
itativ
e as
sess
men
t of s
ecur
ity in
sof
twar
e ar
chite
ctur
es,”
in
Proc
eedi
ngs
of th
e 13
th N
ordi
c W
orks
hop
on S
ecur
e IT
Sys
tem
s (N
ordS
ec 2
008)
, Co
penh
agen
, Den
mar
k, 9
-10
Octo
ber 2
008.
Ac
cess
ed 7
Feb
ruar
y 20
09 a
t:
http
://w
ww
.dit.
unitn
.it/~
evtiu
khi/
Reso
urce
s/YA
UT-0
8-N
ordS
ec.p
df
Sola
na N
etw
orks
and
So
mbr
a La
bs
Spon
sore
d by
Dep
tart
men
t of
Publ
ic S
afet
y an
d Em
erge
ncy
Prep
ared
ness
Can
ada
(PSE
PC)
Net
wor
k Se
curit
y M
etric
sA
stat
e of
the
art r
epor
t (ca
200
4) o
f IA
met
rics.
Pro
pose
d a
new
defi
nitio
n of
In
form
atio
n As
sura
nce
that
incl
udes
sec
urity
, qua
lity
of s
ervi
ce, a
nd a
vaila
bilit
y. Ev
alua
ted
curr
ent I
A ta
xono
mie
s an
d pr
opos
ed a
new
taxo
nom
y al
ong
with
a
met
ric th
at re
pres
ents
the
heal
th o
f an
orga
niza
tion’
s ne
twor
k.
Nab
il Se
ddig
h, P
eter
Pie
da, M
atra
wy A
shra
f, Bi
swaj
it N
andy
, Joh
n La
mba
daris
, Ad
am H
atfie
ld. “
Curre
nt Tr
ends
and
Ad
vanc
es in
Info
rmat
ion
Assu
ranc
e M
etric
s.” S
econ
d An
nual
Con
fere
nce
on
Priv
acy,
Secu
rity a
nd Tr
ust.
http
://de
v.hil.u
nb.
ca/T
exts
/PST
/sed
digh
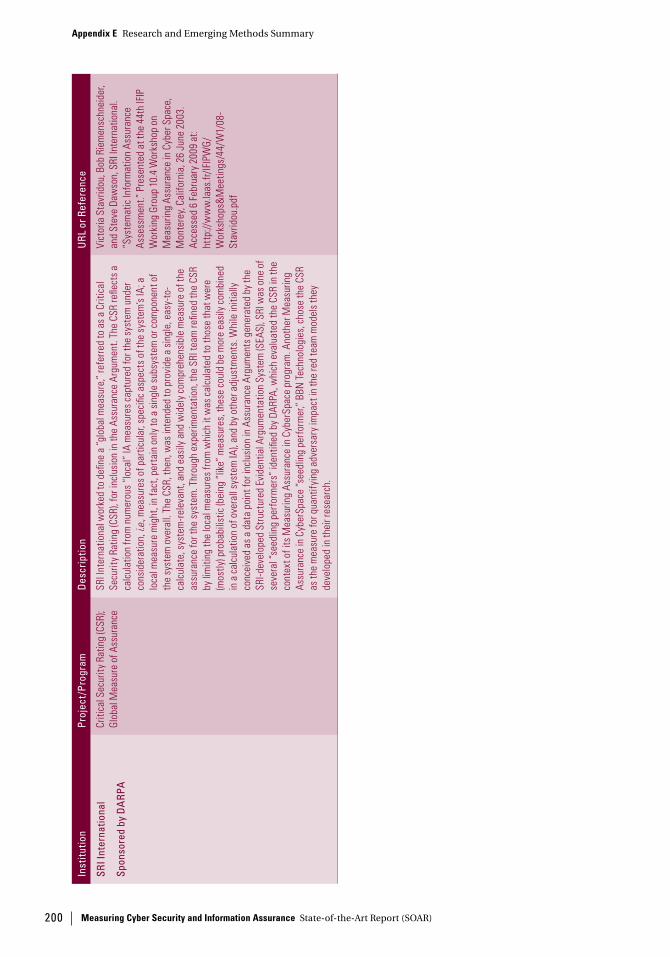
Measuring Cyber Security and Information Assurance State-of-the-Art Report (SOAR)200
Appendix E Research and Emerging Methods Summary
Inst
itutio
nPr
ojec
t/Pr
ogra
mD
escr
iptio
nU
RL o
r Ref
eren
ce
SRI I
nter
natio
nal
Spon
sore
d by
DA
RPA
Criti
cal S
ecur
ity R
atin
g (C
SR);
Glob
al M
easu
re o
f Ass
uran
ceSR
I Int
erna
tiona
l wor
ked
to d
efine
a “g
loba
l mea
sure
,” re
ferr
ed to
as
a Cr
itica
l Se
curit
y Ra
ting
(CSR
), fo
r inc
lusi
on in
the
Assu
ranc
e Ar
gum
ent.
The
CSR
refle
cts
a ca
lcul
atio
n fr
om n
umer
ous
“loc
al”
IA m
easu
res
capt
ured
for t
he s
yste
m u
nder
co
nsid
erat
ion,
i.e.,
mea
sure
s of
par
ticul
ar, s
peci
fic a
spec
ts o
f the
sys
tem
’s IA
; a
loca
l mea
sure
mig
ht, i
n fa
ct, p
erta
in o
nly
to a
sin
gle
subs
yste
m o
r com
pone
nt o
f th
e sy
stem
ove
rall.
The
CSR
, the
n, w
as in
tend
ed to
pro
vide
a s
ingl
e, e
asy-
to-
calc
ulat
e, s
yste
m-r
elev
ant,
and
easi
ly a
nd w
idel
y co
mpr
ehen
sibl
e m
easu
re o
f the
as
sura
nce
for t
he s
yste
m. T
hrou
gh e
xper
imen
tatio
n, th
e SR
I tea
m re
fined
the
CSR
by li
miti
ng th
e lo
cal m
easu
res
from
whi
ch it
was
cal
cula
ted
to th
ose
that
wer
e (m
ostly
) pro
babi
listic
(bei
ng “
like”
mea
sure
s, th
ese
coul
d be
mor
e ea
sily
com
bine
d in
a c
alcu
latio
n of
ove
rall
syst
em IA
), an
d by
oth
er a
djus
tmen
ts. W
hile
initi
ally
co
ncei
ved
as a
dat
a po
int f
or in
clus
ion
in A
ssur
ance
Arg
umen
ts g
ener
ated
by
the
SRI-d
evel
oped
Str
uctu
red
Evid
entia
l Arg
umen
tatio
n Sy
stem
(SEA
S), S
RI w
as o
ne o
f se
vera
l “se
edlin
g pe
rfor
mer
s” id
entifi
ed b
y DA
RPA,
whi
ch e
valu
ated
the
CSR
in th
e co
ntex
t of i
ts M
easu
ring
Assu
ranc
e in
Cyb
erSp
ace
prog
ram
. Ano
ther
Mea
surin
g As
sura
nce
in C
yber
Spac
e “s
eedl
ing
perf
orm
er,”
BBN
Tec
hnol
ogie
s, c
hose
the
CSR
as th
e m
easu
re fo
r qua
ntify
ing
adve
rsar
y im
pact
in th
e re
d te
am m
odel
s th
ey
deve
lope
d in
thei
r res
earc
h.
Vict
oria
Sta
vrid
ou, B
ob R
iem
ensc
hnei
der,
and
Stev
e Da
wso
n, S
RI In
tern
atio
nal.
“Sys
tem
atic
Info
rmat
ion
Assu
ranc
e As
sess
men
t.” P
rese
nted
at t
he 4
4th
IFIP
W
orki
ng G
roup
10.
4 W
orks
hop
on
Mea
surin
g As
sura
nce
in C
yber
Spa
ce,
Mon
tere
y, Ca
lifor
nia,
26
June
200
3.
Acce
ssed
6 F
ebru
ary
2009
at:
ht
tp://
ww
w.la
as.fr
/IFI
PWG/
Wor
ksho
ps&
Mee
tings
/44/
W1/
08-
Stav
ridou

Measuring Cyber Security and Information Assurance State-of-the-Art Report (SOAR) 201
Appendix E Research and Emerging Methods Summary
Inst
itutio
nPr
ojec
t/Pr
ogra
mD
escr
iptio
nU
RL o
r Ref
eren
ce
Stoc
khol
m U
nive
rsit
y/K
THSe
curit
y m
etric
s fo
r eva
luat
ion
of in
form
atio
n sy
stem
s se
curit
yEx
amin
e a
fram
ewor
k th
at c
an b
e us
ed to
dev
elop
Com
mon
Crit
eria
Pro
tect
ion
Profi
les
by a
pply
ing
vario
us e
stab
lishe
d m
easu
rem
ent m
etho
dolo
gies
, inc
ludi
ng
Fede
ral B
ridge
Cer
tifica
tion
Auth
ority
cer
tifica
te p
olic
y as
sura
nce
leve
ls fo
r pub
lic
key
cert
ifica
tes
(Rud
imen
tary
, Bas
ic, M
ediu
m, H
igh)
; Int
erna
tiona
l Sys
tem
s Se
curit
y En
gine
erin
g As
soci
atio
n (IS
SEA)
SSE
-CM
M p
roce
ss a
rea
met
rics
for m
easu
ring
orga
niza
tion
secu
re s
yste
m e
ngin
eerin
g m
atur
ity; C
omm
on C
riter
ia (C
C) a
ssur
ance
le
vels
for r
atin
g as
sura
nce
of e
valu
ated
sec
urity
pro
duct
s; a
nd a
soc
ial-t
echn
ical
m
odel
. Use
the
Com
mon
Crit
eria
to id
entif
y se
curit
y fu
nctio
ns o
f an
X.50
9 ce
rtifi
cate
/PKI
-ena
bled
app
licat
ion,
and
ass
ocia
te o
ne o
r mor
e m
etric
s w
ith e
ach
func
tion
iden
tified
. The
se m
etric
s m
ay fa
ll in
to th
e fo
llow
ing
cate
gorie
s: (1
) Im
pact
m
etric
s, fo
r mea
surin
g im
pact
to th
e or
gani
zatio
n w
hen
a se
curit
y fu
nctio
n is
co
mpr
omis
ed; (
2) R
isk
impa
ct a
nd ri
sk li
kelih
ood
met
rics;
(3) S
ecur
ity s
ervi
ce/
secu
rity
func
tion
assu
ranc
e le
vels
; (4)
Pol
icy
met
rics;
(5) H
uman
fact
ors
met
rics
to
(a) d
elin
eate
ear
ly, l
ate,
and
last
ado
pter
s of
info
rmat
ion
syst
ems
tech
nolo
gy; (
b)
mea
sure
wha
t peo
ple
cons
ider
to b
e et
hica
l on
unet
hica
l in
rega
rd to
com
pute
r m
isus
e an
d cr
ime.
Kevi
n Cl
ark,
Eth
an S
ingl
eton
, Ste
phen
Ty
ree,
and
Joh
n Ha
le, C
haul
a, J
ob A
sher
i, Lo
uise
Yng
strö
m, a
nd S
tew
art K
owal
ski.
“Sec
urity
Met
rics
and
Eval
uatio
n of
In
form
atio
n Sy
stem
s Se
curit
y,” in
Pr
ocee
ding
s of
Info
rmat
ion
Secu
rity
Sout
h Af
rica
Enab
ling
Tom
orro
w C
onfe
renc
e (IS
SA
2004
), M
idra
nd, S
outh
Afr
ica,
30
June
20
04-2
Jul
y 20
04. A
cces
sed
29 D
ecem
ber
2008
at:
http
://ic
sa.c
s.up
.ac.
za/is
sa/2
004/
Proc
eedi
ngs/
Rese
arch
/048

Measuring Cyber Security and Information Assurance State-of-the-Art Report (SOAR)202
Appendix E Research and Emerging Methods Summary
Inst
itutio
nPr
ojec
t/Pr
ogra
mD
escr
iptio
nU
RL o
r Ref
eren
ce
Thal
es C
omm
unic
atio
ns, S
.A.
Spon
sore
d un
der E
urop
ean
Uni
on In
form
atio
n an
d Co
mm
unic
atio
n Te
chno
logi
es
(ICT)
Six
th F
ram
ewor
k Pr
ogra
m
(FW
P 6)
IST-
2004
-2.4
.3
“Tow
ards
a g
loba
l dep
enda
bilit
y an
d se
curit
y fr
amew
ork”
DEpe
ndab
ility
and
Sec
urity
by
Enha
nced
REC
onfig
urab
ility
(D
ESER
EC) P
roje
ct
DESE
REC
invo
lves
dev
elop
men
t of a
ppro
ache
s an
d to
ols
to d
esig
n, m
odel
, sim
ulat
e,
and
plan
crit
ical
infr
astr
uctu
res
to d
ram
atic
ally
impr
ove
thei
r res
ilien
ce, i
nteg
ratio
n of
var
ious
det
ectio
n m
echa
nism
s to
ens
ure
fast
det
ectio
n of
sev
ere
inci
dent
s bu
t al
so to
det
ect c
ompl
ex o
nes,
and
defi
nitio
n of
a fr
amew
ork
for c
ompu
ter-a
ided
co
unte
rmea
sure
s to
resp
ond
in a
qui
ck a
nd a
ppro
pria
te w
ay to
a la
rge
rang
e of
in
cide
nts
and
rapi
dly
miti
gate
the
thre
ats
to d
epen
dabi
lity
thro
ugh
reco
nfigu
ratio
n an
d ot
her s
yste
m/n
etw
ork
surv
ivab
ility
mec
hani
sms.
Spe
cific
met
rics-
rela
ted
wor
k un
der D
ESER
EC in
clud
es th
e us
e of
att
ack
grap
hs to
com
pute
an
“att
acka
bilit
y m
etric
” fo
r sta
tic e
valu
atio
n, a
nd im
plem
enta
tion
of a
sec
urity
ass
uran
ce
asse
ssm
ent s
yste
m (t
he “
Secu
rity
Cock
pit”
) to
gene
rate
the
real
wor
ld e
quiv
alen
ts
of th
e id
entifi
ed s
tatic
met
rics.
Ngu
yen
Pham
, Loï
c Ba
ud, P
atric
k Be
llot,
and
Mic
hel R
igui
del,
Tele
com
Par
is É
cole
N
atio
nale
Sup
érie
ure
des
Télé
com
mun
icat
ions
. “A
Nea
r Rea
l-tim
e Sy
stem
for S
ecur
ity A
ssur
ance
As
sess
men
t,” in
Pro
ceed
ings
of t
he T
hird
In
tern
atio
nal C
onfe
renc
e on
Inte
rnet
M
onito
ring
and
Prot
ectio
n (IC
IMP
2008
), Bu
char
est,
Rom
ania
, 29
June
–5 J
uly
2008
. Ac
cess
ed 8
Jan
uary
200
7 at
: ht
tp://
ww
w.in
fres.
enst
.fr/~
bello
t/pu
blis
/IC
IMP2
008.
-and
-N
guye
n Ph
am, L
oic B
aud,
Pat
rick B
ello
t, an
d M
iche
l Rig
uide
l, Te
leco
m P
aris
Écol
e N
atio
nale
Sup
érie
ure
des
Télé
com
mun
icat
ions
. “To
war
ds a
Sec
urity
Co
ckpi
t,” in
Pro
ceed
ings
of t
he S
econ
d In
tern
atio
nal C
onfe
renc
e on
Info
rmat
ion
Secu
rity a
nd A
ssur
ance
(ISA
200
8), B
usan
, Ko
rea,
24-
26 A
pril
2008
. Acc
esse
d 8
Janu
ary
2009
at:
http
://w
ww
.infr
es.e
nst.f
r/~be
llot/
publ
is/5
43.p
df
-and
- DE
SERE
C W
eb p
ages
. Acc
esse
d 4
Febr
uary
200
9 at
: htt
p://
ww
w.d
eser
ec.e
u

Measuring Cyber Security and Information Assurance State-of-the-Art Report (SOAR) 203
Appendix E Research and Emerging Methods Summary
Inst
itutio
nPr
ojec
t/Pr
ogra
mD
escr
iptio
nU
RL o
r Ref
eren
ce
Uni
vers
ité d
e To
ulou
se C
entr
e N
atio
nal d
e la
Rec
herc
he
Scie
ntifi
que
Labo
rato
ire
d’A
naly
se e
t d’A
rchi
tect
ure
des
Syst
èmes
(CN
RS-L
AA
S)
Gro
upe
Tolé
ranc
e au
x fa
utes
et
Sûr
eté
de F
onct
ionn
emen
t in
form
atiq
ue (T
SF)
Spon
sore
d un
der E
urop
ean
Com
mis
sion
IST
6th
Fram
ewor
k Pr
ogra
mm
e
Secu
rity,
Safe
ty, a
nd Q
ualit
y Ev
alua
tion
for D
epen
dabl
e Sy
stem
s (S
QUAL
E)
Resi
lienc
e fo
r Sur
viva
bilit
y in
IS
T (R
eSIS
T)
Othe
r EC-
spon
sore
d pr
ojec
ts
In w
ork
that
beg
an in
the
late
199
0s u
nder
the
Euro
pean
Com
mis
sion
-spo
nsor
ed
SQUA
LE p
roje
ct, c
ontin
ued
unde
r a v
arie
ty o
f EC-
spon
sore
d re
sear
ch p
roje
cts,
and
no
w c
ontin
ues
unde
r the
um
brel
la o
f the
EC-
spon
sore
d Re
SIST
pro
ject
, CN
RS-L
AAS
(a
lso
a “s
eedl
ing
perf
orm
er”
unde
r the
DAR
PA M
easu
ring
Assu
ranc
e in
Cyb
erSp
ace
prog
ram
), ha
s si
nce
deve
lope
d an
app
roac
h to
com
puta
tion
of m
eani
ngfu
l vu
lner
abili
ty/a
ttac
ker e
ffor
t cor
rela
tion
mea
sure
s. B
ased
on
an u
nder
stan
ding
of t
he
secu
rity
polic
y, an
d al
gebr
aic
mod
els
of o
pera
tiona
l sys
tem
vul
nera
bilit
ies
and
atta
ck
proc
esse
s, m
easu
res
wer
e co
mpu
ted
for i
ndiv
idua
l att
acke
r-tar
get c
oupl
es in
the
mod
els,
incl
udin
g (1)
Mea
n Ef
fort
To s
ecur
ity F
ailu
re (M
ETF)
, Sho
rtes
t Pat
h (M
ean
Effo
rt re
quire
d to
go
thro
ugh
shor
test
pat
h to
the
targ
et n
ode)
, and
Num
ber o
f Pat
hs
from
the
atta
cker
to th
e ta
rget
nod
e. T
hey
also
dev
elop
ed th
e Év
alua
tion
de la
Sé
curit
é OP
Erat
ionn
elle
(ESO
PE) t
ool s
et to
aut
omat
e th
e de
finiti
on o
f sec
urity
pol
icy,
the
mod
elin
g of
vul
nera
bilit
ies
into
priv
ilege
gra
phs
(bas
ed o
n an
alys
is o
f rea
l vu
lner
abili
ties
in a
UN
IX s
yste
m) a
nd a
ttac
kers
, and
com
puta
tion
of m
easu
res
base
d on
thos
e da
ta. T
hrou
gh e
xper
imen
tatio
n, q
ualit
ativ
ely
valid
ate
thes
e m
easu
res
and
mod
els,
and
adju
st a
utom
ated
mod
elin
g ap
proa
ch b
y us
ing
hone
ynet
s as
dat
a so
urce
fo
r use
in b
uild
ing
the
vuln
erab
ility
and
att
ack
mod
els,
ther
eby
impr
ovin
g ac
cura
cy
and
sign
ifica
nce
of th
e ca
lcul
ated
mea
sure
s. T
he la
rger
ReS
IST
prog
ram
is d
evel
opin
g a
Resi
lient
Com
putin
g Cu
rricu
lum
and
Res
ilien
ce K
now
ledg
e Ba
se fo
r use
by
acad
emic
s an
d re
sear
cher
s.
Yves
Des
war
te a
nd M
oham
ed K
aâni
che,
Un
iver
sité
de
Toul
ouse
CN
RS-L
AAS
. “T
owar
ds Q
uant
itativ
e Se
curit
y Ev
alua
tion.
” Pr
esen
ted
at th
e 44
th IF
IP
Wor
king
Gro
up 1
0.4
Wor
ksho
p on
M
easu
ring
Assu
ranc
e in
Cyb
er S
pace
, M
onte
rey,
Calif
orni
a, 2
6 Ju
ne 2
003.
Ac
cess
ed 6
Feb
ruar
y 20
09 a
t:
http
://w
ww
.laas
.fr/I
FIPW
G/W
orks
hops
&M
eetin
gs/4
4/W
1/11
-De
swar
te.p
df-a
nd-
Gera
ldin
e Va
che,
CN
RS-L
AAS
, Uni
vers
ité
de T
oulo
use
(Fra
nce)
. “To
war
ds In
form
atio
n Sy
stem
Sec
urity
Met
rics,”
in P
roce
edin
gs o
f th
e Se
vent
h Eu
rope
an D
epen
dabl
e Co
mpu
ting
Conf
eren
ce (E
DCC-
7), K
auna
s,
Lith
uani
a, 7
-9 M
ay 2
008
-and
- ReS
IST
proj
ect W
eb p
age.
Acc
esse
d 7
Febr
uary
20
09 a
t: ht
tp://
ww
w.re
sist
-noe
.org
-and
-SQ
UALE
pro
ject
Web
pag
e. A
cces
sed
7 Fe
brua
ry 2
009
at: h
ttp://
rese
arch
.cs.n
cl.ac
.uk/
cabe
rnet
/ww
w.la
as.re
sear
ch.e
c.org
/sq
uale
Uni
vers
ity
of Il
linoi
s at
Ch
ampa
ign-
Urb
ana
Des
ign
an
d Va
lidat
ion
of R
elia
ble
Net
wor
ked
Syst
ems
(D
EPEN
D) g
roup
Spon
sore
d by
DA
RPA
Mea
sure
men
t-bas
ed
char
acte
rizat
ion
of n
etw
orke
d sy
stem
dep
enda
bilit
y
and
secu
rity
Appl
y AN
ALYZ
E-N
OW m
onito
ring
and
data
gat
herin
g to
ol to
mon
itorin
g an
d m
easu
ring
the
depe
ndab
ility
and
sec
urity
of n
etw
orke
d sy
stem
s an
d, u
ltim
atel
y, th
e In
tern
et. T
his
wor
k in
clud
es th
e im
plem
enta
tion
of m
etric
s to
des
crib
e re
liabi
lity
of In
tern
et n
etw
ork
host
s.
Univ
ersi
ty o
f Illi
nois
/Cha
mpa
ign-
Urba
na
DEPE
ND
grou
p. S
ecur
ity a
nd P
erfo
rman
ce
Mod
elin
g: A
n En
viro
nmen
t and
Too
ls fo
r M
easu
rem
ent-b
ased
Eva
luat
ion
of th
e Av
aila
bilit
y of
Fie
ld S
yste
ms
proj
ect W
eb
page
. Acc
esse
d 6
Febr
uary
200
9 at
: ht
tp://
ww
w.c
rhc.
illin
ois.
edu/
DEPE
ND/
proj
ects
/sec
urity
/sec
urity
.htm
l

Measuring Cyber Security and Information Assurance State-of-the-Art Report (SOAR)204
Appendix E Research and Emerging Methods Summary
Inst
itutio
nPr
ojec
t/Pr
ogra
mD
escr
iptio
nU
RL o
r Ref
eren
ce
Uni
vers
ity
of Il
linoi
s at
Ch
ampa
ign-
Urb
ana
PE
RFO
RM g
roup
Spon
sore
d by
NSF
Möb
ius
Appl
y IT
UA w
ork
on s
urvi
vabi
lity
mea
sure
s in
Möb
ius,
a s
oftw
are
tool
dev
elop
ed
by th
e PE
RFOR
M g
roup
for m
odel
ing
the
beha
vior
of c
ompl
ex s
yste
ms.
Orig
inal
ly
deve
lope
d fo
r stu
dyin
g th
e re
liabi
lity,
avai
labi
lity,
and
perf
orm
ance
of c
ompu
ter
and
netw
ork
syst
ems,
Möb
ius’
use
exp
ande
d to
mod
elin
g of
a b
road
rang
e of
di
scre
te-e
vent
sys
tem
s, ra
ngin
g fr
om b
ioch
emic
al re
actio
ns w
ithin
gen
es to
the
effe
cts
of m
alic
ious
att
acke
rs o
n se
cure
com
pute
r sys
tem
s. O
ne o
f the
key
feat
ures
of
Möb
ius
is it
s su
ppor
t for
cus
tom
ized
mea
sure
s fo
r mea
surin
g sy
stem
pro
pert
ies
( e.g
., re
liabi
lity,
avai
labi
lity,
perf
orm
ance
, sec
urity
) by
enab
ling
user
s to
con
stru
ct
deta
iled
expr
essi
ons
that
mea
sure
the
exac
t inf
orm
atio
n de
sire
d ab
out t
he s
yste
m,
with
the
defin
ed m
easu
rem
ents
con
duct
ed a
t spe
cific
poi
nts
in ti
me,
ove
r per
iods
of
tim
e, o
r whe
neve
r the
sys
tem
reac
hes
a st
eady
sta
te.
Univ
ersi
ty o
f Illi
nois
-Cha
mpa
ign/
Urba
na
PERF
ORM
gro
up. M
öbiu
s pr
ojec
t Web
Pa
ge. A
cces
sed
6 Fe
brua
ry 2
009
at:
http
://w
ww
.mob
ius.
uiuc
.edu
/
Uni
vers
ity
of Il
linoi
s at
Ch
ampa
ign-
Urb
ana
PE
RFO
RM g
roup
Spon
sore
d by
DA
RPA
Com
pile
r-Ena
bled
Mod
el-
and
Mea
sure
men
t-Driv
en
Adap
tatio
n En
viro
nmen
t for
De
pend
abili
ty a
nd P
erfo
rman
ce
Appl
y ear
lier s
urvi
vabi
lity m
easu
rem
ent r
esea
rch
to d
evel
opin
g a
“Com
pile
r-Ena
bled
M
odel
- and
Mea
sure
men
t-Driv
en A
dapt
atio
n En
viro
nmen
t for
Dep
enda
bilit
y and
Pe
rform
ance
,” w
hich
use
s erro
r and
per
form
ance
mea
sure
men
t tec
hniq
ues t
o ch
arac
teriz
e sy
stem
erro
r beh
avio
r, en
able
ear
ly e
rror d
etec
tion,
gui
de o
nlin
e ad
apta
tion
mod
els,
and
impr
ove
com
pile
r-bas
ed e
rror d
etec
tion
and
tole
ranc
e. A
pa
rticu
lar f
ocus
of t
his r
esea
rch
has b
een
use
of m
easu
rem
ents
in o
pera
tiona
l sys
tem
s to
char
acte
rize
real
-wor
ld is
sues
in th
e fie
ld, s
uch
as c
orre
late
d er
rors
and
erro
r pr
opag
atio
n—is
sues
that
ofte
n es
cape
curre
nt d
etec
tion
mec
hani
sms.
Univ
ersi
ty o
f Illi
nois
-Cha
mpa
ign/
Urba
na
PERF
ORM
gro
up. A
Com
pile
r-Ena
bled
M
odel
- and
Mea
sure
men
t-Driv
en A
dapt
atio
n En
viro
nmen
t for
Dep
enda
bilit
y and
Pe
rform
ance
(NSF
CN
S-04
0635
1) pr
ojec
t W
eb p
age.
Acc
esse
d 6
Febr
uary
200
9 at
: ht
tp://
perf
orm
.csl
.illin
ois.
edu/
proj
ects
/ne
wN
SFN
GS.h
tml
Uni
vers
ity
of Il
linoi
s at
Ch
ampa
ign-
Urb
ana
Perf
orm
abili
ty E
ngin
eerin
g Re
sear
ch g
roup
(PER
FORM
)
Spon
sore
d by
DA
RPA
Intru
sion
Tol
eran
ce b
y Un
pred
icta
ble
Adap
tatio
n (IT
UA)
As p
art o
f arc
hite
ctur
e fo
r add
ing
intru
sion
tole
ranc
e via
mid
dlew
are
to in
form
atio
n sy
stem
s, de
fine
prob
abili
stic
mea
sure
s th
at c
ould
be
used
to m
easu
re s
yste
m
surv
ivab
ility
in th
e fa
ce o
f att
acks
and
intru
sion
s in
aid
of v
alid
atio
n of
intru
sion
to
lera
nce
as a
via
ble
appr
oach
to in
form
atio
n se
curit
y.
Will
iam
H. S
ande
rs, U
nive
rsity
of I
llino
is a
t Ch
ampa
ign-
Urba
na. “
Prob
abili
stic
Qu
antifi
catio
n of
Sur
viva
bilit
y Pr
oper
ties.”
Pr
esen
ted
at th
e 44
th IF
IP W
orki
ng
Grou
p 10
.4 W
orks
hop
on M
easu
ring
Assu
ranc
e in
Cyb
er S
pace
, Mon
tere
y, Ca
lifor
nia,
26
June
200
3. A
cces
sed
6 Fe
brua
ry 2
009
at: h
ttp:
//w
ww
.laas
.fr/
IFIP
WG/
Wor
ksho
ps&
Mee
tings
/44/
W1/
07-S
ande
rs.p
df

Measuring Cyber Security and Information Assurance State-of-the-Art Report (SOAR) 205
Appendix E Research and Emerging Methods Summary
Inst
itutio
nPr
ojec
t/Pr
ogra
mD
escr
iptio
nU
RL o
r Ref
eren
ce
Uni
vers
ity
of M
annh
eim
La
bora
tory
for D
epen
dabl
e D
istr
ibut
ed S
yste
ms
Depe
ndab
ility
Met
rics
Amon
g th
e qu
antit
ativ
e de
pend
abili
ty m
easu
rem
ent a
ppro
ache
s un
der d
evel
opm
ent
incl
udes
“a p
ract
ical
app
roac
h w
hich
allo
ws
to a
sses
s th
e se
curit
y of
a s
yste
m u
sing
a
qual
itativ
e ef
fort-
base
d m
etric
.” Th
e ap
proa
ch is
bas
ed o
n th
e no
tion
of s
ecur
ity
test
ing
(als
o kn
own
as p
enet
ratio
n te
stin
g).
Depe
ndab
ility
Met
rics
proj
ect p
age.
Ac
cess
ed 1
3 Ap
ril 2
009
at:
http
://pi
1.in
form
atik
.uni
-man
nhei
m.d
e/in
dex.
php?
page
cont
ent=
site
%2F
Rese
arch
.m
enu%
2FPr
ojec
ts.p
age%
2FDe
pand
abili
ty_
Met
rics.
page
Uni
vers
ity
of N
evad
a at
Ren
o D
atab
ase
and
Secu
rity
Lab
Adap
tive
Secu
rity
Met
rics
for
Com
pute
r Sys
tem
sTo
ove
rcom
e th
e sy
stem
-spe
cific
ity o
f mos
t met
ric s
yste
ms
by d
efini
ng m
etric
s “t
hat
are
port
able
ada
ptab
le to
any
par
ticul
ar ty
pe o
f sys
tem
,” de
velo
ping
a m
atrix
-bas
ed
mat
hem
atic
al m
odel
for e
valu
atin
g pr
edefi
ned
secu
rity
met
rics
of a
par
ticul
ar
com
pute
r sys
tem
, the
n ta
ilorin
g th
ose
met
rics
to re
flect
the
uniq
ue s
ecur
ity fa
ctor
s of
an
othe
r sys
tem
by
addi
ng, d
elet
ing,
or m
odify
ing
the
secu
rity
and
inte
grity
fact
ors
capt
ured
by
the
mat
rix.)
Greg
ory
L. V
ert a
nd S
atis
h Ba
ddel
peli,
Un
iver
sity
of N
evad
a at
Ren
o. “A
dapt
ive
Secu
rity
Met
rics
for C
ompu
ter S
yste
ms,”
in
Pro
ceed
ings
of t
he 2
006
Inte
rnat
iona
l Co
nfer
ence
on
Secu
rity
and
Man
agem
ent
(SAM
200
6). L
as V
egas
, Nev
ada,
26
-29
June
200
6, p
p. 3
51-3
56. A
cces
sed
7 Ja
nuar
y 20
09 a
t: ht
tp://
ww
1.uc
mss
.com
/bo
oks/
LFS/
CSRE
A20
06/S
AM80
20.p
df-a
lso-
Vert
, Gre
gory
and
Pha
nid
Dogi
part
hi,
Univ
ersi
ty o
f Nev
ada
at R
eno.
“A G
ener
ic
Met
ric fo
r Eva
luat
ion
of D
atab
ase
Secu
rity,”
in
Pro
ceed
ings
of t
he 2
007
Inte
rnat
iona
l Co
nfer
ence
on
Secu
rity a
nd M
anag
emen
t (S
AM 2
007).
Las
Veg
as, N
evad
a, U
SA,
25-2
8 Ju
ne 2
007,
pp. 2
98-3
05

Measuring Cyber Security and Information Assurance State-of-the-Art Report (SOAR)206
Appendix E Research and Emerging Methods Summary
Inst
itutio
nPr
ojec
t/Pr
ogra
mD
escr
iptio
nU
RL o
r Ref
eren
ce
Uni
vers
ity
of P
enns
ylva
nia
Com
pute
r and
Info
rmat
ion
Scie
nce
Dep
artm
ent
Quan
titat
ive
Deni
al o
f Se
rvic
e re
sear
chTh
e m
easu
rem
ent-r
elat
ed o
bjec
tives
of t
his
rese
arch
incl
uded
est
ablis
hmen
t of
bett
er m
etric
s of
sec
urity
, exa
mpl
es o
f whi
ch in
clud
ed: (
1) a
den
ial o
f ser
vice
w
orkf
acto
r-lik
e fo
rmul
atio
n th
at is
a c
ompo
site
of a
var
iety
of m
easu
rem
ents
with
im
prec
ise
but m
eani
ngfu
l wei
ghts
; (2)
qua
ntifi
catio
n of
the
rela
tive
secu
rity
of
syst
ems
and
soft
war
e to
sup
port
info
rmed
trad
eoff
s be
twee
n se
curit
y an
d ov
erhe
ad
vs. f
eatu
res
and
conv
enie
nce;
(3) s
tatis
tical
ly b
ased
mod
els
that
qua
ntita
tivel
y ca
ptur
e ru
les
of th
umb
rega
rdin
g sa
lient
pro
pert
ies
of s
oftw
are
pack
ages
.
Mic
hael
B. G
reen
wal
d, C
arl A
. Gun
ter,
B.
Knut
sson
, And
re S
cedr
ov, J
onat
han
M.
Smith
, and
S. Z
danc
ewic
, “Co
mpu
ter
Secu
rity
is N
ot a
Sci
ence
(but
it s
houl
d be
),” in
the
Larg
e-Sc
ale
Net
wor
k Se
curit
y W
orks
hop,
Lan
dsdo
wne
, VA,
13-
14 M
arch
20
03. h
ttp:
//w
ww
.cis
.upe
nn.
edu/
~mbg
reen
/pap
ers/
lns0
3-se
curit
y-sc
ienc
e-w
hite
pape
r.pdf
-als
o-ht
tp://
ww
w.c
is.u
penn
.edu
/~st
evez
/pa
pers
/GGK
S03.
Uni
vers
ity
of S
outh
ern
Calif
orni
a Ce
nter
for S
yste
ms
and
Soft
war
e En
gine
erin
g
Secu
rity
Econ
omic
s an
d
Thre
at M
odel
ing
for I
T Sy
stem
s - A
Sta
keho
lder
Val
ue
Driv
en A
ppro
ach
Devi
sed
a qu
antit
ativ
e m
odel
, the
Thr
eat M
odel
ing
fram
ewor
k ba
sed
on A
ttac
k Pa
th a
naly
sis
(T-M
AP),
to m
easu
re a
nd p
riorit
ize s
ecur
ity th
reat
s by
cal
cula
ting
the
tota
l sev
erity
wei
ghts
of r
elev
ant a
ttac
king
pat
hs fo
r IT
syst
ems.
Com
pare
d to
va
lue-
neut
ral a
ppro
ache
s, T
-MAP
is d
ynam
ic a
nd s
ensi
tive
to s
yste
m s
take
hold
er
valu
e pr
iorit
ies
and
IT e
nviro
nmen
t. It
dist
ills
the
tech
nica
l det
ails
of m
ore
than
23
,000
kno
wn
soft
war
e vu
lner
abili
ties
into
man
agem
ent-f
riend
ly n
umbe
rs a
t a
high
-leve
l. T-
MAP
has
als
o be
en d
emon
stra
ted
to a
id in
prio
ritizi
ng a
nd e
stim
atin
g th
e co
st-e
ffec
tiven
ess
of s
ecur
ity in
vest
men
ts, s
peci
fical
ly th
e co
st-e
ffec
tiven
ess
of s
ecur
ity im
prov
emen
ts a
ttai
ned
thro
ugh
syst
em p
atch
ing,
use
r acc
ount
con
trol
, an
d fir
ewal
l dep
loym
ent.
Secu
rity
Econ
omic
s an
d Th
reat
Mod
elin
g fo
r IT
Syst
ems
proj
ect.
Acce
ssed
7
Febr
uary
200
9 at
: htt
p://
csse
.usc
.edu
/cs
se/r
esea
rch/
COTS
_Sec
urity
/

Measuring Cyber Security and Information Assurance State-of-the-Art Report (SOAR) 207
Appendix E Research and Emerging Methods Summary
Inst
itutio
nPr
ojec
t/Pr
ogra
mD
escr
iptio
nU
RL o
r Ref
eren
ce
Uni
vers
ity
of T
ulsa
Secu
rity
Risk
Met
rics;
St
rata
-Gem
Defin
e a
risk
asse
ssm
ent m
etho
dolo
gy th
at s
ynth
esize
s hi
gh-le
vel e
nter
pris
e as
sess
men
t with
det
aile
d te
chni
cal a
naly
sis
to g
ener
ate
secu
rity
met
rics.
Incr
ease
m
etho
dolo
gy s
cala
bilit
y by
aut
omat
ing
the
iden
tifica
tion
of c
ritic
al s
tate
s an
d vu
lner
abili
ties.
Incr
ease
use
fuln
ess
with
a m
eans
to d
iffer
entia
te b
etw
een
likel
y an
d un
likel
y at
tack
s ba
sed
on m
ulti-
stag
e at
tack
tree
s an
d fa
ult t
ree
anal
ysis
for
ratin
g ris
ks a
ssoc
iate
d w
ith v
ario
us ty
pes
of a
dver
sarie
s, li
kely
att
ack
scen
ario
s.
Deve
lop
a ris
k as
sess
men
t fra
mew
ork
that
use
s m
issi
on tr
ees
to li
nk o
rgan
izatio
nal
obje
ctiv
es to
thei
r im
plem
entin
g IT
ass
ets,
ther
eby
iden
tifyi
ng c
ritic
al s
tate
s th
at a
n at
tack
er c
an re
ach
to a
ffec
t the
org
aniza
tion’
s m
issi
on. U
sing
thes
e st
ates
, att
ack
and
faul
t tre
es c
an b
e cr
eate
d an
d an
alyz
ed to
det
erm
ine
the
likel
ihoo
d of
att
ack.
Clar
k, K
evin
, Jer
ald
Daw
kins
, and
Joh
n Ha
le. “
Secu
rity
Risk
Met
rics:
Fus
ing
Ente
rpris
e Ob
ject
ives
and
Vul
nera
bilit
ies,”
in
Pro
ceed
ings
of t
he IE
EE W
orks
hop
on
Info
rmat
ion
Assu
ranc
e an
d Se
curit
y (IA
W
‘05)
, Uni
ted
Stat
es M
ilita
ry A
cade
my,
Wes
t Poi
nt, N
Y, 1
5-17
Jun
e 20
05.
Acce
ssed
7 F
ebru
ary
2009
at:
http
://se
rv1.
ist.p
su.e
du:8
080/
view
doc/
dow
nloa
d;js
essi
onid
=F57
FE1A
9C33
4ECA
823A
2289
464B
8D9F
A?do
i=10
.1.1
.93.
3272
&re
p=re
p1&
type
=pdf -a
nd-
Clar
k, K
evin
, Eth
an S
ingl
eton
, Ste
phen
Tyr
ee,
and
John
Hal
e, U
nive
rsity
of T
ulsa
. “S
trata
-Gem
: risk
ass
essm
ent t
hrou
gh
mis
sion
mod
elin
g,” i
n Pr
ocee
ding
s of t
he 4
th
ACM
Wor
ksho
p on
Qua
lity o
f Pro
tect
ion,
Al
exan
dria
, Virg
inia
, 200
8, p
p. 5
1-58
.
Uni
vers
ity
of V
icto
ria
Info
rmat
ion
Secu
rity
and
O
bjec
t Tec
hnol
ogy
(ISO
T)
Rese
arch
Lab
(B
ritis
h Co
lum
bia,
Can
ada)
Secu
rity T
estin
g an
d En
gine
erin
g us
ing
Met
rics (
STEM
)Id
entif
y, de
velo
p an
d va
lidat
e m
athe
mat
ical
ly a
nd e
mpi
rical
ly a
fam
ily o
f met
rics
that
can
be
used
to g
uide
effi
cien
tly th
e so
ftw
are
secu
rity
engi
neer
ing
proc
ess.
Pr
opos
e a
set o
f des
ign
met
rics
that
allo
w fo
r mea
sure
men
t of b
asic
sec
urity
at
trib
utes
suc
h as
con
fiden
tialit
y, in
tegr
ity, a
nd a
vaila
bilit
y. Ex
tend
this
met
rics
suite
to o
ther
mea
sure
men
t of s
oftw
are
secu
rity
attr
ibut
es. D
efine
an
axio
mat
ic
fram
ewor
k fo
r rig
orou
s ev
alua
tion
of s
oftw
are
secu
rity
met
rics,
and
dev
elop
a
benc
hmar
k fo
r em
piric
al e
valu
atio
n of
thes
e m
etric
s. D
evel
op a
tool
kit (
STEM
) tha
t w
ill a
ssis
t dev
elop
ers
in g
ener
atin
g an
d in
terp
retin
g th
e m
etric
s fr
om U
nifie
d M
odel
ing
Lang
uage
(UM
L) m
odel
s.
STEM
pro
ject
Web
pag
e. A
cces
sed
7 Fe
brua
ry 2
009
at: h
ttp:
//w
ww
.isot
.ece
.uv
ic.c
a/pr
ojec
ts/s
tem
/inde
x.ht
ml

Measuring Cyber Security and Information Assurance State-of-the-Art Report (SOAR)208
Appendix E Research and Emerging Methods Summary
Inst
itutio
nPr
ojec
t/Pr
ogra
mD
escr
iptio
nU
RL o
r Ref
eren
ce
Calif
orni
a St
ate
Uni
vers
ity
Sa
n B
erna
rdin
o In
form
atio
n A
ssur
ance
and
Sec
urit
y
Man
agem
ent (
IASM
) Cen
ter
Valu
e of
info
rmat
ion
se
curit
y in
vest
men
tsAs
sess
exi
stin
g ap
proa
ches
for m
easu
ring
the
norm
ativ
e, re
al, a
nd p
erce
ived
val
ue
of in
vest
men
ts in
info
rmat
ion
secu
rity.
Tony
Cou
lson
, Jak
e Zh
u, a
nd C
.E. T
apie
Ro
hm, C
alifo
rnia
Sta
te U
nive
rsity
-San
Be
rnar
dino
; and
Sha
n M
iyua
n, H
unan
Un
iver
sity
-Cha
ngsh
a. “
The
Pric
e of
Se
curit
y: T
he C
halle
nge
of M
easu
ring
Busi
ness
Val
ue In
vest
men
ts in
Sec
urin
g In
form
atio
n Sy
stem
s,” in
Com
mun
icat
ions
of
the
IIMA,
Vol
ume
5 Is
sue
4, 2
005.
Ac
cess
ed 2
5 M
arch
200
9 at
: ht
tp://
ww
w.ii
ma.
org/
CIIM
A/8
%20
5.4_
Coul
son_
19_2
4.pd
f -a
nd-
Tony
Cou
lson
, Jak
e Zh
u, K
urt C
ollin
s,
Wal
ter S
tew
art,
C.E.
Tap
ie R
ohm
, Jr.,
Ca
lifor
nia
Stat
e Un
iver
sity
-San
Be
rnar
dino
. “Se
curit
y: V
alui
ng In
crea
sed
Over
head
Cos
ts,”
in P
roce
edin
gs o
f the
10
th C
ollo
quiu
m fo
r Inf
orm
atio
n Sy
stem
s Se
curit
y Ed
ucat
ion,
Ade
lphi
, MD,
5-8
Jun
e 20
06. A
cces
sed
25 M
arch
200
9 at
: ht
tp://
ww
w.c
isse
.info
/col
loqu
ia/c
isse
10/
proc
eedi
ngs1
0/pd
fs/p
aper
s/S0
5P03
Carn
egie
Mel
lon
Uni
vers
ity
H
. Joh
n H
einz
III S
choo
l of
Publ
ic P
olic
y an
d M
anag
emen
t
Econ
omic
s of
Info
rmat
ion
and
Soft
war
e Se
curit
yM
easu
rem
ent o
f risk
-bas
ed re
turn
on
inve
stm
ent f
or in
form
atio
n se
curit
y and
sof
twar
e se
curit
y. M
easu
rem
ent o
f bus
ines
s im
pact
of s
oftw
are
vuln
erab
ility
dis
closu
re.
Ashi
sh A
rora
, Den
nis
Hall,
C. A
riel P
into
, Dw
ayne
Ram
sey,
and
Rahu
l Tel
ang.
“M
easu
ring
the
Risk
-Bas
ed V
alue
of I
T Se
curit
y So
lutio
ns,”
IT P
rofe
ssio
nal,
Vol.
6 N
o. 6
, Nov
./Dec
. 200
4, p
p. 3
5-42
. Dig
ital
Obje
ct Id
entifi
er: 1
0.11
09/M
ITP.
2004
.89

Measuring Cyber Security and Information Assurance State-of-the-Art Report (SOAR) 209
Appendix E Research and Emerging Methods Summary
Inst
itutio
nPr
ojec
t/Pr
ogra
mD
escr
iptio
nU
RL o
r Ref
eren
ce
Uni
vers
ity o
f Mar
ylan
d-Co
llege
Pa
rk D
epar
tmen
t of M
echa
nica
l En
gine
erin
g Ce
nter
for R
isk
and
Relia
bilit
y
Spon
sore
d by
NSF
Prob
abili
stic
Eva
luat
ion
of
Com
pute
r Sec
urity
Bas
ed o
n Ex
perim
enta
l Dat
a
Prop
ose
a ne
w a
ppro
ach
for e
valu
atin
g th
e se
curit
y of
a c
ompu
ter n
etw
ork
base
d on
exp
erim
enta
l dat
a. T
he re
sults
obt
aine
d fr
om th
is p
roje
ct w
ill a
llow
sec
urity
pr
actit
ione
rs to
qua
ntify
the
secu
rity
of a
com
pute
r net
wor
k. T
his
rese
arch
in
clud
es th
e de
velo
pmen
t of d
iffer
ent t
ools
and
larg
e da
ta c
olle
ctio
ns o
n vu
lner
abili
ties
and
atta
cker
s.
Gerr
y Sn
eerin
ger a
nd M
iche
l Cuk
ier.
Quan
tifica
tion
of S
ecur
ity: S
ome
Case
St
udie
s. P
rese
nted
at U
nive
rsity
of
Mar
ylan
d De
part
men
t of M
echa
nica
l En
gine
erin
g Re
sear
ch R
evie
w D
ay,
19 M
arch
200
7. A
cces
sed
25 M
arch
200
9 at
: ht
tp://
ww
w.e
nme.
umd.
edu/
even
ts/
RRD/
2007
/Pre
sent
atio
ns/
Secu
rityS
neer
inge
rCuk
ier.p
df
Colo
rado
Sta
te U
nive
rsit
y So
ftw
are
Ass
uran
ce
Labo
rato
ry
Secu
rity
Mea
sure
men
tDe
finiti
on o
f met
rics
for s
ecur
ity v
ulne
rabi
litie
s, d
esig
n tr
adeo
ffs
invo
lvin
g se
curit
yOm
ar H
. Alh
azm
i, Ya
shw
ant K
. Mal
aiya
, and
In
drak
shi R
ay. “
Mea
surin
g, A
naly
zing
and
Pred
ictin
g Se
curit
y Vul
nera
bilit
ies i
n So
ftw
are
Syst
ems,”
in C
ompu
ters
and
Se
curit
y Jou
rnal
, Vol
ume
26 Is
sue
3, M
ay
2007
, pp.
219
-228
. Acc
esse
d 25
Mar
ch 2
009
at: h
ttp://
ww
w.c
s.col
osta
te.e
du/~
mal
aiya
/pu
b/co
m&
secu
rity_
darti
cle.p
df-a
nd-
O. H
. Alh
azm
i. As
sess
ing
Vuln
erab
ilitie
s in
So
ftw
are
Syst
ems:
A Q
uant
itativ
e Ap
proa
ch. P
h.D.
Dis
sert
atio
n, C
olor
ado
Stat
e Un
iver
sity
Com
pute
r Sci
ence
De
part
men
t, 6
Nov
embe
r 200
6. A
cces
sed
25 M
arch
200
9 at
: htt
p://
ww
w.
cs.c
olos
tate
.edu
/~m
alai
ya/p
ub/
omar
_dis
sert
atio
n.pd
f

Measuring Cyber Security and Information Assurance State-of-the-Art Report (SOAR)210
Appendix E Research and Emerging Methods Summary
Inst
itutio
nPr
ojec
t/Pr
ogra
mD
escr
iptio
nU
RL o
r Ref
eren
ce
Uni
vers
ity o
f Vic
toria
(Brit
ish
Colu
mbi
a, C
anad
a) In
form
atio
n Se
curit
y an
d O
bjec
t Tec
hnol
ogy
(ISO
T) R
esea
rch
Lab
Secu
rity T
estin
g an
d En
gine
erin
g Us
ing
Met
rics (
STEM
)Pr
opos
ed c
olle
ctio
n of
des
ign
met
rics
that
allo
w m
easu
rem
ent o
f bas
ic s
ecur
ity
attr
ibut
es s
uch
as c
onfid
entia
lity,
inte
grity
, and
ava
ilabi
lity.
Defin
ition
of a
n ax
iom
atic
fram
ewor
k fo
r rig
orou
s ev
alua
tion
of s
oftw
are
secu
rity
met
rics.
Ex
tens
ion
of p
ropo
sed
met
rics
suite
to m
easu
re o
ther
sof
twar
e se
curit
y at
trib
utes
. De
velo
pmen
t of a
ben
chm
ark
for e
mpi
rical
eva
luat
ion
of th
e pr
opos
ed m
etric
s.
Deve
lopm
ent o
f a S
TEM
tool
kit t
o as
sist
dev
elop
ers
in g
ener
atin
g an
d in
terp
retin
g th
e m
etric
s fr
om U
ML
mod
els.
http
://w
ww
.isot
.ece
.uvi
c.ca
/pro
ject
s/st
em/in
dex.
htm
l
Stoc
khol
m U
nive
rsit
y an
d Ro
yal I
nstit
ute
of T
echn
olog
y D
epta
rtm
ent o
f Com
pute
r and
Sy
stem
s Sc
ienc
es In
form
atio
n Sy
stem
s Se
curi
ty L
ab (S
ecLa
b)
Secu
rity
Met
rics
Iden
tifica
tion
of K
ey P
erfo
rman
ce In
dica
tors
und
erpi
nnin
g RO
I est
imat
ions
for
secu
rity
inve
stm
ents
Job
Ashe
ri Ch
aula
, Lou
ise
Yngs
tröm
, and
St
ewar
t Kow
alsk
i. “S
ecur
ity M
etric
s Ev
alua
tion
of In
form
atio
n Sy
stem
Se
curit
y,” in
Pro
ceed
ings
of I
nfor
mat
ion
Secu
rity
Sout
h Af
rica,
30
June
-2Ju
ly 2
004,
M
idra
nd, S
outh
Afr
ica.
Acc
esse
d 25
M
arch
200
9 at
: htt
p://
icsa
.cs.
up.a
c.za
/is
sa/2
004/
Proc
eedi
ngs/
Rese
arch
/048
-a
nd-
Erka
n Ka
hram
an. “
Eval
uatin
g IT
sec
urity
pe
rfor
man
ce w
ith q
uant
ifiab
le m
etric
s.”
Mas
ters
The
sis
for S
tock
holm
Uni
vers
ity
and
Roya
l Ins
titut
e of
Tec
hnol
ogy,
1 Fe
brua
ry 2
005.
Acc
esse
d 25
Mar
ch 2
009
at: h
ttp:
//ds
v.su.
se/r
esea
rch/
secl
ab/
page
s/pd
f-file
s/20
05-x
-245
Elec
tric
Pow
er R
esea
rch
In
stitu
te (E
PRI)
Secu
rity
Met
rics
for E
nerg
y M
anag
emen
t Cen
ters
EPRI
, in
part
ners
hip
with
Dyo
nyx
and
Lum
ina
Syst
ems,
is d
evel
opin
g a
tool
that
will
pr
ovid
e qu
antit
ativ
e es
timat
es o
f the
val
ue o
f sec
urity
act
iviti
es fo
r Ene
rgy
Man
agem
ent C
ente
rs. A
pro
toty
pe v
ersi
on o
f the
tool
has
bee
n pr
oduc
ed th
at is
ba
sed
on L
umin
a Sy
stem
s’ A
naly
tica
prod
uct.
Mad
hava
Sus
hile
ndra
, Ele
ctric
al P
ower
Re
sear
ch In
stitu
te. “
Road
map
to S
ecur
e Co
ntro
l Sys
tem
s in
the
Ener
gy S
ecto
r.”
Pres
ente
d at
the
Ener
gy S
ecto
r Con
trol
Sy
stem
s W
orki
ng G
roup
ieRo
adm
ap
Wor
ksho
p, C
hica
go, I
L, 2
8-29
May
200
8.
Acce
ssed
25
Mar
ch 2
009
at: h
ttp:
//w
ww
.co
ntro
lsys
tem
sroa
dmap
.net
s/17
%20
Secu
rity%
20M
etric
s%20
for%
20EM
S.pd
f

Measuring Cyber Security and Information Assurance State-of-the-Art Report (SOAR) 211
Appendix E Research and Emerging Methods Summary
Inst
itutio
nPr
ojec
t/Pr
ogra
mD
escr
iptio
nU
RL o
r Ref
eren
ce
Tele
com
Par
isTe
ch (E
NS
T)
Inst
itut T
ELEC
OM
Com
pute
r Sc
ienc
e an
d N
etw
orki
ng
Dep
artm
ent (
INFR
ES)
Vers
un
cock
pit d
e sé
curit
é (T
owar
ds a
Sec
urity
Coc
kpit)
Deve
lopm
ent o
f a “s
ecur
ity c
ockp
it” to
ol to
hel
p as
sess
larg
e, n
etw
orke
d, IT
-driv
en
syst
ems
and
dete
rmin
e th
eir o
vera
ll se
curit
y as
sura
nce
leve
ls. T
he to
ol u
ses
atta
ck
grap
hs to
com
pute
an
atta
ckab
ility
met
ric v
alue
for t
he s
yste
m, a
nd to
defi
ne o
ther
m
etric
s fo
r ano
mal
y de
tect
ion
that
furt
her s
uppo
rt a
sses
smen
t of b
oth
stat
ic a
nd
dyna
mic
vie
ws
of th
e sy
stem
.
Ngu
yen
Pham
, Loi
c Ba
ud, P
atric
k Be
llot,
Mic
hel R
igui
del.
“Tow
ards
a S
ecur
ity
Cock
pit,”
in P
roce
edin
gs o
f the
In
tern
atio
nal C
onfe
renc
e on
Info
rmat
ion
Secu
rity
and
Assu
ranc
e (IS
A 20
08),
Busa
n (P
usan
), So
uth
Kore
a, 2
4-26
Apr
il 20
08, p
p.
374-
379.
htt
p://
ww
w.in
fres
.ens
t.fr/
~bel
lot/
publ
is/7
43.p
df-a
nd-
Pham
, Ngu
yen,
Loi
c Ba
ud, P
atric
k Be
llot,
Mic
hel R
igui
del.
“Nea
r Rea
l-tim
e Sy
stem
fo
r Sec
urity
Ass
uran
ce A
sses
smen
t,” in
Pr
ocee
ding
s of
the
Third
Inte
rnat
iona
l Co
nfer
ence
on
Inte
rnet
Mon
itorin
g an
d Pr
otec
tion
(ICIM
P ‘0
8), B
ucha
rest
, Rom
ania
, 29
Jun
e-5
July
200
8, p
p. 1
52-1
60.
Acce
ssed
25
Mar
ch 2
009
at:
http
://w
ww
.infr
es.e
nst.f
r/~be
llot/
publ
is/
ICIM
P200
8.pd
f

Measuring Cyber Security and Information Assurance State-of-the-Art Report (SOAR)212
FWhy is CS/IA Measurement Challenging
The government research community has publicly acknowledged the importance of CS/IA measurement. The community has also acknowledged the challenges involved in achieving the measures and measurement techniques that will yield meaningful assessments and quantifications of information, system, and network security assurance, effectiveness of technical and non-technical security measures, process security, etc.
The two excerpts below, from the INFOSEC Research Council’s (IRC) “Hard Problems List of 2005” [181] (the last time IRC published such a list) and
the National Science and Technology Council Interagency Working Group on Cyber Security and Information Assurance’s Federal Plan for Cyber Security and Information Assurance Research and Development of April 2006, are representative of this government research community’s views.
F.1 IRC Hard Problem No. 8 Enterprise-Level Security Metrics Definition:Along with the systems and component-level metrics that have been mentioned in the preceding “hard problems,” and the technology-specific metrics that are continuing to emerge with new technologies year after year, it is essential to have a macro-level view of security within an organization.

Measuring Cyber Security and Information Assurance State-of-the-Art Report (SOAR) 213
Appendix F Why is CS/IA Measurement Challenging
What happens when all the systems, processes, and tools are turned on? Today, government decision makers and corporate leaders do not have answers to such important questions as—
f How secure is my organization? f Has our security posture improved over the last year? f To what degree has security improved in response to changing
threats and technology? f How do we compare with our peers? f How secure is this product or software that we are purchasing? f How does it fit into the existing systems and networks? f What is the marginal change in our security, given the use of a new
tool or practice?
Most organizations view the answers to these questions in the short term from a financial mind-set and make a cost-benefit trade analysis. The decisions resulting from this analysis will frequently be to the detriment of significant improvements in security in the long term, which may require costly new development.
ThreatOne of the most insidious threats to security metrics lies in the metrics themselves. The mere existence of a metric may encourage its purveyors to over-endow the significance of the metric. A common risk is that analyses may be based on spurious assumptions, inadequate models, and flawed tools, and that the metrics themselves are inherently incomplete—often a one-dimensional projection of a multidimensional situation.
Furthermore, a combination of metrics in the small (e.g., regarding specific attributes of specific components) typically do not compose into metrics in the large (e.g., regarding the enterprise as a whole).
MotivationWithout answers to these important questions, management is mired in a quandary without meaningful direction. The dearth of metrics and decision-making tools places the determination of information security risk to the enterprise on the judgment of IT security practitioners. The gathering and sharing of information about threats, vulnerabilities, and attacks is critical to establishment of a scientific approach to managing these risks.
Metrics and a risk management framework must guide decision makers— f First, recent events (like 9/11 and its economic impacts), along with
intelligence reporting, have shown the existence of considerable threats to the critical infrastructures of the United States.
f Second, financial restrictions require explicit understanding of how funds invested in security will affect an organization.

Measuring Cyber Security and Information Assurance State-of-the-Art Report (SOAR)214
Appendix F Why is CS/IA Measurement Challenging
f Last, regulations, such as FISMA and the Public Company Accounting and Investor Protection Act, require the government and private sector firms to become accountable in the area of IT security.
These factors support the need for decision makers to have sound metrics and a decision-making framework that embraces risk management principles.
As technology continues to advance into every facet of society, societal dependence on technology grows. This dependence has increased unabated. Technologies are at risk not only from highly publicized hackers, but also from more deceptive and dangerous nation-states and terrorists.
In addition, systems that are poorly designed, implemented, and maintained tend to fall apart on their own, without any attacks.
Organizations need a metric-based approach built on qualitative and quantitative risk management principles for the effective allocation of IT security resources, in addition to empirical methods.
ChallengesMany challenges still exist in this area—
f First, in a world where technology, threats, and users change so quickly, tomorrow’s risks may be quite different from yesterday’s risks, and historical data is not a sufficiently reliable predictor of the future.
f Second, organizations are reluctant to share information, thus making data on emerging threats difficult to collect. Even when network owners are aware of threats, the constant barrage and high volume of low-level threats (e.g., phishing attacks and spam) distract many organizations from defending against potentially devastating attacks representing more serious threats.
f Third, risk management is complicated by a dearth of adequate information on capabilities and intentions of threat agents, such as terrorists and hostile nations. To estimate the potential costs of downtime, loss, or impairment of tangible and intangible assets across an entire organization for previously unseen events is almost impossible.
f Finally, complete security is unattainable at any price, and security is not simply a matter of technology.
Many factors complicate the statistical foundations of any approach to predict the likelihood of attacks for a range of impacts. Better protection for some resources often merely increases the likelihood of other resources being attacked. Attackers will shift their focus from more protected resources to less well-protected resources.

Measuring Cyber Security and Information Assurance State-of-the-Art Report (SOAR) 215
Appendix F Why is CS/IA Measurement Challenging
Furthermore, IT security technology is often bought through a principle of adverse selection: Groups that are the most lucrative targets will buy the most defensive technology, and although those defenses may decrease attacks, those organizations may still be attacked more than their peers that are less lucrative targets. This creates a misperception that defenses draw attacks.
Amplifying this perception, the best defended groups often have the best sensors, catching and reporting more successful attacks than other groups. This leads to the imprecise conclusion that funds spent on defenses have allowed the number of successful attacks to rise, when in reality, the number of successful attacks may have fallen, although the fraction being detected may have risen.
Also, even as the fraction of attacks detected rises, that fraction is never known, because “you never know what you don’t know.”
IT security also experiences self-falsification through a set of moral hazards similar to the claim that “seatbelts cause accidents”—in that such protection can lower users’ risk aversion, causing them to operate systems less cautiously.
These factors make formal metrics for IT security difficult.
ApproachesMany disciplines operate in environments of decision making under uncertainty, but most have proven methods to determine risk. Examples include: financial metrics and risk management practices; balanced scorecard, six-sigma, insurance models; complexity theory; and data mining.
The field of finance, for example, has various metrics that help decision makers understand what is transpiring in their organizations. These metrics provide insight into liquidity, asset management, debt management, profitability, and market value of a firm. Capital budgeting tools, such as net present value and internal rate of return, allow insight in the return that can be expected from an investment in different projects.
In addition, the financial industry relies on decision-making frameworks, such as the Capital Asset Pricing Model and Options Pricing Model, that link risk and return to provide a perspective of the entire portfolio.
These frameworks have demonstrated some usefulness and can be applied across industries to support decision making. A possible analog for IT security would be sound systems development frameworks that support an enterprise view of an organization’s security.
MetricsThe IRC supports the Computing Research Association’s finding that an excellent goal or “Grand Challenge” for this area would be that, within 10 years, quantitative information-systems risk management should be at least as good as quantitative financial risk management.

Measuring Cyber Security and Information Assurance State-of-the-Art Report (SOAR)216
Appendix F Why is CS/IA Measurement Challenging
However, a caveat is needed. This goal has serious pitfalls based on some inherent differences between the more or less continuous mathematics of multidimensional econometric and financial models on one hand, and the more or less discrete nature of computers on the other hand. For example, a one-bit change in a program or piece of data may be all that is required to transform something that is extremely secure to something that is completely insecure.
Metrics for the validity of metrics for security need to be taken with a grain of salt. Indeed, metrics about metrics always seem to be speculative.
F.2 NSTC IWG on Cyber Security and Information Assurance Federal Plan for Cyber Security and Information Assurance Research and DevelopmentFindings and Recommendations—
Finding 8: Develop and apply new metrics to assess cyber security and IA.
FindingIt is widely acknowledged in the IT industry and the national research community that a major research challenge is posed by the lack of effective methods, technologies, and tools to assess and evaluate the level of component, system, and network security. The baseline analysis of federal investments found that, while the technical topic of software testing and assessment tools is both funded and ranked as a top R&D priority, the topic of metrics is not in either the top funding or top priority rankings.
RecommendationAs part of roadmapping, federal agencies should develop and implement a multi-agency plan to support the R&D for a new generation of methods and technologies for cost-effectively measuring IT component, system, and network security. As more exacting cyber security and IA metrics, assessment tools, and best practices are developed through R&D, these should be adopted by agencies and applied in evaluating the security of federal systems, and should evolve with time. [182]
References181 INFOSEC Research Council (IRC). Hard Problems List, November 2005. Accessed 11 December 2008
at: http:// www.cyber.st.dhs.gov/docs/IRC_Hard_Problem_List.pdf
182 Federal Plan for Cyber Security and Information Assurance Research and Development, April 2006. Accessed 31 March 2009 at: http://nitrd.gov/pubs/csia/csia_federal_plan.pdf


Distribution Statement A
Approved for public release; distribution is unlimited.
State-of-the-Art Report (SOAR) May 8, 2009
Information Assurance
Technology Analysis Center (IATAC)SOAR09
Measuring Cyber Security and
Information Assurance
Measu
ring C
yber S
ecurity
and
Info
rmatio
n A
ssuran
ceState-of-the-A
rt Report (SOA
R) M
ay 8, 2009Inform
ation Assurance Technology Analysis Center (IATAC)
This State-of-the-Art Report is published by the Information Assurance Technology Analysis
Center (IATAC). IATAC is a DoD-sponsored Information Analysis Center, administratively
managed by the Defense Technical Information Center (DTIC), and the Director, Defense
Research and Engineering (DDR&E).