measuring global influence
TRANSCRIPT
CHINA-US COMPETITIONCHINA-US COMPETITIONMEASURING GLOBAL INFLUENCEMEASURING GLOBAL INFLUENCE
CHINA-US COMPETITIONMEASURING GLOBAL INFLUENCE
Jonathan D. Moyer, Collin J. Meisel, Austin S. Matthews, David K. Bohl, and Mathew J. Burrows

The Scowcroft Center for Strategy and Security works to develop sustainable, nonpartisan strategies to address the most important
security challenges facing the United States and its allies and partners. The Center honors the legacy of service of General Brent Scowcroft and embodies his ethos of nonpartisan commitment to the cause of security,
support for US leadership in cooperation with allies and partners, and dedication to the mentorship of the next generation of leaders.

ISBN-13: 978-1-61977-173-4
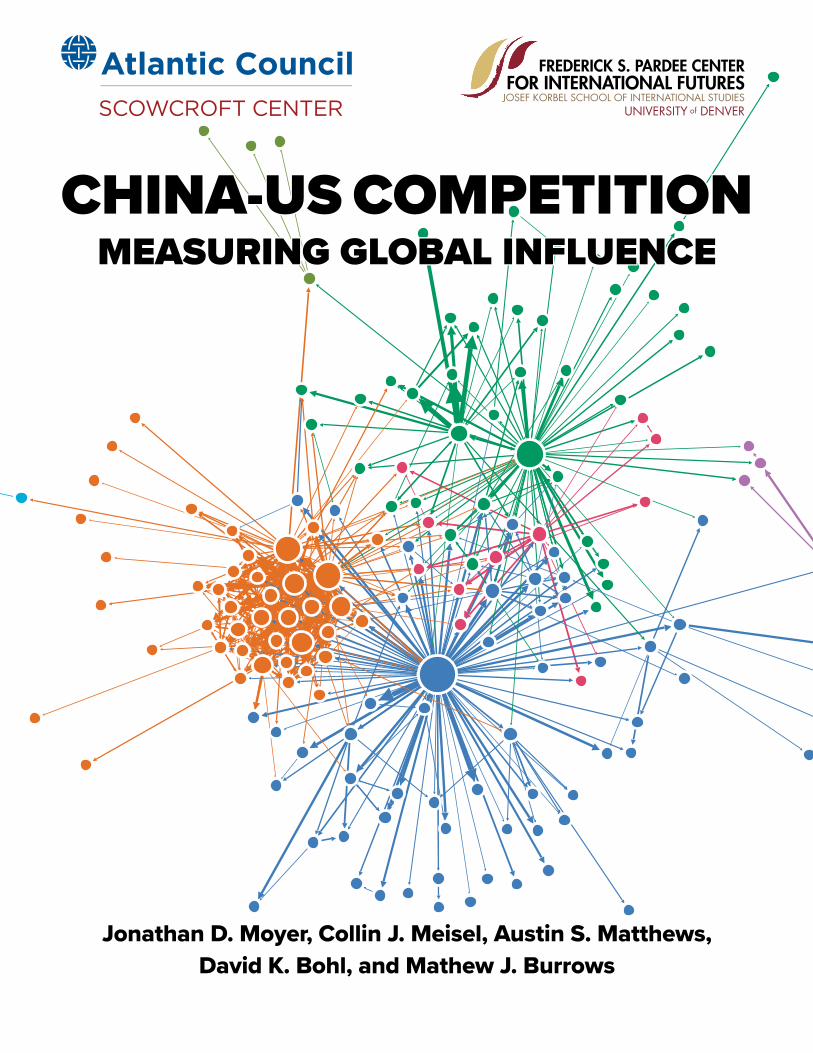
Cover: Network visualization of Formal Bilateral Influence Capacity (FBIC) between countries in 2020, as estimated by the report’s authors. Node size and edge thickness are determined by a country’s FBIC Index score, node and edge colors are determined by community (inferred using Louvain method with modularity optimization), and graph layout is determined by a Yifan Hu layout algorithm. Graph produced in Gephi. Cover art by David K. Bohl and Collin J. Meisel.
This report is written and published in accordance with the Atlantic Council Policy on Intellectual Independence. The au-thors are solely responsible for its analysis and recommendations. The Atlantic Council and its donors do not determine, nor do they necessarily endorse or advocate for, any of this report’s conclusions.
May 2021
CHINA-US COMPETITIONMEASURING GLOBAL INFLUENCE
Jonathan D. Moyer, Collin J. Meisel, Austin S. Matthews, David K. Bohl, and Mathew J. Burrows
The authors would like to thank Drew Bowlsby, Whitney Doran, Mickey Rafa, John McPhee, and the large team of research assistants at the University of Denver who contributed to this report.

China-US Competition: Measuring Global Influence
II ATLANTIC COUNCIL
Table of ContentsExecutive Summary 1
Power in International Relations: A New Model 3
Conceptualizing Multidimensional Relational Power 4
Building the Formal Bilateral Influence Capacity Index 7
Exploring the FBIC Index 9
Most Influential States 9
China and the United States 9
Influence Capacity and ASEAN Member States 13
Historical Relational Power Trends Among ASEAN Members According to the FBIC Index 13
Country-Level Relational Power Categories in Southeast Asia 14
Opportunities for Multilateral Engagement in Southeast Asia 17
Conclusion 25
Appendix 26
Index Methodology 26
Variables 26
Index Calculation 28
Overview of Data 28
Historical Data Estimation and Nowcast Methodology 30
About the Authors 32

China-US Competition: Measuring Global Influence
1ATLANTIC COUNCIL
Executive Summary
1 As described in this report’s appendix, values in 2019 and 2020 are based on “nowcasts” from the International Futures integrated assessment model.2 A previous version of this index was presented in: Jonathan D. Moyer, Tim Sweijs, Mathew J. Burrows, and Hugo Van Manen, Power and Influence in a
Globalized World (Washington, DC: Atlantic Council, 2018).3 The authors of this study use the terms “influence capacity” and “relational power” interchangeably. A country’s relational power is its capacity to
influence another state through economic, political, and/or security measures.4 Although undoubtedly important, Australia and Singapore are each already signatories to bilateral trade agreements with the United States. That said,
expanding from a bilateral to a multilateral framework would most likely produce economic benefits and could further boost trade bandwidth between these countries.
A new era of great power competition is under-way, with rising Chinese capabilities challenging the position of the United States across multiple dimensions and regions. The contours of this
unfolding relationship will shape the geopolitical environ-ment regionally and globally over the coming years. This report analyzes US-China competition globally with a par-ticular focus on these trends and relationships in Southeast Asia by introducing the Formal Bilateral Influence Capacity (FBIC) Index, a quantitative measure of multidimensional in-fluence between pairs of states from 1960 through 2020.1 The FBIC Index attempts to capture the size of interac-tions, as well as the reliance that one country has on oth-ers across economic, political, and security dimensions.2 The combination of these factors is influence capacity or relational power.3
Findings drawing upon this index show that Chinese influ-ence has grown in both size and reach around the world, reinforcing and contextualizing experts’ understanding of this changing international system. From the end of the Cold War to the present, Chinese influence has cut into or supplanted Western countries’ sway in every geographic region. More recently, the COVID-19 pandemic has further accelerated the rate of these Chinese gains, with new and existing partners increasing their dependence on China.
Focusing on these trends through a region-specific lens, this study shows that foreign influence in Southeast Asia has changed dramatically over the past twenty years. Once secure and dominant, American influence in the region has entered a long period of decline and stag-nation, including losses among traditional allies, such as Thailand and the Philippines. Meanwhile, China has built and maintains a strong and growing presence across all countries in the region, with notable growth in Indonesia and Singapore.
To the extent that the United States and the West have been caught off guard by the rise of China, the “game” is not over. The United States still has many opportuni-ties to counterbalance the expansion of Chinese influence through greater bilateral engagements and increased
support for regional integration within the Association of Southeast Asian Nations (ASEAN). Washington also has opportunities to work multilaterally with allies that main-tain a strong presence in the region, particularly Japan and South Korea. The authors of this study recommend leveraging these partners to not only improve ASEAN-US relations but also to build the internal networks of inter-dependence that will allow the region to make decisions more independent of external powers.
Drawing upon their assessment of the dynamics asso-ciated with Chinese and US influence in Southeast Asia using the FBIC Index, the authors recommend that US policymakers:
■ Approach competition with China using multilateral foreign policy tools that leverage the collective influ-ence capacity of US allies and partners rather than direct bilateral competition in regions with very high levels of Chinese influence.
■ Promote intra-ASEAN interdependence, increasing the region’s ability to counter large and growing Chinese influence.
■ Negotiate a preferential trade agreement between the United States and ASEAN, boosting US economic bandwidth in the region and counterbalancing the ASEAN–China Free Trade Area, which achieved full implementation in 2020.
■ Negotiate entry into and revision of the Comprehen-sive and Progressive Agreement for Trans-Pacific Partnership (CPTPP), which will boost economic band-width with key US allies and partners in the Asia-Pa-cific, particularly Japan, and countries at the heart of US-China competition in Southeast Asia, particularly Singapore and Vietnam. Revision of the agreement should focus on transparency and the agreement’s effects on the environment, human rights, and labor.4
■ Maintain security ties with Indonesia and Thailand—the primary component of influence that the United

China-US Competition: Measuring Global Influence
2 ATLANTIC COUNCIL
States possesses in these countries relative to China— but more effectively leverage these connec-tions to combat illiberal trends in each country.
■ Continue to strengthen the security alliance between the United States and Japan, perhaps by pushing for
Japan to become a formal member of the “Five Eyes” intelligence-sharing arrangement. This would posi-tion Japan to share the burden of countering Chinese expansion in Southeast Asia with the other members of the group (Australia, Canada, New Zealand, the United Kingdom, and the United States).

China-US Competition: Measuring Global Influence
3ATLANTIC COUNCIL
Power in International Relations: A New Model
5 Values in 2019 and 2020 are based on “nowcasts” from the International Futures integrated assessment model. See this report’s appendix for additional details on the nowcasting methodology.
Power—a central idea in international relations—has often been conceptualized through the lens of rel-ative material capabilities, such as defense expen-ditures or gross domestic product (GDP). Various
researchers have attempted to measure these capabilities in multidimensional indices, providing some context to the quantitative study of international relations. In addition to academic utility, these measures have also provided in-sights useful to US policymakers.
Although often conceptualized as a relative imbalance in material capabilities, power can be expressed and under-stood in different ways. For example, previous scholarship and policy work has also focused on the power of attrac-tion, or soft power. More recent work has highlighted the importance of interdependence as a condition that can allow states to coerce others effectively.
This policy brief introduces a measure of bilateral influ-ence capacity—also referred to as relational power—that
can be used to better understand more granular trends in the distribution of power across the international sys-tem. The authors present the Formal Bilateral Influence Capacity (FBIC) Index to track such relational power in the international system from 1960 through 2020 for all pairs of states.5 This index is operationalized using data that cut across economic, political, and security dimensions of bi-lateral influence.
The FBIC Index can enhance policymakers’ understanding of the transformations in the global power landscape at the country, regional, and global levels. In this brief, the authors showcase these changes and highlight how poli-cymakers can draw upon the analytic findings to develop new strategies. In the subsequent sections of this brief, the authors introduce how this measure is built, explain what it reveals about the global distribution of influence, and draw insights from the index by evaluating US-China competition in Southeast Asia.

China-US Competition: Measuring Global Influence
4 ATLANTIC COUNCIL
Conceptualizing Multidimensional Relational Power
6 Kenneth N. Waltz, Man, the State, and War: A Theoretical Analysis (New York: Columbia University Press, 1959), 101.7 Inis L. Claude, Jr., Power and International Relations (New York: Random House, 1962).8 John J. Mearsheimer, “The False Promise of International Relations,” International Security 19 (3), 1995: 5-49.
The study of power and its distribution among states is one of the most persistent fields of in-quiry in international relations. The most notable school of thought for understanding international
power was developed by Realists. American political sci-entist Kenneth Waltz defined power “in terms of the distri-bution of capabilities” between states.6 Studies building upon this capability-based definition have pointed to the importance of industrial production and military capacity as
metrics for power.7 Collectively, these capacity-based un-derstandings have led to the concept of hard power, which equates the possession of these resources with power in the international system.8 Hard power allows states to co-erce others into changing their behaviors out of the im-plied or actual threat of force if they do not. Such threats can push states to change their behaviors out of self-inter-est, hoping to avoid being the target of hard power if they do not acquiesce.
Economic Leverage
Economic leverage does not automatically ensure influ-ence. It depends on the kind and amount of economic hold the more powerful partner holds over the more dependent one. Other factors—from ties with other powerful players to membership in multilateral institu-tions—can temper the dependency.
That said, historically, economic trade—including mil-itary sales—has been an instrument for great powers to build networks of influence. The ties that begin with trade and investment have often given a boost to establishing strong political and cultural relation-ships. The United States and Europe have for a long time been each other’s most important trade and in-vestment partners. Europe is largely dependent for its security on the United States and NATO, including US arms sales. The common transatlantic front during the Cold War against Soviet communism has also left a legacy that still orients each to the other despite the United States’ and Europe’s growing trade ties with China. Over time and at the individual European state level, Chinese influence could increase: Central and Eastern European members of the European Union (EU) have established a common 16-1 forum with China. Nevertheless, Brussels still sees China as a systemic rival of the Europeans.
China has made the greatest inroads outside of Eu-rope, where US and Western influence has shrunk dra-
matically in the last few decades. In 1960, the United States was the largest trading partner with practically all the other countries in the world (except for commu-nist states). That is no longer the case. Beijing has bol-stered its trading position throughout the developing world, taking over the United States’ former role. In ad-dition to trading, China has increased foreign aid, rival-ing and often outdoing Western sources. Here, China’s inroads into Africa have been notable to the extent that Western influence is on the decline.
US global power and influence exploded practically overnight as a result of the Second World War, leaving much of the rest of the world devastated and the United States as the defender against encroaching commu-nism. Such an example is a historical aberration. The French language remained the language of diplomacy well beyond Britain’s defeat of Napoleon. Throughout most of human history, the global system has been mul-tipolar, not unipolar. No one power—whether United States, China, or Europe—is likely to succeed in dom-inating the rest of the world. Instead, more likely, the global and regional powers will jockey for more sway, giving smaller countries the ability to play off one of the great powers against the other, lessening their depen-dence on any single great power. To the extent that the United States and the West has been caught off guard by the rise of China, the “game” is not over; there are still ways to increase Western influence in the world.
China-US Competition: Measuring Global Influence
5ATLANTIC COUNCIL
Another school of thinking, from the Neoliberal field, em-phasizes the importance of cooperation and absolute gains among states.9 As these relationships develop, patterns of complex “interdependencies” can emerge where states rely on one another for shared prosperity.10 However, these interdependencies are not always balanced between part-ners; thus they can create situations where imbalances can be leveraged for coercive objectives.11 Two scholars out-lined the thrust of this argument when writing: “Asymmetric network structures create the potential for ‘weaponized in-terdependence,’ in which some states are able to leverage interdependent relations to coerce others.”12
As an example of asymmetrical interdependence at work in interstate strategy, consider the balance of trade be-tween two states. Trade from a large nation to a much smaller neighbor often accounts for a large proportion of the smaller state’s total trade, but only a fraction of the larger state’s trade. This creates an asymmetrical, or un-balanced, relationship in which one state becomes more reliant on the other for certain resources or services, but the other state remains largely unfettered by the small scale of the exchanges relative to the size of its economy,
9 Robert Powell, “Absolute and Relative Gains in International Relations Theory,” American Political Science Review 85 (4), 1991; 1303-20; Robert Powell, “Anarchy in International Relations Theory: The Neorealist-Neoliberal Debate,” International Organization 48 (2), 1994: 313–44.
10 Robert O. Keohane and Joseph S. Nye, Power and Interdependence: World Politics in Transition (Boston, Massachusetts: Little, Brown and Company, 1977).
11 David A. Baldwin, “Interdependence and Power: A Conceptual Analysis,” International Organization 34 (4), 1980: 471–506.12 Henry Farrell and Abraham L. Newman, “Weaponized Interdependence: How Global Economic Networks Shape State Coercion,” International Security
44 (1), 2019: 45.
population, or military. This unbalanced relationship leaves the more reliant state in a position of weakness, where economic prospects, for example, are influenced by the economic performance of its more dominant partner. Any disruption of the relationship with the larger state could have adverse effects on the economic, political, or security standing of the smaller state, which has little recourse or ability to engage in retaliation.
Recognizing the advantage it has, the dominant partner in the relationship might decide that this imbalance can be used in a coercive manner to pursue its foreign pol-icy objectives. The asymmetrical relationship allows the dominant partner to coercively apply diplomatic pressure on its partner state, implying that the linkages could be manipulated in the event of noncompliance. This potential for coercion built upon interdependencies constitutes a form of relational power, which creates an effective foreign relations tool—one that does not necessarily set the stage for the use of hard power.
Although relational power is the product of bilateral in-teractions, material capacity remains a precondition of
The Australia/China Case
Trade is an obvious core element of interstate relations and foundational to what has been an era of globaliza-tion and growing interdependency. China’s recent impo-sition of tariffs on Australian agricultural products is an example of China leveraging trade dependence to pun-ish Canberra’s noneconomic policy stances, such as its opposition to the detention and mistreatment of China’s minority Uighur population, taking an economic toll as long as Australia does not mend its way in China’s eyes.
The outcome of the Australian example has yet to be determined. As with economic sanctions, such punitive actions are not always successful. As an example of a positive case, Iran was persuaded to curtail its nuclear program after a negotiation with the P5+1 (Germany) that was preceded by a United Nations prohibition on sales of Iranian oil. On the other hand, other coun-tries on the receiving end have refused to give in and would rather pay an economic price than acquiesce to
such economic blackmail. President Vladimir Putin’s Russia has largely ignored US and European demands to change its ways despite the economic harms from Western sanctions. In this case, Russia had the support from other countries—especially China—as well as the fact that the economic toll from sanctions was not so great as to threaten the regime’s hold on power.
In the Australian case, some in the business community and others are calling for Canberra to change its con-frontational approach toward China. At the same time, Australia has some leverage and could withhold vital exports that would hurt the Chinese economy—but such action would involve paying an additional economic price. Canberra could also appeal to the World Trade Organization (WTO). Multilateral institutions have histor-ically helped to level the playing field, ensuring rights to smaller states and tempering the advantages the great powers have in dealing with them.

China-US Competition: Measuring Global Influence
6 ATLANTIC COUNCIL
interdependencies. The possession of resources gives states the ability to become interdependent with state part-ners. Developing a large and complex economy creates the material resource base for engaging with more part-ners and developing linkages that are more imbalanced in favor of the larger economy. This is also true of states
that possess large military manufacturing sectors: part-ner states can become reliant on the other’s cutting-edge technologies, which would be difficult to replicate at home. Conditions arising from these size imbalances give the ad-vantage to those with more capacity, potentially boosting their power and influence over the others.

China-US Competition: Measuring Global Influence
7ATLANTIC COUNCIL
Building the Formal Bilateral Influence Capacity Index
The FBIC Index measures the multidimensional asymmetrical dependence of one country on an-other. It is the product of two subindices, one mea-suring the “bandwidth” across a relationship and
another measuring the “dependence” of one state on an-other. The measure includes data representing economic-, political-, and security-related variables.
Bandwidth measures the volume of interactions between countries, such as the amount of economic activity that flows across borders in a given year. Two countries that interact more frequently and across more dimensions of activity are more likely to have opportunities to exert influ-ence on one another. All bandwidth values are the same for country A and country B in a dyad (pair).
Dependence measures how reliant one country is on an-other for its economic activity or security services by, for example, measuring levels of trade as a share of total trade or as a share of GDP. Countries with high levels of de-pendence can be more easily manipulated. Dependence values differ within a dyad, where values for A to B are different than those for B to A.
Often, countries with higher levels of bandwidth will have a greater opportunity for increased dependence. However, high levels of bandwidth do not necessarily translate into imbalanced relationships between pairs of states. For example, China and the United States have high lev-els of bilateral bandwidth but very low levels of bilateral
dependence. As a counterexample, consider the relation-ship between a very small country and very large country. Where bandwidth and dependence are both relatively high compared to the global average, overall influence capacity is particularly high, such as Russian influence capacity in Belarus.
There are various ways of thinking about the relationships among dependence, bandwidth, and influence capacity. For some, it may be useful to think about a physical lever, where the length of the lever is equivalent to bandwidth and the size and positioning of the fulcrum represents the degree of dependence. In this metaphor, as the length of the lever (bandwidth) grows, the amount of potential leverage increases. How much leverage country A actually possesses over country B is then determined by the posi-tioning of the fulcrum and the asymmetry of the length of lever extending on the respective sides of A and B (depen-dence). Both factors can independently or simultaneously increase the ability of one side in a relationship to lever-age the other. Note that this lever-and-fulcrum analogy illustrates a capacity for leverage; it says nothing about whether A chooses to (or has the political will to) pull the lever and influence B.
In the FBIC Index, bandwidth can be broken down into po-litical, economic, and security components. Dependence contains economic and security components but excludes political dependence, given that quantifiable diplomatic relationships are largely undirected in nature (treaties, for
Dimension Economic Security Political
Bandwidth Total Goods Trade Total Arms Transfers Level of Diplomatic Representation
Trade Agreements Military Alliances Shared Intergovernmental Organization Membership
Dependence Goods Trade, % of Total Goods Trade
Arms Import Stock, % of Total Arms Import Stock
Goods Trade, % of GDP Arms Import Stock, % of Military Spending Stock
Aid, % of Total Aid
Aid, % of GDP
Table 1: Dimensions, subcomponents and core variables for the FBIC Index

China-US Competition: Measuring Global Influence
8 ATLANTIC COUNCIL
example, can at times be as much a burden as they are a benefit for partner countries). These subcomponents and their core variables are summarized below in Table 1.
Tables 2 shows the actual figures for FBIC, bandwidth, and dependence for China and the United States respec-tively for their relations with Indonesia in order to provide a
13 Index values, scaled from zero to one, are rounded to the nearest thousandth decimal. For a fuller description of the index methodology, see this report’s appendix.
specific example of how these measures are applied using the FBIC Index. See, for example, how China’s influence capacity, as measured by FBIC, is estimated to have in-creased from 2018 to 2019 despite a small decrease in Indonesia’s estimated dependence on China owing to the fact that this decrease was offset by a larger increase in bandwidth between the two countries.
Table 2: Formal Bilateral Influence Capacity in, Bandwidth with, and Dependence of Indonesia relative to China and the United States, 2016 through 202013
Influencing country
Country receiving influence
Year FBIC Bandwidth Dependence
China Indonesia 2016 0.256 0.451 0.324
China Indonesia 2017 0.262 0.454 0.329
China Indonesia 2018 0.263 0.457 0.329
China Indonesia 2019 0.264 0.461 0.327
China Indonesia 2020 0.261 0.462 0.323
United States Indonesia 2016 0.223 0.384 0.342
United States Indonesia 2017 0.246 0.394 0.356
United States Indonesia 2018 0.260 0.403 0.368
United States Indonesia 2019 0.261 0.410 0.363
United States Indonesia 2020 0.245 0.410 0.341

China-US Competition: Measuring Global Influence
9ATLANTIC COUNCIL
Exploring the FBIC Index
14 As measured by GDP at market exchange rates using constant 2011 US dollars.
In the following sections the authors explore the behav-ior of the FBIC Index, starting at the global level and tracking how the index measures change in the inter-national system across time. Next, we focus on global
dynamics between China and the United States, eventually demonstrating how the index can be used to trace behav-ior in a regional international organization, ASEAN.
Most Influential States
Although the country sum of the FBIC measure can be helpful for thinking about the global distribution of power, another way to track the behavior of the measure is to track which countries are the greatest external influencers around the world and across time. Figure 1 shows this for six historically influential countries for the year 2020. The United States is the most influential country across the Western Hemisphere, and Germany is the top-ranked in-fluencer across much of Europe, while Chinese influence has spread across much of Southeast Asia and Africa. Russia is the top-influencer primarily in Central Asia, though its influence capacity also spills over into Belarus, its much smaller and highly dependent neighbor, and into Algeria, the third largest importer of Russian arms over the past half-decade. Meanwhile, the influence of previ-ous colonial powers is much more limited, with French
influence scattered across North, West, and Southern Africa and the United Kingdom displaying the top influ-ence capacity only in Ireland.
Figures 2 and 3 show these patterns across time. In 1980 the world saw much more influence from traditional colo-nial powers, with French influence stretching across Africa and influence from the United Kingdom spread around the world. The influence of the Soviet Union was also much more pronounced, as was influence from the United States in most of East and Southeast Asia. By the year 2000, the geopolitical environment had shifted once again. French influence across Africa had declined, and influence from Russia was more consolidated across Eastern Europe and Central and South Asia. Chinese influence had started to emerge at this point, with growth in key emerging partners like Iran and Sudan.
China and the United States
The changing structure of the international system away from its unipolar moment in the years following the Cold War has been the focus of much policy-oriented research. The rise of China is unmistakable, with overall economic activity growing from $937 billion in 1990 to $13.3 trillion by 2020,14 military spending increasing from $23 billion in
FranceUnited Kingdom
RussiaGermany
ChinaUnited StatesOther
Top influencer – 2020
Figure 1: Top influencer in each country, 2020.
Top Influencer – 2020

China-US Competition: Measuring Global Influence
10 ATLANTIC COUNCIL
1990 to $273 billion by 2020, and population in extreme poverty declining from 66 percent in 1990 to less than 1 percent by 2020.
The growth of China’s relational power is also reflected in its FBIC Index scores, showing a cumulative increase from a global summed value of three in 1990 to over twenty today.
Meanwhile, US values have remained relatively flat from the 1980s to the present, with some slight reductions over the past few years. See Figure 4, which compares the outward influence capacities of China and the United States from 1960 through 2020 as well as the influence received in each country. Outward influence capacity is the influence that a country can exert on the rest of the world. It is the sum of a
FranceUnited Kingdom
Soviet UnionWest Germany
ChinaUnited StatesOther
Top influencer – 1980
FranceUnited Kingdom
RussiaGermany
ChinaUnited StatesOther
Top influencer – 2000
Figure 2: Top influencer in each country, 1980.
Figure 3: Top influencer in each country, 2000.
Top Influencer – 2000
Top Influencer – 1980

China-US Competition: Measuring Global Influence
11ATLANTIC COUNCIL
country’s FBIC scores in all other countries in a given year—roughly, the amount of leverage that a country has over other states. Influence received is the reverse of that rela-tionship. It is the sum of all countries’ FBIC scores in a given country in a given year—roughly how much relational power other countries have in a given country.
While trends in the sum of total influence tell a similar story pertaining to other measures of material capabilities, the FBIC Index allows analysts to assess how specific bilateral relationships have been changed. Figure 5 shows which countries the United States has more influence in relative to China in 1992 and 2020 (China’s FBIC scores were sub-tracted from US scores, providing net US influence capac-ity relative to China). In 1992, the United States was more influential than China in most of the Western Hemisphere, with notable exceptions in Cuba and Nicaragua. US in-fluence was also greater throughout Western Europe, Oceania, and parts of East Asia and the Middle East. Chinese influence outpaced the United States in the for-mer Soviet Union, a handful of countries within Southeast Asia, and in a few countries scattered across Africa.
By 2020, however, the map had shifted significantly. Most notable is the erosion of US influence relative to Chinese
influence across nearly every global region. Chinese influ-ence outweighs US influence across much of Africa and Southeast Asia and has increased in former Soviet states. Chinese influence has also eroded the US advantages in South America, Western Europe, and East Asia.
Moving from the regional to the country level, Chinese influence capacity has surpassed US capacity in many key states. From 1960 to 2010, US influence capacity in Indonesia was much greater than China’s. Nevertheless, Chinese influence capacity surpassed US capacity in 2011 and has remained greater through 2020. The United States retained more relational influence capacity in Pakistan from 1960 through 2013, when Chinese capacity surpassed that of the United States. In Ghana, Chinese re-lational influence outstripped that of the United States by 2007; while in Ethiopia, Chinese influence capacity passed that of the United States by 2009. In each of these places, China’s economic tools of statecraft have been responsi-ble for most of these gains.
Another way to compare the influence capacities of the United States and China is to count the number of coun-tries in which Washington has had a greater capacity than Beijing over time. Figure 6 tracks this. In 1992, China had
0
5
10
15
20
25
30
35Su
m o
f FB
IC In
dex
US China outward influence capacity influence received
Figure 4: Sum of outward and inward FBIC Index scores for China and the United States.

China-US Competition: Measuring Global Influence
12 ATLANTIC COUNCIL
more influence capacity than the United States in thir-ty-three countries, while the United States retained an advantage in 160 countries. By 2020, Chinese influence capacity had surpassed US capacity in sixty-one coun-tries, while the US lead had dropped to 140 countries.
Over time, the peak of Chinese influence capacity rela-tive to US influence occurred in 2012, when China had more influence in sixty-seven countries compared to the United States, though it has seen a modest decline since then. Chinese relational power saw the greatest
Figure 5: Changes in US net influence capacity relative to China since the end of the Cold War, where net influence capacity is calculated as the US FBIC Index score in a given country minus China’s FBIC Index score.

China-US Competition: Measuring Global Influence
13ATLANTIC COUNCIL
increase relative to the United States—nineteen coun-tries—under former Chinese President Hu Jintao (2004 to 2012). The US leader overseeing the greatest reduction in the number of countries susceptible to US influence was George W. Bush. During his administration (2001 to 2009), seventeen countries switched from being susceptible to greater US to Chinese influence. Since then, the pace of such changes has slowed. Note, however, that these sums are net gains and losses. Over the past decade, China and the United States have swapped leading positions relative to one another in several dozen countries, with the general trend being a stalemate. During the past three decades, however, the average trend has clearly been in China’s favor.
Influence Capacity and ASEAN Member States
Although the United States maintains a strong relational power position internationally, China has made rapid prog-ress over the past two decades—albeit at a slower pace in
recent years. This is particularly evident in Southeast Asia, which has occupied a special geopolitical and economic position throughout history, particularly so in the modern era after the creation of ASEAN. This section explores how the FBIC Index can be useful in analyzing the current state of relational influence within ASEAN countries as well as from China, the United States, and US partners.
Historical Relational Power Trends Among ASEAN Members According to the FBIC Index
The era of high influence capacity enjoyed by the United States throughout the Cold War—which peaked during the Vietnam War—is evident. The regional member states of the Southeast Asia Treaty Organization (SEATO)—the Philippines and Thailand—enjoyed particularly strong se-curity relations with Washington during this period. Since the 1980s, American influence in the region has stagnated. Chinese relational power began to emerge toward the end of the 1980s, which also coincided closely with the
Figure 6: Changes in US influence capacity dominance worldwide relative to China, which has narrowed and at least temporarily stabilized in recent years.
20
40
60
80
100
120
140
160
180
Cou
nt o
f cou
ntrie
s
Bush: -17
Xi: -7
Influence capacity match-up and country leadership changes
Number of countries where the US had greater influence capacity than ChinaNumber of countries where China had greater influence capacity than the US
Clinton: -2 Obama: -4 Trump: +3
Hu: +19Jiang: +14 (from 1989)
Influence capacity match-up and country leadership changes

China-US Competition: Measuring Global Influence
14 ATLANTIC COUNCIL
intraregional influence growth created by the ASEAN Free Trade Area coming into effect in the early 1990s. However, a few countries, such as Cambodia and Laos, proved less able to benefit from this period of growth to build their own relational power in the region, falling increasingly into dependence on other states.
The next major shift occurred after the signing of the ASEAN-China Free Trade Area in the early 2000s, which led to a massive increase in regional dependence on China, particularly in the economic domain. US engage-ment remained stagnant in the region, but intraregional linkages witnessed a sizable increase by those states with a greater capacity to build partnerships, less so for others. Cambodia, Laos, and Myanmar saw marginal increases in regional interconnectedness while Singapore, Thailand, Indonesia, Malaysia, Vietnam, and to a smaller degree the Philippines benefited greatly from the regional free trade.
Chinese relational power throughout the 2000s and 2010s increased, eventually reaching the point where the rela-tional power level of the United States was matched and exceeded in 2008. Since 2008, Chinese influence capac-ity has continued to grow, and the disparity between China and the United States has become more pronounced. Intraregional influence, however, has plateaued for those
states that benefited from free trade–related growth, with those that did not remaining extremely low in their own relational power, even among their neighbors. The current situation suggests that intraregional and American influ-ence capacity in Southeast Asia remains stagnant, while China continues to build upon the period of massive gains achieved between the years 1998 and 2013.
These developments led to a situation where, by 2020, US influence was continuing to stagnate while China’s was on the rise, and intraregional connections plateaued. The United States’ inability to compete with China in economic development within the region, along with Washington’s turn toward the Middle East and elsewhere in the 2000s, left an opportunity for Chinese relational power to grow. Still, while Chinese influence is entrenched in some Southeast Asian countries, others remain battlegrounds for Sino-US competition. The authors of this study present these find-ings below and suggest opportunities for strategic engage-ment for the United States with traditional partners.
Country-Level Relational Power Categories in Southeast Asia
Focusing the FBIC Index measurements at the state level, including use of longer-term trend analysis, facil-
Brunei
Cambodia
China
Indonesia
Laos
Malaysia
Myanmar
Philippines
Singapore
Thailand
US
Vietnam
0
0.5
1
1.5
2
2.5
3Co
untry
sum
of F
BIC
Inde
x
Figure 7: Sum of FBIC Index Scores for regional influence in Southeast Asia

China-US Competition: Measuring Global Influence
15ATLANTIC COUNCIL
itates a better understanding of the domestic dynamics of relational power. In doing so, ASEAN member coun-tries generally separate descriptively according to one of three characteristics: China-Dominant, US-Dominant, or Competitive.
China-Dominant
Interestingly, despite its regional prominence, China does not hold substantial influence capacity dominance across the full range of ASEAN member states. Rather, it has fo-cused influence in some states, is competing for the lead in others, and has a much less pronounced presence in a few. As of 2020, China enjoyed the large plurality of do-mestic-level relational power in only three ASEAN states: Cambodia, Laos, and Myanmar.
After decades of political instability or isolation, China has made inroads into these states by providing eco-nomic linkages where few had previously existed. Despite being ASEAN member states, intraregional in-fluences have been low. These states were not the main beneficiaries of the free trade areas. As a result, China has been able to maintain a dominant position of influ-ence in them, which has motivated these states to some-times act as proxies for Chinese interests within ASEAN.
Cambodia has been accused by observers of acting in this manner, sometimes in ways that are deemed con-trary to its own self-interest. Using the FBIC Index to an-alyze the dependencies with China, it is clear that all China-dominant states—not just Cambodia—lack robust intraregional linkages with their neighbors. These states are either marginalized or restricted to one or two limited partnerships.
In the wake of its recent coup, Myanmar is likely to be-come further isolated. However, given the already minimal US influence in the country relative to China, policymakers should understand that US sanctions and termination of aid are unlikely to substantially alter domestic Burmese policies or political moves. Rather, the benefits to US cen-sure of those responsible for the 2021 coup are diplomatic in nature, signaling to the outside world that such anti-democratic actions are unacceptable.
US-Dominant
Although overall US influence capacity in Southeast Asia has ebbed in recent years, interdependencies with the United States remain robust in a number of countries. The Philippines, a former US colony, has significant eco-nomic, cultural, and security linkages with the United
China
Indonesia
Laos
Malaysia
MyanmarPhilippines
Singapore
Thailand
US
Vietnam
0
0.1
0.2
0.3
0.4
0.5
0.6FB
IC In
dex
Figure 8: Bilateral influence on Cambodia

China-US Competition: Measuring Global Influence
16 ATLANTIC COUNCIL
States. Singapore also enjoys robust economic and secu-rity interdependencies with the United States. Although Washington still has much more relational power than Beijing in these two states, the magnitudes of the linkages have decreased gradually over time.
Despite Singapore’s longstanding position of strategic nonalignment,15 Singapore-US relations have remained strong since the end of the Cold War period. In the mod-ern era, Chinese economic inroads into Singapore have grown considerably, but they do not approach US influ-ence through a multidimensional linkage strategy that in-cludes security and political attachments.
Retaining economic and security linkages with multiple partners has allowed Singapore to bolster its position as a regional leader in ASEAN. As Sino-US competition heats up in the coming years, balancing the United States against China could become more difficult for Singapore. Singapore’s regional influence would suffer if either Beijing or Washington would force it to choose sides. Moreover, the United States’ broader regional influence would be di-minished if Singapore were to cut back on its economic
15 Daniel Wei Boon Chua, US-Singapore Relations, 1965-1975: Strategic Non-Alignment in the Cold War (Singapore: NUS Press, 2017).
engagement with China due to the boost to Singapore’s economic capacity that its free trade agreement with China provides. Instead, the United States can use its currently close ties with Singapore to encourage the state’s further outreach to the rest of the region, helping to build its re-gional prominence by supporting its large and growing economic footprint.
Competitive
Despite the region-wide evidence of Southeast Asia’s dependency on China relative to the United States, a state-level application of the FBIC Index suggests that competition between the two great powers is ongoing in many Southeast Asian states. Interestingly, most of the states falling into this category are some of the most prom-inent intraregional influencers within the member states of ASEAN: Indonesia, Malaysia, Thailand, and Vietnam, as well as the less influential Brunei. Focusing attention on Indonesia helps to draw out some findings about the state of bilateral competition, suggesting opportunities for the United States to focus its engagement in a way that will be useful to restoring this relationship.
Figure 9: Bilateral influence on Singapore
Brunei
Cambodia
China
Indonesia
Laos
Malaysia
Myanmar
Philippines
Thailand
US
Vietnam
0
0.05
0.1
0.15
0.2
0.25
0.3
0.35
0.4
0.45
0.5FB
IC In
dex

China-US Competition: Measuring Global Influence
17ATLANTIC COUNCIL
Throughout the early part of the Cold War, Indonesia main-tained a strong partnership with the United States through the Sukarno and Suharto regimes (1945–1998); at the same time, its links with other regional states remained strong. The 1965 coup that removed Sukarno from power brought about a resurgence of linkages to Washington that solidified throughout the New Order period of the 1970s and 1980s.16 However, the waning of US competition with the Soviet Union left the Suharto regime more exposed to scrutiny be-cause of its human rights abuses, which led to decreasing American security cooperation with the military regime.17 Post-Suharto, US linkages continued to deteriorate, creating opportunities for China and other intraregional partnerships. Singapore was one of the more substantial holders of rela-tional power with Indonesia, until the rapid ascendency of China in the mid-2000s led to a disengagement.
Recent US efforts to reengage through the US-Indonesia Strategic Partnership have yielded some positive results, but the growth of Chinese economic influence remains
16 Ang Cheng Guan, “United States-Indonesia Relations: The 1965 Coup and After,” War and Society 21 (1), 2003: 119–3617 Bradley R. Simpson, “Denying the ‘First Right’: The United States, Indonesia, and the Ranking of Human Rights by the Carter Administration, 1976-1980,”
International History Review 31 (4), 2009: 798–826. Also Anthony L. Smith, “A Glass Half Full: Indonesia-U.S. Relations in the Age of Terror,” Contemporary Southeast Asia 25 (3), 2003: 49-472.
18 Anne Marie Murphy, “US Rapprochement with Indonesia: From Problem State to Partner,” Contemporary Southeast Asia 32 (3), 2010: 1303–20.19 Eveline Danubrata and Gayatri Suroyo, “In Indonesia, Labor Frication and Politics Fan Anti-Chinese Sentiment,” Reuters, 2017.
considerable.18 Although the United States neared rela-tional power parity with China in Indonesia in 2018-2019, the COVID-19 effect had a more substantial negative ef-fect on US linkages. Still, long-term opportunities exist for Washington to build strong economic and security cooper-ation with Indonesia. The Indonesian government could be open to greater cooperation with the United States, partic-ularly given domestic concerns about overdependency of the economy on China in recent years.19 The most direct approach for Washington would be to maintain security ties— the primary component of influence that the United States possesses in Indonesia relative to China—while staying attuned to illiberal trends in the country.
Opportunities for Multilateral Engagement in Southeast Asia
Although the competition between the United States and China often draws the most attention from observers, intra-regional linkages in Southeast Asia also merit examination.
Brunei
China
Laos
Malaysia
Myanmar
Philippines
Singapore
Thailand
US
Vietnam
0
0.05
0.1
0.15
0.2
0.25
0.3
0.35
0.4FB
IC In
dex
Figure 10: Inward Relational Power by State in Indonesia

China-US Competition: Measuring Global Influence
18 ATLANTIC COUNCIL
Many states in the region have security and economic strengths in their own right, and the growth of the ASEAN free trade bloc has created powerful interdependencies among the participants. Although these linkages may be smaller relative to their ties with China or the United States, many are significant in scope. Below the authors of this study explore some of these intra-ASEAN relational power trends, highlighting regional capacities and pointing out areas of opportunity to leverage the regional power of some states.
Owing to the outsized dominance of American economic and arms trade into the 1980s, intra-ASEAN intraregional connections were marginal in comparison, and only a few states were able to establish their own interdependencies of scale. Singapore had already established itself as a global economic hub and used its trade to build economic networks with other states in the region, particularly to Indonesia, Malaysia, and Thailand. Although to a much smaller degree, Vietnam was able to leverage its political connections to Laos and Cambodia in order to slowly build up a subregional position. Political issues, occupation, and general impover-ishment in other areas left states like Cambodia, Laos, and Myanmar unable to begin building intraregional interdepen-dencies for some time, themselves remaining the subjects of asymmetrical relationships with other states.
The implementation of the ASEAN Free Trade Area in 1993 was a major event in the history of interregional trade in Southeast Asia. As an intergovernmental organization, ASEAN by the early 1990s had taken on the position of being a forum for economic negotiation between the member states. With implementation of a free trade zone, intraregional connections were for the first time rapidly developing, creating strong economic ties between the member states. These interdependencies spread with the introduction of new members into the organization, incor-porating states that were previously mostly isolated from the rest of the region owing to the geopolitical tensions of the Cold War.
Ascension of the ASEAN-Chinese Free Trade Area in the early 2000s created another rise in intraregional depen-dencies, as more states were able to reallocate benefits to building more linkages with their neighbors. However, this period of growth has stagnated since the late 2000s. The ASEAN members who had benefited intraregionally from the capacity for free trade saw slower growth after limited absolute increases in intra-ASEAN trade since 2010. Countries that were largely behind, even during the growth periods, continued to occupy the lower bounds of outward interdependencies.
Figure 11: ASEAN Intraregional Relational Power by State
Brunei
Cambodia
Indonesia
Laos
Malaysia
Myanmar
Philippines
Singapore
Thailand
Vietnam
0
0.2
0.4
0.6
0.8
1
1.2
1.4
Cou
ntry
sum
of F
BIC
Inde
x

China-US Competition: Measuring Global Influence
19ATLANTIC COUNCIL
Relative to the United States and China, each member state of ASEAN possesses a much smaller amount of relational power among its neighbors on a bilateral capacity, sug-gesting that the region is largely beholden to external pow-ers for economic and security linkages. Nonetheless, the unifying bond of membership in ASEAN points to the pos-sibility that intraregional interdependencies have room to grow, should the organization pursue a more coordinated approach toward economic relations (coordinated security relationships are perhaps a bridge too far and something that even the much more tightly connect European Union struggles with). In other words, the intraregional power of Southeast Asia is not negligible, just fractured. If the rel-ative power between each state in ASEAN was summed together, the bloc would collectively possess more than double the influence of either the United States or China in the region, as seen in Figure 12.
This suggests that Southeast Asia is not powerless in the face of external states, but the fractured regional dynam-ics have given the United States, China, and others the opportunity to develop dependencies without substantial regional pushback. The regional integration so far devel-oped suggests great potential for Southeast Asia relative to other areas of the world. If ASEAN can build internal unity and pursue common interests, member states could build
intraregional influence as a counterbalance to external part-ners. In doing so, Southeast Asian countries could lever-age their linkages to focus more on localized growth and partnerships, becoming less dependent on major powers. Although this could have a negative impact on American influence in the region directly because ASEAN resources would be redirected within, China stands to lose more in its regional dependency growth given recent trends. If slowing Chinese influence is a high priority for Washington, pro-moting regional integration could be a way to accomplish this goal.
Leveraging Allies and Partners for Regional Engagement
Despite the narrative of a changing world divided be-tween the United States and China, several other countries have major linkages to Southeast Asia. Conveniently for Washington, many of these extraregional influencers are also allies with vested interests in helping to counterbal-ance strong dependence on China. The most influential extraregional countries in Southeast Asia after China and the United States are Germany, Japan, and South Korea—all three of which are US allies.
There are two ways to think about the engagement of al-lies in the region that could aid policymakers, visualized
ASEAN
China
US
0
1
2
3
4
5
6Su
m o
f FB
IC In
dex
Figure 12: ASEAN Intraregional Influence Capacity: China, US, ASEAN (summed total)

China-US Competition: Measuring Global Influence
20 ATLANTIC COUNCIL
through the FBIC Index. One way is through the bilateral engagement of allies with ASEAN member states; the other is through broader engagement by participation in regional partnerships and agreements.
In focusing on opportunities for strategic engagement within individual states where competition with China is ongoing, Vietnam is a prime candidate. Figure 13 depicts Chinese, American, and intra-ASEAN influence in Vietnam. Clearly, Beijing has been pursuing a gradual strategy of increasing Vietnam’s dependence on China over the past twenty years, while the United States only started to make large gains after President Barack Obama’s termination of the arms embargo in 2016—a policy that had been in place since the Cold War. Currently, the United States and China appear to be locked in a close race for the position of top influencer in Vietnam, with other regional partners trailing substantially.
Nonetheless, Vietnam benefits from other linkages with Pacific states and others around the world as a result of its expanding trade in manufacturing goods started by the re-gime in the last decade. Fortunately for Washington, many of these partnerships developed by Vietnam throughout the broader region and the rest of the world are with the
United States’ traditional allies, which have a vested inter-est in diversifying Vietnam’s external dependencies. Three of the most prominent US allies with growing influence in Vietnam are Germany, Japan, and the South Korea.
Using the FBIC Index to delve deeper, a starkly different narrative than simply China-US competition is apparent. Starting in 2017, South Korea made significant inroads into Vietnam through investments and trade, prompting substantial cultural exchanges between the two countries. The economic linkages were so strong that South Korea’s relational power in Vietnam leapt over the influence ca-pacities of China and the United States by a substantial degree, making Seoul the largest partner for Hanoi from 2017 through 2020. Japan also holds a strong influence position in Vietnam, on par with that of both China and the United States. Germany’s relational power trails in compar-ison, but its influence is not inconsequential, owing to its trade relations with Vietnam.
Taken together, this bloc of the United States and its allies holds a portion of influence in Vietnam that is substantially greater than China’s. Unilateral tactics by Washington to better engage Hanoi would be unlikely to produce signifi-cant shifts in dependence, but acting multilaterally with the
Brunei
Cambodia
China
Indonesia
Laos
Malaysia
Myanmar
Philippines
Singapore
Thailand
US
0
0.05
0.1
0.15
0.2
0.25FB
IC In
dex
Figure 13: Influence in Vietnam

China-US Competition: Measuring Global Influence
21ATLANTIC COUNCIL
aid of key allies presents a significant opportunity for the group to build greater cooperation with Vietnam.
These are not the only states with significant influence in Vietnam, however. Vietnam for most of the late Cold-War period was a major strategic partner of the Soviet Union, acting as a regional counterbalance to China in Southeast Asia; this was facilitated in part by Soviet trade and military sales. Although the Soviet Union has since dissolved, Russia has reinvigorated connections with its traditional partner, rebuilding influence through economic exchanges and security cooperation. Taking into consider-ation Russia’s influence capacity presents a complication for the United States and its allies because Russia has be-come the second-most influential state in Vietnam. As can be seen in Figure 15, any strategy to engage more with Vietnam will need to factor in the state’s dependence on Russia and affinities that have endured between the coun-tries for over fifty years.
Using the FBIC Index to analyze Southeast Asia at the regional level, it is evident that many US allies are signif-icant partners of states throughout the region. Although none of the allies have the same broad regional influence enjoyed by China and the United States, their connections
are substantial and present opportunities for chipping away at Chinese influence. South Korea and Japan oc-cupy the third and fourth positions of influence among the ASEAN states respectively, while Germany’s position is on par with that of the regional economic hub, Singapore. Overall, the United States and its allies exert a total influ-ence capacity in the region that far outweighs China’s. See Figure 16.
One approach to boosting US influence in Southeast Asia could involve negotiating a preferential trade agreement between the United States and ASEAN, expanding US eco-nomic bandwidth in the region and counterbalancing the ASEAN-China Free Trade Area, which achieved full imple-mentation in 2020.
Thinking more broadly, however, joining the Comprehen-sive and Progressive Agreement for Trans-Pacific Partner-ship (CPTPP)—an agreement with which many policymakers of the Biden administration are undoubtedly thoroughly fa-miliar, and which probably would not need to be negotiated from scratch—could have a similar effect. Namely, US mem-bership in the CPTPP would boost economic bandwidth with key US allies and partners in the Asia-Pacific, partic-ularly Japan, and with countries at the heart of US-China
China
Germany
Japan
S. Korea
US
0
0.05
0.1
0.15
0.2
0.25
0.3
0.35
0.4FB
IC In
dex
Figure 14: Inward Relational Power by State in Vietnam with Major US Allies

China-US Competition: Measuring Global Influence
22 ATLANTIC COUNCIL
China
Germany
Japan
S. Korea
Russia
US
0
0.05
0.1
0.15
0.2
0.25
0.3
0.35
0.4
0.45
0.5FB
IC In
dex
China
Germany
Japan
S. Korea
Singapore
US
0
0.5
1
1.5
2
2.5
3
Cou
ntry
sum
of F
BIC
Inde
x
Figure 15: Inward Relational Power by State in Vietnam with Russia (prev. Soviet Union)
Figure 16: Regional Inward Relational Power in Southeast Asia with US Partners

China-US Competition: Measuring Global Influence
23ATLANTIC COUNCIL
competition in Southeast Asia, particularly Malaysia and Vietnam. As Figures 12 and 16 illustrate, the cumulative re-gional influence capacity of these countries, which Wash-ington could in turn help to shape, is significant.
This conclusion only speaks to the ability of this particu-lar agreement to expand US influence through economic linkages into the region; it does not address critiques of the agreement’s negotiation transparency and possibly detrimental domestic-level economic and environmental effects. Although the CPTPP is likely to boost the econ-omies of member countries and reduce poverty, its long-term gains are projected to increase income inequality in countries such as Vietnam.20 Meanwhile, the suspension of a provision in the trade agreement that would have required member countries “to combat, and cooperate to prevent, the trade of wild fauna and flora,” formerly Article 20.17.5 of the Trans-Pacific Partnership, does not bode well for conservation efforts in Southeast Asia, a region already under severe threat owing to the loss of
20 World Bank, “Economic and Distributional Impacts of Comprehensive and Progressive Agreement for Trans-Pacific Partnership: the Case of Vietnam,” (Washington, DC: World Bank Publications, 2018).
21 Jan Schipper, et al, “The Status of the World’s Land and Marine Mammals: Diversity, Threat, and Knowledge,” Science 322 (5899), 2008: 225–30. Also Lian Pin Koh, et al., “Remotely Sensed Evidence of Tropical Peatland Conversion to Oil Palm, PNAS 108 (12), 2011: 327-77.
habitat and biodiversity.21 Another complicating factor is Chinese President Xi Jinping’s recently expressed interest in joining the CPTPP, which could blunt the impact of US membership.
Acting through allies and partners, the United States could also counteract China’s influence capacity by continuing to strengthen the security alliance between the United States and Japan, perhaps by pushing for Japan to become a formal member of the “Five Eyes” intelligence-sharing ar-rangement. Although this is not a conclusion that can be drawn mechanically from the FBIC Index, which quantifies security in terms of arms and alliances, becoming a “Sixth Eye” could ensure further sharing of sensitive equipment, greater synergy between weapon systems, and thus in-creased arms bandwidth and dependence—core elements of the FBIC Index’s security component.
In addition, the United States could encourage expanded involvement in Southeast Asia by key East Asian ally South
Brunei
Cambodia
Indonesia
Laos
Malaysia
Myanmar
Philippines
Singapore
Thailand
Vietnam
0
0.2
0.4
0.6
0.8
1
1.2
1.4C
ount
ry s
um o
f FB
IC In
dex
Figure 17: ASEAN Intraregional Relational Power by State
China-US Competition: Measuring Global Influence
24 ATLANTIC COUNCIL
Korea, which already possesses the greatest influence ca-pacity in Vietnam and has the third-highest influence ca-pacity in Thailand—the country with the top intra-ASEAN influence capacity.
As illustrated in Figure 11 and repeated in Figure 17, in-tra-ASEAN influence capacity as of 2020 can be roughly divided into four tiers. In the top tier sits Singapore, a long-term US partner. Although this partnership should not be taken for granted, enduring economic and security ties sug-gest that Singapore will most likely continue to broadly sup-port US interests in the region. Also in this tier sits Thailand, where, similar to Indonesia, the United States held signifi-cant advantages over China until recent years. Through a multilateral lens, however, Washington can continue to hold the overall advantage if, in addition to maintaining strong bi-lateral security ties, South Korean influence capacity is also relied upon to support actions consistent with US interests.
Second-tier influencers in ASEAN include Indonesia, Malaysia, and Vietnam. As discussed earlier, each of these countries is a toss-up in the US competition with China. Aside from joining the CPTPP, which would boost US influ-ence capacity in the latter two countries, and continuing to cautiously foster US-Indonesia security cooperation,
Washington will need to lean on its partners—particularly Japan, Singapore, and South Korea—to further push back against Chinese influence with this group of countries. However, in Vietnam the picture remains complicated given Russia’s significant influence capacity.
Alone in the third tier of intra-ASEAN influencers is the Philippines. Although the US relationship with the Philippines has become strained in recent years—in-cluding Filipino threats to terminate the military pact with Washington and a notable year-to-year drop in US influ-ence capacity in the Philippines in the wake of COVID-19—the United States remains the dominant player in the country. While this is undoubtedly an important and his-toric relationship, limited resources may dictate that US policymakers focus their efforts elsewhere. The same goes for the fourth tier of intra-ASEAN influencers: Brunei, Cambodia, Laos, and Myanmar. Three of the four countries are Chinese strongholds, and the first (Brunei) is a toss-up state that provides little upside in terms of potential gains in influence capacity. Put simply, US policymakers are bet-ter off applying their limited time and resources to foster-ing relationships with other partners and allies both within and outside of the region when attempting to counterbal-ance China’s influence capacity within ASEAN.

China-US Competition: Measuring Global Influence
25ATLANTIC COUNCIL
Conclusion
The concept of relational power in the internation-al system is a key consideration for policymakers because it facilitates a clear understanding of the geopolitical position of states and their abilities to
pursue foreign policy objectives. Rather than simply con-ceptualizing power as the sum of material capabilities, it is important to examine how relational power is exercised between states.
The authors of this study argue that relational power, or influence capacity, is the degree of multidimensional de-pendence that one state has on another, giving the partner state a certain capacity to leverage these linkages if the connections are asymmetrical. Although the capacity to use asymmetrical interdependencies in a coercive manner depends on the larger context, the more that one country is dependent on another country for its economic and polit-ical wellbeing, as well as its security, the greater the asym-metrical advantages of the dominant partner. Building upon dyadic data across a number of interdependency domains, the authors have developed the Formal Bilateral Influence Capacity Index, which aims to quantify relational power be-tween every pair of states from 1960 through 2020.
The use of the FBIC Index facilitates the study of relational power trends at the bilateral, regional, and global levels. It also allows for a more detailed examination of the under-lying interdependencies that drive influence in each state. Future work could expand upon the bilateral measurement to create studies of network effects in the international system, studying how changes in one bilateral link affect interrelated connections to additional states.
This report has demonstrated the growing rise of depen-dence on China around the world. Disengagement by the United States, as well as withdrawal by former colonial powers from regions like Africa, have presented China with the opportunity to use its impressive economic gains to expand its global influence. The scale of its growing global influence has now put China among a small group of great powers whose sway extends beyond their immediate re-gion. Beijing has used trade and investments, in particular, to build strong linkages with a wide array of partners. Africa has been one of the regions of the world most affected by this strategy, with a substantial number of these states now having China as their primary partner. Other areas, such as Central Asia, also are becoming more dependent on China owing to Beijing’s economic linkage strategy.
Southeast Asia has also been greatly affected by China’s expanding influence over the past twenty years. Although
the United States maintained powerful influence in the region throughout most of the Cold War, with a mix of economic and security cooperation, the subsequent with-drawal or stagnation in linkages has presented China with an opportunity for greater engagement among the mem-ber states of ASEAN. The China-ASEAN Free Trade Area allowed greater dependency between Southeast Asian states and their powerful neighbor, growing to such a point that China has overtaken US influence in such strategically important states such as Thailand and Indonesia.
The United States probably will not be able to compete economically with China in the near future in a unilateral manner. ASEAN member-states have deep vested interests in having China as their economic partner. Nevertheless, Washington could employ a number of strategies to re-en-gage with the region and slow China’s growing influence.
The authors of this study have used the FBIC Index to map out the opportunities for the United States to change the current trajectory of increasing Chinese influence. Washington would benefit from adopting a two-pronged approach: 1) robust and multidimensional reengagement with states where the United States and China are in com-petition; and 2) renewed support for ASEAN as an organi-zation to help Southeast Asia build intraregional linkages that will empower member nations to be more reliant on each other and less beholden to China. Although the sec-ond strategy could cost the United States influence in some states, as intraregional connections become more powerful, such a strategy has the potential to slow Chinese influence growth as intraregional interdependencies be-come more powerful, a net gain for the United States.
The authors also recommend that Washington leverage allies and partners with influence in the region, such as Japan and South Korea, to pursue common objectives guided by these two strategies. Leveraging Tokyo and Seoul to boost ASEAN as a regional organization would also be beneficial for countering Chinese influence. Similar lessons can generally be applied elsewhere, particularly in Africa, where US competition with China should be viewed as a multilateral affair involving foreign policy coordination between the US and its allies and partners, leveraging col-lective influence capacity for common objectives.
The world is no longer unipolar. Policymakers must man-age competing values and interests through the balance of partners and the use of their tools of statecraft. The alternative—a unilateral, single-minded approach—could transform competition into conflict.

China-US Competition: Measuring Global Influence
26 ATLANTIC COUNCIL
Appendix
22 Thomas Kemeny and David Rigby, “Trading Away What Kind of Jobs? Globalization, Trade and Tasks in the US Economy,” Review of World Economics 148 (1), 2012: 1–16, https://doi.org/10.1007/s10290-011-0099-5. Also Paul Krugman and Richard N. Cooper, and T. N. Srinivasan, “Growing World Trade: Causes and Consequences,” Brookings Papers on Economic Activity 1995 (1), 1995: 327–77, https://doi.org/10.2307/2534577.
23 Bruce Russett, John R. Oneal, and David R. Davis, “The Third Leg of the Kantian Tripod for Peace: International Organizations and Militarized Disputes, 1950—85,” International Organization 52 (3), 1998: 441—67, https://doi.org/10.1162/002081898550626. Also Richard Rosencrance, The Rise of the Trading State: Commerce and Conquest in the Modern World. (New York, New York: Basic Books, 1986). Immanuel Kant, Perpetual Peace: A Philosophical Sketch, 3rd ed., 1795, http://www.gutenberg.org/files/50922/50922-h/50922-h.htm.
24 Guillaume Gaulier and Soledad Zignago, “BACI: International Trade Database at the Product-Level (the 1994-2007 Version),” CEPII Working Paper no. 2010 – 23: 1–35, (Paris, France: Centre d’Etudes Prospectives et d’Informations Internationales, 2010).
25 Michel Fouqin and Jules Hugot, “Two Centuries of Bilateral Trade and Gravity Data: 1827-2014,” CEPII Working Paper no. 2016 – 14: 1–39, (Paris, France: Centre d’Etudes Prospectives et d’Informations Internationales, 2016).
26 Specifically, the trade agreement index is calculated as: PSA*1 + EIA*1 + BTA*3 + BTAEIA*4 + RTA*5 + RTA *8 + CU*15 + CUEIA*20, where PSA = partial scope agreement, EIA = economic integration agreement, BTA = bilateral trade agreement, RTA = regional trade agreement; and CU = customs union.
27 Pippa Morgan and Yu Zheng, “Old Bottle New Wine? The Evolution of China’s Aid in Africa 1956-2014,” Third World Quarterly 40(7), 2019: 1283-1303.28 A 10-year sum with an annual, straight-line 10% depreciation.
Index Methodology
To transform the FBIC Index from a conceptual to a practical measure, we gather data for core input series from a host of sources (described below). These data are then normal-ized, smoothed, weighted, and combined via a multi-step process. This process was developed through elicitation of subject matter experts within the national security com-munity and validation against historical case studies. Thus, while theoretical considerations derived from the interna-tional relations literature inspired the FBIC Index, its imple-mentation was driven equally by empirical and practical realities from data-gathering through validation exercises.
Variables
Chosen both for their ability to capture core elements of countries’ economic, security, and political interactions in the international system as well as their widespread data availability, the FBIC Index’s core input variables are as follows: 1) goods trade; 2) foreign aid; 3) arms trade; 4) dip-lomatic exchange (i.e., presence of embassies); 5) shared intergovernmental organization memberships; 6) trade agreements; and 7) military alliances. The FBIC Index also uses country-level data for 8) GDP and 9) military spending as denominators for the dependence indicators.
Among the bilateral flows considered, trade is an obvi-ous core element of interstate relations and foundational to theories ranging from globalization22 to international peace.23 Given this reality, goods trade is included in the FBIC Index’s economic bandwidth subindex using data as measured by the Centre d’Études Prospectives et d’Informations Internationales (CEPII). For the years 1995 through 2018, the authors used the Base pour L’Analyse du Commerce International.24 Prior to 1995 they used TRADEHIST.25
Economic bandwidth also consists of a trade agreement index, which is meant in part to measure the structural ties and latent trading capacity between countries. This index is calculated as a weighted sum of memberships across the various types of regional trade agreements (RTAs) recorded by the WTO here; there are eight types of RTAs in total.26
Relative and absolute goods trade dependence are in-cluded in the FBIC Index’s economic dependence subin-dex. The former is measured as total goods trade of A with B as a percent of B’s total goods trade with all countries, using the CEPII data mentioned above. The latter is mea-sured by total goods trade of country A with country B as a percent of country B’s GDP, using CEPII data for trade and the World Bank for GDP.
As another component of economic dependence, the FBIC Index also includes relative and absolute foreign aid dependence. Relative aid dependence (specifically, official development assistance [ODA]) is measured as aid from country A to country B as a percent of all for-eign aid to country B, using a combination of data from the Organisation for Economic Cooperation and Development (OECD), the College of William & Mary’s AidData, and Morgan and Zheng.27 Absolute aid dependence is mea-sure as aid from country A to country B as a percent of country B’s GDP, using aid data from the sources above and GDP at market exchange rates (MER) data from the World Bank.
Given that many relationships in the international system are motivated primarily by security rather than economic concerns (NATO, for example), the FBIC Index also includes measures of relative and absolute security dependence. The former is measured as arms import stock28 from coun-try A to country B as a percent of country B’s arms import stock from all countries, using Stockholm International Peace Research Institute (SIPRI) arms transfers data.

China-US Competition: Measuring Global Influence
27ATLANTIC COUNCIL
Absolute security dependence is calculated as arms import stock from country A to country B as a percent of country B’s military stock, using SIPRI’s arms transfers and military expenditures data.
Security relationships can also readily be conceptual-ized in terms of bandwidth. This is measured in part by the arms transfer stock between country A and country B using SIPRI data. Security bandwidth is further character-ized by an alliance index, which is calculated using Rice University’s Alliance Treaty Obligations and Provisions (ATOP) data.29
29 Specifically, the alliance index is calculated as: (Nonaggression pact*5) + (Neutrality pact*10) + (Consultation pact*20) + (Defensive pact*75).30 Jonathan D. Moyer, Sara D. Turner, and Collin J. Meisel, “What are the Drivers of Diplomacy? Introducing and Testing New Annual Dyadid Data Measuring
Diplomatic Exchange,” Journal of Peace Research (Advanced online publication), 2020: 1–11, doi: 10.1177/0022343320929740.31 Paul Ingram, Jeffrey Robinson, and Marc Bush, “The Intergovernmental Network of World Trade: IGO Connectedness, Governance, and Embeddedness,”
The American Journal of Sociology 11 (3), 2005: 824–58.32 Jon C. Pevehouse, “Democracy from the Outside-In? International Organizations and Democratization,” International Organization 56 (3), 2002: 515–549.33 Brandon J. Kinne, “IGO Membership, Network Convergence, and Credible Signaling in Militarized Disputes,” Journal of Peace Research 50 (6), 2013:
659–676. Jon Pevehouse and Bruce Russet, “Democratic International Governmental Organizations Promote Peace,” International Organization 60 (4), 2006: 969–1000. John R. Oneal, Bruce Russett, and Michael L. Berbaum, “Causes of Peace: Democracy, Interdependence, and International Organizations, 1885–1992,” International Studies Quarterly 47 (3), 2003: 371–393. Bruce M. Russett and John R. Oneal, Triangulating Peace: Democracy, Interdependence, and International Organizations, (New York, NY: W.W. Norton, 2001). Bruce Russett, John R. Oneal, and David R. Davis, “The Third Leg of the Kantian Tripod for Peace: International Organizations and Militarized Disputes, 1950–85,” International Organization 52 (3), 1998: 441–467.
The final element of the FBIC Index measures political bandwidth, estimated using the average level of diplomatic representation and shared intergovernmental organization (IGO) membership between countries. Diplomatic repre-sentation is captured by an index introduced by Moyer, Turner, and Meisel.30 This index describes the formal level of accreditation of the top diplomats exchanged by each country as well as whether those diplomats are assigned to more than one country. IGO membership intersects a host of issue areas in international relations, including as a hypothesized driver of economic engagement,31 democra-tization,32 and peace and conflict.33 In the estimation of the
Aid%GDP, 0.21
Aid%Aid, 0.12
Trade%GDP, 0.28
Trade%Trade, 0.16
Arms%Arms, 0.13
Arms%Milstock, 0.1LOR Avg., 0.11
Shared IGOs, 0.19
Trade Agreement, 0.14
Total Trade, 0.35
Alliances, 0.13
Arms stock, 0.08
Formal Bilateral Influence Capacity
Bandwidth DependenceX
Figure A1: Conceptual illustration of the FBIC Index, bandwidth and dependence, and the weights provided to their subcomponents
Formal Bilateral Influence Capacity

China-US Competition: Measuring Global Influence
28 ATLANTIC COUNCIL
FBIC Index’s political bandwidth term, shared membership is weighted according to IGO importance.34
Index Calculation
The FBIC Index was calculated using the following nine-step process. First, the authors log-normalized arms stock and total trade bandwidth inputs, and then normalized these and all other bandwidth components to the average level of representation variable. This allowed the bandwidth inputs to be compared on the same scale. Second, the authors calculated a three-year moving average of the normalized bandwidth inputs and core dependence inputs. The authors then log-normalized the core dependence input variables and provided weights derived from expert elicitation to each of the normalized, averaged input variables.
The FBIC Index’s subindices are created next by summing the core inputs to create political, economic, and security bandwidth as well as economic and security dependence scores. Bandwidth and dependence index values are cre-ated by first summing the respective subindices and then treating them with maximum-minimum normalization using the maximum and minimum bandwidth and dependence values measured in the data.
The FBIC Index is finalized by multiplying the normalized bandwidth and dependence values, where the product is treated to another round of maximum-minimum normaliza-tion. An FBIC Index value of zero corresponds with zero influence capacity. An FBIC Index value of one— the high-est score possible—corresponds with the most influence capacity recorded between 1960 and 2018, the selected normalization window.
Overview of Data
The data presented in this analysis include the authors’ composite measure of influence, the FBIC Index, and its subcomponents for more than 44,000 bilateral country relationships from 1960 through 2020.
Where possible, actual observations were used for the variables used to calculate the FBIC Index. These include: 1) goods trade; 2) foreign aid; 3) arms trade; 4) diplomatic exchange (i.e., the presence of embassies); 5) shared inter-governmental organization memberships; 6) trade agree-ments; and 7) military alliances. The FBIC Index also uses country-level data for 8) GDP and 9) military spending as denominators for the dependence indicators. Interpolation and extrapolation techniques were applied to fill holes from 1960 through 2018. Beyond 2018, the Frederick S. Pardee
34 For more details on the content-analysis-based methodology for the weighting of the count of country-pair’s shared membership in IGOs, see: https://pardee.du.edu/diplometrics.
Center’s International Futures tool was used to generate “nowcasts” for the FBIC Index and its subcomponents. This estimation methodology is described below.
The FBIC Index provides measures for country-pairs’: influ-ence capacity; economic, security, and political bandwidth; and economic and security dependence. Summary statis-tics for these and the composite bandwidth, dependence, and influence capacity measures are presented below in Table A1.
Formal Bilateral Influence Capacity
The FBIC Index is built upon the idea that two main fac-tors affect the ability of states to exert influence in the in-ternational system. First, the extent of interaction across economic, political, and security dimensions creates op-portunities for states to influence each other. Second, the relative dependence of one state on another for crucial aspects of economic prosperity or security creates oppor-tunities for the more dominant state to cause the more de-pendent state to make decisions that they would not have otherwise made. We call these two subindices bandwidth and dependence. The FBIC Index is measured from zero to one, where zero indicates no influence from country A on country B, and one indicates the most influence ever mea-sured between any two countries from 1960 through 2018.
Bandwidth
Bandwidth refers to the size of the relationship (‘pipeline volume’) between countries A and B based on economic, military, and political indicators. Bandwidth is measured from 0 to 1, where 0 indicates no bandwidth between country A on country B, and 1 indicates the most band-width ever measured between any two countries from 1960 through 2018.
Economic Bandwidth
Economic bandwidth is measured through total trade and trade agreements. Specifically, this is calculated as the sum of the normalized moving average trade agreement index value for countries A and B multiplied by 0.14 plus the mov-ing average of the natural log of total goods trade between countries A and B multiplied by 0.35. These weights were determined by a survey of experts.
Political Bandwidth
Political bandwidth is measured through indicators includ-ing diplomatic level of representation and intergovernmen-

China-US Competition: Measuring Global Influence
29ATLANTIC COUNCIL
tal (IGO) membership. Specifically, this is calculated as the sum of the normalized moving average level of diplomatic of representation between countries A and B multiplied by 0.11 plus the normalized shared weighted IGO member-ship of countries A and B multiplied by 0.19. These weights were determined by a survey of experts.
Security Bandwidth
Security bandwidth is measured through arms transfers and military alliances. Specifically, this is calculated as the sum of the normalized moving average of the alli-ance index score for country A and country B multiplied by 0.13 plus the normalized moving average sum of total arms stock for countries A and B multiplied by 0.08. These weights were determined by a survey of experts.
Dependence
Dependence is the relational context that governs which side of the dyad can leverage observed bandwidth to its advantage more credibly. Dependence is measured from zero to one, where zero indicates no dependence from country B on country A, and 1 indicates the most depen-dence ever measured between two countries from 1960 through 2018.
Economic Dependence
Economic dependence is measured through trade (as a percent of total trade and as a percent of GDP) and aid received (as a percent of total aid and as a percent of GDP). Specifically, this is broken into the absolute aid de-pendence (official development assistance [ODA] from country A to B as a percent of country B’s GDP) multiplied by 0.21, which was then added with the relative aid depen-dence (ODA from country A to B as a percent of all ODA to country B in a given year) multiplied by 0.12. Also added is absolute trade dependence (goods exports plus imports between countries A and B divided by country B’s GDP) multiplied by 0.28, along with relative trade dependence (goods exports plus imports between countries A and B divided by all trade with country B in a given year) multi-plied by 0.16. These weights were determined by a survey of experts.
Security Dependence
Security dependence is measured through arms imports stock (as a percent of military spending stock and as a per-cent of all arms import stock). Specifically, this is calculated as the sum of relative arms dependence (arms stock from country A to B as a percent of arms stock transferred to
Variable N μ σ Max. Min. % Missing
Influence Capacity 1,766,019 0.0076 0.0337 1 0 7.76
Bandwidth 1,767,068 0.0677 0.0976 1 0 7.70
Political bandwidth 1,881,519 0.0616 0.0482 0.2325 0 1.73
Economic bandwidth 1,777,853 0.1061 0.1824 1.9092 0 7.14
Security bandwidth 1,914,567 0.0421 0.1347 1.4095 0 0.00
Dependence 1,776,804 0.0215 0.0608 1 0 7.20
Economic dependence 1,777,853 0.0806 0.2197 3.6797 0 7.14
Security dependence 1,913,475 0.0079 0.0620 1.5034 0 0.06
Table A1: Summary statistics for the Formal Bilateral Influence Capacity index and its subcomponent indices, 1960 through 2020
Note: N = number of observations; μ = mean average; σ = standard deviation; max. = maximum value; min. = minimum value; % missing = percent of values in the full dataset that could not be estimated. Values rounded to the ten-thousandth decimal.

China-US Competition: Measuring Global Influence
30 ATLANTIC COUNCIL
country B in a given year) multiplied by 0.13, which is then added to absolute arms dependence (arms stock from country A to B as a percent of country B’s military stock) multiplied by 0.10. These weights were determined by a survey of experts.
Historical Data Estimation and Nowcast Methodology
The nowcasting methodology consists of two stages: 1) filling holes in each of the FBIC Index’s core input vari-ables through the year 2018, and 2) extending these values to 2020 using model-based estimates from the International Futures (IFs) integrated assessment plat-form. In this first stage, we applied a piecewise cubic Hermite interpolating polynomial to impute missing val-ues in observed military spending (from which military stock was calculated) and GDP data, and extrapolated values to 2018 using a Gaussian-kernel-weighted smooth-ing process. The Gaussian-kernel-weighted smoothing process was applied to all other input variables for the purposes of both interpolation and extrapolation from 1960 through 2018.
To extend the FBIC Index’s core input variables from 2018 to 2020, the authors began by projecting individual components of these input variables using model-based estimates from IFs. After this process, the authors recon-stituted the core-input variables and calculated the FBIC Index using the methodology described above. The re-mainder of this section describes the specific process used for each constituent variable as well as a summary of the relevant model dynamics in IFs.
GDP: For the nowcast period (2019 through 2020), the authors applied GDP growth rates from the International Monetary Fund’s (IMF) World Economic Outlook (2020 WEO) to 2018 values of GDP at MER in 2011 constant USD. These projections are used in the estimation of other FBIC Index components (e.g., aid and trade) and are an import-ant driving variable within the IFs model.
Aid: Bilateral aid as a percent of the donor’s GDP is as-sumed to be constant over the 2019 through 2020 nowcast period. Using GDP estimates, the authors calculated bilat-eral aid in constant 2011 USD and used the results to cal-culate the aid as a percent of total aid component.
Trade: From the IFs model the authors estimated the 2019 and 2020 growth rates of total trade for each country, then averaged these growth rates for each country-pair
35 For more information see the IFs Economics model documentation see: https://pardee.du.edu/wiki/Economics.36 Ibid.37 This practice is similar to that recommended by Gregory G. Hildebrant,The Capital Valuation of Military Equipment: Conceptual and Measurement Issues,
(Santa Monica, CA: RAND, 1985, 41).
and applied the result to the corresponding 2018 values of bilateral trade. Trade in IFs employs a pooled approach (common in many computable general equilibrium mod-els), which estimates export capacity and import demand for each country, reconciling final exports and imports using domestic and global prices (adjusted by exchange rates).35
Bilateral arms transfers: Arms exports were initialized from data in 2015 and forecast in IFs as a function dyadic energy imports, military spending of both partners, the dis-tance between partners, and whether the countries share a border. These values were aggregated to capture each country’s trade with rest of the world. The authors aver-aged 2019 and 2020 growth rates of this measure for each country-pair and applied the result to the corresponding 2018 bilateral arms trade values obtained from SIPRI. To calculate arms transfers stocks, they summed the previ-ous ten years of arms transfers with a 10 percentage-point, straight-line annual depreciation rate. Using these stock estimates, the authors calculated the bilateral arms trans-fers stocks as a percent of total arms transfers stocks as well as a percent of military spending stock (described below) components of the FBIC Index.
Military spending: Military spending nowcasts were esti-mated by applying 2019 and 2020 military spending growth rates from the IFs model to the 2018 data and estimates from the first imputation phase of this process. In IFs, government expenditures are modeled across multiple destinations, in-cluding household transfers balances with government rev-enue via a debt-based equilibration mechanism. Aggregate demand for military spending is initialized from data and driven as a function of economic production and threat (a bilateral measure driven by historical patterns and relative power dynamics).36 To calculate military spending stocks we summed the previous ten years with a 10 percentage-point, straight-line annual depreciation rate.37
Level of representation (LOR): IFs initializes level of rep-resentation from historical data and projects it as a func-tion of regime type (from the POLITY IV project), GDP per capita (at PPP), as well as an assumed tendency towards greater diplomatic representation (a basic annual increase in LOR). To nowcast this measure, the authors applied the average annual growth rate between all country-pairs of the IFs variable and applied it to 2018 bilateral estimates.
Intergovernmental organization (IGO) membership: IFs ini-tializes IGO membership from historical data and projects it as a function of trade openness (exports plus imports as a
China-US Competition: Measuring Global Influence
31ATLANTIC COUNCIL
share of GDP), material capabilities (using the Hillebrand-Herman Index),38 as well as an assumed tendency towards greater IGO participation (a basic annual increase in IGO membership). To nowcast this measure, the authors aver-aged annual growth rates between all country-pairs of the IFs variable and applied it to 2018 bilateral estimates.
Trade agreements: Bilateral trade agreement values were carried forward from 2018.
38 For more on the Hillebrand-Herman Index, see: Whitney Doran, Alanna Markle, and Jonathan D. Moyer, Measuring National Power Codebook [Diplometrics], (Denver, Colorado: Frederick S. Pardee Center for International Futures, Josef Korbel School of International Studies, University of Denver, 2018), https://pardee.du.edu/measuring-national-power-codebook.
39 Although the carry-forward process for military alliances and trade agreements may result in 2020 nowcasts of the FBIC Index exhibiting less dynamism than expected for a handful of dyads, the overall impact would probably be small given that these trends typically exhibit little movement over short periods of time. With respect to the expected impact of Brexit on this measure, the carry-forward approach should not misrepresent agreements and alliance among EU members because the transition period for the United Kingdom’s departure from the European Union extends through December 2020.
Military alliances: Bilateral military alliances values were carried forward from 2016.39
After estimating a nowcast through 2020 for each core series, subcomponents of the FBIC Index were calcu-lated using the methodology described above, the only difference being that the normalization window was held constant from 1960 through 2018 rather than using the full time-window (1960 through 2020).

China-US Competition: Measuring Global Influence
32 ATLANTIC COUNCIL
About the AuthorsDr. Jonathan D. Moyer is Assistant Professor at the Josef Korbel School of International Studies and Director of the Frederick S. Pardee Center for International Futures at the University of Denver.
Collin J. Meisel is the Diplometrics Program Lead and Research Associate at the Frederick S. Pardee Center for International Futures at the University of Denver.
Dr. Austin S. Matthews is a Research Scientist at the Frederick S. Pardee Center for International Futures at the University of Denver and an Open Research Laboratory Associate at the Russian, East European, and Eurasian Center at the University of Illinois at Urbana-Champaign.
David K. Bohl is Assistant Director of Analysis at the Frederick S. Pardee Center for International Futures at the University of Denver.
Dr. Mathew J. Burrows serves as Director of the Atlantic Council’s Foresight, Strategy, and Risks Initiative and is one of the leading experts on strategic foresight and global trend analysis.

Board of Directors
CHAIRMAN*John F.W. Rogers
EXECUTIVE CHAIRMAN EMERITUS
*James L. Jones
PRESIDENT AND CEO *Frederick Kempe
EXECUTIVE VICE CHAIRS *Adrienne Arsht *Stephen J. Hadley
VICE CHAIRS *Robert J. Abernethy *Richard W. Edelman *C. Boyden Gray *Alexander V. Mirtchev *John J. Studzinski
TREASURER *George Lund
DIRECTORS Stéphane Abrial Todd Achilles *Peter Ackerman Timothy D. Adams *Michael Andersson David D. Aufhauser Barbara Barrett Colleen Bell Stephen Biegun *Rafic A. Bizri *Linden P. Blue Adam Boehler Philip M. Breedlove Myron Brilliant *Esther Brimmer R. Nicholas Burns *Richard R. Burt Michael Calvey Teresa Carlson James E. Cartwright John E. Chapoton Ahmed Charai Melanie Chen Michael Chertoff *George Chopivsky Wesley K. Clark Beth Connaughty
*Helima Croft Ralph D. Crosby, Jr. *Ankit N. Desai Dario Deste *Paula J. Dobriansky Joseph F. Dunford, Jr. Thomas J. Egan, Jr. Stuart E. Eizenstat Thomas R. Eldridge Mark T. Esper *Alan H. Fleischmann Jendayi E. Frazer Courtney Geduldig Meg Gentle Thomas H. Glocer John B. Goodman *Sherri W. Goodman Murathan Günal Amir A. Handjani Frank Haun Michael V. Hayden Amos Hochstein Tim Holt *Karl V. Hopkins Andrew Hove Mary L. Howell Ian Ihnatowycz Wolfgang F. Ischinger Deborah Lee James Joia M. Johnson *Maria Pica Karp Andre Kelleners Henry A. Kissinger *C. Jeffrey Knittel Franklin D. Kramer Laura Lane Jan M. Lodal Douglas Lute Jane Holl Lute William J. Lynn Mark Machin Mian M. Mansha Marco Margheri Michael Margolis Chris Marlin William Marron Gerardo Mato Timothy McBride Erin McGrain John M. McHugh Eric D.K. Melby *Judith A. Miller
Dariusz Mioduski *Michael J. Morell *Richard Morningstar Georgette Mosbacher Dambisa F. Moyo Virginia A. Mulberger Mary Claire Murphy Edward J. Newberry Thomas R. Nides Franco Nuschese Joseph S. Nye Ahmet M. Ören Sally A. Painter Ana I. Palacio *Kostas Pantazopoulos Alan Pellegrini David H. Petraeus W. DeVier Pierson Lisa Pollina Daniel B. Poneman *Dina H. Powell McCormick Robert Rangel Thomas J. Ridge Lawrence Di Rita Michael J. Rogers Charles O. Rossotti Harry Sachinis C. Michael Scaparrotti Ivan A. Schlager Rajiv Shah Kris Singh Walter Slocombe Christopher Smith Clifford M. Sobel James G. Stavridis Michael S. Steele Richard J.A. Steele Mary Streett *Frances M. Townsend Clyde C. Tuggle Melanne Verveer Charles F. Wald Michael F. Walsh Gine Wang-Reese Ronald Weiser Olin Wethington Maciej Witucki Neal S. Wolin *Jenny Wood Guang Yang Mary C. Yates Dov S. Zakheim
HONORARY DIRECTORS James A. Baker, III Ashton B. Carter Robert M. Gates James N. Mattis Michael G. Mullen Leon E. Panetta William J. Perry Colin L. Powell Condoleezza Rice Horst Teltschik John W. Warner William H. Webster
*Executive Committee Members
List as of May 17, 2021

China-US Competition: Measuring Global Influence
C4 ATLANTIC COUNCIL
The Atlantic Council is a nonpartisan organization that promotes constructive US leadership and engagement in international affairs based on the central role of the Atlantic community in meeting today’s global challenges.
© 2021 The Atlantic Council of the United States. All rights reserved. No part of this publication may be reproduced or transmitted in any form or by any means without permission in writing from the Atlantic Council, except in the case of brief quotations in news articles, critical articles, or reviews. Please direct inquiries to:
Atlantic Council
1030 15th Street, NW, 12th Floor, Washington, DC 20005
(202) 463-7226, www.AtlanticCouncil.org