measuring performance council in · pdf file- 1 - preface the key performance indicator (kpi)...
TRANSCRIPT

1
Measuring CouncilPerformance in Tasmania 2007-2008
Local Government Divis ionDepar tment of Premier and Cabinet

Published August 2009
© State of Tasmania
ISSN: 1833-7546
PREFACE 1
1. INTRODUCTION 5 1.1 Background to the Key Performance Indicator Framework ............................................................. 5
1.2 Accountability and Leading Practice .............................................................................................................. 5
1.4 What is Performance Measurement? ........................................................................................................... 6
1.5 Identification of Key Result Areas ................................................................................................................... 6
2. PERFORMANCE MEASUREMENT SYSTEM 7 2.1 The KPI Committee ............................................................................................................................................... 7
2.2 Defining Key Performance Indicators ........................................................................................................... 7
2.3 Performance Measurement for Tasmanian Councils ........................................................................... 8
2.4 Consolidated Data Collection .......................................................................................................................... 8
3. HOW TO USE THIS REPORT 10 3.1 Changes to some KPIs 2005-2006 onwards ......................................................................................... 10
3.2 Presentation of the Data .................................................................................................................................. 10
3.3 Analysis, Interpretation and Other Information ................................................................................... 14
KEY RESULT AREA 16
1 GOVERNANCE 16 1.1 GOVERNANCE ................................................................................................................................................... 16
1.1.1 VOTER TURNOUT ......................................................................................................................... 16
2.1 FINANCE ................................................................................................................................................................. 18
2.1.1 BUDGET ACHIEVEMENT – REVENUE ............................................................................... 18
2.1.2 BUDGET ACHIEVEMENT – EXPENSES ............................................................................. 18
2 MANAGEMENT AND FINANCE 18 2.1 FINANCE continued .......................................................................................................................................... 20
2.1.3 COST OF DEBT RATIO Note: Revised Indicator 2005-2006 ................................. 20
2.1.4 WORKING CAPITAL RATIO .................................................................................................... 20
2.1 FINANCE continued .......................................................................................................................................... 23
2.1.5 REVENUE GROWTH ..................................................................................................................... 23
2.1.6 EXPENDITURE GROWTH .......................................................................................................... 23
2.1 FINANCE continued .......................................................................................................................................... 25
2.1.7 SOURCES OF REVENUE ............................................................................................................. 25
2.1 FINANCE continued......................................................................................................................................... 28
2.1.8 REVENUE PER CAPITA ................................................................................................................. 28
2.1.9 TOTAL RATES PER CAPITA ..................................................................................................... 28
2.1.10 GENERAL RATE PER CAPITA ............................................................................................... 28
CONTENTS

2.1 FINANCE continued .......................................................................................................................................... 31
2.1.11 AVERAGE RESIDENTIAL RATE ............................................................................................ 31
2.1.12 RATES OUTSTANDING AT YEAR END ....................................................................... 31
2.1 FINANCE continued .......................................................................................................................................... 34
2.1.13 CAPITAL EXPENDITURE/DEPRECIATION RATIO ................................................. 34
2.1.14 OUTSOURCED CAPITAL EXPENDITURE .................................................................... 34
2.2 CUSTOMER SERVICE – No measures available as yet .............................................................. 37
2.3 HUMAN RESOURCE MANAGEMENT ................................................................................................ 37
2.3.1 AVERAGE COST PER EMPLOYEE ......................................................................................... 37
2.3.2 AVERAGE COST OF TRAINING PER EMPLOYEE ...................................................... 37
2.3.3 NUMBER OF EMPLOYEES PER 1000 POPULATION † ........................................... 37
2.3 HUMAN RESOURCE MANAGEMENT continued ......................................................................... 40
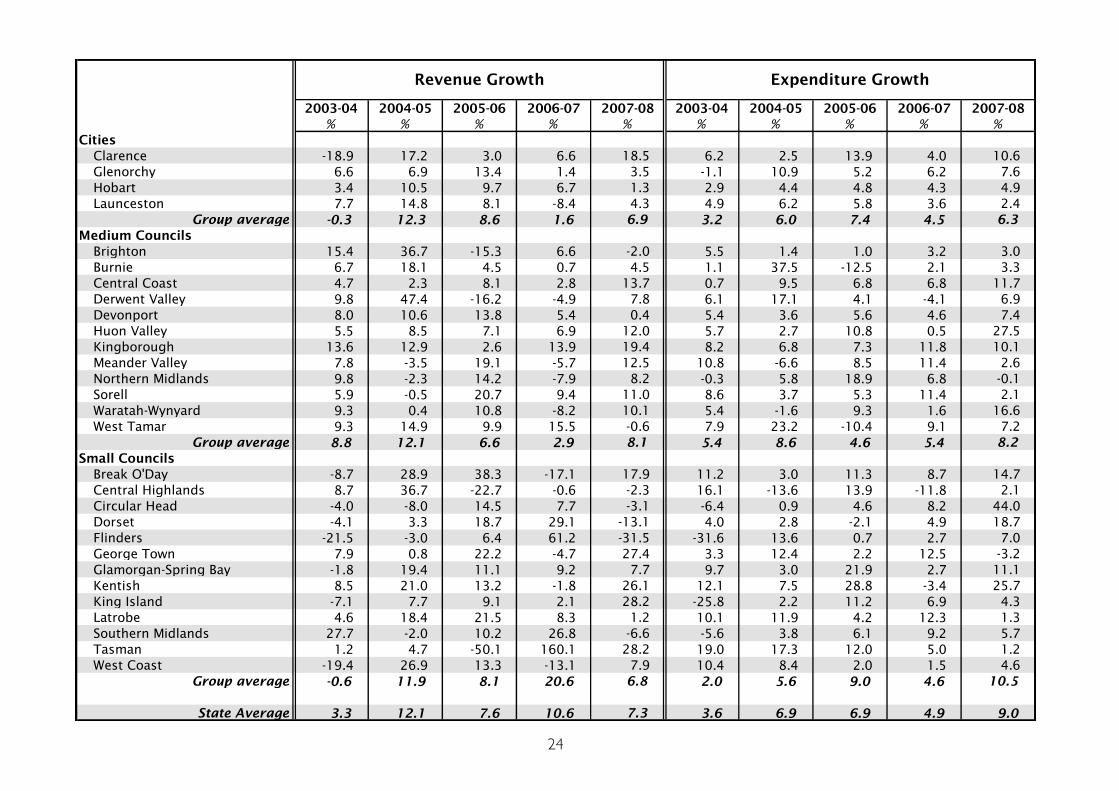
2.3.4 STAFF TURNOVER RATE ........................................................................................................... 40
2.3.5 AVERAGE SICK LEAVE PER EMPLOYEE ............................................................................ 40
2.3.6 LOST TIME DUE TO INJURY .................................................................................................... 40
2.4 INFORMATION SYSTEMS MANAGEMENT ..................................................................................... 43
2.4.1 ELECTRONIC SERVICE DELIVERY RECEIPTS ................................................................ 43
2.4.2 INFORMATION TECHNOLOGY EXPENSES ................................................................ 43
2.4.3 IT EXPENSES PER TERMINAL OR PER PERSONAL COMPUTER ..................... 43
3 REGULATORY 45 3.1 COMMUNITY HEALTH AND SAFETY ................................................................................................ 45
3.1.1 COMMUNITY HEALTH AND SAFETY EXPENDITURE .......................................... 45
3. 1 COMMUNITY HEALTH AND SAFETY Continued ....................................................................... 48
3.1.2 NUMBER OF TIMES FOOD-HANDLING PREMISES ARE INSPECTED ......... 48
3.2 PLANNING AND DEVELOPMENT ........................................................................................................ 50
3.2.1 DAYS TO OBTAIN APPROVALS .......................................................................................... 50
3.2 PLANNING AND DEVELOPMENT continued ................................................................................. 53
3.2.2 NUMBER OF PLANNING APPLICATIONS LODGED ............................................. 53
3.2.3 NUMBER OF BUILDING APPLICATIONS LODGED................................................. 53
4 INFRASTRUCTURE AND UTILITIES 55 4.1 ROADS, FOOTPATHS AND TRAFFIC ................................................................................................. 55
4.1.1 RATIO OF TOTAL EXPENDITURE ON ROADS AND FOOTPATHS TO
DEPRECIATION ............................................................................................................................... 55

4.1.2 STATE OF THE ROADS AND FOOTPATHS ASSETS ............................................. 55
4.1 ROADS, FOOTPATHS AND TRAFFIC continued .......................................................................... 58
4.1.3 EXPENDITURE PER KILOMETRE OF SEALED ROAD .............................................. 58
4.1.4 EXPENDITURE PER KILOMETRE OF UNSEALED ROAD .................................... 58
4.2 WATER ..................................................................................................................................................................... 61
4.2.1 OUTCOME OF WATER QUALITY TESTS ...................................................................... 61
4.2.2 NUMBER OF BREAKS IN RETICULATION SYSTEMS per 100 kms .................. 61
4.2.3 AVERAGE NUMBER OF DAYS OF WATER RESTRICTIONS .............................. 61
4.2 WATER continued .............................................................................................................................................. 64
4.2.4 UNIT COST PER KILOLITRE...................................................................................................... 64
4.2.5 AVERAGE WATER CONSUMPTION PER CONNECTION ................................. 64
4.2.6 WATER SYSTEM LOSS ................................................................................................................. 64
4.3 SEWERAGE AND DRAINAGE .................................................................................................................. 67
4.3.1 NUMBER OF NOTIFIABLE INCIDENTS (SEWERAGE) ............................................ 67
4.3.2 AVERAGE COST PER SEWERAGE CONNECTION ................................................. 67
4.4 WASTE MANAGEMENT ............................................................................................................................... 70
4.4.1 AVERAGE COST OF WASTE MANAGEMENT PER PROPERTY ...................... 70
4.4.2 AVERAGE COST OF WASTE MANAGEMENT PER CAPITA .............................. 70
5 COMMUNITY SERVICES AND DEVELOPMENT 73 5.1 SOCIAL AND COMMUNITY SERVICES .............................................................................................. 73
5.2 RECREATION AND CULTURE FACILITIES ....................................................................................... 73
5.1.1 SOCIAL AND COMMUNITY SERVICES EXPENDITURE PER CAPITA ......... 73
5.2.1 RECREATIONAL AND CULTURAL FACILITIES EXPENDITURE PER
CAPITA .................................................................................................................................................. 73
APPENDIX 1 76
APPENDIX 2 91
APPENDIX 3 Classification concordance 93
APPENDIX 4 Customer Satisfaction Survey 95 Local Government Association of Tasmania October 2006 ..................................................................... 95
APPENDIX 5 Data abnormalities 98

- 1 -
PREFACE
The Key Performance Indicator (KPI) Committee is pleased to present the ninth KPI report
measuring council performance in Tasmania. This report presents data from the 2007-08 financial year and provides five-year comparisons over the 2003-04 to 2007-08 financial years.
The presentation of five years of data enables us to look at performance trends within Tasmanian
councils. In addition, this report continues to provide opportunities to share knowledge about local government performance in Tasmania. It also represents the continued and unique
collaborative effort across the three spheres of government in Tasmania.
Since the first report for the 1999-2000 financial year, data collection processes have been
refined in an attempt to minimise the reporting burden on councils wherever possible. The
committee intends to continue this practice.
The KPI Committee has continued to minimise changes to the KPIs since they were first
developed and there are no changes this year. As was the case last year, councils were provided
with their KPIs for validation and review and, as a result, some councils amended data supplied. As in previous years, the report does not contain measures of customer satisfaction with services.
The Local Government Association of Tasmania (LGAT) commissioned its third customer
satisfaction survey in October 2006. As the most recent source of customer satisfaction data, a summary of the results of this survey is presented in Appendix 4.
This report includes some graphical representations of indicator trends for the period 2003-04 to 2007-08. A number of trends are apparent from the data and some of these trends are outlined
below:
Revenue
In terms of the sources of total council revenue, the data continues to show that city councils are raising a greater proportion of their revenue from rates relative to smaller councils, and that
smaller councils are more dependent on grants. This has been the situation for all nine years of
the KPI report. For example, during 2007-08 Launceston City Council raised 65.8% of its total
revenue from rates compared with Flinders Council which raised only 26.9% of its total revenue.
Rates There has been continued strong growth in the general rate per capita for the small council
group with a 48% increase from 2003-04 to 2007-08. The same period saw an increase of 22%
for the medium council group and the city councils. Hobart City Council at $787 had the highest
general rate per capita of the cities group, Burnie City Council at $660 was the highest of the
medium councils and Tasman Council at $1181 was the highest of the small council group.
Over the previous eight years, there was a consistent reduction in the level of rates outstanding
at the end of the financial year, indicating that councils were working hard to reduce the level of
rates outstanding. For 2007-08 this indicator plateaued, although the West Coast, Sorell and Brighton Councils continued to have significant reductions in the level of rates outstanding. The
Flinders and Southern Midlands Councils continue to have the highest level of rates outstanding
of all councils. Derwent Valley Council has the highest level of the medium councils and
Clarence City Council the highest level of the cities group.
- 2 -
Cost of debt ratio There has been a slight decline in the cost of debt ratio for the cities and small council groups,
with the medium council group unchanged from last year. Burnie City Council with 3% had the
highest cost of debt ratio, with Clarence City and Glenorchy City Councils having the highest for the cities group at 2.2%, and George Town Council the highest of the small council group at
1.6%.
Electronic service delivery
There continues to be a steady increase, particularly in the smaller and medium council groups, in
the level of electronic service delivery as councils promote, and communities adopt, the newer
technologies. Circular Head Council at 100% had the highest level of electronic service delivery.
In the medium group, Brighton Council with 74.5% had the highest level, and in the cities group
Hobart City Council had the highest level with 69.2%.
Planning approvals The cities group continues to have most days required to obtain approvals for permitted-use
planning applications, with Launceston City Council the highest at 32 days. Meander Valley and
West Tamar Councils rank the highest in the medium group with 26 days, and George Town
Council ranks the highest in the small council group with 31 days. King Island and Derwent
Valley Councils had the shortest approval period of seven days.
In the number of days taken to obtain building approvals Launceston City and Sorell Councils
took 39 days. At the other end of the scale King Island Council took two days, and West Tamar
and Clarence Councils took three days.
Waste management costs
The average cost of waste management per property increased by approximately 27% and the
average cost per sewerage connection increased by approximately 26% from 2003-04 to 2007-
08. Hobart City Council at $250 per property had the highest cost of the city group for waste
management per property. Devonport City Council at $272 per property had the highest of the
medium group, and Glamorgan-Spring Bay Council at $294 per property had the highest of the
small council group.
Road expenditure
The expenditure per kilometre of sealed road has increased by 33% for the state average, with
the small council group increasing by 37% and the medium council group by 41%. Over this
period the expenditure for the cities group increased by 8%.
As in recent reports, the KPI Committee includes appendices containing councils’ financial information, based on international standards used by the ABS to prepare and publish
Government Finance Statistics, and other statistics to provide contextual information on Tasmanian councils.
With the detailed time series data in the KPI report enabling long-term statistical comparisons,
the committee continues to receive positive feedback from councils using the data for budgeting
and planning, researchers from academic institutions, private companies, and from State
Government bodies.
With the change in arrangements for water and sewerage, the KPI report for 2008-09 will be the
last for water and sewerage KPIs by municipal area.

- 3 -
The KPI report is published and distributed by the Department of Premier and Cabinet’s Local
Government Division on behalf of the KPI Committee. The Local Government Division provides
executive and administrative support, and gives the KPI project an independence and objectivity that is vital in maintaining broad community acceptance and the support of all Tasmanian
councils. The KPI Committee appreciates the ongoing financial support of the State Government
and the cooperation of the State’s 29 councils.
David Sales
Chair
Key Performance Indicator Committee

- 4 -

5
1. INTRODUCTION
1.1 Background to the Key Performance Indicator Framework
The KPI Project was developed through a partnership between the Local Government Division of
the Department of Premier and Cabinet, the Local Government Association of Tasmania (LGAT) and Local Government Managers Australia (LGMA). This partnership built on performance
indicator systems in use by other jurisdictions to develop the KPI framework.
Following the development of the KPI framework, the KPI Committee was established to provide guidance to the Local Government Division which is responsible for the ongoing management of
the framework. The project continues to attract strong support from local government in
Tasmania. Although participation in the project has been on a voluntary basis, all 29 councils have
participated over the nine financial years in which it has operated.
Over this nine-year period, the KPI project has provided councils with a range of indicators to
measure their organisational performance. This enables councils to benchmark their operations
and, through the time-series data, to monitor trends over time. Prior to this, there was no statewide framework for measuring and comparing council performance.
In summary, the information in the report aims to:
enhance performance measurement by councils
enable benchmarking and identification of best practice
establish performance trends over time
improve accountability to the community.
1.2 Accountability and Leading Practice
In recent years, government accountability to the community has become increasingly important.
Communities want to know more about, and have an increased involvement in, the operation of
their councils. This means that in recent years, councils have become increasingly open and transparent.
Value for money is high on the community agenda, as is the ability of councillors to assess
priorities. The development of and reporting against performance indicators provides councils
and councillors with a tool to discuss performance with the community. In addition, the cooperation underpinning this activity contributes towards Tasmania Together Goal 8: Open and
accountable government that listens and plans for a shared future.

6
1.4 What is Performance Measurement?
Key performance indicators (KPIs) are generic measures that focus on the achievement of
outcomes most critical to the current and future success of organisations wishing to achieve continuous improvement. KPIs do this by monitoring the efficiency and effectiveness of service
delivery. KPIs can provide qualitative and/or quantitative information, which is used to assist in
determining how successful a council is in achieving its objectives.
Performance measurement is not about ranking the performance of councils. Rather, it is about
providing information to assist councils in improving their operations over time.
The following questions should be asked when analysing performance information:
What does this information tell us about what we are doing well?
What does this information tell us about where we need to improve?
Which councils appear to have “leading practices”?
How are these councils achieving success in these areas?
While the community may want to examine and analyse previous performances, the main value is in providing information to help councils plan for the future. This report gives a focus on where
councils currently stand, some directions for the future and how these goals might be achieved.
1.5 Identification of Key Result Areas
Councils are responsible for policy development and resource and service delivery in a range of
areas. The following are the key result areas for measuring the performance of councils in
Tasmania:
Governance
Management and Finance
Regulation
Infrastructure and Utilities
Community Services and Development.
Councils report against a range of measures in these areas.
From the framework of measures, 49 council performance indicators have been selected for
reporting purposes. These indicators are summarised in Section 3 – How to Use This Report.
(See page 9)

7
2. PERFORMANCE MEASUREMENT SYSTEM
2.1 The KPI Committee
The KPI Committee was established in 2001 to oversee the introduction of the performance
measurement system. Its role is to serve as the formal body reviewing the performance management system from year to year. This includes reviews of timeframes, expectations of
councils, data and indicator definitional issues, and data management matters.
The committee for this report comprises:
David Sales Chief Executive Officer, Southern Waste Strategy Authority – Chair
Paul West General Manager, Kingborough Council
Frank Barta Corporate Treasurer, Clarence City Council
Liz Gillam Senior Policy Officer, Local Government Association of Tasmania
Rodney Malcomson Secretary to the State Grants Commission, Department of Treasury and
Finance
Alistair Scott Deputy Director, Local Government Division, Department of Premier
and Cabinet.
Executive support is provided by:
Pete Morrow Senior Policy Analyst, Local Government Division, Department of
Premier and Cabinet.
For the 2007-08 report, data validation and technical support was provided by Mr John Gibson,
and specialist statistical advice was provided by the ABS.
2.2 Defining Key Performance Indicators
The KPIs are designed to assist councils identify better practices and to encourage them to look at
the operation of other councils.
It is very difficult to precisely measure the performance of a council. The KPIs in this report are
therefore only indicators designed to draw attention to performance, and highlight those councils who appear to be setting industry benchmarks. There may be special circumstances or unusual
factors that influence the KPI outcomes for one or more councils. These influencing factors are
included for each KPI.
The KPIs reported by the KPI Committee are:
directly related to performance outcomes
clearly defined in respect of purpose and use
understandable
cost-effective to collect.
8
2.3 Performance Measurement for Tasmanian Councils
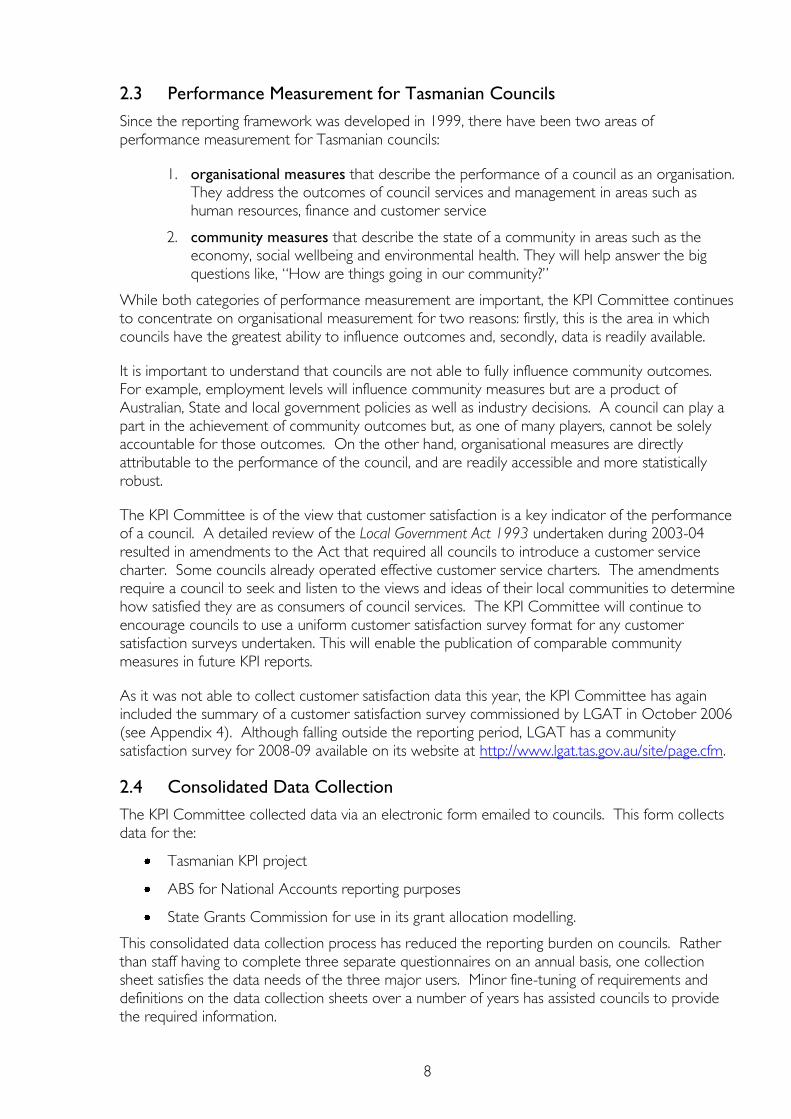
Since the reporting framework was developed in 1999, there have been two areas of
performance measurement for Tasmanian councils:
1. organisational measures that describe the performance of a council as an organisation. They address the outcomes of council services and management in areas such as human resources, finance and customer service
2. community measures that describe the state of a community in areas such as the economy, social wellbeing and environmental health. They will help answer the big
questions like, “How are things going in our community?”
While both categories of performance measurement are important, the KPI Committee continues
to concentrate on organisational measurement for two reasons: firstly, this is the area in which
councils have the greatest ability to influence outcomes and, secondly, data is readily available.
It is important to understand that councils are not able to fully influence community outcomes. For example, employment levels will influence community measures but are a product of
Australian, State and local government policies as well as industry decisions. A council can play a
part in the achievement of community outcomes but, as one of many players, cannot be solely accountable for those outcomes. On the other hand, organisational measures are directly
attributable to the performance of the council, and are readily accessible and more statistically
robust.
The KPI Committee is of the view that customer satisfaction is a key indicator of the performance of a council. A detailed review of the Local Government Act 1993 undertaken during 2003-04
resulted in amendments to the Act that required all councils to introduce a customer service
charter. Some councils already operated effective customer service charters. The amendments
require a council to seek and listen to the views and ideas of their local communities to determine
how satisfied they are as consumers of council services. The KPI Committee will continue to
encourage councils to use a uniform customer satisfaction survey format for any customer
satisfaction surveys undertaken. This will enable the publication of comparable community
measures in future KPI reports.
As it was not able to collect customer satisfaction data this year, the KPI Committee has again
included the summary of a customer satisfaction survey commissioned by LGAT in October 2006
(see Appendix 4). Although falling outside the reporting period, LGAT has a community
satisfaction survey for 2008-09 available on its website at http://www.lgat.tas.gov.au/site/page.cfm.
2.4 Consolidated Data Collection
The KPI Committee collected data via an electronic form emailed to councils. This form collects
data for the:
Tasmanian KPI project
ABS for National Accounts reporting purposes
State Grants Commission for use in its grant allocation modelling.
This consolidated data collection process has reduced the reporting burden on councils. Rather
than staff having to complete three separate questionnaires on an annual basis, one collection sheet satisfies the data needs of the three major users. Minor fine-tuning of requirements and
definitions on the data collection sheets over a number of years has assisted councils to provide
the required information.
9
Feedback about the collection system continues to be positive. This demonstrates a unique
collaboration in Tasmania between the three spheres of government. Ongoing consultation and
cooperation will continue to improve the system further, minimising demands on councils, and
improving consistency in data for the purpose of analysis.
This was the fifth time that the custom-made database program assisted the committee to analyse
the data in a timely manner to prepare the tables and graphs. The improvement in the program
enabled the committee to send each council the background data (Appendix 1) and its own KPIs
for validation and reasonableness testing.
The ABS has requested jurisdictions move to adopt a national minimum dataset which will assist
inter-jurisdictional comparisons. There are also similar proposals being put forward in other
forums such as the Local Government and Planning Ministers’ Council. The Local Government Division is monitoring the proposed changes on behalf of the KPI Committee. No changes have
been agreed to at this time.

10
3. HOW TO USE THIS REPORT
3.1 Changes to some KPIs 2005-2006 onwards
The KPIs for the five financial years 2003-04 to 2007-08 are presented in this report. As in recent
years, the committee has included a number of graphs showing the movements in the KPIs over the five financial years. This allows trend analysis across various KPIs that are considered to be of
most use and interest to the readers of this report.
In the 2005-06 report, following a review of the KPIs carried out in consultation with all Tasmanian councils during 2005 and 2006, the KPI Committee made significant changes to the
following KPIs:
2.1.3 Debt Service Ratio became Cost of Debt Ratio
3.1.2 Number of Infringement Notices Issued per 1000 Population became Number of Times Food-Handling Premises are Inspected
3.2.2 Number of Building and Planning Applications Lodged was split to become:
3.2.2. Number of Building Applications Lodged
3.2.3. Number of Planning Applications Lodged.
The changes were made so that the KPIs would be more meaningful and would provide more
accurate measures of council services as originally intended.
These changed KPIs cannot be compared to the KPIs they replaced.
The KPI Committee made some fine-tuning adjustments to other KPIs in 2005-06. These KPIs are
annotated in the tables. For these indicators, care should be taken when comparing this year’s
figures to figures before 2005-06.
3.2 Presentation of the Data
The report is divided into the five key result areas:
1. Governance
2. Management and Finance
3. Regulation
4. Infrastructure and Utilities
5. Community Services and Development.
Within these categories the relevant indicators are presented. Table 1A summarises how the
indicators are arranged.

11
Table 1A – Categories of Indicators
Report Ref Key Result Area Indicator
1 Governance
Governance
1.1.1 Voter Turnout
2
Management &
Finance
Finance
2.1.1 Budget Achievement – Revenue
2.1.2 Budget Achievement – Expenditure
2.1.3 Cost of Debt Ratio
(Note: this measure has been substantially revised from 2005-06
and so the figures cannot be compared to previous figures of the
former Debt Service Ratio KPI)
2.1.4 Working Capital Ratio
2.1.5 Revenue Growth
2.1.6 Expenditure Growth
2.1.7 Sources of Revenue
2.1.8 Revenue per Capita
2.1.9 Total Rates per Capita
2.1.10 General Rate per Capita
2.1.11 Average Residential Rate
2.1.12 Rates Outstanding at Year End
2.1.13 Capital Expenditure/Depreciation Ratio
2.1.14 Outsourced Capital Expenditure
Customer Service No measures available as yet
Human Resource
Management
2.3.1 Average Cost per Employee
2.3.2 Average Cost of Training per Employee
2.3.3 Number of Employees per 1000 Population
2.3.4 Staff Turnover Rate
2.3.5 Average Sick Leave per Employee
2.3.6 Lost Time Due to Injury
Information Systems
Management
2.4.1 Electronic Service Delivery Receipts
2.4.2 Information Technology (IT) Expenses
2.4.3 IT Expenses per Terminal or per Personal Computer

12
Report Ref Key Result Area Indicator
3 Regulation
Community Health
and Safety
3.1.1 Community Health and Safety Expenses
(Note: two measures)
3.1.2 Number of Times Food-Handling Premises are Inspected
(Note: this measure has been substantially revised. The KPIs under
reference 3.1.2 before the 2005-06 report cannot be compared to
later figures)
Planning and
Development
3.2.1 Days to Obtain Approvals
(Note: three measures)
3.2.2 Number of Planning Applications Lodged
(Note: figures before 2005-06 cannot be compared with later
figures)
3.2.3 Number of Building Applications Lodged
(Note: figures before 2005-06 cannot be compared with later
figures)
4 Infrastructure and
Utilities
Roads, Footpaths
and Traffic
4.1.1 Ratio of Total Expenditure on Road and Footpaths to
Depreciation
4.1.2 State of the Roads and Footpaths Assets
4.1.3 Expenditure per Kilometre of Sealed Road
4.1.4 Expenditure per Kilometre of Unsealed Road
Water
4.2.1 Outcome of Water Quality Tests
4.2.2 Number of Breaks in Reticulation Systems per 100kms
4.2.3 Number of Days of Water Restrictions
4.2.4 Unit Cost per Kilolitre
4.2.5 Average Water Consumption per Connection
4.2.6 Water System Loss
Sewerage and
Drainage
4.3.1 Number of Notifiable Incidents (Sewerage)
4.3.2 Average Cost per Sewerage Connection
Waste Management
4.4.1 Average Cost of Waste Management per Property
4.4.2 Average Cost of Waste Management per Capita
13
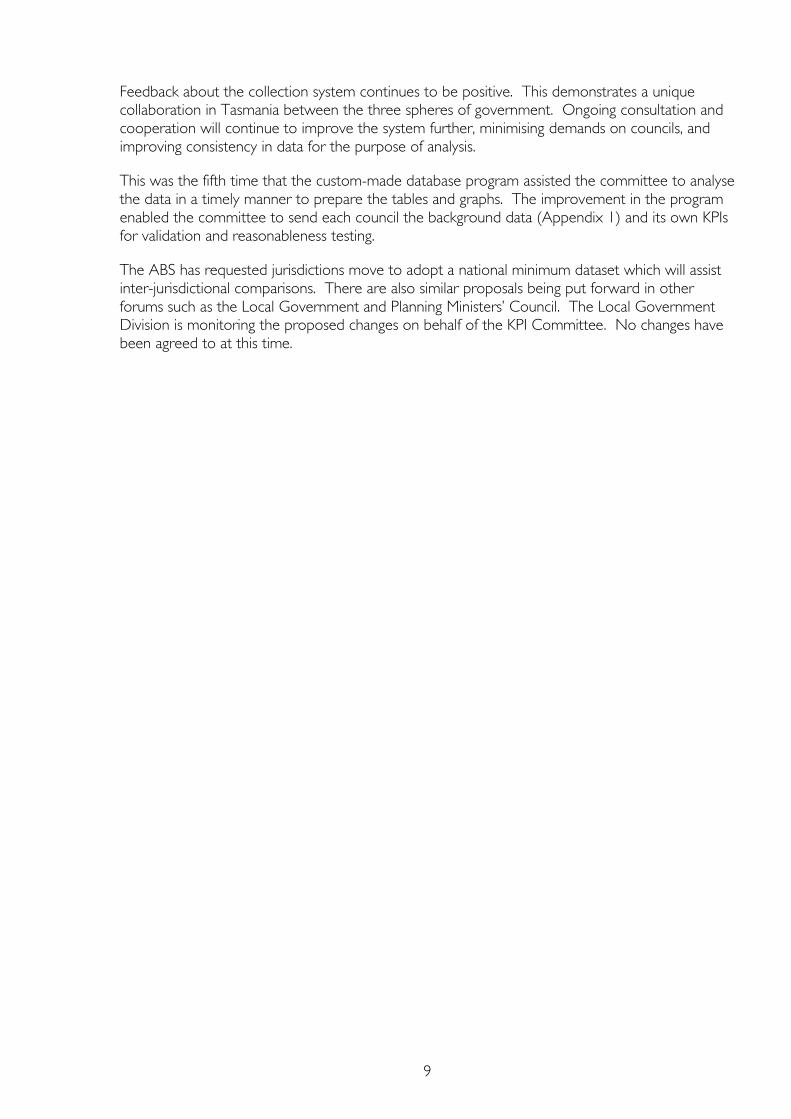
Report Ref Key Result Area Indicator
Community Services
and Development
Social and Community
Services
5.1.1 Social and Community Services Expenditure per Capita
Recreational & Cultural
Facilities
5.2.1 Recreational and Cultural Expenditure per Capita
Accompanying each set of related indicators is a brief explanation of what the indicator is
attempting to measure and a list of factors that may affect the outcome of that indicator.
The councils are arranged in the left-hand column according to the Australian Local Government
Classification (ALGC). Categories have been abridged, however, in order to make them more meaningful to Tasmania’s local government situation. Table 1B below illustrates how the councils
have been classified for the purpose of this publication.
Table 1B – Tasmanian Local Governments
(Classified according to the abridged ALGC)
Major Cities (Cities) Other Urban and Large Rural
(Medium)
Other (Smaller) Rural
(Small)
Clarence City Brighton Break O’Day
Glenorchy City Burnie City Central Highlands
Hobart City Central Coast Circular Head
Launceston City Derwent Valley Dorset
Devonport City Flinders
Huon Valley George Town
Kingborough Glamorgan-Spring Bay
Meander Valley Kentish
Northern Midlands King Island
Sorell Latrobe
Waratah-Wynyard Southern Midlands
West Tamar Tasman
West Coast

14
3.3 Analysis, Interpretation and Other Information
Caution should be used when comparing one council with another, even within the abridged
ALGC classifications. Differences in demography, geography and land use all influence cross-
council comparisons.
The committee believes that the KPIs can best be used for monitoring changes in performance of
a council over a statistically relevant period of time, and for identifying councils that may have
improved practices in their operations.
The data from which the KPIs are calculated can be found in Appendix 1. This is the data that has
been provided to the KPI Committee by councils, and has been independently validated against
audited financial statements (where possible) and other information available to the public.
Two appendices containing statistical data based on ABS Government Finance Statistics (GFS)
concepts were included in recent reports. These appendices are being reviewed and are not
included in this report.
Appendix 2 contains council area demographics to create a contextual picture of each council for
interpretation of the KPIs.
Appendix 3 provides a comparative link between ABS classifications and council functions.
Appendix 4 is the summary of the LGAT-commissioned customer satisfaction survey conducted
during October 2006.
Appendix 5 provides an explanation of why some of the data presented may appear to be
abnormal.
Note on comparisons between years
Data is presented for the 2007-08 financial year as well as for the previous four financial years. It
should be noted that some movements in figures between the years may potentially be the result
of the change in the collection process. Such cases should be infrequent, as maintaining
consistency has been a high priority for the KPI Committee in presenting this report.
Nevertheless, in order to have meaningful performance measures, it has been necessary to have
some KPIs better defined and the results clarified. Where this has been necessary, the KPI
columns have been marked with an asterisk (*). As discussed in Section 3.1, it was necessary to make significant changes to three KPIs in 2005-06. These are annotated in the following KPI
tables.
Averages
The averages of the council data presented in the report are not weighted averages. The
committee determined to retain the present method of calculating averages for the 2007-08 report. The importance of the timely production of this document resulted in the committee
having insufficient time to address the calculation of averages.
Notes on unavailable, not applicable or zero data
In the KPI tables, UA is used where a council was not able to provide the data (unavailable) and NA is used where the council does not provide that particular service (not applicable). A zero
(0) is included if the item is a nil amount.
15
For the 2004-05 financial year, the figures relating to the number of kilolitres of water used by
councils were not collected, as the committee had planned to use the data collected by the
Government Prices Oversight Commission (GPOC). On reviewing the GPOC data, the
committee decided not to report indicator 4.2.6 Water System Loss for 2004-05. Because many properties in Tasmania do not have water meters, the data presented in some water related KPIs
may not be robust.

16
KPI INFORMATION
KEY RESULT AREA
1 GOVERNANCE
1.1 GOVERNANCE
CATEGORY
DEFINITION This category covers the role of the elected representatives, dealings with the community and the leadership of local government.
OBJECTIVE Open, accountable government and high standards of behaviour.
INDICATOR 1.1.1 VOTER TURNOUT
INDICATOR
CALCULATION
Number of electors who voted in ordinary elections
Number of electors who are eligible to vote
INDICATOR
EXPLANATION
Voter Turnout: A measure of a council’s engagement with its community. It should be noted that elections for mayor and deputy mayor
usually occur in October in every second year. Councillors have a four-year term, with half the positions being contested every two years,
concurrently with the mayor and deputy mayor elections.
As local government elections are held every second year, this indicator will be quoted every second year, or as the elections are held.
INFLUENCING
FACTORS
timing of elections
number and quality of electoral candidates
number of voters with language and other difficulties
nature of current public issues
proportion of dwellings being rented
%

17
Cities Note
Clarence 52.1 52.1 * No election held
Glenorchy 55.8 52.8 # Election postponed
Hobart 50.4 54.2
Launceston 60.3 56.0
Group average 54.6 53.8
Medium Councils
Brighton 48.3 46.8
Burnie 64.5 60.4
Central Coast 59.2 58.1
Derwent Valley 57.0 57.4
Devonport 57.9 55.2
Huon Valley 65.9 65.9
Kingborough 52.2 54.3
Meander Valley 59.0 59.9
Northern Midlands 68.2 66.8
Sorell 59.4 57.4
Waratah-Wynyard 68.1 59.5
West Tamar 59.3 55.9
Group average 59.9 58.1
Small Councils
Break O'Day 73.7 71.7
Central Highlands 62.0 63.3
Circular Head 66.9 70.1
Dorset 70.3 68.5
Flinders 81.7 76.1
George Town 62.7 65.9
Glamorgan-Spring Bay 71.3 68.9
Kentish 62.0 65.5
King Island 78.9 72.0
Latrobe 57.6 58.8
Southern Midlands 64.9 63.5
Tasman 72.2 75.2
West Coast 66.8 66.3
Group average 68.5 68.1
State Average 63.0 62.0
2003-04 *
%
2006-07 #
%
Voter Turnout
2007-08
%
2004-05 #
%
2005-06
%

18
KEY RESULT AREA
2 MANAGEMENT AND FINANCE
2.1 FINANCE
CATEGORY
DEFINITION
This category covers corporate services provided to the organisation by council management. Sound management and adequate financial capacity
are essential to deliver services to meet current and future community needs.
OBJECTIVE Value for council services, an equitable revenue policy (rates and other charges), sufficient funds for asset replacement and refurbishment,
and good project management.
INDICATOR 2.1.1 BUDGET ACHIEVEMENT – REVENUE 2.1.2 BUDGET ACHIEVEMENT – EXPENSES
INDICATOR
CALCULATION
Actual revenue
Budgeted revenue
Actual expenses
Budgeted expenses
INDICATOR
EXPLANATION
Budget achievement reflects the accuracy of the budget control as compared to the operating results. It measures a council’s achievement in
meeting annual budgeted revenue targets and a council’s ability to contain costs within budgeted expenditure parameters. A council with
consistent major variations from the budgeted targets may have budgetary issues that need to be addressed.
INFLUENCING
FACTORS
quality of forecasting model
quality of reporting and control systems
unforeseen (not budgeted items)
major revenue/expenditure variations
changes in accounting policies or standards
profit/loss on asset disposals can vary actual revenue and expenses totals
% %

19
Cities
Clarence 107.4 112.7 112.7 113.3 120.2 111.2 103.4 114.2 112.9 113.8
Glenorchy 103.2 103.9 116.0 108.7 105.1 104.1 110.2 111.8 103.2 106.0
Hobart 104.3 106.1 111.2 113.4 108.9 104.4 102.1 103.5 103.7 105.6
Launceston 103.2 103.5 104.9 103.6 103.2 102.5 103.0 102.9 99.9 101.0
Group average 104.5 106.5 111.2 109.8 109.3 105.5 104.7 108.1 104.9 106.6
Medium Councils
Brighton 108.9 104.2 107.1 103.4 111.7 105.4 103.4 99.0 101.3 110.6
Burnie 100.4 108.0 102.5 102.7 97.2 98.4 125.6 109.7 100.1 103.2
Central Coast 102.7 103.1 101.7 99.4 101.6 97.9 102.5 102.3 102.0 106.7
Derwent Valley 111.5 143.4 114.6 103.4 107.4 110.4 138.8 135.5 123.4 128.0
Devonport 104.4 109.1 117.3 117.9 112.6 102.9 104.3 107.3 103.7 107.4
Huon Valley 102.5 97.9 119.3 116.6 131.2 100.3 93.8 115.1 97.0 122.8
Kingborough 115.6 128.3 122.2 133.7 145.5 102.9 99.6 102.0 109.3 107.7
Meander Valley 110.6 104.0 115.9 95.9 104.1 113.8 105.6 109.7 111.6 105.5
Northern Midlands 110.3 112.8 115.1 108.2 104.7 100.1 99.0 115.0 117.8 103.7
Sorell 109.5 103.5 106.1 114.8 119.1 108.1 102.4 98.7 106.7 104.9
Waratah-Wynyard 110.8 105.6 114.2 106.8 114.6 100.6 101.9 102.3 96.5 107.7
West Tamar 110.5 117.8 121.5 124.4 113.6 102.4 120.9 100.2 98.4 96.9
Group average 108.2 111.5 113.1 110.6 113.6 103.6 108.1 108.1 105.7 108.8
Small Councils
Break O'Day 95.7 83.7 105.4 98.2 103.7 102.8 95.6 96.8 94.1 102.1
Central Highlands 140.8 178.9 123.3 116.5 106.7 119.7 91.5 72.8 104.9 76.7
Circular Head 102.7 98.9 99.6 110.5 100.4 100.0 95.6 99.2 89.2 120.2
Dorset 102.7 109.0 103.8 120.3 111.2 111.2 110.9 96.8 85.6 111.6
Flinders 135.2 105.7 106.4 142.3 107.5 97.5 94.2 79.6 78.2 89.2
George Town 103.4 103.5 111.8 106.8 129.0 99.0 109.9 97.6 108.2 100.3
Glamorgan-Spring Bay 106.4 117.7 109.5 103.2 102.6 112.6 106.0 108.8 99.9 107.9
Kentish 114.7 129.3 116.8 99.8 118.2 104.8 111.5 113.8 104.6 120.0
King Island 104.4 106.4 107.3 106.7 115.9 96.0 98.0 99.5 109.0 102.2
Latrobe 106.9 112.7 121.8 125.3 112.4 96.8 105.6 100.6 106.7 100.1
Southern Midlands 108.4 109.1 112.4 127.6 122.9 89.0 95.2 100.4 105.6 96.3
Tasman 101.9 100.6 49.1 110.9 138.4 104.4 105.0 111.3 105.2 100.7
West Coast 106.0 108.6 135.5 91.6 94.7 112.4 113.5 106.6 84.1 84.3
Group average 110.0 112.6 107.9 112.3 112.6 103.6 102.5 98.7 98.1 100.9
State Average 108.5 111.3 110.5 111.2 112.6 103.9 105.1 103.9 102.2 104.9
Budget Achievement – Revenue Budget Achievement - Expenses
2003-04 2004-05 2005-06 2006-07 2007-082007-082005-06 2006-072003-04 2004-05
%%% % % % % % %%

20
2.1 FINANCE continued
CATEGORY
DEFINITION This category covers corporate services provided to the organisation by council management. Sound management and adequate financial capacity
are essential to deliver services to meet current and future community needs.
OBJECTIVE Value for council services, an equitable revenue policy (rates and other charges), sufficient funds for asset replacement and refurbishment,
good project management.
INDICATOR 2.1.3 COST OF DEBT RATIO
Note: Revised Indicator 2005-2006 2.1.4 WORKING CAPITAL RATIO
INDICATOR
CALCULATION
Interest payments
Operating revenue
Current assets
Current liabilities
INDICATOR
EXPLANATION
Cost of Debt Ratio: A measure of the capacity of a
council to service debt – usually incurred to fund
infrastructure and other major capital works. This
indicates the percentage of council operating revenue
required to service debt.
Working Capital Ratio: A measure of the liquidity or ’cash‘ position of a
council. It is a measure of a council’s ability to meet its financial obligations
as they fall due. If current liabilities exceed current assets (a ratio of <100%)
then a council would need to improve its liquidity position. A figure well in
excess of 100% may mean that a council is saving for a specific purpose.
INFLUENCING
FACTORS
rate of growth in area
policy on debt financing
level of interest rates
loan terms
policy on funding capital investment
adjusted revenue for disposals
planning and budgetary control
timing of cash flows
credit policies and collection of debts
local economic climate
debt reduction policy
moneys held for future works
% %

21
Cities
Clarence 5.6 5.2 2.8 2.4 2.2 316.9 341.7 464.6 509.9 266.0
Glenorchy 9.0 7.7 2.5 2.4 2.2 94.0 89.7 87.6 103.8 122.8
Hobart 3.0 3.1 0.8 0.9 1.0 201.2 229.7 249.4 276.0 253.4
Launceston 2.6 2.6 0.6 0.7 0.8 231.7 206.7 305.9 262.5 150.2
Group average 5.0 4.6 1.7 1.6 1.5 211.0 217.0 276.9 288.1 198.1
Medium Councils
Brighton 7.5 5.9 2.0 1.7 1.5 122.2 120.3 139.3 184.0 161.9
Burnie 5.4 3.5 1.0 2.1 3.0 298.8 145.5 106.7 174.0 306.8
Central Coast 3.7 3.0 0.3 0.1 0.1 377.1 299.5 255.3 249.2 217.2
Derwent Valley 6.3 4.8 1.4 1.4 1.2 68.2 151.8 165.2 126.3 123.3
Devonport 12.0 8.2 1.8 1.6 1.6 113.2 160.8 151.5 163.8 181.6
Huon Valley 4.1 4.0 0.3 0.2 0.2 377.7 372.7 412.9 563.4 446.6
Kingborough 0.9 0.4 0.2 0.1 0.1 313.2 276.9 299.8 305.4 409.9
Meander Valley 0.0 0.0 0.0 0.0 0.0 630.5 694.7 669.8 706.5 752.3
Northern Midlands 0.0 0.0 0.0 0.0 0.0 471.0 553.8 449.8 298.1 347.2
Sorell 7.8 4.1 1.4 1.8 1.4 221.6 182.0 185.6 152.3 285.2
Waratah-Wynyard 6.1 6.3 1.4 1.2 0.9 241.0 266.3 237.6 201.0 229.7
West Tamar 6.5 5.4 0.7 0.6 0.6 285.8 329.2 348.2 401.2 473.5
Group average 5.0 3.8 0.9 0.9 0.9 293.4 296.1 285.1 293.8 327.9
Small Councils
Break O'Day 3.7 2.9 1.1 1.3 1.1 406.4 463.8 663.3 300.5 313.8
Central Highlands 0.2 0.2 0.0 0.0 0.0 517.3 598.9 815.9 721.8 683.7
Circular Head 4.3 3.7 0.5 0.4 0.4 295.9 591.0 539.6 501.4 310.4
Dorset 2.1 2.6 0.7 0.8 0.8 412.9 430.7 520.2 708.8 660.6
Flinders 0.0 0.0 0.0 0.0 0.0 1,798.3 2,851.8 2,380.3 2,670.2 2,142.0
George Town 16.5 10.5 1.4 1.2 1.6 90.1 139.9 222.1 231.3 254.2
Glamorgan-Spring Bay 6.5 15.5 2.0 1.7 1.4 44.2 80.9 49.9 104.8 97.8
Kentish 2.6 2.1 0.2 0.6 1.5 416.8 386.1 334.4 518.4 429.6
King Island 2.2 1.7 0.9 0.8 1.0 299.8 295.3 308.4 332.3 393.2
Latrobe 4.6 4.7 1.1 0.9 0.6 157.9 136.5 127.4 89.4 123.7
Southern Midlands 4.5 3.6 1.2 0.9 0.9 429.3 388.2 444.2 541.2 590.0
Tasman 2.9 4.0 3.3 1.4 1.2 66.2 63.6 68.8 83.6 129.1
West Coast 7.5 4.8 1.3 1.3 1.1 82.0 100.3 125.2 134.7 168.8
Group average 4.4 4.3 1.1 0.9 0.9 385.9 502.1 507.7 533.7 484.4
State Average 4.8 4.2 1.1 1.0 1.0 323.5 377.5 383.8 400.6 380.2
* Indicator changed 2005-2006 (Loan repayment removed).
Figures for 2001-2002 to 2004-2005 are not comparable with 2005-2006.
Cost of Debt Ratio * Working Capital Ratio
2003-04 2004-05 2005-06 2007-08
%
2004-05
%
2003-04
%% %%% %
2007-08 2006-072005-06 2006-07
% %

22
2003-04 2004-05 2005-06 2006-07 2007-08
Cities 211.0 217.0 276.9 288.1 198.1
Medium Councils 293.4 296.1 285.1 293.8 327.9
Small Councils 385.9 502.1 507.7 533.7 484.4
State Average 323.5 377.5 383.8 400.6 380.2
100.0
150.0
200.0
250.0
300.0
350.0
400.0
450.0
500.0
550.0
600.0
Percen
tag
e
Financial Year
Working Capital Ratio

23
2.1 FINANCE continued
CATEGORY
DEFINITION
This category covers corporate services provided to the organisation by council management. Sound management and adequate financial capacity
are essential to deliver services to meet current and future community needs.
OBJECTIVE Value for council services, an equitable revenue policy (rates and other charges), sufficient funds for asset replacement and refurbishment, and
good project management.
INDICATOR 2.1.5 REVENUE GROWTH 2.1.6 EXPENDITURE GROWTH
INDICATOR
CALCULATION
This year’s operating revenue minus last year’s operating revenue
Last year’s operating revenue
This year’s operating expenditure minus last year’s operating expenditure
Last year’s operating expenditure
INDICATOR
EXPLANATION Revenue Growth: Measures the change in the level of
financial resources available for council activities.
Expenditure Growth: Measures the change in the level of financial
expenditure resulting from council activities.
INFLUENCING
FACTORS
rate of growth or decline in area
timing of maintenance programs
general State/national/international economic activity
abnormal items of revenue
special increase in rates or other operating revenue
availability of grants funding
changes in service levels
adjusted revenue for disposals
rate of growth or decline in area
timing of maintenance programs
general State/national/international economic activity
abnormal items of expenditure
specific projects
changes in service levels
adjusted expenditure for disposals
% %
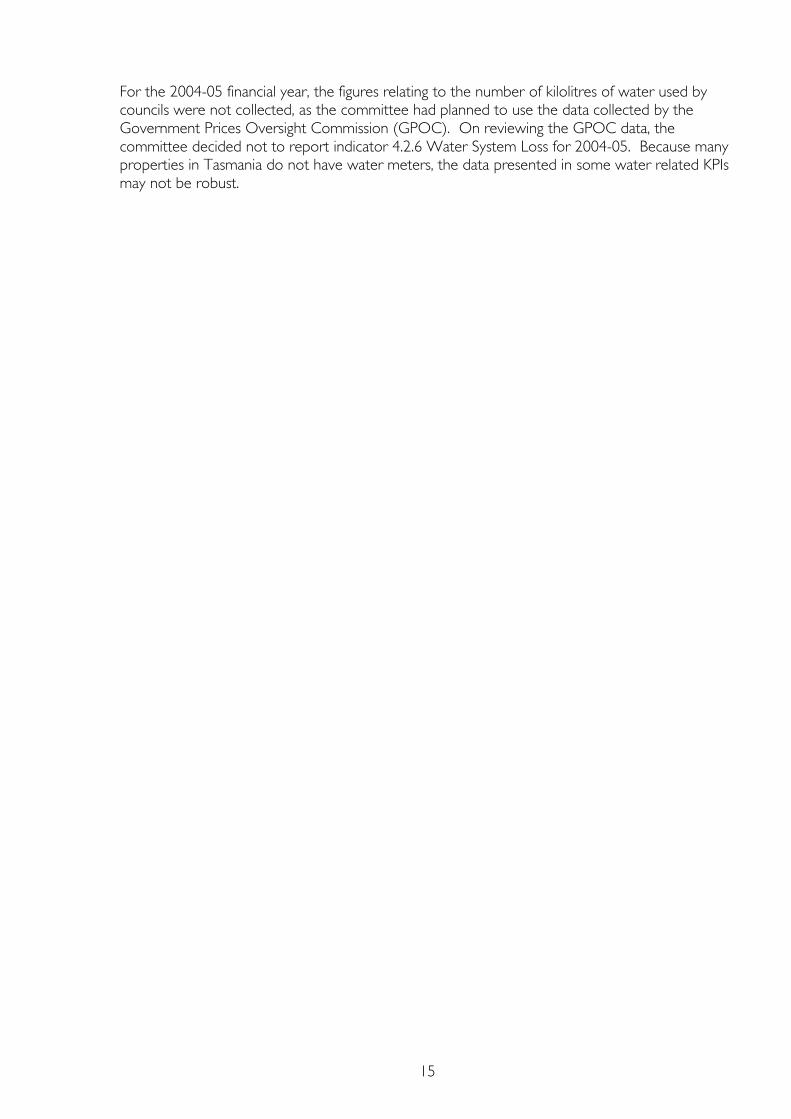
24
Cities
Clarence -18.9 17.2 3.0 6.6 18.5 6.2 2.5 13.9 4.0 10.6
Glenorchy 6.6 6.9 13.4 1.4 3.5 -1.1 10.9 5.2 6.2 7.6
Hobart 3.4 10.5 9.7 6.7 1.3 2.9 4.4 4.8 4.3 4.9
Launceston 7.7 14.8 8.1 -8.4 4.3 4.9 6.2 5.8 3.6 2.4
Group average -0.3 12.3 8.6 1.6 6.9 3.2 6.0 7.4 4.5 6.3
Medium Councils
Brighton 15.4 36.7 -15.3 6.6 -2.0 5.5 1.4 1.0 3.2 3.0
Burnie 6.7 18.1 4.5 0.7 4.5 1.1 37.5 -12.5 2.1 3.3
Central Coast 4.7 2.3 8.1 2.8 13.7 0.7 9.5 6.8 6.8 11.7
Derwent Valley 9.8 47.4 -16.2 -4.9 7.8 6.1 17.1 4.1 -4.1 6.9
Devonport 8.0 10.6 13.8 5.4 0.4 5.4 3.6 5.6 4.6 7.4
Huon Valley 5.5 8.5 7.1 6.9 12.0 5.7 2.7 10.8 0.5 27.5
Kingborough 13.6 12.9 2.6 13.9 19.4 8.2 6.8 7.3 11.8 10.1
Meander Valley 7.8 -3.5 19.1 -5.7 12.5 10.8 -6.6 8.5 11.4 2.6
Northern Midlands 9.8 -2.3 14.2 -7.9 8.2 -0.3 5.8 18.9 6.8 -0.1
Sorell 5.9 -0.5 20.7 9.4 11.0 8.6 3.7 5.3 11.4 2.1
Waratah-Wynyard 9.3 0.4 10.8 -8.2 10.1 5.4 -1.6 9.3 1.6 16.6
West Tamar 9.3 14.9 9.9 15.5 -0.6 7.9 23.2 -10.4 9.1 7.2
Group average 8.8 12.1 6.6 2.9 8.1 5.4 8.6 4.6 5.4 8.2
Small Councils
Break O'Day -8.7 28.9 38.3 -17.1 17.9 11.2 3.0 11.3 8.7 14.7
Central Highlands 8.7 36.7 -22.7 -0.6 -2.3 16.1 -13.6 13.9 -11.8 2.1
Circular Head -4.0 -8.0 14.5 7.7 -3.1 -6.4 0.9 4.6 8.2 44.0
Dorset -4.1 3.3 18.7 29.1 -13.1 4.0 2.8 -2.1 4.9 18.7
Flinders -21.5 -3.0 6.4 61.2 -31.5 -31.6 13.6 0.7 2.7 7.0
George Town 7.9 0.8 22.2 -4.7 27.4 3.3 12.4 2.2 12.5 -3.2
Glamorgan-Spring Bay -1.8 19.4 11.1 9.2 7.7 9.7 3.0 21.9 2.7 11.1
Kentish 8.5 21.0 13.2 -1.8 26.1 12.1 7.5 28.8 -3.4 25.7
King Island -7.1 7.7 9.1 2.1 28.2 -25.8 2.2 11.2 6.9 4.3
Latrobe 4.6 18.4 21.5 8.3 1.2 10.1 11.9 4.2 12.3 1.3
Southern Midlands 27.7 -2.0 10.2 26.8 -6.6 -5.6 3.8 6.1 9.2 5.7
Tasman 1.2 4.7 -50.1 160.1 28.2 19.0 17.3 12.0 5.0 1.2
West Coast -19.4 26.9 13.3 -13.1 7.9 10.4 8.4 2.0 1.5 4.6
Group average -0.6 11.9 8.1 20.6 6.8 2.0 5.6 9.0 4.6 10.5
State Average 3.3 12.1 7.6 10.6 7.3 3.6 6.9 6.9 4.9 9.0
2006-07
%
2007-08
%% % % %
Expenditure Growth
% %
2003-04
%
2004-05
%
2005-06
Revenue Growth
2003-04 2004-05 2005-06 2006-07 2007-08

25
2.1 FINANCE continued
CATEGORY
DEFINITION
This category covers corporate services provided to the organisation by council management. Sound management and adequate financial capacity are
essential to deliver services to meet current and future community needs.
OBJECTIVE Value for council services, an equitable revenue policy (rates and other charges), sufficient funds for asset replacement and refurbishment, good
project management.
INDICATOR
2.1.7 SOURCES OF REVENUE
(Rates, grants contributions/acquisitions and user charges) Note: three separate measures (as tabulated on next page).
INDICATOR
CALCULATION
Source of revenue
Total operating revenue
INDICATOR
EXPLANATION
Sources of Revenue: This is a measure of a council’s dependence on various revenue sources: rates and annual charges, grants and
contributions, user charges, interest and other sources. For this report, interest and other income have not been tabulated.
The higher the percentage of revenue received from Government grants the more dependent is the council upon other levels of government
rather than its own resources.
INFLUENCING
FACTORS
distribution and level of Commonwealth and State Government grant
funding
socio-economic profile of area, i.e. capacity to pay
user-pay policies
private sector contributions
assets acquired without cost
profit/loss on assets disposals
Note: The indicators are inter-dependent; an increase in one component will cause a relative decrease in the other. The percentages may not equal 100 because of adjusted total revenue.
%

26
Cities
Clarence 74.6 68.3 69.9 70.6 63.2 12.2 16.0 15.8 14.2 22.3 6.2 5.9 6.5 7.3 8.2
Glenorchy 66.5 65.6 59.6 62.8 65.6 14.0 15.7 20.2 15.6 13.9 17.6 16.9 17.7 18.6 18.6
Hobart 67.0 65.5 62.0 60.6 62.8 5.6 6.5 6.7 5.7 5.5 21.2 21.3 20.3 19.9 19.8
Launceston 63.2 59.5 57.8 64.8 65.8 13.9 19.4 19.7 9.6 8.5 16.2 14.8 14.0 17.0 18.1
Group average 67.8 64.7 62.3 64.7 64.3 11.4 14.4 15.6 11.3 12.5 15.3 14.7 14.6 15.7 16.2
Medium Councils
Brighton 50.2 39.5 50.2 50.3 55.0 27.8 39.8 29.8 28.5 21.0 19.2 18.5 17.3 17.8 20.1
Burnie 63.2 57.0 54.6 57.8 60.0 11.5 11.7 20.3 12.4 11.5 20.9 22.8 23.7 23.3 30.9
Central Coast 56.4 57.5 56.1 57.3 53.4 23.7 20.3 22.7 21.8 26.2 16.1 18.5 17.3 16.5 15.9
Derwent Valley 56.5 45.5 56.8 62.5 60.8 30.6 43.0 31.1 23.8 25.4 10.7 7.9 8.9 9.4 10.4
Devonport 67.7 64.9 59.0 58.4 61.2 10.7 14.3 21.3 23.1 17.9 20.5 20.9 16.6 17.5 18.3
Huon Valley 46.7 48.9 47.9 47.1 44.6 30.3 29.8 27.5 29.0 29.8 9.4 8.9 9.7 10.7 11.8
Kingborough 59.4 55.5 58.6 56.5 51.7 27.8 31.6 27.1 29.6 36.2 10.0 9.0 10.1 9.7 8.1
Meander Valley 53.8 59.1 52.2 58.5 54.0 30.8 23.0 34.3 23.9 33.6 11.3 10.6 9.8 11.5 10.4
Northern Midlands 43.9 47.6 43.2 48.9 51.9 41.2 36.9 39.8 31.3 32.8 14.3 16.5 18.1 18.7 18.3
Sorell 57.6 62.2 55.9 55.8 55.4 24.9 20.8 27.9 18.8 21.5 13.9 13.9 11.1 11.9 10.6
Waratah-Wynyard 52.4 55.5 52.2 58.6 55.6 25.5 28.1 29.8 23.4 30.0 17.7 16.9 15.4 16.1 14.5
West Tamar 63.0 59.2 56.5 53.7 57.5 18.3 23.6 26.9 26.1 32.1 14.1 13.3 12.8 14.5 15.0
Group average 55.9 54.4 53.6 55.4 55.1 25.3 26.9 28.2 24.3 26.5 14.8 14.8 14.2 14.8 15.4
Small Councils
Break O'Day 53.9 52.5 43.4 56.7 53.3 34.6 25.8 38.2 25.1 28.2 14.4 12.3 8.3 11.1 9.6
Central Highlands 28.0 25.1 33.6 40.4 43.4 34.1 22.9 39.1 32.8 37.1 3.0 2.2 4.0 4.9 4.8
Circular Head 45.5 54.4 49.4 47.9 51.8 23.2 23.1 23.2 23.5 18.4 21.2 22.5 22.8 22.9 20.9
Dorset 43.8 50.1 49.1 40.4 49.6 41.0 35.2 40.9 46.6 29.7 15.0 12.1 10.3 9.5 12.9
Flinders 19.8 23.2 22.9 17.7 26.9 53.4 40.5 45.2 63.2 41.2 7.1 9.2 24.3 12.8 18.4
George Town 55.9 59.9 51.6 58.0 49.0 25.4 17.0 28.0 24.2 29.9 15.9 20.1 14.8 16.3 13.9
Glamorgan-Spring Bay 60.9 62.2 59.1 62.2 59.4 17.5 27.6 19.9 19.3 20.7 8.3 6.8 20.9 17.8 19.0
Kentish 51.7 52.3 49.8 54.3 48.2 34.5 34.3 37.6 31.4 29.3 5.6 4.4 7.2 7.8 6.3
King Island 38.8 39.9 37.5 37.3 30.2 34.6 32.4 36.1 34.5 40.8 20.1 18.8 20.6 23.5 18.3
Latrobe 66.8 61.3 53.1 52.4 55.3 15.3 21.2 29.8 25.9 22.6 13.8 11.1 8.9 11.4 9.9
Southern Midlands 37.8 41.8 39.9 33.4 39.3 51.4 45.4 48.3 56.3 42.9 8.6 10.3 9.8 8.3 10.7
Tasman 27.7 30.6 70.7 37.0 30.0 56.0 50.3 116.5 47.4 55.5 8.7 8.2 30.2 11.0 9.6
West Coast 63.8 54.3 49.7 58.7 58.1 24.7 19.5 19.5 22.8 19.1 11.1 15.7 11.6 15.0 13.7
Group average 45.7 46.7 46.9 45.9 45.7 34.3 30.4 40.2 34.9 32.0 11.8 11.8 14.9 13.2 12.9
State Average 53.0 52.4 51.8 52.4 52.2 27.4 26.8 31.8 27.2 27.0 13.5 13.5 14.6 14.2 14.4
2006-07
%
2007-08
%
2004-05
%
2005-06
%
SOURCES OF TOTAL REVENUE
Rates and Annual Charges
%%
2007-08
%
2006-07
%
2007-082004-052003-04
%
User Fees and Charges
%
Total Grants and Contributions
2003-04
%
2004-05
%
2005-06
%
2006-07 2005-06
%
2003-04
%

27
2003-04 2004-05 2005-06 2006-07 2007-08
Cities 67.8 64.7 62.3 64.7 64.3
Medium Councils 55.9 54.4 53.6 55.4 55.1
Small Councils 45.7 46.7 46.9 45.9 45.7
State Average 53.0 52.4 51.8 52.4 52.2
35.0
40.0
45.0
50.0
55.0
60.0
65.0
70.0
Percen
tag
e
Financial Year
Rates and Annual Charges
1999 - 00 2000 - 01 2001 - 02 2002 - 03 2007-08
Cities 15.3 14.7 14.6 15.7 16.2
Medium Councils 14.8 14.8 14.2 14.8 15.4
Small Councils 11.8 11.8 14.9 13.2 12.9
State Average 13.5 13.5 14.6 14.2 14.4
10.0
11.0
12.0
13.0
14.0
15.0
16.0
17.0
Percen
tag
e
Financial Year
User Fees and Charges
2003-04 2004-05 2005-06 2006-07 2007-08
Cities 11.4 14.4 15.6 11.3 12.5
Medium Councils 25.3 26.9 28.2 24.3 26.5
Small Councils 34.3 30.4 40.2 34.9 32.0
State Average 27.4 26.8 31.8 27.2 27.0
0.0
5.0
10.0
15.0
20.0
25.0
30.0
35.0
40.0
45.0
Percen
tag
e
Financial Year
Total Grants and Contributions

28
2.1 FINANCE continued
CATEGORY
DEFINITION
This category covers corporate services provided to the organisation by council management. Sound management and adequate financial capacity
are essential to deliver services to meet current and future community needs.
OBJECTIVE Value for council services, an equitable revenue policy (rates and other charges), sufficient funds for asset replacement and refurbishment, and
good project management.
INDICATOR 2.1.8 REVENUE PER CAPITA 2.1.9 TOTAL RATES PER CAPITA 2.1.10 GENERAL RATE PER CAPITA
INDICATOR
CALCULATION
Total operating revenue
Population of council area
Total rates
Population of council area
General rate + garbage rate or charge
Population of council area
INDICATOR
EXPLANATION
Revenue per Capita: This measures
revenue generated by councils per head of
population.
Total Rates per Capita: This measures the
rates raised by the council per head of
population.
General Rate per Capita: This measures the
general rate and the garbage rate or charge
per head of population. It should provide a
better basis for comparison between councils
as rates for services such as water and
sewerage, not provided by some councils, are
excluded.
INFLUENCING
FACTORS
distribution and level of
Commonwealth and State
Government funding
socio-economic profile of area, i.e.
capacity to repay
user-pays policies
number of ‘non-residential’ rate
paying properties
level and range of services
provided
profit/loss on asset disposals
distribution and level of
Commonwealth and State
Government funding
socio-economic profile of area, i.e.
capacity to repay
user-pays policies
number of ‘non-residential’ rate
paying properties
level and range of services provided
level of regional responsibility
distribution and level of
Commonwealth and State
Government funding
socio-economic profile of area, i.e.
capacity to repay
user-pays policies
number of ‘non-residential’ rate paying
properties
level and range of services provided

29
Cit ies
Clarence 908 1057 1079 1156 1360 678 722 754 816 859 399 425 445 477 503
Glenorchy 1098 1182 1331 1372 1418 730 775 793 862 930 288 312 312 342 360
Hobart 1627 1788 1962 2062 2082 1089 1172 1216 1249 1306 673 726 740 746 787
Launceston 1243 1406 1519 1401 1454 785 836 877 907 957 429 464 486 505 526
Group average 1219 1358 1473 1498 1579 821 876 910 959 1013 447 482 496 517 544
Medium Councils
Brighton 918 1220 1019 1063 1009 461 482 511 534 555 262 273 292 299 309
Burnie 1480 1740 1808 1787 1875 935 993 987 1032 1124 575 615 599 619 660
Central Coast 976 1006 1070 1100 1250 551 579 600 630 667 366 386 401 423 445
Derwent Valley 1037 1350 1111 1056 1129 586 614 632 660 687 340 367 378 396 408
Devonport 1253 1369 1567 1668 1669 848 889 925 973 1022 512 515 538 571 604
Huon Valley 1111 1187 1255 1371 1516 519 581 601 645 676 324 378 398 427 448
Kingborough 995 1103 1114 1283 1507 591 612 653 726 780 324 336 357 404 435
Meander Valley 861 830 983 918 1022 464 491 513 537 552 318 339 353 368 375
Northern Midlands 1136 1106 1248 1132 1227 499 526 539 554 637 341 361 368 379 441
Sorell 994 977 1148 1218 1320 573 607 642 680 731 460 479 497 521 557
Waratah-Wynyard 1138 1156 1266 1134 1242 596 642 661 664 690 372 411 405 408 430
West Tamar 747 850 923 1064 1044 470 503 522 571 600 277 300 309 342 358
Group average 1054 1158 1209 1233 1317 591 627 649 684 727 373 397 408 430 456
Small Councils
Break O'Day 1187 1491 2017 1704 2004 640 783 875 966 1069 413 527 583 638 708
Central Highlands 2627 3527 2775 2736 2674 737 885 932 1107 1160 560 700 731 885 927
Circular Head 1633 1504 1733 1835 1769 743 819 856 879 917 526 591 622 643 670
Dorset 1285 1330 1595 2000 1739 562 666 783 808 863 394 482 579 595 627
Flinders 3618 3431 3725 5993 4121 718 796 852 1058 1109 574 650 702 909 950
George Town 1248 1271 1550 1466 1869 697 762 799 851 916 509 556 596 634 694
Glamorgan-Spring Bay 1733 2017 2209 2428 2583 1055 1255 1305 1509 1533 552 730 751 951 1008
Kentish 915 1087 1208 1171 1455 474 569 601 636 701 334 422 442 465 500
King Island 2573 2881 3124 2958 3749 999 1150 1171 1103 1133 712 838 861 797 810
Latrobe 942 1107 1298 1437 1424 628 679 690 752 788 349 378 386 421 445
Southern Midlands 1223 1203 1331 1650 1534 463 502 532 551 603 313 345 368 381 423
Tasman 2495 2614 1259 3189 4116 690 800 890 1180 1233 649 756 842 1133 1181
West Coast 1527 1994 2270 1879 2036 975 1083 1128 1103 1183 590 656 575 563 619
Group average 1770 1958 2007 2342 2390 722 827 878 962 1016 498 587 618 694 736
State Average 1398 1544 1603 1767 1834 681 751 788 846 896 439 494 514 560 593
2003-04
$ $
Revenue per Capita Total Rates per Capita
2003-04 2004-05 2005-062007-08
$
2004-05
$
2005-06
$ $$
2006-07 2006-07
$
2004-05
$
General Rate per Capita
2005-06
$
2007-08
$ $ $
2007-08
$
2006-07
$
2003-04

30
`
2003-04 2004-05 2005-06 2006-07 2007-08
Cities 447 482 496 517 544
Medium Councils 373 397 408 430 456
Small Councils 498 587 618 694 736
State Average 439 494 514 560 593
300
350
400
450
500
550
600
650
700
750
800
Do
llars
Financial Year
General Rate per Capita
2003-04 2004-05 2005-06 2006-07 2007-08
Cities 1219 1358 1473 1498 1579
Medium Councils 1054 1158 1209 1233 1317
Small Councils 1770 1958 2007 2342 2390
State Average 1398 1544 1603 1767 1834
800
1000
1200
1400
1600
1800
2000
2200
2400
2600
Do
llars
Financial Year
Revenue per Capita
2003-04 2004-05 2005-06 2006-07 2007-08
Cities 821 876 910 959 1013
Medium Councils 591 627 649 684 727
Small Councils 722 827 878 962 1016
State Average 681 751 788 846 896
500
600
700
800
900
1000
1100
Do
llars
Financial Year
Total Rates per Capita

31
2.1 FINANCE continued
CATEGORY
DEFINITION
This category covers corporate services provided to the organisation by council management. Sound management and adequate financial capacity
are essential to deliver services to meet current and future community needs.
OBJECTIVE Value for council services, an equitable revenue policy (rates and other charges), sufficient funds for asset replacement and refurbishment,
and good project management.
INDICATOR
2.1.11 AVERAGE RESIDENTIAL RATE 2.1.12 RATES OUTSTANDING AT YEAR END
INDICATOR
CALCULATION
Total rates on residential properties
Total number of rateable residential properties
Outstanding rates (excluding rates postponed) and annual charges
at 30 June
Total rates and annual charges
INDICATOR
EXPLANATION
Average Residential Rate: Measures the average rates paid
on residential properties in each council area.
Year End Rates Outstanding: Measures how councils manage their
debt collection systems (excludes postponed rates).
INFLUENCING
FACTORS
socio-economic profile of area
policies on users paying for service
level and range of services provided
existence of cross subsidies between residential and
other property classes
availability of payment options
efficiency of follow-up procedures
socio-economic profile of the area
general economic conditions
level of rates postponed (under section 125 of the Local
Government Act 1993)
%

32
Cities
Clarence 1,368 1,409 1,451 1,539 1,574 5.4 5.2 4.6 4.6 6.1
Glenorchy 1,341 1,405 1,490 1,492 1,648 1.8 1.9 2.0 1.8 2.3
Hobart 1,406 1,452 1,476 1,631 1,767 2.7 2.4 2.3 1.4 1.3
Launceston 1,258 1,291 1,464 1,492 1,543 4.7 4.4 4.0 2.8 2.7
Group average 1,343 1,389 1,470 1,538 1,633 3.6 3.5 3.2 2.6 3.1
Medium Councils
Brighton 1,177 1,224 1,336 1,377 1,183 5.5 3.9 3.2 1.7 1.4
Burnie 1,355 1,386 1,434 1,467 1,666 4.0 3.8 3.9 4.4 4.1
Central Coast 1,265 1,238 1,251 1,338 1,447 1.0 0.4 0.4 2.2 2.3
Derwent Valley 1,282 1,381 1,419 1,460 1,518 7.3 7.6 6.4 6.6 5.9
Devonport 1,401 1,381 1,581 1,588 1,652 2.4 2.5 1.7 1.9 1.6
Huon Valley 848 935 1,027 1,063 1,041 4.4 3.8 3.1 3.4 3.7
Kingborough 1,293 1,362 1,388 1,452 1,531 2.9 2.8 2.5 2.5 2.1
Meander Valley 916 958 990 961 1,046 2.8 2.5 2.8 2.8 2.7
Northern Midlands 918 916 904 890 1,035 2.0 1.4 2.5 2.0 3.1
Sorell 1,011 954 1,133 1,149 1,108 6.9 6.8 6.2 2.8 3.3
Waratah-Wynyard 944 1,123 1,152 1,109 1,289 0.9 0.7 0.9 1.0 0.7
West Tamar 1,114 1,108 1,148 1,250 1,313 5.3 4.6 3.9 4.0 4.2
Group average 1,127 1,164 1,230 1,259 1,319 3.8 3.4 3.1 2.9 2.9
Small Councils
Break O'Day 709 779 912 991 1,051 3.4 2.0 2.8 2.8 4.2
Central Highlands 381 426 448 558 574 6.1 8.3 7.2 7.0 5.8
Circular Head 1,073 1,080 1,055 1,149 1,131 2.2 0.9 0.4 0.1 1.2
Dorset 840 903 1,030 1,081 1,117 3.8 2.7 2.4 2.3 1.5
Flinders 338 370 370 147 371 6.6 10.9 15.5 12.8 14.6
George Town 649 635 658 1,123 1,000 2.8 1.9 1.8 1.6 0.4
Glamorgan-Spring Bay 1,081 1,228 1,257 1,167 1,285 1.8 9.6 3.4 2.8 3.5
Kentish 893 974 901 944 987 2.7 2.2 0.5 1.3 1.1
King Island 596 520 1,648 1,852 1,466 5.8 7.3 5.3 7.2 6.7
Latrobe 1,108 1,138 1,129 1,141 1,293 1.3 1.1 0.3 0.4 2.1
Southern Midlands 799 815 637 613 804 10.7 8.7 8.2 8.9 8.2
Tasman 530 575 591 896 593 6.3 6.4 6.8 6.2 5.9
West Coast 1,029 1,518 1,141 1,401 1,451 13.9 11.4 9.3 5.2 2.6
Group average 771 843 906 1,005 1,009 5.2 5.6 4.9 4.5 4.4
State Average 997 1,051 1,118 1,184 1,224 4.2 4.2 3.7 3.4 3.5
%%%
Average Residential Rate
2003-04 2004-05 2005-06 2006-07 2007-08
$ % %$ $ $ $
Rates Outstanding at Year End
2005-06 2006-07 2007-082003-04 2004-05

33
2003-04 2004-05 2005-06 2006-07 2007-08
Cities 1343 1389 1470 1538 1633
Medium Councils 1127 1164 1230 1259 1319
Small Councils 771 843 906 1005 1009
State Average 997 1051 1118 1184 1224
0
200
400
600
800
1000
1200
1400
1600
1800
Do
llars
Financial Year
Average Residential Rate
2003-04 2004-05 2005-06 2006-07 2007-08
Cities 3.6 3.5 3.2 2.6 3.1
Medium Councils 3.8 3.4 3.1 2.9 2.9
Small Councils 5.2 5.6 4.9 4.5 4.4
State Average 4.2 4.2 3.7 3.4 3.5
0.0
1.0
2.0
3.0
4.0
5.0
6.0
Percen
tag
e
Financial Year
Rates Outstanding at Year End

34
2.1 FINANCE continued
CATEGORY
DEFINITION
This category covers corporate services provided to the organisation by council management. Sound management and adequate financial capacity
are essential to deliver services to meet current and future community needs.
OBJECTIVE Value for council services, an equitable revenue policy (rates and other charges), sufficient funds for asset replacement and refurbishment, and
good project management.
INDICATOR 2.1.13 CAPITAL EXPENDITURE/DEPRECIATION RATIO 2.1.14 OUTSOURCED CAPITAL EXPENDITURE
INDICATOR
CALCULATION
Total capital expenditure on existing assets
Total depreciation expense
Total outsourced capital expenditure
Total capital expenditure
INDICATOR
EXPLANATION
Ratio of Capital Expenditure on Existing Assets to
Depreciation: This measure can assist in identifying the
potential decline or improvement in asset condition and
standards. Capital expenditure can include the renewal,
upgrade or expansion of existing assets. A percentage
above 100 means that expenditure on existing assets
exceeded depreciation of existing assets.
Outsourced Capital Expenditure: Measures the extent to which a
council uses external providers to deliver capital expenditure
programs.
INFLUENCING
FACTORS
stage in life of assets
growth or decline of the area
depreciation policies/standards
capitalisation policy
presence in area of alternative service suppliers
availability of joint ventures
extent of competitive tender processes
ability to define projects and manage external providers
cost/benefit of outsourcing particular projects or activities
extent of grant funded projects
policy in respect of outsourcing
% %

35
Cities
Clarence 142.0 94.0 38.3 48.5 36.5 68.7 67.0 67.8 34.4 32.8
Glenorchy 103.5 68.9 58.3 53.6 50.8 17.4 20.8 21.8 21.7 21.8
Hobart 67.1 76.3 49.7 50.6 44.6 7.6 18.0 12.3 6.9 26.4
Launceston 135.4 133.9 3.6 5.8 5.8 54.9 58.1 35.6 39.1 21.4
Group average 112.0 93.3 37.5 39.6 34.4 37.1 41.0 34.4 25.5 25.6
Medium Councils
Brighton 98.9 264.6 37.1 0.0 0.0 27.2 21.7 22.7 20.2 10.6
Burnie 85.8 129.2 79.2 72.6 64.4 25.8 61.0 66.4 54.1 92.2
Central Coast 96.1 127.1 57.4 46.2 71.4 58.9 31.5 55.5 42.5 47.9
Derwent Valley 107.2 137.9 78.5 117.3 90.2 6.0 4.3 9.1 44.9 84.9
Devonport 71.7 77.6 57.8 63.4 54.9 49.6 47.6 73.6 73.9 51.1
Huon Valley 181.3 172.0 101.7 86.1 38.8 0.0 0.0 0.0 0.0 0.0
Kingborough 85.8 124.9 61.4 62.3 35.1 67.0 59.3 50.8 66.2 58.0
Meander Valley 99.2 92.6 63.2 88.9 70.1 96.6 54.5 44.2 36.6 61.9
Northern Midlands 298.2 148.9 93.8 90.7 85.1 77.4 45.4 43.8 62.8 44.3
Sorell 50.6 70.0 38.0 90.1 86.3 100.0 85.7 45.9 30.7 37.6
Waratah-Wynyard 165.2 213.3 97.2 120.5 90.8 50.9 35.5 41.1 22.1 25.4
West Tamar 151.8 112.8 71.3 103.1 99.7 89.8 86.3 90.3 83.0 92.0
Group average 124.3 139.2 69.7 78.4 65.6 54.1 44.4 45.3 44.7 50.5
Small Councils
Break O'Day 67.3 111.0 24.1 92.1 52.6 18.8 32.9 39.4 84.5 50.7
Central Highlands 73.8 122.0 15.0 14.6 74.9 56.8 95.2 87.0 68.8 69.1
Circular Head 229.0 111.9 80.1 87.5 110.4 35.8 52.9 46.8 37.4 35.5
Dorset 80.0 75.2 79.9 96.9 76.1 38.7 21.2 33.8 34.1 26.9
Flinders 33.6 33.8 0.4 0.0 7.0 54.1 6.1 24.7 26.5 42.1
George Town 120.5 61.7 37.9 83.5 217.4 7.0 4.6 18.2 UA UA
Glamorgan-Spring Bay 254.3 159.0 72.4 59.7 39.8 10.1 3.0 17.4 40.9 50.8
Kentish 162.3 135.3 0.0 7.5 69.5 56.0 78.2 60.0 64.9 0.0
King Island 135.8 113.2 5.4 37.8 32.8 15.1 19.7 16.3 16.9 18.4
Latrobe 127.3 137.1 76.7 64.8 62.3 52.7 22.4 28.4 12.9 29.0
Southern Midlands 89.7 114.5 92.1 27.2 57.3 25.5 28.6 36.5 42.5 40.9
Tasman 282.5 138.6 87.3 73.0 34.8 57.9 30.9 25.1 43.9 25.9
West Coast 110.7 135.3 17.8 92.8 43.1 94.5 82.4 81.6 97.4 98.6
Group average 135.9 111.4 45.3 56.7 67.5 40.2 36.8 39.6 47.6 40.7
State Average 127.8 120.4 54.3 63.3 62.2 45.5 40.5 41.2 43.2 42.7
%
2007-08
%
2007-08
%
2005-06
%
2006-07
%
* For the 2005-06 FY the definition of assets was amended from all assets to existing assets.
This may mean the figures prior to 2005-06 may not be directly comparable with 2005-06.
2004-05
%
2003-04
%
2004-05
%
Outsourced Capital ExpenditureTotal Capital Expenditure on Existing Assets *
/ Total Depreciation Ratio
2003-04
%
2006-07
%
2005-06

36
2003-04 2004-05 2005-06 2006-07 2007-08
Cities 37.1 41.0 34.4 25.5 25.6
Medium Councils 54.1 44.4 45.3 44.7 50.5
Small Councils 40.2 36.8 39.6 47.6 40.7
State Average 45.5 40.5 41.2 43.2 42.7
20.0
25.0
30.0
35.0
40.0
45.0
50.0
55.0
60.0
Percen
tag
e
Financial Year
Outsourced Capital Expenditure

37
2.2 CUSTOMER SERVICE – No measures available as yet
2.3 HUMAN RESOURCE MANAGEMENT
CATEGORY
DEFINITION
This category covers corporate services provided to the organisation by council management. Sound management and adequate physical and
financial capacity are essential to deliver services to meet current and future community needs.
OBJECTIVE For each council to have well-trained, highly motivated staff, who are multi-skilled to provide the necessary flexibility for management in a
modern corporation, and operate in a safe and healthy environment.
INDICATOR 2.3.1 AVERAGE COST PER EMPLOYEE 2.3.2 AVERAGE COST OF TRAINING
PER EMPLOYEE
2.3.3 NUMBER OF EMPLOYEES PER
1000 POPULATION †
INDICATOR
CALCULATION
Total employee costs
Number of year-end full-time equivalents
(FTEs)
Total employee training costs
Number of year-end full-time equivalents
(FTEs)
Number of year end FTEs (x 1000)
Population of council area
INDICATOR
EXPLANATION
Average Cost per Employee: Reflects
the cost to council of employing and
training its workforce.
Average Cost of Training per Employee:
Is a measure of employee skill
development.
Number of Employees per 1000
population: A measure to compare
staffing levels of similar sized councils.
INFLUENCING
FACTORS
policy on use of outsourced
labour/consultants
difficulty in attracting staff
range of services provided
organisational structure
skill mix of staff
introduction of new systems and
staff
use of new technology or
equipment
access to training facilitators
level of outsourcing and range of
services provided
population and ‘critical mass’ of staff
required to run councils
geographical remoteness and lack of
alternative suppliers
† Previously known as Relative Number of Employees. Only a name change.

38
Cities
Clarence 47,996 45,091 53,702 53,964 58,152 867 1,058 975 821 550 4.5 4.5 4.8 4.7 4.7
Glenorchy 56,362 59,840 60,944 64,788 55,846 866 1,014 755 1,033 627 6.4 6.6 6.7 6.9 7.3
Hobart 54,241 58,059 54,579 59,942 63,241 634 972 1,468 1,475 1,666 11.9 12.0 12.0 11.7 11.7
Launceston 49,969 54,471 58,638 64,697 66,393 665 840 935 798 1,273 7.7 7.8 7.9 7.5 7.1
Group average 52,140 54,365 56,966 60,848 60,908 758 971 1,033 1,032 1,029 7.6 7.7 7.9 7.7 7.7
Medium Councils
Brighton 39,497 41,373 47,230 38,953 53,215 1,766 837 998 1,048 1,242 3.1 3.5 3.5 4.0 4.1
Burnie 47,056 47,128 57,924 60,849 60,625 586 799 879 1,087 1,260 10.4 11.3 11.5 11.6 11.0
Central Coast 49,976 53,435 64,085 58,073 58,054 856 1,118 810 1,011 648 6.1 6.5 6.3 7.1 7.4
Derwent Valley 46,458 47,627 49,600 51,382 46,230 456 501 632 705 554 7.0 7.5 6.4 5.6 5.5
Devonport 48,865 49,526 58,532 61,508 65,112 911 912 886 666 537 8.0 8.0 8.2 8.3 7.7
Huon Valley 33,683 38,837 44,604 50,548 54,496 351 335 444 386 504 10.0 10.0 10.5 10.2 10.4
Kingborough 47,947 47,682 51,298 54,219 56,115 750 697 834 1,043 1,118 5.1 5.3 5.3 5.6 5.6
Meander Valley 44,941 51,161 52,596 60,081 64,391 726 1,170 1,018 1,130 1,248 3.5 3.7 4.0 4.0 3.9
Northern Midlands 43,628 48,097 54,878 58,938 63,390 1,651 1,144 1,124 1,103 2,031 5.7 6.2 5.9 6.0 5.9
Sorell 53,947 55,651 51,248 53,204 58,715 434 609 501 567 989 6.3 6.1 7.3 7.0 6.9
Waratah-Wynyard 37,740 41,037 48,476 50,217 49,398 823 898 1,012 985 1,038 6.0 6.4 6.0 6.4 6.4
West Tamar 56,406 53,769 55,949 58,813 59,519 1,650 887 909 912 904 3.6 4.1 4.3 4.3 4.4
Group average 45,845 47,943 53,035 54,732 57,438 913 826 837 887 1,006 6.2 6.5 6.6 6.7 6.6
Small Councils
Break O'Day 48,855 56,887 50,607 52,638 56,931 814 2,261 1,733 2,015 2,679 8.0 7.6 9.2 10.6 10.9
Central Highlands 49,625 51,848 50,969 49,563 46,431 564 613 601 302 322 13.9 14.1 13.9 13.8 16.0
Circular Head 46,720 48,365 49,173 53,712 57,999 423 662 1,130 1,676 2,014 6.2 6.3 6.8 6.8 6.6
Dorset 50,049 50,720 58,856 55,415 57,469 1,090 1,514 1,356 921 1,728 7.0 7.2 6.5 7.2 7.3
Flinders 44,507 54,709 57,953 68,273 53,359 465 245 661 1,505 534 19.4 20.1 20.5 18.2 26.2
George Town 33,626 47,685 52,295 55,483 49,684 527 832 870 1,196 1,478 6.4 6.9 6.9 7.3 7.4
Glamorgan-Spring Bay 48,103 46,660 68,833 65,576 69,233 806 547 939 797 788 9.3 10.9 11.0 11.3 9.8
Kentish 48,000 53,027 45,630 49,420 52,793 598 704 1,408 1,593 1,241 4.1 4.1 4.9 5.0 4.8
King Island 50,736 46,186 48,604 47,964 46,912 137 77 1,750 762 685 17.2 16.6 16.5 16.4 18.6
Latrobe 46,787 50,320 51,156 49,563 60,307 1,463 1,262 1,090 1,296 1,474 6.0 6.3 6.2 6.9 6.0
Southern Midlands 38,320 39,505 48,922 49,777 62,275 376 375 521 600 509 7.8 7.7 7.7 7.9 7.7
Tasman 48,358 52,750 61,578 58,446 52,607 698 643 736 732 862 23.9 25.7 24.8 24.2 8.7
West Coast 48,438 53,637 52,510 54,240 59,105 696 886 391 475 469 11.2 11.7 11.8 11.0 10.9
Group average 46,317 50,177 53,622 54,621 55,777 666 817 1,014 1,067 1,137 10.8 11.2 11.3 11.3 10.8
State Average 46,925 49,830 53,840 55,526 57,172 781 842 944 988 1,068 8.5 8.8 8.9 8.9 8.7
* During the course of validation, there was an inconsistency in a number of Councils in the way in which average cost per emplooyee
was calculated. This may explain the large discrepancies between 2004-05 figures and 2005-06.
$ $ $$ $ $ $
2003-04 2004-05 2005-06 2006-07 2007-08
$ $ $
2005-06 2006-07 2007-08
No. of Employees per 1000 Population
2007-08
Average Cost of Training per EmployeeAverage Cost per Employee *
2003-04 2004-052006-072005-062004-052003-04

39
2003-04 2004-05 2005-06 2006-07 2007-08
Cities 52140 54365 56966 60848 60908
Medium Councils 45845 47943 53035 54732 57438
Small Councils 46317 50177 53622 54621 55777
State Average 46925 49830 53840 55526 57172
37500
40000
42500
45000
47500
50000
52500
55000
57500
60000
62500
Do
llars
Financial Year
Average Cost per Employee *
2003-04 2004-05 2005-06 2006-07 2007-08
Cities 758 971 1033 1032 1029
Medium Councils 913 826 837 887 1006
Small Councils 666 817 1014 1067 1137
State Average 781 842 944 988 1068
400
500
600
700
800
900
1000
1100
1200
Do
llars
Financial Year
Average Cost of Training per Employee
2003-04 2004-05 2005-06 2006-07 2007-08
Cities 7.6 7.7 7.9 7.7 7.7
Medium Councils 6.2 6.5 6.6 6.7 6.6
Small Councils 10.8 11.2 11.3 11.3 10.8
State Average 8.5 8.8 8.9 8.9 8.7
4.0
5.0
6.0
7.0
8.0
9.0
10.0
11.0
12.0
Em
plo
yees
Financial Year
No. of Employees per 1000 Population

40
2.3 HUMAN RESOURCE MANAGEMENT continued
CATEGORY
DEFINITION
This category covers corporate services provided to the organisation by council management. Sound management and adequate financial capacity
are essential to deliver services to meet current and future community needs.
OBJECTIVE For each council to have well-trained, highly motivated staff, who are multi skilled to provide the necessary flexibility for management in a
modern corporation, and operate in a safe and healthy environment.
INDICATOR 2.3.4 STAFF TURNOVER RATE 2.3.5 AVERAGE SICK LEAVE PER
EMPLOYEE 2.3.6 LOST TIME DUE TO INJURY
INDICATOR
CALCULATION
Full-time equivalent terminations
Total number of year-end
full-time equivalents (FTEs)
Number of days of sick leave
Number of year-end full-time equivalents
(FTEs)
Hours lost to injury (x1000)
Total hours worked
INDICATOR
EXPLANATION
Staff Turnover Rate: Measures workforce
stability.
Average Sick Leave per Employee:
Measures health and wellbeing in the
workplace.
Lost Time Due to Injury: An indicator of a
council’s occupational health and safety
performance.
INFLUENCING
FACTORS
organisational re-structure
employer/employee relations and
practices
workplace culture
quality of staff and staff mobility
remuneration and recognition
long-term sickness of one or
more staff
employer/employee relations
inflexible working patterns
workplace culture
employee morale
inadequate occupational health and
safety practices
long-term injury of one or more
employees
workplace culture
%

41
Cities
Clarence 9.3 12.6 8.2 7.6 6.3 7.6 7.5 6.7 7.3 9.4 4.8 1.3 2.3 0.3 5.2
Glenorchy 10.1 10.8 7.6 8.8 11.7 6.8 5.9 5.9 6.6 6.8 3.7 4.0 8.9 11.7 10.9
Hobart 9.4 9.2 11.1 14.6 10.4 7.3 6.1 6.4 6.8 9.4 3.2 1.5 2.4 4.0 5.9
Launceston 8.1 9.1 9.7 13.3 16.6 5.7 6.2 6.3 7.5 7.7 8.1 4.4 4.0 2.6 1.6
Group average 9.2 10.5 9.2 11.1 11.2 6.8 6.5 6.3 7.0 8.3 5.0 2.8 4.4 4.6 5.9
Medium Councils
Brighton 16.7 6.1 0.0 5.3 11.5 3.9 3.1 5.7 7.1 6.5 1.0 4.4 3.9 1.8 0.5
Burnie 10.6 11.0 3.2 9.8 16.6 6.0 4.9 4.9 4.3 5.7 2.7 1.1 1.3 2.0 8.1
Central Coast 4.7 5.9 7.5 8.0 8.3 6.5 8.0 7.5 6.1 6.6 8.7 4.7 7.0 8.7 5.0
Derwent Valley 10.6 11.3 25.8 14.8 13.0 3.3 3.5 2.2 4.7 3.9 10.2 2.9 0.9 0.1 0.5
Devonport 6.5 21.8 17.6 12.6 17.3 6.0 6.2 6.8 7.8 7.9 6.9 4.3 3.4 5.4 3.9
Huon Valley 10.8 12.1 14.2 21.8 17.1 3.6 2.1 4.1 3.8 3.4 8.5 3.6 0.3 0.5 1.9
Kingborough 13.4 13.8 13.6 16.5 17.1 4.1 5.3 4.9 5.1 6.6 3.7 2.9 1.5 1.4 2.7
Meander Valley 4.6 8.8 10.6 9.1 6.7 5.0 5.1 5.0 3.4 5.0 0.4 1.5 0.0 0.3 0.7
Northern Midlands 9.1 21.3 13.0 14.0 10.8 6.1 4.4 4.8 4.7 8.7 4.2 10.8 0.9 2.0 5.4
Sorell 7.0 11.4 14.0 12.9 15.1 5.5 5.3 2.7 5.6 6.5 1.1 0.8 1.5 2.5 0.9
Waratah-Wynyard 13.6 7.8 9.6 8.6 26.6 5.3 6.7 6.2 6.7 6.7 6.7 6.5 8.0 1.6 1.0
West Tamar 9.2 17.2 13.0 9.7 17.5 5.0 5.1 5.4 5.0 6.4 0.4 1.0 2.5 1.4 2.0
Group average 9.7 12.4 11.8 11.9 14.8 5.0 5.0 5.0 5.4 6.2 4.5 3.7 2.6 2.3 2.7
Small Councils
Break O'Day 14.6 6.4 21.6 7.6 20.6 5.1 4.9 5.2 4.0 6.2 1.6 2.3 14.4 36.3 36.5
Central Highlands 6.3 12.1 9.4 7.8 5.4 3.5 5.9 2.8 3.8 4.6 4.7 4.4 4.1 0.6 8.4
Circular Head 14.0 19.6 10.9 12.5 19.4 9.3 6.2 5.0 5.3 7.6 18.3 24.2 18.1 3.2 0.3
Dorset 8.0 5.9 8.7 5.8 0.0 5.7 5.5 5.5 4.2 5.1 0.8 0.1 0.0 0.4 0.8
Flinders 23.5 16.7 27.8 25.0 8.7 5.3 2.6 7.8 7.7 13.8 0.0 0.0 2.0 0.0 0.0
George Town 4.7 4.3 4.3 6.1 18.0 5.3 4.4 6.1 7.2 5.2 0.6 4.9 5.7 0.0 1.5
Glamorgan-Spring Bay 17.9 14.9 10.4 12.2 16.3 6.7 3.8 4.5 4.1 6.9 7.7 1.2 0.5 0.2 0.2
Kentish 8.7 12.5 10.3 6.7 20.7 2.7 2.8 2.2 4.0 6.0 8.6 2.7 0.0 0.4 0.0
King Island 17.9 7.7 7.7 14.3 12.5 3.8 7.1 6.1 9.5 8.6 11.7 1.1 0.6 6.0 0.2
Latrobe 5.8 14.5 14.3 8.2 22.2 4.9 3.9 7.0 4.9 6.7 3.0 0.8 0.0 0.5 3.1
Southern Midlands 0.0 2.3 0.0 2.2 6.7 3.8 3.5 6.3 6.1 3.0 3.9 1.9 5.0 3.1 1.3
Tasman 17.0 17.9 19.6 14.3 25.0 7.3 8.6 7.4 8.3 6.2 11.3 21.5 13.1 5.4 0.0
West Coast 17.5 51.7 24.1 24.6 42.9 5.7 6.5 7.2 7.4 9.5 1.6 0.6 0.7 0.8 23.7
Group average 12.0 14.3 13.0 11.3 16.8 5.3 5.0 5.6 5.9 6.9 5.7 5.0 4.9 4.4 5.9
State Average 10.7 13.0 12.0 11.5 15.2 5.4 5.2 5.5 5.8 6.8 5.1 4.2 3.9 3.6 4.6
Staff Turnover RateLost Time due to Injury
(hours lost per 1000 hours worked) Average Sick Leave per Employee (days)
2007-082003-04 2004-05 2005-06 2006-07 2007-08 2006-072003-04 2004-05 2005-06 2006-07 2007-08 2003-04 2004-05 2005-06
% % % % %
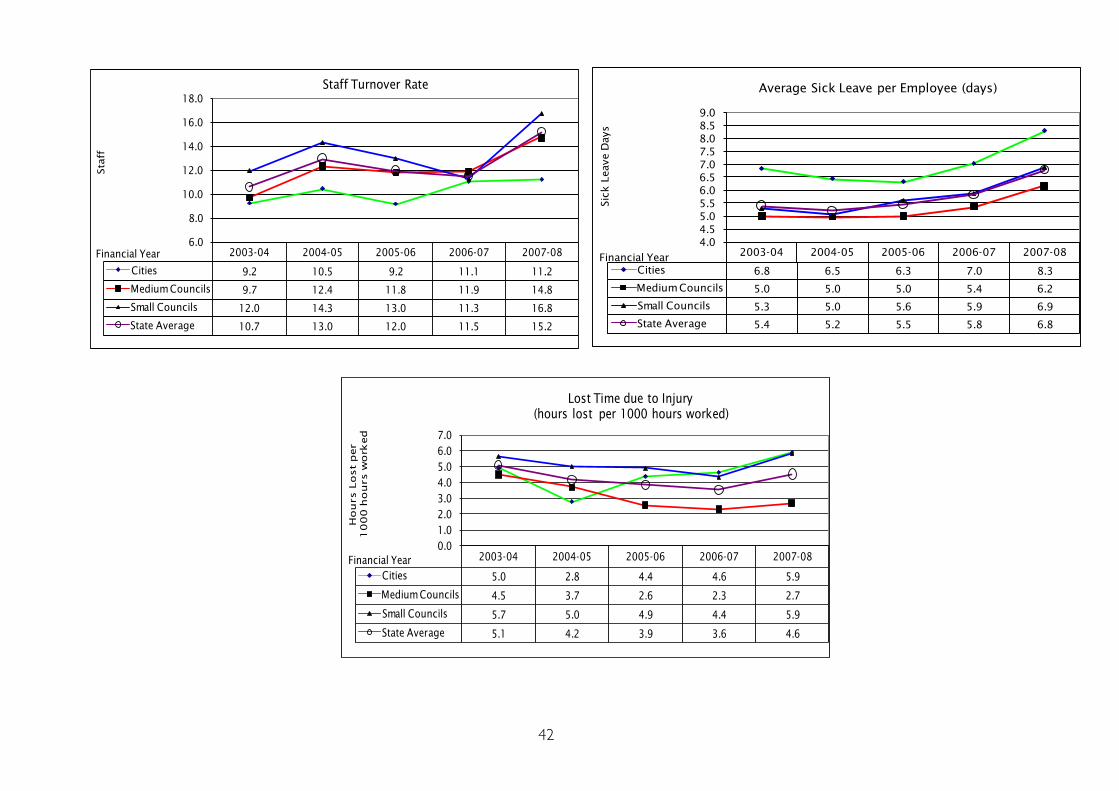
42
2003-04 2004-05 2005-06 2006-07 2007-08
Cities 9.2 10.5 9.2 11.1 11.2
Medium Councils 9.7 12.4 11.8 11.9 14.8
Small Councils 12.0 14.3 13.0 11.3 16.8
State Average 10.7 13.0 12.0 11.5 15.2
6.0
8.0
10.0
12.0
14.0
16.0
18.0Staff
Financial Year
Staff Turnover Rate
2003-04 2004-05 2005-06 2006-07 2007-08
Cities 6.8 6.5 6.3 7.0 8.3
Medium Councils 5.0 5.0 5.0 5.4 6.2
Small Councils 5.3 5.0 5.6 5.9 6.9
State Average 5.4 5.2 5.5 5.8 6.8
4.0
4.5
5.0
5.5
6.0
6.5
7.0
7.5
8.0
8.5
9.0
Sic
k L
eave D
ays
Financial Year
Average Sick Leave per Employee (days)
2003-04 2004-05 2005-06 2006-07 2007-08
Cities 5.0 2.8 4.4 4.6 5.9
Medium Councils 4.5 3.7 2.6 2.3 2.7
Small Councils 5.7 5.0 4.9 4.4 5.9
State Average 5.1 4.2 3.9 3.6 4.6
0.0
1.0
2.0
3.0
4.0
5.0
6.0
7.0
Ho
urs Lo
st p
er
10
00
h
ou
rs w
ork
ed
Financial Year
Lost Time due to Injury
(hours lost per 1000 hours worked)

43
2.4 INFORMATION SYSTEMS MANAGEMENT
CATEGORY
DEFINITION
This category covers corporate services provided to the organisation by council management. Sound management and adequate physical and
financial capacity are essential to deliver services to meet current and future community needs.
OBJECTIVE For councils to have efficient and effective Information Technology (IT) systems to support modern management practices and to satisfy
the service needs of their communities.
INDICATOR 2.4.1 ELECTRONIC SERVICE DELIVERY
RECEIPTS
2.4.2 INFORMATION
TECHNOLOGY EXPENSES
2.4.3 IT EXPENSES PER TERMINAL
OR PER PERSONAL COMPUTER
INDICATOR
CALCULATION
Number of service delivery receipts issued
electronically
Total number of service delivery receipts
issued
IT operating expenses
Total operating expenses IT operating expenses
Number of terminals or PCs
INDICATOR
EXPLANATION
Electronic Service Delivery Receipts:
Measures the degree to which council
business is conducted electronically.
Information Technology Expenses:
Measures a council’s investment in
information technology.
IT Expenses per Terminal or per
Personal Computer: Measures the
proportional cost of supplying IT services
to each terminal.
INFLUENCING
FACTORS
provision of electronic service delivery
systems
communication of availability of
systems
community IT take-up
appropriate infrastructure
age and socio-economic profile of the
community
commitment to the use of new
technology
timing of equipment and
software upgrades
cost allocation systems
economies of scale
commitment to the use of new
technology
timing of equipment or software
upgrades
cost allocation systems
economies of scale
% %

44
Cities
Clarence 52.8 56.7 57.6 54.9 21.0 2.8 2.7 2.2 2.6 2.2 8,702 8,786 7,567 8,516 8,275
Glenorchy 57.4 68.5 63.8 60.7 58.0 2.1 2.2 2.6 2.3 3.1 4,761 5,087 5,752 4,956 7,469
Hobart 38.1 40.7 56.8 57.1 69.2 2.7 2.8 2.9 3.0 2.7 5,988 6,032 6,177 6,264 5,815
Launceston 22.1 24.9 19.8 27.8 29.9 2.2 1.9 1.6 1.6 1.6 5,956 5,193 3,906 4,109 4,181
Group average 42.6 47.7 49.5 50.1 44.5 2.4 2.4 2.3 2.4 2.4 6,352 6,274 5,851 5,961 6,435
Medium Councils
Brighton 45.3 58.5 41.4 76.6 74.5 1.6 1.3 1.4 1.1 0.5 3,956 3,312 3,603 2,886 1,185
Burnie 23.3 27.8 29.5 29.2 38.8 2.5 2.3 3.0 2.9 3.0 5,114 6,008 6,342 6,434 6,381
Central Coast 37.9 41.8 46.2 50.6 46.8 1.9 1.7 1.8 1.7 2.1 5,588 5,515 5,805 5,470 7,437
Derwent Valley 33.0 56.2 61.5 71.2 63.1 1.0 0.7 0.8 0.6 0.6 3,660 2,954 3,701 2,723 2,855
Devonport 27.7 40.1 40.2 41.0 49.8 2.9 3.2 2.7 2.3 2.9 6,044 7,016 6,156 5,597 6,100
Huon Valley 47.0 45.7 51.6 44.9 52.4 1.2 1.1 1.3 1.7 0.6 2,564 2,361 2,495 3,268 1,477
Kingborough 59.1 67.5 69.8 70.0 74.1 2.5 2.7 2.4 2.1 2.1 6,043 6,815 5,226 4,690 5,024
Meander Valley 68.9 72.7 80.9 75.4 77.3 2.2 2.2 2.1 1.8 1.7 6,503 6,153 6,493 6,052 5,750
Northern Midlands 36.6 42.8 43.5 42.9 48.9 2.1 1.4 1.5 1.5 1.5 4,833 3,496 4,538 4,221 4,381
Sorell 34.1 24.8 11.4 11.9 12.6 0.8 0.6 2.0 0.8 0.9 2,351 1,593 4,413 1,681 1,968
Waratah-Wynyard 20.8 12.3 30.4 32.9 28.4 1.8 1.6 1.6 1.9 1.8 5,600 4,810 4,874 5,260 5,616
West Tamar 32.6 37.3 38.4 45.5 48.9 3.2 2.6 2.7 2.8 2.4 6,524 6,187 5,392 6,170 5,435
Group average 38.9 44.0 45.4 49.3 51.3 2.0 1.8 1.9 1.8 1.7 4,898 4,685 4,920 4,538 4,467
Small Councils
Break O'Day 45.4 76.1 58.5 62.5 66.0 1.7 2.0 1.9 1.4 1.3 4,744 5,639 3,869 2,867 2,974
Central Highlands 41.0 54.7 58.9 61.6 63.4 1.4 1.9 1.8 1.8 1.8 5,764 6,602 7,051 6,392 6,304
Circular Head 0.0 0.0 100.0 100.0 100.0 1.3 1.2 1.7 1.7 1.5 3,947 3,700 4,983 6,145 6,673
Dorset 26.2 32.0 35.2 33.8 26.6 1.5 2.4 2.2 2.2 2.0 4,296 6,893 6,169 6,519 7,053
Flinders 0.0 0.0 10.0 10.0 10.0 1.6 1.0 1.0 1.4 1.2 4,230 3,049 3,333 4,734 3,082
George Town 23.7 25.5 UA UA UA 2.6 2.4 2.1 1.5 2.3 7,780 7,371 6,639 4,994 7,309
Glamorgan-Spring Bay 23.4 22.2 45.1 46.0 47.0 2.6 2.4 2.1 1.7 1.2 4,483 3,540 5,582 5,477 4,081
Kentish 65.4 65.4 65.8 67.1 67.1 1.5 1.6 2.1 2.9 2.8 4,051 4,049 6,348 8,390 9,886
King Island 3.7 9.1 10.8 11.0 11.3 1.8 1.0 0.9 0.8 1.2 4,126 2,731 2,914 2,564 4,087
Latrobe 16.3 16.8 34.4 35.2 62.5 1.8 1.6 1.8 1.7 1.9 4,927 4,639 5,319 5,021 5,111
Southern Midlands 45.4 47.1 82.6 82.4 91.7 1.2 1.3 1.5 1.7 1.6 2,971 3,164 3,366 4,134 4,255
Tasman 31.9 41.2 61.8 77.8 73.3 1.7 1.4 1.4 1.1 1.3 3,191 3,093 3,285 2,571 5,927
West Coast 35.8 56.0 57.6 70.0 68.8 1.0 1.7 1.4 0.9 1.4 3,266 4,770 3,960 2,383 3,559
Group average 27.5 34.3 51.7 54.8 57.3 1.7 1.7 1.7 1.6 1.7 4,444 4,557 4,832 4,784 5,408
State Average 34.3 40.2 48.7 51.8 52.9 1.9 1.8 1.9 1.8 1.8 4,895 4,847 5,009 4,845 5,160
2006-07 2007-082005-06
IT Expenses per Terminal / PC
2005-06 2006-07 2004-05
Electronic Service Delivery
Receipts
Information Technology
Expenses
2003-04 2004-05 2005-06 2006-07
% % % % $$ $
2007-08 2007-08
% %
2003-04 2004-05 2003-04
$ $% % % %

45
KEY RESULT AREA
3 REGULATORY
3.1 COMMUNITY HEALTH AND SAFETY
CATEGORY
DEFINITION
This category provides information regarding those roles in which councils monitor the maintenance of standards including health inspections and
building regulations.
OBJECTIVE Freedom from disease, clean and safe communities, efficient implementation of sound and consistent planning policies, and the maintenance of
building standards.
INDICATOR 3.1.1 COMMUNITY HEALTH AND SAFETY EXPENDITURE
Note two separate measures
INDICATOR
CALCULATION
Expenditure on community, health and safety
Total operating expenditure Expenditure on community, health and safety
Population of council Area
INDICATOR
EXPLANATION
Community Health and Safety Expenditure as a % of Total Operating
Expenditure is a measure of the level of expenditure on community
health and safety.
Community Health and Safety Expenditure per Capita indicates
the scale of council’s service provision.
INFLUENCING
FACTORS
budgetary constraints
education policies
number of premises subject to inspection
rural health issues
budgetary constraints
education policies
number of premises subject to inspection
rural health issues
%
46
Cities
Clarence 2.6 2.6 2.5 2.6 2.0 22.4 23.2 24.8 27 24
Glenorchy 1.8 1.7 2.0 2.0 2.0 20.5 21.4 26.6 28 30
Hobart 1.2 1.2 1.6 1.4 1.3 20.4 22.5 30.6 27 28
Launceston 1.8 1.7 1.5 1.3 1.5 21.3 20.7 19.4 18 22
Group average 1.8 1.8 1.9 1.8 1.7 21.2 22.0 25.4 25 26
Medium Councils
Brighton 2.9 3.2 2.1 1.4 8.6 23.6 25.9 16.4 11 69
Burnie 1.2 1.1 1.2 1.8 1.3 17.2 20.8 21.0 31 24
Central Coast 1.9 1.8 1.9 2.1 2.9 16.7 18.4 19.6 23 36
Derwent Valley 2.8 3.5 3.7 4.0 3.8 28.4 37.6 40.9 42 43
Devonport 1.8 1.9 1.7 1.9 1.5 22.9 25.6 23.3 28 24
Huon Valley 3.2 5.3 0.9 2.8 2.2 31.7 53.5 9.6 32 32
Kingborough 1.7 1.9 2.0 1.7 1.7 14.5 16.5 18.7 18 19
Meander Valley 2.1 3.7 3.0 1.3 1.7 16.8 27.7 24.2 11 15
Northern Midlands 1.5 1.3 1.3 1.4 1.4 13.2 12.5 14.7 17 17
Sorell 4.2 3.8 4.2 3.0 4.5 46.8 43.6 48.9 38 57
Waratah-Wynyard 1.9 2.2 1.6 2.1 2.0 18.0 20.1 16.3 21 23
West Tamar 2.6 1.8 1.7 2.1 1.9 18.0 15.4 12.9 17 16
Group average 2.3 2.6 2.1 2.1 2.8 22.3 26.5 22.2 24 31
Small Councils
Break O'Day 1.9 1.6 1.7 1.5 1.5 24.0 21.1 23.1 22 26
Central Highlands 5.3 5.6 5.3 5.7 5.3 177.6 157.8 174.7 163 156
Circular Head 0.7 1.9 1.6 0.6 0.5 9.2 25.0 22.7 9 10
Dorset 4.9 2.2 5.7 8.1 2.1 68.1 31.2 80.7 116 36
Flinders 2.8 0.8 0.0 1.1 0.6 107.5 34.0 0.3 48 30
George Town 1.9 2.1 1.8 1.3 1.4 21.6 26.1 23.7 19 19
Glamorgan-Spring Bay 1.5 0.5 4.0 4.0 5.6 28.1 8.4 87.9 90 140
Kentish 5.5 0.2 0.6 5.5 4.7 49.0 2.1 7.5 63 65
King Island 1.6 0.1 1.1 2.1 1.7 39.5 3.2 32.7 61 51
Latrobe 2.1 1.8 1.9 1.6 1.8 19.2 18.2 19.5 19 21
Southern Midlands 1.3 1.4 1.6 1.9 2.0 15.1 16.7 19.9 26 28
Tasman 8.6 4.8 5.0 2.3 2.2 198.9 126.6 144.0 67 65
West Coast 3.7 2.4 2.5 1.8 2.2 57.1 41.9 44.7 31 41
Group average 3.2 1.9 2.5 2.9 2.4 62.7 39.4 52.4 56 53
State Average 2.6 2.2 2.3 2.4 2.5 40.3 31.6 36.2 39 39
Community Health and Safety Expenditure
as a % of Total Operating Expenditure
Community Health and Safety
Expenditure per Capita
2003-04 2007-08
% % $ $ $$
2004-05 2003-04 2004-05
$
2005-06
%
2006-072006-07
%
2007-08
%
2005-06

47
2003-04 2004-05 2005-06 2006-07 2007-08
Cities 21 22 25 25 26
Medium Councils 22 26 22 24 31
Small Councils 63 39 52 56 53
State Average 40 32 36 39 39
0
20
40
60
80
Percen
tag
e
Financial Year
Community Health and Safety
Expenditure per Capita
2003-04 2004-05 2005-06 2006-07 2007-08
Cities 1.8 1.8 1.9 1.8 1.7
Medium Councils 2.3 2.6 2.1 2.1 2.8
Small Councils 3.2 1.9 2.5 2.9 2.4
State Average 2.6 2.2 2.3 2.4 2.5
0.0
1.0
2.0
3.0
4.0
Percen
tag
e
Financial Year
Community Health and Safety Expenditure
as a % of Total Operating Expenditure

48
3. 1 COMMUNITY HEALTH AND SAFETY Continued
CATEGORY
DEFINITION
This category provides information regarding those roles in which councils monitor the maintenance of standards including health inspections and
building regulations.
OBJECTIVE Freedom from disease, clean and safe communities, efficient implementation of sound and consistent planning policies, and the maintenance
of building standards.
INDICATOR
3.1.2 NUMBER OF TIMES FOOD-HANDLING PREMISES ARE INSPECTED
Note: Revised Indicator 2005-2006
INDICATOR
CALCULATION
Number of Inspections of Food-Handling Premises
Total Number of Food-Handling Premises
INDICATOR
EXPLANATION
This will indicate the percentage of times food-handling premises are inspected each year. For example, a council with a KPI of 200%
means on average each premises has been inspected twice, 50% means only half the food handling premises have been inspected.
INFLUENCING
FACTORS
number of inspections of premises
council policy
education of operators
particular local problems (i.e. disease outbreaks)
%

49
Cities
Clarence 0.0 0.0 47.5 17.1 101.8
Glenorchy 0.4 0.4 28.7 82.3 79.0
Hobart 0.5 0.3 145.9 121.0 134.8
Launceston 0.1 1.3 151.7 169.5 141.9
Group average 0.3 0.5 93.5 97.5 114.4
Medium Councils
Brighton 0.3 0.2 221.2 192.9 49.1
Burnie 0.0 0.0 135.5 140.7 113.6
Central Coast 0.0 0.0 204.9 180.6 53.3
Derwent Valley 0.0 0.0 100.0 110.1 55.8
Devonport 0.0 0.0 227.3 153.4 114.3
Huon Valley 0.1 0.1 76.7 102.2 49.3
Kingborough 0.0 0.0 100.0 100.0 109.6
Meander Valley 0.0 0.0 55.3 51.4 93.2
Northern Midlands 0.0 0.0 83.9 44.2 105.1
Sorell 0.1 0.1 147.0 143.3 150.0
Waratah-Wynyard 0.1 0.0 66.7 41.2 82.7
West Tamar 0.1 0.0 27.8 106.5 50.0
Group average 0.1 0.0 120.5 113.9 85.5
Small Councils
Break O'Day 0.0 0.0 93.8 92.9 93.0
Central Highlands 0.0 0.0 100.0 100.0 94.0
Circular Head 0.0 0.0 35.6 32.7 151.9
Dorset 0.1 0.0 90.2 125.9 114.8
Flinders 0.0 0.0 250.0 250.0 246.7
George Town 0.0 0.0 100.0 100.0 87.7
Glamorgan-Spring Bay 1.2 0.0 99.2 83.9 45.1
Kentish 0.0 0.0 131.6 152.6 87.9
King Island 0.0 0.0 40.5 114.3 51.4
Latrobe 0.2 0.0 38.4 90.8 89.0
Southern Midlands 0.0 0.0 117.0 95.8 145.8
Tasman 0.0 1.4 219.0 147.7 145.0
West Coast 0.0 0.0 100.0 100.0 100.0
Group average 0.1 0.1 108.9 114.4 111.7
State Average 0.1 0.1 111.6 111.8 101.2
* Indicator changed 2005-2006. Figures for 2002-2003 to 2004-2005 are not comparable with 2005-2006.
% % % %
2003-04 2004-05
Number of Times Food-Handling Premises are
Inspected *2005-06 2006-07 2007-08
%
Please Note – Indicator 3.1.2 ’Notices Issued‘ was removed from the
2005-2006 Report because of problems with defining which
community health and safety services should be included. This
measure is now about the frequency of inspection of food handling
premises. Consequently previous data concerning ’Notices Issued‘ is not comparable to the new measure.

50
3.2 PLANNING AND DEVELOPMENT
CATEGORY DEFINITION This category covers services by councils in the management of planning and development in their municipal area.
OBJECTIVE The planning scheme must reflect the economic, social and environmental views of the community and be implemented in an efficient
and effective manner.
INDICATOR
3.2.1 DAYS TO OBTAIN APPROVALS
(Permitted use planning, discretionary planning, and buildings) Note: three separate measures
INDICATOR
CALCULATION
Average number of calendar days for councils to process planning and building approvals.
INDICATOR
EXPLANATION
Measures the turnaround time of planning and building approval processes. Delays in processing can have a significant financial impact
on the applicants and downstream providers. It is a measure of the total number of days taken - no allowances are made for delays to
obtain additional information etc.
INFLUENCING FACTORS
number and experience of planning and regulatory staff
number and complexity of applications
level of building and development activity within the
municipal area
council systems and procedures
external certification of building plans
additional information sought
involvement of external bodies and other legislation
level of delegation
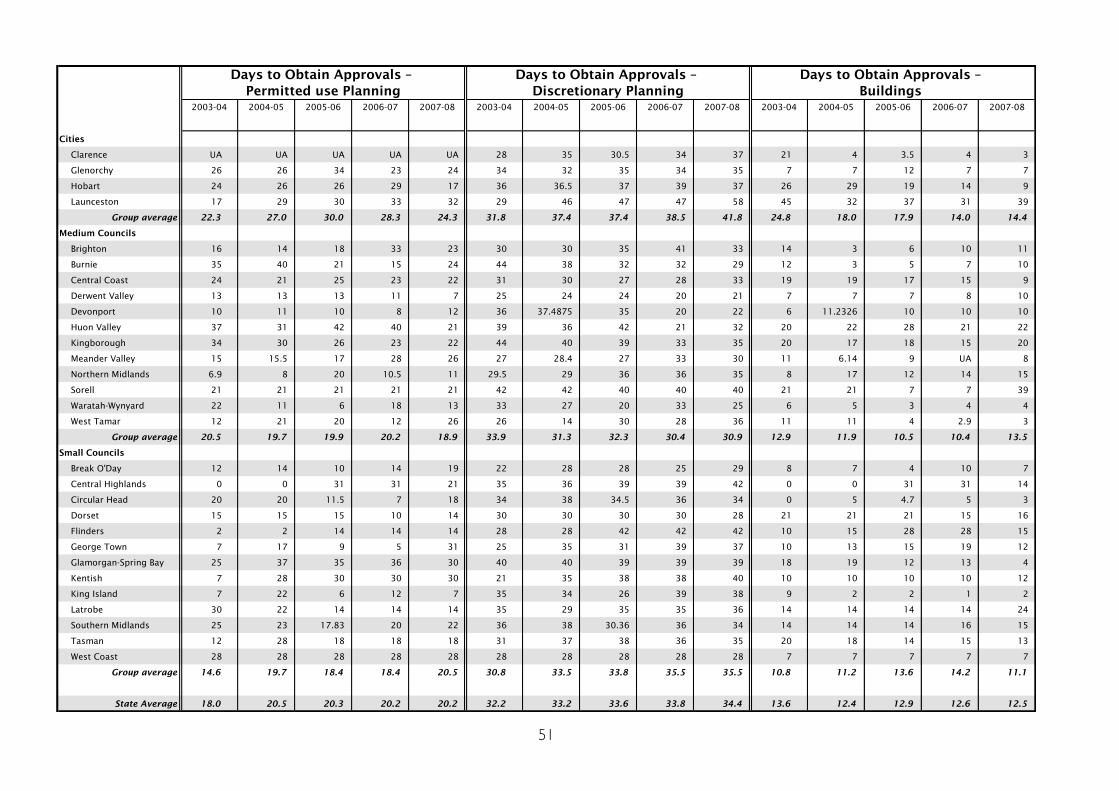
51
Cities
Clarence UA UA UA UA UA 28 35 30.5 34 37 21 4 3.5 4 3
Glenorchy 26 26 34 23 24 34 32 35 34 35 7 7 12 7 7
Hobart 24 26 26 29 17 36 36.5 37 39 37 26 29 19 14 9
Launceston 17 29 30 33 32 29 46 47 47 58 45 32 37 31 39
Group average 22.3 27.0 30.0 28.3 24.3 31.8 37.4 37.4 38.5 41.8 24.8 18.0 17.9 14.0 14.4
Medium Councils
Brighton 16 14 18 33 23 30 30 35 41 33 14 3 6 10 11
Burnie 35 40 21 15 24 44 38 32 32 29 12 3 5 7 10
Central Coast 24 21 25 23 22 31 30 27 28 33 19 19 17 15 9
Derwent Valley 13 13 13 11 7 25 24 24 20 21 7 7 7 8 10
Devonport 10 11 10 8 12 36 37.4875 35 20 22 6 11.2326 10 10 10
Huon Valley 37 31 42 40 21 39 36 42 21 32 20 22 28 21 22
Kingborough 34 30 26 23 22 44 40 39 33 35 20 17 18 15 20
Meander Valley 15 15.5 17 28 26 27 28.4 27 33 30 11 6.14 9 UA 8
Northern Midlands 6.9 8 20 10.5 11 29.5 29 36 36 35 8 17 12 14 15
Sorell 21 21 21 21 21 42 42 40 40 40 21 21 7 7 39
Waratah-Wynyard 22 11 6 18 13 33 27 20 33 25 6 5 3 4 4
West Tamar 12 21 20 12 26 26 14 30 28 36 11 11 4 2.9 3
Group average 20.5 19.7 19.9 20.2 18.9 33.9 31.3 32.3 30.4 30.9 12.9 11.9 10.5 10.4 13.5
Small Councils
Break O'Day 12 14 10 14 19 22 28 28 25 29 8 7 4 10 7
Central Highlands 0 0 31 31 21 35 36 39 39 42 0 0 31 31 14
Circular Head 20 20 11.5 7 18 34 38 34.5 36 34 0 5 4.7 5 3
Dorset 15 15 15 10 14 30 30 30 30 28 21 21 21 15 16
Flinders 2 2 14 14 14 28 28 42 42 42 10 15 28 28 15
George Town 7 17 9 5 31 25 35 31 39 37 10 13 15 19 12
Glamorgan-Spring Bay 25 37 35 36 30 40 40 39 39 39 18 19 12 13 4
Kentish 7 28 30 30 30 21 35 38 38 40 10 10 10 10 12
King Island 7 22 6 12 7 35 34 26 39 38 9 2 2 1 2
Latrobe 30 22 14 14 14 35 29 35 35 36 14 14 14 14 24
Southern Midlands 25 23 17.83 20 22 36 38 30.36 36 34 14 14 14 16 15
Tasman 12 28 18 18 18 31 37 38 36 35 20 18 14 15 13
West Coast 28 28 28 28 28 28 28 28 28 28 7 7 7 7 7
Group average 14.6 19.7 18.4 18.4 20.5 30.8 33.5 33.8 35.5 35.5 10.8 11.2 13.6 14.2 11.1
State Average 18.0 20.5 20.3 20.2 20.2 32.2 33.2 33.6 33.8 34.4 13.6 12.4 12.9 12.6 12.5
Days to Obtain Approvals –
Discretionary Planning
Days to Obtain Approvals –
Buildings
Days to Obtain Approvals –
Permitted use Planning
2003-04 2004-052003-04 2004-05 2005-06 2006-07 2007-08 2005-06 2007-082006-072006-07 2007-08 2003-04 2004-05 2005-06

52
2003-04 2004-05 2005-06 2006-07 2007-08
Cities 22.3 27.0 30.0 28.3 24.3
Medium Councils 20.5 19.7 19.9 20.2 18.9
Small Councils 14.6 19.7 18.4 18.4 20.5
State Average 18.0 20.5 20.3 20.2 20.2
10.0
15.0
20.0
25.0
30.0
35.0
Days
Financial Year
Days to Obtain Approvals –
Permitted use Planning
2003-04 2004-05 2005-06 2006-07 2007-08
Cities 31.8 37.4 37.4 38.5 41.8
Medium Councils 33.9 31.3 32.3 30.4 30.9
Small Councils 30.8 33.5 33.8 35.5 35.5
State Average 32.2 33.2 33.6 33.8 34.4
27.0
29.0
31.0
33.0
35.0
37.0
39.0
41.0
43.0
Days
Financial Year
Days to Obtain Approvals –
Discretionary Planning
7
2003-04 2004-05 2005-06 2006-07 2007-08
Cities 24.8 18.0 17.9 14.0 14.4
Medium Councils 12.9 11.9 10.5 10.4 13.5
Small Councils 10.8 11.2 13.6 14.2 11.1
State Average 13.6 12.4 12.9 12.6 12.5
5.0
10.0
15.0
20.0
25.0
30.0
Days
Financial Year
Days to Obtain Approvals –
Buildings
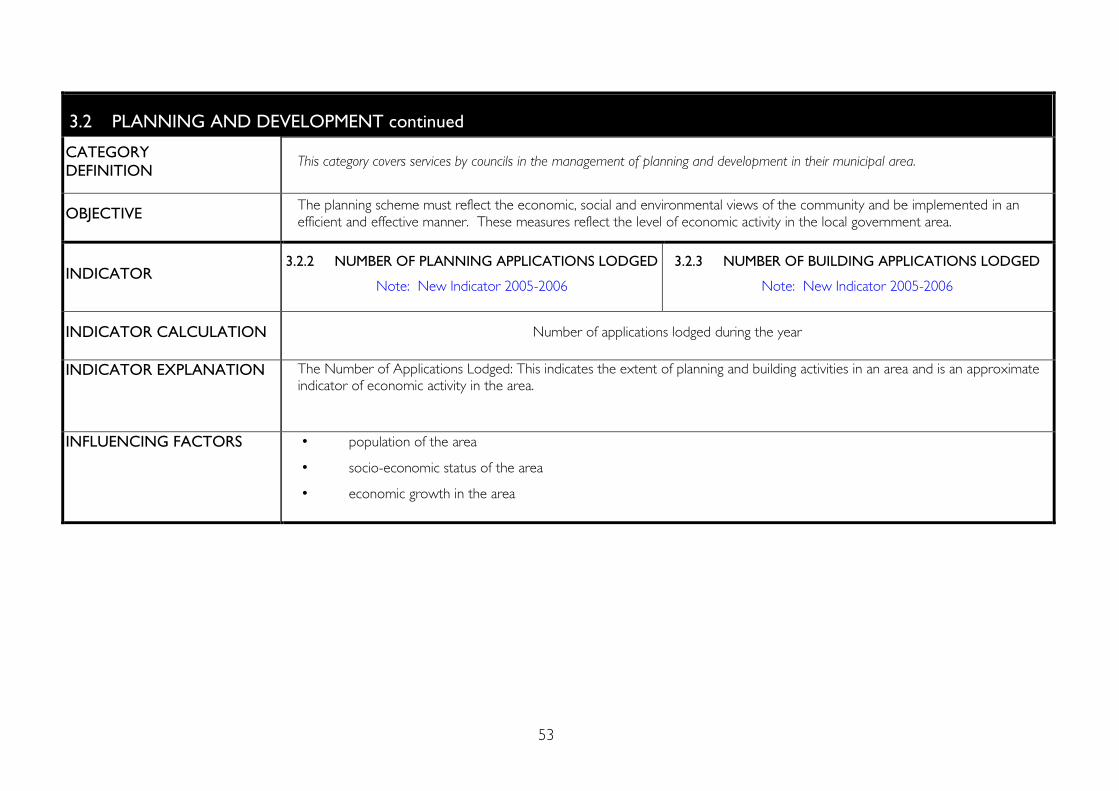
53
3.2 PLANNING AND DEVELOPMENT continued
CATEGORY
DEFINITION This category covers services by councils in the management of planning and development in their municipal area.
OBJECTIVE The planning scheme must reflect the economic, social and environmental views of the community and be implemented in an
efficient and effective manner. These measures reflect the level of economic activity in the local government area.
INDICATOR 3.2.2 NUMBER OF PLANNING APPLICATIONS LODGED
Note: New Indicator 2005-2006
3.2.3 NUMBER OF BUILDING APPLICATIONS LODGED
Note: New Indicator 2005-2006
INDICATOR CALCULATION Number of applications lodged during the year
INDICATOR EXPLANATION The Number of Applications Lodged: This indicates the extent of planning and building activities in an area and is an approximate
indicator of economic activity in the area.
INFLUENCING FACTORS • population of the area
• socio-economic status of the area
• economic growth in the area

54
Cities
Clarence 1,443 1,250 561 437 731 1,443 1,250 759 794 800
Glenorchy 940 881 382 380 405 940 881 520 522 448
Hobart 2,440 2,503 912 978 987 2,440 2,503 796 716 795
Launceston 2,099 1,678 707 728 728 2,099 1,678 1,022 1,063 1,030
Group average 1,731 1,578 641 631 713 1,731 1,578 774 774 768
Medium Councils
Brighton 860 819 403 472 457 860 819 360 332 349
Burnie 552 482 227 205 221 552 482 377 331 338
Central Coast 648 562 149 160 291 648 562 437 441 375
Derwent Valley 378 387 345 218 223 378 387 347 198 156
Devonport 539 286 205 274 236 539 286 188 377 294
Huon Valley 933 854 509 372 491 933 854 251 372 443
Kingborough 1,686 1,905 831 826 717 1,686 1,905 789 837 796
Meander Valley 671 755 312 321 336 671 755 386 359 403
Northern Midlands 776 630 311 341 373 776 630 264 308 306
Sorell 514 852 379 398 555 514 852 365 328 492
Waratah-Wynyard 658 489 280 240 286 658 489 233 224 281
West Tamar 732 697 181 216 289 732 697 456 456 505
Group average 746 727 344 337 373 746 727 371 380 395
Small Councils
Break O'Day 497 598 425 339 343 497 598 531 340 320
Central Highlands 337 234 152 127 179 337 234 112 93 130
Circular Head 264 259 136 153 195 264 259 152 171 139
Dorset 395 320 232 98 92 395 320 95 216 192
Flinders 99 67 51 43 53 99 67 41 39 40
George Town 213 324 307 150 144 213 324 164 201 148
Glamorgan-Spring Bay 610 519 289 244 308 610 519 211 220 236
Kentish 232 244 134 135 127 232 244 143 150 139
King Island 103 104 34 27 26 103 104 41 30 31
Latrobe 511 358 141 156 180 511 358 268 266 341
Southern Midlands 343 323 124 207 196 343 323 149 156 135
Tasman 193 243 94 95 110 193 243 104 108 94
West Coast 157 62 84 118 110 157 62 75 92 107
Group average 304 281 169 146 159 304 281 160 160 158
State Average 684 644 307 297 324 684 644 332 336 340
Number of Planning Applications Lodged *
2003-04 2004-05 2005-06 2006-07 2007-08
* Indicator changed 2005-2006. Figures for 2001-2002 to 2004-2005 include planning and building, and are not comparable with 2005-2006.
2004-05 2005-06 2006-07
Number of Building Applications Lodged *
2003-04 2007-08

55
KEY RESULT AREA
4 INFRASTRUCTURE AND UTILITIES
4.1 ROADS, FOOTPATHS AND TRAFFIC
CATEGORY
DEFINITION
This category contains information about those essential services that local government provides in Tasmania, including roads, water and sewerage
provision and waste management.
OBJECTIVE Safe roads and footpaths, efficient and accessible transport networks.
INDICATOR 4.1.1 RATIO OF TOTAL EXPENDITURE ON ROADS AND
FOOTPATHS TO DEPRECIATION 4.1.2 STATE OF THE ROADS AND FOOTPATHS ASSETS
INDICATOR
CALCULATION
Total capital and operational expenditure on roads and footpaths
Total depreciation expense of roads and footpaths
Written down value of roads and footpaths
Replacement value of roads
INDICATOR
EXPLANATION
Ratio of Total Expenditure on Roads and Footpaths to
Depreciation: Measures the actual expenditure on road assets as a
ratio of the depletion in the road assets reflected in the annual
depreciation charge.
State of the Assets: Measures the current condition of the asset base by
comparing the written down value with the current replacement value.
INFLUENCING
FACTORS
budgetary constraints
traffic volume and road usage
asset revaluation policies
asset capitalisation policies
maintenance policies
budgetary constraints
traffic volume and road usages
asset life/depreciation policies
asset revaluation policies
asset capitalisation policies
maintenance policies
number of new assets
% %

56
Cities
Clarence 110.1 124.7 103.8 143.4 65.5 57.3 55.7 56.5 53.0 51.8
Glenorchy 161.6 117.0 128.1 94.7 81.3 53.3 55.8 55.4 53.6 53.2
Hobart 49.7 58.8 65.0 65.3 90.3 69.2 66.8 64.6 62.7 61.6
Launceston 160.2 186.4 167.6 182.2 166.0 49.9 50.3 59.9 59.2 59.1
Group average 120.4 121.7 116.1 121.4 100.8 57.4 57.2 59.1 57.1 56.4
Medium Councils
Brighton 120.8 118.5 132.4 134.8 53.5 79.8 80.4 81.3 79.6 70.2
Burnie 79.3 132.4 126.4 120.3 130.4 46.7 58.9 57.8 55.2 53.8
Central Coast 134.7 144.9 134.9 119.6 127.9 67.8 69.1 66.8 65.4 68.9
Derwent Valley 120.9 141.6 103.8 99.8 117.3 56.2 54.7 54.1 53.1 53.2
Devonport 112.1 97.1 108.5 144.4 137.8 49.7 49.2 48.2 47.5 46.6
Huon Valley 146.9 129.1 165.5 195.6 246.4 41.0 39.9 40.4 41.2 53.8
Kingborough 142.2 139.0 113.0 87.5 116.9 59.6 59.2 59.2 57.5 57.1
Meander Valley 146.2 124.1 145.6 136.1 162.4 56.3 55.6 55.0 77.8 76.6
Northern Midlands 142.7 159.6 142.4 142.7 160.3 78.0 77.6 69.4 68.8 68.6
Sorell 68.7 68.8 56.1 64.5 77.7 59.4 55.1 56.5 54.0 54.9
Waratah-Wynyard 331.3 262.7 296.1 301.6 375.4 55.3 54.7 55.9 56.7 56.1
West Tamar 270.7 231.6 263.3 231.5 200.2 41.1 69.0 75.3 74.2 73.5
Group average 151.4 145.8 149.0 148.2 158.8 57.6 60.3 60.0 60.9 61.1
Small Councils
Break O'Day 136.4 241.0 197.4 194.1 236.8 55.3 51.7 69.8 68.4 65.4
Central Highlands 77.8 121.6 103.1 88.3 56.5 59.4 57.0 55.3 54.9 76.9
Circular Head 375.0 291.3 309.7 355.6 300.2 61.9 60.8 60.0 59.3 56.6
Dorset 117.7 90.2 109.2 129.0 95.2 65.1 63.6 62.2 43.1 42.0
Flinders 43.0 52.4 61.9 59.1 63.1 50.8 46.4 47.3 48.8 43.7
George Town 149.4 91.4 67.8 119.8 133.5 35.2 72.1 72.9 72.7 72.9
Glamorgan-Spring Bay 118.8 133.3 97.3 73.5 76.5 68.1 66.2 73.2 71.9 57.7
Kentish 133.3 152.5 177.4 158.2 90.9 52.5 43.3 50.0 44.2 54.0
King Island 112.0 137.9 138.0 186.9 178.3 22.2 62.0 62.1 61.5 65.1
Latrobe 195.5 187.8 180.0 165.9 346.4 51.0 49.7 50.0 50.1 59.4
Southern Midlands 105.8 139.0 217.1 137.9 101.0 59.5 55.4 53.8 55.1 55.9
Tasman 159.1 132.1 175.4 159.5 88.8 33.8 42.0 41.0 43.5 50.5
West Coast 96.3 103.2 503.4 389.9 345.4 59.1 55.8 55.4 58.9 58.0
Group average 140.0 144.1 179.8 170.6 162.5 51.8 55.8 57.9 56.3 58.3
State Average 142.0 141.7 158.3 154.5 152.5 55.0 57.9 58.9 58.3 59.2
% % % %
State of the Assets
Roads and Footpaths
Ratio of Total Expenditure
Roads and Footpaths to Depreciation
2003-04 2004-05 2005-06 2006-07 2007-08 2007-08
%
2003-04
% %
2004-05
%
2005-06 2006-07
% %

57
2003-04 2004-05 2005-06 2006-07 2007-08
Cities 120.4 121.7 116.1 121.4 100.8
Medium Councils 151.4 145.8 149.0 148.2 158.8
Small Councils 140.0 144.1 179.8 170.6 162.5
State Average 142.0 141.7 158.3 154.5 152.5
0.0
20.0
40.0
60.0
80.0
100.0
120.0
140.0
160.0
180.0
200.0
Ratio
Financial Year
Ratio of Total Expenditure
Roads and Footpaths to Depreciation
2003-04 2004-05 2005-06 2006-07 2007-08
Cities 57.4 57.2 59.1 57.1 56.4
Medium Councils 57.6 60.3 60.0 60.9 61.1
Small Councils 51.8 55.8 57.9 56.3 58.3
State Average 55.0 57.9 58.9 58.3 59.2
46.0
48.0
50.0
52.0
54.0
56.0
58.0
60.0
62.0
Ratio
Financial Year
State of the Assets
Roads and Footpaths

58
4.1 ROADS, FOOTPATHS AND TRAFFIC continued
CATEGORY
DEFINITION
This category contains information about those essential services that local government provides in Tasmania, including roads, water and sewerage
provision and waste management.
OBJECTIVE Safe roads and footpaths, efficient and accessible transport networks.
INDICATOR
4.1.3 EXPENDITURE PER KILOMETRE OF SEALED ROAD
(CAPITAL / MAINTENANCE)
4.1.4 EXPENDITURE PER KILOMETRE OF UNSEALED ROAD
(CAPITAL / MAINTENANCE)
INDICATOR
CALCULATION
Total capital and maintenance expenditure on sealed roads and
footpaths
Number of kilometres of sealed roads in council area
Total capital and maintenance expenditure on unsealed roads and
footpaths
Number of kilometres of unsealed roads in council area
INDICATOR
EXPLANATION
Expenditure per Kilometre of Sealed Road: This measure provides an
indicator of maintaining and renewing the sealed road asset.
Expenditure per Kilometre of Unsealed Road: This measure
provides an indicator of maintaining and renewing the unsealed
road asset.
INFLUENCING
FACTORS
topography and terrain
traffic volume and road usage
road types and specification
state of the road assets
maintenance and accounting policies
major works
topography and terrain
traffic volume and road usage
road types and specification
state of the road assets
maintenance and accounting policies
major works

59
Cities
Clarence 6,642 4,136 4,838 10,179 5,317 4,229 5,358 7,692 9,145 5,915
Glenorchy 13,492 13,288 8,617 12,772 14,069 4,706 6,402 5,294 5,556 4,833
Hobart 11,774 10,769 11,949 14,425 11,223 7,812 6,625 11,667 11,667 12,467
Launceston 8,508 9,930 8,750 12,778 13,070 3,253 5,383 3,464 3,357 4,592
Group average 10,104 9,531 8,539 12,538 10,920 5,000 5,942 7,029 7,431 6,952
Medium Councils
Brighton 7,581 7,856 8,554 8,349 6,290 3,237 1,745 2,119 2,495 2,910
Burnie 6,140 12,567 8,718 10,576 9,231 1,566 2,736 9,732 4,036 3,946
Central Coast 5,405 6,548 6,166 5,838 6,574 2,678 2,038 2,215 2,574 3,412
Derwent Valley 12,798 12,963 7,025 11,972 14,525 1,400 1,847 1,972 935 1,264
Devonport 8,854 6,988 8,139 13,019 10,223 2,548 2,718 2,718 3,109 4,398
Huon Valley 6,786 8,205 18,433 20,325 29,227 2,277 1,882 1,295 1,927 1,793
Kingborough 15,537 12,607 10,482 11,985 19,255 4,866 6,006 4,422 4,762 4,534
Meander Valley 4,883 3,107 4,437 5,019 6,104 1,485 2,266 2,598 2,446 2,506
Northern Midlands 3,445 4,307 4,157 4,531 5,742 1,480 1,382 1,587 1,145 1,574
Sorell 7,401 7,402 9,017 7,002 6,016 4,654 4,438 3,117 4,022 4,965
Waratah-Wynyard 10,850 8,531 9,247 10,548 14,588 2,246 2,872 5,184 3,143 3,774
West Tamar 7,460 6,708 9,063 7,250 8,726 3,692 3,127 3,389 6,803 6,512
Group average 8,095 8,149 8,620 9,701 11,375 2,677 2,755 3,362 3,116 3,466
Small Councils
Break O'Day 5,573 9,880 5,224 6,494 4,097 1,400 1,213 2,141 1,608 2,369
Central Highlands 7,112 2,763 1,967 3,813 4,384 806 1,071 1,350 2,123 1,189
Circular Head 10,279 5,027 8,490 8,447 8,583 2,980 3,136 2,870 3,346 3,665
Dorset 9,007 4,756 4,006 4,302 3,604 1,609 1,890 1,858 1,743 2,386
Flinders 1,991 2,959 4,080 4,099 5,942 1,117 1,215 1,266 1,229 1,024
George Town 6,401 6,158 3,459 5,357 7,114 1,685 1,600 1,671 5,167 2,390
Glamorgan-Spring Bay 2,118 3,538 3,425 3,125 3,767 1,125 1,679 2,060 1,209 795
Kentish 1,137 1,226 5,017 3,879 4,959 3,425 4,803 3,191 3,034 2,400
King Island 2,816 6,869 7,879 14,345 9,165 1,832 1,724 1,372 1,175 1,532
Latrobe 3,850 4,497 3,903 6,880 7,831 5,305 6,265 6,568 4,293 6,351
Southern Midlands 6,340 7,555 7,172 4,476 4,070 1,394 1,609 4,021 3,550 2,508
Tasman 3,917 4,967 3,150 5,850 2,304 3,054 2,619 4,966 3,667 2,025
West Coast 1,853 5,372 7,124 20,080 19,860 2,206 1,720 20,982 5,842 4,133
Group average 4,800 5,044 4,992 7,011 6,591 2,149 2,349 4,178 2,922 2,521
State Average 6,895 6,947 6,982 8,887 9,168 2,761 3,013 4,234 3,624 3,523
Expenditure per Kilometre of Sealed Road
(Capital/Maintenance)
Expenditure per Kilometre of Unsealed Road
(Capital/Maintenance)
$
2003-04 2004-05
$
2005-06
$
2006-07
$
2007-08
$
2003-04
$
2004-05
$
2007-08
$
2005-06
$
2006-07
$

60
2003-04 2004-05 2005-06 2006-07 2007-08
Cities 10,104 9,531 8,539 12,538 10,920
Medium Councils 8,095 8,149 8,620 9,701 11,375
Small Councils 4,800 5,044 4,992 7,011 6,591
State Average 6,895 6,947 6,982 8,887 9,168
0
2,000
4,000
6,000
8,000
10,000
12,000
14,000
Do
llars
Financial Year
Expenditure per Kilometre of Sealed Road
(Capital/Maintenance)
2003-04 2004-05 2005-06 2006-07 2007-08
Cities 5,000 5,942 7,029 7,431 6,952
Medium Councils 2,677 2,755 3,362 3,116 3,466
Small Councils 2,149 2,349 4,178 2,922 2,521
State Average 2,761 3,013 4,234 3,624 3,523
0
2,000
4,000
6,000
8,000
10,000
12,000
14,000
Do
llars
Financial Years
Expenditure per Kilometre of Unsealed Road
(Capital/Maintenance)

61
4.2 WATER
CATEGORY
DEFINITION
This category contains information about those essential services that local government provides in Tasmania, including roads, water and sewerage
provision and waste management.
OBJECTIVE The reliable provision of a continuous supply of safe drinking water, and equitable pricing.
INDICATOR 4.2.1 OUTCOME OF WATER QUALITY
TESTS
4.2.2 NUMBER OF BREAKS IN
RETICULATION SYSTEMS per 100 kms
4.2.3 AVERAGE NUMBER OF DAYS
OF WATER RESTRICTIONS
INDICATOR
CALCULATION
Number of
water quality tests that met standard
Number of water quality tests conducted
Number of breaks in water mains
Per 100 Kilometres of water mains
Total number of days of water restrictions
(all schemes)
Total number of schemes
INDICATOR
EXPLANATION
Outcome of Water Quality Tests: Measures
the extent to which water provided by
councils meets accepted environmental
standards.
Number of Breaks in Reticulation Systems:
This is an indication of the condition and
reliability of the systems.
Average Number of Days of Water
Restrictions: This measure provides an
indication of the capacity and reliability
of water systems. May also reflect
council policy on the quantity of water
pre-purchased from a supplier.
INFLUENCING
FACTORS
standard of installed infrastructure
major systems failures
weather interference
lack of compliance with regulations
age and state of the asset
original infrastructure specifications
maintenance/replacement policies
topography and soil types
capacity of installed systems
user pays and metering policies
seasonal population and demand
changes
weather patterns
%

62
Cities
Clarence 100.0 97.3 97.8 99.0 98.7 60.5 38.5 31.3 57.3 100.4 122 0 0 0 0
Glenorchy 98.2 98.7 98.6 98.7 100.0 4.4 4.9 30.7 41.8 47.3 122 0 0 73 0
Hobart 93.8 93.8 100.0 100.0 100.0 23.9 27.0 26.3 32.0 31.6 117 0 0 25 0
Launceston 92.8 99.4 92.4 99.2 99.7 0.0 17.1 24.0 26.6 20.7 0 0 0 0 0
Group average 96.2 97.3 97.2 99.2 99.6 22.2 21.9 28.1 39.4 50.0 90 0 0 33 0
Medium Councils
Brighton 96.4 89.9 94.0 96.4 99.4 0.0 0.0 41.5 39.6 34.6 0 0 0 0 0
Burnie 100.0 100.0 100.0 100.0 100.0 3.1 2.5 3.0 8.0 6.0 0 0 0 0 0
Central Coast 98.9 100.0 99.5 99.8 99.5 22.5 11.5 8.3 15.0 7.3 0 0 0 0 0
Derwent Valley 97.3 97.4 99.0 100.0 100.0 85.0 0.0 25.8 14.2 18.3 122 103 0 8 0
Devonport 100.0 98.4 98.3 51.6 100.0 3.4 7.9 1.7 3.9 2.2 0 0 0 0 0
Huon Valley 86.8 72.2 99.0 97.9 99.0 61.1 62.2 54.0 50.5 39.8 109 120 0 10 20
Kingborough 95.8 97.4 87.1 92.8 92.8 5.0 5.3 7.2 7.2 3.2 122 0 0 0 0
Meander Valley 94.4 97.1 94.4 93.6 87.6 22.6 11.1 7.6 6.1 5.0 0 70 2 20 13
Northern Midlands 76.4 99.2 90.1 92.1 96.3 NA NA NA UA 59.7 10 23 4 6 4
Sorell 100.0 100.0 97.4 97.4 100.0 42.9 44.4 28.6 25.0 23.8 0 0 0 0 0
Waratah-Wynyard 99.3 98.7 99.2 99.3 84.0 5.7 0.0 7.2 7.1 9.4 0 0 0 0 0
West Tamar 100.0 100.0 100.0 100.0 100.0 60.4 70.4 52.7 102.8 84.5 0 0 0 0 0
Group average 95.4 95.9 96.5 93.4 96.6 28.3 19.6 21.6 25.4 24.5 30 26 3 11 12
Small Councils
Break O'Day 78.4 96.3 93.3 80.5 78.0 14.3 10.6 8.1 6.6 7.3 4 2 0 3 0
Central Highlands 79.8 82.4 79.3 86.4 77.1 61.5 88.5 192.3 192.3 144.6 0 0 0 30 61
Circular Head 99.7 98.4 99.7 101.6 31.0 27.8 51.9 9.3 0.0 24.1 0 0 0 0 0
Dorset 82.8 90.8 90.8 86.7 84.0 3.0 2.2 4.4 3.7 5.9 58 103 9 16 13
Flinders 0.0 31.2 94.6 100.0 90.0 23.8 23.8 28.6 23.8 38.1 0 0 0 60 0
George Town 100.0 100.0 100.0 100.0 100.0 24.2 37.1 51.4 58.6 18.4 0 0 0 0 0
Glamorgan-Spring Bay 98.8 99.0 85.2 22.9 99.2 25.6 26.4 84.1 67.5 54.8 63 365 41 73 73
Kentish 100.0 100.0 100.0 100.0 100.0 28.0 36.0 28.0 44.7 26.3 0 0 0 0 0
King Island 100.0 91.5 97.9 100.0 100.0 55.6 33.3 22.2 11.1 0.0 93 90 45 45 45
Latrobe 42.1 87.4 100.0 98.0 100.0 35.9 31.4 19.6 7.6 13.7 0 0 0 0 0
Southern Midlands 100.0 100.0 92.7 97.3 98.9 15.8 18.6 13.7 16.7 60.8 30 0 0 33 50
Tasman NA NA NA NA NA NA NA NA NA NA NA NA NA NA NA
West Coast 3.7 2.4 96.3 98.0 100.0 143.2 112.5 127.3 127.3 151.8 0 0 0 0 0
Group average 73.8 81.6 94.2 89.3 88.2 38.2 39.4 49.1 46.7 45.5 21 47 32 37 48
State Average 86.3 90.0 95.6 92.5 93.4 31.8 28.7 34.8 36.9 37.1 35 31 20 31 35
Outcome of Water Quality TestsNumber of Breaks in
Reticulation System per 100 km
Number of Days of Water
Restrictions
2003-042007-08 2004-05 2006-072005-06 2007-082007-08
%
2003-04 2004-05 2005-06 2006-072006-07
%%
2005-06
%
2004-05
%
2003-04

63
2003-04 2004-05 2005-06 2006-07 2007-08
Cities 96.2 97.3 97.2 99.2 99.6
Medium Councils 95.4 95.9 96.5 93.4 96.6
Small Councils 73.8 81.6 94.2 89.3 88.2
State Average 86.3 90.0 95.6 92.5 93.4
0.0
10.0
20.0
30.0
40.0
50.0
60.0
70.0
80.0
90.0
100.0
Percen
tag
e
Financial Year
Outcome of Water Quality Tests
2003-04 2004-05 2005-06 2006-07 2007-08
Cities 22.2 21.9 28.1 39.4 50.0
Medium Councils 28.3 19.6 21.6 25.4 24.5
Small Councils 38.2 39.4 49.1 46.7 45.5
State Average 31.8 28.7 34.8 36.9 37.1
0.0
10.0
20.0
30.0
40.0
50.0
60.0
70.0
80.0
90.0
100.0
No
o
f Break
s
Financial Year
Number of Breaks in
Reticulation System per 100 km
2003-04 2004-05 2005-06 2006-07 2007-08
Cities 90.3 0.0 0.0 32.6 0.0
Medium Councils 30.3 26.3 2.7 10.8 12.4
Small Councils 20.7 46.7 31.8 37.1 48.4
State Average 34.7 31.3 20.2 30.8 34.9
0.0
10.0
20.0
30.0
40.0
50.0
60.0
70.0
80.0
90.0
100.0
No
of D
ays
Financial Year
Number of Days of Water Restrictions

64
4.2 WATER continued
CATEGORY
DEFINITION
This category contains information about those essential services that local government provides in Tasmania, including roads, water and sewerage
provision and waste management.
OBJECTIVE The reliable provision of a continuous supply of safe drinking water, and equitable pricing.
INDICATOR 4.2.4 UNIT COST PER KILOLITRE
4.2.5 AVERAGE WATER
CONSUMPTION PER CONNECTION 4.2.6 WATER SYSTEM LOSS
INDICATOR
CALCULATION
Total operating water expenses
Total volume of water purchased
Total number of kilolitres (Kl) supplied
Number of connections
Water purchased – water used
Total volume of water purchased
INDICATOR
EXPLANATION
Unit Cost per Kilolitre: This measures the
cost to council of providing water to the
community.
Average Water Consumption per
Connection: This measures average water
consumption per annum by the
community. It includes water used on
public parks and gardens.
Water System Loss: This indicates
system integrity, but measurement will
require universal metering.
INFLUENCING
FACTORS
distance and quality of water supply
size and density of population served
topography of area
seasonal and rural demand
depreciation and maintenance policies
cost allocation policies
system capacity and use of restrictions
user-pays and metering policies
weather patterns
level of industrial usage
seasonal population changes
un-metered usage
system leaks
evaporation
illegal connections/damage
accuracy of meters
%

65
Cit ies
Clarence 0.84 0.88 0.96 0.90 1.04 432.8 424.8 410.4 444.2 433.1 UA NA NA 0.0
Glenorchy 0.70 0.82 0.99 0.88 0.93 554.9 554.7 472.6 526.5 515.3 UA UA UA UA
Hobart 0.79 0.84 0.92 0.90 1.00 508.9 532.9 446.5 459.4 471.8 UA 0.0 0.0 0.0
Launceston 1.19 1.20 1.29 1.17 1.33 354.9 377.7 349.6 376.0 353.4 23.5 13.6 22.7 20.1
Group average 0.88 0.93 1.04 0.96 1.07 462.9 472.5 419.8 451.5 443.4 23.5 6.8 11.4 6.7
Medium Councils
Brighton 1.65 1.65 0.92 0.85 0.79 302.1 284.0 293.1 337.7 324.8 UA 9.2 8.1 11.6
Burnie 0.45 0.84 0.94 0.89 0.91 585.8 425.2 362.8 363.8 436.7 UA UA UA UA
Central Coast 0.68 0.65 0.75 0.82 0.87 586.4 629.3 603.4 559.6 491.9 UA UA UA UA
Derwent Valley 1.21 1.27 1.53 1.49 1.61 450.4 494.1 377.2 426.3 396.9 UA UA UA UA
Devonport 0.95 0.97 1.10 1.10 1.23 473.2 462.9 403.6 418.4 384.1 15.2 19.4 15.8 12.5
Huon Valley 0.40 0.44 0.43 0.37 0.37 666.7 632.3 604.2 597.9 691.6 UA UA UA UA
Kingborough 0.78 0.82 0.87 0.92 0.98 404.5 383.3 377.4 392.4 396.9 UA UA UA UA
Meander Valley 2.13 0.78 0.82 0.82 0.85 240.7 309.4 330.4 373.9 350.9 24.3 19.3 20.6 19.9
Northern Midlands 0.44 0.43 0.81 0.65 0.79 UA UA 443.7 420.7 373.7 UA 33.5 47.4 38.8
Sorell 0.72 0.95 0.84 1.77 1.60 391.1 411.2 360.5 417.4 397.8 11.0 0.0 0.0 0.0
Waratah-Wynyard 1.03 1.05 0.98 0.91 1.09 404.1 387.7 367.4 442.4 434.0 0.0 UA UA UA
West Tamar 1.06 ‡ 2.29 1.09 0.99 1.08 281.8 295.3 261.7 331.1 298.3 15.1 12.7 15.4 17.4
Group average 0.96 0.90 0.92 0.96 1.01 435.2 428.6 398.8 423.5 414.8 13.1 15.7 17.9 16.7
Small Councils
Break O'Day 0.76 1.13 1.15 1.04 1.66 301.4 232.7 240.2 279.7 196.9 6.2 17.0 14.6 4.2
Central Highlands 0.00 0.72 1.17 0.91 1.010.0
617.0 448.0 523.7 453.4 UA UA 0.7 21.4
Circular Head 0.75 0.75 0.79 0.82 0.85 743.4 746.9 708.3 723.2 624.3 UA 4.0 11.5 11.1
Dorset 0.90 1.38 1.63 1.94 1.90 289.3 245.9 147.7 217.5 204.0 14.9 UA UA UA
Flinders 0.53 0.60 0.63 0.15 0.10 318.3 306.6 328.8 882.2 1,892.5 UA 0.0 0.0 0.0
George Town 0.88 1.09 1.17 1.26 1.20 313.1 273.8 273.0 287.5 317.9 37.7 7.4 25.5 37.4
Glamorgan-Spring Bay 1.85 1.88 1.81 1.46 2.13 179.1 176.6 214.5 247.5 224.2 UA UA 35.1 30.2
Kentish 1.07 1.14 1.46 1.04 1.24 320.8 342.9 269.2 332.2 258.8 UA 0.2 0.4 0.2
King Island 0.90 1.25 1.57 1.49 1.77 335.8 311.6 253.9 259.0 242.0 UA 55.6 55.6 2.6
Latrobe 1.04 0.93 1.00 1.02 1.15 354.7 378.4 339.7 353.6 268.9 UA UA UA UA
Southern Midlands 0.91 1.18 1.31 0.94 0.86 364.8 304.4 333.6 547.2 524.9 UA 3.5 26.1 24.1
Tasman NA NA NA NA NA NA NA NA NA NA NA NA NA NA
West Coast 0.77 0.58 0.60 0.64 0.64 452.2 518.5 449.4 449.4 449.4 10.0 UA UA UA
Group average 0.86 1.05 1.19 1.06 1.21 331.1 371.3 333.9 425.2 471.4 17.2 12.5 18.8 14.6
State Average 0.91 0.97 1.05 1.00 1.11 393.0 409.6 374.0 428.2 443.2 15.8 13.0 17.6 14.0
‡ West Tamar Council - The comparative adjusted unit cost for West Tamar is $1.00 after allowing for $$2.$2.898M asset write-off.
† Data not collected 2004-05.
Unit Cost Per KilolitreAverage Water Consumption per
ConnectionWater System Loss †
%
2007-08
%%
2005-06 2006-07
%
2004-052006-07
Kl
2005-06
Kl %
2007-08
Kl
2003-042004-05
Kl
2003-04
Kl
2007-08
$
2006-07
$
2003-04
$
2005-06
$
2004-05
$

66
2003-04 2004-05 2005-06 2006-07 2007-08
Cities 0.88 0.93 1.04 0.96 1.07
Medium Councils 0.96 0.90 0.92 0.96 1.01
Small Councils 0.86 1.05 1.19 1.06 1.21
State Average 0.91 0.97 1.05 1.00 1.11
0.60
0.70
0.80
0.90
1.00
1.10
1.20
1.30
Co
st
Financial Year
Unit Cost Per Kilolitre
2003-04 2004-05 2005-06 2006-07 2007-08
Cities 462.9 472.5 419.8 451.5 443.4
Medium Councils 435.2 428.6 398.8 423.5 414.8
Small Councils 331.1 371.3 333.9 425.2 471.4
State Average 393.0 409.6 374.0 428.2 443.2
300.0
320.0
340.0
360.0
380.0
400.0
420.0
440.0
460.0
480.0
500.0
Averag
e
Financial Year
Average Water Consumption per Connection

67
4.3 SEWERAGE AND DRAINAGE
CATEGORY
DEFINITION
This category contains information about those essential services that local government provides in Tasmania, including roads, water and sewerage
provision and waste management.
OBJECTIVE Reliable sewerage systems with efficient and effective operations and environmentally acceptable treatment.
INDICATOR 4.3.1 NUMBER OF NOTIFIABLE INCIDENTS (SEWERAGE) 4.3.2 AVERAGE COST PER SEWERAGE CONNECTION
INDICATOR
CALCULATION
Number of notifiable incidents
(reported to the Department of Primary Industries, and Water)
eg, Pump and pipe failure, rain incidents, etc.
Total operating expenses of sewerage system
Number of connections
INDICATOR
EXPLANATION
Notifiable Incidents: Measures the reliability of the sewerage systems. Average Cost per Sewerage Connection: Measures the average
cost of providing a sewerage service, including disposal, to a
property.
INFLUENCING
FACTORS
standard of installed structure
major systems failures
weather/natural interference
lack of compliance with regulations
scale of operations
age and condition of infrastructure
number of pumping stations
distance from plant and level of treatment required
size and density of population served
topography of reticulation area
use of combined stormwater and sewerage systems
cost allocation policies
depreciation and maintenance policies
operational difficulties

68
Cities
Clarence 4 4 1 4 2 356 384 471 468 506
Glenorchy 5 10 4 7 4 193 209 198 197 211
Hobart 7 5 12 9 21 301 312 346 364 412
Launceston 79 34 38 31 34 499 518 563 407 565
Group average 24 13 14 13 15 337 356 395 359 423
Medium Councils
Brighton 5 5 10 5 2 350 305 226 226 197
Burnie 7 11 5 9 5 258 361 309 319 380
Central Coast 5 4 13 8 10 286 295 293 325 287
Derwent Valley 0 0 0 0 0 316 331 410 410 372
Devonport 24 10 27 24 5 401 403 344 363 378
Huon Valley 1 0 1 1 3 318 324 815 579 324
Kingborough 0 3 3 2 2 403 408 436 458 469
Meander Valley 0 0 1 0 3 164 198 197 239 243
Northern Midlands 0 1 2 4 4 276 295 378 325 357
Sorell 1 2 0 0 0 108 519 211 390 390
Waratah-Wynyard 0 0 2 9 1 302 298 399 359 653
West Tamar 20 9 3 0 2 166 226 236 250 270
Group average 5 4 6 5 3 279 330 354 353 360
Small Councils
Break O'Day 2 1 0 0 0 188 204 231 229 267
Central Highlands 0 0 0 0 0 256 242 547 257 257
Circular Head 0 0 0 0 1 489 455 425 453 550
Dorset 0 0 0 0 0 351 348 267 202 316
Flinders NA NA NA NA NA NA NA NA NA NA
George Town 0 0 0 0 1 406 384 431 467 305
Glamorgan-Spring Bay 3 3 2 0 0 299 274 354 237 295
Kentish 0 0 0 0 2 365 246 1000 949 791
King Island 0 0 0 0 0 213 321 440 332 384
Latrobe 3 2 4 1 1 212 199 297 228 303
Southern Midlands 1 1 1 0 0 191 180 222 231 238
Tasman NA NA NA NA NA NA NA NA NA NA
West Coast 0 1 0 0 0 275 258 237 253 296
Group average 1 1 1 0 0 295 283 371 349 364
State Average 6 4 4 4 4 294 315 367 353 371
2005-06
$
2005-06 2006-07 2007-08
No.
2003-04
$
2006-07
$
Number of Notifiable Incidents (Sewerage) Average Cost per Sewerage Connection
No. No. No. No.
2003-04 2004-05 2007-08
$
2004-05
$

69
2003-04 2004-05 2005-06 2006-07 2007-08
Cities 24 13 14 13 15
Medium Councils 5 4 6 5 3
Small Councils 1 1 1 0 0
State Average 6 4 4 4 4
-5
0
5
10
15
20
25
30
No
of In
cid
en
ts
Financial Year
Number of Notifiable Incidents (Sewerage)
2003-04 2004-05 2005-06 2006-07 2007-08
Cities 337 356 395 359 423
Medium Councils 279 330 354 353 360
Small Councils 295 283 371 349 364
State Average 294 315 367 353 371
240
260
280
300
320
340
360
380
400
420
440
Co
st
Financial Year
Average Cost per Sewerage Connection

70
4.4 WASTE MANAGEMENT
CATEGORY
DEFINITION
This category contains information about those essential services that local government provides in Tasmania, including roads, water and sewerage
provision and waste management.
OBJECTIVE Reliable waste management system with efficient and effective operations and environmentally acceptable treatment.
INDICATOR 4.4.1 AVERAGE COST OF WASTE MANAGEMENT PER
PROPERTY
4.4.2 AVERAGE COST OF WASTE MANAGEMENT PER
CAPITA
INDICATOR
CALCULATION
Total operating expenses of waste management
Number rateable properties.
Total operating expenses of waste management
Population of council area
INDICATOR
EXPLANATION
Average Cost of Waste Management per property: This indicates
the average cost of waste management services provided per
property..
Average Cost of Waste Management per Capita: This indicates
the average cost of waste management services provided per
head of population. It provides an indication of the scale of the
waste management operations.
INFLUENCING
FACTORS
type and scale of available disposal facilities
type of recycling services provided
frequency and volume allowance for garbage collection
density of population and distance from disposal facility
industrial users of waste management facilities
cost allocation policies
amount of waste received from outside the municipal area
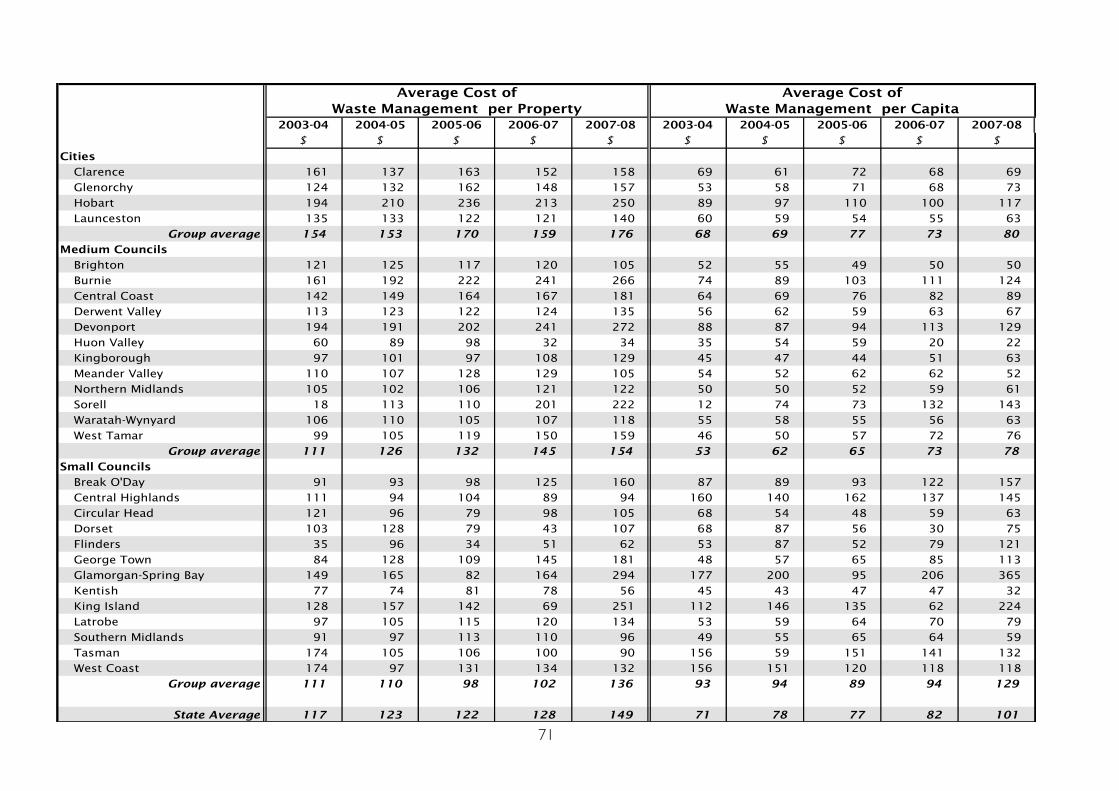
71
Cities
Clarence 161 137 163 152 158 69 61 72 68 69
Glenorchy 124 132 162 148 157 53 58 71 68 73
Hobart 194 210 236 213 250 89 97 110 100 117
Launceston 135 133 122 121 140 60 59 54 55 63
Group average 154 153 170 159 176 68 69 77 73 80
Medium Councils
Brighton 121 125 117 120 105 52 55 49 50 50
Burnie 161 192 222 241 266 74 89 103 111 124
Central Coast 142 149 164 167 181 64 69 76 82 89
Derwent Valley 113 123 122 124 135 56 62 59 63 67
Devonport 194 191 202 241 272 88 87 94 113 129
Huon Valley 60 89 98 32 34 35 54 59 20 22
Kingborough 97 101 97 108 129 45 47 44 51 63
Meander Valley 110 107 128 129 105 54 52 62 62 52
Northern Midlands 105 102 106 121 122 50 50 52 59 61
Sorell 18 113 110 201 222 12 74 73 132 143
Waratah-Wynyard 106 110 105 107 118 55 58 55 56 63
West Tamar 99 105 119 150 159 46 50 57 72 76
Group average 111 126 132 145 154 53 62 65 73 78
Small Councils
Break O'Day 91 93 98 125 160 87 89 93 122 157
Central Highlands 111 94 104 89 94 160 140 162 137 145
Circular Head 121 96 79 98 105 68 54 48 59 63
Dorset 103 128 79 43 107 68 87 56 30 75
Flinders 35 96 34 51 62 53 87 52 79 121
George Town 84 128 109 145 181 48 57 65 85 113
Glamorgan-Spring Bay 149 165 82 164 294 177 200 95 206 365
Kentish 77 74 81 78 56 45 43 47 47 32
King Island 128 157 142 69 251 112 146 135 62 224
Latrobe 97 105 115 120 134 53 59 64 70 79
Southern Midlands 91 97 113 110 96 49 55 65 64 59
Tasman 174 105 106 100 90 156 59 151 141 132
West Coast 174 97 131 134 132 156 151 120 118 118
Group average 111 110 98 102 136 93 94 89 94 129
State Average 117 123 122 128 149 71 78 77 82 101
$ $
2004-05 2005-06 2006-07 2007-08
Average Cost of
Waste Management per Property
Average Cost of
Waste Management per Capita
$ $ $ $ $ $$ $
2003-04 2004-05 2006-07 2003-042005-06 2007-08

72
2003-04 2004-05 2005-06 2006-07 2007-08
Cities 154 153 170 159 176
Medium Councils 111 126 132 145 154
Small Councils 111 110 98 102 136
State Average 117 123 122 128 149
0
20
40
60
80
100
120
140
160
180
200
Co
st p
er P
ro
perty
Financial Year
Average Cost of
Waste Management per Property
2003-04 2004-05 2005-06 2006-07 2007-08
Cities 68 69 77 73 80
Medium Councils 53 62 65 73 78
Small Councils 93 94 89 94 129
State Average 71 78 77 82 101
0
10
20
30
40
50
60
70
80
90
100
110
120
130
140
Co
st p
er C
ap
ita
Financial Year
Average Cost of
Waste Management per Capita

73
KEY RESULT AREA
5 COMMUNITY SERVICES AND DEVELOPMENT
5.1 SOCIAL AND COMMUNITY SERVICES
5.2 RECREATION AND CULTURE FACILITIES
CATEGORY
DEFINITION
Councils maintain a variety of policies, services, programs and facilities to assist community members to maximise quality of life.
OBJECTIVE Informed community (on council objectives, strategies and policies).
Community input into the development of policy and plans.
Access to council programs and services.
INDICATOR
5.1.1 SOCIAL AND COMMUNITY SERVICES EXPENDITURE
PER CAPITA
5.2.1 RECREATIONAL AND CULTURAL FACILITIES
EXPENDITURE PER CAPITA
INDICATOR
CALCULATION
Total social and community services expenditure
Population of council area
Total recreational and cultural facilities expenditure
Population of council area
INDICATOR
EXPLANATION
Social and Community Services Expenditure per Capita:
Measures the level of spending on social and community services
and programs. These include nursing homes, family day care and
childcare.
Recreational and Cultural Facilities Expenditure per Capita:
Measures the level of spending on recreational and cultural facilities
in an area. This includes expenditure on halls and civic centres, parks
and reserves, and sports facilities.
INFLUENCING
FACTORS
range of services and programs provided
budgetary constraints and council priorities
age profile of population (different demands on services)
cost allocation policies
range of services provided by others
range of facilities and services provided
provision for users outside of council area (regional facilities)
budgetary constraints and council priorities
depreciation and maintenance policies
age profile of population (different demands on services)
cost allocation policies

74
Cities
Clarence 47 50 48 53 57 74 91 93 88 89
Glenorchy 106 104 99 100 108 89 95 98 101 90
Hobart 35 41 60 58 55 309 337 393 400 428
Launceston 6 5 6 5 6 229 245 259 255 260
Group average 49 50 53 54 56 175 192 211 211 217
Medium Councils
Brighton 37 43 20 4 0 50 48 57 58 55
Burnie 86 107 124 147 162 186 247 277 251 257
Central Coast 54 52 60 66 81 101 119 127 129 146
Derwent Valley 85 85 93 89 81 103 112 103 86 110
Devonport 13 13 7 10 15 161 189 181 191 211
Huon Valley 222 177 305 323 387 19 38 26 48 67
Kingborough 42 44 40 35 33 95 92 109 106 115
Meander Valley 3 0 4 4 5 34 67 63 63 73
Northern Midlands 31 39 37 35 41 63 74 71 84 86
Sorell 46 108 98 88 56 18 22 33 34 32
Waratah-Wynyard 49 60 61 63 62 81 84 93 110 86
West Tamar 0 0 5 6 7 72 62 71 87 95
Group average 56 61 71 72 77 82 96 101 104 111
Small Councils
Break O'Day 0 0 0 0 0 40 50 66 76 100
Central Highlands 0 0 0 2 2 71 66 83 78 94
Circular Head 0 0 0 0 2 87 98 80 91 98
Dorset 5 6 12 4 10 109 132 118 124 154
Flinders 83 101 130 122 147 139 94 93 0 0
George Town 31 29 29 46 36 154 211 181 201 131
Glamorgan-Spring Bay 0 10 0 0 30 8 91 87 105 64
Kentish 0 0 0 0 13 45 83 144 126 93
King Island 122 0 37 0 33 0 104 122 46 91
Latrobe 19 12 19 20 22 95 86 75 123 137
Southern Midlands 8 11 13 3 14 48 49 53 61 80
Tasman 969 1,059 1,186 1,246 1,248 29 23 68 34 32
West Coast 0 67 49 36 38 112 106 189 238 100
Group average 95 100 113 114 123 72 92 105 100 90
State Average 72 77 88 88 95 90 107 118 117 116
$$
2003-04
$
2005-06
$
2004-05
$ $
2007-08
$
Recreational and Cultural Facilities
Expenditure per Capita
Social and Community Services
Expenditure per Capita
2007-082006-07 2005-06
$
2006-07
$
2003-04
$
2004-05

75
2003-04 2004-05 2005-06 2006-07 2007-08
Cities 49 50 53 54 56
Medium Councils 56 61 71 72 77
Small Councils 95 100 113 114 123
State Average 72 77 88 88 95
0
25
50
75
100
125
150
175
200
Ex
pen
dit
ure p
er C
ap
ita
Financial Year
Social and Community Services
Expenditure per Capita
2 0 0 3 -0 4 2 0 0 4 -0 5 2 0 0 5 -0 6 2 0 0 6 -0 7 2 0 0 7 -0 8
C it ie s 1 7 5 1 9 2 2 1 1 2 1 1 2 1 7
M e d iu m C o u n c ils 8 2 9 6 1 0 1 1 0 4 1 1 1
S ma ll C o u n c ils 7 2 9 2 1 0 5 1 0 0 9 0
S ta te A v e r a g e 9 0 1 0 7 1 1 8 1 1 7 1 1 6
0
2 5
5 0
7 5
1 0 0
1 2 5
1 5 0
1 7 5
2 0 0
2 2 5
2 5 0
Expenditure p
er C
apita
F in a n c ia l Y e a r
R ec rea t io n a l a n d C u ltu ra l F a c i l i t ie s
E x p en d itu re p e r C a p ita

76
APPENDIX 1
Cities
Clarence 3,267 3,822 6,638 8,284 21,940 0 43,951
Glenorchy 3,181 837 12,197 9,818 15,105 0 41,138
Hobart 6,607 4,571 11,197 8,025 34,551 0 64,951
Launceston 4,513 2,484 8,373 14,712 31,682 381 62,144
Medium Councils
Brighton 510 639 1,000 2,079 3,937 36 8,202
Burnie 1,204 1,254 2,793 3,810 11,698 1,308 22,067
Central Coast 362 909 2,534 1,830 8,544 0 14,179
Derwent Valley 198 309 1,470 1,034 3,680 17 6,708
Devonport 1,620 1,001 3,570 5,238 14,075 0 25,504
Huon Valley 319 327 1,751 1,279 6,220 0 9,896
Kingborough 897 1,224 3,721 6,483 12,798 0 25,124
Meander Valley 851 650 1,066 1,465 6,528 0 10,560
Northern Midlands 311 344 1,272 811 5,157 53 7,947
Sorell 320 1,288 575 1,130 5,629 143 9,087
Waratah - Wynyard 296 528 1,452 1,866 5,446 0 9,589
West Tamar 802 1,348 2,088 2,283 6,476 100 13,097
Small Councils
Break O'Day 220 827 775 1,256 3,588 0 6,666
Central Highlands 150 384 243 146 1,762 0 2,685
Circular Head 231 561 541 1,236 4,955 20 7,544
Dorset 215 572 654 841 3,969 0 6,251
Flinders 48 58 92 0 775 0 973
George Town 170 657 613 715 4,021 0 6,175
Glamorgan - Spring Bay 195 739 1,028 962 3,680 116 6,720
Kentish 135 156 572 510 2,871 0 4,244
King Island 81 157 262 214 1,238 0 1,952
Latrobe 232 473 1,628 1,256 3,559 0 7,148
Southern Midlands 135 133 416 242 2,352 265 3,543
Tasman 115 393 0 5 2,325 0 2,838
West Coast 167 839 1,588 1,148 2,346 0 6,088
Total 27,352 27,484 70,110 78,678 230,907 2,439 436,970
APPENDIX 1
Dat a Provided by
Local Governm ent
Financial Year
2007-2008
$'000 $'000 $'000
Revenue - Rates and Annual Charges
Fire Levy Special RatesGarbage Water
$'000
Sewerage General Rates
$'000
Total Rates
and Annual
Charges:
$'000$'000

77
Cities
Clarence 1,171 1,029 23 381 1,735 300 32 10,842 15,513
Glenorchy 740 1,100 188 1,064 3,249 718 651 1,008 8,718
Hobart 862 1,403 12 102 360 533 166 2,252 5,690
Launceston 1,318 2,205 1,917 150 130 2,154 112 0 7,987
Medium Councils
Brighton 1,075 398 0 0 92 648 0 922 3,134
Burnie 1,011 828 267 137 799 771 13 412 4,239
Central Coast 1,852 1,420 186 797 543 1,265 902 0 6,965
Derwent Valley 852 581 427 84 220 232 401 5 2,802
Devonport 620 834 288 74 773 310 230 4,318 7,446
Huon Valley 1,542 1,149 1,108 243 298 2,193 71 0 6,603
Kingborough 758 980 315 1,358 795 1,707 1,037 10,657 17,606
Meander Valley 1,488 1,640 351 45 465 0 130 2,455 6,573
Northern Midlands 1,372 1,762 31 830 197 711 0 120 5,024
Sorell 736 711 28 273 328 275 388 795 3,535
Waratah - Wynyard 1,366 1,017 137 100 3 495 0 2,060 5,178
West Tamar 1,627 846 55 53 3 1,085 321 3,335 7,324
Small Councils
Break O'Day 1,154 1,194 353 275 503 47 0 0 3,526
Central Highlands 644 1,013 11 275 0 357 0 0 2,299
Circular Head 1,167 1,364 0 84 0 35 0 25 2,676
Dorset 1,155 1,405 214 91 350 501 30 0 3,747
Flinders 506 497 207 0 100 179 0 0 1,487
George Town 857 584 177 103 82 230 112 1,624 3,768
Glamorgan - Spring Bay 673 499 112 183 408 466 0 0 2,341
Kentish 898 916 111 338 0 317 0 0 2,581
King Island 440 560 26 1,095 31 483 0 0 2,636
Latrobe 602 535 9 246 0 470 94 962 2,919
Southern Midlands 1,143 1,257 63 58 308 1,029 3 0 3,862
Tasman 363 320 946 378 1,429 1,818 0 0 5,254
West Coast 991 480 260 77 0 178 6 8 2,000
Total 28,984 28,527 7,822 8,894 13,203 19,507 4,699 41,799 153,434
APPENDIX 1
Dat a Provided by
Local Governm ent
Financial Year
2007-2008
Revenue - Grants and Contributions
Grants
Commission
Base Grant
Grants
Commission
Local Roads
State Current
Grants
$'000 $'000 $'000
State Capital
Grants
Commonwealth
Current Grants
Commonwealth
Capital Grants
$'000$'000 $'000 $'000$'000$'000
Private Sector
Contributions
Assets Acquired
Without Cost
Total Grants
and
Contributions:

78
Cities
Clarence 5,705 3,432 97 214 95 585 0 992 69,592
Glenorchy 11,691 978 179 976 -2,003 1,078 0 230 62,756
Hobart 20,542 3,187 3,954 913 -165 890 3,540 9,132 103,502
Launceston 17,119 3,588 1,249 1,755 -1,114 1,694 0 3,584 94,421
Medium Councils
Brighton 3,004 420 0 154 5 0 0 159 14,919
Burnie 11,386 999 542 -109 -2,326 0 0 -1,892 36,798
Central Coast 4,233 605 28 123 109 327 0 587 26,569
Derwent Valley 1,148 246 0 155 -29 0 0 126 11,030
Devonport 7,621 779 502 468 -662 0 0 308 41,658
Huon Valley 2,613 881 0 0 -231 2,408 0 2,177 22,170
Kingborough 3,943 1,220 0 805 -118 0 0 687 48,580
Meander Valley 2,032 1,069 0 233 -921 0 0 -688 19,546
Northern Midlands 2,809 446 11 0 -917 0 0 -906 15,320
Sorell 1,740 508 13 1,249 -105 375 0 1,532 16,402
Waratah - Wynyard 2,497 557 0 135 -703 0 0 -568 17,252
West Tamar 3,416 950 6 436 -2,442 0 0 -2,000 22,788
Small Councils
Break O'Day 1,200 540 0 0 11 552 0 563 12,495
Central Highlands 295 422 0 0 3 444 42 488 6,190
Circular Head 3,044 865 0 113 73 244 0 430 14,559
Dorset 1,629 923 0 0 46 0 0 46 12,596
Flinders 665 486 0 0 3 0 0 3 3,615
George Town 1,754 350 0 193 190 170 0 553 12,600
Glamorgan - Spring Bay 2,150 88 0 0 25 0 0 25 11,323
Kentish 559 278 0 77 58 1,010 0 1,145 8,806
King Island 1,181 225 0 0 -8 474 0 466 6,460
Latrobe 1,282 172 1 182 696 519 0 1,399 12,919
Southern Midlands 962 368 0 246 -64 64 28 273 9,008
Tasman 907 229 0 -81 27 297 0 243 9,471
West Coast 1,437 357 12 0 -24 0 613 600 10,483
Total 118,564 25,167 6,595 8,237 -10,493 11,131 4,222 19,692 753,827
APPENDIX 1
Dat a Provided by
Local Governm ent
Financial Year
2007-2008
$'000 $'000
Other Revenue
FinesUser Fees and
ChargesInterest
$'000
Other Revenue
Total
$'000$'000
Capital Revenue
n e c
Profits from
Authorities
$'000 $'000 $'000
Profit / Loss on
Sale of Assets
Current Revenue
n e c
$'000
Total Revenue

79
$'000
Cities
Clarence 1,147 6,735 2,315 6,763 6,612 4,396 3,448 2,900 4,144 982 39,442
Glenorchy 1,339 10,170 2,719 3,412 8,372 2,519 3,224 4,771 3,970 3,065 43,560
Hobart 1,379 2,256 11,335 13,232 8,767 6,345 5,268 2,688 17,723 2,998 71,989
Launceston 1,388 6,080 4,667 7,761 9,664 10,790 3,838 409 14,229 2,630 61,458
Medium Councils
Brighton 1,020 650 325 775 1,368 695 737 0 585 2,172 8,327
Burnie 454 2,382 1,842 2,934 1,415 1,739 1,874 3,130 4,088 1,916 21,772
Central Coast 745 3,724 1,889 1,838 3,214 1,315 1,778 1,500 1,998 466 18,467
Derwent Valley 398 1,429 389 572 1,730 755 614 787 867 420 7,960
Devonport 610 4,377 2,716 3,356 4,068 2,283 3,209 376 5,254 994 27,245
Huon Valley 466 6,259 469 1,227 803 457 316 5,360 980 456 16,793
Kingborough 607 4,577 3,123 3,400 3,031 2,948 2,020 1,071 2,947 348 24,073
Meander Valley 271 1,828 1,648 1,492 1,292 693 927 82 951 1,635 10,819
Northern Midlands 188 2,081 1,380 1,367 1,099 953 713 468 768 290 9,308
Sorell 695 2,332 1,169 828 1,266 553 1,730 686 316 725 10,300
Waratah - Wynyard 304 2,029 1,009 1,987 1,730 1,937 864 842 949 338 11,988
West Tamar 357 2,254 1,808 1,746 2,043 745 1,129 150 1,724 614 12,571
Small Councils
Break O'Day 157 1,610 867 1,326 762 364 972 0 528 861 7,448
Central Highlands 333 1,202 323 937 221 95 315 5 153 0 3,584
Circular Head 84 7,393 899 1,702 1,308 650 445 6 635 1,066 14,189
Dorset 248 1,368 775 1,639 783 296 539 67 910 822 7,445
Flinders 26 962 295 940 35 0 106 125 0 270 2,759
George Town 109 1,475 944 527 708 618 763 222 739 529 6,632
Glamorgan - Spring Bay 615 1,699 1,604 474 1,389 524 1,560 130 185 305 8,486
Kentish 393 1,633 846 1,253 247 586 184 80 403 0 5,626
King Island 89 766 330 1,074 164 109 366 57 141 681 3,776
Latrobe 180 1,319 938 801 1,139 379 711 122 960 1,163 7,713
Southern Midlands 165 1,331 843 975 512 127 329 84 351 332 5,049
Tasman 149 1,492 253 331 0 80 284 2,828 68 195 5,678
West Coast 209 1,666 784 1,278 871 485 539 195 440 360 6,826
Total 14,126 0 83,076 0 48,502 0 65,948 0 64,611 0 43,435 38,802 0 29,140 0 67,007 26,634 481,281
APPENDIX 1
Dat a Provided by
Local Governm ent
Financial Year
2007-2008
$'000
Community
Amenity
Expenses
(excl.
Depreciation)
Roads, Footpaths
and Traffic
Expenses
(excl.
Depreciation)
Water System
Expenses
(excl.
Depreciation)
Sewerage
Systems
Expenses
(excl.
Depreciation)
Governance
Expenses
(excl.
Depreciation)
$'000 $'000
Functional Expenses
Community
Health and Safety
Expenses (excl.
Depreciation)
$'000 $'000
Waste
Management
Expenses
(excl.
Depreciation)
Social and
Community
Service Expenses
(excl.
Depreciation)
Recreational and
Cultural Expenses
(excl.
Depreciation)
$'000
Total Functional
Expenses
$'000 $'000 $'000 $'000
All Other
Expenses (Excl.
Depreciation)
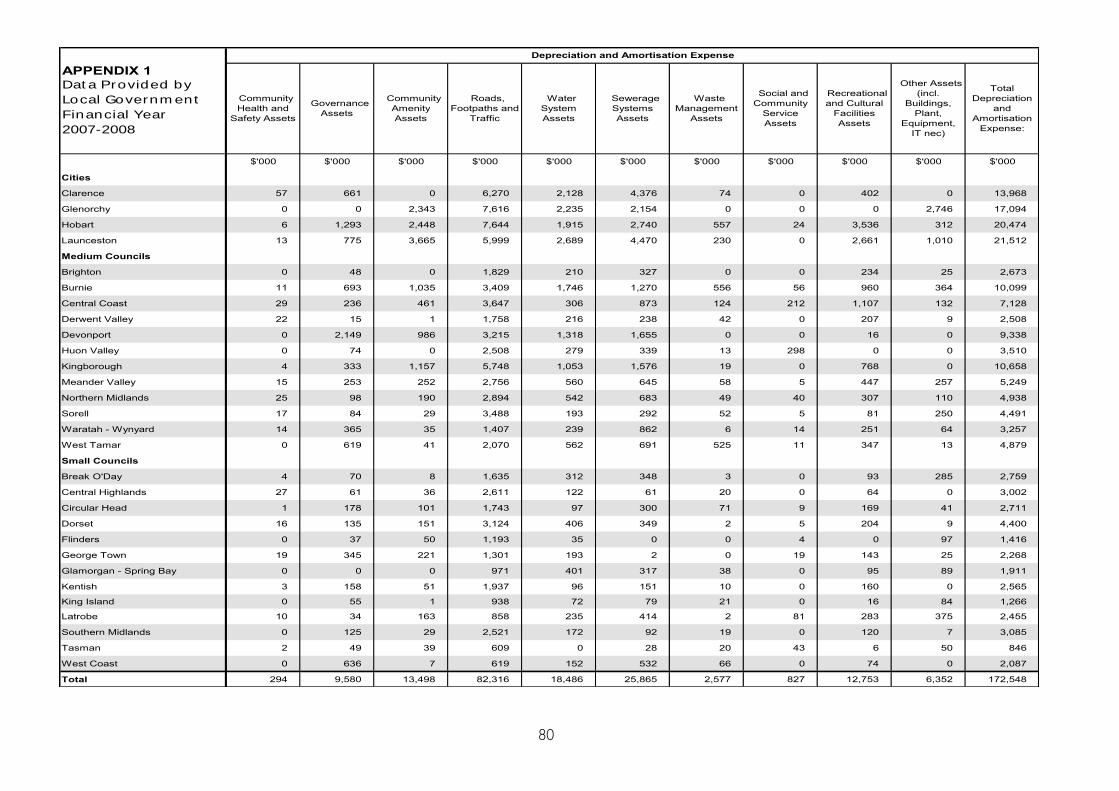
80
Cities
Clarence 57 661 0 6,270 2,128 4,376 74 0 402 0 13,968
Glenorchy 0 0 2,343 7,616 2,235 2,154 0 0 0 2,746 17,094
Hobart 6 1,293 2,448 7,644 1,915 2,740 557 24 3,536 312 20,474
Launceston 13 775 3,665 5,999 2,689 4,470 230 0 2,661 1,010 21,512
Medium Councils
Brighton 0 48 0 1,829 210 327 0 0 234 25 2,673
Burnie 11 693 1,035 3,409 1,746 1,270 556 56 960 364 10,099
Central Coast 29 236 461 3,647 306 873 124 212 1,107 132 7,128
Derwent Valley 22 15 1 1,758 216 238 42 0 207 9 2,508
Devonport 0 2,149 986 3,215 1,318 1,655 0 0 16 0 9,338
Huon Valley 0 74 0 2,508 279 339 13 298 0 0 3,510
Kingborough 4 333 1,157 5,748 1,053 1,576 19 0 768 0 10,658
Meander Valley 15 253 252 2,756 560 645 58 5 447 257 5,249
Northern Midlands 25 98 190 2,894 542 683 49 40 307 110 4,938
Sorell 17 84 29 3,488 193 292 52 5 81 250 4,491
Waratah - Wynyard 14 365 35 1,407 239 862 6 14 251 64 3,257
West Tamar 0 619 41 2,070 562 691 525 11 347 13 4,879
Small Councils
Break O'Day 4 70 8 1,635 312 348 3 0 93 285 2,759
Central Highlands 27 61 36 2,611 122 61 20 0 64 0 3,002
Circular Head 1 178 101 1,743 97 300 71 9 169 41 2,711
Dorset 16 135 151 3,124 406 349 2 5 204 9 4,400
Flinders 0 37 50 1,193 35 0 0 4 0 97 1,416
George Town 19 345 221 1,301 193 2 0 19 143 25 2,268
Glamorgan - Spring Bay 0 0 0 971 401 317 38 0 95 89 1,911
Kentish 3 158 51 1,937 96 151 10 0 160 0 2,565
King Island 0 55 1 938 72 79 21 0 16 84 1,266
Latrobe 10 34 163 858 235 414 2 81 283 375 2,455
Southern Midlands 0 125 29 2,521 172 92 19 0 120 7 3,085
Tasman 2 49 39 609 0 28 20 43 6 50 846
West Coast 0 636 7 619 152 532 66 0 74 0 2,087
Total 294 9,580 13,498 82,316 18,486 25,865 2,577 827 12,753 6,352 172,548
APPENDIX 1
Dat a Provided by
Local Governm ent
Financial Year
2007-2008
$'000 $'000 $'000 $'000 $'000$'000 $'000 $'000 $'000$'000$'000
Depreciation and Amortisation Expense
Community
Health and
Safety Assets
Sewerage
Systems
Assets
Waste
Management
Assets
Social and
Community
Service
Assets
Recreational
and Cultural
Facilities
Assets
Governance
Assets
Community
Amenity
Assets
Roads,
Footpaths and
Traffic
Total
Depreciation
and
Amortisation
Expense:
Other Assets
(incl.
Buildings,
Plant,
Equipment,
IT nec)
Water
System
Assets

81
Total Other
Expenses
$'000
Cities
Clarence 1,504 720 0 0 3,249 5,474 58,884 10,709 43,770 54,479
Glenorchy 1,394 1,223 37 107 3,181 5,941 66,596 -3,840 54,104 50,264
Hobart 999 2,262 436 305 6,447 10,449 102,913 589 175,449 176,038
Launceston 712 1,768 654 130 4,476 7,739 90,709 3,712 177,192 180,905
Medium Councils
Brighton 221 86 0 106 489 903 11,903 3,016 10,505 13,521
Burnie 1,108 810 0 52 1,161 3,131 35,002 1,796 5,823 7,619
Central Coast 20 464 0 51 387 921 26,516 52 24,701 24,753
Derwent Valley 134 103 0 0 193 429 10,897 132 7,048 7,181
Devonport 682 705 0 61 1,602 3,049 39,632 2,026 15,331 17,357
Huon Valley 38 331 0 0 319 688 20,991 1,179 41,277 42,456
Kingborough 44 581 243 81 900 1,848 36,580 12,000 18,678 30,678
Meander Valley 0 295 44 51 844 1,234 17,301 2,244 12,726 14,970
Northern Midlands 0 221 0 22 293 536 14,781 539 16,434 16,972
Sorell 227 209 0 12 450 899 15,690 712 6,055 6,767
Waratah - Wynyard 153 208 22 20 286 689 15,934 1,318 31,695 33,013
West Tamar 128 277 0 53 800 1,259 18,709 4,079 11,737 15,816
Small Councils
Break O'Day 139 146 24 0 219 528 10,735 1,760 2,781 4,541
Central Highlands 0 69 0 0 150 219 6,805 -615 15,687 15,072
Circular Head 52 110 0 0 231 393 17,293 -2,734 26,646 23,911
Dorset 107 141 12 34 213 507 12,353 244 1,725 1,968
Flinders 0 4 0 0 45 49 4,224 -609 1,573 963
George Town 197 122 0 26 169 515 9,415 3,185 4,620 7,805
Glamorgan - Spring Bay 158 143 0 15 187 504 10,900 422 2,195 2,617
Kentish 131 35 0 14 131 312 8,503 304 8,192 8,496
King Island 66 50 0 0 80 196 5,237 1,223 1,987 3,209
Latrobe 79 125 0 19 217 440 10,608 2,311 12,861 15,172
Southern Midlands 85 94 0 5 132 316 8,450 558 5,893 6,451
Tasman 118 137 0 0 115 370 6,894 2,577 266 2,843
West Coast 113 145 0 0 164 421 9,334 1,149 4,491 5,640
Total 8,609 11,583 1,471 1,164 27,132 49,960 703,789 50,037 741,440 791,478
APPENDIX 1
Dat a Provided by
Local Governm ent
Financial Year
2007-2008
$'000 $'000$'000 $'000$'000$'000
Fringe Benefits
Tax
$'000 $'000 $'000
Total Revenue,
Expense and
Valuation
adjustment
recognised
directly in
Equity
Total Changes
in Equity
Other Expenses
Government
Levies Paid
Rehabilitation
Provision
Total
Operating
Expenses:
Annual
Operational
Surplus /
(Deficit)
Interest Paid Payroll Tax

82
Cities
Clarence 2,670 66 1,417 55,230 20,763 34,467 546,042 13,224 567,285
Glenorchy 955 0 1,577 15,894 12,947 2,948 669,477 19,704 652,720
Hobart 867 136 3,023 49,688 19,608 30,080 983,496 26,900 986,676
Launceston 1,669 0 4,844 71,948 47,901 24,047 1,138,775 21,092 1,141,731
Medium Councils
Brighton 116 0 384 4,597 2,840 1,757 129,359 2,297 128,819
Burnie 915 0 4,635 20,577 6,707 13,871 331,046 20,141 324,776
Central Coast 326 0 743 9,466 4,359 5,107 306,054 2,164 308,997
Derwent Valley 396 0 713 3,596 2,917 679 82,801 1,661 81,818
Devonport 416 71 953 11,265 6,204 5,061 385,078 9,269 380,870
Huon Valley 362 0 171 8,556 1,916 6,640 141,426 1,495 146,571
Kingborough 529 0 1,559 23,248 5,672 17,576 432,835 1,627 448,784
Meander Valley 287 0 419 15,193 2,019 13,173 224,912 2,409 235,676
Northern Midlands 249 0 582 6,725 1,937 4,788 204,320 108 209,001
Sorell 296 0 309 8,842 3,100 5,742 123,967 6,708 123,001
Waratah - Wynyard 69 0 359 7,333 3,192 4,141 125,270 2,804 126,608
West Tamar 556 0 188 13,792 2,913 10,880 206,909 1,552 216,237
Small Councils
Break O'Day 280 0 184 7,899 2,517 5,382 98,620 2,687 101,315
Central Highlands 157 0 224 5,606 820 4,786 116,270 32 121,024
Circular Head 87 0 772 5,386 1,735 3,651 107,850 648 110,853
Dorset 93 0 156 13,016 1,970 11,045 100,975 1,845 110,175
Flinders 142 0 100 7,529 351 7,177 34,940 174 41,944
George Town 23 0 365 4,430 1,743 2,688 99,872 3,151 99,408
Glamorgan - Spring Bay 236 0 463 2,021 2,066 -45 58,587 2,265 56,277
Kentish 47 0 234 5,925 1,379 4,546 65,060 2,257 67,350
King Island 130 0 297 4,391 1,117 3,274 54,503 906 56,871
Latrobe 151 0 241 2,296 1,856 440 96,428 1,936 94,932
Southern Midlands 292 0 453 6,858 1,163 5,696 82,174 1,178 86,692
Tasman 167 0 221 2,676 2,073 603 16,657 1,541 15,719
West Coast 161 0 126 4,775 2,828 1,947 58,970 1,633 59,283
Total 12,644 273 25,709 398,758 166,613 232,145 7,022,673 153,406 7,101,412
APPENDIX 1
Dat a Provided by
Local Governm ent
Financial Year
2007-2008
$'000
Rate Debtors
(excl. Deferred
Rate Debtors)
$'000 $'000
Rate Debtors
Postponed
$'000 $'000$'000 $'000
Net AssetsNon Current
Liabilities
Working
Capital
$'000$'000
Total Current
Assets
All Other
Current Assets
Assets and LiabilitiesOutstanding Rates
Non Current
Assets
Total Current
Liabilities

83
No. No. No. No. No.
Cities
Clarence 51,173 22,287 21,497 19,547 37,517
Glenorchy 44,250 20,597 18,214 16,802 31,827
Hobart 49,720 23,298 20,763 19,509 35,969
Launceston 64,931 29,093 25,037 25,598 45,717
Medium Councils
Brighton 14,791 7,043 6,468 4,347 9,280
Burnie 19,629 9,151 7,589 8,444 13,986
Central Coast 21,253 10,527 7,946 9,210 15,856
Derwent Valley 9,770 4,860 3,612 3,841 6,688
Devonport 24,961 11,802 9,799 10,026 18,154
Huon Valley 14,628 9,548 5,825 6,951 10,544
Kingborough 32,228 15,829 12,655 12,584 23,161
Meander Valley 19,124 9,338 7,537 8,132 13,586
Northern Midlands 12,482 6,244 4,319 6,004 8,994
Sorell 12,428 8,026 7,131 5,177 9,015
Waratah - Wynyard 13,889 7,360 5,419 6,006 10,088
West Tamar 21,833 10,420 8,267 8,684 15,529
Small Councils
Break O'Day 6,234 6,100 3,835 3,631 5,065
Central Highlands 2,315 3,578 2,145 1,744 2,756
Circular Head 8,228 4,907 2,991 4,012 5,721
Dorset 7,245 5,044 3,087 3,735 5,456
Flinders 877 1,699 924 589 774
George Town 6,740 4,204 3,735 3,319 5,035
Glamorgan - Spring Bay 4,383 5,431 3,265 2,857 4,146
Kentish 6,052 3,491 2,480 2,788 4,256
King Island 1,723 1,542 621 940 1,305
Latrobe 9,071 5,310 3,694 3,959 6,734
Southern Midlands 5,871 3,638 2,398 2,661 4,191
Tasman 2,301 3,388 3,059 1,694 2,252
West Coast 5,148 4,574 2,826 2,283 3,444
Total 493,278 258,329 207,138 205,074 357,046
APPENDIX 1
Dat a Provided by
Local Governm ent
Financial Year
2007-2008
Municipal Statistics Governance
Total Population
Within Municipal
area
Total Number of
Rateable
Properties
Number of Rateable
Residential
Properties
Number of Electors
Who Voted in Election
Total Number
of Electors
Eligible to Vote
as at
30 June 2006
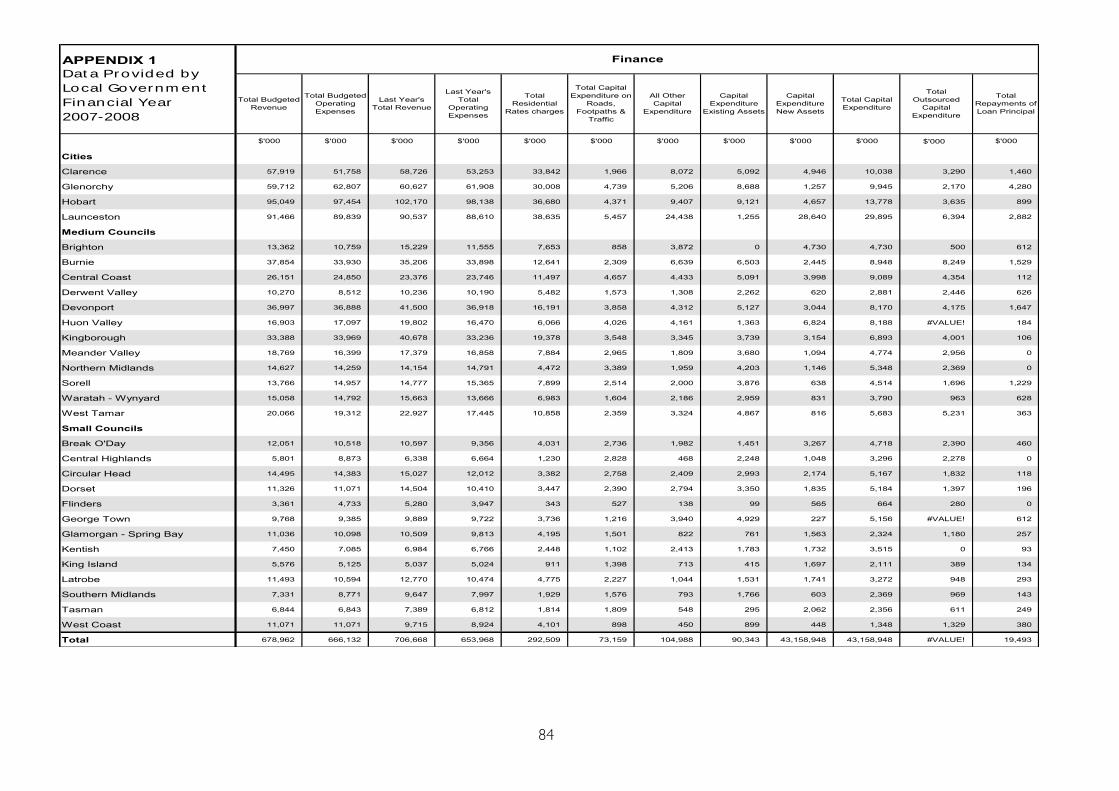
84
$'000
Cities
Clarence 57,919 51,758 58,726 53,253 33,842 1,966 8,072 5,092 4,946 10,038 3,290 1,460
Glenorchy 59,712 62,807 60,627 61,908 30,008 4,739 5,206 8,688 1,257 9,945 2,170 4,280
Hobart 95,049 97,454 102,170 98,138 36,680 4,371 9,407 9,121 4,657 13,778 3,635 899
Launceston 91,466 89,839 90,537 88,610 38,635 5,457 24,438 1,255 28,640 29,895 6,394 2,882
Medium Councils
Brighton 13,362 10,759 15,229 11,555 7,653 858 3,872 0 4,730 4,730 500 612
Burnie 37,854 33,930 35,206 33,898 12,641 2,309 6,639 6,503 2,445 8,948 8,249 1,529
Central Coast 26,151 24,850 23,376 23,746 11,497 4,657 4,433 5,091 3,998 9,089 4,354 112
Derwent Valley 10,270 8,512 10,236 10,190 5,482 1,573 1,308 2,262 620 2,881 2,446 626
Devonport 36,997 36,888 41,500 36,918 16,191 3,858 4,312 5,127 3,044 8,170 4,175 1,647
Huon Valley 16,903 17,097 19,802 16,470 6,066 4,026 4,161 1,363 6,824 8,188 #VALUE! 184
Kingborough 33,388 33,969 40,678 33,236 19,378 3,548 3,345 3,739 3,154 6,893 4,001 106
Meander Valley 18,769 16,399 17,379 16,858 7,884 2,965 1,809 3,680 1,094 4,774 2,956 0
Northern Midlands 14,627 14,259 14,154 14,791 4,472 3,389 1,959 4,203 1,146 5,348 2,369 0
Sorell 13,766 14,957 14,777 15,365 7,899 2,514 2,000 3,876 638 4,514 1,696 1,229
Waratah - Wynyard 15,058 14,792 15,663 13,666 6,983 1,604 2,186 2,959 831 3,790 963 628
West Tamar 20,066 19,312 22,927 17,445 10,858 2,359 3,324 4,867 816 5,683 5,231 363
Small Councils
Break O'Day 12,051 10,518 10,597 9,356 4,031 2,736 1,982 1,451 3,267 4,718 2,390 460
Central Highlands 5,801 8,873 6,338 6,664 1,230 2,828 468 2,248 1,048 3,296 2,278 0
Circular Head 14,495 14,383 15,027 12,012 3,382 2,758 2,409 2,993 2,174 5,167 1,832 118
Dorset 11,326 11,071 14,504 10,410 3,447 2,390 2,794 3,350 1,835 5,184 1,397 196
Flinders 3,361 4,733 5,280 3,947 343 527 138 99 565 664 280 0
George Town 9,768 9,385 9,889 9,722 3,736 1,216 3,940 4,929 227 5,156 #VALUE! 612
Glamorgan - Spring Bay 11,036 10,098 10,509 9,813 4,195 1,501 822 761 1,563 2,324 1,180 257
Kentish 7,450 7,085 6,984 6,766 2,448 1,102 2,413 1,783 1,732 3,515 0 93
King Island 5,576 5,125 5,037 5,024 911 1,398 713 415 1,697 2,111 389 134
Latrobe 11,493 10,594 12,770 10,474 4,775 2,227 1,044 1,531 1,741 3,272 948 293
Southern Midlands 7,331 8,771 9,647 7,997 1,929 1,576 793 1,766 603 2,369 969 143
Tasman 6,844 6,843 7,389 6,812 1,814 1,809 548 295 2,062 2,356 611 249
West Coast 11,071 11,071 9,715 8,924 4,101 898 450 899 448 1,348 1,329 380
Total 678,962 666,132 706,668 653,968 292,509 73,159 104,988 90,343 43,158,948 43,158,948 #VALUE! 19,493
$'000 $'000 $'000 $'000 $'000 $'000
APPENDIX 1
Dat a Provided by
Local Governm ent
Financial Year
2007-2008
Total Budgeted
Revenue
Total Budgeted
Operating
Expenses
Last Year's
Total Revenue
Finance
Capital
Expenditure
Existing Assets
Last Year's
Total
Operating
Expenses
Total
Residential
Rates charges
Total
Outsourced
Capital
Expenditure
Total Capital
Expenditure on
Roads,
Footpaths &
Traffic
All Other
Capital
Expenditure
$'000 $'000 $'000
Capital
Expenditure
New Assets
$'000
Total
Repayments of
Loan Principal
$'000
Total Capital
Expenditure

85
Cities
Clarence 13,957 132 240 15 2,247 2,470 471,380
Glenorchy 18,094 203 324 38 2,210 5,748 525,038
Hobart 36,933 973 584 61 5,468 6,808 1,153,984
Launceston 30,448 584 459 76 3,525 1,308 821,960
Medium Councils
Brighton 3,246 76 61 7 396 42 93,023
Burnie 13,113 273 216 36 1,228 2,767 343,526
Central Coast 9,114 102 157 13 1,032 1,232 248,000
Derwent Valley 2,496 30 54 7 210 40 85,416
Devonport 12,436 103 191 33 1,515 1,363 352,639
Huon Valley 8,283 77 152 26 514 547 295,002
Kingborough 10,157 202 181 31 1,203 1,051 388,155
Meander Valley 4,829 94 75 5 377 109 151,571
Northern Midlands 4,691 150 74 8 646 780 145,120
Sorell 5,050 85 86 13 561 154 174,600
Waratah - Wynyard 4,374 92 89 24 597 158 154,268
West Tamar 5,773 88 97 17 625 319 160,162
Small Councils
Break O'Day 3,871 182 68 14 421 4,182 114,688
Central Highlands 1,718 12 37 2 169 543 64,408
Circular Head 3,132 109 54 11 412 27 93,271
Dorset 3,046 92 53 0 272 92 109,378
Flinders 1,227 12 23 2 318 0 66,768
George Town 2,484 74 50 9 260 119 76,813
Glamorgan - Spring Bay 2,977 34 43 7 297 22 88,187
Kentish 1,531 36 29 6 175 0 51,750
King Island 1,501 22 32 4 275 11 51,804
Latrobe 3,257 80 54 12 362 283 91,449
Southern Midlands 2,802 23 45 3 137 102 78,454
Tasman 1,052 17 20 5 123 0 40,455
West Coast 3,310 26 56 24 531 2,291 96,550
Total 214,904 3,980 3,603 508 26,106 32,567 6,587,819
APPENDIX 1
Dat a Provided by
Local Governm ent
Financial Year
2007-2008
Total Days Paid and
Unpaid Sick Leave
No. No.$ Days
Human Resource Management
$'000
Employee ExpensesTraining and
Education Expenses
Number of Full Time
Equivalent
Employees (FTEs)
Number of FTE
Terminations
Hours
Hours Lost Due to
InjuryTotal Hours Worked
Hours

86
No. No. No.
Cities
Clarence 1,324 27,665 131,808 160 283 288
Glenorchy 2,039 96,677 166,725 273 315 249
Hobart 2,733 134,917 194,862 470 761 1,026
Launceston 1,463 77,646 259,578 350 628 891
Medium Councils
Brighton 63 42,536 57,068 53 110 54
Burnie 1,059 18,932 48,789 166 140 159
Central Coast 550 19,901 42,509 74 152 81
Derwent Valley 66 7,911 12,538 23 77 43
Devonport 1,141 58,785 118,009 187 175 200
Huon Valley 136 23,650 45,107 92 144 71
Kingborough 764 56,858 76,775 152 198 217
Meander Valley 288 35,337 45,705 50 146 136
Northern Midlands 215 13,116 26,803 49 118 124
Sorell 148 17,500 139,000 75 120 180
Waratah - Wynyard 281 7,135 25,088 50 104 86
West Tamar 451 28,591 58,444 83 110 55
Small Councils
Break O'Day 137 20,665 31,296 46 86 80
Central Highlands 120 5,375 8,474 19 50 47
Circular Head 260 9,850 9,850 39 104 158
Dorset 247 2,553 9,589 35 81 93
Flinders 49 500 5,000 16 15 37
George Town 219 UA UA 30 57 50
Glamorgan - Spring Bay 131 12,495 26,582 32 122 55
Kentish 237 11,085 16,525 24 66 58
King Island 61 435 3,850 15 37 19
Latrobe 204 10,868 17,397 40 82 73
Southern Midlands 136 12,186 13,294 32 48 70
Tasman 89 5,500 7,500 15 40 58
West Coast 135 12,034 17,500 38 74 74
Total 14,745 770,703 1,615,665 2,688 4,443 4,732
APPENDIX 1
Dat a Provided by
Local Governm ent
Financial Year
2007-2008
Information Systems
$'000
Community Health and Safety
Total Number of
Food Handling
Premises
Total Number of
Inspections of Food
Handling Premises
No.
Information Systems
Expenses (including
Depreciation)
Number of Electronic
Service Delivery
Receipts
Transactions
Total Number of All
Receipts
Transactions
Total Number of
Terminals (including
PCs) In Use
No.

87
No.
Cities
Clarence UA 37 3 731 800
Glenorchy 24 35 7 405 448
Hobart 17 37 9 987 795
Launceston 32 58 39 728 1,030
Medium Councils
Brighton 23 33 11 457 349
Burnie 24 29 10 221 338
Central Coast 22 33 9 291 375
Derwent Valley 7 21 10 223 156
Devonport 12 22 10 236 294
Huon Valley 21 32 22 491 443
Kingborough 22 35 20 717 796
Meander Valley 26 30 8 336 403
Northern Midlands 11 35 15 373 306
Sorell 21 40 39 555 492
Waratah - Wynyard 13 25 4 286 281
West Tamar 26 36 3 289 505
Small Councils
Break O'Day 19 29 7 343 320
Central Highlands 21 42 14 179 130
Circular Head 18 34 3 195 139
Dorset 14 28 16 92 192
Flinders 14 42 15 53 40
George Town 31 37 12 144 148
Glamorgan - Spring Bay 30 39 4 308 236
Kentish 30 40 12 127 139
King Island 7 38 2 26 31
Latrobe 14 36 24 180 341
Southern Midlands 22 34 15 196 135
Tasman 18 35 13 110 94
West Coast 28 28 7 110 107
Total 566 999 363 9,863 9,863
APPENDIX 1
Dat a Provided by
Local Governm ent
Financial Year
2007-2008
Days
Planning permitted
use
Number of Calendar days to Process Planning and
Development Applications
Number of Planning and Development
Application lodged
Days Days No.
Planning
discretionary use Building
Total Number of all
Building Applications
Lodged
Total Number of all
Planning Applications
Lodged

88
Cities
Clarence 966 290 297 1,552 1,103 89 1,365 2,556
Glenorchy 738 87 623 1,448 3,356 0 1,387 4,743
Hobart 716 60 1,069 1,845 2,538 15 2,507 5,060
Launceston 2,126 837 2,185 5,148 4,396 228 186 4,810
Medium Councils
Brighton 383 31 0 413 517 48 0 565
Burnie 1,505 116 514 2,135 1,680 69 560 2,309
Central Coast 1,244 287 346 1,877 2,280 147 360 2,786
Derwent Valley 205 146 168 519 1,204 148 191 1,543
Devonport 868 57 696 1,620 1,494 0 1,317 2,811
Huon Valley 981 1,092 234 2,307 3,871 0 0 3,871
Kingborough 1,700 1,204 377 3,281 3,326 20 91 3,438
Meander Valley 1,231 287 149 1,667 2,383 347 78 2,807
Northern Midlands 1,221 464 37 1,722 2,029 186 702 2,917
Sorell 179 299 129 607 700 926 478 2,104
Waratah - Wynyard 1,941 514 51 2,506 1,980 464 334 2,778
West Tamar 685 612 488 1,785 1,811 475 73 2,359
Small Councils
Break O'Day 693 724 100 1,518 183 62 2,108 2,354
Central Highlands 95 730 112 937 322 51 167 540
Circular Head 738 1,466 495 2,700 1,674 337 521 2,532
Dorset 388 484 467 1,339 495 695 447 1,636
Flinders 288 319 0 608 146 0 0 146
George Town 431 41 32 504 807 196 230 1,232
Glamorgan - Spring Bay 297 127 0 425 298 20 0 318
Kentish 572 453 45 1,070 613 78 0 691
King Island 120 409 393 922 311 187 253 751
Latrobe 686 299 139 1,124 1,076 107 666 1,849
Southern Midlands 360 671 181 1,212 373 891 69 1,333
Tasman 107 226 0 333 72 137 0 209
West Coast 1,053 172 25 1,250 575 213 101 889
Total 22,517 12,506 9,350 44,373 41,611 6,133 14,190 61,934
APPENDIX 1
Dat a Provided by
Local Governm ent
Financial Year
2007-2008
Roads, Footpaths and Traffic (Excluding Parking Operations)
Maintenance
Expenditure on
Sealed Roads
Maintenance
Expenditure on
Unsealed Roads
Other
Maintenance
Expenditure on
Roads, Footpaths
and Traffic
Total
Maintenance
Expenditure on
Roads, Footpaths
& Traffic
Capital
Expenditure on
Sealed Roads
Capital
Expenditure on
Unsealed Roads
Other Capital
Expenditure on
Roads, Footpaths
and Traffic
$'000$'000 $'000 $'000 $'000 $'000
Total Capital
Expenditure on
Roads, Footpaths
& Traffic
$'000 $'000

89
Cities
Clarence 253 136 389 4 60 64 156,551 302,351 0 0 0
Glenorchy 253 38 291 2 16 18 191,772 360,436 179,069 328,758 92,356
Hobart 290 0 290 6 0 6 243,726 395,519 9,850,000 6,910,000 649,000
Launceston 361 138 499 0 232 232 252,714 427,500 4,920,433 2,971,920 244,068
Medium Councils
Brighton 68 75 143 0 27 27 54,913 78,184 0 0 0
Burnie 132 213 345 0 47 47 91,996 171,138 2,028,532 757,240 150,528
Central Coast 133 403 536 1 126 127 135,304 196,426 17,322 48,140 63,391
Derwent Valley 32 65 97 4 229 233 28,306 53,194 0 0 0
Devonport 158 73 231 0 13 13 88,235 189,479 1,676,554 1,058,587 55,794
Huon Valley 24 142 166 10 599 609 68,901 128,029 0 0 0
Kingborough 127 134 261 0 270 270 225,865 395,254 0 0 0
Meander Valley 110 482 592 6 247 253 131,879 172,163 0 0 0
Northern Midlands 101 465 566 14 399 413 100,862 147,049 0 0 0
Sorell 76 71 146 37 210 247 73,216 133,258 0 0 0
Waratah - Wynyard 71 198 269 3 256 259 37,812 67,448 0 4,543 5,275
West Tamar 84 202 286 4 163 167 108,868 148,185 NA NA NA
Small Councils
Break O'Day 90 124 214 26 306 332 55,057 84,139 0 0 0
Central Highlands 16 79 95 2 655 657 98,421 127,985 0 0 0
Circular Head 26 255 281 0 492 492 60,799 107,419 0 0 0
Dorset 46 199 245 9 485 494 49,364 117,541 0 0 0
Flinders 6 67 73 3 309 312 24,407 55,871 0 0 0
George Town 69 105 174 3 96 99 47,311 64,939 0 0 0
Glamorgan - Spring Bay 100 58 158 17 168 185 27,856 48,270 0 0 0
Kentish 47 192 239 1 220 221 34,625 64,070 0 0 0
King Island 11 36 47 6 383 389 38,908 59,781 0 0 0
Latrobe 62 163 225 2 62 64 40,319 67,889 0 2,957 32,243
Southern Midlands 30 150 180 13 610 623 63,497 113,611 0 0 0
Tasman 19 59 77 1 178 179 6,181 12,240 NA NA NA
West Coast 67 15 82 17 76 93 24,634 42,493 8,951 10,092 495
Total 2,862 4,336 7,198 191 6,934 7,125 2,562,298 4,331,863 18,680,861 12,092,237 1,293,150
APPENDIX 1
Dat a Provided by
Local Governm ent
Financial Year
2007-2008
Kms $'000 $'000
Replacement
Value of Roads
On and Off Street Parking Operations
$ $ $
Revenue from
Parking
Operations
Operating
Expenses of
Parking
Operations (not
Incl Depn)
Depreciation and
Amortisation of
Parking
Infrastructure
Roads, Footpaths and Traffic (Excluding Parking Operations) Cont.
Total Kilometres
of Council
Managed
Unsealed Road
Kms Kms
Total Kilometres
of Council
Managed Urban
Sealed Road
Written Down
Value of Roads
Total Kilometres
of Council
Managed Rural
Sealed Road
Kms Kms
Total Kilometres
of Council
Managed Rural
Unsealed Road
Total Kilometres
of Council
Managed Sealed
Road
Total Kilometres
of Council
Managed Urban
Unsealed Road
Kms

90
No.
Cities
Clarence 607 615 523 521 0 8,443,000 8,443,000 19,495 1 139,000 2 17,340 353,000
Glenorchy 157 157 232 490 0 11,461,659 UA 22,242 1 206,000 4 22,154 260,000
Hobart 795 795 145 459 0 10,652,000 10,652,000 22,579 1 342,785 21 22,071 343,341
Launceston 361 362 110 531 0 9,297,238 7,432,452 26,307 4 0 34 27,015 391,450
Medium Councils
Brighton 168 169 71 205 0 1,989,636 1,758,181 6,126 1 27,268 2 5,179 38,118
Burnie 368 368 12 199 0 3,490,000 UA 7,991 1 0 5 7,915 935,611
Central Coast 412 414 14 193 0 4,038,404 UA 8,210 1 0 10 7,619 2,593
Derwent Valley 250 250 22 120 0 1,210,942 UA 3,051 10 15,827 0 2,668 16,915
Devonport 182 182 5 223 0 4,374,482 3,829,190 11,389 1 0 5 10,412 439,548
Huon Valley 283 286 100 251 180 2,900,000 UA 4,193 9 5,140 3 2,453 23,096
Kingborough 323 348 10 311 0 4,185,934 UA 10,547 1 0 2 9,653 6,155
Meander Valley 255 291 10 200 104 2,188,077 1,753,186 6,235 8 0 3 5,512 0
Northern Midlands 501 520 120 201 37 2,089,000 1,277,793 5,590 9 0 4 4,580 0
Sorell 148 148 20 84 0 913,796 913,796 2,297 1 12,070 0 2,166 57,453
Waratah - Wynyard 430 512 12 127 0 1,808,682 UA 4,167 1 1,870 1 4,283 75,024
West Tamar 180 180 212 251 0 2,406,662 1,988,690 8,069 1 0 2 5,310 NA
Small Councils
Break O'Day 96 123 11 151 0 645,000 618,004 3,275 6 6,272 0 2,670 109,209
Central Highlands 54 70 94 65 365 338,259 265,946 746 6 0 0 605 0
Circular Head 99 318 13 54 0 1,655,130 1,470,775 2,651 1 0 1 1,729 0
Dorset 110 131 8 136 130 627,000 UA 3,074 10 34,660 0 2,037 56,030
Flinders 18 20 8 21 0 690,755 690,755 365 2 0 0 0 0
George Town 51 51 14 76 0 750,847 469,984 2,362 2 33,384 1 2,034 28,104
Glamorgan - Spring Bay 248 250 69 126 365 839,000 586,000 3,742 5 34,000 0 2,850 73,000
Kentish 23 23 10 38 0 276,618 276,000 1,069 1 0 2 931 1,425
King Island 60 60 0 18 90 133,100 129,600 550 2 0 0 489 7,858
Latrobe 359 359 16 117 0 1,195,337 UA 4,445 1 0 1 2,621 35,966
Southern Midlands 94 95 62 102 200 795,250 603,596 1,515 4 25,450 0 923 15,992
Tasman NA NA NA NA NA NA NA NA NA NA NA 0 NA
West Coast 276 276 134 88 0 1,600,000 UA 3,560 7 39,376 0 3,432 72,991
Total 6,908 7,373 2,057 5,358 1,471 80,995,808 43,158,948 195,842 923,102 923,102 103 176,651 3,342,879
APPENDIX 1
Dat a Provided by
Local Governm ent
Financial Year
2007-2008
Water Sewerage and Drainage
Interest Paid
on Sewerage
Infrastructure
Debt
Total Number
of Sewerage
Connections
Number of
Notifiable
Incidents
Interest Paid
on Water
Infrastructure
Debt
Total Number
of Kilolitres
Used
$
Total Number
of Water
Connections
No. $ No. No.
Total Number
of Water
Schemes
Km Days Kl Kl
Total Number
of Reported
Breaks in
Water System
Total Number
of Kilolitres
Purchased /
Produced
Total Number
of Days Water
Restrictions
During the
Year
Total
Kilometres of
Reticulation
Number of
Water Quality
Tests
Number of
Water Quality
Tests Which
Met Standards
No. No. No.

91
APPENDIX 2
Estimated
Resident
Population
June 2007
Area Population
Density
No. 0-14 15-24 25-64 65+ km2
Persons/km2
Cities
Clarence 51173 19 13 53 15 377 136
Glenorchy 44250 19 13 51 17 121 366
Hobart 49720 15 19 53 14 78 639
Launceston 64931 19 15 51 15 1411 46
Medium Councils
Brighton 14791 28 14 52 7 171 87
Burnie 19629 21 13 51 14 610 32
Central Coast 21253 19 11 52 17 931 23
Derwent Valley 9770 21 12 54 13 4103 2
Devonport 24961 20 12 51 17 111 225
Huon Valley 14628 22 11 54 13 5497 3
Kingborough 32228 21 13 53 13 719 45
Meander Valley 19124 21 11 54 14 3320 6
Northern Midlands 12482 21 11 53 15 5126 2
Sorell 12428 21 12 54 13 583 21
Waratah - Wynyard 13889 20 12 52 16 3526 4
West Tamar 21833 21 12 52 15 690 32
Small Councils
Break O'Day 6234 19 8 56 18 3521 2
Central Highlands 2315 19 11 57 14 7976 <1
Circular Head 8228 23 13 52 12 4891 2
Dorset 7245 20 12 51 17 3223 2
Flinders 877 16 8 60 17 1994 <1
George Town 6740 22 12 53 13 653 10
Glamorgan - Spring Bay 4383 16 7 57 19 2587 2
Kentish 6052 22 12 55 12 1155 5
King Island 1723 17 11 56 16 1094 2
Latrobe 9071 19 11 54 16 600 15
Southern Midlands 5871 22 11 55 11 2611 2
Tasman 2301 17 7 60 16 659 3
West Coast 5148 22 12 55 11 9574 1
Persons Aged (%) as at June 2006 (census data)APPENDIX 2:
Council Profile
Information

92
Employment
as at 2006
census data
Primary
industries and
manufacturing
Retail and
wholesale
trade
Property and
business
services
Education
Health and
community
services
Other Number
Cities
Clarence 3622 3405 8421 2 050 3 372 1374 22244
Glenorchy 3473 3181 6177 1 031 3 634 436 17932
Hobart 2254 3061 10291 2 816 4 173 1179 23774
Launceston 5174 4893 8608 2 549 4 097 1550 26871
Medium Councils
Brighton 1279 921 1659 258 728 359 5204
Burnie 1940 1382 2334 568 986 465 7675
Central Coast 2510 1272 2346 735 1 043 520 8426
Derwent Valley 1096 475 999 182 649 200 3601
Devonport 2567 1729 2811 749 1 165 526 9547
Huon Valley 1900 741 1442 366 698 332 5479
Kingborough 2543 2135 5131 1 489 2 288 861 14447
Meander Valley 2379 1398 2260 546 1 085 533 8201
Northern Midlands 1643 834 1382 313 692 316 5180
Sorell 1269 794 1746 304 638 446 5197
Waratah - Wynyard 1613 844 1403 425 668 330 5283
West Tamar 2086 1439 2778 928 1 311 555 9097
Small Councils
Break O'Day 621 269 577 173 227 107 1974
Central Highlands 432 40 213 41 82 44 852
Circular Head 1917 461 750 216 232 187 3763
Dorset 1350 376 638 153 343 26 2886
Flinders 181 42 120 33 44 33 453
George Town 887 289 597 150 265 147 2335
Glamorgan - Spring Bay 617 207 596 74 139 83 1716
Kentish 800 346 646 123 266 147 2328
King Island 508 99 105 47 62 92 913
Latrobe 1305 536 990 246 470 223 3770
Southern Midlands 926 331 566 149 265 138 2375
Tasman 240 64 262 56 140 53 815
West Coast 795 160 696 140 144 120 2055
Employed Persons by Industry as at 2006 census dataAPPENDIX 2:
Council Profile
Information

93
APPENDIX 3 Classification concordance
Council KPI
ClassificationABS Purpose Classification Council Function
Accounting (Not otherwise allocated)
Councillors Expenses (Allowances, meetings, support)
Customer Service (Not otherwise allocated)
Election Costs
General Managers Expenses (Not otherwise allocated)
Human Resources (Not otherwise allocated)
Information Technology (Not otherwise allocated)
LGAT & Regional Organisation (Not otherwise allocated)
Public Relations - Council
Rating (Not otherwise allocated)
Records Management (Not otherwise allocated)
Corporate Services (Not otherwise allocated)
Strategic Planning
Technical Management and Support (Not otherwise allocated)
Fire Protection Services
SES Contributions
Enforcement of By-Laws
Animal and Nuisance Control
Infant Health Services
Immunisation Services
Environmental Health - Inspections and General Services
Flood Protection
Street Cleaning
Stormwater Drainage
Community and Regional Development Biodiversity/Habitat protection
Building Inspections
Statutory Planning - Town Planning and Development Applications
Crematoriums and Cemeteries
Public Conveniences
Drinking Fountains
Public Clocks
Street Furniture
Street Lighting
Assistance Programs for the Disabled
Nursing Homes/Aged Care
Transport services associated with Aged Care
Recreation services for the Aged
Housing Rental Housing for council employees and others
Housing Information Dissemination
Welfare
Child Care
Family Day Care
Public Order, Fire and Safety
Community and Public Health
Other Protection of the Environment / Biodiversity
Community Amenities
Nursing Homes / Aged Care
Welfare
Social and Community
Services
Governance Legislative, Executive, Financial and Fiscal Affairs
Community Health and
Safety
Community Amenities
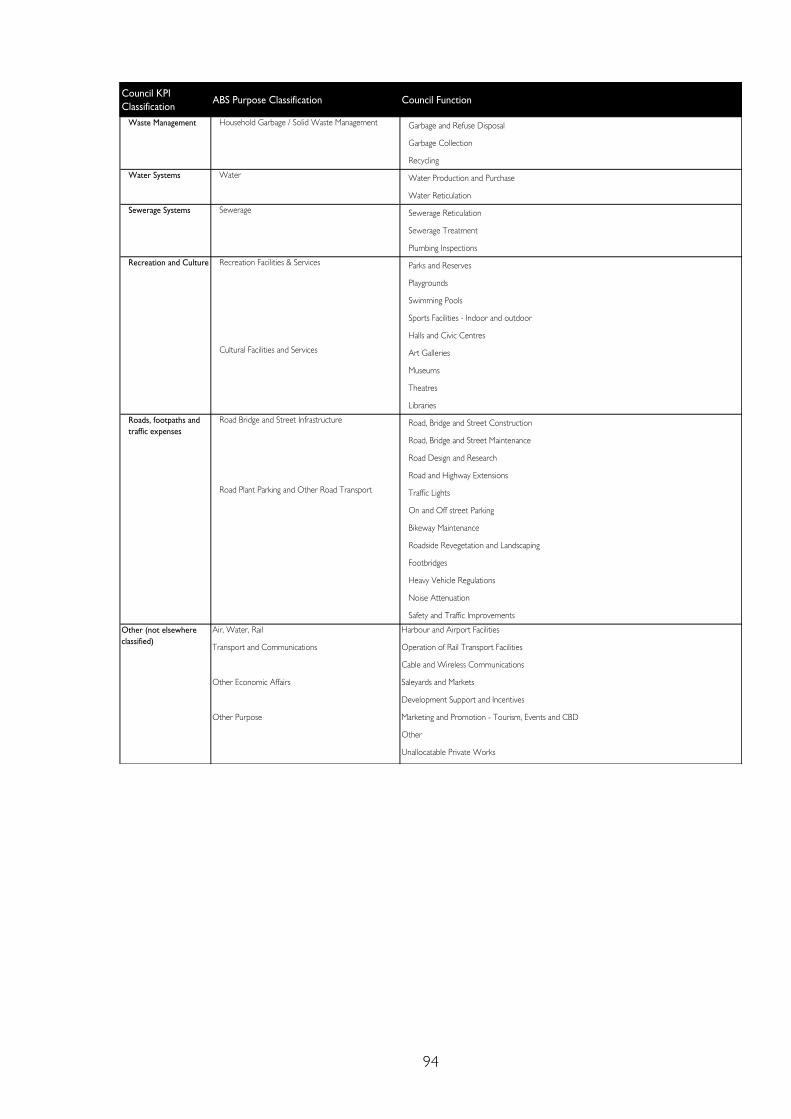
94
Council KPI
ClassificationABS Purpose Classification Council Function
Garbage and Refuse Disposal
Garbage Collection
Recycling
Water Production and Purchase
Water Reticulation
Sewerage Reticulation
Sewerage Treatment
Plumbing Inspections
Parks and Reserves
Playgrounds
Swimming Pools
Sports Facilities - Indoor and outdoor
Halls and Civic Centres
Art Galleries
Museums
Theatres
Libraries
Road, Bridge and Street Construction
Road, Bridge and Street Maintenance
Road Design and Research
Road and Highway Extensions
Traffic Lights
On and Off street Parking
Bikeway Maintenance
Roadside Revegetation and Landscaping
Footbridges
Heavy Vehicle Regulations
Noise Attenuation
Safety and Traffic Improvements
Air, Water, Rail Harbour and Airport Facilities
Operation of Rail Transport Facilities
Cable and Wireless Communications
Saleyards and Markets
Development Support and Incentives
Marketing and Promotion - Tourism, Events and CBD
Other
Unallocatable Private Works
Other Economic Affairs
Other Purpose
Cultural Facilities and Services
Road Bridge and Street Infrastructure
Road Plant Parking and Other Road Transport
Transport and Communications
Recreation and Culture
Roads, footpaths and
traffic expenses
Other (not elsewhere
classified)
Recreation Facilities & Services
Water Systems Water
Sewerage Systems Sewerage
Waste Management Household Garbage / Solid Waste Management

95
APPENDIX 4 Customer Satisfaction Survey
Local Government Association of Tasmania
October 2006
Summary of the Results
This is the third round of research designed to provide a snapshot of the satisfaction residents have
with local councils across Tasmania, and to produce a State-wide benchmark against which councils
may wish to measure the satisfaction of their residents with respect to the services they provide. It follows surveys conducted in October 2001 and August 2002.
Nine areas of council services were identified, within these areas some 31 distinctive service areas
were identified. 1240 Tasmanian residents were interviewed by telephone, selected from all Tasmanian local government areas.
Summary Table 2 - Satisfaction with Council Services in the Nine Service Areas
Service Area Number of
Elements
Satisfaction Score %
2001 2002 2006
Customer Service 7 82 83 81
Water and Sewerage 3 77 78 77
Waste Management 4 76 77 76
Community Health and Safety 3 76 74 74
Recreational and Cultural Facilities and
Programs
5 71 71 70
Social and Community Services 2 67 68 66
Informing Residents about Council
Activities & Decisions
3 63 65 62
Roads, Footpaths and Traffic 3 63 65 60
Planning and Development 1 62 64 58
Average Satisfaction with Council’s Performance*
31 71 72 69
Average satisfaction across Tasmania obtained by aggregating the scores for each of the nine
customer service areas fell from 72% in 2002 to 69% in 2006. Scores for each of the areas were
marginally lower. This may reflect either lower performance achievements or rising community
expectations.

96
When a single question asking for overall satisfaction with council performance was put towards
the end of the survey, the satisfaction level recorded was 72% compared with 74% in 2001.
Areas with the highest level of customer satisfaction were, ’The Standards of Customer Service
Provided by Councils‘, ’Water and Sewerage‘, ’Waste Management‘ and ’Community Health and Safety‘. The lowest levels of satisfaction were recorded for, ’Planning and Development‘, ’Informing
Council Residents about Council Activities and Decisions‘ and ’Roads, Footpaths and Traffic‘. Once
again this replicated the results of earlier surveys. “Roads, Footpaths and Traffic” was identified as
the area greatest in need of improvement.
In 2001 residents were also asked about the importance they attached to each service. This
information was not sought in the 2002 survey because it is known that importance ratings vary
little if at all over a short period of time. The importance scores were obtained in the 2006 survey.
They show very little change from the 2001 survey.
Figure 1 – Average Importance and Performance Scores
State-wide results should not be taken as an indication of the overall satisfaction levels in any
individual council, or of satisfaction with respect to any particular service.
50
55
60
65
70
75
80
85
90
95
Average Importance and Performance Scores
Importance Satisfaction 2001

97
The full report is available at:
http://www.lgat.tas.gov.au/webdata/resources/files/Community_Satisfaction_Survey.pdf
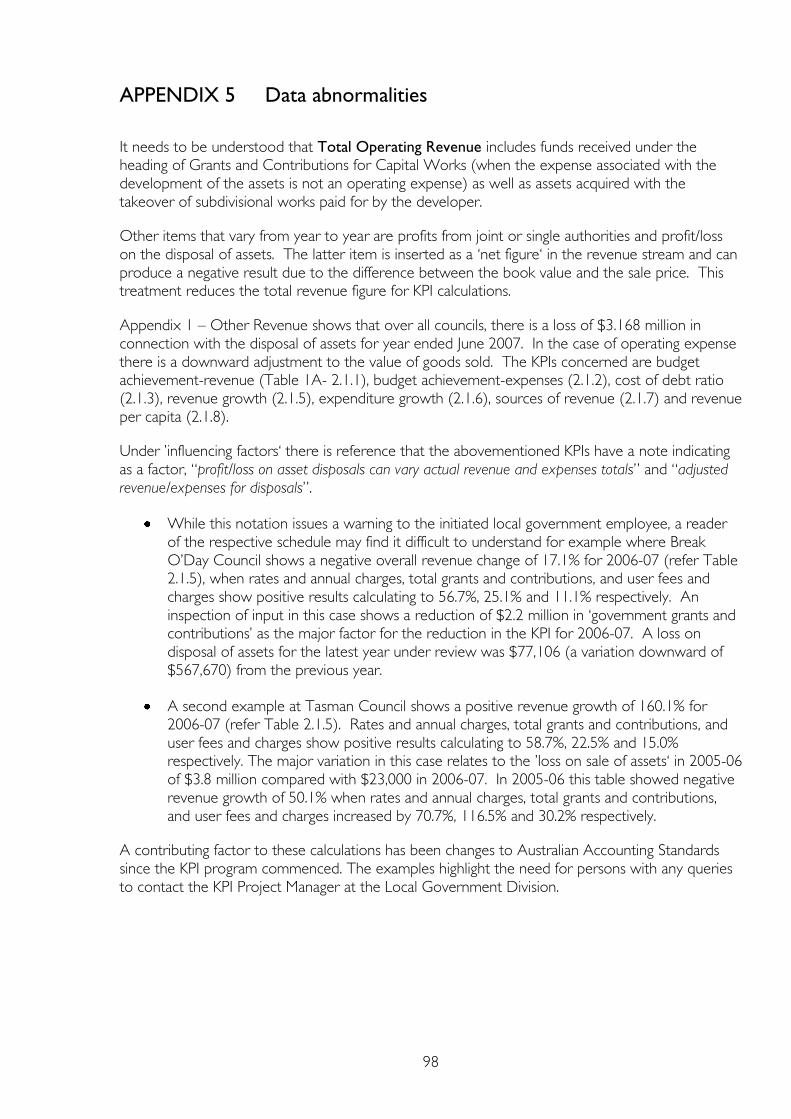
98
APPENDIX 5 Data abnormalities
It needs to be understood that Total Operating Revenue includes funds received under the heading of Grants and Contributions for Capital Works (when the expense associated with the
development of the assets is not an operating expense) as well as assets acquired with the
takeover of subdivisional works paid for by the developer.
Other items that vary from year to year are profits from joint or single authorities and profit/loss
on the disposal of assets. The latter item is inserted as a ‘net figure‘ in the revenue stream and can
produce a negative result due to the difference between the book value and the sale price. This
treatment reduces the total revenue figure for KPI calculations.
Appendix 1 – Other Revenue shows that over all councils, there is a loss of $3.168 million in
connection with the disposal of assets for year ended June 2007. In the case of operating expense
there is a downward adjustment to the value of goods sold. The KPIs concerned are budget achievement-revenue (Table 1A- 2.1.1), budget achievement-expenses (2.1.2), cost of debt ratio
(2.1.3), revenue growth (2.1.5), expenditure growth (2.1.6), sources of revenue (2.1.7) and revenue
per capita (2.1.8).
Under ’influencing factors‘ there is reference that the abovementioned KPIs have a note indicating
as a factor, “profit/loss on asset disposals can vary actual revenue and expenses totals” and “adjusted
revenue/expenses for disposals”.
While this notation issues a warning to the initiated local government employee, a reader
of the respective schedule may find it difficult to understand for example where Break
O’Day Council shows a negative overall revenue change of 17.1% for 2006-07 (refer Table 2.1.5), when rates and annual charges, total grants and contributions, and user fees and
charges show positive results calculating to 56.7%, 25.1% and 11.1% respectively. An
inspection of input in this case shows a reduction of $2.2 million in ‘government grants and contributions’ as the major factor for the reduction in the KPI for 2006-07. A loss on
disposal of assets for the latest year under review was $77,106 (a variation downward of
$567,670) from the previous year.
A second example at Tasman Council shows a positive revenue growth of 160.1% for
2006-07 (refer Table 2.1.5). Rates and annual charges, total grants and contributions, and
user fees and charges show positive results calculating to 58.7%, 22.5% and 15.0% respectively. The major variation in this case relates to the ’loss on sale of assets‘ in 2005-06
of $3.8 million compared with $23,000 in 2006-07. In 2005-06 this table showed negative
revenue growth of 50.1% when rates and annual charges, total grants and contributions,
and user fees and charges increased by 70.7%, 116.5% and 30.2% respectively.
A contributing factor to these calculations has been changes to Australian Accounting Standards
since the KPI program commenced. The examples highlight the need for persons with any queries
to contact the KPI Project Manager at the Local Government Division.

Errata
The Local Government Division of the Department of Premier and Cabinet has been advised that some
figures previously provided by councils were incorrect. The corrections are as follows:
Clarence City Council
Page 86 Training and Education Expenses should be $207,000
Page 86 Number of Electronic Receipts should be 71,434
Page 88 Other Maintenance Expenditure on Roads Footpaths and Traffic should be $1,297
These corrections change the following Clarence City Council’s KPIs:
Page 38 KPI 2.3.2 Average Cost of Training per Employee $863
Page 43 KPI 2.4.1 Electronic Service Delivery Receipts 54%
Page 56 KPI 4.1.1 Ratio of Total Expenditure on Roads and Footpaths to Depreciation
81.5%
Huon Valley Council
Page 79 Waste Management Expenses (Excluding Depreciation) should be $880,987
This correction changes the following Huon Valley Council’s KPIs:
Page 70 Average Cost of Waste Management Per Property $96.07
Page 70 Average Cost of Waste Management Per Capita $62.71

CONTACT DETAILS
Local Government DivisionDepartment of Premier and Cabinet
GPO Box 123, Hobart TAS 7001Phone:
(03) 6232 7022Email:
(03) 6233 5602Visit:
www.dpac.tas.gov.au