measuring shared value presentation
TRANSCRIPT

7/29/2019 Measuring Shared Value Presentation
http://slidepdf.com/reader/full/measuring-shared-value-presentation 1/15
Boston | Geneva | Mumbai | San Francisco | Seattle | Washington FSG.ORG
February 6, 2013
Measuring Shared Value
A conversation with:
Greg Hills, Managing Director, FSG
Suzanne Fallender , Director of CSR Strategy and Communications, Intel Janet Voûte, Global Head of Public Affairs, Nestlé Paul Snyder, Global Head of Environmental Sustainability, InterContinental
Hotels Group
Claudia Lorenzo, Social Business Director, Coca-Cola Brasil

7/29/2019 Measuring Shared Value Presentation
http://slidepdf.com/reader/full/measuring-shared-value-presentation 2/15
2
FSG.ORG
©2013 FSG
Today’s Agenda
Welcome and Agenda
Suzanne Fallender (Moderator), Intel
Overview of Measuring Shared Value
Greg Hills, FSG
Case Example: Nestlé and Rural Development
J anet Voûte, Nestlé
Case Example: InterContinental Hotels Group and Environment
Paul Snyder, InterContinental Hotels Group
Case Example: Coca-Cola and Youth Employment
Claudia Lorenzo, Coca-Cola Brasil
Audience Q&A and Wrap-up

7/29/2019 Measuring Shared Value Presentation
http://slidepdf.com/reader/full/measuring-shared-value-presentation 3/15
3
FSG.ORG
©2013 FSG
About FSG and Measuring Shared Value
• FSG− Nonprofit consulting and research firm founded
in 2000 by HBS Prof. Michael Porter and MarkKramer
− Staff of over 100 in Boston, Geneva, Mumbai,San Francisco, Seattle, and Washington DC
− Recognized thought leader and advisor instrategic planning and evaluation to over 400foundations, corporations, and nonprofits
• Measur ing Shared Value Report
– Published in Oct. 2012 by Porter and FSG
– Builds on “Creating Shared Value” published inHBR in 2011 by FSG founders Porter and Kramer
– How to understand and track the connectionbetween social and business results to driveshared value creation
– Sponsored by Nestlé, Intel, InterContinentalHotels Group, and the Rockefeller Foundation

7/29/2019 Measuring Shared Value Presentation
http://slidepdf.com/reader/full/measuring-shared-value-presentation 4/15
4 ©2013 FSG
FSG.ORG
Effective Measurement Is a Lynchpin for Shared Value Adopt ion
• Executives and managers need actionable data to make abusiness case and inform improved business decisions
• Conflation and confusion with other measurement approaches,e.g., impact assessments and sustainability metrics
• Limited expertise linking social results to business results
• Businesses are leaving value on the table
• Creating a line of sight for investors
Why is Measuring Shared Value important?

7/29/2019 Measuring Shared Value Presentation
http://slidepdf.com/reader/full/measuring-shared-value-presentation 5/15
5
FSG.ORG
©2013 FSG
Shared Value Measurement Requires an Iterative Process That Is
Integrated with Business Strategy
Strategic priorities inform the focus and extent of shared value
measurement and the data and insights from shared value measurement
inform refinement of the shared value strategy

7/29/2019 Measuring Shared Value Presentation
http://slidepdf.com/reader/full/measuring-shared-value-presentation 6/15
6
FSG.ORG
©2013 FSG
Shared Value Measurement Systematically Links Business
and Social Results
Reconceiving products
and marketsHow targeting unmet needs
drives incremental revenue and
profits
• Increased revenue
• Increased market share
• Increased market growth
• Improved profitability
• Improved patient care
• Reduced carbon footprint
• Improved nutrition
• Improved education
Redefining productivity
in the value chainHow better management of
internal operations increases
productivity and reduces risks
• Improved productivity
• Reduced operating costs
• Secured supply
• Improved quality
• Improved profitability
• Reduced energy use
• Reduced water use
• Reduced raw materials
• Improved job skills
• Improved employee incomes
Enabling cluster
developmentHow changing societal
conditions outside the company
unleashes new growth and
productivity gains
• Reduced costs
• Secured supply
• Improved distribution infrastructure
• Improved workforce access
• Improved profitability
• Improved education
• Increased job creation
• Improved health
• Improved incomes
1
2
3
Levels of Shared Value Business Results Social Resul ts
7/29/2019 Measuring Shared Value Presentation
http://slidepdf.com/reader/full/measuring-shared-value-presentation 7/157
FSG.ORG
©2013 FSG
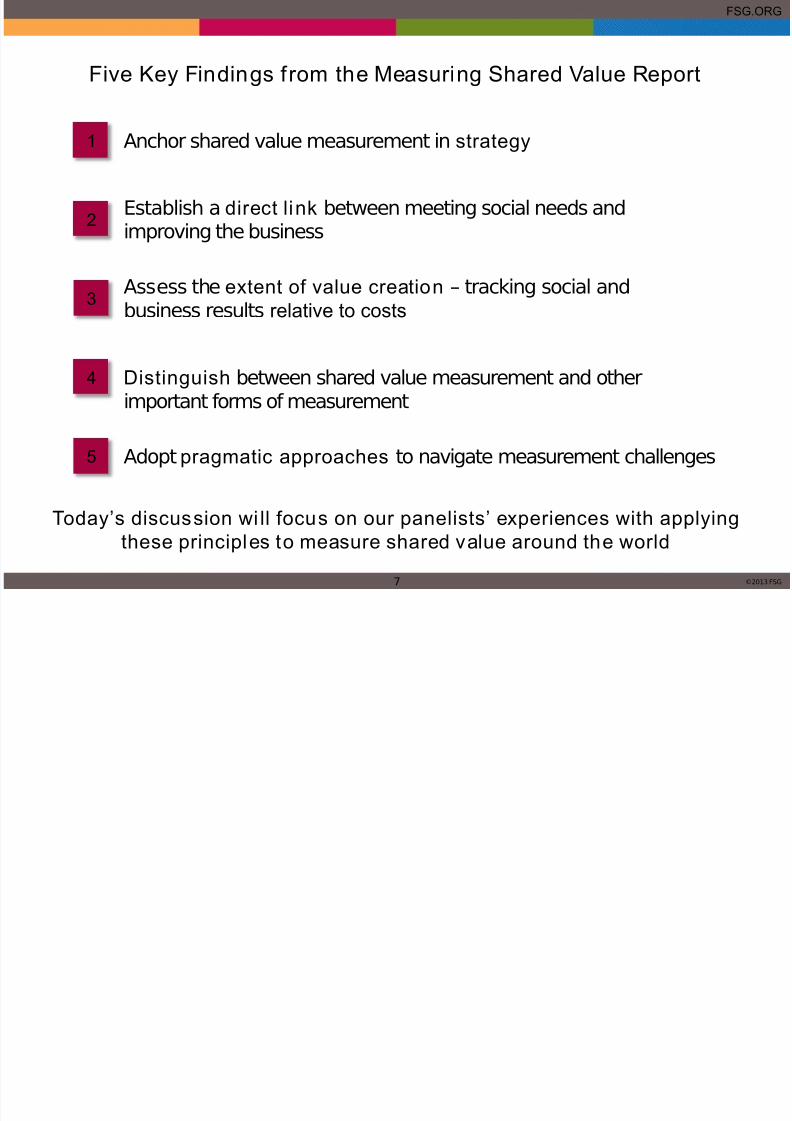
Five Key Findings from the Measuring Shared Value Report
Today’s discussion wi ll focus on our panelists’ experiences with applying
these principles to measure shared value around the world
Adopt pragmatic approaches to navigate measurement challenges
Distinguish between shared value measurement and otherimportant forms of measurement
Assess the extent of value creation – tracking social andbusiness results relative to costs
Establish a direct link between meeting social needs andimproving the business
Anchor shared value measurement in strategy1
2
3
4
5

7/29/2019 Measuring Shared Value Presentation
http://slidepdf.com/reader/full/measuring-shared-value-presentation 8/158
FSG.ORG
©2013 FSG
2004: The NestléCommitmentto Africa
2005:
The NestléConcept of CSR asimplementedin LatinAmerica
2006:
The NestléWaterManagementReport
2007:
The NestléCreatingShared
ValueReport
2008:
The NestléCSV and
NutritionReport
2009: TheNestlé CSVsummaryReport
2010: TheNestlé CSVand RuralDevelopmentSummaryReport
2011: TheNestlé CSVand WaterSummaryReport
2012: Nestlé in
Society: Creating SharedValue andMeeting ourCommitments
2012 (March)
Nestlé inSociety:CSV andMeeting ourCommitments
Evolut ion of Creating Shared Value at Nestlé

7/29/2019 Measuring Shared Value Presentation
http://slidepdf.com/reader/full/measuring-shared-value-presentation 9/159
FSG.ORG
©2013 FSG
Nestlé Creates Shared Value across Three Focus Areas

7/29/2019 Measuring Shared Value Presentation
http://slidepdf.com/reader/full/measuring-shared-value-presentation 10/1510
FSG.ORG
©2013 FSG
10
Nestlé’s Rural Development Framework
CSV Goal Farmers are business-orientated and farming by choice
Business Value Societal Value
Outcomes
Crop supply is increasing Farmer productivity is increasing
Crop quality is increasing Farmers are resilient to external shocks
Transparency within supply chains Farmer net incomes are increasing
Farmers are responsible stewards of natural & human resources (including workers)
Activities
Provision of elite planting and othermaterials
Training (technical & business) to farmers& women on costs, quality, productivity
RSG process, supply chain maps Facilitate provision of financial services
RSGs on water, deforestation, humanrights, biodiversity, soil
Training on water, deforestation, humanrights, biodiversity, soil
Strengthen farmer groups Allocation of price premiums
Measuring
Progress
Business Outcomes
Business Activities
Societal Outcomes
Societal Activities
Key Enablers
Cocoa Plan, Nescafé Plan, Nespresso AAA, Dairy Platform, Local Sourcing Plans, Trade
Partner Programmes, RSG Programme, SAIN, SMETA Audits, Supplier CodeRSG =Responsible Sourcing Guidelines

7/29/2019 Measuring Shared Value Presentation
http://slidepdf.com/reader/full/measuring-shared-value-presentation 11/1511
FSG.ORG
©2013 FSG
IHG’s Green Engage Approach Reduces Its Environmental
Footprint and Drives System-Wide Cost Reduct ions
Measurement
Lessons and Insights:
• Illuminates the relative sharedvalue potential of a wide range of
practices• On-line tool provides real-time
data on energy savings from allparticipating hotels
• Measurement allows for testingtheories and leads to real
refinements in how IHG runs itsbusiness
Measurement provides the necessary data to improve IHG’s SV strategy
InterContinental Hotels
Group’s Green Engage
• Prioritized environmentalimpact efforts based onanticipated impact andeconomic returns
• Modeled dozens of optionsfor reducing energy, water,and waste
• Rolled out to 2,250 hotelswith up to 25% energysavings in hotels

7/29/2019 Measuring Shared Value Presentation
http://slidepdf.com/reader/full/measuring-shared-value-presentation 12/1512
FSG.ORG
© 2013 FSG
Coca-Cola Brasil’s
• Train local youth in retailing,business development, and
entrepreneurship
• Social goals: Increase youth
skills, self-esteem,
employability, and income
• Business goals: Increase
value chain efficiency through
incremental sales and
reduced selling costs
Shared Value Measurement Improves Coca-Cola Brasil’s
Value Chain Performance and Youth Employability
Measurement
Lessons and Insights:
• Tracking Progress – Same process and discipline as other
business approaches, using real-time data
– Linkage between social and business goals
• Benefits of Measurement – Engage current culture in a fact-based mode
– Essential to refine business strategy
– Market segmentation
– Allows organized dialogue and partnership
with key stakeholders
• Key Learnings – Integral to long-term vision and commitments
– Innovation in methodology
– Partnerships
Innovat ion, partnership, and disc ipl ine are key ing redients
FSG ORG

7/29/2019 Measuring Shared Value Presentation
http://slidepdf.com/reader/full/measuring-shared-value-presentation 13/15
FSG.ORG
13 ©2013 FSG
Audience Questions
Paul Snyder
InterContinental Hotels Group
Claudia Lorenzo
Coca-Cola Brasil
Suzanne Fallender Intel
Janet VoûteNestlé
Greg Hills
FSG
FSG ORG

7/29/2019 Measuring Shared Value Presentation
http://slidepdf.com/reader/full/measuring-shared-value-presentation 14/15
FSG.ORG
14 ©2013 FSG
The Shared Value Init iative Was Launched in September 2012 to
Advance Shared Value Globally
Leadership Council
Supporters
AssociatesShared Value Leadership Summit,including Professor Michael Porter, on May
23, 2013 in Cambridge, MA
A multi-stakeholder effort that aims to drive
adoption and improve implementation of shared value strategies among leadingcompanies, civil society, and governmentorganizations
If you are interested in joining the Shared
Value Initiative, please contact J ustinBakule at [email protected]
FSG ORG

7/29/2019 Measuring Shared Value Presentation
http://slidepdf.com/reader/full/measuring-shared-value-presentation 15/1515
FSG.ORG
Thank You!
• Thank you for joining in the conversation today
• Please fill in the brief electronic survey that you’ll receive aftertoday’s event to share your feedback with us
• For more information onShared Value
, visithttp://www.fsg.org/OurApproach/SharedValue.aspx
•To access the recording and to download the slides fromtoday’s webinar, and the Measuring Shared Value article,
visit http://www.fsg.org/measuringsharedvalue