measuring speech quality for text-to-speech systems: development and assessment of a modified mean...
TRANSCRIPT

COMPUTER
SPEECH ANDComputer Speech and Language 19 (2005) 55–83LANGUAGE
www.elsevier.com/locate/csl
Measuring speech quality for text-to-speechsystems: development and assessment of a modified
mean opinion score (MOS) scale
Mahesh Viswanathan a,*, Madhubalan Viswanathan b,1
a IBM Thomas J. Watson Research Center, P.O. Box 218, 1101 Kitchawan Road, Route 134,
Yorktown Heights, NY 10598, USAb Department of Business Administration, University of Illinois at Urbana-Champaign, 61 Wohlers Hall,
MC-706, 1206 S. Sixth Street, Champaign, IL 61820, USA
Received 16 December 2002; received in revised form 17 December 2003; accepted 17 December 2003
Available online 8 January 2004
Abstract
The quality of text-to-speech systems can be effectively assessed only on the basis of reliable and valid
listening tests to assess overall system performance. A mean opinion scale (MOS) has been the recom-
mended measure of synthesized speech quality [ITU-T Recommendation P.85, 1994. Telephone trans-
mission quality subjective opinion tests. A method for subjective performance assessment of the quality of
speech voice output devices]. We assessed this MOS scale and developed and tested a modified measure of
speech quality. This modified measure has new items specific to text-to-speech systems. Our research was
motivated by the lack of clear evidence of the conceptual content of as well as the psychometric properties
of the MOS scale. We present conceptual arguments and empirical evidence for the reliability and validityof a modified scale. Moreover, we employ state of the art psychometric techniques such as confirmatory
factor analysis to provide strong tests of psychometric properties. This modified scale is better suited to
appraise synthesis systems since it includes items that are specific to the artifacts found in synthesized
speech. We believe that the speech synthesis research communities will find this modified scale a better fit
for listening tests to assess synthesized speech.
� 2004 Elsevier Ltd. All rights reserved.
* Corresponding author. Tel.: +1-914-945-1754; fax: +1-914-945-4490.
E-mail addresses: [email protected] (M. Viswanathan), [email protected] (M. Viswanathan).1 Tel.: +(217)-333-4550; fax: +(217)-244-7969.
0885-2308/$ - see front matter � 2004 Elsevier Ltd. All rights reserved.
doi:10.1016/j.csl.2003.12.001

56 M. Viswanathan, M. Viswanathan / Computer Speech and Language 19 (2005) 55–83
1. Introduction
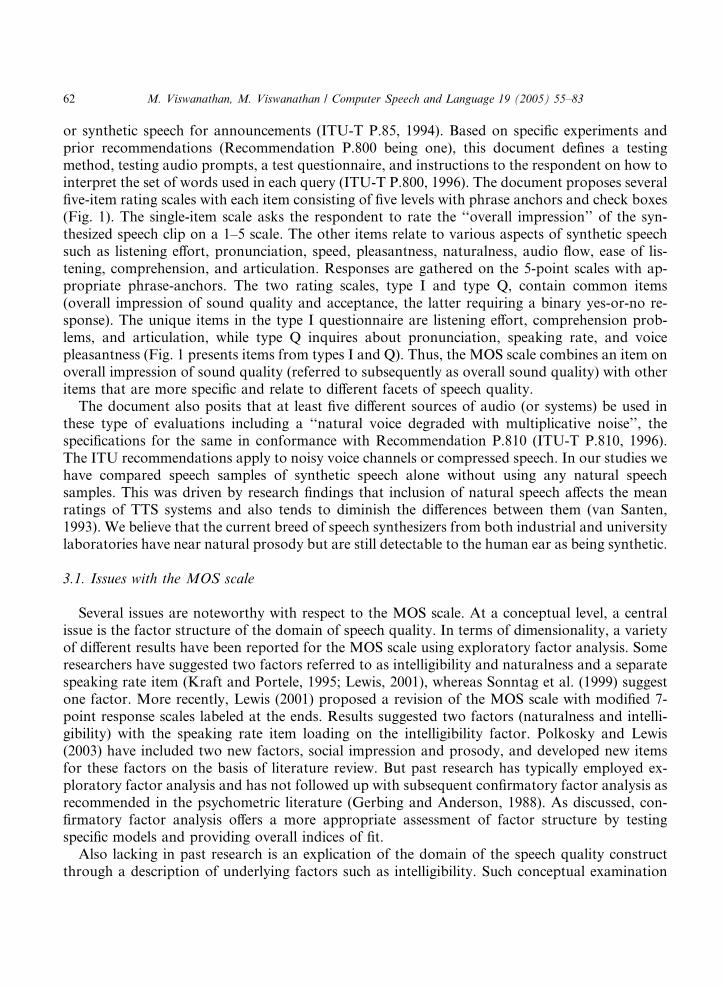
The methodology for text-to-speech (TTS) listening tests must be rigorous in voice samplepresentation, subject selection, and questionnaire preparation. Listening tests involve preparingseveral samples of synthesized output from multiple TTS systems, randomizing the system–sen-tence combinations and asking listeners to score each output audio. Listening tests assess thequality of each tested synthesis system relative to another. Johnston (1996) notes that opiniontests of speech quality are the basis of speech quality assessment. A mean opinion scale (MOS) hasbeen the recommended measure of text-to-speech quality (ITU-T P.85, 1994) consisting of seven5-point scales that assess overall sound quality, listening effort, comprehension problems, artic-ulation, pronunciation, speaking rate and pleasantness (Fig. 1). MOS tests have been reported tobe reliable for assessment of TTS quality (Salza et al., 1996).
Given the importance of accurate measurement of speech quality, we assessed the MOS scaleand developed and tested a modified measure of speech quality. Our research was motivated bythe lack of clear evidence of the measurement or psychometric properties of the MOS scale. Froma measurement perspective, which emphasizes reliability and validity of measures, there areseveral issues that warrant attention with the MOS scale. Past research lacks explication of thecontent of the measure in terms of what it is actually measuring, such as the factors or dimensionsof speech quality. Moreover, in terms of psychometric procedures for measure assessment, pastresearch has employed exploratory factor analysis to assess factor structure, a procedure ap-propriate at preliminary stages of measure development that needs to be followed up with testingusing confirmatory factor analysis. In this paper, we carefully examine the psychometric prop-erties of the MOS scale. We assessed a modified scale of speech quality that used the MOS scale asthe starting point. We present conceptual arguments and empirical evidence for the reliability andvalidity of our scale. Moreover, we employ state of the art psychometric techniques such asconfirmatory factor analysis to provide strong tests of psychometric properties.
In the next section, we provide a generic background of the basics of measurement. The nextsection presents a review of past research on the measurement of speech quality and a discussionof issues pertaining to the MOS scale that motivate the current study. This is followed by anoverview of the studies conducted. Next we present a detailed analysis of each of the studies andconclude with a general discussion of our findings.
2. Review of psychometric background
This section covers some generic issues in measurement by way of providing a background withwhich to assess conceptual and empirical issues with the MOS scale as well as procedures used inthis paper to address these issues.Relevant metrics are summarized in Appendix A. Psychologicalmeasurement has focused on developing concrete measures of what are often abstract concepts.
2.1. Conceptual and operational definitions
At the center of psychological measurement represented by the considerable literature onpsychometrics is the distinction between conceptual and operational definitions of concepts (or

NAME: _______________________ DEPT. _____ PHONE ______ DATE __________
Acceptance (Type I & Q) Do you think that this voice could be used for an information service by telephone?
Yes
No
Comprehension problems (Type I) Did you find certain words hard to understand? � Never
� Rarely
� Occasionally
� Often
� All of the time
Articulation (Type I) Were the sounds distinguishable? � Yes, very clear
� Yes, clear enough
� Fairly clear
� No, not very clear
� No, not at all
Pronunciation (Type Q) Did you notice any anomalies in pronunciation? � No
� Yes, but not annoying
� Yes, slightly annoying
� Yes, annoying
� Yes, very annoying
Voice pleasantness (Type Q) How would you describe the voice? � Very pleasant
� Pleasant
� Fair
� Unpleasant
� Very unpleasant
Speaking rate (Type Q) The average speed of delivery was: � Much faster than preferred
� Faster than preferred
� Preferred
� Slower than preferred
� Much slower than preferred
Listening effort (Type I) How would you describe the effort you were required to make in order to understand the message? � Complete relaxation possible;
no effort required � Attention necessary; no
appreciable effort required � Moderate effort required � Effort required � No meaning understood with
any feasible effort
Overall impression (Type I & Q) How do you rate the quality of the sound of what you just heard? � Excellent
� Good
� Fair
� Poor
� Bad
Fig. 1. The initial version of the ITU MOS questionnaire. The respondents filled out printed versions of this figure
using the check-off boxes. The results were later manually entered into a spreadsheet for analysis. The choices translate
to a numeric range from 1 to 5, 5 being the most positive. The speaking rate item was scored on a 3-point scale with 3
being the mid point of the scale and scores on either side moving toward a 1 for the extremes. Each test set contains a
single fixed calibration synthesized speech utterance of about median quality relative to all the other test samples. This
calibration sample was played first before any of the test samples to be evaluated. (Note. The ‘‘Type I’’ and ‘‘Type Q’’
classification labels shown in parentheses alongside the item headings were not in the original questionnaire to
respondents.)
M. Viswanathan, M. Viswanathan / Computer Speech and Language 19 (2005) 55–83 57
58 M. Viswanathan, M. Viswanathan / Computer Speech and Language 19 (2005) 55–83
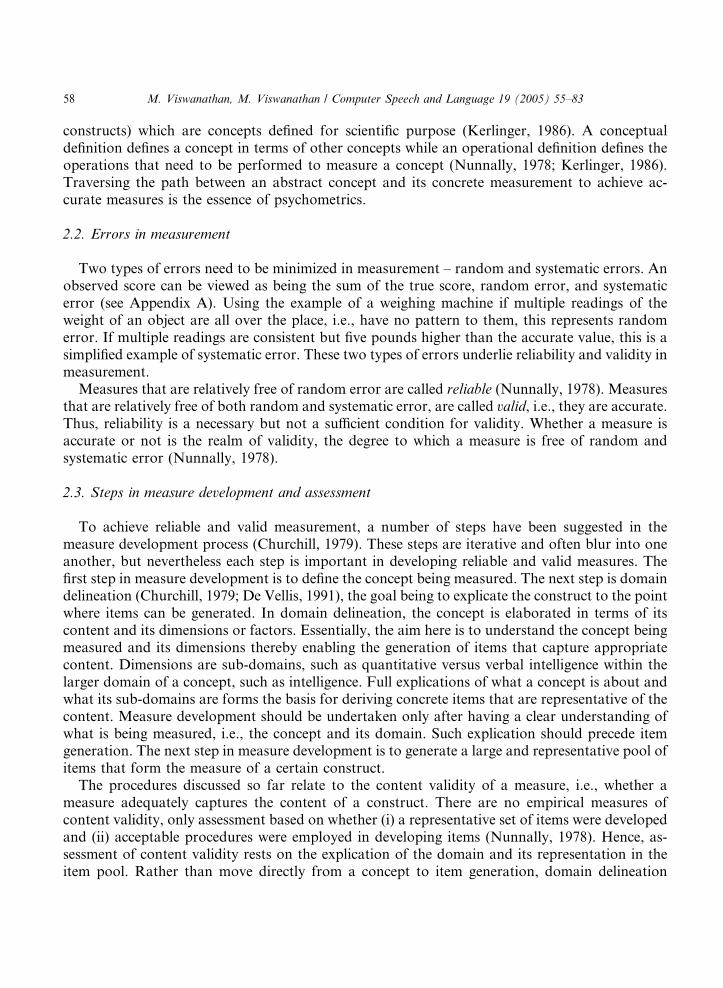
constructs) which are concepts defined for scientific purpose (Kerlinger, 1986). A conceptualdefinition defines a concept in terms of other concepts while an operational definition defines theoperations that need to be performed to measure a concept (Nunnally, 1978; Kerlinger, 1986).Traversing the path between an abstract concept and its concrete measurement to achieve ac-curate measures is the essence of psychometrics.
2.2. Errors in measurement
Two types of errors need to be minimized in measurement – random and systematic errors. Anobserved score can be viewed as being the sum of the true score, random error, and systematicerror (see Appendix A). Using the example of a weighing machine if multiple readings of theweight of an object are all over the place, i.e., have no pattern to them, this represents randomerror. If multiple readings are consistent but five pounds higher than the accurate value, this is asimplified example of systematic error. These two types of errors underlie reliability and validity inmeasurement.
Measures that are relatively free of random error are called reliable (Nunnally, 1978). Measuresthat are relatively free of both random and systematic error, are called valid, i.e., they are accurate.Thus, reliability is a necessary but not a sufficient condition for validity. Whether a measure isaccurate or not is the realm of validity, the degree to which a measure is free of random andsystematic error (Nunnally, 1978).
2.3. Steps in measure development and assessment
To achieve reliable and valid measurement, a number of steps have been suggested in themeasure development process (Churchill, 1979). These steps are iterative and often blur into oneanother, but nevertheless each step is important in developing reliable and valid measures. Thefirst step in measure development is to define the concept being measured. The next step is domaindelineation (Churchill, 1979; De Vellis, 1991), the goal being to explicate the construct to the pointwhere items can be generated. In domain delineation, the concept is elaborated in terms of itscontent and its dimensions or factors. Essentially, the aim here is to understand the concept beingmeasured and its dimensions thereby enabling the generation of items that capture appropriatecontent. Dimensions are sub-domains, such as quantitative versus verbal intelligence within thelarger domain of a concept, such as intelligence. Full explications of what a concept is about andwhat its sub-domains are forms the basis for deriving concrete items that are representative of thecontent. Measure development should be undertaken only after having a clear understanding ofwhat is being measured, i.e., the concept and its domain. Such explication should precede itemgeneration. The next step in measure development is to generate a large and representative pool ofitems that form the measure of a certain construct.
The procedures discussed so far relate to the content validity of a measure, i.e., whether ameasure adequately captures the content of a construct. There are no empirical measures ofcontent validity, only assessment based on whether (i) a representative set of items were developedand (ii) acceptable procedures were employed in developing items (Nunnally, 1978). Hence, as-sessment of content validity rests on the explication of the domain and its representation in theitem pool. Rather than move directly from a concept to item generation, domain delineation

M. Viswanathan, M. Viswanathan / Computer Speech and Language 19 (2005) 55–83 59
allows for a gradual process of traversing the path from the conceptual to the operational orconcrete.
2.4. Reliability
After item-generation, the next step is to assess measures for a type of reliability, internalconsistency reliability. Measures are administered to a sample of respondents and correlationsacross respondents between items and total scores computed. Item-to-total correlations assess theextent to which items are correlated with the total. Higher item-to-total correlations suggest that aspecific item covaries with the total to a greater extent. In other words, a higher rating for arespondent on an item is likely to be associated with a higher total score, i.e., higher ratings acrossall items. This is an indicator of the degree to which there is consistency in responses between anitem and other items in a measure. Items are deleted on this basis to achieve a higher coefficient a,an overall indicator of internal consistency reliability (see Appendix A). This process is repeateduntil the marginal gain in a is minimal. Coefficient a is the proportion of variance attributable tocommon sources (De Vellis, 1991). Common sources are the underlying causes that lead to re-sponses, ideally the construct being measured. In other words, coefficient a assesses the degree towhich a set of items that purportedly attempt to measure speech quality covary together, showingconsistency in responses across items. It does not differentiate between a single common sourceand multiple common sources.
Researchers have suggested that the average inter-item correlation is another useful summaryof internal consistency and should ideally be in a range between 0.2 and 0.4 (Briggs and Cheek,1988). The rationale for such a guideline is that, if correlations between items are too low, itsuggests that a common core may not exist. If correlations are too high, items may be very similarand only capture some narrow sub-domain of a construct.
Internal consistency reliability is often supplemented with test–retest reliability. Typically, thesame scale is administered twice with an interval of a few weeks, with a 10 to 12 week intervaloften being recommended. The logic of test–retest reliability is very simply that individuals whoscore higher (or lower) in one administration should score higher (or lower) in the second or viceversa, i.e., that the ordering of scores should be approximately maintained. A key assumption oftest–retest reliability is that the ‘‘true score’’ does not change between test and retest.
2.5. Dimensionality
The next step in the process is to assess the dimensionality of a measure. Reliability throughinternal consistency assesses whether a set of items are tapping into a common core as measuredthrough the degree to which they covary with each other. But whether the common core consistsof a specific number of dimensions is the realm of dimensionality and is assessed through factoranalysis. Factor analysis is an approach where variables are reduced into linear combinations ofvariables, i.e., factors (Hair, 1998). A factor is essentially a linear combination of variables from amathematical perspective and a distinct dimension from a conceptual perspective (Hair, 1998; alsosee Appendix A). In this context, factor analysis is conducted to assess the number of factors thatare extracted and to assess the degree to which items correlate with specific factors (Coovert and

60 M. Viswanathan, M. Viswanathan / Computer Speech and Language 19 (2005) 55–83
McNellis, 1988). The assumption in performing factor analysis on a set of items is that an un-derlying factor or factors, i.e., combinations of individual items, exist.
The results of factor analysis include the number of factors extracted and the variance ex-plained by each factor (see Appendix A). A judgment has to be made as to the number ofmeaningful factors underlying the data by comparing the percentage of variance explained byeach extracted factor (reflected in eigen values) in light of expectations. For instance, a dominantfactor would be indicated by the first factor having a much higher eigen value (or percent ofvariance explained) then the second factor. The noteworthy point here is that not all extractedfactors are meaningful and several methods are used to assess the number of meaningful factors.
Another issue in factor analysis is factor rotation. The purpose of rotation is to facilitate in-terpretation of factors by simplifying loadings to be closer to 1 or 0. Different types of rotationsserve different purposes, each with its limitations. Varimax rotation is one such approach oftenused when multiple dimensions are anticipated. While this type of rotation is useful when multipledimensions are present, it may sometimes extract multiple factors even when there is a singleunderlying dimension, i.e., it may over-predict multiple factors.
Another distinction in factor analysis is between using principal component analysis andcommon factor analysis (Hair, 1998). The former uses all the variance available and is a datareduction technique, while the latter uses only the common variances shared by variables, and ismore appropriate for conceptually driven examination of the data. In performing common factoranalysis, the communality of each item is computed, an indicator of the variance in each itemattributable to common factors (see Appendix A). Essentially, variance for each item can bedivided into error, specific and common parts.
Factor analysis presents the correlations between individual items and factors referred to asloadings. If a single factor is expected, then this is likely to be the first factor with itemcorrelations or loadings with this factor being high. (Presumably because the construct inquestion rather than incidental factors being measured should be dominant and explain themost variation.) Individual items can be evaluated by assessing their loading or correlationwith the factor considered to represent the overall construct. Exploratory factor analysisprovides initial evidence of dimensionality but confirmatory factor analysis is required forconclusive evidence. Exploratory factor analysis assumes that all items are related to all fac-tors whereas confirmatory factor analysis imposes a more restrictive model where items havepre-specified loadings with certain factors which may themselves be related to each other.Whereas exploratory factor analysis uses a general model no matter what the substantivelymotivated constraints are. Confirmatory factor analysis allows more precise specification of therelationship between items and factors.
Confirmatory factor analysis allows isolation of items that measure multiple factors that are ofsubstantive importance (see Appendix A). If only one item is influenced by an additional un-known factor, that is usually tolerable. In fact, all items will probably have some unique variance.However, items that measure more than one substantive factor have to be identified and deleted.Psychometricians have strongly emphasized that while exploratory factor analysis can be used inpreliminary stages of measure development, it should be followed up with confirmatory factoranalysis (Gerbing and Anderson, 1988). Confirmatory factor analysis tests carefully specifymodels of the relationship between items and factors (Gerbing and Anderson, 1988). It alsoprovides overall indices of fit between the proposed model and the data, which ranges in value

M. Viswanathan, M. Viswanathan / Computer Speech and Language 19 (2005) 55–83 61
from 0 to 1. Exploratory factor analysis employs more of a shotgun approach by allowing allitems to correlate to all factors.
2.6. Validity
The next step in the process of measure development is to assess the validity of a measure.Internal consistency reliability captures the degree to which a set of items taps into some commonsources of variance, presumably the construct being measured. What the common sources are, i.e.,how many factors underlie the data, is in the purview of dimensionality. Whether the commonsources that are reliably measured are the construct in question is in the purview of validity.Several types of validity need to be considered (Nunnally, 1978) and very brief descriptions areprovided below: As discussed, content validity is based on a judgment whether the content ofitems in a scale represents the conceptual domain of a construct. This form of validity is evaluatedthrough the procedures employed for developing measures and through assessing whether items ina measure are representative of the domain of a concept. Other forms of validity are assessedempirically by examining relationships between measures of different constructs. Predictive va-lidity relates to whether a measure predicts what it is expected to predict such as an externalcriterion, e.g., SAT and grades in college. Evidence of convergent validity is provided by con-vergence or correlation between the measure being assessed and another validated measure of thesame construct, e.g., two measures of quantitative intelligence. Nomological validity relates towhether the measure of a construct relates to measures of other constructs that it is theoreticallyexpected to be correlated with. Discriminant validity relates to whether a measure of a construct isnot related to measures of constructs that it is not expected to relate to. Construct validity is anumbrella term that relates to whether a measure measures what it aims to measure.
2.7. Summary
A few general points are noteworthy with regard to psychometrics. First, relatively large samplesizes are essential for various psychometric procedures (Nunnally, 1978; Guadagnoli and Velicer,1988). Second, lack of sufficient variation inhibits the ability of an item to covary or correlate withother items and with the total measure. Covariations, reflected statistically in correlations, beingthe underpinning of psychometric analyses, lack of sufficient variation inhibits the ability of anitem to covary with other items. Third, although reliability and validity are the key concepts inmeasurement, dimensionality is discussed separately earlier. However, it is subsumed within va-lidity, the aim being to understand what a measure is capturing both conceptually and empirically.Fourth, and more generally, measure validation is an ongoing process whereby measures arerefined, items added, dimensions expanded, etc. Therefore, no single study is definitive in terms ofmeasure validation.
3. The MOS scale
Our reference MOS scale document is the ITU-T (formerly CCITT) Recommendation P.85 forsubjective performance assessment of speech from telephone networks, which may store recorded
62 M. Viswanathan, M. Viswanathan / Computer Speech and Language 19 (2005) 55–83
or synthetic speech for announcements (ITU-T P.85, 1994). Based on specific experiments andprior recommendations (Recommendation P.800 being one), this document defines a testingmethod, testing audio prompts, a test questionnaire, and instructions to the respondent on how tointerpret the set of words used in each query (ITU-T P.800, 1996). The document proposes severalfive-item rating scales with each item consisting of five levels with phrase anchors and check boxes(Fig. 1). The single-item scale asks the respondent to rate the ‘‘overall impression’’ of the syn-thesized speech clip on a 1–5 scale. The other items relate to various aspects of synthetic speechsuch as listening effort, pronunciation, speed, pleasantness, naturalness, audio flow, ease of lis-tening, comprehension, and articulation. Responses are gathered on the 5-point scales with ap-propriate phrase-anchors. The two rating scales, type I and type Q, contain common items(overall impression of sound quality and acceptance, the latter requiring a binary yes-or-no re-sponse). The unique items in the type I questionnaire are listening effort, comprehension prob-lems, and articulation, while type Q inquires about pronunciation, speaking rate, and voicepleasantness (Fig. 1 presents items from types I and Q). Thus, the MOS scale combines an item onoverall impression of sound quality (referred to subsequently as overall sound quality) with otheritems that are more specific and relate to different facets of speech quality.
The document also posits that at least five different sources of audio (or systems) be used inthese type of evaluations including a ‘‘natural voice degraded with multiplicative noise’’, thespecifications for the same in conformance with Recommendation P.810 (ITU-T P.810, 1996).The ITU recommendations apply to noisy voice channels or compressed speech. In our studies wehave compared speech samples of synthetic speech alone without using any natural speechsamples. This was driven by research findings that inclusion of natural speech affects the meanratings of TTS systems and also tends to diminish the differences between them (van Santen,1993). We believe that the current breed of speech synthesizers from both industrial and universitylaboratories have near natural prosody but are still detectable to the human ear as being synthetic.
3.1. Issues with the MOS scale
Several issues are noteworthy with respect to the MOS scale. At a conceptual level, a centralissue is the factor structure of the domain of speech quality. In terms of dimensionality, a varietyof different results have been reported for the MOS scale using exploratory factor analysis. Someresearchers have suggested two factors referred to as intelligibility and naturalness and a separatespeaking rate item (Kraft and Portele, 1995; Lewis, 2001), whereas Sonntag et al. (1999) suggestone factor. More recently, Lewis (2001) proposed a revision of the MOS scale with modified 7-point response scales labeled at the ends. Results suggested two factors (naturalness and intelli-gibility) with the speaking rate item loading on the intelligibility factor. Polkosky and Lewis(2003) have included two new factors, social impression and prosody, and developed new itemsfor these factors on the basis of literature review. But past research has typically employed ex-ploratory factor analysis and has not followed up with subsequent confirmatory factor analysis asrecommended in the psychometric literature (Gerbing and Anderson, 1988). As discussed, con-firmatory factor analysis offers a more appropriate assessment of factor structure by testingspecific models and providing overall indices of fit.
Also lacking in past research is an explication of the domain of the speech quality constructthrough a description of underlying factors such as intelligibility. Such conceptual examination

M. Viswanathan, M. Viswanathan / Computer Speech and Language 19 (2005) 55–83 63
should ideally precede item generation and empirical assessment. Conceptual examination andempirical assessment should then proceed in conjunction through the measure development andassessment process. Intelligibility is related to the extent to which words and sentences can beunderstood, therefore, items tapping into the factor assess listening effort, pronunciation,speaking rate, comprehension problems, and articulation. These are aspects of speech that con-tribute to intelligibility. Therefore, contrary to results that suggest speaking rate as being a sep-arate factor, it conceptually belongs in the intelligibility factor. Naturalness relates to the degreeto which speech is similar to natural human speech, hence items such as naturalness, ease oflistening, pleasantness and audio flow are relevant. These are impressions about the speech andthe feeling it engenders in respondents. This should be contrasted with specific aspects of re-spondents� cognition such as speaking rate, listening effort, and pronunciation. Thus, conceptu-ally, intelligibility and naturalness relate to specific cognitions about aspects of the speech versusbroader impressions and feelings about the speech, respectively. Central here from a measuredevelopment perspective is the importance of explicating the domain of speech quality prior totesting through confirmatory factor analysis.
Another issue with the MOS scale is the inclusion of an item that is global in nature assessingoverall sound (speech) quality, with other items that are more specific to aspects of speech qualitysuch as articulation, pronunciation, etc. Such an approach is problematic; either the scale shouldconsist of all global or all specific items. The global approach essentially asks for overall im-pressions of sound quality while the specific approach has items representing different aspects ofspeech quality. For example, if different items relate to different factors such as intelligibility andnaturalness, then a global item would relate to both factors being broader than either. In fact, thisargument is supported by inconsistent results that have been obtained. While this global item hasbeen thought to belong to the naturalness factor, Lewis (2001) unexpectedly found that it relatedto the intelligibility factor.
The nature of response scales poses another issue for the MOS scale. The scale has typicallyemployed five response categories that are fully described (Fig. 1). More recently, Lewis (2001)employed a 7-point scale labeled at the ends, for instance, end-anchored very unnatural tovery natural for an item on naturalness. Such 7-point end-anchored scales are frequently usedin a variety of settings (Cox, 1980) including the measurement of attitudes and individualdifference variables and provide the ability for more variation than a 5-point scale. However,for a setting where respondents listen to stimuli (speech) and rate each of them, we argue thatthe 5-point scale with meaningful labels for each level is more appropriate. When the labelsfor each level are carefully constructed, they provide clear calibration which is necessary in asituation where respondents are evaluating complex, sensory stimuli. Listening to speech andrating them on self-report scales across several attributes could be considered a somewhatcomplex task, when compared to completing, say, self-report scales on personality traits. Thecurrent task involves listening to many sensory stimuli and rating them on many attributes.Therefore, we decided to use a few meaningful levels for each item that likely match the wayrespondents think about the stimuli and provided descriptors of each of these five levels thatcapture the distinctions. Moreover, with complex stimuli, respondents may find it easier tomanage five rather than seven response categories (Cox, 1980). Therefore, we start out byassessing five response categories typically used in the MOS scale, and modify them acrossstudies.

64 M. Viswanathan, M. Viswanathan / Computer Speech and Language 19 (2005) 55–83
A key issue with past research relates to the adequacy of samples as well as choice of psy-chometric analyses. Given the costs of administering speech tests, researchers in this area haveoften used small samples and treated multiple responses from the same individual as independentobservations. As discussed, relatively large sample sizes are essential for various psychometricprocedures (Nunnally, 1978; Guadagnoli and Velicer, 1988). We address this issue by using arelatively larger sample in our final study. As discussed, we also employ confirmatory factoranalysis to provide appropriate tests of factor structure whereas past research has employed ex-ploratory factor analysis, a technique appropriate in preliminary stages of measure developmentand assessment.
4. Overview of studies
The rationale for the studies reported here was to establish the reliability, dimensionality, andvalidity of a modified MOS scale through a logical sequence of studies that used the original MOSscale as the starting point. First, individual items and response categories were carefully edited forclarity of wording and for conveying gradations in responses. Five response categories were usedfor each scale as discussed earlier, to provide respondents with a meaningful set of categoriesthat were also manageable from a cognitive perspective while listening to stimuli. The first threestudies also involved modifying an existing item and adding additional items based on resultsof psychometric tests. The third and fourth studies tested for the 9-item version of the modi-fied MOS scale. The fifth study used a relatively large sample to perform confirmatory factoranalysis.
The psychometric assessments aimed to test reliability, dimensionality, and validity. As dis-cussed, reliability or consistency, i.e., freedom from random error, was assessed in the first fourstudies through a measure of internal consistency, coefficient a (Cronbach, 1951; Peterson, 1994).Dimensionality, the underlying factor structure of the scale as to whether it consisted of a singlefactor or multiple factors such as intelligibility and naturalness, was assessed through exploratoryfactor analysis in Studies 1–4. Confirmatory factor analysis was used in Study 5 to carefullycompare alternate models of speech quality (e.g., 1-factor versus 2-factor models or whether theglobal item belonged with either factor). As discussed, validity pertains to whether a measureaccurately measures the underlying construct it aims to measure (Nunnally, 1978). Here, theproposed 9-item scale was related to a single item scale of overall sound quality as a test ofconvergent validity, the degree to which two different measures of the same construct are stronglyrelated to each other. The scale was also related to an item on acceptability of speech systems forspecific applications, a test of nomological validity, i.e., whether a measure is related to measuresof constructs it is expected to be related to.
A noteworthy point in terms of analyses was that the datasets for Study 1 as well as Studies 2–4were formed from multiple responses from each individual respondent being treated as inde-pendent observations, an issue addressed later in the paper. Given the costs of conducting speechtests, sample sizes for the first four studies were necessarily small, similar to past research. In fact,respondents rated multiple systems and these responses were treated as being independent ob-servations for purposes of analysis similar to past research (Lewis, 2001). However, the fifth studyused a relatively larger sample and independent observations to run confirmatory tests. In each

M. Viswanathan, M. Viswanathan / Computer Speech and Language 19 (2005) 55–83 65
study, system differed in the choice of algorithm used for prosody generation. Also, systemsdiffered from study to study in the choice of prosody module to which various algorithms applied.
The experimental stimuli and procedures used in all of the listening tests were as follows.Multiple ‘‘play lists’’ of speech files were generated from the pool of N �M sentence–systemcombinations. All the speech files used in these tests were ‘‘normalized’’ to produce files with equalaverage peak amplitudes resulting in samples of similar loudness. Each �play list� consisted of Mrows of systems listed in random order with each row containing all N sentences also listed inrandom order. The purpose of the randomization was to minimize the effect of the order in whichsystems and sentences were heard. Samples of synthetic speech to be used in these tests werecompiled by inputting text selected at random from any source, such as the web, into the syn-thesizers. Usually the text reflects the purpose for which the synthetic speech system has beenbuilt. As TTS systems are principally developed to serve as automated information providers,sentences pertaining to prominent service applications such as news, weather, sports, finance,travel, etc., were possible areas from which sentences are used.
The sentences tended to run to about 20–25 words. Ideally, synthesized sentences played tolisteners to be rated must mimic the application domain in which the TTS system is likely to beused – in sentence length and complexity. Complex sentences have a high cognitive load, whichcan make the ratings unreliable. Short sentences may not truly reflect the application domain andare less likely to contain artifacts resulting in artificially high ratings. The sentence or paragraphmust be long enough to provide the respondents with enough information to make a fair as-sessment. Extra long sentences run the risk that the rating may be based on just the last portion ofthe sentence. All of our studies in this paper used multiple speech files ranging from 3 to 10sentences. Clearly, the larger the number of sentences used the better the results because we findthat the synthesis quality is often a function of sentence chosen as it is the system from which itwas derived. Synthesis systems are very inconsistent in that certain combinations of phonemesmay engender some audio artifacts while other phoneme or word combinations are extremelysmooth and natural. Synthesizing multiple sentences is one way to capture some of these idio-syncrasies. The same set of sentences is used as input to all of the synthesizers in a study and afresh set is chosen for each study.
The listening station was equipped with a listening device, some studies using headphones andothers using high-quality computer speakers with excellent frequency-gain characteristics. Weconsidered these listening modes to be nominally equivalent. Each listener was first presented witha printed copy of the questionnaire and encouraged to read it carefully. This gives the respondent asense of the items in the measure. The respondents were next given fixed verbal instructions aboutthe source of the speech samples (i.e., TTS), their task in terms of completing response scales, andthe time required to take the listening test. The time required ranged across studies from 18 to 25min depending on the number of systems involved. Each listening set contained a fixed calibrationutterance made up of a synthesized speech sample. This sample was played at the very beginningof the test before any of the other synthesized files were played to set the expectation level. Thissample was usually of median quality in relation to the samples from all the systems beingevaluated.
The subjects for the studies were all IBM employees invited via e-mail to participate in listeningtests. Studies 1 and 2 were conducted at the IBM Thomas J. Watson Research Center, YorktownHeights, NY, and therefore all the participants were IBM Research employees. Studies 3–5 were

66 M. Viswanathan, M. Viswanathan / Computer Speech and Language 19 (2005) 55–83
conducted at the IBM site in Poughkeepsie, NY. Employees who responded agreeing to partic-ipate were selected until the target sample size was reached, unless the pool had to be extended toobtain equal numbers of male and female respondents. All the studies had equal number of malesand female respondents. Individuals who described themselves as ‘‘native-born’’ North Americanaccented speakers alone were eligible to participate. This was done because the TTS systems andsamples were built upon a US English phoneme set. Individuals working in language technologies(speech recognition, synthesis, natural language understanding, dialog management, etc.) werenot included as respondents in any of the studies. The e-mail recipient lists were carefully screenedto prevent respondents from participating in consecutive studies or two previous studies if theelapsed time was small. The names, gender, department, and phone number of all respondentswere recorded. Given IBM�s work force, we assumed that the ages ranged from 25 to 55. Re-spondents held a variety of job designations and included researchers, scientists, library staff,public relations personnel, secretaries, human resources personnel, and other administrative staff.
When all the synthesized sentences from a system were played back-to-back, respondentsevaluated the system in its entirety based on all the sentences heard. In such cases, we disallowedreplay of audio clips. The listening tests in Studies 3–5 were controlled and managed electronicallyusing a computer program. (In Studies 1 and 2, the listeners provided their responses on the paperquestionnaire itself by checking off boxes alongside the phrase anchors.) A computer monitor andkeyboard was placed in front of the respondent and the program instructed the listener about eachupcoming item and the choices to be made. The wording of the items on the screen appearedexactly as on the printed questionnaire. In addition, the screen showed the numbers 5–1, where 5referred to more positive scores on all attributes. A computer program automatically registeredthe responses collected from listeners� keyboard entries and stored it human readable computerfiles. Audible cues such as beeps were used to alert listeners to various sections of the test, such asthe beginning of an audio playback or the need to read an item and provide a response. Inter-actions with the listening test supervisor were uncommon and usually limited to stock answers toquestions relating whether the sample audio could be used as a benchmark and whether thecomplete range (1–5) on a scale needed to be used. The same test supervisors were used in all ofour studies.
5. Studies 1–4 – MOS scale modification and assessment
5.1. Study 1
The first study used a single item on overall sound quality, a 6-item scale of speech qualitycovering listening effort, pronunciation, speaking rate, voice pleasantness, comprehension, andarticulation (i.e., a hybrid of the type I and type Q items from the ITU MOS scale), and a singleitem on acceptability of a system (‘‘Do you think this voice can be used for an interactive tele-phone or wireless hand-held information service system?’’), requiring a yes or no response (Fig. 1).Individual items and response scales were carefully edited so that each item heading and thephrase anchors were descriptive and meaningful to listening test takers. As discussed, the taskinvolved listening to complex sensory stimuli; therefore, we used 5-point scales with meaningfulanchors similar to past research. While Lewis (2001) has suggested a set of 7-point scales anchored

M. Viswanathan, M. Viswanathan / Computer Speech and Language 19 (2005) 55–83 67
at the ends, we employed the 5-point scales from the original MOS scale as the starting point.Moreover, the 5-point scales are fully described, thus making each response category moremeaningful to respondents (Fig. 1). The item on speaking rate (phrase anchored as ‘‘much fasterthan preferred’’, ‘‘faster than preferred’’, ‘‘preferred’’, ‘‘slower than preferred’’, and ‘‘much slowerthan preferred’’) was scored such that the choice of the middle point led to the highest score (3)while the choice of extremes led to the lowest score (1). In Study 1, 16 respondents each rated sixsystems in all, a total of 96 sets of responses.
In Study 1, we used six systems – two speakers, one male, one female, and three systems perspeaker. We collected a set of 10 sentences (average length¼ 17 words) and synthesized them at 11kHz using all six systems. Each respondent listened to five synthesized sentences from each sys-tem, the five being selected at random from the set of 10. The sentences were played back to backwith a one second pause. The respondent then filled out the questionnaire completely beforemoving on to the next system. The three systems used were different in that three different ap-proaches were used to impose target pitch contours on the final synthesized outputs. The baselinesystem employed the pitch contour generation scheme used in the IBM research system of early2001 vintage (Donovan et al., 2001). This system used a rule-based pitch contour generationalgorithm. The second system used a pitch contour derived statistically from the training data.Both these systems used sub-phone segments for concatenated synthesis. In the second system, thepitch of each of the sub-phone units was modified to meet the target pitch contour as predicted bya decision tree built from the training data. There was both audible distortion, from the per-spective of an expert listener, and visual distortion, determined by viewing the spectra. These areintroduced during signal modification of available sub-phone units to match the target pitchcontour. The third system used entire phones for synthesis with no prosody modification what-soever and used phonetic features as criteria for concatenation. For instance, determininggoodness of fit for a phone is based on its proximity to the prior phone. This task is morecommonly performed using context trees. This system has very audible ‘‘jumps’’ in pitch. The goalwas to determine the perceptual effect of ‘‘no modification’’ when compared to the other twosystems that had sub-phone units for concatenation. The samples from the systems with sub-phone units had smoother prosody but with signal modification induced distortion. In this studythe listeners� responses were captured on paper instead of the PC-based test taking methodologyintroduced in later systems.
The results showed a high coefficient a (0.81), with most of the items having high corre-lations with the total score, indicating consistency across items (Table 1). Although internalconsistency was satisfactory, item-level analysis suggested that the item on speaking rate wasproblematic in terms of low item-to-total correlation. A clear possibility for this result was thelack of potential for variation for this item, which, in effect, had three levels. Lack of sufficientvariation inhibits the ability of an item to covary or correlate with other items and with thetotal measure. Unrotated common factor analysis, a form of exploratory factor analysis ap-propriate here, suggested a single dominant factor explaining 49.4% of the variance (ratio ofeigen values of first to second factor¼ 8.49), this factor in all likelihood representing speechquality. The item on speaking rate had a high loading on a secondary factor. High significantcorrelation between the 6-item scale and the single item on overall sound quality (0.82,p < 0:01) and the single item on acceptability (0.68, p < 0:01) provided evidence of the validityof the 6-item scale.

Table 1
Results for Study 1 for 16 respondents and six systems
Item Mean SD Item-to-total
correlation
First factor
loading
Second factor
loading
Listening effort 3.47 0.88 0.79 0.87 0.08
Pronunciation 3.31 0.96 0.74 0.88 )0.25Speaking rate 2.72 0.45 0.14 0.14a 0.37
Voice pleasantness 3.38 0.81 0.28 0.29a 0.81
Comprehension 3.54 0.88 0.72 0.81 )0.11Articulation 3.47 0.78 0.75 0.82 0.10
The means and standard deviations in the table are the item means and standard deviations over 96 responses. Item-
to-total correlation is the correlation of an item score with the total score summed across all items. Factor loadings are
the correlation between an item and a factor, e.g., first and second factor loadings. For two of the items, the loading on
the first factor was lower – these are marked with ðaÞ in the table.
Number of responses ¼ 96; coefficient a ¼ 0:81; mean inter-item correlation¼ 0.38; number of factors extracted in
common factor analysis ¼ 2; variance explained by first factor¼ 49.4%; eigen value of first factor¼ 2.97; variance
explained by second factor¼ 5.8%; eigen value of second factor¼ 0.35; correlation with overall quality¼ 0.82
(p < 0:01); correlation with acceptance¼ 0.68 (p < 0:01).aHigher loading on second when compared to first factor.
68 M. Viswanathan, M. Viswanathan / Computer Speech and Language 19 (2005) 55–83
5.2. Study 2
Several changes were incorporated into the scale for Study 2 based on Study 1. First, the itemon speaking rate was modified to provide a 5-point rather than a 3-point spread thus enhancing itsability to covary with other items. This modification was aimed at addressing the problem of lowstandard deviation and consequently low item-to-total correlations. The scale was anchored withthe following descriptors: just right, slightly fast/slight slow, fairly fast/fairly slow, very fast/veryslow, and extremely fast/extremely slow (Fig. 2). The last four anchors were placed on either sideof the check-off (i.e., fast and slow were placed on opposite sides of the check-off box). Second,two items on ‘‘voice naturalness’’ and ‘‘ease of listening’’ were added to the scale after a carefulconsideration of the domain of speech quality. Lewis (2001) has previously suggested these itemsas ways of modifying the MOS scale and adding to the naturalness factor.
In Study 2, 16 respondents rated eight systems, a total of 128 sets of responses. The eightsystems consisted essentially of two speakers each for four systems. These systems were producedby synthesizing 10 sentences (average length¼ 17 words) per system but using only five per listenerselected randomly from the available 10. There were two speakers and hence four systems perspeaker. Study 2 tests the perceptual effects of modifying the duration of the phones used inconcatenative synthesis using signal processing techniques. Two different approaches for pre-dicting phone durations were used, one statistical and the other rule-based (Eide et al., 2003). Ineach case, the effect of modifying or not modifying duration to match the target durations weretested. When the phone durations are not modified to match the target, the phone with the closestduration to that called for in the target was used. It is generally believed that modifying duration(or pitch for that matter) using signal-processing techniques introduces subtle perceptual effectslike hoarseness more noticeable at telephone bandwidths.
Study 2 provided strong evidence of internal consistency (coefficient a ¼ 0:88; Table 2). Onlyone factor was extracted explaining 52.2% of the variance. The item on speaking rate continued to

Fig. 2. The intermediate version of the ITU MOS questionnaire used in Study 2 is shown here. Here too the re-
spondents filled out printed versions of this figure using the check-off boxes, which were later transferred to a
spreadsheet. The choices translate to a numeric range from 1 to 5, 5 being the most positive. The speaking rate item was
also scored on a 5-point scale making it consistent with the remaining items. Each test set contains a single fixed
calibration synthesized speech utterance of about median quality relative to all the other test samples. This calibration
sample was played first before any of the test samples to be evaluated.
M. Viswanathan, M. Viswanathan / Computer Speech and Language 19 (2005) 55–83 69

Table 2
Results for Study 2 for 16 respondents and 8 systems
Item Mean SD Item-to-total
correlation
First factor
loading
Listening effort 3.70 0.70 0.71 0.76
Pronunciation 3.57 0.92 0.74 0.82
Speaking rate 4.35 0.89 0.22 0.24
Voice pleasantness 3.10 0.79 0.67 0.70
Voice naturalnessa 2.88 0.89 0.65 0.69
Ease of listeninga 3.09 0.93 0.79 0.84
Comprehension 3.63 0.72 0.72 0.76
Articulation 3.46 0.74 0.73 0.78
The mean and standard deviation in the table are the item means and standard deviations over 128 responses. Item-
to-total correlation is the correlation of an item score with the total score across all items. Factor loadings are the
correlation between an item and a factor. Two new items (‘‘voice naturalness’’ and ‘‘ease of listening’’) were introduced
in this study and carried through for all later studies.
Number of responses¼ 128; coefficient a ¼ 0:88; mean inter-item correlation¼ 0.49; number of factors extracted in
common factor analysis¼ 1; variance explained by first factor¼ 52.2%; correlation with overall quality¼ 0.82
(p < 0:01); correlation with acceptance¼ 0.68 (p < 0:01).aNew items for Study 2 and later studies.
70 M. Viswanathan, M. Viswanathan / Computer Speech and Language 19 (2005) 55–83
have a low correlation with the total and a low factor loading. Labeling on either side of thevertical scale may have been a source of confusion for respondents, leading to this result (Fig. 2).The two new items on naturalness and ease of listening performed well in terms of their psy-chometric properties, i.e., they had high item-to-total correlations and high factor loadings. Ev-idence of validity was provided by high correlations of the scale with the single item on overallsound quality (0.82, p < 0:01) and with the item on acceptability (0.68, p < 0:01).
5.3. Study 3
In Study 3, the response scale for the speaking rate item was simplified further. Rather thanlabel either side of an anchor, the scale ranged from just right, slightly fast or slightly slow, fairlyfast or fairly slow, very fast or very slow, and extremely fast or extremely slow (Fig. 3). An item onaudio flow was added based on continued examination of conceptual content. This item wasconceptualized to represent the naturalness factor of speech quality (Fig. 3). 32 respondents rated12 systems in all.
Study 3 (and Study 4) compared the perceptual effects of two different methods of pitch ex-traction used during the training process. One technique uses an electro-laryngograph to deter-mine the points of glottal closure in the vocal folds and computes pitch periodically from theseclosures. The other technique determines the points of closures directly from the audio waveform.(Plante et al., 1995; Saito, 2001). We used systems built from six different speakers for each pitchextraction approach for the study. The audio sample used in the test consisted of one 50-wordparagraph.
Study 3 provided strong evidence of internal consistency (coefficient a ¼ 0:88; Table 3). Al-though two factors (naturalness and intelligibility) were extracted, one dominant factor explained46.1% of the variance, with all items having their highest loadings on this factor. The item on

Fig. 3. The final version of the MOS questionnaire. In Studies 3–5 the version shown above was presented item-by-item
on a computer screen. The respondents were shown a printed copy of the questionnaire as shown in this figure before
they took the listening tests. This helped to familiarize them with the wording in the items and the scales. The screen
showed the numbers 5–1 alongside the phrase anchors where 5 referred to the more positive scores on all attributes.
Each test set contains a single fixed calibration synthesized speech utterance of about median quality relative to all the
other test samples. This calibration sample was played first before playing any of the test samples to be evaluated.
M. Viswanathan, M. Viswanathan / Computer Speech and Language 19 (2005) 55–83 71

Table 3
Results for Study 3 for 32 respondents and 12 systems
Item Mean SD Item-to-total
correlation
First factor
loading
Second factor
loading
Listening effort 3.97 0.67 0.68 0.72 0.20
Pronunciation 3.91 0.82 0.57 0.63 0.34
Speaking rate 4.47 0.63 0.36 0.38 )0.16Pleasantness 3.27 0.83 0.66 0.72 )0.32Naturalness 3.87 0.87 0.70 0.76 )0.36Audio flowa 3.37 0.83 0.56 0.59 )0.27Ease of listening 3.04 0.95 0.77 0.84 )0.20Comprehension 4.12 0.77 0.55 0.66 0.62
Articulation 3.69 0.85 0.67 0.72 0.18
The mean and standard deviation in the table are the item means and standard deviations over 384 responses. Item-
to-total correlation is the correlation of an item score with the total score across all items. Factor loadings are the
correlation between an item and a factor, e.g., first and second factor loadings. One new item (‘‘audio flow’’) was
introduced in this study and used in all later studies.
Number of responses¼ 384; coefficient a¼ 0.88; mean inter-item correlation¼ 0.43; number of factors extracted in
common factor analysis¼ 2; variance explained by first factor¼ 46.1%; variance explained by second factor¼ 10.5%;
eigen value of first factor¼ 4.15; eigen value of second factor ¼ .95; correlation with overall quality¼ 0.75 (p < 0:01);correlation with acceptance¼ 0.57 (p < 0:01).
aNew item for Study 3 and later studies.
72 M. Viswanathan, M. Viswanathan / Computer Speech and Language 19 (2005) 55–83
speaking rate had improved performance. Labeling on one side of the scale rather than both sidesappeared to have improved the performance of this item to a satisfactory level. The two items onnaturalness and ease of listening added in Study 2 performed well in terms of their psychometricproperties, as did the item on audio flow added in Study 3. Evidence of validity was provided byhigh correlations of the 9-item scale with the single item on overall sound quality (0.75, p < 0:01)and with the item on acceptability (0.57, p < 0:01).
5.4. Study 4
Study 4 consisted of 18 sentences formed by having combinations of six system and threesamples from each system. Therefore, the stimuli in this study consisted of individual sentencesabout 20 words long. 32 respondents rated 18 systems in all using the 9-item scale employed inStudy 3. The respondent group was different from those in Study 3.
The internal consistency reliability of the 9-item scale was very high (coefficient a ¼ 0:93; Table4). All items were internally consistent and had correlations with the total score that ranged from0.59 to 0.81. The average inter-item correlation was 0.59. These results provide strong evidence ofinternal consistency reliability. Factor analysis was run on the 9-item scale. A dominant factorexplained 59% of the variance. Moreover, all nine items had high correlations (loadings) with thisdominant factor, ranging from 0.61 to 0.85. The correlations with single item overall soundquality item (0.81, p < 0:01) and with the item on acceptability (0.61, p < 0:01) were high. Alsonoteworthy here were that item-to-total correlations for most items including speaking rate werehigher when compared to Study 3 even though the scale was identical. Such variation is, however,often found across studies.

Table 4
Results for Study 4 for 32 respondents and 18 systems
Item Mean SD Item-to-total
correlation
First factor
loading
Listening effort 3.69 0.90 0.78 0.81
Pronunciation 3.67 0.98 0.75 0.78
Speaking rate 4.38 0.84 0.59 0.61
Pleasantness 3.24 0.83 0.72 0.76
Naturalness 2.95 0.88 0.77 0.81
Audio Flow 3.16 0.91 0.73 0.76
Ease of listening 2.98 0.92 0.81 0.85
Comprehension 3.74 0.90 0.72 0.75
Articulation 3.47 0.85 0.73 0.76
The mean and standard deviation in the table are the item means and standard deviations over 576 responses. Item-
to-total correlation is the correlation of an item score with the total score across all items. Factor loadings are the
correlation between an item and a factor.
Number of responses¼ 576; coefficient a¼ 0.93; mean inter-item correlation¼ 0.59; number of responses¼ 576;
coefficient a¼ 0.93; number of factors extracted in common factor analysis¼ 1; variance explained by first fac-
tor¼ 58.9%; correlation with overall quality¼ 0.81 (p < 0:01); correlation with acceptance¼ 0.61 (p < 0:01).
M. Viswanathan, M. Viswanathan / Computer Speech and Language 19 (2005) 55–83 73
The results from the two studies showed that the two pitch extraction algorithms were statis-tically equivalent. The voice (or system) has an effect on respondent perception of the quality ofsynthesis but not the pitch extraction algorithm. There was no evidence indicating that laryn-gograph-based pitch extraction worked better for some speakers while waveform-based pitchextraction was better for others. This is perhaps because both algorithms provided accurate pointsof glottal closure detection for the speakers used in building these TTS systems. However, thismay not extrapolate to all speakers and systems. Generally, the laryngograph approach does runinto problems with female speakers more often than male speakers even if this was not evidenthere. The electro-laryngograph uses a small current between two contacts on the collar wornaround the neck during recording to detect the instant of glottal closure. If the glottal folds don�tquite touch or touch very lightly, as can be the case for some speakers, the resulting laryngographsignal can introduce artifacts when computing phonemic pitch.
Speaking rate in the two studies was similar (i.e., 4.47 and 4.38). The phrase anchors for levels 4(slightly fast or slightly slow) and 5 (just right) indicates that some respondents felt that thespeaking rate was either slightly faster or slightly slower than desirable. Concatenated units ex-hibiting different durations within the same synthesized sentence is probably the cause. Speakersrecording databases for the concatenative speech synthesis often employ different reading stylesdepending on the content of the training data. Hence, news items will be read with a differentmeasure and tempo from, say, e-mails or phone messages. Unit selection from different sections ofthe original reading can cause slight speed-up or slow-down within the same synthesized sentence.
6. Study 5 – confirmatory scale assessment
The datasets reported in the first four studies provide sound preliminary evidence of the psy-chometric properties of the speech quality scale. However, all these datasets were formed from

74 M. Viswanathan, M. Viswanathan / Computer Speech and Language 19 (2005) 55–83
multiple responses from each individual respondent being treated as independent observations.Moreover, the analyses, particularly factor analysis, are exploratory in nature. While commonfactor analysis was performed without rotation, some other rotation such as Varimax rotationmay have led to the emergence of multiple factors, even over-prediction of multiple factors (Hair,1998). As discussed, the best test of factor structure is through confirmatory factor analysis(Gerbing and Anderson, 1988). Therefore, Study 5 was conducted on a larger scale to enablereasonable sample sizes using independent observations and to examine the dimensionality of thescale using confirmatory factor analysis.
One hundred twenty-eight respondents rated five systems on the 9-item speech quality scaleused in Study 4, the single item on overall sound quality, and the single item on system accept-ability. Nine different sentences were synthesized from each of the five systems for a total of 45system–sentence combinations. Eighteen samples were randomly chosen, four sentences eachfrom three systems and three each from the remaining two systems. These eighteen were played toall respondents in randomized order. Each respondent listened to the same set of 18 samples, witheach synthesized sentence occurring exactly two times. The decision to use a subset of 45 wasmade so that the listening test could be completed in less than 25 min.
Because each respondent rated more than one system and the purpose here was to generateindependent observations within a dataset, each dataset analyzed related to independent re-sponses to a particular system. Moreover, some systems were slightly different across subsets ofrespondents. Therefore, the first step was to identify datasets of responses to exactly the samesystem. This led to four datasets of 64 respondents each rating identical systems. These fourdatasets provided the best quality of data of independent observations of identical systems. 2 Sixmore datasets provided 128 independent observations, however the systems rated varied slightlyacross respondents. Sample sizes for these datasets met some of the criteria in past research forfactor analysis – i.e., greater than five times the number of items (>45), or greater than 100 in thecase of the larger datasets (Iacobucci, 1994). Although more stringent criteria have been suggestedas a function of factors such as the communality of items (MacCallum et al., 1999), less stringentcriteria appear to be appropriate here given the high communality of items of speech quality.
2 Four subsets of 32 respondents, referred to as subgroups 1–4, each rated six systems. Subgroups 1 and 2 rated six
identical systems while 3 and 4 rated six identical systems. Within subgroups 1 and 2, the six systems differed in the
delivery being in a male versus a female voice (Table 8). The same distinction occurred with subgroups 3 and 4.
Moreover, between 1 and 2 versus 3 and 4, two of the six systems rated were identical, the first system rated (referred to
as system 1) and another system that was rated fourth in subgroups 1 and 2 and sixth in subgroups 3 and 4 (referred to
as system 4). By combining datasets for each of these systems across subgroups so that the gender of the voice was also
identical, a total of 4 datasets of 64 respondents each were formed (i.e., subgroups 1 and 3 on system 1 as dataset 1;
subgroups 1 and 3 on system 4 as dataset 2; subgroups 2 and 4 on system 1 as dataset 3; subgroups 2 and 4 on system 4
as dataset 4). Each of these datasets consisted of independent observations of identical systems. An additional six
datasets with a sample size of 128 respondents were formed by combining responses across 128 respondents for each of
the six systems separately. These six datasets consisted of independent observations of systems that varied across
subsets of respondents. In this regard, while scales have been categorized as being subject-centered (i.e., measuring
differences across individuals), or stimulus-centered (i.e., measuring differences across stimuli) (Cox, 1980), aggregating
responses to slightly different systems is not substantively different from aggregating across responses to the same
system. Clearly, responses are capturing variations in individual perceptions as well as systems, if anything making the
psychometric tests more conservative.

M. Viswanathan, M. Viswanathan / Computer Speech and Language 19 (2005) 55–83 75
The five synthesis systems used in this test included algorithmic variations for pitch and du-ration generation. System 1 is a baseline system against which all the newer algorithms were beingtested. System 2 incorporated a new approach to build statistical decision trees to predict the pitchcontour for any new input text. In system 3, this approach was extended to durations. System 3,thereby, included a new algorithm to generate durations in addition to the pitch contour pre-diction algorithm. System 4 augments system 3 by including a penalty for splices that occur acrossa phoneme boundary (contiguous segments across phone boundaries are preferred). System 5penalizes back-to-back sub-phoneme splices from different phonemes, which are likely in TTSsystems using sub-phone units for concatenation. The constraint in System 5 is also applied on topof the System 3 configuration.
Internal consistency was high in terms of the entire scale as well as individual items in variousdatasets, confirming the results of the first four studies. Several models were tested throughconfirmatory factor analysis. The results in Tables 5 and 6 are summarized here. The overall levelsof fit of both one and two-factor models are satisfactory by accepted (e.g., >0.90; Bagozzi and Yi,1988; Bentler and Bonnet, 1980) and even by conservative norms (e.g., >0.95; Hu and Bentler,1998). All individual items had significant loadings on hypothesized factors. While the 2-factormodel improved on the one-factor model, the one factor model had a high level of fit. Tables 5–7present results of tests of differences between competing models, shown through statisticallysignificant differences in v2. These results suggest that both one and two factor formulations of the9-item scale are strongly supported through confirmatory factor analysis. Contrary to the notionthat the item on speaking rate loads on a separate factor, here speaking rate appears to be a partof the intelligibility factor as suggested by the higher fit for such a model when compared tocompeting models. An alternate model with speaking rate as a separate factor did not improve onthe 2-factor fit indices, although fit levels were so high to begin with as to allow little or no roomfor improvement. A model with speaking rate loading on the intelligibility factor led to superior fit
Table 5
Results for Study 5 confirmatory analysis
Datasets 1 2 3 4
No. of factors 1 2 1 2 1 2 1 2
n 64 64 64 64 64 64 64 64
df 27 26 27 26 27 26 27 26
v2 51.9 30.4^;� 57.8 31.6^;� 57.0 43.4� 76.3 51.7�
NFI 0.92 0.96 0.89 0.94 0.93 0.94 0.82 0.88
NNFI 0.95 0.99 0.91 0.98 0.95 0.97 0.83 0.91
CFI 0.96 0.99 0.94 0.99 0.96 0.98 0.87 0.93
IFI 0.96 0.99 0.94 0.99 0.96 0.98 0.88 0.94
SRMR 0.07 0.05 0.08 0.06 0.07 0.06 0.10 0.09
Results for the 3-factor model (with 24 degrees of freedom) with speaking rate as separate item were identical to
those for the 2-factor model with following exceptions. Dataset 2: v2 ¼ 31.3, CFI¼ 0.98, SRMR¼ 0.05; Dataset 3:
v2 ¼ 41.7, NFI¼ 0.95, NNFI¼ 0.96; Dataset 4: v2 ¼ 46.0, NFI¼ 0.89, NNFI¼ 0.92, CFI¼ 0.94, IFI¼ 0.95. Note that
column entries marked with a caret (^) had p > 0:05 with p < 0:05 for all other v2 values. Also, column entries marked
with an asterisk (*) are those whose v2 values for 1 versus 2 factor models that were significantly different at the 0.05
level.
n – Sample size; df – degrees of freedom; NFI – normed fit index; NNFI – non-normed fit index; CFI – comparative
fit index; IFI – incremental fit index; SRMR – standardized root-mean-square residual.

Table 6
Results for Study 5 confirmatory analysis
Datasets 1 2 3 4 5 6
No. of factors 1 2 1 2 1 2 1 2 1 2 1 2
n 128 128 128 128 128 128 128 128 128 128 128 128
df 27 26 27 26 27 26 27 26 27 26 27 26
v2 72.8 39.1� 49.5 38.3^;� 118.2 57.6� 102.8 64.3� 88.0 52.8� 78.3 49.2�
NFI 0.95 9.97 0.96 0.97 0.90 0.95 0.90 0.94 0.92 0.95 0.94 0.97
NNFI 0.96 0.99 0.98 0.99 0.89 0.96 0.90 0.95 0.92 0.96 0.95 0.98
CFI 0.97 0.99 0.98 0.99 0.92 0.97 0.92 0.96 0.94 0.97 0.96 0.98
IFI 0.97 0.99 0.98 0.99 0.92 0.97 0.92 0.96 0.94 0.97 0.96 0.98
SRMR 0.06 0.04 0.05 0.04 0.08 0.06 0.07 0.06 0.07 0.05 0.05 0.05
Results for the 3-factor model (with 24 degrees of freedom) with speaking rate as separate item were identical to
those for the 2-factor model with following exceptions. Dataset 1: v2 ¼ 39.0, NNFI¼ 0.98; Dataset 2: v2 ¼ 36.5; Dataset
3: v2 ¼ 57.4; Dataset 4: v2 ¼ 64.2, NNFI¼ 0.94; Dataset 6: v2 ¼ 47.6, NNFI¼ 0.97. Note that column entries marked
with a caret (^) had p > 0:05 with p < 0:05 for all other v2 values. Also, column entries marked with an asterisk (*) are
those whose v2 values for 1 versus 2 factor models that were significantly different at the 0.05 level.
n – Sample size; df – degrees of freedom; NFI – normed fit index; NNFI – non-normed fit index; CFI – comparative
fit index; IFI – incremental fit index; SRMR – standardized root-mean-square residual.
Table 7
Results for Study 5 confirmatory analysis
Datasets 1 2 3 4 5 6
Models 2 2a 2b 2 2a 2b 2 2a 2b 2 2a 2b
n 64 64 64 64 64 64 64 64 64 64 64 64
df 26 34 34 26 34 34 26 34 34 26 34 34
v2 30.4^ ;� 55.1 52.5 31.6^� 54.0 55.9 43.4� 47.6 54.5 51.7� 70.9 74.8
NFI 0.96 0.94 0.94 0.94 0.92 0.92 0.94 0.95 0.94 0.88 0.88 0.87
NNFI 0.99 0.97 0.97 0.98 0.96 0.96 0.97 0.98 0.97 0.91 0.91 0.90
CFI 0.99 0.98 0.98 0.99 0.97 0.97 0.98 0.99 0.98 0.93 0.93 0.92
IFI 0.99 0.98 0.98 0.99 0.97 0.97 0.98 0.99 0.98 0.94 0.93 0.92
SRMR 0.05 0.06 0.06 0.06 0.06 0.06 0.06 0.05 0.06 0.09 0.09 0.10
Note that column entries marked with a caret (^) had p > 0:05 with p < 0:05 for all other v2 values. Also, column
entries marked with an asterisk (*) are those whose v2 values for 1 versus 2 factor models were significantly different at
the 0.05 level. Also, ‘‘Model 2’’ is 2-factor model from Table 5 and Models 2a & 2b are a 10-item scale with item on
overall quality loaded on the intelligibility and naturalness factor respectively.
Model 2 – 2-factor model from Table 5; Model 2a(b) – 10-item scale with overall quality item loaded on intelligibility
(naturalness) factor; n – sample size; df – degrees of freedom; NFI – normed fit index; NNFI – non-normed fit index;
CFI – comparative fit index; IFI – incremental fit index; SRMR – standardized root-mean-square residual.�Marked v2 with p > 0:05, all other v2 with p < 0:05.* v2 values of 2 versus 2a & 2b factor models are significantly different at the 0.05 level.
76 M. Viswanathan, M. Viswanathan / Computer Speech and Language 19 (2005) 55–83
than an alternate model with it loading on the naturalness factor, consistent with the argumentthat speaking rate loads primarily on the intelligibility factor (see Table 8).
Another issue related to the role of the global single-item scale of overall sound quality. Ourargument for excluding it from the multiple item speech quality scale was conceptual; the itemassessed overall sound quality, while the items selected in the scale assessed some specific aspect ofspeech quality. In a two-factor model, the item on overall sound quality would not belong in

Table 8
Distribution of systems and subjects for Study 5
Subgroup 1 (n ¼ 32) Subgroup 2 (n ¼ 32) Subgroup 3 (n ¼ 32) Subgroup 4 (n ¼ 32)
System 1 – Male System 1 – Female System 1 – Male System 1 – FemaleSystem 2 – Male System 2 – Female System 7 – Male System 7 – Female
System 3 – Male System 3 – Female System 8 – Male System 8 – Female
System 4 – Male System 4 – Female System 9 – Male System 9 – Female
System 5 – Male System 5 – Female System 10 – Male System 10 – Female
System 6 – Male System 6 – Female System 4 – Male System 4 – Female
Identical systems across Subgroups 1 and 3 are shown in italics and identical systems across Subgroups 2 and 4 are
shown in bold italics.
M. Viswanathan, M. Viswanathan / Computer Speech and Language 19 (2005) 55–83 77
either the intelligibility or the naturalness factors, being a more global assessment of overall soundquality that is caused by both naturalness and intelligibility. If a multiple item scale is envisionedwith the global overall sound quality item, then other items should also be global in nature. Asdiscussed, mixed results have been found in terms of the loading of this item on the intelligibilityversus naturalness factors. Here, we definitively tested our argument by comparing the 9-item 2-factor model to two alternate models that included the global overall sound quality item loadingon the intelligibility and naturalness factors, respectively. As shown in Table 7, the results suggestthat the 9-item 2-factor version is significantly better than either 10-item versions. Moreover, thetwo 10 item versions are not significantly different from each other, strongly supporting our ar-gument that the global overall sound quality item really does not belong to either factor but is anoverall single-item indicator of sound quality related to both factors. Similar results were foundfor the 6 datasets with sample sizes of 128.
In light of evidence for a 2-factor model, the reliability of individual factors were computedacross the four datasets (n ¼ 64) and found to be satisfactory (Intelligibility – coefficient as 0.77–0.84, and Naturalness – coefficient as 0.84–0.92), with item-to-total correlations being satisfactoryas well.
7. Conclusion
This research carefully examined the MOS scale, the standard for measuring speech quality.Based on conceptual and empirical analysis, a modified scale was developed (Fig. 3) with addi-tional items (‘‘voice naturalness’’, ‘‘ease of listening’’, and ‘‘audio flow’’) and modified itemwording and response categories, especially for speaking rate. This scale was tested across mul-tiple studies using exploratory as well as confirmatory psychometric tests. The results suggest that,while a single factor model performs very well, it can be improved upon with a two-factor modelof intelligibility and naturalness. Several inconsistencies in past research are clarified here; asufficient number of items for the naturalness factor are used (naturalness, audio flow, pleas-antness and ease of listening; Tables 3 and 4), a global item on overall sound quality is argued andshown to be independent of the items of the scale in which it was previously included, and an itemon speaking rate is argued and found to belong to the intelligibility factor in Study 5. Through thisanalysis, the nature of the speech quality measure and its underlying factors is explicated. State ofthe art psychometric techniques are brought to bear on the data resulting in strong evidence for
78 M. Viswanathan, M. Viswanathan / Computer Speech and Language 19 (2005) 55–83
our modified scale. Sufficiently large sample sizes were employed in conducting psychometrictests, another improvement over past research.
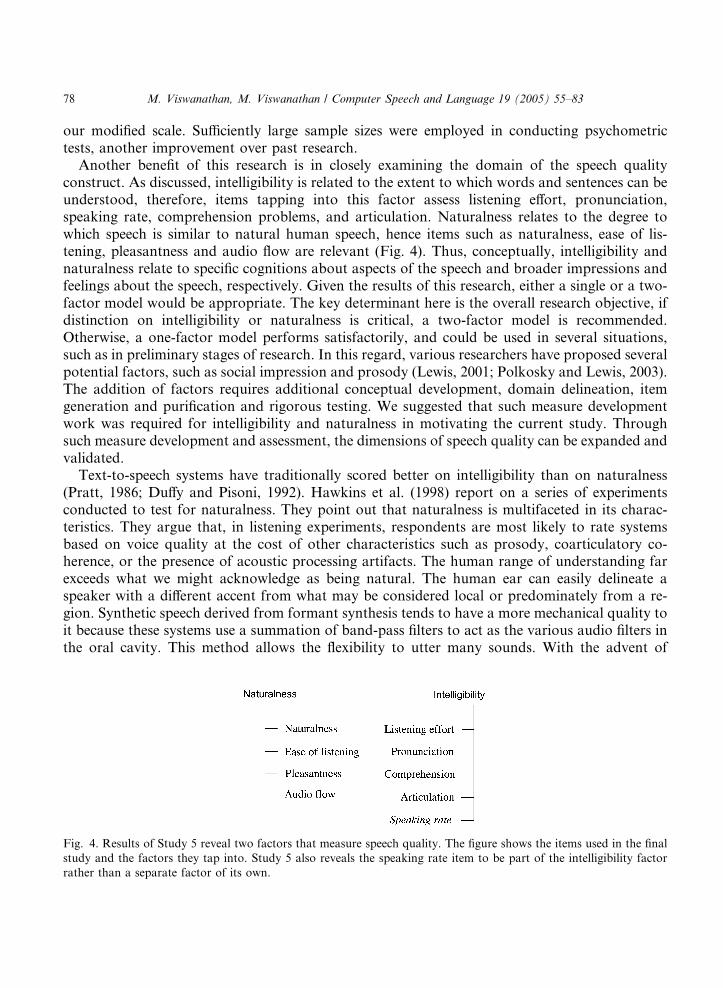
Another benefit of this research is in closely examining the domain of the speech qualityconstruct. As discussed, intelligibility is related to the extent to which words and sentences can beunderstood, therefore, items tapping into this factor assess listening effort, pronunciation,speaking rate, comprehension problems, and articulation. Naturalness relates to the degree towhich speech is similar to natural human speech, hence items such as naturalness, ease of lis-tening, pleasantness and audio flow are relevant (Fig. 4). Thus, conceptually, intelligibility andnaturalness relate to specific cognitions about aspects of the speech and broader impressions andfeelings about the speech, respectively. Given the results of this research, either a single or a two-factor model would be appropriate. The key determinant here is the overall research objective, ifdistinction on intelligibility or naturalness is critical, a two-factor model is recommended.Otherwise, a one-factor model performs satisfactorily, and could be used in several situations,such as in preliminary stages of research. In this regard, various researchers have proposed severalpotential factors, such as social impression and prosody (Lewis, 2001; Polkosky and Lewis, 2003).The addition of factors requires additional conceptual development, domain delineation, itemgeneration and purification and rigorous testing. We suggested that such measure developmentwork was required for intelligibility and naturalness in motivating the current study. Throughsuch measure development and assessment, the dimensions of speech quality can be expanded andvalidated.
Text-to-speech systems have traditionally scored better on intelligibility than on naturalness(Pratt, 1986; Duffy and Pisoni, 1992). Hawkins et al. (1998) report on a series of experimentsconducted to test for naturalness. They point out that naturalness is multifaceted in its charac-teristics. They argue that, in listening experiments, respondents are most likely to rate systemsbased on voice quality at the cost of other characteristics such as prosody, coarticulatory co-herence, or the presence of acoustic processing artifacts. The human range of understanding farexceeds what we might acknowledge as being natural. The human ear can easily delineate aspeaker with a different accent from what may be considered local or predominately from a re-gion. Synthetic speech derived from formant synthesis tends to have a more mechanical quality toit because these systems use a summation of band-pass filters to act as the various audio filters inthe oral cavity. This method allows the flexibility to utter many sounds. With the advent of
Fig. 4. Results of Study 5 reveal two factors that measure speech quality. The figure shows the items used in the final
study and the factors they tap into. Study 5 also reveals the speaking rate item to be part of the intelligibility factor
rather than a separate factor of its own.

M. Viswanathan, M. Viswanathan / Computer Speech and Language 19 (2005) 55–83 79
synthesis from concatenated speech from sub-phone units, the degree of naturalness has increased(Eide et al., 2003).
Listening tests offer a unique objective view of how TTS systems are perceived by the users atlarge. It is limited in that sentence-by-sentence quality variation of TTS systems can be large;sometimes even larger than the differences between systems. There are several reasons for thisquality variation. Misalignment of the speech and text in the training corpus is one apparentreason. Manual correction of misaligned segments can be painfully slow and expensive but will ridthe system of this problem. Reading different categories of text in the training corpus with varyingdegree of casualness is another source of sentence-to-sentence quality difference. For instance,news and e-mail may be read differently by the speaker, the second far more casually than the first.This is by no means the rule, but if these two sections are intoned in a similar fashion, the resultingsystem may be consistent but devoid of expression. On the other hand, adding different degrees ofexpression to news and e-mail makes the resulting system livelier, but can cause audible pitch andduration artifacts when units from ‘‘news’’ readings are mixed in with units from e-mail readings.Pitch extraction algorithms can also be a source of problems causing either missed pitch marks ormultiple pitch marks within the same pitch period. Both errors can cause unrealistic pitch esti-mates to be computed. Units that suffer from unnatural pitch assignments can get eliminatedduring unit selection since most segment selection algorithms use some form of global costminimization.
Some other sources for sentence to sentence variation within TTS systems in no particularorder of importance are: 1. Sub-optimal run-time unit selection algorithms may be chosen thatfavor run-time speed over memory footprint. 2. Spelling to sound rules that predict the placementof phrase boundaries and pauses during synthesis that are contrary to the pauses or phraseboundaries in the training corpus can be another source of glitches. 3. Inadequate coverage ofdiphone contexts in the training corpus and inadequate coverage of punctuations in the trainingcorpus are also significant sources of artifacts. 4. Casual and inconsistent enunciation, exagger-ated or insufficient inflection of words, phrases, or sentences on the part of the speaker is oftendetectable in the resulting TTS system. Several of these training corpora related issues can beaddressed by careful preparation of a ‘‘balanced’’ training script, manual screening of automat-ically generated spelling to sound rules, and manual editing of automatically produced textalignments. All of these issues put together imply longer and more expensive system buildingtimes and are at odds with the oft-claimed advantages of building concatenative text-to-speechsystems quickly without manual intervention using data from a customer-selected speaker.
It has also been difficult to produce a class of text sentences that can serve as a baseline againstwhich all TTS systems can be measured. Prominent examples of such corpora developed forevaluation of speech algorithms are TIMIT (TIMIT, 1990; Garofolo et al., 1993), which are re-cordings of 630 speakers of 8 major American English dialects each reading 10 phonetically richsentences, and the Boston University Radio News Corpus (Ostendorf et al., 1995), which consistsof professionally read radio news data including speech and annotations. A more comprehensivelist of databases and corpora for use in speech and language research can be had from http://www.ling.hawaii.edu/corpora.htm. But acceptance of TTS systems is often very subjective anddriven more by the application domain than by anything else. For instance, users may be willingto put up with a robotic but clear rendition of the details of a financial stock of interest. In fact, amechanical rendition may even be interpreted as authoritative in this case. On the other hand,

80 M. Viswanathan, M. Viswanathan / Computer Speech and Language 19 (2005) 55–83
news bulletins or driving directions may demand a more natural-sounding and ‘‘friendly’’ voice.Nevertheless, a reliable and valid measure of speech quality tapping multiple attributes drives theacademic and commercial research communities towards synthesis systems with improved sound,and towards systems that can sound doubtful or show emotions such as joy or anger in its voice.Future research should explore additional factors through careful conceptual development, de-lineation of domain, generation of items, and rigorous testing.
Several limitations are noteworthy here that can be addressed in future research. The complexadministration procedures involved in presenting audio clips and obtaining responses necessarilyhas inhibited sample sizes in past work. While we start out with small sample sizes, we employed alarger-scale study to provide confirmatory evidence. Second, measurement of speech quality,particularly at the individual sentence level, may require a measure that is shorter than the current9-item measure. Therefore, future efforts should focus on a representative short-form of thismeasure. Third, measure development is an ongoing process of collecting evidence for reliability,dimensionality, and validity, and further modifying scales. Therefore, future research should focuson obtaining further evidence of different types of validity of the modified MOS scale.
Acknowledgements
The authors thank Timothy Mathes and Allen Delmar of IBM for supervising and managingthe listening tests that were central to this work. We like to acknowledge the encouragement of themembers of the TTS team in the Human Language Technologies department at the IBM ThomasJ. Watson Research Center.
We thank James Lewis and Melanie Polkosky, IBM Pervasive Computing Division, BocaRaton, FL, who reviewed an early draft of this paper and provided us with invaluable comments.
Finally, thanks also to Professor Steve Young and two anonymous referees for their invaluablecomments.
Appendix A. Selected metrics in measurement
A.1. Random and systematic errors (adapted from Churchill, 1979)
Xo ¼ Xt þ Xr þ Xs;
where Xo is the observed score, Xt the true score, Xr the random error, and Xs is the systematicerror.
A.2. Coefficient a
Coefficient a¼ k � r=½1þ ðk � 1Þ � r�, where k is the number of items in a measure and r is theaverage inter-item correlation.
The expression of a presented above is based on a variance-covariance matrix of all the items ina measure. a is the proportion of variance due to common sources. The elements in a covariance

M. Viswanathan, M. Viswanathan / Computer Speech and Language 19 (2005) 55–83 81
matrix can be separated into unique variances represented by diagonal elements and covariancesbetween items represented by off-diagonal elements
a ¼ ½k=ðk � 1Þ�½1� ðsum of unique elements=sum of covariance elementsÞ�:
k=ðk � 1Þ is a correction term applied to restrict the range of a from 0 to 1.A.3. A simplified illustration of exploratory factor analysis
The following are equations and computations showing the relationships between two uncor-related factors and four items. F – factor, X – item, l – loading or correlation between an item anda factor, and e – error term.
Numbers refer to different factors or items.
x1 ¼ l11F1 þ l12F2 þ e1; x2 ¼ l21F1 þ l22F2 þ e2;
x3 ¼ l31F1 þ l32F2 þ e3; x4 ¼ l41F1 þ l42F2 þ e4:
In matrix form:
x1x2x3x4
2664
3775 ¼
l11 l12l21 l22l31 l32l41 l42
2664
3775� F1
F2
� �þ
e1e2e3e4
2664
3775:
Communality of x1 ¼ l211 þ l212.Generally, communality of xi ¼
Pnj¼1 l
2ij where i is the ith item and j is the jth factor with n
factors.Variance explained by F1 in eigen values ¼ l211 þ l221 þ l231 þ l241.In general terms, variance explained by Fj in eigen values, Fj ¼
Pmi�1 l
2ij where i is the ith item
and j is the jth factor with m items.
A.4. A simplified illustration of confirmatory factor analysis
In confirmatory factor analysis, rather than every item being allowed to be related to everyfactor (as shown in the equations earlier), specific models are tested. Consider a model where thefirst two of four items are hypothesized to load on the first factor and the last two items hy-pothesized to load on the second factor
x1 ¼ l11F1 þ 0F2 þ e1; x2 ¼ l21F1 þ 0F2 þ e2;
x3 ¼ 0F1 þ l32F2 þ e3; x4 ¼ 0F1 þ l42F2 þ e4:
In matrix form:
x1x2x3x4
2664
3775 ¼
l11 0
l21 0
0 l320 l42
2664
3775� F1
F2
� �þ
e1e2e3e4
2664
3775

82 M. Viswanathan, M. Viswanathan / Computer Speech and Language 19 (2005) 55–83
Any correlation between items from different factors, say, x1 and x3, occurs only because of arelationship between F1 and F2. Confirmatory factor analysis assesses the degree to which theproposed model is consistent with the data in terms of relationships between items belonging tothe same factor (say x1 and x2) and the relationship between items belonging to different factors(say, x1 and x3). For instance, if an item actually measures two factors, then its relationship withan item from the second factor is going to be too high, leading to a poor fit for the overall model.
References
Bagozzi, R.P., Yi, Y., 1988. On the evaluation of structural equation models. J. Acad. Market. Sci. 16, 74–94.
Bentler, P.M., Bonnet, D.G., 1980. Significance tests and goodness of fit in the analysis of covariance structures.
Psychol. Bull. 88, 588–606.
Briggs, S.R., Cheek, J.M., 1988. On the nature of self-monitoring: problems with assessment, problems with validity. J.
Pers. Social Psychol. 54 (4), 663–678.
Churchill Jr, G.A., 1979. A paradigm for developing better measures of marketing constructs. J. Market. Res. 16, 64–
73.
Coovert, M.D., McNellis, K., 1988. Determining the number of common factors in factor analysis: a review and
program. Educ. Psychol. Meas. 48, 687–692.
Cox, E., 1980. The optimal number of response alternatives in a scale: a review. J. Market. Res. 17, 407–422.
Cronbach, L.J., 1951. Coefficient alpha and the internal structure of tests. Psychometrica 16, 297–334.
De Vellis, R.F., 1991. Scale development:theory and applications. Sage, CA. 12-42.
Donovan, R.E., Ittycheriah, A., Franz, M., Ramabhadran, B., Eide, E., Viswanathan, M., Bakis, R., Hamza, W.,
Picheny, M., Gleason, P., Rutherfoord, T., Cox, P., Green, D., Janke, E., Revelin, S., Waast, C., Zeller, B.,
Guenther, C., Kunzmann, J., 2001. Current status of the IBM trainable speech synthesis system. In: Proceedings of
the 4th ISCA Tutorial and Research Workshop on Speech Synthesis. Perthshire, Scotland, UK.
Duffy, S.A., Pisoni, D.B., 1992. Comprehension of synthetic speech produced by rule. A review and theoretical
interpretation. Lang. Speech 35, 351–389.
Eide, E., Aaron, A., Bakis, R., Cohen, P., Donovan, R., Hamza, W., Mathes, T., Picheny, M., Polkosky, M., Smith,
M., Viswanathan, M. 2003. Recent improvements to the IBM trainable speech synthesis system. In: Proc. ICASSP,
Hong Kong, China, pp. 708–711.
Garofolo, J.S., Lamel, L.F., Fisher, W.M., Fiscus, J.G., Pallett, D.S., Dahlgren, N.L. 1993. The DARPA TIMIT
acoustic–phonetic continuous speech corpus. CDROM: NTIS Order No. PB91-100354, February.
Gerbing, D.W., Anderson, J.C., 1988. An updated paradigm for scale development incorporating unidimensionality
and its assessment. J. Market. Res. 25, 186–192.
Guadagnoli, E., Velicer, W.F., 1988. Relation of sample size to the stability of component patterns. Psychol. Bull. 103,
265–275.
Hair, J.F., 1998. Multivariate data analysis. Prentice-Hall, NJ.
Hawkins S, House J, Huckvale M, Local J, Ogden R. 1998. ProSynth: an integrated prosodic approach to device-
independent natural-sounding speech synthesis. Proc. Int. Conf. Spoken Lang. Process. Sydney, Australia.
Hu, L., Bentler, P.M., 1998. Fit indices in covariance structure modeling: sensitivity to underparametrized model
misspecification. Psychol. Meth. 3, 424–453.
Iacobucci, D., 1994. Analysis of experimental data. In: Bagozzi, R.P. (Ed.), Principles of Marketing Research.
Blackwell Business, MA.
ITU-T Recommendation P.85. 1994. Telephone transmission quality subjective opinion tests. A method for subjective
performance assessment of the quality of speech voice output devices.
ITU-T Recommendation P.800. 1996. Methods for subjective determination of transmission quality (formerly Rec.
P.80).
ITU-T Recommendation P.810. 1996. Modulated noise reference unit (MNRU) (formerly Rec. P.81).
Johnston, R.D., 1996. Beyond intelligibility – the performance of text-to-speech synthesisers. BT Techn. J. 14, 100–111.

M. Viswanathan, M. Viswanathan / Computer Speech and Language 19 (2005) 55–83 83
Kerlinger, F.N., 1986. Constructs variables and definitions. Foundations of Behavioral Research. Holt, Rinehart &
Winston, New York. pp. 26–44.
Kraft, V., Portele, T., 1995. Quality evaluation of five German speech synthesis systems. Acta Acust. 3, 351–365.
Lewis, J.R. 2001. The revised mean opinion scale (MOS-R): preliminary psychometric evaluation, IBM Technical
Report TR 29.3414, IBM Voice Systems, West Palm Beach, FL, USA.
MacCallum, R.C., Widaman, K.F., Zhang, S., Hong, S., 1999. Sample size in factor analysis. Psychol. Meth. 4, 84–99.
Nunnally, J.C., 1978. Psychometric Theory, second ed. McGraw-Hill, New York.
Ostendorf, M., Price, P.J., Shattuck-Hufnagel, S. 1995. The Boston University radio news corpus. Boston University
Technical Report No. ECS-95-001.
Peterson, R., 1994. A meta-analysis of Cronbach�s coefficient alpha. J. Consum. Res. 21, 381–391.
Plante, F., Meyer, G.F., Ainsworth, W.A. 1995. A pitch extraction reference database. In: Proc. ESCA Eurospeech�954th European Conf. Speech Commun. Tech. Madrid, Spain, pp. 837–840.
Polkosky, M.D., Lewis, J.R., 2003. Expanding the MOS: development and psychometric evaluation of the MOS-R and
MOS-X. J. Speech Tech. 6, 161–182.
Pratt, R., 1986. On the intelligibility of synthetic speech. Proc. Inst. Acoust. 8, 183–192.
Saito, T. 2001. Generating F0 contours by statistical manipulation of natural F0 shapes. In: Proc. Eurospeech 2001. 7th
European Conf. Speech Commun. Tech. Aalborg, Denmark.
Salza, P.L., Foti, E., Nebbia, L., Oreglia, M., 1996. MOS and pair comparison combined methods for quality
evaluation of text to speech systems. Acta Acust. 82, 650–656.
Sonntag, G.P., Portele, T., Haas, F., Kohler, J. 1999. Comparative evaluation of six German TTS systems. Proc. ESCA
Eurospeech�99 6th European Conf. Speech Commun. Tech., Budapest, Hungary, ISSN 1018–4074, pp. 251–254.
TIMIT. 1990. TIMIT acoustic-phonetic continuous speech corpus. National Institute of Standards and Technology
Speech Disc 1-1.1, NTIS Order No. PB91-5050651996, October.
van Santen, J., 1993. Perceptual experiments for diagnostic testing of text-to-speech systems. Comput. Speech Lang. 7,
49–100.