measuring tax gaps 2014. - uk government web...
TRANSCRIPT

Measuring tax gaps 2014 editionTax gap estimates for 2012-13
An Official Statistics release 16 October 2014

Contents
Introduction 3
At a glance 4
1. Summary 6
2. VAT 23
3. Alcohol 31
4. Tobacco 37
5. Oils 40
6. Income Tax, National Insurance Contributions and Capital Gains Tax 44
7. Corporation Tax 58
8. Other taxes 70
Glossary 73
Abbreviations 75
Index of tables and figures 77
Feedback 79

HM Revenue & CustomsMeasuring tax gaps 20143
Introduction
What is the tax gap?The ‘tax gap’ is the difference between the amount of tax that should, in theory, be collected by HMRC, against what is actually collected.
Why do we measure it?
The tax gap provides a useful tool for understanding the relative size and nature of non-compliance. This understanding can be applied in many different ways:
• Firstly, it provides a foundation for HMRC’s strategy. Thinking about the tax gap helps the department to understand how non-compliance occurs and how the causes can be addressed.
• Secondly, drawing on information on how other countries manage their tax gaps, our tax gap analysis provides insight into which strategies are most effective at reducing the tax gap.
• Thirdly, although the tax gap isn’t sufficiently timely or precise enough to set performance targets, it provides important information which helps us understand our long-term performance.
Why is there a tax gap? The tax gap reflects tax lost for a variety of reasons, from taxpayers simply not taking enough care with their tax returns to criminal attacks on the tax system.
How is it calculated?It has been produced by government analysts working within HMRC, in line with the values, principles and protocols set out in the Code of Practice for Official Statistics. We use a range of internal and external data and different analytical techniques to produce annual estimates, which we revise as more accurate data becomes available. These are our best estimates based on the information available, but there are many sources of uncertainty and potential error.
6.8%The tax gap in 2012-13 is estimated to be £34 billion, which is 6.8 per cent of tax liabilities

HM Revenue & CustomsMeasuring tax gaps 20144
6The 2
.01
82-13 U
%K tax gap at a glance
The tax gap is estimated to be £34 billion, which is 6.8 per cent of tax liabilities.
6.8%
Value of the tax gap by customer group
SMEs
£15.1bnLarge businesses
£9.3bnIndividuals
£4.6bnCriminals
£5.4bnValue of the tax gap by type of tax
Value of the tax gap by behaviour
£34bn
What is the tax gap? How is it calculated?The ‘tax gap’ is the difference between the amount It’s an Official Statistic produced using many of tax that should, in theory, be collected by HMRC, different approaches that have been endorsed by against what is actually collected. the International Monetary Fund.
Why measure it? The tax gap is difficult to measure — there are many sources of uncertainty and error. However, it gives an
Tax gap analysis helps us to understand the reasons indication of our long-term performance — we have for losses in the tax system. seen that the tax gap has decreased since 2005-06.
Tax gap and percentage of liabilities: 2005-06 to 2012-13
£0bn
30
20
10
£37b
n
£36b
n
£38b
n
05-06 06-07 07-08 08-09
£36b
n
09-10
£31b
n
10-11
£33b
n
11-12
£33b
n
40
50
0%
4.5
3.0
1.5
6.0
7.5
12-13
£34b
n
60 9.08.5%
7.8% 7.7%7.5%
7.0%6.8%
6.6%6.8%
Corporation Tax
£3.9bnOther taxes
£0.9bnValue Added Tax
£12.4bn
Excise duties
£2.9bn
IT, NICs and CGT
£14.2bn
Failure to take reasonable care
£4.2bn
Error
£2.9bnCriminal attacks
£5.4bn
Hidden economy
£5.9bnLegal interpretation
£4.5bn
Evasion
£4.1bn
Avoidance
£3.1bn
Non-payment
£4.4bn

HM Revenue & CustomsMeasuring tax gaps 20146
1. Summary
Key findings• The tax gap in 2012-13 (the latest year) is estimated to be £34 billion, which
is 6.8 per cent of total theoretical tax liabilities.
• The percentage tax gap has reduced steadily from 8.5 per cent in 2005-06 to 6.6 per cent in 2011-12 and 6.8 per cent in 2012-13.
• The current tax gap estimate of £34 billion is £8 billion lower than it would have been if the percentage tax gap had remained at the 2005-06 level of 8.5 per cent.
• The Corporation Tax and VAT gaps have seen the largest reductions over this period.
• The tax gap increased between 2011-12 and 2012-13 from £33 billion to £34 billion, which is mainly due to:
— an increase in the VAT gap of £0.9 billion (see Chapter 2)
— an increase in the tobacco tax gap of £0.3 billion (see Chapter 4).
• A large amount of new operational and external data has been received since tax gap estimates were published in October 2013. As a result, the tax gap in 2011-12 has been revised down from £35 billion to £33 billion and the percentage tax gap down from 7 per cent to 6.6 per cent. The largest changes contributing to the 2011-12 revision are:
— Reductions in the Income Tax, National Insurance Contributions and Capital Gains Tax (IT, NICs and CGT) avoidance tax gaps by £0.6 billion as a result of an improved methodology (see Chapter 6).
— A reduction of £1.1 billion in those components estimated using random enquiry programmes (see Chapter 6). About half of this figure is the result of new operational data and half is due to methodological improvements (see Chapter 6 and 7).
• Years prior to 2011-12 have also been revised as a result of updated data and methodology from the random enquiry programmes. Table 1.7 sets out these revisions.
Tax gap components: 2012-13Table 1.1 shows the composition of tax gap estimates for 2012-13. A colour coding system is used in the table to represent the robustness of the estimates. The percentage tax gap for 2012-13 is 6.8 per cent of total theoretical liabilities. This suggests that around 93 per cent of tax due is paid.
6.8%
2012-13
8.5%2005-06

HM Revenue & CustomsMeasuring tax gaps 20147
Table 1.1: Tax gap estimates
Tax Type Component 2012-13
Percentage tax gap1 Point estimate (£ billion)2
Value Added Tax Total VAT 10.9% 12.4
Excise duties
Tobacco dutiesCigarette dutyHand rolled tobacco dutyTotal tobacco duties
9%36%
14.2%
0.90.71.6
Alcohol duties
Spirits duty 5% 0.2Beer duty 12% 0.5Wine duty 5% 0.2Total alcohol duties 8.2% 0.9
Hydrocarbon oils duties
Great Britain diesel dutyGreat Britain petrol dutyNorthern Ireland diesel dutyNorthern Ireland petrol dutyTotal hydrocarbon oils duties
2%n/a13%0%
1.4%
0.3n/a0.1
0.030.4
Other excise duties3 5% 0.1
Total excise duties3 5.7% 2.9
Income Tax, National Insurance Contributions, Capital Gains Tax (IT, NICs and CGT)
Self Assessment
Non-business taxpayersBusiness taxpayers
n/an/a
0.34.0
Large partnerships 10% 0.7
Total Self Assessment 16.9% 5.0
PAYE
Small and medium employers 1% 1.2
Large employers 1% 2.2
Total PAYE 1.5% 3.4
Avoidance Total avoidance (IT, NICs and CGT) n/a 1.4
Hidden economy
PAYE individuals not in Self AssessmentGhostsMoonlightersTotal hidden economy (IT, NICs and CGT)
n/an/an/an/a
1.01.32.14.4
Total IT, NICs and CGT 5.3% 14.2
Corporation TaxSmall and medium businessesLarge businesses4
11%7%
2.11.8
Total Corporation Tax 8.7% 3.9
Other taxes
Stamp duties
Stamp Duty Land Tax 2% 0.1
Stamp Duty Reserve Tax 1% 0.03
Total stamp duties 1.8% 0.2
Other direct taxesInheritance Tax 9% 0.3
Petroleum Revenue Tax 2% 0.04
Other indirect taxes Environmental taxes and Insurance Premium Tax 4% 0.4
Total other taxes 3.7% 0.9
Total tax gap5 6.8% 34
Developing methodology.
Experimental methodology, illustrative indicators for gaps with no direct measure.
1 Tax gap as a proportion of theoretical liability, which is defined as the tax gap plus the amount of tax actually received. Total percentage tax gap estimates are rounded to the nearest 0.1 per cent with individual estimates rounded to the nearest one per cent.
2 The overall tax gap is rounded to the nearest £1 billion. Other estimates are rounded to the nearest £100 million or the nearest £10 million if they are less than £50 million.
3 The excise tax gap estimates are for excise duty only and show duty loss as a percentage of revenue due. So they differ from estimates in Chapters 3 to 5 that include tax loss due to VAT.
4 The Corporation Tax gap estimate for large businesses is derived from two methodologies. An established methodology exists for businesses managed by the Large Business Service and an experimental methodology is used for businesses managed by HMRC’s Large and Complex unit.
5 HMRC is developing an evidence base of funds held by UK individuals internationally. The methodologies will be reviewed to ensure that they reflect this new data.

HM Revenue & CustomsMeasuring tax gaps 20148
Figure 1.1 Tax gap and percentage of liabilities
Tax gap time series: 2005-06 to 2012-13Figure 1.1 shows the value of the overall tax gap alongside the tax gap as a percentage of tax liabilities. The percentage tax gap provides a better measure of compliance over time, because it takes out some of the effects of inflation and changes to tax rates. Over this period there has been a steady reduction in the percentage tax gap, from 2005-06 to 2011-12, with a marginal rise in 2012-13.
£0bn
30
20
10
£37b
n
£36b
n
£38b
n
05-06 06-07 07-08 08-09
£36b
n
09-10
£31b
n
10-11
£33b
n
11-12
£33b
n
40
50
0%
4.5
3.0
1.5
6.0
7.5
12-13£3
4bn
60 9.08.5%
7.8% 7.7%7.5%
7.0%6.8%
6.6%6.8%
Table 1.2 shows the percentage tax gap since 2005-06 by type of tax. The largest reductions over this period have been in the Corporation Tax and VAT percentage tax gaps.
Direct tax gap estimates (IT, NICs and CGT and Corporation Tax) are based on operational data from the latest available years in 2010-11 or 2011-12. Estimates before this point are based on actual data. Tax gap estimates for years after this point are projected, with actual data on tax liabilities, non-payment and compliance yield used.
A time series of the tax gap components from 2005-06 to 2012-13 is shown in Table 1.3. The tax gap stayed fairly flat between 2005-06 and 2008-09 at around £37 billion, fell to £31 billion in 2009-10, before rising to £34 billion in 2012-13.

HM Revenue & CustomsMeasuring tax gaps 20149
Table 1.2: Tax gap by type of tax
Tax Type Percentage tax gap1
2005-06 2006-07 2007-08 2008-09 2009-10 2010-11 2011-12 2012-13
Value Added Tax Total VAT 14.4% 12.9% 11.7% 14.2% 11.6% 10.3% 10.4% 10.9%
Excise duties
Tobacco dutiesAlcohol dutiesHydrocarbon oils dutiesOther excise duties
n/an/an/an/a
n/an/an/an/a
16.5%10.3%2.7%7.0%
17.1%6.8%3.3%6.0%
16.2%7.6%2.6%6.0%
12.4%11.4%1.9%6.0%
12.0%7.9%1.4%5.0%
14.2%8.2%1.4%5.0%
Total excise duties 7.8% 7.9% 7.3% 7.1% 6.6% 6.2% 5.2% 5.7%
Income Tax, National Insurance Contributions, Capital Gains Tax (IT, NICs and CGT)2
Self AssessmentPAYE
20.7%1.6%
18.6%1.5%
22.2%1.4%
13.3%1.3%
17.2%1.5%
16.1%1.7%
16.7%1.5%
16.9%1.5%
Avoidance n/a n/a n/a n/a n/a n/a n/a n/a
Hidden economy n/a n/a n/a n/a n/a n/a n/a n/a
Total IT, NICs and CGT 5.7% 5.4% 5.9% 4.7% 5.4% 5.5% 5.3% 5.3%
Corporation Tax
Small and medium businesses
17.1% 13.4% 13.9% 12.4% 12.1% 11.4% 10.9% 11.3%
Large businesses 10.8% 9.8% 8.2% 7.6% 8.1% 7.3% 6.8% 6.8%
Total Corporation Tax 12.6% 10.8% 10.1% 9.2% 9.6% 8.8% 8.4% 8.7%
Other direct and indirect taxes
Stamp dutiesOther taxes3
n/a3.1%
n/a3.2%
9.0%6.2%
14.9%5.7%
2.4%6.6%
2.5%5.6%
2.6%5.1%
1.8%4.8%
Total other direct and indirect taxes
7.2% 7.7% 7.6% 9.2% 5.0% 4.4% 4.2% 3.7%
Total tax gap 8.5% 7.8% 7.7% 7.5% 7.0% 6.8% 6.6% 6.8%
1 Estimates are rounded to nearest 0.1 per cent.
2 Percentage tax gap estimates for avoidance and the hidden economy are not shown as tax receipts cannot be calculated.
3 ‘Other taxes’ includes Inheritance Tax, Petroleum Revenue Tax, environmental taxes and Insurance Premium Tax.

HM Revenue & CustomsMeasuring tax gaps 201410
Table 1.3: Tax gap by type of tax
Tax Type Point estimates (£ billion)1
2005-06 2006-07 2007-08 2008-09 2009-10 2010-11 2011-12 2012-13
Value Added Tax Total VAT 12.3 11.5 10.8 13.2 9.4 9.8 11.4 12.4
Excise duties
Tobacco dutiesAlcohol dutiesHydrocarbon oils dutiesOther excise duties
2.10.50.80.1
2.00.60.70.2
1.60.90.70.2
1.70.60.80.1
1.70.70.70.1
1.31.20.50.1
1.30.80.40.1
1.60.90.40.1
Total excise duties 3.5 3.5 3.4 3.3 3.2 3.1 2.6 2.9
Income Tax, National Insurance Contributions, Capital Gains Tax (IT, NICs and CGT)2
Self Assessment 5.5 5.5 7.9 4.7 5.0 4.9 4.9 5.0
PAYE 3.1 3.1 3.3 2.9 3.2 3.8 3.4 3.4
Avoidance n/a n/a n/a n/a n/a n/a n/a 1.4
Hidden economy n/a n/a n/a n/a n/a 4.2 4.3 4.4
Total IT, NICs and CGT 13.1 13.3 15.9 12.4 13.5 14.5 14.1 14.2
Corporation Tax
Small and medium businesses
2.3 1.9 2.4 2.0 1.8 2.0 2.0 2.1
Large Businesses 3.7 3.5 2.8 2.3 2.0 2.1 2.0 1.8
Total Corporation Tax 6.0 5.4 5.2 4.4 3.8 4.1 4.0 3.9
Other direct and indirect taxes
Stamp dutiesOther taxes3
1.10.7
1.30.9
1.40.9
1.40.9
0.20.8
0.20.8
0.20.8
0.20.8
Total other direct and indirect taxes
1.8 2.2 2.3 2.3 1.0 1.0 1.1 0.9
Total tax gap 37 36 38 36 31 33 33 34
Total theoretical liabilities 435 460 489 475 439 480 500 504
Total percentage tax gap (%) 8.5% 7.8% 7.7% 7.5% 7.0% 6.8% 6.6% 6.8%
1 The overall tax gap is rounded to the nearest £1 billion. Other estimates are rounded to the nearest £100 million. Figures may not appear to sum due to rounding.
2 Tax gap estimates for avoidance and the hidden economy are not shown prior to 2012-13 and 2010-11 respectively.
3 ‘Other taxes’ includes Inheritance Tax, Petroleum Revenue Tax, environmental taxes and Insurance Premium Tax.
Estimates for these years are projections and will be revised when operational data becomes available.

HM Revenue & CustomsMeasuring tax gaps 201411
Tax gap by type of taxFigure 1.2 shows how the tax gap is composed of different taxes. The largest component is IT, NICs and CGT, which makes up 41 per cent of the total tax gap.
Figure 1.2: Composition of the tax gap by type of tax, 2012-13
Corporation Tax
11% £3.9bn
Other taxes†
3% £0.9bnValue Added Tax
36% £12.4bn
Excise duties
9% £2.9bn
IT, NICs and CGT
41% £14.2bn
† ‘Other taxes’ includes stamp duties, Inheritance Tax, Petroleum Revenue Tax, environmental taxes and Insurance Premium Tax
Figure 1.3: Tax gap time series by type of tax
5
15
10
05-06 06-07 07-08 08-09 09-10 10-11 11-12
IT, NICs and CGT
VAT
CT
Excise duties
Other taxes†
12-130%
The largest fall between 2005-06 and 2012-13 has been in the Corporation Tax and VAT percentage gaps (Figure 1.3).

HM Revenue & CustomsMeasuring tax gaps 201412
Figure 1.4 represents the tax gap by the scale of liabilities. The size of the rings represents the relative amounts of receipts from each tax. Most of the tax paid is from IT, NICs and CGT (54 per cent of receipts) and VAT (21 per cent of tax receipts). It also shows that the tax gap for IT, NICs and CGT of £14.2 billion equates to just 5.3 per cent of the total theoretical liabilities. This can be compared to the VAT tax gap (£12.4 billion) which equates to 10.9 per cent of VAT theoretical tax liabilities.
Figure 1.4: Tax gaps relative to tax due, 2012-13 (not drawn to scale)
IT, NICs and CGT
£14.2bnVAT
£12.4bnExcise duties
£2.9bnCorporation Tax
£3.9bnOther taxes
£0.9bn
5% 11%
6% 9% 4%
Tax gap by customer groupFigure 1.5 shows estimates of the 2012-13 tax gap by customer group. Nearly half of the 2012-13 tax gap can be attributed to small and medium-sized businesses (SMEs) and around one quarter from large businesses. The remainder is split between criminals and individuals. An element of management assumption is used in compiling these estimates, which should not be compared with similar analysis in previous publications.
Figure 1.5: Tax gap by customer group, 2012-13*
Large businesses
27% £9.3bnSMEs
44% £15.1bn
Individuals
13% £4.6bn
Criminals
16% £5.4bn
* These estimates by customer group are not comparable with those in last year’s publication. This is a result of new information and improvements in methodology. To facilitate comparison, estimates for 2011-12 have been recalculated on a comparable basis. These are: SMEs £14.7bn, large businesses £8.9bn, criminals £5bn and individuals £4.6bn.

HM Revenue & CustomsMeasuring tax gaps 201413
Tax gap by behaviourFigure 1.6 shows a breakdown of the estimated composition of taxpayer behaviours within the tax gap for 2012-13. These estimates give a broad indication of behaviours using management assumptions and judgement. The behaviours are defined in Table 1.6. Behaviour estimates should not be compared with similar analysis in previous publications; a comparable breakdown of the 2011-12 tax gap is shown in the footnote. Where there is a difference between the ‘top-down’ and the ‘bottom-up’ VAT gap estimate, the difference is apportioned across behaviours and customer groups.
Figure 1.6: Tax gap by behaviour, 2012-131,2
Failure to take reasonable care
12% £4.2bn
Error
8% £2.9bnCriminal attacks
16% £5.4bn
Hidden economy
17% £5.9bnLegal interpretation
13% £4.5bn
Evasion
12% £4.1bn
Avoidance
9% £3.1bn
Non-payment
13% £4.4bn
1 Where there is a difference between the ‘top-down’ and the ‘bottom-up’ VAT gap estimate, the difference is apportioned across behaviours and customer groups.
2 Estimates by behaviour are not comparable with those in last year’s publication. This is a result of new information and improvements in methodology. To facilitate comparison, estimates for 2011-12 have been recalculated on a comparable basis. These are: criminal attacks £5bn, evasion £4bn, hidden economy £5.6bn, avoidance £3.4bn, legal interpretation £4.2bn, non-payment £4.4bn, failure to take reasonable care £3.8bn and error £2.8bn.
Table 1.4 shows a time series of tax gap by behaviour, as a percentage of total theoretical liabilities. This shows that behaviours over the past four years have been broadly consistent. We do not have a comparable series for all elements prior to 2009-10. However, reductions in criminal attacks and avoidance look to be the main behavioural reasons for the reduction in the tax gap since 2005-06. For further details on these behavioural reductions:
• Criminal attacks — see excise duty tax gap in Tables 1.2 and 1.3 and MTIC fraud in Table 2.1
• Avoidance — see Corporation Tax gap for our Large Business Service in Table 7.1

HM Revenue & CustomsMeasuring tax gaps 201414
AvoidanceThe published avoidance tax gap is an annual estimate of the tax lost due to avoidance schemes that are subject to HMRC scrutiny and frustrate the intention of Parliament. This estimate reflects the legal framework in place at the time and does not include any subsequent changes to the tax law to prevent further use of avoidance schemes.
The estimated avoidance tax gap is £3.1 billion for 2012-13. Table 1.5 shows how this is split by type of tax. The estimate for 2011-12 published last year was £4 billion, but has been revised down to £3.4 billion due to a methodology improvement and new data — see Table 1.8.
The avoidance estimate is subject to revision as new risks emerge and as issues are resolved through litigation or settlement. The estimate is net of the additional tax that we expect to collect once any enquiries have been concluded. The definition of tax avoidance used to produce the tax gap estimates is described in Table 1.6.
The methodologies used to estimate the avoidance tax gap continue to be developed as more information becomes available. Improvements have been made to the methodologies for estimating the Corporation Tax and IT, NICs and CGT gaps; details can be found in the relevant chapters and in the ‘Methodological annex’. Further improvements are expected following an HMRC review of all enquiries into tax avoidance schemes.
Table 1.5: Avoidance tax gap by type of tax (£ billion)
1 ‘Other direct taxes’ includes stamp duties, Inheritance Tax and Petroleum Revenue Tax.
2 Figures may not appear to sum due to rounding.
Type of tax 2012-13
IT, NICs and CGT 1.4
Corporation Tax 1.3
VAT 0.1
Other direct taxes1 0.2
Total2 3.1
Table 1.4: Tax gap time series by behaviour, percentage of total theoretical liabilities
Behaviour Percentage tax gap
2009-10 2010-11 2011-12 2012-13
Avoidance 0.6% 0.8% 0.7% 0.6%
Criminal attacks 1.3% 1.2% 1.0% 1.1%
Error 0.5% 0.5% 0.6% 0.6%
Evasion 0.8% 0.9% 0.8% 0.8%
Failure to take reasonable care 0.8% 0.8% 0.8% 0.8%
Hidden economy 1.1% 1.1% 1.1% 1.2%
Legal interpretation 0.9% 0.8% 0.8% 0.9%
Non-payment 1.0% 0.8% 0.9% 0.9%
Total 7.0% 6.8% 6.6% 6.8%

HM Revenue & CustomsMeasuring tax gaps 201415
Table 1.6: Description of behaviours
Behaviour Description
Criminal attacks Organised criminal gangs undertake co-ordinated and systematic attacks on the tax system. This includes smuggling goods such as alcohol or tobacco, VAT repayment fraud and VAT Missing Trader Intra-Community (MTIC) fraud.
Evasion Tax evasion is illegal activity, where registered individuals or businesses deliberately omit, conceal or misrepresent information so they can reduce their tax liabilities.
Hidden economy Undeclared economic activity that involves what we call ‘ghosts’ — whose entire income is unknown to HMRC, and ‘moonlighters’ — who are known to us in relation to part of their income, but have other sources of income that HMRC does not know about.
There is a difference between the hidden economy and tax evasion:
• Hidden economy — where an entire source of income is not declared
• Tax evasion — where a declared source of income is deliberately understated.
Avoidance Avoidance is exploiting the tax rules to gain a tax advantage that Parliament never intended. It often involves contrived, artificial transactions that serve little or no commercial purpose other than to produce a tax advantage. It involves operating within the letter, but not the spirit of the law.
It does not include international tax arrangements such as base erosion and profit shifting (BEPS). Measures for tackling this are overseen by the Organisation for Economic Co-operation and Development (OECD). The OECD defines BEPS as tax planning strategies that exploit gaps and mismatches in tax rules to make profits disappear for tax purposes or to shift profits to locations where there is little or no real activity, but the taxes are low resulting in little or no overall corporate tax being paid.
Tax avoidance is not the same as legitimate tax planning. Legitimate tax planning involves using tax reliefs for the purpose for which they were intended. For example, claiming tax relief on capital investment, saving in a tax-exempt ISA or saving for retirement by making contributions to a pension scheme are all legitimate forms of tax planning.
Legal interpretation Legal interpretation relates to the potential tax loss from cases where HMRC and individuals or businesses have different views of how, or whether, the law applies to specific and often complex transactions. Examples include the correct categorisation of an asset for allowances, the allocation of profits within a group of companies, or VAT liability of a particular item. Customers have an alternative view of the law from us in these situations and how it applies to the facts in their case.
Non-payment For direct taxes, non-payment refers to tax debts that are written off by HMRC and result in a permanent loss of tax — mainly as a result of insolvency. It does not include debts that are eventually paid.
VAT non-payment differs, as it is based on the difference between new debts arising and debt payments (see chapter 2).
HM Revenue & CustomsMeasuring tax gaps 201416
Behaviour Description
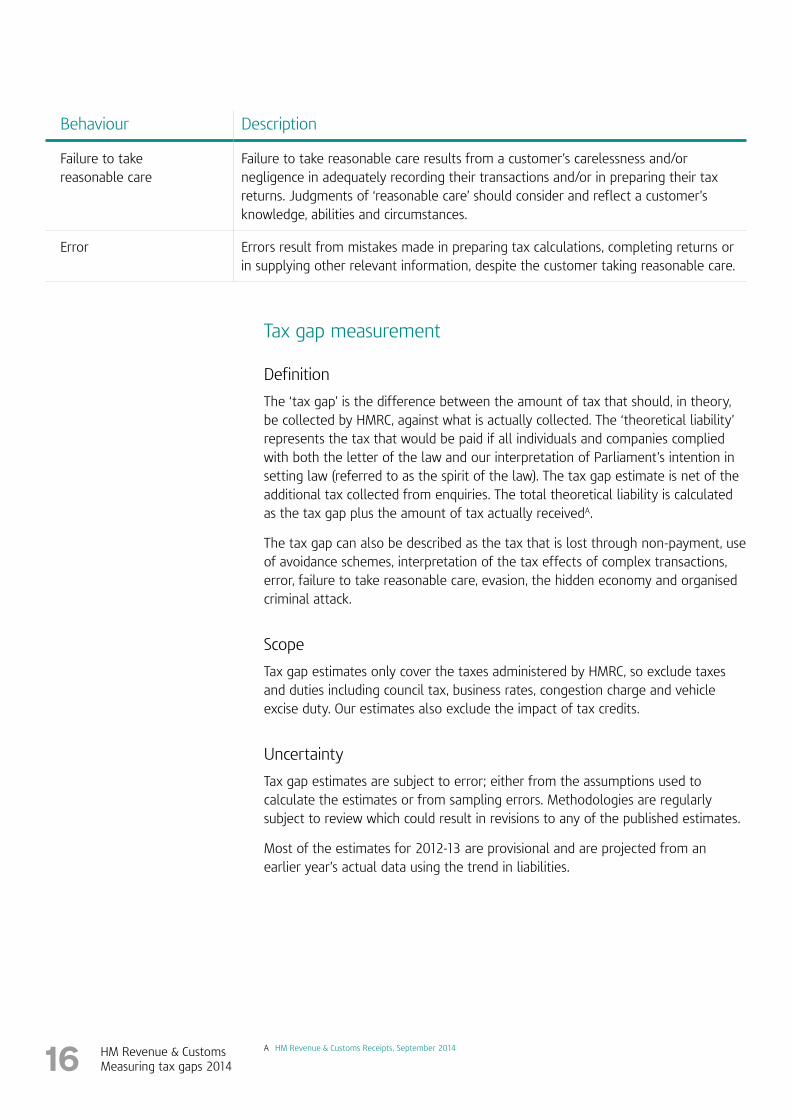
Failure to take reasonable care
Failure to take reasonable care results from a customer’s carelessness and/or negligence in adequately recording their transactions and/or in preparing their tax returns. Judgments of ‘reasonable care’ should consider and reflect a customer’s knowledge, abilities and circumstances.
Error Errors result from mistakes made in preparing tax calculations, completing returns or in supplying other relevant information, despite the customer taking reasonable care.
Tax gap measurement
Definition
The ‘tax gap’ is the difference between the amount of tax that should, in theory, be collected by HMRC, against what is actually collected. The ‘theoretical liability’ represents the tax that would be paid if all individuals and companies complied with both the letter of the law and our interpretation of Parliament’s intention in setting law (referred to as the spirit of the law). The tax gap estimate is net of the additional tax collected from enquiries. The total theoretical liability is calculated as the tax gap plus the amount of tax actually receivedA.
The tax gap can also be described as the tax that is lost through non-payment, use of avoidance schemes, interpretation of the tax effects of complex transactions, error, failure to take reasonable care, evasion, the hidden economy and organised criminal attack.
Scope
Tax gap estimates only cover the taxes administered by HMRC, so exclude taxes and duties including council tax, business rates, congestion charge and vehicle excise duty. Our estimates also exclude the impact of tax credits.
Uncertainty
Tax gap estimates are subject to error; either from the assumptions used to calculate the estimates or from sampling errors. Methodologies are regularly subject to review which could result in revisions to any of the published estimates.
Most of the estimates for 2012-13 are provisional and are projected from an earlier year’s actual data using the trend in liabilities.
A HM Revenue & Customs Receipts, September 2014
HM Revenue & CustomsMeasuring tax gaps 201417
Methods
VAT and excise tax gaps are estimated using a ‘top-down’ approach; by comparing consumption expenditure data with tax receipts. Most other components are estimated using a ‘bottom-up’ approach; building up from departmental operational data and management information. A ‘top-down’ approach was explored for direct taxes, but was found not to be feasibleB. Methodologies and data sources for estimating each tax gap component are set out in the relevant chapters, with additional information in the ‘Methodological annex’.
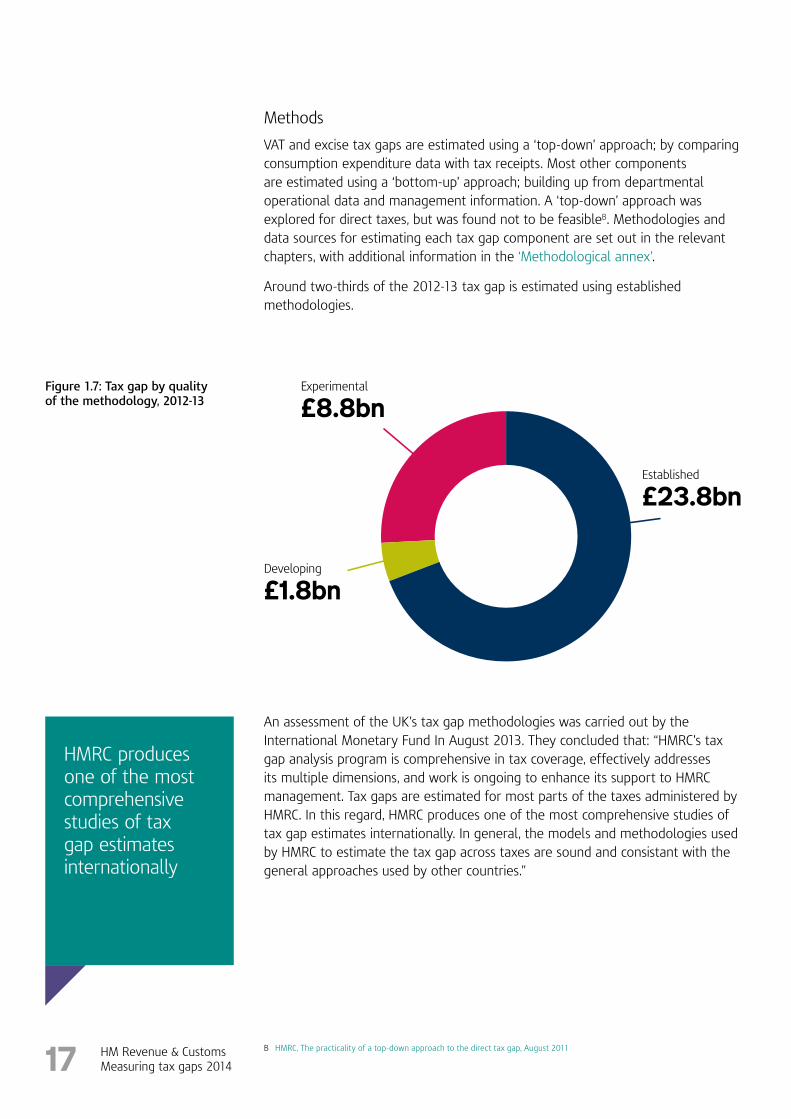
Around two-thirds of the 2012-13 tax gap is estimated using established methodologies.
Figure 1.7: Tax gap by quality of the methodology, 2012-13
Established
£23.8bn
Developing
£1.8bn
Experimental
£8.8bn
B HMRC, The practicality of a top-down approach to the direct tax gap, August 2011
An assessment of the UK’s tax gap methodologies was carried out by the International Monetary Fund In August 2013. They concluded that: “HMRC’s tax gap analysis program is comprehensive in tax coverage, effectively addresses its multiple dimensions, and work is ongoing to enhance its support to HMRC management. Tax gaps are estimated for most parts of the taxes administered by HMRC. In this regard, HMRC produces one of the most comprehensive studies of tax gap estimates internationally. In general, the models and methodologies used by HMRC to estimate the tax gap across taxes are sound and consistant with the general approaches used by other countries.”
HMRC produces one of the most comprehensive studies of tax gap estimates internationally

HM Revenue & CustomsMeasuring tax gaps 201418
Revisions to tax gap estimatesMany tax gap component estimates have been revised since ‘Measuring tax gaps 2013 edition’. This is due to improvements in the methodologies used, the availability of more up-to-date data and projections based on more recent years. Table 1.7 summarises the amount of revisions for each component and Table 1.8 summarises the reasons. Further information is available within the relevant chapters.
Tax Type Component Point estimates (£ billion)1,2
2005-06 2006-07 2007-08 2008-09 2009-10 2010-11 2011-12
Value Added Tax Total VAT - - - neg neg -0.1 neg
Excise duties
Tobacco dutiesCigarette dutyHand rolled tobacco dutyTotal tobacco
---
---
---
---
---
---
---
Alcohol duties
Spirits dutyBeer dutyWine dutyTotal alcohol
----
neg--
neg
neg-
negneg
neg-
negneg
neg+0.1neg+0.1
neg+0.1negneg
+0.05+0.2-0.1+0.1
Hydrocarbon oils duties
Great Britain diesel dutyGreat Britain petrol dutyNorthern Ireland diesel dutyNorthern Ireland petrol dutyTotal hydrocarbon oils
--
neg-
neg
--
neg-
neg
--
neg-
neg
-----
--
neg-
neg
--
neg-
neg
--
neg-
neg
Other excise duties -0.1 neg neg -0.1 -0.1 neg neg
Total excise duties -0.1 -0.1 neg neg -0.1 +0.1 +0.1
Income Tax, National Insurance Contributions, Capital Gains Tax (IT, NICs and CGT)
Self Assessment
Non-business taxpayersBusiness taxpayersLarge partnershipsTotal Self Assessment
-0.1+0.3neg
+0.2
neg-0.4neg-0.4
+0.4-0.2+0.1+0.3
+0.1-0.2neg-0.2
+0.2-0.7-0.1-0.5
-0.1-0.3neg-0.3
neg-0.3neg-0.3
PAYESmall and medium employers Large employers Total PAYE
+0.1-
+0.1
neg-
neg
neg-
neg
neg-
neg
neg-
neg
-0.1-
-0.1
-0.4neg-0.4
Avoidance Total avoidance (IT, NICs and CGT) n/a n/a n/a n/a n/a n/a 0.6
Hidden economy
PAYE individuals not in Self AssessmentGhostsMoonlightersTotal hidden economy
n/a
n/a n/a n/a
n/a
n/a n/a n/a
n/a
n/a n/a n/a
n/a
n/a n/a n/a
n/a
n/a n/a n/a
-
+0.1neg+0.1
-
neg+0.1+0.1
Total IT, NICs and CGT +0.6 +0.2 +0.6 +0.1 -1.3 -0.8 -1.2
Corporation Tax
Small and medium businessesLarge and Complex businessesBusinesses managed by our Large Business Service
+0.4--
+0.2--
+0.6-0.4
-
+0.2-0.6-0.3
+0.5-0.1-0.1
-0.1-0.5-0.1
-0.4-0.2-0.1
Total Corporation Tax +0.4 +0.2 +0.3 -0.7 +0.3 -0.6 -0.7
Other taxes
Stamp dutiesStamp Duty Land TaxStamp Duty Reserve Tax
n/a n/a
n/a n/a
n/a n/a
n/a n/a
n/a n/a
--
-neg
Total stamp duties - - - - - - neg
Other direct taxes
Inheritance TaxPetroleum Revenue Tax
negneg
negneg
+0.1neg
+0.1neg
negneg
negneg
-0.1neg
Other indirect taxes
Environmental taxes and Insurance Premium Tax
neg neg neg neg neg neg neg
Total other taxes neg +0.1 neg +0.1 neg neg neg
Total tax gap +0.9 +0.4 +0.9 -0.5 -1.1 -1.5 -1.8
1 neg denotes revisions less than £50 million.2 n/a denotes that comparable estimates for earlier years are not available and ‘-’ means there has been no change.
Table 1.7: Revisions to estimates since 2013 edition of ‘Measuring tax gaps’

HM Revenue & CustomsMeasuring tax gaps 201419
Figure 1.8 shows the revisions made to aggregate tax gap estimates for editions published since ‘Measuring tax gaps 2010’. The extent of revisions shows that the tax gap measure is a long-term indicator and that overall trends are more reliable than year-on-year changes.
Figure 1.8 Revisions to the tax gap as a percentage of liabilities compared to previous editions*
2
0%
8
6
4
10
05-06 06-07 07-08 08-09 09-10 10-11 11-12 12-13
MTG 2014
MTG 2013
MTG 2012
MTG 2011
MTG 2010
* MTG stands for Measuring tax gaps

HM Revenue & CustomsMeasuring tax gaps 201420
Table 1.8: Description of revisions since last edition
Tax gap component Revisions
Value Added Tax • The VAT gap estimates have been updated with the ‘Consumer Trends’ data published by Office for National Statistics (ONS) on 30 June 2014. This has made small changes to all years. (More recent published data does not yet have sufficient detail to calculate the tax gap).
• A forecast for 2013-14 was published by the Office for Budget Responsibility (OBR) at Budget 2014. HMRC will publish the preliminary estimate for 2013-14 at this year’s Autumn Statement.
• The ONS is currently part-way through a work programme to introduce a new European System of Accounts (ESA10) by 2014. The next ‘Blue Book’ release, (the UK’s national accounts) is published on 31 October 2014.
• A series of articles outlining expected changes to gross domestic product (GDP) as a result of introducing ESA10 and other methodological changes has been published by the ONS. Given the direct link of this data source to the VAT gap estimates, there may be subsequent changes to the VAT total theoretical liability and VAT gap estimates once the new data are incorporated.
Excise duties
Alcohol • Legitimate consumption is based on returns HMRC receive from the sale of alcohol where duty has been paid. This data was revised and was reflected in legitimate consumption figures in 2013.
Tobacco • No revisions since last edition.
Oils • The oils estimates for 2012-13 have been projected forward rather than calculated.

HM Revenue & CustomsMeasuring tax gaps 201421
Tax gap component Revisions
Income Tax, National Insurance Contributions, Capital Gains Tax
Self Assessment (SA) • 2005-06 to 2009-10 have been revised due to the settlement of more enquiries relating to those years.
• 2010-11 has been revised due to using actual data rather than being projected from the 2009-10 estimate.
• 2011-12 has been revised as it is now projected from the 2010-11 estimate rather than the 2009-10 estimate. Projections are made using the year-on-year change in relevant tax liabilities.
• More detailed data on SA taxpayers has led to an improved allocation of the tax gap between SA business and SA non-business. This has increased the SA non-business tax gap and decreased the SA business tax gap in all years.
• Improvements to the treatment of cases that have been deselected from the SA random enquiry programme have reduced the SA individuals and small partnerships tax gap across all years.
Small employers • 2005-06 to 2010-11 have been revised due to the settlement of more enquiries relating to those years.
• 2011-12 has been revised as it now uses actual data rather than being projected from the 2010-11 estimate. Projections are made using the year-on-year change in relevant tax liabilities.
• Improvements to the treatment of cases that have been deselected from the SA random enquiry programme have reduced the tax gaps for small and medium-sized businesses (SME) and individuals across all years.
Avoidance • The methodology used to estimate the avoidance tax gap for Corporation Tax and IT, NICs and CGT has been improved this year. The main change is that the number of years that the tax under consideration was assumed to relate was increased from three to six years.
Hidden economy • Hidden economy tax gap estimates for previous years are recalculated, but remain experimental.

HM Revenue & CustomsMeasuring tax gaps 201422
Tax gap component Revisions
Corporation Tax
Businesses managed by our Large Business Service (LBS)
• Estimates for 2005-06 to 2007-08 are unchanged since ‘Measuring tax gaps 2013 edition’.
• 2008-09 and 2009-10 have been revised with data from the closure of more risks and better estimates of tax under consideration on our LBS’s case management system. They also reflect minor changes resulting from a methodological simplification (see Chapter 7, ‘Methodology and data issues for our Large Business Service’ for more details).
• 2010-11 has been revised as it is now estimated from case management system data rather than projected from 2009-10.
• 2011-12 has been revised as it is now projected from 2010-11 data instead of 2009-10 data.
• Projections are made using the year-on-year change in LBS Corporation Tax receipts.
Large and Complex businesses (L&C)
• 2011-12 has been revised as it is estimated from the updated tax under consideration estimate for 2010-11 for businesses managed by our Large Business Service.
• More detailed data has enabled a more accurate allocation of CT compliance yield between L&C and SME businesses.
Small and medium-sized businesses(SME)
• 2005-06 to 2010-11 have been revised due to the settlement of more enquiries relating to those years.
• Updated liabilities data has led to a reduction in the projected estimate for 2011-12.
• More detailed data has enabled a more accurate allocation of CT compliance yield between L&C and SME businesses.
Other direct and indirect taxes
Stamp Duty Land Tax • No revisions to previously published estimates.
Stamp Duty Reserve Tax • No revisions to previously published estimates.
Inheritance Tax • The 2012-13 tax gap reflects a number of factors, including the effect of the Liechtenstein Disclosure Facility, improved transparency and the improved compliance these promote.
Petroleum Revenue Tax • No revisions to previously published estimates.
Environmental taxes and Insurance Premium Tax
• No revisions to previously published estimates.

HM Revenue & CustomsMeasuring tax gaps 201423
2. VAT
Key findings• The VAT gap is estimated at £12.4 billion in 2012-13. This equates to around
10.9 per cent of the estimated VAT total theoretical liability (VTTL). This estimate includes:
— Missing trader intra-community (MTIC) fraud of between £0.5 billion and £1 billion, — VAT debt of £1.3 billion, — VAT avoidance of £0.1 billion.
• The VAT gap increased between 2011-12 and 2012-13 from 10.4 per cent to 10.9 per cent, which equates to an increase from £11.4 billion to £12.4 billion. The average VAT gap is estimated at 10.8 per cent of the VTTL for the period 2009-10 to 2012-13.
• The MTIC fraud estimate for 2012-13 has remained within the same range as 2011-12. See the ‘Methodology and data issues’ section for the definition of MTIC fraud. VAT debt decreased from £1.8 billion in 2011-12 to £1.3 billion in 2012-13 (Figure 2.2).
• Around 70 per cent of the VTTL in 2012-13 was from household consumption, with the remaining proportion from consumption by businesses making exempt supplies, and from the government and housing sectors (Figure 2.3).
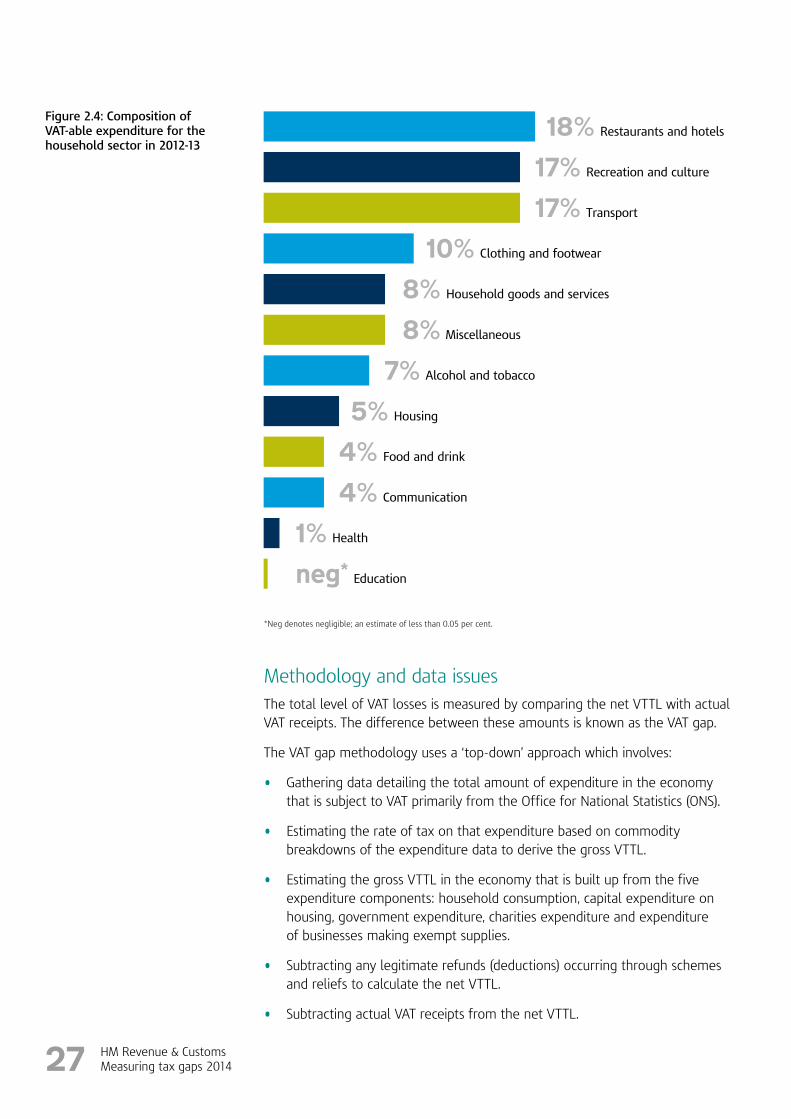
• Restaurants and hotels, recreation and culture, and transport are the largest contributors to the household sector (Figure 2.4). This is consistent with estimates in previous years.
• There have been minimal revisions made to the VAT gap estimates published in ‘Measuring tax gaps 2013 edition’. The inclusion of updated ‘ONS Consumer Trends’C data has meant a decrease in the 2010-11 VAT gap by 0.1 percentage points and negligible changes in other years.
C The latest ‘ONS Consumer Trends’ publications can be found here
£12.4bnEstimated VAT gap in 2012-13. This equates to around 10.9 per cent of VAT liabilities

HM Revenue & CustomsMeasuring tax gaps 201424
Table 2.1: Estimated VAT gap (£ billion)1
2005-06 2006-07 2007-08 2008-09 2009-10 2010-11 2011-12 2012-13
Net VTTL 85.3 89.0 92.8 93.1 80.8 95.2 109.8 113.1
Net VAT receipts2 73.0 77.6 82.0 79.8 71.4 85.4 98.4 100.7
VAT gap (point estimate) 12.3 11.5 10.8 13.2 9.4 9.8 11.4 12.4
of which MTIC fraud 2.5-3.5 2.0-2.5 1.0-1.5 1.0-1.5 1.0-1.5 0.5-1.0 0.5-1.0 0.5-1.0
of which debt n/a n/a 0.9 2.4 1.8 0.9 1.8 1.3
VAT gap (per cent)3 14.4% 12.9% 11.7% 14.2% 11.6% 10.3% 10.4% 10.9%
1 The amounts are rounded to the nearest £0.1 billion.
2 Net VAT receipts are expressed net of payments and repayments.
3 The VAT gap as a percentage of VTTL has been rounded to the nearest 0.1 per cent.
Results and tablesTable 2.1 shows the estimated VTTL, net VAT receipts and the estimated VAT gap for years 2005-06 to 2012-13.
The rise in the VAT gap from 2011-12 to 2012-13 reflects stronger growth in consumer expenditure than in receipts. Consumer expenditure rising by around £20 billion increased the VTTL by around £4 billion. The data HMRC use to calculate the VTTL fluctuates and is designed to measure consumption for the ‘ONS Blue Book’ National Accounts, rather than focusing on spending at the time when VAT would be due. This means the VAT gap can also fluctuate; for example, VAT receipts in some areas can be out of sync with the measure of consumption for the National Accounts. Perfectly splitting consumption data into standard and non-standard rated goods and services is not possible, so the VTTL is an approximate measure of the tax that should be due.
Changes to the standard rate of VAT is the main reason why the VAT gap fluctuates during the period 2005-06 to 2012-13. The VAT gap expressed as a percentage of VTTL provides a like-for-like comparison, excluding the impact of any rate change.
Figure 2.1 shows a time series of the VAT gap over the period 2005-06 to 2012-13. The VAT gap excluding debt remained broadly stable from 2009-10 onwards, at around nine per cent of VTTL.

HM Revenue & CustomsMeasuring tax gaps 201425
Figure 2.1: Time series of the VAT gap, including and excluding debt
4
0%
16
12
8
05-06 06-07 07-08 08-09 09-10 10-11 11-12 12-13
Excluding debt
Including debt
Missing trader intra-community (MTIC) fraud
MTIC fraud has declined from a peak of between £2.5 billion and £3.5 billion in 2005-06. It has stayed broadly stable between £0.5 billion and £1.5 billion from 2007-08 onwards and for 2012-13 being between £0.5 billion and £1 billion.
VAT debt
The contribution of debt to the VAT gap is defined as the amount of VAT declared by businesses but not yet paid to HMRC. (See ‘Methodology and data issues’ section for the definition of VAT debt). The VAT gap peaked at 14.2 per cent in 2008-09, because the recession caused an increase in VAT debt from £0.9 billion in 2007-08 to £2.4 billion in 2008-09. The level of debt was £1.3 billion in 2012-13.
Figure 2.2: Time series of VAT debt
2
£0bn
8
6
4
07-08 08-09 09-10 10-11 11-12 12-13
10
New debt
Paid and adjusted debt
New data source introduced (April 2011)
VAT debt gap

HM Revenue & CustomsMeasuring tax gaps 201426
Avoidance
VAT avoidance is another component of the VAT gap. Avoidance is exploiting the rules of the tax system to gain a tax advantage that Parliament never intended (Table 1.5). VAT avoidance is estimated to be £0.1 billion in 2012-13.
Sectoral analysis
Figure 2.3 shows each sector’s contribution to the VTTL in percentage terms, with household consumption contributing about 70 per cent in 2012-13. This is consistent with the VAT gap estimates in previous years.
Figure 2.3: VTTL components in 2012-13
Households1
70%
Businesses making exempt supplies
15%
Government
12%
Housing
3%
1 The household component also includes estimates of expenditure by non-profit institutions serving households.
Estimates of the contribution to the household sector in percentage terms of each relevant expenditure component for 2012-13 are given in Figure 2.4. Restaurants and hotels, recreation and culture and transport are the largest contributors to the household sector. Again, this is consistent with the estimates of the VAT gap in previous years.
HM Revenue & CustomsMeasuring tax gaps 201427
Figure 2.4: Composition of VAT-able expenditure for the household sector in 2012-13
*Neg denotes negligible; an estimate of less than 0.05 per cent.
Methodology and data issuesThe total level of VAT losses is measured by comparing the net VTTL with actual VAT receipts. The difference between these amounts is known as the VAT gap.
The VAT gap methodology uses a ‘top-down’ approach which involves:
• Gathering data detailing the total amount of expenditure in the economy that is subject to VAT primarily from the Office for National Statistics (ONS).
• Estimating the rate of tax on that expenditure based on commodity breakdowns of the expenditure data to derive the gross VTTL.
• Estimating the gross VTTL in the economy that is built up from the five expenditure components: household consumption, capital expenditure on housing, government expenditure, charities expenditure and expenditure of businesses making exempt supplies.
• Subtracting any legitimate refunds (deductions) occurring through schemes and reliefs to calculate the net VTTL.
• Subtracting actual VAT receipts from the net VTTL.
18% Restaurants and hotels
17% Recreation and culture
17% Transport
10% Clothing and footwear
8% Household goods and services
8% Miscellaneous
7% Alcohol and tobacco
5% Housing
4% Food and drink
4% Communication
1% Health
neg* Education

HM Revenue & CustomsMeasuring tax gaps 201428
• Comparing the net VTTL for the calendar year to VAT receipts for the corresponding financial year. This assumes a three-month lag between the economic activity and payment of the associated VAT to HMRC.
• Calculating the residual element — the gap — which is assumed to be the total VAT gap including fraud, debt and other losses.
The estimates are consistent with the ‘ONS Consumer Trends’ data published on 30 June 2014; they do not include the later ‘ONS Consumer Trends’ update of 30 September, which is consistent with the forthcoming ‘UK National Accounts — The Blue Book, 2014 edition’, to be published on 31 October.
For all ONS release dates please refer to the UK National Statistics Publication Hub.
VAT gap estimates are included in the total tax gap as part of the ‘Measuring tax gaps’ publication. These estimates will be subject to further revision as more data becomes available and methodological improvements are implemented.
The VAT gap preliminary estimate for 2013-14 will be published at the Chancellor’s Autumn Statement in December 2014 and a second estimate will be published at next year’s Budget. The exact release date will be available on the HMRC website (schedule of updates). The preliminary estimate will reflect the latest ‘ONS Consumer Trends’ and ‘Blue Book’ data published in September and October 2014 respectively.
MTIC fraud
MTIC fraud is an organised criminal attack on the European Union’s VAT system involving fraudulent traders acquiring goods or services VAT free from EU member states. They charge VAT on their onward sale and go ‘missing’ to avoid paying the VAT charged to the relevant tax authorities. One form of the fraud — known as carousel fraud — involves a series of contrived transactions within and beyond the EU, with the aim of creating large unpaid VAT liabilities and in some cases invalid VAT repayment claims.
The method used to estimate MTIC fraud was reviewed last year with changes that better reflect the way MTIC fraud is carried out. It is not possible to recalculate past years using the new methodology, as the data is not available before this point. This means a break exists in the time series between 2010-11 and 2011-12, with estimates up to and including 2010-11 calculated using the previous methodology. The estimates for the years before 2011-12 will not be revised.
It is not appropriate to reveal details of the methodology used to provide MTIC fraud estimates, as to do so may have a detrimental effect on compliance activity.

HM Revenue & CustomsMeasuring tax gaps 201429
VAT debt
For VAT, debt is defined as the difference between new debts arising in the financial year and debt payments plus debt adjustments made in the financial year. This differs to direct taxes, where non-payment is equated to debt written off. Debt adjustments refer to the difference between the amount initially declared by the trader and the finalised amount due.
The debt contribution to the VAT gap is estimated using our own data, with adjustments made to exclude MTIC debt and to reflect the deferral of payments under the ‘Time to Pay’ arrangements. Due to data quality issues, the debt contribution can only be measured from 2007-08.
This methodology does not relate to the stock of debt or debt written off. This means that estimates shown will differ from the VAT debt balance contained in the ‘HMRC Annual Report and Accounts 2013-14’.
Avoidance
The VAT avoidance tax gap is estimated using HMRC’s risk register data of avoidance schemes relating to VAT. The methodology remains unchanged from ‘Measuring tax gaps 2013 edition’ with the exception of a small uplift factor that has been removed following analysis of emerging data from the HMRC review of avoidance enquiries. No change was made to the assumption on the length of time that VAT avoidance schemes operate.
RevisionsA key component of the VAT gap estimate is UK National Accounts data from the ONS. Every year, the ONS updates the UK National Accounts through a process known as ‘annual supply and use balancing’. This brings together detailed data on the three approaches to measuring Gross Domestic Product (GDP) and balances them by product and industry. At the same time, any major methodological or classification changes may be implemented within the accounts.
The ONS is part-way through a work programme designed to meet their international obligations to introduce a new ‘European System of Accounts’ (ESA10) by 2014. The next release of the ‘Blue Book’ has a publication date of 31 October 2014. HMRC is aware of the forthcoming changes, ensuring the National Accounts changes can be taken on board at the soonest possible time after the new data is released. The next preliminary estimate of the VAT gap will incorporate the latest data from the ‘Blue Book’ and ‘ONS Consumer Trends’.
A series of articles explaining expected changes to GDP following the introduction of ESA10 and other methodological changes is also being published by ONS. The direct link of this data source to the VAT gap estimates, means there may be subsequent changes to the VTTL and VAT gap estimates once the new data is incorporated.
10.9%
2012-13
14.4%2005-06
The change in percentage VAT gap

HM Revenue & CustomsMeasuring tax gaps 201430
The impact of revisions made to the VAT gap estimates since last year’s publication ‘Measuring tax gaps 2013 edition’ resulted in a decrease in the level of the VAT gap for 2010-11, with negligible changes to other years. The VAT gap for 2010-11 has been revised down from £9.9 billion to £9.8 billion and in percentage terms, the VAT gap has been revised from 10.4 per cent to 10.3 per cent.
The VAT gap estimate for 2012-13 has been revised down by 0.4 percentage points since the preliminary estimate published at the 2013 Autumn Statement. The estimate is now based on an improved methodology within the education sector and incorporates the impact of the VAT refund scheme for academies that came into effect in April 2011.
The VAT gap estimate was updated using the latest ‘ONS Consumer Trends’ data published in June 2014. This resulted in a decrease in the 2010-11 VAT gap of 0.1 percentage points and negligible changes in other years.

HM Revenue & CustomsMeasuring tax gaps 201431
3. Alcohol
Key findings for spirits• The spirits illicit market share was five per cent in 2012-13, with a tax gap of
£260 million.
• The spirits illicit market share has fluctuated between three and six per cent between 2008-09 and 2012-13. The temporary increase in 2010-11 is consistent with wine.
Further tables on spirits, showing a breakdown of UK market share, UK revenue and volumes can be found online in the ‘Measuring tax gaps 2014 edition’ tables in Excel.
Results and tables for spirits
£260mSpirits tax gap
Table 3.1: Spirits: Illicit market share and tax gap1
2008-09 2009-10 2010-11 2011-12 2012-132
Illicit market share3
Upper estimate 9% 11% 13% 11% 13%
Mid-point estimate 3% 4% 6% 4% 5%
Lower estimate4 0% 0% 0% 0% 0%
Tax gap (£ million)5,6
Upper estimate 330 440 580 580 680
Mid-point estimate 100 170 270 200 260
of which VAT 30 50 90 70 90
of which Duty 70 120 180 130 170
Lower estimate4 0 0 0 0 0
1 Figures for previous years have been revised.
2 Figures for 2012-13 are provisional.
3 Figures rounded to the nearest one per cent.
4 Negative numbers have been truncated at zero.
5 Includes both duty and VAT.
6 Figures rounded to the nearest £10 million.

HM Revenue & CustomsMeasuring tax gaps 201432
Methodology and data issues for spiritsThe spirits tax gap estimate is produced using a ‘top-down’ methodology, that involves estimating total consumption from which legitimate consumption is then subtracted — with the remainder being the illicit market.
Total consumption is estimated using the ONS ‘Living Costs and Food Survey’ (LCF). Legitimate consumption is based on the returns HMRC receives from the volumes of alcohol on which duty have been paid. The methodology is contained in the separate ‘Methodological annex’.
For spirits, the central estimate should be interpreted as an indicator of the long-term trends in the illicit market share, rather than a precise estimate of the level or year-on-year changes. The confidence intervals indicate the uncertainty surrounding the estimate. They do not take into account any bias due to assumptions we have made during our calculations.
RevisionsThe LCF survey results are published 18 months after the survey takes place. For this reason, estimates for 2013-14 are still unavailable and so forecasts have been used for some elements of the 2012-13 estimates. This means estimates for 2012-13 are provisional and the estimates for 2011-12 have been revised with new data.
Legitimate consumption is based on returns HMRC receives from the volumes of alcohol on which duty have been paid. In 2013 this data was revised and has been reflected in legitimate consumption figures. Consequently, the uplift factor used to calculate the total consumption figure has also been revised. The details of the uplift factor methodology are presented in the separate ‘Methodological annex’. These changes have resulted in small revisions in both total and legal consumption figures and the tax gap, some of which may not be apparent due to rounding.
ONS estimates of the UK adult population have been revised and are now based on Census 2011 data.

HM Revenue & CustomsMeasuring tax gaps 201433
Key findings for beer• The beer illicit market share was 12 per cent in 2012-13, with a tax gap of
£700 million.
• The illicit market share in beer shows a generally level trend of nine and ten per cent in 2008-09 and 2009-10, followed by an increase to 12 per cent in 2010-11 to 2012-13.
Further tables on beer, showing a breakdown of UK market share, UK revenues and volumes can be found online in the ‘Measuring tax gaps 2014 edition’ tables in Excel.
Results and tables for beer
£700mBeer tax gap
Table 3.2: Beer: Illicit market share and tax gap1,2
2008-09 2009-10 2010-11 2011-12 2012-133
Illicit market share4
Upper estimate 12% 13% 17% 18% 17%
Mid-point estimate 9% 10% 12% 12% 12%
Lower estimate 7% 6% 7% 7% 8%
Tax gap (£ million)5,6
Upper estimate 600 700 1,050 1,150 1,000
Mid-point estimate 450 500 700 750 700
of which VAT 100 150 200 200 200
of which Duty 350 400 550 550 500
Lower estimate 350 300 350 350 450
1 Lower and mid point estimates are not available for years before 2007-08.
2 Figures for previous years have been revised.
3 Figures for 2012-13 are provisional.
4 Figures rounded to the nearest one per cent.
5 Includes both duty and VAT.
6 Figures rounded to the nearest £50 million.

HM Revenue & CustomsMeasuring tax gaps 201434
Methodology and data issues for beer
Upper estimate
The beer tax gap upper estimate is produced using a ‘top-down’ methodology; total consumption is estimated, and then the legitimate consumption is subtracted, with the remainder being the illicit market.
Total consumption is estimated using the ONS ‘Living Costs and Food Survey’ (LCF). Legitimate consumption is based on the returns HMRC receives from the volumes of alcohol on which duty have been paid. The details of the methodology are presented in the separate ‘Methodological annex’.
Lower estimate
The beer tax gap lower estimate is produced using a ‘bottom-up’ methodology. This means estimates of illicit beer are made directly, using our own data. This type of methodology is less comprehensive than the ‘top-down’ approach, as is does not cover all types of fraud. The lower estimate includes only estimates of the diversion of UK-produced beer and drawback fraud.
Difficultly in estimating a number of beer frauds means they are not included in this methodology and is one of the reasons it is a lower-bound estimate. This includes smuggled beer, diversion of foreign-produced beer and counterfeit beer.
Implied mid-point
The implied mid-point estimate is calculated as the average of the upper and lower estimates. It is only intended as an indicator of long-term trend — the true tax gap could lie anywhere within the bounds.
The upper and lower estimates should be interpreted as indicators of the long-term trend, rather than precise estimates of the level or year-on-year changes. They do not take account of any systematic tendency to over or under-estimate the size of the tax gap that might arise from the modelling assumptions.
RevisionsA description of the revised underlying data can be found in the spirits revisions section.
Dispatches from excise warehouses are taken directly from the warehouse return (W1 form). W1 data has been revised and this has adjusted the lower bound tax gap figures for 2008-09 to 2011-12.

HM Revenue & CustomsMeasuring tax gaps 201435
Key findings for wine• The wine illicit market share is five per cent in 2012-13, with a tax gap of
£340 million.
• The illicit market share for wine was between four and six per cent, with the exception of an increase of 12 per cent in 2010-11. This temporary increase is also consistent with spirits.
Further tables on wine, showing a breakdown of UK market share, UK revenue and volumes can be found online in the ‘Measuring tax gaps 2014 edition’ tables in Excel.
Results and tables for wine
£340mWine tax gap
Table 3.3: Wine: Illicit market share and tax gap1
2008-09 2009-10 2010-11 2011-12 2012-132
Illicit market share3
Upper estimate4 10% 11% 18% 9% 11%
Mid-point estimate 6% 6% 12% 4% 5%
Lower estimate4,5 2% 1% 6% 0% 0%
Tax gap6,7
Upper estimate4 500 590 1,110 600 720
Mid-point estimate 280 310 710 250 340
of which VAT 110 110 270 100 130
of which Duty 180 200 440 150 210
Lower estimate4,5 70 20 300 0 0
1 Figures for previous years have been revised.
2 Figures for 2012-13 are provisional.
3 Figures rounded to the nearest one per cent.
4 Confidence intervals are experimental and should be taken as illustrative.
5 Negative numbers have been truncated at zero.
6 Includes both duty and VAT.
7 Figures rounded to the nearest £10 million.

HM Revenue & CustomsMeasuring tax gaps 201436
Methodology and data issues for wineThis is the second year of publishing the wine tax gap estimate, which is produced using an experimental ‘top-down’ methodology. Total consumption is estimated, from which legitimate consumption is subtracted, with the remainder being the illicit market.
Total consumption is estimated using the ONS ‘Living Costs and Food Survey’ (LCF) and commercial research. Legitimate consumption is based on the returns HMRC receives from the volumes of alcohol on which duty have been paid. The details of the methodology are presented in the separate ‘Methodological annex’.
For wine, the central estimate is best interpreted as an indicator of long-term trend in the illicit market share rather than a precise estimate of the level or year-to-year changes. The 95 per cent confidence intervals are experimental and are only illustrative of the potential size of fluctuations in the estimates due to sampling error. They do not take account of any systematic tendency to over or under-estimate the size of the tax gap that might arise from the modelling assumptions.
RevisionsA description of the revised underlying data can be found in the spirits revisions section.

HM Revenue & CustomsMeasuring tax gaps 201437
4. Tobacco
Key findings for cigarettes• The illicit market share for cigarettes is estimated to be nine per cent in
2012-13, with a tax gap of £1.1 billion.
• There has been a long-term decreasing trend in the cigarette illicit market share. The level in 2012-13 is three percentage points lower compared with 2008-09.
Results and tables for cigarettesThe mid-point estimate should be interpreted as an indicator of long-term trends rather than a precise estimate of year-on-year changes. These figures were first published alongside ‘Measuring tax gaps 2013 edition’.
9%Illicit market share for cigarettes in 2012-13
Table 4.1: Illicit market share and tax gap for cigarettes1
2008-09 2009-10 2010-11 2011-12 2012-13
Illicit market share
Upper estimate 15% 15% 13% 12% 13%
Mid-point estimate 12% 11% 9% 7% 9%
Lower estimate 9% 8% 5% 2% 4%
Tax gap (£ million)2,3
Upper estimate 1,800 1,800 1,500 1,500 1,700
Mid-point estimate 1,400 1,300 1,000 900 1,100
of which VAT 200 200 200 200 200
of which Duty 1,100 1,100 800 700 900
Lower estimate 900 900 500 200 500
1 Figures are rounded to the nearest one per cent or £100 million.
2 Includes both duty and VAT.
3 Based on the weighted average price (WAP) of all UK duty paid cigarettes.

HM Revenue & CustomsMeasuring tax gaps 201438
Key findings for hand rolling tobacco• The mid-point estimate shows an illicit market share of 36 per cent, which is
around the same level as in 2010-11 and 2011-12.
• The tax gap for hand rolling tobacco is estimated to be around £900 million.
Results and tables for hand rolling tobaccoThe mid-point estimate should be interpreted as an indicator of long-term trends rather than a precise estimate of year-on-year changes. The 2012-13 tax gap shows an increase compared with previous years. This increase can be explained by the higher duty rates and prices in 2012-13 together with a slight increase in the illicit volumes consumed.
Table 4.2: Illicit market share and tax gap for hand rolling tobacco1
2008-09 2009-10 2010-11 2011-12 2012-13
Illicit market share
Upper estimate 55% 48% 44% 41% 42%
Mid-point estimate 50% 42% 38% 35% 36%
Lower estimate 46% 37% 32% 30% 31%
Tax gap (£ million)2,3
Upper estimate 900 800 800 900 1,100
Mid-point estimate 800 700 700 700 900
of which VAT 200 100 200 200 200
of which Duty 600 600 500 600 700
Lower estimate 700 600 500 600 700
1 Figures are rounded to the nearest one per cent or £100 million.
2 Includes both duty and VAT.
3 Weighted average price (WAP) data for all UK duty paid hand rolling tobacco is not available prior to 2012-13, so the losses are based on the price of a ‘typical brand’.

HM Revenue & CustomsMeasuring tax gaps 201439
Methodology and data issues for cigarettes and hand rolling tobaccoFurther tables on cigarettes and hand rolling tobacco, showing a breakdown of UK market share and volumes can be found online in the ‘Measuring tax gaps 2014 edition’ tables in Excel.
The estimates are produced using a ‘top-down’ methodology; that is, total consumption is estimated, from which legitimate consumption is subtracted, the remainder being the illicit market.
The estimates are presented as lying within a range defined by the upper and lower estimates. The range provides an indication of the size of potential systematic errors due to under-reporting, and of the sampling error associated with the consumption estimates which are based on survey data. The mid-point of this range is also shown, and this figure represents the most likely estimate of the scale of the illicit market.
Details on the methodology used are contained in the ‘Methodological annex’.
RevisionsThere has been a minor revision to the weighted average price used to calculate the value of the tax gap. Some of the numbers have changed due to rounding effects.

HM Revenue & CustomsMeasuring tax gaps 201440
5. Oils
Key findings for GB diesel• The GB diesel illicit market share lies within the range of zero to six per cent
in 2012-13, with the tax gap between £0 and £1,250 million.
• The illicit market share in GB diesel shows a generally level trend from 2007-08 to 2009-10, between four per cent and five per cent. This is followed by a reduction to two per cent in 2011-12 and 2012-13.
Results and tables for GB dieselThe reduction of the illicit market share to two per cent in 2011-12 and 2012-13 may not be a true reflection, due to the sensitivity of the modelling assumptions when the tax gap is small. Some elements of the 2011-12 estimates have been produced using forecasts. Additionally, for 2012-13, the size of the illicit market was forecast rather than calculated.
Further tables on GB diesel, showing a breakdown of UK market share and volumes, can be found online in the ‘Measuring tax gaps 2014 edition’ tables in Excel.
Table 5.1: GB diesel: Illicit market share and tax gap1
2008-09 2009-10 2010-11 2011-122 2012-132
Illicit market share (per cent)3
Upper estimate 9% 9% 7% 6% 6%
Mid-point estimate 5% 5% 3% 2% 2%
Lower estimate4 1% 1% 0% 0% 0%
Tax gap (£ million)5,6
Upper estimate 1,700 1,600 1,350 1,250 1,250
Mid-point estimate 950 850 500 400 400
of which VAT 250 200 150 100 100
of which Duty 700 700 400 250 250
Lower estimate4 200 100 0 0 0
1 Figures for previous years have been revised.
2 Figures for 2011-12 and 2012-13 are provisional. 2012-13 is a forecast.
3 Figures rounded to the nearest one per cent.
4 Negative numbers have been truncated at zero.
5 Includes both duty and VAT.
6 Figures rounded to the nearest £50 million.
2%Illicit market share for GB diesel in 2012-13

HM Revenue & CustomsMeasuring tax gaps 201441
Methodology and data issues for GB diesel and petrolThe GB diesel tax gap estimates are produced using a ‘top-down’ methodology; total consumption is estimated, from which legitimate consumption is subtracted, with the remainder being the illicit market.
Estimates of GB diesel and petrol consumption are taken from a number of data sources including sample surveys, vehicle testing and our own data.
Petrol is considered to be less vulnerable to illicit activity than diesel, because of the low demand from commercial sectors and the flammable nature of the product. This means that the illicit market share in GB petrol is assumed to be negligible and this assumption lies behind the calculation for GB diesel.
The mid-point estimate is best interpreted as an indicator of long-term trends in the illicit market share rather than a precise estimate of the level or year-on-year changes. The confidence intervals indicate the potential size of chance fluctuations in the estimates due to sampling error. They do not take account of any systematic tendency to over or under-estimate the size of the tax gap that might arise from the modelling assumptions.
RevisionsSome elements of the 2011-12 estimates have been produced using forecasts. Additionally, for 2012-13 the tax gap was forecast to be the same as the previous year. This means that estimates for 2011-12 and 2012-13 should be considered provisional.
Key findings for Northern Ireland (NI) diesel• The market share for fraudulent diesel in NI was 13 per cent, with a tax gap
of £80 million in 2012-13.
• The illicit market share in NI diesel shows a decreasing trend from 15 per cent in 2007-08 to 13 per cent in 2012-13, with an unusually low estimate of six per cent in 2009-10.
Results and tables for NI dieselOur analysis suggests that the low level of illicit market share in 2009-10 is an anomaly peculiar to that year and was probably caused by a smaller price differential between NI and Republic of Ireland, making it less cost-effective for NI residents to cross the border to shop for their fuel.
Further tables on NI diesel, showing a breakdown of UK market share and volumes, can be found online in the ‘Measuring tax gaps 2014 edition’ tables in Excel.

HM Revenue & CustomsMeasuring tax gaps 201442
Table 5.2: NI diesel: Illicit market share and tax gap1
2008-09 2009-102 2010-11 2011-123 2012-133
Illicit market share4
Upper estimate 15% 9% 15% 16% 16%
Mid-point estimate 12% 6% 12% 13% 13%
Lower estimate 9% 2% 9% 10% 10%
Tax gap (£ million)5,6
Upper estimate 90 50 100 110 110
Mid-point estimate 70 30 70 80 80
of which VAT 20 10 20 20 20
of which Duty 50 30 60 60 60
Lower estimate 40 10 50 60 60
1 Figures for previous years have been revised.
2 The low level of the non-UK duty paid market in 2009-10 is believed to be due to a reduced level of cross-border shopping.
3 Figures for 2011-12 and 2012-13 are provisional. 2012-13 is a forecast.
4 Figures rounded to the nearest one per cent.
5 Includes both duty and VAT.
6 Figures rounded to the nearest £10 million.
Methodology and data issues for NI dieselEstimates of NI diesel and petrol consumption are based on the average consumption per vehicle in Great Britain. Details of the methodology are given in the separate ‘Methodological annex’.
We estimate the non-UK duty paid market and then take off estimated cross-border shopping to determine the illicit market. The non-UK duty paid market includes both the illicit market and legitimate cross-border shopping consumed in NI. Up to now it has been difficult to separate these two markets as HMRC did not have a robust estimate of cross-border shopping between NI and the Republic of Ireland. However, exploratory modelling has been carried out which has given an indication of the cross-border shopping element. This work is not yet fully robust, but clearly indicates that in most years about half of the non-UK duty paid figure is from completely legitimate cross-border shopping. For 2011-12 and 2012-13 HMRC estimates that the illicit market share for fraudulent diesel is 13 per cent.
The mid-point estimate is best interpreted as an indicator of long-term trends in the non-UK duty paid market share rather than a precise estimate of the level or year on-year changes. The confidence intervals indicate the potential size of chance fluctuations in the estimates are due to sampling error. They do not take account of any systematic tendency to over or under-estimate the size of the illicit market that might arise from the modelling assumptions.
RevisionsSome elements of the 2011-12 estimates have been produced using forecasts. Additionally, for 2012-13 the tax gap was forecast to be the same as the previous year. This means that estimates for 2011-12 and 2012-13 should be considered provisional.
We have revised Table 5.2 to show illicit market rather than non-UK duty paid (NUKDP) by applying our estimate of cross-border shopping.

HM Revenue & CustomsMeasuring tax gaps 201443
Key findings for NI petrol
• For 2013-13 HMRC estimates the market share for fraudulent petrol in NI to be negligible.
Results for NI petrolThe non-UK duty paid market includes both the illicit market and legitimate cross-border shopping consumed in NI. As for GB petrol illicit market, petrol is considered to be less vulnerable to illicit activity than diesel, because of the low demand from commercial sectors and the flammable nature of the product. Additionally, the analysis carried out for NI cross-border shopping suggested that at least 50 per cent and possibly all the NI petrol market was cross-border shopping, but the model was not sensitive enough to determine the split more accurately.
Given this, HMRC consider the NI petrol market to be negligible.
Further tables on NI petrol, showing a breakdown of UK market share and volumes can be found online in the ‘Measuring tax gaps 2014 edition’ tables in Excel.
Methodology and data issues for NI petrolEstimates of NI diesel and petrol consumption are based on the average consumption per vehicle in Great Britain. Details of the methodology are given in the separate ‘Methodological annex’.
The estimates for NI relate to the non-UK duty paid market, rather than the illicit market. Further modelling has been used to attempt to determine the cross-border shopping element of this.
The mid-point estimate is best interpreted as an indicator of long-term trends in the non-UK duty paid market share rather than a precise estimate of the level or year-to-year changes.
To produce a NI non-UK duty paid estimate, the cross-border shopping of Republic of Ireland residents must be removed from the clearances to be consistent with the estimate of total consumption of petrol for NI residents.
RevisionsWe have revised our figures to show illicit market rather than NUKDP by applying our estimate of cross-border shopping.

HM Revenue & CustomsMeasuring tax gaps 201444
6. Income Tax, NICs and Capital Gains Tax
Key findings• In 2012-13 the total estimated tax gap for Income Tax, National Insurance
Contributions and Capital Gains Tax (IT, NICs and CGT) was £14.2 billion. This equates to 5.3 per cent of total theoretical liabilities. It accounts for 41 per cent of the overall tax gap in 2012-13.
Individuals and partnerships in Self Assessment (SA)
• The 2012-13 SA tax gap of £5 billion is equivalent to 17 per cent of SA tax liabilities.
• The tax gap from business taxpayers contributes the majority of the total SA tax gap (£4 billion), with non-business taxpayers accounting for just £0.3 billion and large partnerships accounting for £0.7 billion.
• The proportion of SA taxpayers who under-declared their tax liabilities has fallen from 29 per cent in 2005-06 to 25 per cent in 2010-11.
• Business taxpayers are more than twice as likely to under-declare their tax liabilities than non-business taxpayers (35 per cent compared to 16 per cent).
Employers (PAYE)
• The 2012-13 employers tax gap of £3.4 billion is equivalent to 1.5 per cent of employer PAYE liabilities.
• The tax gap from small and medium-sized employers (SMEs) was £1.2 billion (1.4 per cent of SME PAYE tax liabilities). The tax gap from large employers was £2.2 billion (1.5 per cent of large employer PAYE liabilities).
• The proportion of SMEs failing to correctly operate their PAYE scheme has decreased from 41 per cent in 2005-06 to 23 per cent in 2011-12.
Avoidance
• The avoidance tax gap for IT, NICs and CGT for 2012-13 is £1.4 billion.
• The overall estimate for the avoidance tax gap, which also includes VAT and Corporation Tax avoidance, is £3.1 billion (Table 1.5).
Hidden economy
• The direct tax hidden economy estimate is £4.4 billion in 2012-13. This consists of ghosts (£1.3 billion), moonlighters (£2.1 billion) and PAYE individuals not in Self Assessment (£1 billion)D.
D See Table 1.6 for a description of ghosts and moonlighters.
£14.2bnTotal tax gap for IT, NICs and CGT in 2012-13
£5bn Self Assessment
£3.4bn Employers (PAYE)
£1.4bn Avoidance
£4.4bn Hidden economy

HM Revenue & CustomsMeasuring tax gaps 201445
IntroductionThe overall tax gap for IT, NICs and CGT is estimated in a number of different ways. The estimates for individuals and small partnerships, and SME employers are both taken from the results of random enquiry programmes (REPs)E. The tax gaps for large partnerships and large employers are illustrative tax gaps produced by assuming the tax at risk will represent a similar proportion of liabilities to all other SA or employer taxpayers, as shown by the results of the relevant random programme.
Figure 6.1 shows that the tax gap estimate as a proportion of total liabilities has stayed broadly stable at between five per cent and six per cent from 2005-06 to 2012-13, with the exception of a slight dip below five per cent in 2008-09. The tax gap as a proportion of liabilities is larger for those in SA than for employers, and also shows more variation from year to year. The trends for both SME and large employers are more stable, with the percentage around one per cent to two per cent across all the years shown.
As the total liabilities for SA represent less than 15 per cent of the total liabilities for IT, NICs and CGT, the trends in SME and large employers have greater influence on the total IT, NICs and CGT trend.
E See Chapter 6, Methodology and data issues for description of random enquiry programmes.
Figure 6.1: SA individuals and small partnerships, SA large partnerships, SME employers and large employers tax gaps as a proportion of liabilities
5
0%
20
15
10
05-06 06-07 07-08 08-09 09-10 10-11 11-12 12-13
SA individuals and small partnerships
Total IT, NICs and CGT
Large employers
SME employers
SA large partnerships
ActualProjected
5.3%IT, NICs and CGT gap as a proportion of liabilities

HM Revenue & CustomsMeasuring tax gaps 201446
Results and tables for Self Assessment (SA)
SA individuals and small partnerships
Tax gap estimates from incorrect returns come from the Self Assessment random enquiry programme (SA REP) and data on compliance yield and non-payment. The latest programme data available is for the 2010-11 tax year, with estimates for subsequent years projected forward based on the year-on-year change in liabilities.
Table 6.1 shows estimated tax gaps for SA taxpayers (excluding large partnerships) due to incorrect returns for the tax years 2005-06 to 2012-13. This could be as a result of error, failure to take reasonable care or evasion. The SA tax gap as a proportion of liabilities has fallen from a high of 21 per cent in 2007-08 to a level of around 16 per cent to 17 per cent in subsequent years. Non-payment has remained broadly stable, staying between £0.2 billion and £0.3 billion.
Table 6.1: SA tax gap (excluding large partnerships) (£ billion)1
2005-06 2006-07 2007-08 2008-09 2009-10 2010-11 2011-12 2012-13
Under-declared liabilities due to incorrect returns
Upper estimate 9.6 10.4 14.0 9.2 10.2 9.3 9.2 9.3
Mid-point estimate 5.4 5.3 7.3 4.7 5.0 4.9 4.8 4.9
Lower estimate 2.6 2.6 3.2 2.3 2.6 2.2 2.2 2.2
Compliance yield2 0.6 0.6 0.9 0.9 0.9 0.8 0.8 0.7
Non-payment 0.2 0.2 0.3 0.2 0.3 0.3 0.2 0.3
Total tax gap
Upper estimate 9.1 10.1 13.4 8.6 9.6 8.7 8.7 8.8
Mid-point estimate 4.9 4.9 6.7 4.1 4.4 4.3 4.3 4.4
Lower estimate 2.1 2.2 2.6 1.6 2.0 1.6 1.7 1.7
Total tax liabilities 26.5 28.5 32.7 25.7 27.2 25.5 25.3 25.6
Proportion of liabilities 19% 17% 21% 16% 16% 17% 17% 17%
1 Figures rounded to the nearest £0.1 billion. As a result components may not appear to sum.
2 By period of settlement of enquiry.
Table 6.2: SA tax gap by type of taxpayer (£ billion)1
2005-06 2006-07 2007-08 2008-09 2009-10 2010-11 2011-12 2012-13
Business taxpayers 4.4 4.5 4.9 3.5 3.9 4.1 4.0 4.0
Non-business taxpayers 0.5 0.4 1.8 0.5 0.6 0.2 0.3 0.3
Total tax gap 4.9 4.9 6.7 4.1 4.4 4.3 4.3 4.4
1 Figures rounded to the nearest £0.1 billion. As a result components may not appear to sum.

HM Revenue & CustomsMeasuring tax gaps 201447
Table 6.2 shows estimated tax gaps for SA taxpayers (excluding large partnerships) split by business and non-business taxpayers for the tax years 2005-06 to 2012-13. Business taxpayers accounted for around 90 per cent of the total tax gap between 2005-06 and 2012-13, except for 2007-08 when the level decreased to 73 per cent due to a large spike in the tax gap from non-business taxpayers.
Table 6.3 shows the estimated proportion of incorrect SA returns leading to under-declaration of liabilities. This has decreased from 29 per cent to 25 per cent between the tax years 2005-06 and 2010-11. However, the proportion of returns where the annualised under-declared liability was more than £1,000 has stayed broadly stable over this period at between eight per cent to ten per cent.
Table 6.3: Proportion of SA returns with under-declared tax liability1
2005-06 2006-07 2007-08 2008-09 2009-10 2010-11
Under-declared liabilities due to incorrect returns
Proportion of SA returns 29% 29% 29% 26% 25% 25%
of which, size of under-declaration
£1 to £500 15% 14% 13% 13% 12% 11%
£501 to £1,000 5% 5% 6% 5% 5% 3%
over £1,000 9% 9% 10% 8% 9% 10%
1 Figures rounded to the nearest one per cent. As a result components may not appear to sum.
The proportion of under-declarations shown in Table 6.3 can be further split by business and non-business taxpayers. Table 6.4 shows the estimated proportion of incorrect SA returns leading to under-declaration of liabilities for the tax years 2005-06 to 2010-11 for business taxpayers only. The proportion of incorrect SA returns from business taxpayers has fallen from 49 per cent to 35 per cent between the tax years 2005-06 to 2010-11. This reduction is predominantly driven by falls in the levels of annualised additional liability under £1,000.

HM Revenue & CustomsMeasuring tax gaps 201448
Table 6.4: Business taxpayers: Proportion of SA returns with under-declared tax liability1
2005-06 2006-07 2007-08 2008-09 2009-10 2010-11
Proportion of SA returns 49% 44% 44% 39% 38% 35%
of which, size of under-declaration
£1 to £500 21% 19% 16% 16% 15% 12%
£501 to £1,000 10% 8% 10% 9% 8% 6%
over £1,000 18% 16% 18% 14% 15% 17%
1 Figures rounded to the nearest one per cent. As a result components may not appear to sum.
Table 6.5 shows a three per cent increase between 2009-10 and 2010-11 in the estimated proportion of incorrect SA returns leading to under-declaration of liabilities for non-business taxpayers. However, the level has stayed at around 13 per cent to 16 per cent between the tax years 2005-06 to 2010-11. The level of incorrect SA returns with under-declared tax liabilities is lower for non-business taxpayers than business taxpayers. This is because the majority of IT paid by these non-business taxpayers is deducted at source under PAYE, leading to lower levels of incorrect SA returns.
Table 6.5: Non-business taxpayers: Proportion of SA returns with under-declared tax liability1
2005-06 2006-07 2007-08 2008-09 2009-10 2010-11
Proportion of SA returns 14% 15% 16% 15% 13% 16%
of which, size of under-declaration
£1 to £500 10% 10% 10% 9% 8% 11%
£501 to £1,000 2% 3% 2% 2% 2% 1%
over £1,000 2% 3% 4% 4% 3% 4%
1 Figures rounded to the nearest one per cent. As a result components may not appear to sum.
Large partnerships in SA
Large partnerships are not covered by the random enquiry programme and so an illustrative tax gap is produced by assuming the tax at risk will represent a similar proportion of liabilities to all other SA taxpayers, as shown by the results of the SA REP.
Table 6.6 shows the tax gap for large partnerships in Self Assessment is broadly in line with previous years’ estimates at £0.7 billion in 2012-13 following a peak of £1.2 billion in 2007-08. The higher 2007-08 figure was a result of increased liabilities of SA large partnerships in that year, combined with the spike in the percentage tax gap of SA individuals and small partnerships.

HM Revenue & CustomsMeasuring tax gaps 201449
Table 6.6: Tax gap for large partnerships in SA (£ billion)1
2005-06 2006-07 2007-08 2008-09 2009-10 2010-11 2011-12 2012-13
Under-declared liabilities due to incorrect returns
Upper estimate 0.8 0.9 1.6 0.9 1.0 1.0 1.0 1.0
Mid-point estimate 0.7 0.8 1.3 0.8 0.8 0.8 0.8 0.8
Lower estimate 0.6 0.7 1.0 0.6 0.7 0.6 0.6 0.6
Compliance yield2 0.1 0.2 0.3 0.3 0.2 0.2 0.2 0.2
Non-payment 0.0 0.1 0.1 0.1 0.1 0.1 0.1 0.1
Total tax gap
Upper estimate 0.7 0.8 1.4 0.8 0.8 0.8 0.8 0.8
Mid-point estimate 0.6 0.6 1.2 0.6 0.6 0.6 0.6 0.7
Lower estimate 0.5 0.5 0.8 0.5 0.5 0.5 0.5 0.5
Total theoretical tax liabilities 5.7 6.8 9.0 6.7 6.8 6.9 6.8 6.9
Proportion of liabilities 11% 9% 13% 9% 9% 9% 9% 10%
1 Figures rounded to the nearest £0.1 billion. As a result components may not appear to sum.
2 By period of settlement of enquiry.
Results and tables for small and medium-sized employersTax gap estimates come from the employer compliance random enquiry programme (EC REP) and data on compliance yield and non-payment. The latest EC REP data available is for the 2011-12 tax year, with 2012-13 projected forward based on the trend in liabilities.
Table 6.7 shows estimated tax gaps for small and medium-sized employers for the tax years 2005-06 to 2012-13 have remained at around one per cent to two per cent of liabilities, with a low of 0.9 per cent in 2008-09. The main cause of the rise since 2008-09 has been a £0.4 billion increase in non-payment over this period.

HM Revenue & CustomsMeasuring tax gaps 201450
Table 6.7: Tax gap for small and medium-sized employers (£ billion)1
2005-06 2006-07 2007-08 2008-09 2009-10 2010-11 2011-12 2012-13
Under-declared liabilities due to incorrect returns
Upper estimate 1.1 1.0 1.2 0.6 0.7 1.3 0.7 0.7
Mid-point estimate 0.9 0.9 1.0 0.6 0.6 0.9 0.5 0.5
Lower estimate 0.7 0.8 0.9 0.5 0.5 0.5 0.4 0.4
Compliance yield2 0.3 0.4 0.3 0.3 0.2 0.3 0.3 0.3
Non-payment 0.7 0.7 0.6 0.5 0.9 1.0 1.0 0.9
Total tax gap
Upper estimate 1.5 1.3 1.4 0.9 1.3 2.0 1.4 1.3
Mid-point estimate 1.3 1.2 1.3 0.8 1.2 1.6 1.2 1.2
Lower estimate 1.1 1.0 1.1 0.8 1.1 1.2 1.1 1.0
Total theoretical tax liabilities 76.9 82.4 91.1 86.9 81.4 84.9 83.0 83.1
Proportion of liabilities 1.7% 1.4% 1.4% 0.9% 1.5% 1.9% 1.5% 1.4%
1 Figures rounded to the nearest £0.1 billion. As a result components may not appear to sum.
2 By period of settlement of enquiry.
Table 6.8 shows the estimated proportion of employers failing to fully meet their obligations in respect of operating PAYE has fallen from 41 per cent in 2005-06 to 23 per cent in 2011-12. This fall is a result of fewer identified small under-declarations (less than £1,000) and fewer large under-declarations (more than £1,000).
Table 6.8: Proportion of small and medium-sized employers not meeting their PAYE scheme obligations1
2005-06 2006-07 2007-08 2008-09 2009-10 2010-11 2011-12
Under-declared liabilities due to incorrect returns
Proportion of PAYE schemes 41% 40% 40% 34% 27% 26% 23%
of which, size of under-declaration
£1 to £1,000 23% 22% 21% 17% 12% 12% 10%
over £1,000 18% 18% 18% 17% 14% 13% 13%
1 Figures rounded to the nearest one per cent. As a result components may not appear to sum.

HM Revenue & CustomsMeasuring tax gaps 201451
Results and tables for large employersLarge employers are not covered by the EC REP so an illustrative tax gap is produced by assuming the tax at risk will represent a similar proportion of liabilities to SME employers, as shown by the results of its REP.
Table 6.9 shows the estimated tax gap for large employers has gradually increased in line with total liabilities between the tax years 2005-06 and 2012-13.
Table 6.9: Estimated tax gap for large employers (£ billion)1
2005-06 2006-07 2007-08 2008-09 2009-10 2010-11 2011-12 2012-13
Under-declared liabilities due to incorrect returns
Upper estimate 2.4 2.5 2.4 2.4 2.2 2.3 2.4 2.7
Mid-point estimate 1.8 1.9 1.7 1.7 1.5 1.6 1.6 2.0
Lower estimate 1.2 1.2 1.0 1.1 0.9 0.8 0.9 1.2
Compliance yield2 0.1 0.1 0.1 0.1 0.2 0.3 0.3 0.5
Non-payment 0.1 0.2 0.4 0.4 0.7 0.8 0.9 0.8
Total tax gap
Upper estimate 2.4 2.6 2.7 2.7 2.7 2.8 3.0 3.0
Mid-point estimate 1.8 1.9 2.0 2.0 2.0 2.1 2.2 2.2
Lower estimate 1.2 1.3 1.4 1.4 1.4 1.4 1.5 1.5
Total theoretical tax liabilities 124.4 132.9 137.4 136.7 137.8 144.6 149.6 150.1
Proportion of liabilities 1.5% 1.5% 1.5% 1.5% 1.5% 1.5% 1.5% 1.5%
1 Figures rounded to the nearest £0.1 billion. As a result components may not appear to sum.
2 By period of settlement of enquiry.

HM Revenue & CustomsMeasuring tax gaps 201452
Results for avoidance and hidden economy
Avoidance
The avoidance tax gap for IT, NICs and CGT for 2012-13 was £1.4 billion.
Hidden economy
The direct tax hidden economy estimate of £4.4 billion in 2012-13 consists of three elements: ghosts, moonlighters and PAYE individuals not in SA.
Ghosts and moonlighters
The 2012-13 illustrative estimates for ghosts was £1.3 billion and for moonlighters was £2.1 billion.
PAYE individuals not in Self Assessment
Estimates relating to the income and capital gains of individuals taxed through PAYE in 2012-13 and who do not receive SA returns was £1 billion. Estimates for 2010-11, 2011-12 and 2012-13 are projected from 2009-10 data in line with the trend in gross domestic product.
Methodology and data issues
Overview
Most of the IT, NICs and CGT components of the tax gap are estimated using our own sources, such as surveys, administrative and operational data. These methods are based on our compliance activity which can, in some cases, take years to complete. This means the resulting tax gap estimates typically apply to periods before 2012-13. This has two consequences:
• To produce a tax gap for years that have not yet been estimated, the latest available estimate is projected forward. The projections are made using the change in the tax liabilities for the relevant tax. Using tax liabilities ensures that our projections reflect changes to tax rates and taxable income, and projects a stable level of underlying compliance. Hidden economy components are projected forward using growth in GDP or wages and salaries rather than tax liabilities, as there is no directly relevant data series to base predictions on.
• Estimates for earlier years have been revised as they now include additional data from compliance checks that have been completed since last year’s publication.
The methods used differ between taxes, according to the type of non-compliance and the type of taxpayer involved. The main methods used to estimate tax gaps for direct taxes are random enquiries, data matching and risk registers. Where robust methodologies have not yet been developed, an illustrative tax gap estimate is given based on our operational experts opinion or calculated by selecting the nearest equivalent measured gap.

HM Revenue & CustomsMeasuring tax gaps 201453
Table 6.10: Summary of methods by tax gap estimates
Tax gap Population section Methods used
EC (IT and NICs on employment income and tax on occupational pensions)
Employers with up to 250 employees (except where the employer is part of a complex group).
Random enquiries
Employers dealt with by our Large Business Service or are within the Local Compliance Large and Complex population.
Illustrative estimate
SA (IT, NICs and CGT)
Business taxpayers consisting of self-employed taxpayers and partnerships with up to four partners who receive a notice to file an SA return.
Random enquiries
Non-business taxpayers consisting of individuals without business income and trusts who receive a notice to file an SA return.
Random enquiries
Partnerships with five or more partners who receive a notice to file an SA return.
Illustrative estimate
Avoidance (IT, NICs and CGT)
Individuals, trusts, partnerships and employers. Risk register
Hidden economy
Employees and pensioners who are taxed through PAYE but are outside SA. Data matching
Ghosts Illustrative estimate
Moonlighters Illustrative estimate
Random enquiriesRandom enquiry programmes (REPs) involve samples of taxpayers being selected at random and their returns subjected to full enquiries by HMRC officers. The results of these programmes show the proportion of taxpayers under-reporting their tax liabilities and the corresponding amount of additional tax due. These results can be used to produce an estimate for the amount of under-declared tax liability for the whole population, as the enquiries are randomly selected and form a representative sample. A proportion of the under-declared liabilities will be recovered as a result of our compliance activity, which is then subtracted from the estimate of under-declared liabilities.
The REPs will not identify all incorrect returns or the full scale of tax gaps, especially where independent information from third parties is not available to verify the data supplied by the taxpayer. This means that tax gap estimates produced through random enquiries will under estimate the full extent of the tax gap.
The Internal Revenue Service (IRS) in the United States has tackled this problem by using a range of ‘multipliers’ to make adjustments for non-detectionF. These multipliers are generated through supplementary studies on particular tax return entries, together with econometric analysis of non-detection rates across IRS examiners. Multipliers based on the IRS research with some adjustments for the UK tax system, have been applied to the REP results.
F James Andreoni, Brian Erard and Jonathan Feinstein (1998) ‘Tax Compliance’, Journal of Economic Literature, Vol. 36, No. 2. (Jun., 1998), pp. 818-860
Random enquiry programmes
HMRC audits a random sample of taxpayers.
The under-declared tax identified is scaled up to the taxpayer population.
The results are used to estimate the tax gap.
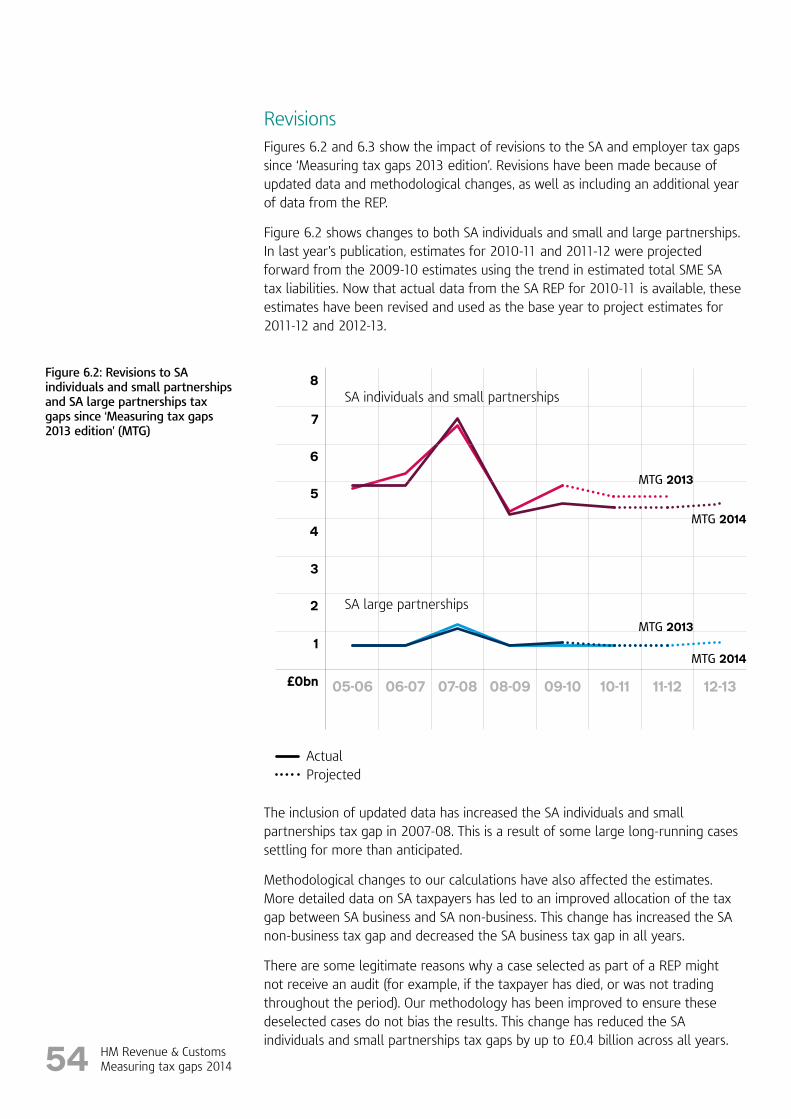
HM Revenue & CustomsMeasuring tax gaps 201454
Revisions Figures 6.2 and 6.3 show the impact of revisions to the SA and employer tax gaps since ‘Measuring tax gaps 2013 edition’. Revisions have been made because of updated data and methodological changes, as well as including an additional year of data from the REP.
Figure 6.2 shows changes to both SA individuals and small and large partnerships. In last year’s publication, estimates for 2010-11 and 2011-12 were projected forward from the 2009-10 estimates using the trend in estimated total SME SA tax liabilities. Now that actual data from the SA REP for 2010-11 is available, these estimates have been revised and used as the base year to project estimates for 2011-12 and 2012-13.
Figure 6.2: Revisions to SA individuals and small partnerships and SA large partnerships tax gaps since ‘Measuring tax gaps 2013 edition’ (MTG)
The inclusion of updated data has increased the SA individuals and small partnerships tax gap in 2007-08. This is a result of some large long-running cases settling for more than anticipated.
Methodological changes to our calculations have also affected the estimates. More detailed data on SA taxpayers has led to an improved allocation of the tax gap between SA business and SA non-business. This change has increased the SA non-business tax gap and decreased the SA business tax gap in all years.
There are some legitimate reasons why a case selected as part of a REP might not receive an audit (for example, if the taxpayer has died, or was not trading throughout the period). Our methodology has been improved to ensure these deselected cases do not bias the results. This change has reduced the SA individuals and small partnerships tax gaps by up to £0.4 billion across all years.
1
2
3
£0bn
8
6
7
4
5
05-06 06-07 07-08 08-09 09-10 10-11 11-12 12-13
MTG 2014
MTG 2014
MTG 2013
MTG 2013
SA individuals and small partnerships
SA large partnerships
ActualProjected

HM Revenue & CustomsMeasuring tax gaps 201455
From 2011-12 the random sample for the SA business population has been split into turnover bands. This change will increase the accuracy of the estimate, but will have no impact on the level. For more details see the ‘Methodological annex’.
The SA large partnerships estimate has seen only minor revisions since last year’s publication.
Figure 6.3 shows the changes to the estimates since last year’s publication for both SME and large employers.
Figure 6.3: Revisions to SME employers and large employers tax gaps since ‘Measuring tax gaps 2013 edition’ (MTG)
Last year’s SME employers estimate for 2011-12 was projected forward from the 2010-11 estimate using the trend in estimated total SME PAYE tax liabilities. Now that actual data from the EC REP for 2011-12 is available, this estimate has been lowered by £0.4 billion, and the estimate for 2012-13 now projected from 2011-12. There have only been minor revisions to earlier years. The methodological change to the treatment of deselected cases has led to minor reductions across all years.
Non-payment
The tax gap estimates include a measure of associated losses from non-payment of tax by the relevant type of taxpayer, if appropriate. Non-payment estimates for direct taxes come from our financial statements and represent amounts written off or remitted; that is, debts that are not collectable. Direct tax debts that are paid at a later date do not form part of the direct tax gap, although payment will be deferred. Due to timing effects the amounts written off during a tax year will not all relate to liabilities arising during that year.
0.5
1.0
1.5
£0bn
3.0
2.0
2.5
05-06 06-07 07-08 08-09 09-10 10-11 11-12 12-13
MTG 2014
MTG 2014
MTG 2013
MTG 2013
Large employers
SME employers
ActualProjected

HM Revenue & CustomsMeasuring tax gaps 201456
Large employers
Larger employers with 250 or more employees, including those dealt with by our Large Business Service and employers which are part of a complex group, are not covered by the EC REP. This means an alternative methodology is required to produce an indicator of the associated tax gap. An illustrative estimate is produced by assuming that the tax at risk will represent a similar proportion of liabilities to SME employers, as shown by the results of the REP.
Large partnerships
Partnerships with five or more partners are not covered by the SA REP which means an alternative methodology is required to estimate the associated tax gap. An illustrative estimate can be produced by assuming that the tax at risk will represent a similar proportion of liabilities to all other SA taxpayers, as shown by the results of the REP.
Avoidance
The IT, NICs and CGT avoidance tax gap for 2012-13 is estimated using our ‘risk register’ of information on identified avoidance schemes used by individuals, trusts, partnerships and employers. The tax gap is calculated by subtracting an annual estimate of the compliance yield from the annual estimated tax under consideration relating to avoidance. (See ‘Methodological annex’ for more information on data sources, methodology and limitations).
The methodology used to estimate the IT, NICs and CGT tax gap includes several improvements this year:
• A tax gap estimate from closed enquiries.
• The number of years that the tax under consideration was assumed to relate was increased from three to six years. This change followed analysis of the taxpayer-level data and the quality assurance review that showed avoidance schemes relating to more years than previously assumed.
• Avoidance scheme notifications data was used to apportion the tax under consideration over the assumed period instead of being evenly apportioned as before.
• Where the quality assurance review produced accurate data on the tax years that particular schemes relate to, this was used instead of the assumed six year period.
• The ‘conversion ratios’ used to estimate the compliance yield have been updated to reflect the new taxpayer-level data. This includes closed enquiry data on IT, NICs and CGT risks in addition to our Large Business Service Corporation Tax risks previously used. This means it should provide a fairer basis for estimating the compliance yield.
HMRC maintains a risk register of identified avoidance schemes.
These risks are then allocated across years.
Compliance yield is then subtracted to calculate the tax gap.

HM Revenue & CustomsMeasuring tax gaps 201457
Hidden economy
The direct tax hidden economy estimate is composed of three elements:
• PAYE individuals not in SA
• Ghosts
• Moonlighters.
PAYE individuals not in SA
A tax gap estimate is produced for employees and pensioners taxed under PAYE who do not receive SA returns and have not returned details of additional taxable income.
In the absence of updated data and consistent with the estimates for 2010-11 and 2011-12, the estimate for 2012-13 is projected from the methodology that produced the 2009-10 estimate.
By matching data supplied by third parties to a sample of our PAYE records, it has been possible to produce a tax gap estimate relating to income and capital gains of individuals taxed through PAYE but who do not receive SA returns. Several sources of income were investigated, such as income from lettings, bank and building society interest and capital gains. Where a difference was found between income in the third party data and the tax records, the tax that should have been paid on this income, if any, was then calculated and identified as the tax gap. The results from the sample were then grossed to produce an estimate of the overall tax gap for all employees and pensioners taxed through PAYE who are outside SA.
The limitations associated with the results of this exercise relate to the coverage of the third party data used to establish evidence of additional undeclared income. Not all potential sources of income could be investigated due to availability of data and the investigation of some sources was limited by the completeness of the information. As a result, the estimate should be interpreted as a lower limit for the true scale of the tax gap relating to this group of taxpayers.
Ghosts and moonlighters
‘Ghosts’ are individuals who receive income from employment or self-employment but are not known to HMRC because they and/or their employers fail to declare their earnings. Ghosts are not accurately recorded by any government agency or survey, which means any estimate about their number or the potential loss of duty is approximate.
‘Moonlighters’ are individuals who pay tax on their main job through PAYE, but who fail to declare earnings from a second job or additional income from self employment.
Using a series of assumptions, it has been possible to produce illustrative estimates of the tax gap from moonlighters and ghosts. Due to the extent of the assumptions used to produce this estimate and the inherent uncertainties in the methodologies, this estimate has a large margin of error and should be treated with due caution.
‘Ghosts’ are individuals who receive income from employment but are not known to HMRC
‘Moonlighters’ are individuals who are taxed through PAYE and have another source of income which they have not declared

HM Revenue & CustomsMeasuring tax gaps 201458
7. Corporation Tax
Key findings for Corporation Tax • The estimated total tax gap for Corporation Tax (CT) was £3.9 billion in
2012-13 (£4.7 billion in 2011-12). This represents 11 per cent of the overall tax gap.
• The CT gap is estimated to be nine per cent of the estimated CT liabilities in 2012-13 (eight per cent in 2011-12).
Key findings for large businesses• In 2012-13 the CT gap for large businesses was estimated to be seven per
cent of large businesses CT liabilities. This is comprises of businesses managed by our Large Business Service (LBS) and businesses managed by our Local Compliance Large and Complex (L&C) directorates.
• The LBS CT gap has remained at five per cent of theoretical liabilities since 2009-10. This equates to £1.3 billion in 2011-12 and £1.1 billion in 2012-13.
• The LBS CT gap fell from £2.6 billion in 2005-06 to £1.1 billion in 2012-13. As a proportion of estimated CT liabilities, the LBS CT gap declined from eight per cent to five per cent over the same period, which is broadly consistent with a reduction in the use of aggressive tax planning by large businesses.
• The illustrative L&C CT gap fell slightly from ten per cent to nine per cent of theoretical liabilities between 2011-12 and 2012-13 (£0.7 billion in both years).
Key findings for small and medium-sized businesses• The CT gap for small and medium-sized businesses (SMEs) is estimated to be
£2.1 billion in 2012-13, which is equivalent to 11 per cent of SME CT liabilities.
• The percentage tax gap for SME CT declined from 17 per cent in 2005-06 to 11 per cent in 2012-13.
• The proportion of SMEs submitting an incorrect return leading to a loss of tax declined from 41 per cent in 2005-06 to 24 per cent by 2009-10, before rising to 28 per cent in 2010-11.
9%The overall Corporation Tax gap was 9% of CT liabilities in 2012-13
5% LBS
9% L&C
11% SMEs

HM Revenue & CustomsMeasuring tax gaps 201459
Introduction
The tax gap for CT is estimated separately for SMEs and large businesses. The large business estimates are subdivided into two categories; ‘Large Business Service’ (LBS) and ‘Large and Complex’ (L&C). These are our two directorates that oversee the tax affairs of these businesses. The LBS handle the largest businesses, approximately 800 groups, and L&C oversee a much larger number of comparatively smaller businesses, approximately 9,500. In Chapter 1, estimates for LBS and L&C are combined under the heading ‘Large businesses’.
Figure 7.1 shows that the CT gap estimate as a proportion of total CT liabilities has stayed broadly stable in the last three years, but declined from 13 per cent in 2005-06 to nine per cent in 2012-13. The overall trend masks some differences in the estimate between businesses of different sizes. Businesses managed by LBS have a lower percentage tax gap compared with smaller businesses, perhaps due to the scrutiny of customer relationship managers who closely monitor the largest businesses. Given that the L&C CT gap estimate is derived from an illustrative methodology, care should be taken when interpreting the L&C CT gap estimate.
Figure 7.1: Corporation Tax gap as a proportion of liabilities by business type
5
0%
20
15
10
05-06 06-07 07-08 08-09 09-10 10-11 11-12 12-13
ActualProjected
SMEs
L&C
All businessesLarge businesses
LBS

HM Revenue & CustomsMeasuring tax gaps 201460
G See HMRC CT statistics, Table 11.2 Despite gross taxable trading profits plus other taxable income and net capital gains (excluding life assurance, overseas and North Sea oil companies) falling from £398 billion to £370 billion between 2009-10 and 2010-11, total deductions (for example group relief) fell at a faster rate, resulting in overall CT liabilities increasing from £31.7 billion to £34.5 billion.
Table 7.1: Estimated LBS CT gap (£ billion)
2005-06 2006-07 2007-08 2008-09 2009-10 2010-11 2011-121 2012-131
Total tax under consideration2,3,4 6.8 7.5 7.1 5.3 5.6 6.1 n/a n/a
Technical risks not subject to litigation
2.3 2.9 3.5 2.5 3.7 3.5 n/a n/a
Avoidance risks or technical risks subject to litigation
4.4 4.7 3.6 2.8 1.8 2.6 n/a n/a
Compliance yield5 1.9 2.4 1.8 1.3 0.9 1.3 n/a n/a
Tax gap6 2.6 2.2 1.8 1.5 1.0 1.3 1.3 1.1
Avoidance risks 2.2 2.0 1.6 1.4 1.0 1.3 1.3 1.1
Technical risks subject to litigation
0.4 0.2 0.3 0.1 0.04 0.05 0.05 0.04
Total theoretical tax liabilities7 31.5 29.9 27.6 24.0 20.2 24.7 24.0 20.2
Tax gap as a proportion of liabilities
8% 7% 7% 6% 5% 5% 5% 5%
1 Tax gap estimates for 2011-12 and 2012-13 are projected using factors of 1.0 and 0.8 respectively, based on the trend in CT receipts for LBS groups.
2 Estimates include both risks that are being worked (open) and risks that have been settled (closed) — see Table 7.2.
3 Tax under consideration is defined in the glossary.
4 Figures rounded to the nearest £100 million, or the nearest £10 million if they are less than £50 million. Figures may not appear to sum due to rounding.
5 Compliance yield is the total yield from closed avoidance or litigated technical risks plus the estimated compliance yield from open avoidance risks and technical risks in litigation. Compliance yield in this table relates to a specific accounting periods and cannot be compared to reported compliance yield.
6 Tax gap is tax under consideration on avoidance risks and technical risks subject to litigation minus compliance yield. This includes tax gap from risks identified or recorded in subsequent accounting periods of £0.2 billion in 2008-09, £0.2 billion in 2009-10 and £0.3 billion in 2010-11.
7 Total theoretical tax liabilities is the estimated CT liabilities from LBS groups plus the tax under consideration on avoidance risks and technical risks subject to litigation.
Results and tables for our Large Business ServiceThe LBS CT gap estimates for 2012-13 are taken from our operational data relating to accounting periods (APs) ending in 2010-11 (the latest year of available information). The estimates are based on tax under consideration: this is not tax owed or unpaid — it is a tool which helps managers to better direct resources in order to produce the best results. The 2010-11 estimate of the LBS CT gap is £1.3 billion, which is broadly in line with the projected 2010-11 estimate published last year (£1.4 billion) and is £0.3 billion higher than the latest estimate for 2009-10 (£1 billion). As in previous years, nearly all the LBS CT gap arises from avoidance risks (Table 7.1).
The £0.3 billion increase in the tax gap between 2009-10 and 2010-11 appears to be driven by the increase in the number of risks identified. During the recession reduced profitsG and the availability of losses (that can be used to lower a group’s tax liability) may have reduced both the appetite for avoidance and the number of risks. As the economic environment improves and companies return to profit, the opportunity (if not the appetite) for companies to engage with avoidance in their tax strategy increases.

HM Revenue & CustomsMeasuring tax gaps 201461
Figure 7.2: LBS CT gap; tax under consideration and yield for avoidance risks and technical risks subject to litigation
*The UK economy was in recession between April 2008 and September 2009 (ONS GDP estimates, 2014)
Table 7.1 shows estimates of the LBS CT gap for accounting period ending in 2005-06 to 2010-11 as at June 2014 and projected estimates for 2011-12 and 2012-13. Projections for the latest two years are based on the change in the CT receipts of LBS groups (see note 1 in Table 7.1). Using tax receipts ensures that the projections reflect changes to CT rates and taxable profits and assumes a stable level of underlying compliance.
Until 2009-10, the estimates suggested a shift in the types of risks being dealt with by LBS; from avoidance risks and technical risks subject to litigation to technical risks not subject to litigation. However, this change is not apparent in 2010-11 where both the number and value of avoidance risks and technical risks subject to litigation increased. As for the overall LBS CT gap, an improved economic environment may explain these increases in 2010-11.
1
£0bn
4
5
3
2
Tax gap
05-06 06-07 07-08 08-09 09-10 10-11
Tax under consideration
Recession*
Yield

HM Revenue & CustomsMeasuring tax gaps 201462
Table 7.2: CT risks for LBS groups
2005-06 2006-07 2007-08 2008-09 2009-10 2010-11
Total number of risks1,2 1,942 1,473 1,247 786 575 683
Technical risks not subject to litigation 1,390 1,012 876 580 448 543
Avoidance risks or technical risks subject to litigation 552 461 371 206 127 141
Average tax under consideration from all risks (£m)3 3.3 4.7 5.3 6.8 9.6 8.9
Technical risks not subject to litigation 1.7 2.8 4.0 4.3 8.3 6.5
Avoidance risks or technical risks subject to litigation 7.3 9.0 8.3 11.8 11.9 14.3
Percentage of risks closed (%) 96 95 90 84 78 55
Percentage of tax under consideration closed (%) 92 92 76 69 54 57
1 Risks may span more than one accounting period, but are capped at five accounting periods from the 2008-09 estimates.
2 Figures may not appear to sum due to rounding.
3 The average value of each risk is calculated using the estimates before the adjustment for risks recorded in future accounting periods. The adjustments increase the tax under consideration but not the number of risks.
Table 7.2 shows the number and average value of risks from 2005-06 to 2010-11. Although the broad trends have not changed, the total number of risks before 2007-08 should not be directly compared with the number after 2007-08 due to a methodological change (see Methodology and data issues).
Methodology and data issues for the Large Business ServiceEstimates of the LBS CT gap come from information on our case management system. Where our tax specialists identify risks for further consideration, an initial estimate of the tax associated with these risks is recorded on the system as the ‘tax under consideration’.
The LBS case management system allows the classification of risks into two broad categories; avoidance and technical risks. The avoidance category relates to the use of disclosed avoidance schemes and other suspected avoidance identified by our tax specialists. Technical risks cover a wide range of risks: from cases where there is genuine uncertainty about the correct tax treatment, through mistakes to culpable errors in, or omissions from, the company tax return.
The tax gap is calculated as tax under consideration minus the total actual and expected compliance yield for avoidance risks and for technical risks subject to litigation. The risks will be worked until resolution in line with our litigation and settlement strategy. There is assumed to be no tax gap on technical risks settled by agreement. The flowchart at Figure 7.3 shows the process for arriving at the tax gap estimate.

HM Revenue & CustomsMeasuring tax gaps 201463
Figure 7.3: The process for estimating the LBS CT gap by category
Actual compliance yield1
Expected compliance yield2
Actual compliance yield1
Expected compliance yield2
Tax under consideration on avoidance risks
Tax under consideration on technical risks subject to
litigation
Tax under consideration on technical risks
not subject to litigation
No tax gap from technical risks not subject to litigation
Estimated tax gap
Estimated tax gap
Estimated tax gap
Tax under consideration
Estimated tax gap = tax under consideration – (actual + expected yield)
1 Actual compliance yield refers to closed risks only.
2 Expected compliance yield refers to forecast yield from open risks.
Closed enquiries Open enquiries
Identified risks can take a number of years to resolve. For open enquiries, it is necessary to estimate the expected compliance yield to calculate the tax gap. Differences between the estimated and actual compliance yield will lead to revised tax gap estimates in subsequent publications. Table 7.2 shows the proportion of risks that have closed from accounting periods ending in 2005-06 to 2010-11. The tax gap for more recent years is likely to be subject to larger revisions as a higher proportion of the compliance yield is estimated.
Risks may also take a number of years to identify, so new risks for the accounting periods presented may be identified in subsequent accounting periods. Analysis of past data is used to estimate an appropriate increase to the tax under consideration to reflect the additional risks that are expected to be identified at a later point. Additional tax under consideration may result in additional tax gap. Larger adjustments to tax under consideration are made to recent accounting periods than to older accounting periods (see note 6 in Table 7.1).
Risks can relate to a number of accounting periods. Tax under consideration is allocated to the appropriate year using data from the case management system. There has been a small change to the approach used to allocate tax under consideration this year in order to simplify the process. Although this has a minimal impact on the overall tax gap estimates, the number of risks since 2008-09 are estimated on a different basis so should not be compared to earlier years (see ‘Methodological annex’, which includes an adjusted series of the total number of risks to enable comparisons over time).
LBS reports compliance yield on a year of settlement basis, whereas the tax gap estimates are based on a financial year accounting period basis. For tax gap purposes only, compliance yield is calculated as the total yield from closed avoidance or litigated technical risks relating to that accounting period plus the estimated compliance yield from open avoidance risks and technical risks in litigation.

HM Revenue & CustomsMeasuring tax gaps 201464
Figure 7.4: Revisions to LBS CT gap since ‘Measuring tax gaps 2013 edition’*†
The main rate of CT has fallen in recent years; it was 30 per cent in 2005-06 to 2007-08, 28 per cent from 2008-09 to 2010-11, 26 per cent in 2011-12 and 24 per cent in 2012-13. Although it is difficult to quantify changes in taxpayer behaviour and compliance due to the reduction in rate, it is estimated that the rate change would lead to a fall of approximately £0.1 billion in the LBS CT gap estimate.
RevisionsTax gap estimates for accounting periods ending between 2008-09 and 2009-10 have been revised since ‘Measuring tax gaps 2013 edition’ to account for the latest data available (see Table 7.4). Minor changes result because a more recent snapshot of the data is used each year. For example, the 2009-10 estimate of the tax gap was £1.1 billion using the July 2013 snapshot and £1 billion using the June 2014 snapshot. Where time has elapsed between data snapshots, differences between the initial and latest tax gap estimates are expected for the following reasons;
• More risks may be found, leading to additional tax under consideration in any category.
• A larger proportion of the tax gap estimate will be based on actual yield numbers, replacing the values previously forecast.
• The forecast values may change as the conversion ratio calculation is based on a larger sample of closed cases.
• Our judgement on the tax under consideration of a risk or its classification as avoidance or technical may change where better information has emerged.
Actual
Projected
0.5
1.0
1.5
£0bn
3.0
2.0
2.5
05-06 06-07 07-08 08-09 09-10 10-11 11-12 12-13
MTG 2014
MTG 2013
* Estimates for ‘Measuring tax gaps 2013 edition’, 2010-11 and 2011-12 are projected using factors of 1.26 and 1.25 respectively, based on the trend in Corporation Tax receipts for LBS groups.
† Estimates for ‘Measuring tax gaps 2014 edition’, 2011-12 and 2012-13 are projected using factors of 1.0 and 0.8 respectively, based on the trend in Corporation Tax receipts for LBS groups.

HM Revenue & CustomsMeasuring tax gaps 201465
Table 7.3: Estimated L&C CT gap (£ billion)1
2007-08 2008-09 2009-10 2010-11 2011-12 2012-13
Estimated tax at risk 1.5 1.3 1.4 1.2 1.3 1.2
Compliance yield 0.6 0.6 0.6 0.6 0.7 0.8
Non-payment 0.1 0.2 0.2 0.2 0.1 0.2
Tax gap 1.0 0.9 1.0 0.8 0.7 0.7
Total theoretical tax liabilities2 8.0 8.1 8.0 7.0 7.7 7.3
Tax gap as a proportion of theoretical tax liabilities 13% 11% 13% 12% 10% 9%
1 Figures may not appear to sum due to rounding.
2 Total theoretical tax liabilities is the estimated Corporation Tax liabilities from L&C businesses plus the estimated tax gap.
Limitations
The main source of error in these estimates is that HMRC may not identify all risks — which will lead to an underestimation of the tax gap. It is difficult to quantify how this impacts the estimates. However, in the Chancellor’s Autumn Statement in 2012, the creation of a Large Business Risk Taskforce was announced to identify additional risks in large businesses. The data from the taskforce may help to provide evidence for an uplift factor for unidentified risks. This will be considered fully in due course.
As it can take many years to close every risk identified in a particular year, the yield expected from open cases must be forecast to be able to produce estimates of the overall tax gap. Differences between forecast yield and actual yield may lead to some degree of error, and as such, estimates are provisional until every risk is closed.
Results and tables for Large and Complex businesses The L&C CT gap estimates were £0.7 billion for 2011-12 and 2012-13 (see Table 7.3). Tax gap estimates for businesses dealt with by L&C remain illustrative as it is difficult to estimate the tax gap from existing data sources. Our data on L&C businesses relates to tax risks identified through risk assessment and are not representative of the risks in the wider population. This means the data cannot be used to draw inferences about rates of non-compliance for all L&C businesses (like the SME CT estimates that are based on data from the random enquiry programme), or LBS businesses, where close scrutiny of every business means that most risks are identified.

HM Revenue & CustomsMeasuring tax gaps 201466
Methodology and data issues for Large and Complex businessesThe illustrative estimate of the L&C CT gap is produced by assuming that the tax at risk will represent a similar proportion of liabilities to LBS businesses. Applying this assumption to the L&C CT liabilities data produces an estimate of the tax at risk for L&C businesses for each year. The 2010-11 estimate is projected to 2011-12 and 2012-13 based on the trend in L&C CT liabilities. This produces estimates of tax at risk for 2011-12 and 2012-13, from which compliance yield is subtracted and an estimate of losses from non-payment is added. Compliance yield is a smaller proportion of the tax at risk in L&C businesses, so the percentage tax gap is higher.
Revisions The 2011-12 L&C CT gap, estimated to be £0.9 billion in ‘Measuring tax gaps 2013 edition’, has been revised to £0.7 billion this year. The reduction in the previous estimate is due to an increase in the estimate of compliance yield. More detailed data has enabled improved allocation of CT compliance yield between L&C and SME businesses.
Results and tables for small and medium-sized businesses Tax gap estimates from incorrect returns are taken from the CT random enquiry programme (REP) and data on compliance yield and non-payment. Incorrect tax returns are those found by our enquiries to have under-declared tax liability. This could be as a result of error, failure to take reasonable care or evasion. The REP covers SMEs, which in this context means those businesses not managed by the LBS or L&C, and is broadly in line with the EU definition of SME.
Table 7.4 shows estimated tax gaps for businesses with accounting periods ending in financial years 2005-06 to 2012-13. The projected CT gap for SMEs was £2.1 billion in 2012-13. The latest REP data used is for the 2010-11 financial year, with the estimates for 2011-12 and 2012-13 based on projections of the year-on-year change in estimated total SME CT liabilities.
The percentage tax gap has declined from 17 per cent in 2005-06 to 11 per cent in 2012-13 (see Table 7.4).

HM Revenue & CustomsMeasuring tax gaps 201467
Table 7.4: Estimated SME CT gap (£ billion)1
2005-06 2006-07 2007-08 2008-09 2009-10 2010-11 2011-122 2012-132
Under-declared liabilities due to incorrect returns3
Upper estimate 4.5 3.9 4.8 3.8 3.0 3.3 3.5 3.7
Mid-point estimate 2.3 1.9 2.2 1.8 1.4 1.6 1.7 1.8
Lower estimate 1.0 0.8 0.9 0.7 0.6 0.7 0.7 0.8
Compliance yield4 0.2 0.2 0.2 0.2 0.2 0.2 0.2 0.2
Non-payment 0.2 0.2 0.3 0.4 0.5 0.5 0.4 0.4
Total tax gap5
Upper estimate 4.5 3.9 4.9 4.0 3.4 3.6 3.7 4.0
Mid-point estimate 2.3 1.9 2.4 2.0 1.8 2.0 2.0 2.1
Lower estimate 1.0 0.8 1.0 1.0 1.0 1.0 1.0 1.1
Total theoretical tax liabilities 13.3 14.0 16.9 16.5 14.9 17.2 17.9 19.0
Proportion of theoretical tax liabilities
17% 13% 14% 12% 12% 11% 11% 11%
1 Figures rounded to the nearest £0.1 billion. As a result components may not appear to sum.
2 Projection factors applied to gross tax gap estimate for 2010-11 to produce projected estimates for 2011-12 and 2012-13. These are based on the trend in estimated total SME Corporation Tax liabilities.
3 Ranges for under-declared liabilities are 95 per cent confidence intervals.
4 By period of settlement of enquiry.
5 Includes avoidance estimates.
Table 7.5 shows that between the years 2005-06 to 2009-10, the proportion of SMEs submitting an incorrect CT return leading to a loss of tax declined from 41 per cent to 24 per cent before increasing to 28 per cent in 2010-11. These figures may be revised in future due to a small number of cases which have not yet settled.
The proportion of businesses which had annualised additional liability of more than £1,000 declined from 19 per cent in 2005-06 to 14 per cent from 2007-08 onwards. The proportion of annualised additional liability under £1,000 fell from 22 per cent in 2005-06 to a low of ten per cent in 2009-10, before increasing to 14 per cent in 2010-11.
Table 7.5: Proportion of SMEs with incorrect CT returns where additional liability established1
2005-06 2006-07 2007-08 2008-09 2009-10 2010-11
Proportion of SMEs 41% 32% 25% 25% 24% 28%
of which, size of additional liability
£1 to £1,000 22% 15% 11% 11% 10% 14%
over £1,000 19% 18% 14% 14% 14% 14%
1 Figures rounded to the nearest one percentage point. As a result components may not appear to sum.

HM Revenue & CustomsMeasuring tax gaps 201468
Methodology and data issues for small and medium-sized businessesThe CT REP allows HMRC to estimate the extent of under-declaration of liabilities arising from the submission of incorrect CT returns. The random sample used for the programme is selected from SMEs issued with a notice to file a CT return.
Enquiries are taken up into the sampled returns. The results are then extrapolated to the population to produce estimates of compliance.
As enquiries can take a number of years to settle, it is necessary to make assumptions about any enquiries that are still open at the time of analysis. This means figures are subject to revision until all enquiries are settled. Estimates have been revised since the previous publication to include information on the outcomes of late settling enquiries.
The latest year of CT REP data used relates to 2010-11, with estimates for 2011-12 and 2012-13 projected in line with the trend in estimated total SME CT liabilities.
CT REP data relating to 2011-12 is available but has not been used due to concerns over data quality. Further investigations are required before incorporating the 2011-12 data (which would currently suggest a five per cent tax gap in 2011-12, compared to 11 per cent in 2010-11).
Based on US research, a multiplier of 1.4 is applied to account for non-detected non-compliance. Compliance yield is then subtracted, and estimates for losses from non-payment and SME CT avoidance added.
RevisionsTax gap estimates for historic years have been revised since the publication of ‘Measuring tax gaps 2013 edition’ to take account of the latest information available (see Figure 7.5).
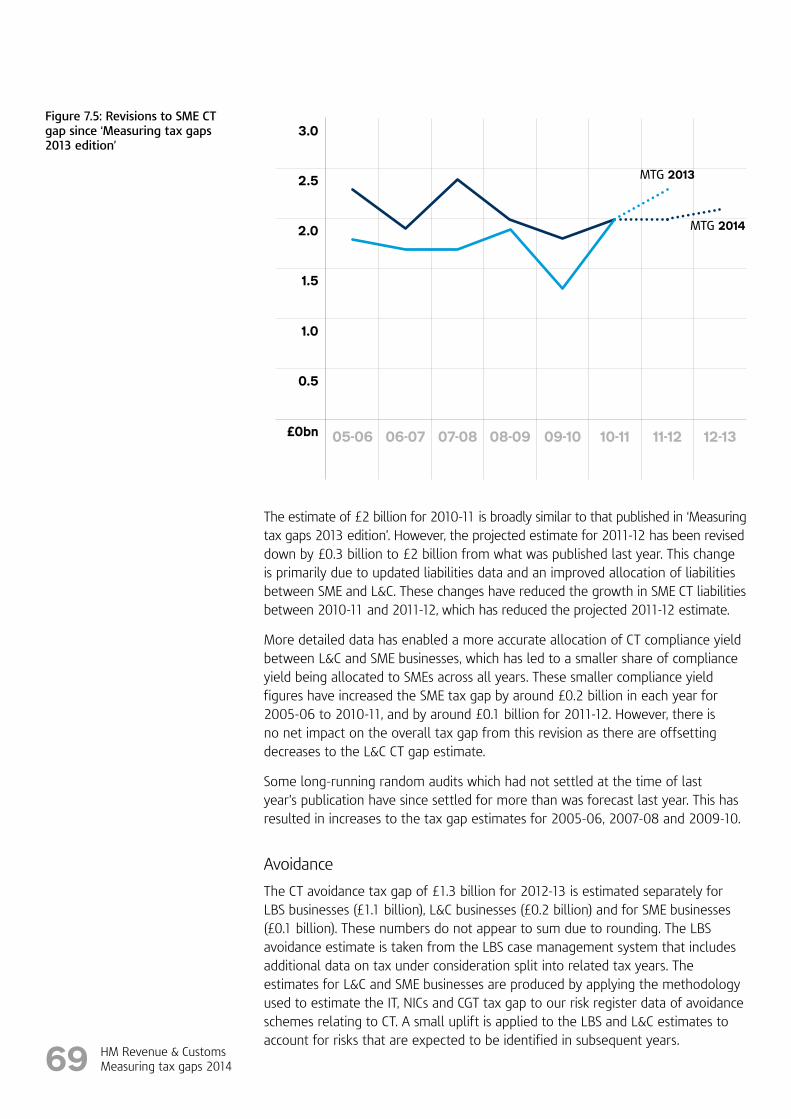
HM Revenue & CustomsMeasuring tax gaps 201469
Figure 7.5: Revisions to SME CT gap since ‘Measuring tax gaps 2013 edition’
The estimate of £2 billion for 2010-11 is broadly similar to that published in ‘Measuring tax gaps 2013 edition’. However, the projected estimate for 2011-12 has been revised down by £0.3 billion to £2 billion from what was published last year. This change is primarily due to updated liabilities data and an improved allocation of liabilities between SME and L&C. These changes have reduced the growth in SME CT liabilities between 2010-11 and 2011-12, which has reduced the projected 2011-12 estimate.
More detailed data has enabled a more accurate allocation of CT compliance yield between L&C and SME businesses, which has led to a smaller share of compliance yield being allocated to SMEs across all years. These smaller compliance yield figures have increased the SME tax gap by around £0.2 billion in each year for 2005-06 to 2010-11, and by around £0.1 billion for 2011-12. However, there is no net impact on the overall tax gap from this revision as there are offsetting decreases to the L&C CT gap estimate.
Some long-running random audits which had not settled at the time of last year’s publication have since settled for more than was forecast last year. This has resulted in increases to the tax gap estimates for 2005-06, 2007-08 and 2009-10.
Avoidance
The CT avoidance tax gap of £1.3 billion for 2012-13 is estimated separately for LBS businesses (£1.1 billion), L&C businesses (£0.2 billion) and for SME businesses (£0.1 billion). These numbers do not appear to sum due to rounding. The LBS avoidance estimate is taken from the LBS case management system that includes additional data on tax under consideration split into related tax years. The estimates for L&C and SME businesses are produced by applying the methodology used to estimate the IT, NICs and CGT tax gap to our risk register data of avoidance schemes relating to CT. A small uplift is applied to the LBS and L&C estimates to account for risks that are expected to be identified in subsequent years.
0.5
1.0
1.5
£0bn
3.0
2.0
2.5
05-06 06-07 07-08 08-09 09-10 10-11 11-12 12-13
MTG 2014
MTG 2013

HM Revenue & CustomsMeasuring tax gaps 201470
8. Other taxes
Key findings• The illustrative tax gap for Stamp Duty Land Tax was £0.1 billion.
• The illustrative tax gap for Stamp Duty Reserve Tax was £30 million.
• The illustrative tax gap for Inheritance Tax was £0.3 billion.
• The illustrative tax gap for Petroleum Revenue Tax in 2012-13 was £40 million.
• The illustrative tax gap for the other indirect taxes was £0.4 billion.
This chapter describes how the tax gap has been estimated for components not covered elsewhere. A ‘direct’ tax is imposed on a person or a business, as opposed to an ‘indirect’ tax which is imposed on a transaction. All estimates are illustrative.
Table 8.1: Other direct and indirect tax gaps (£ billion)1
2005-06 2006-07 2007-08 2008-09 2009-10 2010-11 2011-12 2012-13
Direct
Stamp duties
Stamp Duty Land Tax n/a n/a n/a n/a 0.2 0.2 0.2 0.1
Stamp Duty Reserve Tax n/a n/a n/a n/a 0.03 0.03 0.03 0.03
Total 1.1 1.3 1.4 1.4 0.2 0.2 0.2 0.2
Other direct taxes
Inheritance Tax 0.150 0.200 0.250 0.250 0.275 0.275 0.350 0.300
Petroleum Revenue Tax 0.04 0.04 0.03 0.05 0.02 0.03 0.04 0.04
Total 0.2 0.2 0.3 0.3 0.3 0.3 0.4 0.3
Indirect
Other excise duties
Betting and gaming
0.1 0.2 0.2 0.1 0.1 0.1 0.1 0.1
Cider and perry
Spirits based ready-to-drinks
Biofuels
Other indirect taxes
Custom duties and levies
0.6 0.6 0.7 0.6 0.5 0.5 0.4 0.4
Air Passenger Duty
Insurance Premium Tax
Climate Change Levy
Aggregates Levy
Total other direct and indirect 1.8 2.2 2.3 2.3 1.0 1.0 1.1 0.9
1 Figures rounded to the nearest £100 million, or the nearest £10 million if they are less than £50 million. IHT estimates are rounded to the nearest £25 million. As a result components may not appear to sum.

HM Revenue & CustomsMeasuring tax gaps 201471
Methodology and data issues
Stamp taxes
The Stamp Duty Land Tax (SDLT) gap is estimated using a combination of ‘top-down’ and ‘bottom-up’ methodologies. The estimate includes both commercial and residential transactions.
The estimate for 2012-13 is lower than the corresponding figure for 2011-12 published in ‘Measuring tax gaps 2013 edition’. This reflects the progress HMRC has made in tackling SDLT avoidance.
Stamp Duty Reserve Tax is a tax largely collected at source through the CREST computer system (the London Stock Exchange’s electronic share settlement system) making the risk of non-compliance very low.
An illustrative estimate of the tax gap for Stamp Duty Reserve Tax (SDRT) has been produced using the assumption that the tax under consideration is approximately 1.5 per cent of receipts. Compliance yield is subtracted and losses from non-payment of SDRT are added. This results in an estimate of the tax gap for Stamp Duty Reserve Tax of £30 million for 2012-13.
Inheritance Tax
This is an illustrative estimate based on management assumption.
Methodology and data issues for Petroleum Revenue TaxAn illustrative indicator of the tax gap from Petroleum Revenue Tax (PRT) has been produced using the expert opinion of PRT specialists. Given the narrowly-defined extent of the tax (limited to oil-producing fields developed before April 1993), the small number of businesses involved and HMRC’s compliance approach of six-monthly reviews, a range of between one per cent and three per cent of receipts has been used to calculate an illustrative tax gap. This produces an estimate of £40 million in 2012-13.
Other excise and indirect taxes
A proxy indicator for the scale of revenue losses across other excise taxes has been produced based on the estimated percentage tax gaps for GB oils, spirits duty, beer duty and cigarettes duty. Hand rolling tobacco and the Northern Ireland oils gaps have not been used to produce the proxy indicator. This is because:
• Northern Ireland estimates include losses from legitimate cross-border shopping and so overestimate the true tax gap.
• It is clear from operational evidence that none of the unmeasured indirect taxes are subject to the high levels of fraud found in hand rolling tobacco.
For other indirect taxes, the indicator has been calculated by treating the unknown tax gaps as if they had the same simple average percentage loss as the selected

HM Revenue & CustomsMeasuring tax gaps 201472
measured excise gaps. By calculating the alcohol component separately, using known alcohol tax gaps, the calculation should be more representative.
The average percentage revenue losses should not be considered estimates of the true percentage loss across the taxes listed in Table 8.1 under ‘Other excise duties’ and ‘Other indirect taxes’ as this is unknown. Many of the indirect taxes listed are very different from one another in their nature, each being subject to different rules. The true percentage tax gaps are therefore likely to vary widely across the various taxes listed.

HM Revenue & CustomsMeasuring tax gaps 201473
Glossary
Accounting periodThe period for which a business prepares its accounts and in respect of which a Corporation Tax assessment is raised. It cannot be more than 12 months in length, although it can be shorter.
Central estimate The most likely estimate of the true value.
Compliance activityAn intervention by HMRC, such as a direct tax enquiry, employer compliance review or VAT assurance visit, designed to ensure that the correct amount of tax is being accounted for and paid.
Compliance yield Additional tax charged, resulting from compliance activity.
Confidence intervalA range of values that has a specified probability of containing the true value of interest.
Cross-border shopping Legal importation of goods for personal use.
Estimate Approximate result calculated from approximate or incomplete data.
Fraud Deliberate, dishonest evasion of tax.
Gross domestic product The market value of all final goods and services made within a country in a year.
Illicit market The part of the market on which due taxes and duties have not been paid.
Legitimate consumption Consumption of goods for which the correct duty has been paid.
Liechtenstein Disclosure FacilityThis allows people wilth unpaid tax linked to investments or assests in Liechtenstein to settle their tax liability under this special arrangement. It runs until 5 April 2016.
Litigation A lawsuit seeking a legal remedy to a question or dispute.
Lower estimate The value below which the true value will not lie.
Mid-point Average of the upper and lower estimates.
Non-paymentTax debts that are identified but never paid off. Eventually this debt will be written off by HMRC as uncollectable.
Non-UK duty paid Any product that has not had UK duty paid on it.
Official StatisticsAll statistics produced by the Office for National Statistics, government departments, the Devolved Administrations and other Crown bodies are automatically deemed to be Official Statistics.

HM Revenue & CustomsMeasuring tax gaps 201474
PAYE schemeEach employer operating PAYE registers a PAYE scheme with HMRC, which allows for the issue and monitoring of returns.
Risk registerA list of identified tax risks, together with information such as estimated value, nature and status. Registers are used to track and monitor the risks they cover.
Self AssessmentA system for reporting income and capital gains to, and claiming tax allowances from, HMRC.
SettlementClosure of a direct tax enquiry, resulting in the agreement of any additional tax liability.
Small and medium-sized enterprises/business
Any employer/business that does not fall within the EU Large definition.
SmugglingIn this document this covers all activity that results in goods entering the UK market without the correct duty being paid.
Stamp Duty Reserve TaxStamp Duty Reserve Tax is a tax on shares and securities when you buy through the stock market or a stock broker.
Tax under consideration
The value of an issue is the amount of tax under consideration. It is an estimate initially made before any consideration of the specific facts has taken place. It does not represent the tax owed or unpaid. The tax under consideration for a given risk is updated when the Department’s view on the possible outcome of the enquiry changes, for example, because new facts are established or legal advice is obtained.
Upper estimate The value above which the true value will not lie.
Write-offs Debts that are considered to be irrecoverable.

HM Revenue & CustomsMeasuring tax gaps 201475
Abbreviations
AP Accounting period
BEPS Base erosion and profit shifting
CGT Capital Gains Tax
CT Corporation Tax
EC Employer compliance
ESA10 European System of Accounts
EU European Union
GB Great Britain
GDP Gross domestic product
HMRC Her Majesty’s Revenue & Customs
ISA Individual Savings Account
IRS Internal Revenue Service (United States)
IT Income Tax
L&C Large and Complex
LBRT Large Business Risk Taskforce
LBS Large Business Service
LCF Living Costs and Food Survey
MTIC Missing trader intra-community fraud
NI Northern Ireland
NICs National Insurance Contributions
OECDOrganisation for Economic Cooperation and Development
ONS Office for National Statistics
PAYE Pay as you earn

HM Revenue & CustomsMeasuring tax gaps 201476
PRT Petroleum Revenue Tax
REP Random enquiry programme
RoI Republic of Ireland
SA Self Assessment
SDLT Stamp Duty Land Tax
SME Small and medium-sized enterprise/business
UK United Kingdom
VAT Value Added Tax
VTTL VAT total theoretical liability

HM Revenue & CustomsMeasuring tax gaps 201477
Index of tables and figures
Page Table 1.1: Tax gap estimates 7 Figure 1.1: Tax gap and percentage of liabilities 8 Table 1.2: Composition of the tax gap by type of tax 9 Table 1.3: Tax gap by type of tax 10 Figure 1.2: Tax gap by type of tax, 2012-13 11 Figure 1.3: Tax gap time series by type of tax 11 Figure 1.4: Tax gaps relative to tax due, 2012-13 (not drawn to scale) 12 Figure 1.5: Tax gap by customer group, 2012-13 12 Figure 1.6: Tax gap by behaviour, 2012-13 13 Table 1.4: Tax gap time series by behaviour, percentage of total theoretical liabilities 14 Table 1.5: Avoidance tax gap by type of tax (£ billion) 14 Table 1.6: Description of behaviours 15 Figure 1.7: Tax gap by quality of the methodology, 2012-13 17 Table 1.7: Revisions to estimates since 2013 edition of ‘Measuring tax gaps’ 18 Figure 1.8 Revisions to the tax gap as a percentage of liabilities compared to previous editions 19 Table 1.8: Description of revisions since last edition 20 Table 2.1: Estimated VAT gap (£ billion) 24 Figure 2.1: Time series of the VAT gap, including and excluding debt 25 Figure 2.2: Time series of VAT debt 25 Figure 2.3: VTTL components in 2012-13 26 Figure 2.4: Composition of VAT-able expenditure for the household sector in 2012-13 27 Table 3.1: Spirits: Illicit market share and tax gap 31 Table 3.2: Beer: Illicit market share and tax gap 33 Table 3.3: Wine: Illicit market share and tax gap 35 Table 4.1: Illicit market share and tax gap for cigarettes 37 Table 4.2: Illicit market share and tax gap for hand rolling tobacco 38 Table 5.1: GB diesel: Illicit market share and tax gap 40 Table 5.2: NI diesel: Illicit market share and tax gap 42 Figure 6.1: SA individuals and small partnerships, SA large partnerships, SME employers and large employers tax gaps as a proportion of liabilities 45 Table 6.1: SA tax gap (excluding large partnerships) (£ billion) 46 Table 6.2: SA tax gap by type of taxpayer (£ billion) 46 Table 6.3: Proportion of SA returns with under-declared tax liability 47 Table 6.4: Business taxpayers: Proportion of SA returns with under-declared tax liability 48 Table 6.5: Non-business taxpayers: Proportion of SA returns with under-declared tax liability 48 Table 6.6: Tax gap for large partnerships in SA (£ billion) 49 Table 6.7: Tax gap for small and medium-sized employers (£ billion) 50 Table 6.8: Proportion of small and medium-sized employers not meeting their PAYE scheme obligations 50 Table 6.9: Estimated tax gap for large employers (£ billion) 51 Table 6.10: Summary of methods by tax gap estimates 53 Figure 6.2: Revisions to SA individuals and small partnerships and SA large partnerships tax gaps since ‘Measuring tax gaps 2013 edition’ 54

HM Revenue & CustomsMeasuring tax gaps 201478
Figure 6.3: Revisions to SME employers and large employers tax gaps since ‘Measuring tax gaps 2013 edition’ 55 Figure 7.1: Corporation Tax gap as a proportion of liabilities by business type 59 Table 7.1: Estimated LBS CT gap (£ billion) 60 Figure 7.2: LBS CT gap; tax under consideration and yield for avoidance risks and technical risks subject to litigation 61 Table 7.2: CT risks for LBS groups 62 Figure 7.3: The process for estimating the LBS CT gap by category 63 Figure 7.4: Revisions to LBS CT gap since ‘Measuring tax gaps 2013 edition’ 64 Table 7.3: Estimated L&C CT gap (£ billion) 65 Table 7.4: Estimated SME CT gap (£ billion) 67 Table 7.5: Proportion of SMEs with incorrect CT returns where additional liability established 67 Figure 7.5: Revisions to SME CT gap since ‘Measuring tax gaps 2013 edition’ 69 Table 8.1: Other direct and indirect tax gaps (£ billion) 70

HM Revenue & CustomsMeasuring tax gaps 201479
We are looking to improve the quality, timeliness and the presentation of tax gap statistics, and would welcome your feedback. Please complete our short user survey or contact:
Kerry Booth
03000 589431
Heather Whicker
03000 589520
Feedback

Issued byHM Revenue & CustomsCorporate CommunicationsOctober 2014 © Crown Copyright 2014