measuring infant and young child complementary feeding practices: indicators, current practice and...
TRANSCRIPT
Click to edit Master title style
Shenggen Fan, April 2015
Measuring Infant and Young Child Complementary
Feeding Practices: Indicators, Current Practice and
Research Gaps
Marie Ruel
Director | Poverty, Health and Nutrition | IFPRI
87th Nestle Nutrition Institute Workshop | Singapore May 8-11, 2016

Click to edit Master title style
Shenggen Fan, April 2015
Key Milestones in Infant and Young Child
Feeding (IYCF) practices
Review of scientific
knowledge on CF (1998)
WHO Guiding Principles
for CF of:
• Breastfed (BF) child (2003)
• Non BF child (2005)
WHO Indicators for
measuring IYCF
practices (2008)

Click to edit Master title style
Shenggen Fan, April 2015
Taking Stock on Indicators of CF
practices
What is the status of CF
indicators?
How have they been
used so far and what
are some of the key
findings?
What are the strengths
and weaknesses of the
indicators?
Suggestions for way forward

Click to edit Master title style
Background on IYCF
and related indicators

Click to edit Master title style
Shenggen Fan, April 2015
10 Guiding Principles for Complementary
Feeding of the Breastfed Child
1. Duration of exclusive BF & age of introduction of CF
2. Continued BF
3. Responsive feeding
4. Safe preparation & storage of CF
5. Amount of CF needed
6. Food consistency
7. Meal frequency energy
density
8. Nutrient content of CF
9. Use of supplements or
fortified products
10. Feeding during & after
illness
WHO 2003
Click to edit Master title style
Shenggen Fan, April 2015
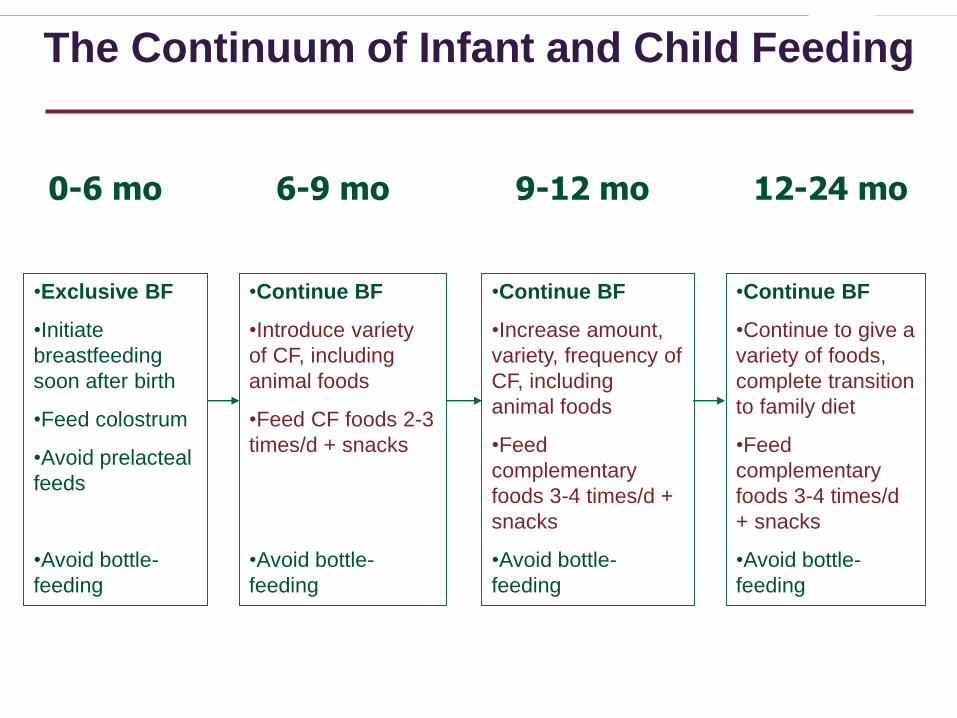
The Continuum of Infant and Child Feeding
0-6 mo 6-9 mo 9-12 mo 12-24 mo
•Exclusive BF
•Initiate
breastfeeding
soon after birth
•Feed colostrum
•Avoid prelacteal
feeds
•Avoid bottle-
feeding
•Continue BF
•Introduce variety
of CF, including
animal foods
•Feed CF foods 2-3
times/d + snacks
•Avoid bottle-
feeding
•Continue BF
•Increase amount,
variety, frequency of
CF, including
animal foods
•Feed
complementary
foods 3-4 times/d +
snacks
•Avoid bottle-
feeding
•Continue BF
•Continue to give a
variety of foods,
complete transition
to family diet
•Feed
complementary
foods 3-4 times/d
+ snacks
•Avoid bottle-
feeding
Click to edit Master title style
Shenggen Fan, April 2015
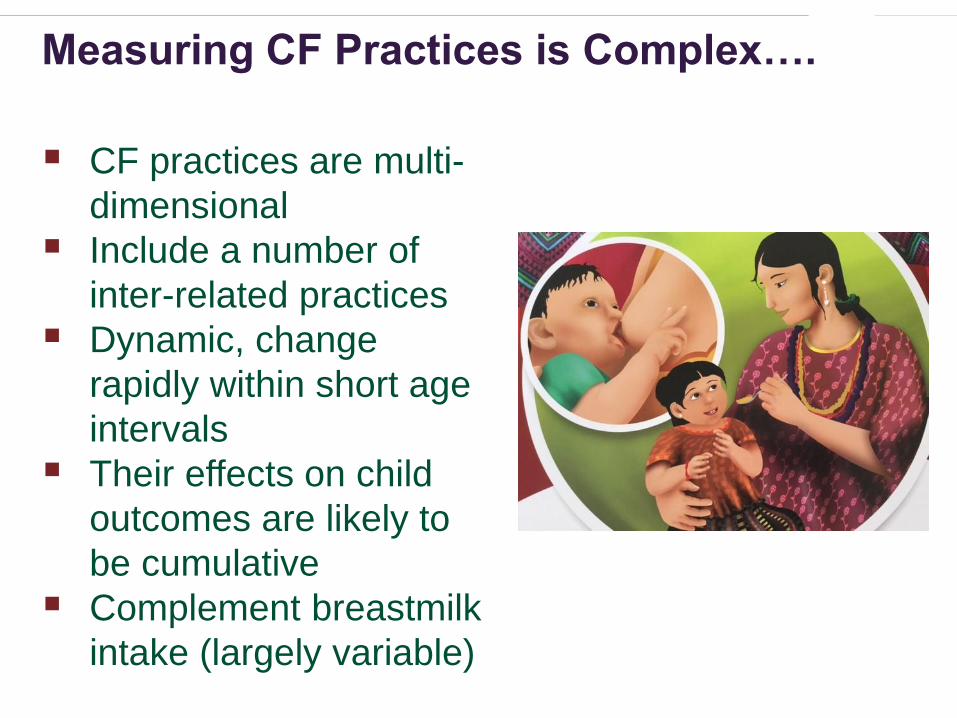
Measuring CF Practices is Complex….
CF practices are multi-
dimensional
Include a number of
inter-related practices
Dynamic, change
rapidly within short age
intervals
Their effects on child
outcomes are likely to
be cumulative
Complement breastmilk
intake (largely variable)
Click to edit Master title style
Shenggen Fan, April 2015
WHO IYCF Indicators for Breastfed
Child
8 core indicators:
• 3 BF practices
• 5 CF practices
7 optional indicators
(all focused on BF
practices)

Click to edit Master title style
Shenggen Fan, April 2015WHO 2008
5 WHO CF Indicators for Breastfed
Child
INDICATOR
Timing of introduction of
solid semi-solid and soft
foods
Minimum dietary diversity
(MDD)
Minimum meal frequency
(MMF)
Minimum acceptable diet
(MAD)
Consumption of iron-rich/
iron-fortified foods
MEASURES
Optimal timing of
introduction of CF
foods
Micronutrient
adequacy of diet
Energy adequacy of
diet
Composite indicator
(BF + MDD + MMF)
Adequacy of iron
intake
Click to edit Master title style
Shenggen Fan, April 2015
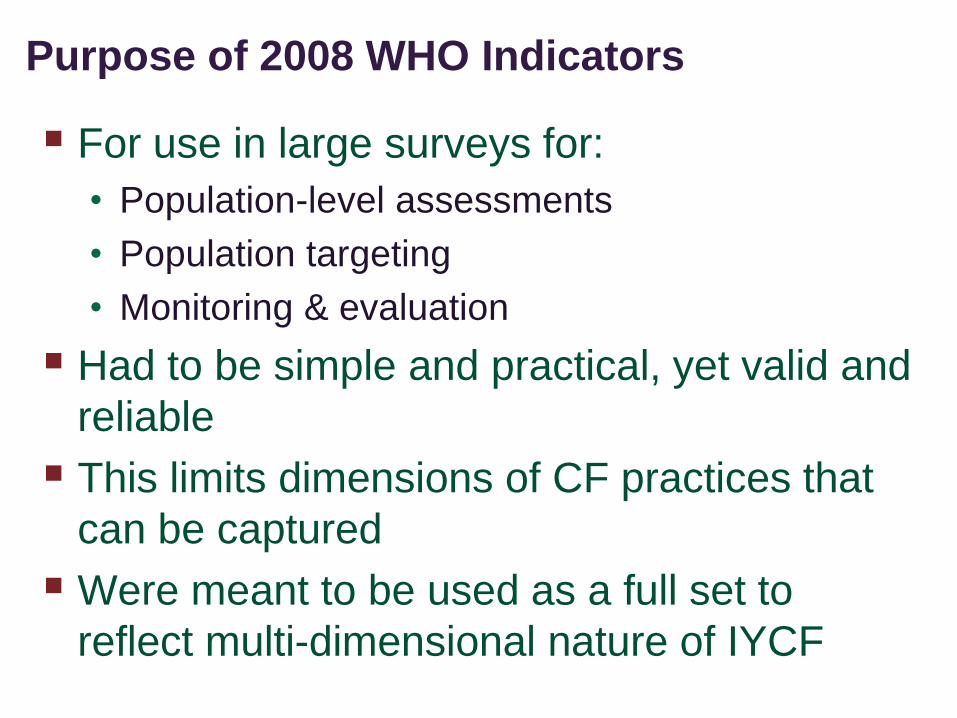
For use in large surveys for:
• Population-level assessments
• Population targeting
• Monitoring & evaluation
Had to be simple and practical, yet valid and
reliable
This limits dimensions of CF practices that
can be captured
Were meant to be used as a full set to
reflect multi-dimensional nature of IYCF
Purpose of 2008 WHO Indicators

Click to edit Master title style
Shenggen Fan, April 2015
BF
CF
0-5 mo 6-8 mo 9-23 mo
Continued Continued
Timely
introductionQuantity of CF:
- Meal frequency
Quality of CF:- Dietary diversity + iron foods
Hygiene/food safety
Responsive feeding
Feeding during illness
Texture/consistency
Exclusive
CF Indicators versus Guiding Principles
Click to edit Master title style
How have the WHO CF indicators
been used so far?

Click to edit Master title style
Shenggen Fan, April 2015
For Population-Level Assessments
and Country Comparisons
Reveals grossly inadequate
CF practices, esp. SS-Africa,
South Asia• < 30% MAD
• Few countries with > 30% MDD
• Poorer practices (younger, rural,
less educated mothers, poorer)
Pooled analysis (46DHS):• < 33% MDD
• ~50% meeting MMF
• 21% MAD
• Africa & Asia fare worst than LA
Indicators have helped unveil the severe problem of
poor IYCF practices globally
WHO 2010 Country Profiles

Click to edit Master title style
Shenggen Fan, April 2015
For Monitoring & Evaluation of
Programs
In the past, programs aimed
at improving IYCF assessed
impact on child anthropometry
• Likely due to lack of standard
IYCF indicators
Indicators helped measure &
document impacts on
practices (often more
achievable outcome)
• E.g. A&T, agriculture-
nutrition programs; social
protection programs0 20 40 60 80 100
Consumption of
iron-rich foods
Minimum
acceptable diet
Minimum meal
frequency
Minimum dietary
diversity
Timely
introduction of
solid, semi-…
%
A&T-I EndlineA&T-NI Endline
Availability of IYCF indicators has led to their
use for M&E and stimulated investments in
programs aimed at improving IYCF
Menon et al. in press

Click to edit Master title style
Shenggen Fan, April 2015
Extensive analysis of association between dietary diversity
and child antropometry• Robust results – strong DD, consistent associations with linear growh, controlling for
energy intake and SES
New studies looking at associations between broader set
of IYCF and child anthropometry• Pooled analysis (14 DHS) – associations between MDD, iron rich foods and
stunting; between MMF and underweight
• Country analyses (8 studies) confirmed association between DD and HAZ (3
countries); MAD and stunting in 4 countries.
New studies look at determinants of CF practices (e.g.
special issue of MCN on patterns and determinants of CF
practices in South Asia)
For Research on Determinants and
Consequences of Poor IYCF Practices
IYCF indicators have been used extensively to
address important gaps in knowledge and
understand patterns, determinants and
consequences of poor IYCF practices

Click to edit Master title style
What are the strengths and weaknesses of
the WHO CF Indicators?
Click to edit Master title style
Shenggen Fan, April 2015
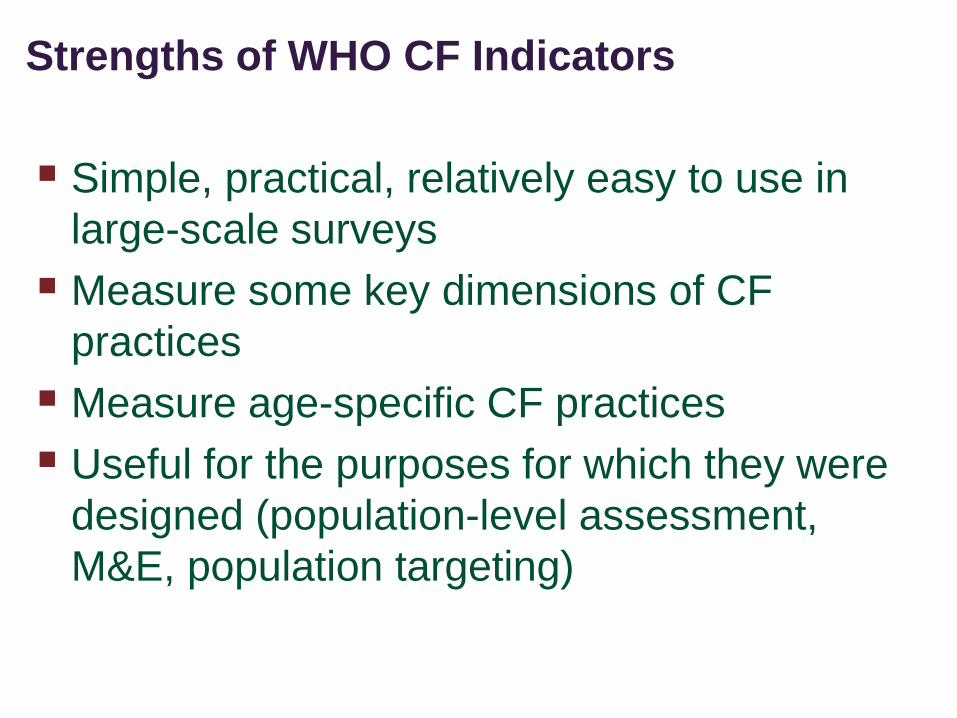
Simple, practical, relatively easy to use in
large-scale surveys
Measure some key dimensions of CF
practices
Measure age-specific CF practices
Useful for the purposes for which they were
designed (population-level assessment,
M&E, population targeting)
Strengths of WHO CF Indicators

Click to edit Master title style
Shenggen Fan, April 2015
Most have not been validated against gold standard
(except DD)
For some, unclear if they reflect underlying construct they
are meant to measure
• Esp. MMF, timing of introduction of CF, MAD, iron-rich
foods
Based on 24-h recall – subject to recall error and bias
Do not capture dynamic nature of CF or usual practice
Rely on unverified assumptions related to breast milk
intake and nutrient contribution
Include only a subset of dimensions of CF; do not include
indicators related to prevention of overweight/obesity
Some Weaknesses of WHO CF Indicators

Click to edit Master title style
The Way Forward

Click to edit Master title style
Shenggen Fan, April 2015
Need to revisit existing set of indicators and carry out
relevant validation studies
Verify underlying assumptions and adjust indicators:• Energy density (for MMF)
• Differentiation of snacks and meals (for MMF)
• Food consumed in small amounts (for MDD)
Assess magnitude of error/bias due to recall
Revisit missing indicators/dimensions of CF, including
overweight/obesity prevention
Develop simplified, technology-smart 24-h dietary
assessment method to quantify nutrient intake from
CF
Time to Revisit our Set of CF Indicators

Click to edit Master title style
Shenggen Fan, April 2015
Conclusions
WHO CF indicators have
been immensely useful – to
measure, document, raise
awareness, stimulate
investments and action
They have been used
extensively for all the
purposes for which they were
designed and more
Almost 10 years after
their release, it is time
to revisit them, improve
them, develop new
ones and promote their
appropriate use