measuring teacher motivation: a scale and findings from northern nigeria
TRANSCRIPT

A scale and findings from northern Nigeria
Measuring teacher motivation
Sept 2016

EDOREN 2
50% of grade-3 pupils could not name the first letter of their name
Only one in every ten grade-3 pupils demonstrated basic listening comprehension skills on a grade-1 level story
On average, a grade-3 pupil could name or sound out 6 letters in a minute
(Source: TDP 2014 baseline - Jigawa, Katsina, Zamfara)
Context: Low learning outcomes

EDOREN 37/12/2015

4Sept 2016
How teachers spend their time in a lesson

5
Motivation in a programme theory of change
Teacher Development Programme in Nigeria: aims to improve teaching through teacher training, materials, ongoing support, ‘trainer in the pocket’
– Theory of change: TDP materials and support can improve teacher motivation by raising teacher self-esteem
– Suggested mechanism:
Sept 2016 © 2016 Oxford Policy Management Ltd
Teachers acquire some
new skills
Visible progress in students’
learning outcomes
Improved self-
esteem
More motivate
d
Work harder
Attend regularly
Attend training
and keen to learn more
Boosts / sustains the effect of a short training intervention through a self-reinforcing cycle

6
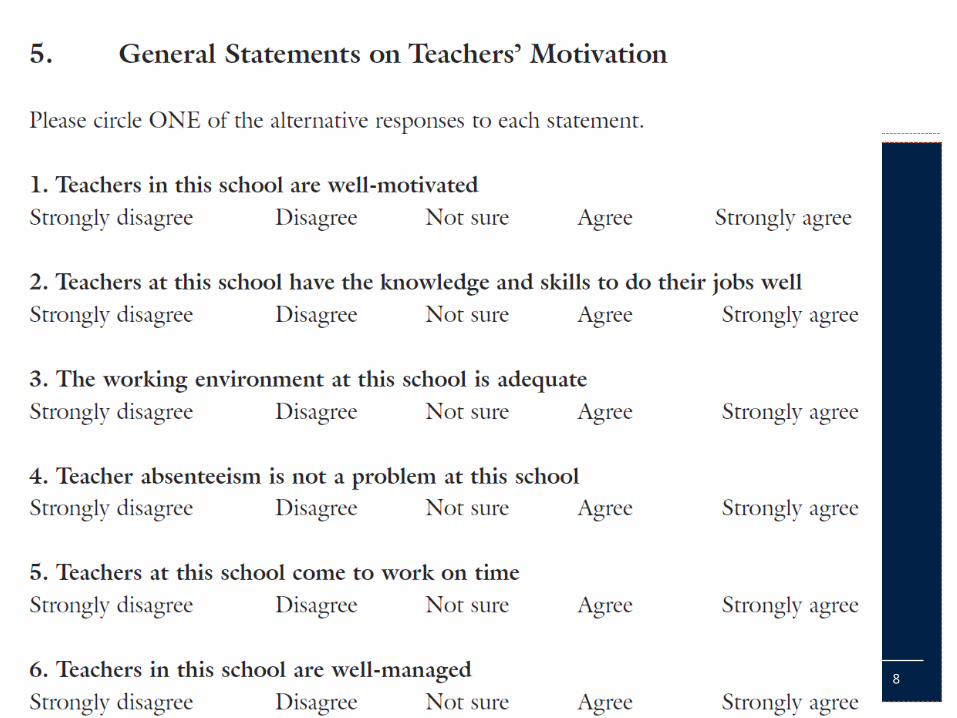
Measuring motivation
3 main issues with the existing scales: Some motivation questions not appropriate for northern Nigeria context Some clearly relate to factors likely to influence motivation rather than the condition of
being motivated Often focused narrowly on self-efficacy / locus of control ideas:
– belief that something is within my control goal setting, activity choice, willingness to expend effort, persistence
We define teacher motivation as the
propensity of teachers to start and maintain behaviours that are directed towards fulfilling their professional goals, and in particular towards achieving better learning outcomes for the school’s learners
We combine self-efficacy-related items with ideas from elsewhere: Bennell (2004) ‘will-do’ vs. ‘can-do’ / Bennell and Akyeampong (2007) scale specifically for
use in developing countries Intrinsic Motivation Inventory: e.g. interest, enjoyment, usefulness, pressureSept 2016 © 2016 Oxford Policy Management Ltd

7
Measuring motivation
Commonly scales mix up aspects from different theoretical frameworks Teacher Efficacy Scale
Sept 2016 © 2016 Oxford Policy Management Ltd
8
Measuring motivation
Sept 2016 © 2016 Oxford Policy Management Ltd

9
A model of motivation for programme evaluations
Sept 2016 © 2016 Oxford Policy Management Ltd
TDP intervention
better pedagogic / content knowledge / skills
better interaction between teachers
can do:external factors less
limiting
better learning outcomes for
students
will do: more motivated,
engaged
Self-efficacy(external + internal efficacy)
intrinsic motivationcommitment

10
Added complication: teachers can’t always read well
Sept 2016 © 2016 Oxford Policy Management Ltd

11
Scale revised for use in subsequent surveysMost recent version: ESSPIN (Education Sector
Support Programme in Nigeria) - Enugu, Jigawa, Kaduna, Kano, Kwara, Lagos
This paper uses data from ESSPIN Composite Survey 3 (2016): 735 schools, 3588 teachers
We focus on northern states (Jigawa, Kaduna, Kano)
Sept 2016
Data and background

EDOREN 127/12/2015

13Sept 2016 © 2016 Oxford Policy Management Ltd
ESSPIN motivation scales
Several revisions leading to 4 factors, with good reliability:– satisfaction: the value I place on my role as a teacher (‘interest and
enjoyment’)– skills: the perception I have of my competences and skills as a a teacher
(≈can do / self-efficacy)– engagement: how engaged and committed I feel I am to my work as a
teacher (≈will do / pressure/tension)– collegiality: how I see the extent of commitment and collaboration among
my colleagues (≈teacher-teacher interaction)Cross-correlations
ItemsEAP reliability
Satisfaction Skills
Engage-ment
Satisfaction 6 0.83 1
Skills 12 0.88 0.65 1
Engagement 4 0.66 0.25 0.24 1
Collegiality 6 0.8 0.46 0.59 0.06

14Sept 2016 © 2011 Oxford Policy Management Ltd

15
Using the scales: research questions
How does teacher motivation vary geographically (rural/urban, by state) and between male and female teachers?
Does training (in-service and pre-service) influence teachers’ self-efficacy, engagement and satisfaction?
Are ‘skills’ (can-do) important for engagement (will-do)? Do teachers whose content knowledge is stronger assess their own scores
more highly? Are more ‘engaged’ teachers more active in their lessons? Do students with more motivated teachers learn more?
Sept 2016 © 2011 Oxford Policy Management Ltd
16Sept 2016 © 2016 Oxford Policy Management Ltd
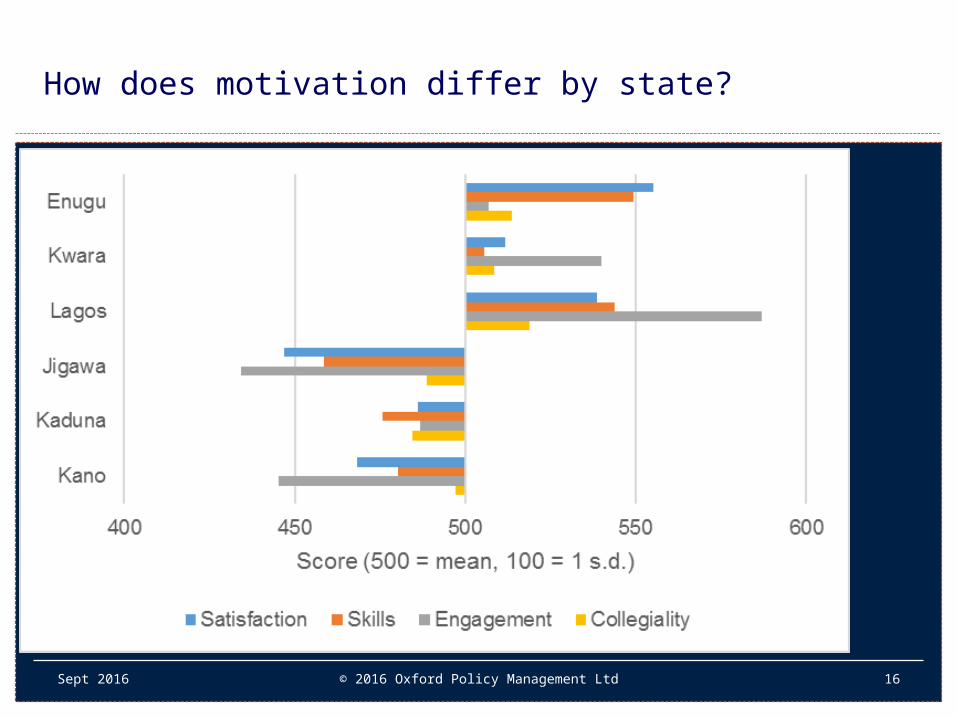
How does motivation differ by state?

17Sept 2016 © 2016 Oxford Policy Management Ltd
… and by training, qualification, and sex?

18Sept 2016 © 2016 Oxford Policy Management Ltd
Does teachers’ perceived ‘skills’ reflect their content knowledge?

19Sept 2016 © 2016 Oxford Policy Management Ltd
Satisfaction and engagement are also strongly correlated with test scores in English and maths

20
Explaining teachers’ motivation: regression analysis
(Sample: 1923 teachers. * p <.05)
Sept 2016 © 2011 Oxford Policy Management Ltd
Satisfaction Skills (I) Skills (II)
Engage-ment (I)
Engage-ment (II)
Kaduna 45.8* 18.0 10.6 52.3* 54.4*Kano 22.1* 19.5* 17.3 2.2 4.4
Rural -2.9 -7.2 -5.8 -19.0* -19.8*Female -11.1 -4.7 -4.1 9.9 9.4Training 0.7 -4.0 -4.3 9.5* 9.0*Qualified -9.6 4.8 3.5 4.6 5.2Years of experience -0.1 -0.3 -0.4 -0.1 -0.1English / maths test 0.1Skills -0.1*
R-squared 0.020 0.011 0.014 0.102 0.121

21
Using teacher motivation to explain outcomes
We attempt to fit models to explain the following outcomes:– Teacher-level
Proportion of time teachers spend on ‘positive interaction’ (e.g. explaining rather than chanting)
Proportion of time teachers spend doing something (e.g. not just leaving students to copy from the board)
– School-level Average proportion of teachers absent each day Proportion of classes with teachers in them at start of school day
and after the morning break Motivation does not seem to influence these outcomes after controlling for
other school characteristics (rural/urban location, state)
Sept 2016 © 2011 Oxford Policy Management Ltd

22Sept 2016 © 2016 Oxford Policy Management Ltd
Conclusions
Teacher motivation appears to be important, but measuring it is not easy Satisfaction and skills scales are worse in Jigawa than Kaduna and Kano Engagement is better in Kaduna than Jigawa or Kano Teachers in rural schools have particularly low engagement compared to
urban teachers Teachers who received in-service training are more engaged But overall, our models seeking either to explain teacher motivation or to
use teacher motivation to explain their behaviour, have limited predictive power
Unobserved factors may include:– Community support for teachers– Relationship with the head teacher– Salary and deployment policies
Teachers’ behaviour may be constrained by their knowledge / skills more than their attitudes
