measuring the performance of service delivery across ...€¦ · measuring public expenditure and...
TRANSCRIPT

Measuring Public Expenditure and Service Delivery Performance across Country: A Proposal for Micro-level Governance Indicators Using
PETS/QSDS
Bernard Gauthier HEC Montréal
May 1, 2008
Contents
1. Introduction 2. The Role and Importance of Micro-Level Governance Indicators 3. Main Purpose and Insights of PETS/QSDS 4. The Public Administration System and PETS/QSDS Data Collection Approach 5. Potential Service Delivery Performance and Governance Indicators 6. Conclusion This document was commissioned by the World Bank as part of the project “Harmonizing and improving the efficiency of PETS and QSDS”. Address for correspondence: Bernard Gauthier, Institute of Applied Economics, HEC Montréal, 3000 Chemin de la Côte-Sainte-Catherine, Montréal (Québec) Canada H3T 2A7 [email protected]
Pub
lic D
iscl
osur
e A
utho
rized
Pub
lic D
iscl
osur
e A
utho
rized
Pub
lic D
iscl
osur
e A
utho
rized
Pub
lic D
iscl
osur
e A
utho
rized
Pub
lic D
iscl
osur
e A
utho
rized
Pub
lic D
iscl
osur
e A
utho
rized
Pub
lic D
iscl
osur
e A
utho
rized
Pub
lic D
iscl
osur
e A
utho
rized
1. Introduction There is a widespread consensus among scholars and policy makers that good governance and strong institutions are fundamental to achieve development objectives (World Bank, 1997, 2004; Acemoglu, 2006; Kaufmann et al 2006). Good governance is seen as an essential factor for economic development and for the quality and success of foreign aid (Burnside and Dollar, 1998; Rodrik, 2002). While good governance has been recognized as fundamental for policy environment in the scientific literature in the last decade and emphasized in World Bank and other donors lending practices, we are still lagging behind with respect to micro-level indicators to measure governance quality in public administrative systems, in particular with respect to the effectiveness of public expenditures and public service delivery systems. During the last decades, various governance indicators have been devised to measure different characteristics of governance around the world and compare countries around these components. Among the well know sets of indicators are the International Country Risk Guide (ICRG), the Transparency International (TI) corruption index and the World Bank Governance Indicators. Also, the Public Expenditure and Financial Accountability (PEFA) framework provides high level indicators of public financial management at the country level and the Doing business indicators measure specific regulatory bottlenecks. These governance indicators however are mainly aggregate-level indicators. They are informative about broad concepts of governance and are useful to compare situations and understand various implications of governance at cross-country level. However, they do not allow to diagnose specific public expenditure and service delivery problems or to monitor specific expenditure programs. Furthermore, they do not allow an understanding the fundamental determinants of governance bottlenecks among regions or categories of clients/citizens. Micro level indicators are necessary for such purpose. The availability of micro-level indicators of performance and quality of service delivery and sectors would allow identifying the efficiency and equity of public administrative systems at allocating resources at reaching development objectives. Consistent and comparable micro-level indicators would allow to monitor and to benchmark public expenditure systems and sectors, to identify specific problems and to assess the impact of reform programs. It would also allow monitoring donors’ programs and identifying if it allows reaching development outcomes. In the framework of the MDGs and of the Africa Action Plan, where emphasis has been placed on social sectors and measuring progress, such public sector and service delivery indicators would be very useful to monitor the progress in various sectors and identify the specific constraints and bottlenecks faced in their achievements. For donors and countries, such indicators, in particular if they are actionable and contestable would allow determining if various interventions and public expenditure programs are useful (Kauffman and Kraay, 2007).
1
PETS and QSDS which are micro-level survey tools developed in the last decade to measure the efficiency and equity of public service delivery systems tools could allow providing very detailed country-level assessment of the situation in specific sectors or programs. These micro tools which measure various component of the institutional arrangements and incentives of actors within the systems, have proved very useful for identifying various shortcoming and bottlenecks in public expenditure and service delivery, in particular expenditures leakage in specific programs or sectors. They could allow shedding light and diagnosing the evolution of particular dimensions of governance and performance of sectors, such as health or education. A consistent and common methodology to collect information across countries could allow constructing consistent sector level indicators allowing for within in-depth country diagnostic and cross country comparisons and monitoring. They could help identify particular challenges in specific areas of public expenditure and could be complementary to other various tools and indicators, aggregate and disaggregate. In this regard, the success in the diffusion of Doing Business type indicators could be a good example to emulate for public sector indicators given the positive effect that country competition could bring. In this article, we propose a list of potential public sector and service delivery performance and governance indicators based on micro-level instruments, in particular PETS and QSDS. The approach of these micro level tools is to evaluate various components of public expenditure and service delivery systems, and to asses the performance and good governance of various components of public sector activities. Combined with some other indicators or other survey tools, for instance linkages with household surveys, they would allow devising a wide picture of supply and demand factors affecting governance levels and the equity and efficiency of service delivery and population outcomes. These public sector and service delivery indicators would complement other existing indicators, including PEFA. The article is structured as follows. Section 2 discusses of the role and importance of micro-level indicators and how they would complement current indicators. Section 3 briefly reviews some of the main insights that could be achieved using PETS and QSDS survey tools. Section 4 presents the context in which these indicators would take place and examine the main public administration levels where data needs to be collected as well as the main categories of data to construct public sector indicators. Section 5 then proposes a list of potential public sector and service delivery indicators. Section 6 concludes.
2
2. The Role and Importance of Micro-Level Governance Indicators Good governance and institutional quality is a wide concept and is composed of various elements. Governance, which refers to the (formal and informal) institutions or “institutional quality” of a country, is related to the environment of decision making at the political and economic level. Overall, most definitions of good governance emphasize three main characteristics (i) efficient and capable state, (ii) accountable to its citizens and which (iii) operates under the rule of law (Kaufmann and Kraay, 2007, p5). During the last decades, a variety of cross-country and within-country governance indicators have been devised including the International Country Risk Guide (ICRG), the Political Risk Services’ rule of law index, the Freedom House democracy index, and Transparency International (TI) corruption index. These indicators differ various ways. First in terms of dimensions of governance they measure, but also in terms of the type of data sources they use, in particular whose views are considered. Indeed, some indicators are based on the perception of various types of experts. The World Bank’s CPIA indicators for instance measure six specific dimensions of governance based on experts’ opinions. Some other indicators make use of surveys of large samples of individuals and firms collecting information on their views of the institutional environment and costs involved, or a mixture of both (e.g. TI). Also, some indicators collect objective (statutory) elements, that is the existence of specific laws (i.e. officially or de jure), while others make use of perception (subjective) data, that is to measure the de facto situation of governance on the ground as the result of these official rules (Kauffman and Kraay, 2008). Some other sets of indicators aggregate several measures of governance. It is the case of the World Bank’s Worldwide Governance Indicator (WGI) which aggregates most of the other specific indicators and constructs six indicators of governance (Kaufmann and Kraay, 2008).1 Furthermore, some indicators of governance are viewed as “actionable” (Reid, 2008), meaning “indicators that measure specific things under the control of policy makers” such as statutory rules governing business environment (Kauffman and Kraay, 2007, p6). For instance the PEFA indicators or the Doing Business indicators identify specific regulatory bottlenecks that policy makers could address. For the most part, these indicators are devised based on perception of broad country level situations to measure different characteristics of governance around the world and to compare countries around these components. They are informative about broad concepts of governance and are useful to compare situations and understand various implications of governance at cross-country level. However, they do not allow diagnosing specific problems within countries among sectors or monitor specific programs. Furthermore,
1 In 2006, the WGI aggregated 310 variables measuring different dimensions of governance taken from 33 different sources and covers 212 countries. It measures 6 dimensions of governance, namely: (i) Voice and Accountability, (ii) Political Stability and Absence of Violence, (iii) Government Effectiveness, (iv) Regulatory Quality, (v) Rule of Law (vi) Control of Corruption
3
they do not allow an understanding the fundamental determinants of governance at the country level and differences among regions, groups or households. Micro level indicators are necessary for such purpose. PETS and QSDS could allow providing very detailed country-level assessment of the situation in specific sectors or programs. These micro tools which measure various component of the institutional arrangements and incentives of actors within the systems, have proved very useful for identifying various shortcoming and bottlenecks in public expenditure and service delivery, in particular expenditures leakage in specific programs or sectors. These indicators of public sector management effectiveness could allow shedding light and diagnosing the evolution of particular dimensions of governance and performance of sectors, such as health or education. These indicators could allow the benchmarking of countries on a somewhat regular basis as they could be regularly updated to assess and reflect on changes and evolution in these countries and sectors (Kauffman and Kraay, 2007). Micro-level indicators based on PETS and QSDS could be seen as complementary to other financial management tools, in particular Public Expenditure Financial Assessment (PEFA) framework. Indeed, PEFA, which is a multi-donor program assessing the quality and efficiency of recipient country’s public finance and is composed of 31 “high level” indicators already incorporates one indicator (PI-23 “Availability of information on resources received by service delivery units”) which is essentially built on PETS contribution and activities in the country.2 However, only the existence of information on resource transfer is used in the evaluation, not the country’s use of this information or results in terms of performance or quality of service provision. PETS and QSDS could also be seen as complementary to national governments Information Management Systems (IMS). Several limitations are associated to IMS (Amin and Chaudhury, 2008). First, national government data usually do not capture information on the entire universe of service providers (e.g. schools, clinics) but generally only those that are administered by the state or who receive public funding, and hence not those administered by the private sector. Also, information contained in IMS could be of poor quality due to missing data for many public facilities. More importantly, problem of accuracy arise with internal IMS due to important incentive for misreporting by facilities. Indeed, reporting accurate information could expose inefficiencies in the system and in the performance of the individuals who are themselves responsible for providing the information. Furthermore, the reliability of national administrative records is often in doubt given that most MIS do not have dependable audit systems. Audits/External verifications in the public sector, (mainly carried out by the General Controller or General Auditor office), tend to be underdeveloped in developing countries. In fact, both internal information management systems and external verification systems tend to be inefficient and underdeveloped. As an ad-hoc tool, sample based surveys could complement internal reporting systems on a series of other dimensions and ownerships 2 The indicator PI-23 could take four values (A to D) depending on the availability of decentralized information about primary health and education sectors.
4

(i.e. non-public providers), in verifying the MIS self reporting data, in providing feedbacks, and at improving and strengthening the routine internal system over time. It should also provide information and feedback to strengthen country’s external verification system Furthermore, it could be worth exploiting the complementarities between in-depth sector level indicators and outcome indicators. Such an integrated approach for assessing in depth governance within a country, drawing on data collection among various units could provide a rich perspective for analysing sectors and programs, instead of relying on official data. With such information in hands, one can assess the particular challenges in a specific area (Kauffman and Kraay, 2007). Comparability over time and across-country The collection of consistent PETS and QSDS indicators over time and across countries would allow building consistent performance and governance indicators, allowing benchmarking and comparability. Such consistent public sector indicators based on PETS and QSDS could prove very useful for monitoring the evolution of public service quality and performance over time. PETS/QSDS indicators could be used to evaluate various elements of service delivery performance and especially assess trends over time in terms of service delivery performance and quality at the country level and well as to evaluate the impact of institutional reforms through repeated surveys (Reinikka and Svensson, 2004a).
Consistent and comparable indicators across countries have shown their usefulness in the last few years with the devising of the World Bank’s Doing Business indicators. These indicators which measure various components of the business environment, have allowed countries to assess constraints placed by state’s interventions and monitor their evolution over time and relative to other countries. An equivalent set of indicators assessing the efficiency of sector interventions and service delivery provision would allow countries to assess their activities and public expenditures, benchmark their services and monitor their evolution over time and across countries. This process would involve the construction of PETS/QSDS core modules as well as other more specific modules (e.g. absenteeism, ghost workers) allowing consistency and comparability of data. Cross-country comparability using PETS/QSDS data is somewhat more difficult. Indeed, cross-country comparability requires that a common methodology be consistently used to assess the situation in the various countries in order to insure that that the same things are measured. This common methodology requires in particular that results could be replicated, i.e. that the various components evaluated could be retraced and the various calculations verified. A more advanced process of methodological coherence and quality control would be needed to ensure such comparability and in order to engage in regional comparison for instance.
5
3. Main Purpose and Insights of PETS/QSDS PETS and QSDS have been used in the last decade to pursue various research and policy objectives. In this section, we review the main motivations of PETS and QSDS and the main insights these tools allow.3
3.1 PETS and QSDS Main Purposes PETS and QSDS are micro-level tools that have been developed to provide policy-makers with adequate information on decentralized levels and service providers, in order to evaluate the efficiency or equity of government expenditures. Both are sample-based micro level surveys that examine inefficiencies in social sector supply chain and service provision PETS examines efficiency and equity problems in the flow of resources to service delivery facilities (e.g. schools, clinics). PETS are based on the examination of administrative records of resource flows and use at different levels within the government system. This generally involves the examination from central ministry through the decentralised administrative levels down to front-line facilities. QSDS focuses on the performance of service provision at facility level. It examines inputs, outputs and incentives. QSDS involves the interview at the facility level of staff, an examination of the records of facility inputs (financial and in kind items) and outputs (various services rendered), other sources of revenues (user fees, donors), interview of clients of the facility (patients or students) These instruments are frequently combined to provide larger picture of service delivery and the efficiency and equity of government expenditures. Since the first PETS in 1996 and the first QSDS in 2000, both carried out in Uganda, there has been a constant evolution and innovations in these survey instruments by the World Bank and other users. Initially, the focus was on tracking resource flows but progressively other themes were added: exit polls, testing of students, measuring health center quality (e.g. vignettes), costing, etc. Various extensions of PETS and linkages with QSDS were developed seeking a better understanding of frontline service providers’ incentives, constraints and efficiency. They have been seen as being able to pursue three main purposes. First, they can be used as a diagnostic tool. For instance, by studying the flow of public funds through various levels of government, PETS allows policymakers to diagnose how incentives and accountability systems work in practice. They provide quantitative evidence on the importance of problems in budget execution and service delivery performance which can be used to study these issues. They can also be useful tools for benchmarking situations in a sector for the purpose of monitoring.
3 See Gauthier and Reinikka (2007) and Gauthier (2006) for a more detailed discussion of PETS/QSDS main purposes and insights.
6
Second, as an analytical tool, PETS can be designed to pinpoint the causes of the problems. Finally, expenditure tracking surveys can also provide micro-data for impact evaluations. They can be designed to examine the impact of a specific government program or reform on service delivery (Gauthier and Reinikka, 2007). 3.2 PETS and QSDS Main Insights PETS and QSDS have proved to be powerful instruments at identifying several bottlenecks, inefficiencies and wastages in service delivery. PETS PETS in particular are useful in diagnosing problems of budget execution, leakage of resources, delays, information, record keeping, ghost workers, absenteeism, equity, decentralization, user fees and efficiency. Budget execution: These tools could allow obtaining information on various problems in budget execution (capacity, reallocation, etc) at different stages, including budget allocation, releases, transfers, receipts, usage. The focus could be placed on various elements: flow of financial resources, various materials delivered in-kind through the supply chain to facilities, salaries and personnel. Weaknesses in organizational and institutional arrangements: Another fundamental problem that PETS and QSDS are able to highlight is weaknesses in administrative systems of recording, reporting and information systems at various levels in the administrative system toward service providers (for financial and non financial resources). In several tracking surveys, problems of information asymmetry through service providers’ supply chain, associated with budgeting, accounting, reporting systems, supervision and monitoring have been identified.4 Also, poor record keeping is often one of the major challenges in public financial management that PETS/QSDS have been able to pinpoint. Indeed, poor record management and weak internal control at the various levels of the administrative system is certainly one of the major findings of tracking surveys. Leakage of resources: These surveys measure resources reaching each level through the various layers of the government bureaucracy. Several tracking surveys have documented evidence of substantial public resource leakage. Indeed, resources reaching frontline facilities could be less than officially budgeted because of diversion for other use, misappropriation, etc. PETS could then help identify impediments to resource flows
4 In most developing country administrative systems examines in past tracking surveys, there is a crucial lack of information at various levels in the public organizational structure, in particular at the central level, regarding resource use and transfers through the supply chain. Furthermore, information problems are also often acute at lower levels of the hierarchy, as decentralized administrative units are generally not aware of the budgetary resources that they are entitled. In Tanzania, for instance, information asymmetry was associated with the use of a cash budgeting system at the central government level (REPOA/ESRF, 2001).
7
(financial, staff, equipment, material). For instance, in Tanzania and Ghana, leakage on non-wage education expenditures was respectively 57% and 49%, while only 1% of non-wage health expenditures to regional health administrations were estimated to arrive at the health facility level in Chad. Delays: PETS have also shed light on the question of delays and bottlenecks in the allocation of resources through public administrations (e.g. salaries, allowances, financing, material, equipment, drugs and vaccines). How long does it takes to for books or drugs to reach facilities; delays in salaries that affect incentives and absenteeism These issues could have important effects on the quality of services, staff morale and the capacity of providers to deliver services. Equity: Another insight brought about by tracking surveys is the question of equity in the allocation of resources and services, by location or between income groups. That is there could be variation among regions, districts and providers in terms of resources officially budgeted and delivered. In several countries, variability of health and school spending across geographical areas, regions and districts, as well as within districts, was observed.5 Decentralization: Tracking surveys could help assess the usefulness and efficiency of various decentralization mechanisms. Various past surveys have been used to examine the impact of decentralization on social sectors’ resource allocation. For instance, this consideration was incorporated in the sample selection process in the 1996 Uganda education PETS and was studied through the flow of capitation (per student) grants to schools. Similarly, the question of decentralization was incorporated in the sample design in the 2002 Zambia PETS/QSDS. Ghost workers A few studies also quantify the share of ghosts on the payroll, that is, teachers or health workers who continue to receive a salary but who no longer are in the government service, or who have been included in the payroll without ever being in the service.6 In Papua New Guinea for example, a 2003 PETS showed that 15% of teachers on the payroll were ghosts (World Bank, 2004a). In a PETS survey in Honduras, 5% of teachers on the payroll were found to be ghosts, while in health care, the percentage was 8.3 for general practitioners in 2000 (World Bank, 2001). QSDS QSDS which examine activities and services at the provider level, the incentives and behavior of various agents, are useful in providing insights on service delivery, incentives, bottlenecks, and experiences with service delivery.
5 The considerable difference in resource allocation noted in several countries raises serious issues of equity among socio-economic and demographic groups. In Mozambique, for instance, a nine-fold variation of per capita health spending was observed at the district level. In Chad, non-wage per capita public health spending showed important variations across districts (in a 16 to 1 ratio). 6 Most public administrations in Sub-Saharan Africa use a centralized staff payroll system. Generally, teachers and health workers are paid directly by the central ministry.
8
Service delivery activities and operations. Facility surveys allow to collect information on serviced delivery activities, in particular inputs (financial and non financial), outputs (quality and quantity), sources of financing. Incentives, behaviour of staff and supervision systems: These surveys allow to evaluate the various mechanisms, incentives, behavior and responsible for inefficiencies, resource leakage, etc. in the service delivery system. In particular unofficial payments, absenteeism, quality of services could be measured. Absenteeism Another important insight brought about by QSDS is the problem of absenteeism among front-line workers. Past survey results show absenteeism rates of between 27 and 40 percent for health care providers and between 11 and 27 percent for teachers (Chaudhury et al, 2006). One of the main conclusions of these studies is that because of poor accountability relationships and weak incentives, service provider absenteeism is prevalent in developing countries, which translates into low quality of services (Gauthier and Reinikka, 2007).7
Variation in service delivery across regions, districts, types of clients. In particular, difference in resources available across country. Also, difference of performance between NGO, public and private providers Client characteristics and experience with service delivery. In particular, use of services across income groups, cost incurred, satisfaction User fees Another insight of facility surveys relates the equity and efficiency effects of user fees on the demand and supply sides. Past surveys have shown that user fees often constitute a very important part of service costs for users and could have considerable negative effects on accessibility.8 Efficiency Finally, also noteworthy are various analyses of productivity performed using facility survey data. For instance, Lindelow et al (2004) have examined the question of productivity of health centers using PETS/QSDS data in Mozambique. They analyze seven categories of service output and devise a composite index of output to deal with the problem of multi-output production. They observe significant urban-rural and regional differences in service output per capita.9 7 Das et al (2005) in particular have explored the relationship between teacher absenteeism and students’ learning. 8 In the Chadian health sector, for instance, contrary to the conclusions of previous studies (World Bank, 2004), the tracking survey discovered that the most important source of health center financing is user fees. Indeed, government transfers in Chad account for only 2% of health center revenues (excluding salaries) and for one quarter of their revenues, including salaries (Gauthier and Wane, 2005). 9 Lindelow et al (2004) also note important variations in output per health worker across districts (in an 8 to 1 ratio).
9
4. The Public Administration System and PETS/QSDS Data Collection Approach Having examined the main purposes and potential insights of PETS/QSDS, we examine in this section the structure of the public administration resource flow system that tracking surveys seek to analyze (section 4.1) and the design and choice of instruments to collect consistent indicators of public sector performance and governance (Section 4.2) 4 . 1 P u b l i c A d m i n i s t r a t i v e S y s t e m s The challenge of collecting data in public administrative systems is important given the complexity of resources flows in social sectors. Indeed, the various resources required for public service delivery (financial resources, human resources and in-kind transfers) originate from several sources (central government ministries, decentralized administrative levels, bilateral and multilateral donors, NGOs), and take various routes in the organizational system. In addition, these flows are generally governed by different allocation rules, administrative processes, recording and accounting procedures, etc. An essential objective and initial challenge in any tracking surveys is thus to identify and analyze the nature and characteristics of these various administrative structures and flows, in order to grasp their role and contribution to service providers’ resources. Figure 2 represents a generic administrative structure and resource flow system in the social sector. A three-tier hierarchy is represented (central, provincial/regional and district/local government) through which resources flow to local service providers.
In countries such as Nigeria or Uganda, the administrative structure governing social service providers’ resources flows comprises only two layers (e.g. central and district/local government).
In most cases, central government ministries allocate resources (human, financial and/or in-kind) to the various layers of the administrative structure. These resources pass through various channels. Financial and in-kind resources might be the responsibility of a line ministry while human resources could be the responsibility of a civil servant ministry.
Other important actors to consider in the service provider supply chain are donors. In most developing countries, international and national donors are pivotal to social sectors’ allocation process. Some donors provide program or sector financial support to the central government, which is then responsible for administering and allocating resources to the various sectors. Donors also provide financial or in-kind support to provincial or district administrations, and sometimes even directly to service providers (e.g. school items, health care materials, drugs or equipment). Donors are also involved in capital investments such as construction of schools, clinics and hospitals.
10
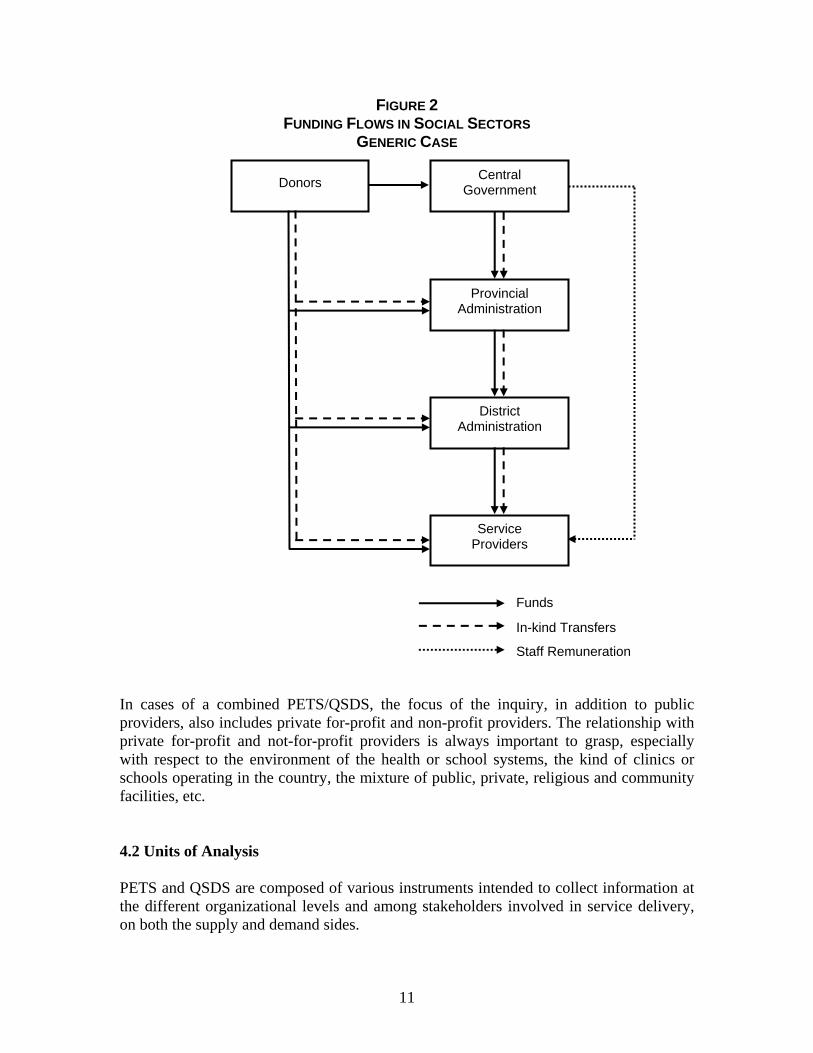
FIGURE 2 FUNDING FLOWS IN SOCIAL SECTORS
GENERIC CASE
Central Government
Provincial Administration
District Administration
Donors
Service Providers
Funds
In-kind Transfers
Staff Remuneration
In cases of a combined PETS/QSDS, the focus of the inquiry, in addition to public providers, also includes private for-profit and non-profit providers. The relationship with private for-profit and not-for-profit providers is always important to grasp, especially with respect to the environment of the health or school systems, the kind of clinics or schools operating in the country, the mixture of public, private, religious and community facilities, etc. 4.2 Units of Analysis PETS and QSDS are composed of various instruments intended to collect information at the different organizational levels and among stakeholders involved in service delivery, on both the supply and demand sides.
11
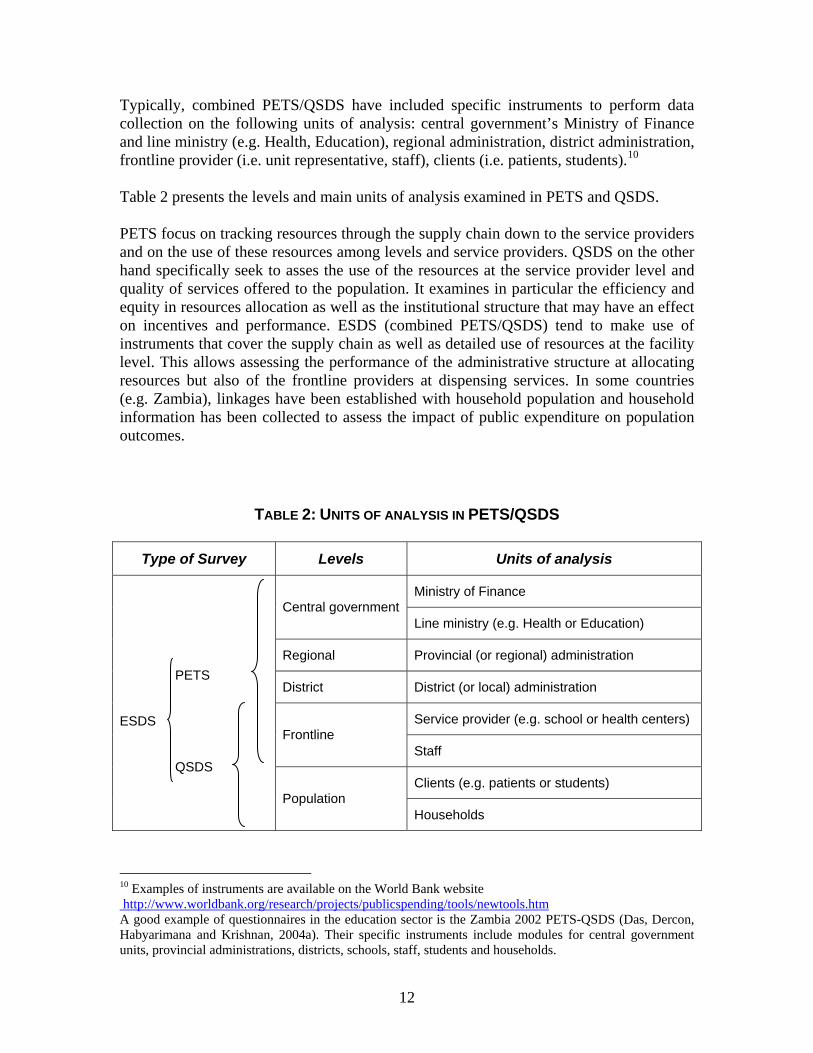
Typically, combined PETS/QSDS have included specific instruments to perform data collection on the following units of analysis: central government’s Ministry of Finance and line ministry (e.g. Health, Education), regional administration, district administration, frontline provider (i.e. unit representative, staff), clients (i.e. patients, students).10 Table 2 presents the levels and main units of analysis examined in PETS and QSDS. PETS focus on tracking resources through the supply chain down to the service providers and on the use of these resources among levels and service providers. QSDS on the other hand specifically seek to asses the use of the resources at the service provider level and quality of services offered to the population. It examines in particular the efficiency and equity in resources allocation as well as the institutional structure that may have an effect on incentives and performance. ESDS (combined PETS/QSDS) tend to make use of instruments that cover the supply chain as well as detailed use of resources at the facility level. This allows assessing the performance of the administrative structure at allocating resources but also of the frontline providers at dispensing services. In some countries (e.g. Zambia), linkages have been established with household population and household information has been collected to assess the impact of public expenditure on population outcomes.
TABLE 2: UNITS OF ANALYSIS IN PETS/QSDS
Type of Survey Levels Units of analysis
Ministry of Finance Central government
Line ministry (e.g. Health or Education)
Regional Provincial (or regional) administration
District District (or local) administration
Service provider (e.g. school or health centers) Frontline
Staff
Clients (e.g. patients or students)
PETS ESDS QSDS
Population Households
10 Examples of instruments are available on the World Bank website http://www.worldbank.org/research/projects/publicspending/tools/newtools.htmA good example of questionnaires in the education sector is the Zambia 2002 PETS-QSDS (Das, Dercon, Habyarimana and Krishnan, 2004a). Their specific instruments include modules for central government units, provincial administrations, districts, schools, staff, students and households.
12
4 . 3 D a t a C a t e g o r i e s PETS/QSDS tend to combine a series of data collection techniques. These include quantitative data taken from central government budget and records, as well as from decentralized administrative and facility records, and qualitative data from interviews with official, staff and clients. These quantitative and qualitative data at the various administrative levels through the supply chain cover a large spectrum of issues of resource transfer, performance, quality, etc. A specificity of PETS/QSDS is their focus on the service provision’s institutional environment and in particular the incentives of the various actors. It seeks to capture these features by collecting information on the production process, accountability mechanisms, financial flows and reward structures. Past surveys have differed in terms of data collected and unit of analysis surveyed. Implicit in these choices are the factors or relationships that are perceived as important in determining performance of the system examined and specific constraints facing teams. Indeed, service delivery performance and population outcomes reflect the complexity of the social sector process is seeks to understand. Various data classifications could be proposed for tracking and facility surveys.11 Table 3 classifies data collected in PETS and QSDS in seven categories i) environment and characteristics, ii) financing, iii) inputs, iv) Institutional arrangements and production process, v) intermediate outputs, vi) final outputs, vii) outcomes. The rationale for collecting these various categories of data is as follows. i) Environment and characteristics: Collecting data on the characteristics of the various agents (i.e. administrative units and service providers) within the supply chain and the environment in which they evolve is important in order to identify important particularities of the sector studied. Such data include information on the location, ownership structure, size, etc. Data on the service provision environment allow to asses the competitive environment. These data could include information on the number and distance of other service providers, the distance from market or from the capital which could have an effect on resource reception and information. ii) Financing: Financial data are important especially for PETS in order to track resources from the central government unit through the supply chain down to the service provider. These quantitative data are taken from the central government budget and records, as well as from decentralized administrative and facility records. Financial data are also important in QSDS to assess the efficiency in the usage of the resources available to service providers and equity in the allocation of these resources. 11 Amin and Chaudhury (2007) for instance classify data collected in micro-level surveys in six categories, grouping together process and intermediate output data.
13

TABLE 3: DATA CATEGORIES IN PETS/QSDS
Data categories Description Examples of variables Environment and characteristics
Environment and characteristics of the various units and agents in the supply chain, including frontline providers.
Size of facilities, ownership structure, types, location, competition
Financing Financing at the different levels and from the various sources
Amounts of financing, types, sources, reliability
Inputs Inputs (transfers, uses and reception) at the different levels. Inputs could include less tangible elements such as staff quality or realized inputs such as the number of facilities.
Material inputs such as staff and salaries, textbooks, equipments, medication.
Institutional arrangements and production process
Production process at different units through the supply chain, i.e. management structure, oversight, incentive structure
Management practices, supervision, reporting, audits, record keeping procedures).
Intermediate outputs Intermediate outputs of the production process
Level of absenteeism, penalty and rewards
Final outputs Final outputs of the production process
Number of patients treated, enrollment, graduation rates, class repetition rates
Outcomes Outcomes and quality. Overall measures of final outcomes within the sector
Mortality rates, student performance, patient or student satisfaction
Source: Amin and Chaudhury (2007), Gauthier (2006) iii) Inputs: Measurement of inputs is essential for assessing resources use, transfers and availability at the various levels. Among the main inputs that need to be collected is information on material inputs such as staff and salaries, medication, vaccines, text books, blackboard, equipments, etc. iv) Institutional arrangements and production process: One of the distinctive particularities of PETS and QSDS, as mentioned, is their emphasis on institutional and production process data. These institutional arrangements and mechanisms determine the incentive structure of the personnel. This information allows understanding how resources are combined, utilized and transformed at every level of the supply chain and how services to the population are produced. These data include for instance information on management practices, supervisory and reporting activities, rewards and penalties, etc. Various proxy of accountability are also targeted, including information on supervision, reporting, auditing, performance assessment, rewards systems, etc v) Intermediate outputs: Intermediate outputs are outputs of the production process that are not directly those associated to the services rendered but which affect quality and
14
performance (OECD, 2000). For instance, staff absenteeism is related to the production process but does not measure a final objective of the production process. Among the key information that need to be collected are measures of access to services such as the variety of services offered, as well as opening and closing time of facilities. It could include the physical distance of the targeted population (e.g. walking distance to the health clinic or school). Some measures of quality of services could also be proxy by physical and human capital, consultation duration, availability of material, etc. Also, measures of affordability of services are important elements to capture. These could for instance include direct costs (such as user fees, transport costs, informal payments, bribes, etc) and indirect costs (opportunity costs, such as waiting time, etc.) (Amin and Chaudhury, 2007). vi) Final outputs: Information on final outputs is related with what is directly valued by clients of the service provision (e.g. patients, student). These could be for instance graduation rates or the number of patients treated. vii) Final outcomes: Outcomes are the result of the interplay between government policies, public interventions, frontline service providers, individuals (e.g. patients and students) and communities. Final outcome indicators are overall measures of performance within the sector. These could be based on objective measures of outcomes such as mortality rates or student achievement, but could also be perception measure such as clients’ satisfaction. While as in any surveys, an objective of parsimony in data collected needs to be respected in order to minimize non-sampling errors, collecting information on these core areas could provide a certain degree of standardization in tracking surveys and allow benchmarking and cross-country comparability over time (Amin and Chaudhury, 2007). 5. Potential Service Delivery Performance and Governance Indicators Having examined PETS and QSDS main objectives, instruments and data, we now turn to the identification of potential service delivery performance and governance indicators. Section 5.1 discusses the various uses of indicators. Section 5.2 examines categories of indicators. Section 5.3 presents potential indicators and discusses their motivations. 5 . 1 U s e o f i n d i c a t o r s Indicators are synthetic measures representing important components of the service delivery system and social sector under study. Indicators play an important role in monitoring and performance measurement. They allow tracking results and progress which potentially would allow to hold some accountable for results. (World Bank, 2002) In order to measure changes, an indicator specifies what is to be measured along a scale, but in itself it does not indicate the desired direction of change (Binnendijk, 2000). A
15
16
choice and definition of indicators have hence to be associated with baseline values and potential objectives of expected results over time.12 One can distinguish between input and output indicators as well as between process and performance indicators. Process indicators help assessing whether “human and procedural interaction…lead to a defined direction” while performance indicators help to assess whether the level of attainment of certain goals have improved as compared to their initial point. Performance indicators measure “deliverables or substantive outcomes” (Morgan and Qualman, 1996, p.42). One can also distinguish between qualitative and quantitative indicators, the former being a subjective description or categories of satisfaction or appreciation of a subject. Quantitative indicators provide “objectively and independently verifiable number or ratios” (Binnendijk, 2000, p.28). The collection of a set of standardized indicators of service delivery would allow comparability over time and countries. It should be noted that the construction of such indicators would fill a void. Current indicator of the public sector and service delivery tend to be based on official data based on internal information systems and statistics which, as discussed in section 2.4, could present shortcomings. For instance, the OECD gathers information on governments’ annual budget to education in the “Education at a Glance” series. These provide a rough indicator of the relative importance of education in the government agenda. However, they do not provide any indication on how much of the allocated funds reach destination/service providers as government commitment to education is assessed on the basis of the budgetary allocation. On the contrary, PETS/QSDS indicators examine the disbursed resources reaching providers, thus providing a more realistic view on the potential improving the quantity and quality of education. 5 . 2 P o t e n t i a l P E T S a n d Q S D S I n d i c a t o r s Various metrics have been used in past tracking surveys to measure the performance, effectiveness, quality and equity of the service provision system. Some reports have also suggested various indicators to provide insights in resource allocation, management of service provision and leakage for comparability purposes (e.g. Oxford Policy Management, 2005). Table 4 presents a list of 20 potential PETS indicators with their purpose, definition, and administrative level examined. A list of 30 potential QSDS indicators is presented in Table 5. The choice of these indicators respond to the need to measure key elements of the service delivery system along the various objectives identified for PETS and QSDS studies, units of analysis and categories of data (see Section 3).
12 For evaluation purposes, which is concerned about better understanding of why and how a program or strategy works, baseline studies need to be carried out before the implementation or during the initial phase of a reform or project. Identifying adequate indicators for observing effects and monitoring results is crucial.
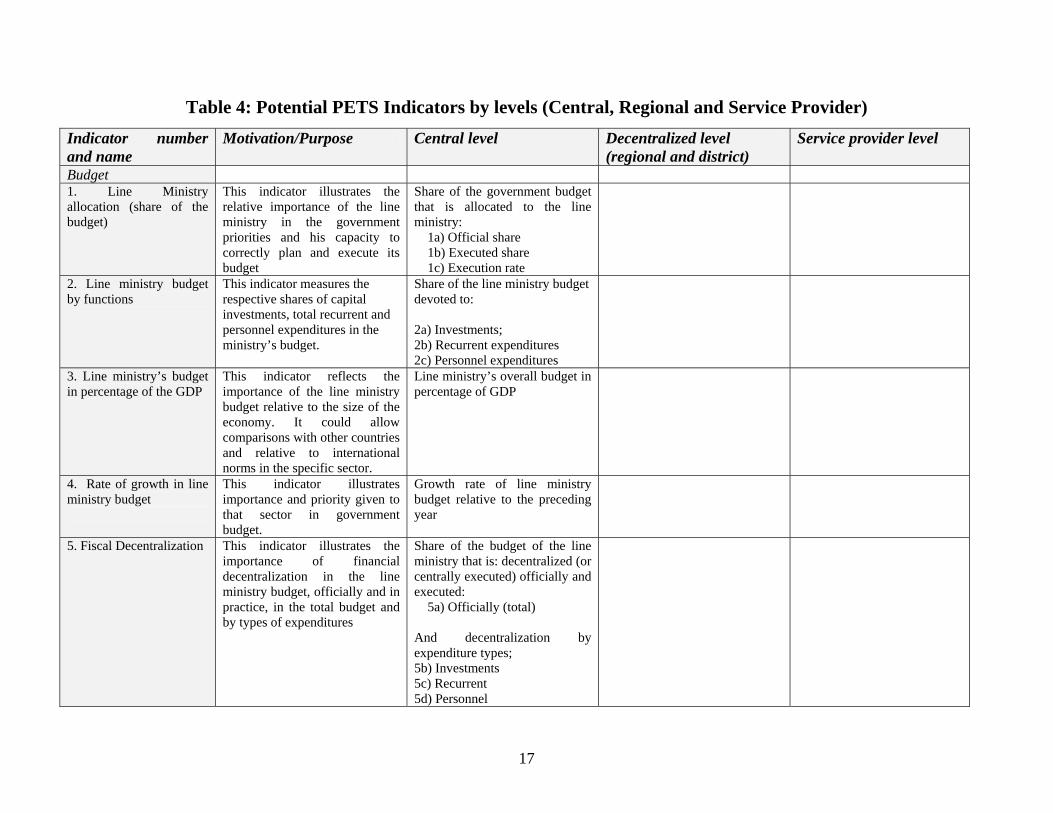
Table 4: Potential PETS Indicators by levels (Central, Regional and Service Provider) Indicator number and name
Motivation/Purpose Central level Decentralized level (regional and district)
Service provider level
Budget 1. Line Ministry allocation (share of the budget)
This indicator illustrates the relative importance of the line ministry in the government priorities and his capacity to correctly plan and execute its budget
Share of the government budget that is allocated to the line ministry: 1a) Official share 1b) Executed share 1c) Execution rate
2. Line ministry budget by functions
This indicator measures the respective shares of capital investments, total recurrent and personnel expenditures in the ministry’s budget.
Share of the line ministry budget devoted to: 2a) Investments; 2b) Recurrent expenditures 2c) Personnel expenditures
3. Line ministry’s budget in percentage of the GDP
This indicator reflects the importance of the line ministry budget relative to the size of the economy. It could allow comparisons with other countries and relative to international norms in the specific sector.
Line ministry’s overall budget in percentage of GDP
4. Rate of growth in line ministry budget
This indicator illustrates importance and priority given to that sector in government budget.
Growth rate of line ministry budget relative to the preceding year
5. Fiscal Decentralization This indicator illustrates the importance of financial decentralization in the line ministry budget, officially and in practice, in the total budget and by types of expenditures
Share of the budget of the line ministry that is: decentralized (or centrally executed) officially and executed: 5a) Officially (total) And decentralization by expenditure types; 5b) Investments 5c) Recurrent 5d) Personnel
17
5e)-f) Idem Executed
6. Discretionary Budget This indicator illustrates the importance of discretion in budgetary allocation at the various levels
6a) % of line ministry budget not governed by fixed allocation rules
6b) % of regional level budget not governed by fixed allocation rules
6c) % of service provider budget not governed by fixed allocation rules
7. Budget Usage This indicator measures the internal usage of the budget at the various levels and importance of resource transfers to lower administrative levels in the service delivery system
Share of the line ministry recurrent budget that is: 7a) Used 7b) Transferred
Share of the line ministry recurrent budget that is: 7c) Received 7d) Used 7e) Transferred
Share of the line ministry recurrent budget that is: 7f) Received at the provider level
8. Share of resources reaching decentralized levels
This indicator illustrates from every dollar allocated in the budget for a specific line ministry, how much arrives at the local level and how much is used for other administrative purposes by each level, i.e. the share of the budget used at the central, provincial, district and provider levels. Note that this indicator does not try to determine if there is leakage or not, as these figures are somewhat objective portrait of the usage of resources in a specific administrative system compared to another.
8a) Share of resources in the sector at the regional and district level (Total value of resources received divided by the total budget of the Ministry). Idem by categories: 8b) recurrent expenditures 8c) non-wage recurrent expenditures).
8d) Share of resources in the sector reaching the provider level: (Total value of resources received divided by the total budget of the Ministry). Idem by categories: 8e) recurrent expenditures 8f) non-wage recurrent expenditures).
9. Resources per capita This indicator gives an indication of the level of real public intervention in the sector. Real expenditure data as well as population in each delegations and district are required
Line Ministry budget per capita (executed) 9a) Total 9b) Recurrent 9c) Non-wage recurrent (and by regions: urban and rural)
Average per capita allocation received in regional delegations (and districts) 9d) Recurrent 9e) Non-wage recurrent
Average per capita allocation received at the service provider level 9f) Recurrent 9g) Non-wage recurrent
10. Leakage This indicator assess the level of leakage at the various levels:
.
10a) Central-Regional leakage: Average leakage at the regional,
Average leakage at the provider levels.
18
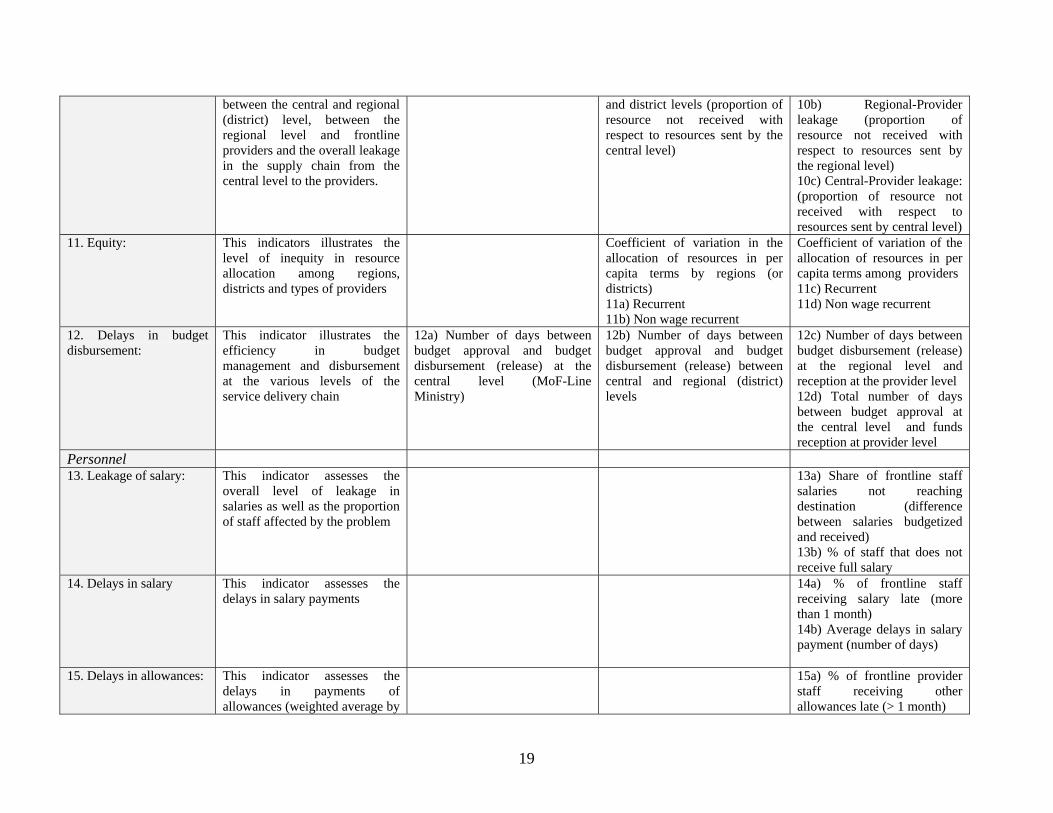
between the central and regional (district) level, between the regional level and frontline providers and the overall leakage in the supply chain from the central level to the providers.
and district levels (proportion of resource not received with respect to resources sent by the central level)
10b) Regional-Provider leakage (proportion of resource not received with respect to resources sent by the regional level) 10c) Central-Provider leakage: (proportion of resource not received with respect to resources sent by central level)
11. Equity: This indicators illustrates the level of inequity in resource allocation among regions, districts and types of providers
Coefficient of variation in the allocation of resources in per capita terms by regions (or districts) 11a) Recurrent 11b) Non wage recurrent
Coefficient of variation of the allocation of resources in per capita terms among providers 11c) Recurrent 11d) Non wage recurrent
12. Delays in budget disbursement:
This indicator illustrates the efficiency in budget management and disbursement at the various levels of the service delivery chain
12a) Number of days between budget approval and budget disbursement (release) at the central level (MoF-Line Ministry)
12b) Number of days between budget approval and budget disbursement (release) between central and regional (district) levels
12c) Number of days between budget disbursement (release) at the regional level and reception at the provider level 12d) Total number of days between budget approval at the central level and funds reception at provider level
Personnel 13. Leakage of salary: This indicator assesses the
overall level of leakage in salaries as well as the proportion of staff affected by the problem
13a) Share of frontline staff salaries not reaching destination (difference between salaries budgetized and received) 13b) % of staff that does not receive full salary
14. Delays in salary This indicator assesses the delays in salary payments
14a) % of frontline staff receiving salary late (more than 1 month) 14b) Average delays in salary payment (number of days)
15. Delays in allowances: This indicator assesses the delays in payments of allowances (weighted average by
15a) % of frontline provider staff receiving other allowances late (> 1 month)
19
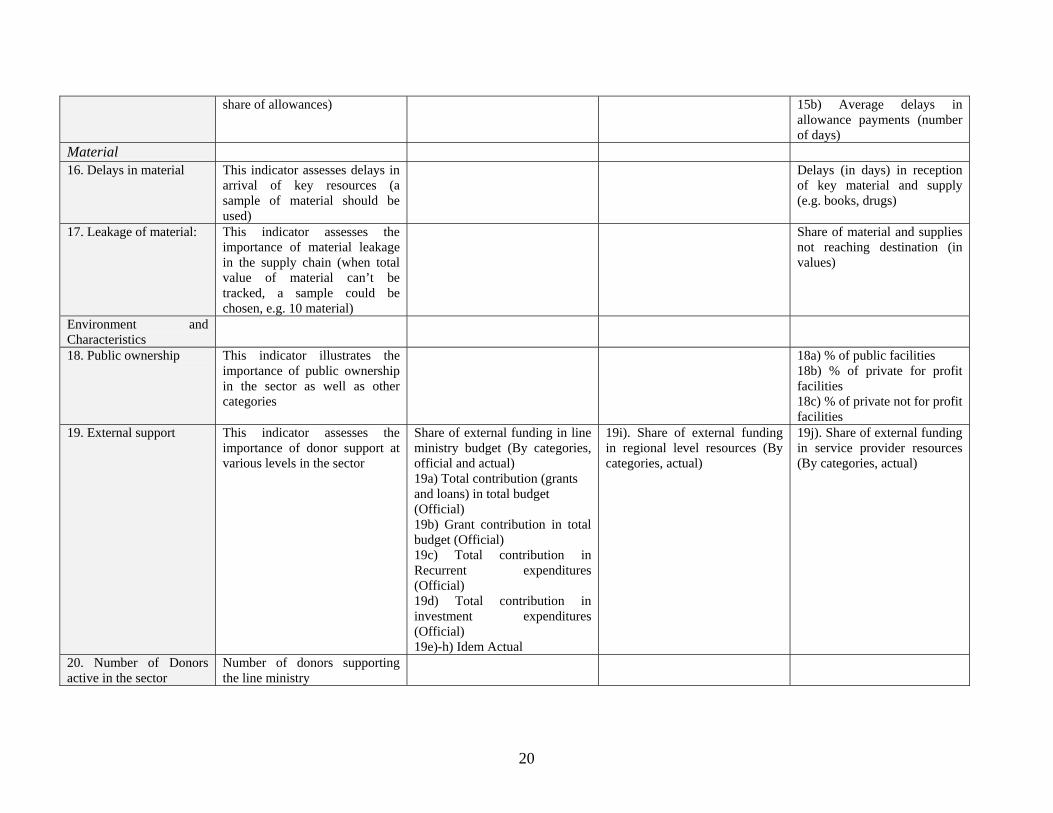
20
share of allowances) 15b) Average delays in allowance payments (number of days)
Material 16. Delays in material This indicator assesses delays in
arrival of key resources (a sample of material should be used)
Delays (in days) in reception of key material and supply (e.g. books, drugs)
17. Leakage of material: This indicator assesses the importance of material leakage in the supply chain (when total value of material can’t be tracked, a sample could be chosen, e.g. 10 material)
Share of material and supplies not reaching destination (in values)
Environment and Characteristics
18. Public ownership This indicator illustrates the importance of public ownership in the sector as well as other categories
18a) % of public facilities 18b) % of private for profit facilities 18c) % of private not for profit facilities
19. External support This indicator assesses the importance of donor support at various levels in the sector
Share of external funding in line ministry budget (By categories, official and actual) 19a) Total contribution (grants and loans) in total budget (Official) 19b) Grant contribution in total budget (Official) 19c) Total contribution in Recurrent expenditures (Official) 19d) Total contribution in investment expenditures (Official) 19e)-h) Idem Actual
19i). Share of external funding in regional level resources (By categories, actual)
19j). Share of external funding in service provider resources (By categories, actual)
20. Number of Donors active in the sector
Number of donors supporting the line ministry
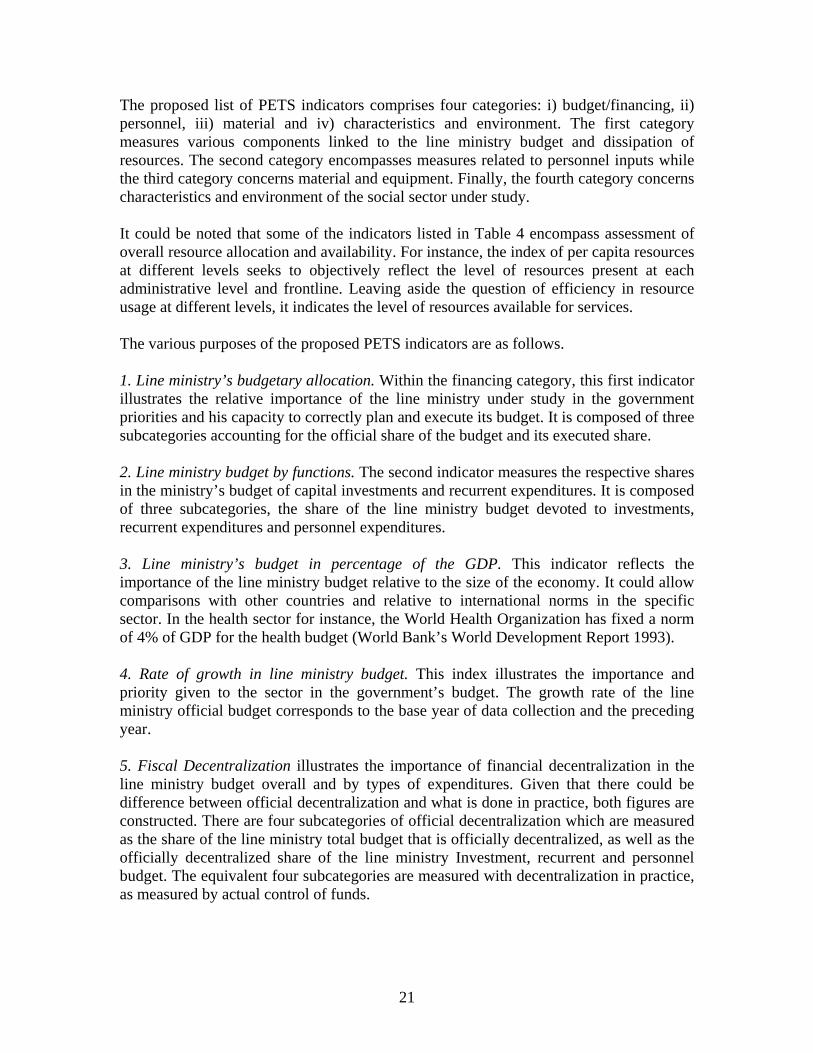
The proposed list of PETS indicators comprises four categories: i) budget/financing, ii) personnel, iii) material and iv) characteristics and environment. The first category measures various components linked to the line ministry budget and dissipation of resources. The second category encompasses measures related to personnel inputs while the third category concerns material and equipment. Finally, the fourth category concerns characteristics and environment of the social sector under study. It could be noted that some of the indicators listed in Table 4 encompass assessment of overall resource allocation and availability. For instance, the index of per capita resources at different levels seeks to objectively reflect the level of resources present at each administrative level and frontline. Leaving aside the question of efficiency in resource usage at different levels, it indicates the level of resources available for services. The various purposes of the proposed PETS indicators are as follows. 1. Line ministry’s budgetary allocation. Within the financing category, this first indicator illustrates the relative importance of the line ministry under study in the government priorities and his capacity to correctly plan and execute its budget. It is composed of three subcategories accounting for the official share of the budget and its executed share. 2. Line ministry budget by functions. The second indicator measures the respective shares in the ministry’s budget of capital investments and recurrent expenditures. It is composed of three subcategories, the share of the line ministry budget devoted to investments, recurrent expenditures and personnel expenditures. 3. Line ministry’s budget in percentage of the GDP. This indicator reflects the importance of the line ministry budget relative to the size of the economy. It could allow comparisons with other countries and relative to international norms in the specific sector. In the health sector for instance, the World Health Organization has fixed a norm of 4% of GDP for the health budget (World Bank’s World Development Report 1993). 4. Rate of growth in line ministry budget. This index illustrates the importance and priority given to the sector in the government’s budget. The growth rate of the line ministry official budget corresponds to the base year of data collection and the preceding year. 5. Fiscal Decentralization illustrates the importance of financial decentralization in the line ministry budget overall and by types of expenditures. Given that there could be difference between official decentralization and what is done in practice, both figures are constructed. There are four subcategories of official decentralization which are measured as the share of the line ministry total budget that is officially decentralized, as well as the officially decentralized share of the line ministry Investment, recurrent and personnel budget. The equivalent four subcategories are measured with decentralization in practice, as measured by actual control of funds.
21

6. Discretionary budget. This indicator illustrates the existence of explicit allocation rule for allocating resources and the importance of discretion in budgetary allocation at the various levels. Fixed allocation rules allow more transparency in budgetary decisions and their absence has generally been associated with greater problems of leakage of resources. 7. Budget usage. This indicator assesses budget usage at the various levels within the line ministry administrative system. It measures resource use at the central level and the importance of resource transfers to lower administrative levels, in particular service providers. More specifically, it is composed of 6 subcategories: the share of the line ministry recurrent budget that is centrally used and the share transferred to lower administrative levels. The same assessment is done at the regional level (share received, used and transferred at lower levels), and finally the share of the line ministry recurrent budget that is received at the provider level 8. Share of resources reaching decentralized levels. This indicator illustrates from every dollar allocated in the budget for a specific line ministry, how much arrives at the local level and how much is used for other administrative purposes by each level, i.e. the share of the budget used at the central, provincial, district and provider levels. Note that this indicator does not try to determine if there is leakage or not, as these figures are somewhat objective portrait of the usage of resources in a specific administrative system compared to another. It is composed of 3 subcategories at the decentralized level (share of resources in the sector at the regional and district level in terms of Ministry’s total budget, in terms of recurrent expenditures and non wage expenditures. Similar indicators are constructed at the provider level. 9. Resources per capita. This indicator gives an indication of the level of real public intervention in the sector and of resources available at various levels in the system. It could also allow direct cross country comparisons. It is composed of three sub categories at the line Ministry level, total budgetary resources per capita (executed), recurrent expenditures available per capita and Non-wage recurrent expenditures. Two subcategories would be devised at the regional and provider levels, recurrent resources and non wage recurrent resources per capita received. 10. Leakage. This indicator assesses the level of leakage at the various levels in the supply chain. Leakage is defined as the proportion of resources intended for identified beneficiaries that does not reach them. The estimation of leakage rates then implies the ability to measure exactly how much the intended beneficiaries received versus how much they should have received as given by resources earmarked for them (that is officially planned). When no resources are earmarked for a level or provider, the estimation of leakage makes use of a broader definition, that of the share not reaching the specific level. Leakage is assessed in three nodes: between the central and regional (district) level, between the regional level and frontline providers and the overall leakage in the supply chain from the central level to the providers. 11. Equity. This indicator illustrates the level of inequity in resource allocation among regions, districts and types of providers. In several countries, large variability of health
22
and school spending across regions and districts, as well as within districts, is observed. Equity is proxy by the coefficient of variation in the allocation of resources in per capita terms by regions (or districts). The indicator is composed of two sub-categories (total recurrent and non wage recurrent expenditures) at the regional level and among providers 12. Delays in budget disbursement. This indicator illustrates the efficiency in budget management and disbursement at the various levels of the service delivery chain. Delays are assessed at four nodes: the number of days between budget approval and budget disbursement (release) at the central level between the Ministry of Finance and the line Ministry; between the line ministry and regional (district) levels, between the regional level and reception at the provider level, and finally the total number of days between budget approval at the central level and funds reception at provider level. 13. Leakage of salary. Within the Personnel category, this indicator assesses the overall level of leakage in salaries as measure by the share of frontline staff salaries not reaching destination (difference between salaries budgetized and received). It is also composed of a subcategory of the proportion of frontline staff affected by the problem, i.e. % of staff that does not receive full salary during the period. 14. Delays in salary. This indicator assesses the delays in salary payments. This issue could have important effects on the quality of services, staff morale and the capacity of providers to deliver services. It is composed of two subcategories, the % of frontline staff receiving salary late (i.e. more than 1 month) and the average delays in salary payment. 15. Delays in allowances. As the previous one, this indicator assesses the delays in payments of allowances (weighted average by share of allowances) and is composed of two categories, the % of frontline provider staff receiving other allowances late (> 1 month) and the average delay. 16. Delays in material. This index assesses delays in arrival of key resources. Adequate availability of medical and educational material is essential for service provision. Delays in reception of key material and supplies (e.g. books, drugs) are measured in days. A sample of material should be used to construct this indicator. 17. Leakage of material. This indicator assesses the importance of material leakage in the supply chain. In cases where the total value of material cannot be tracked, a sample should be chosen (e.g. 10 materials). The index is built as the share of material and supplies not reaching destination (in values). 18. Public ownership. In the category Environment and Characteristics, this indicator illustrates the importance of public ownership as well as other categories in the sector. Three categories are constructed, the % of public facilities, private for profit facilities, and not for profit facilities.
23
19. External support. This indicator assesses the importance of donor support at various levels in the sector under study. It is defined as the share of donors’ contribution in line ministry’s budget. These indicators measure external donors’ budgetary involvement in the country and priority given to the specific sector under study. It is composed of 6 subcategories as accounted by donor community contribution in the line ministry budget as measured in the budget in terms of total contribution (grants and loans) in line ministry budget for the past year, as well as the share of grants, and the total contribution in the recurrent and investment expenditures. The equivalent four categories are assessed in terms of total contributions, including those outside of budget support, as measured by PETS data. 20. Number of Donors active in the sector. Finally, an index of the number of donors supporting the line ministry in constructed. It seeks to proxy the level of fractionalization in donor support to the social sector under study. QSDS Table 5 presents a list of 30 potential QSDS indicators. The list of QSDS indicators comprises seven categories: i) Characteristics and environment ii) inputs, iii) financing iv) institutions, incentives and production process, v) intermediate output, vi) final output and vii) outcomes. The various purposes of the proposed QSDS indicators are as follows. 1.Ownership. Within the first category of Characteristics and environment, the first indicator illustrates the ownership structure of the sector. It is composed of three subcategories accounting for the share of public, private for-profit and private not-for-profit ownership in the sector. 2. Access to electricity. Various indicators are defined to measures access to basic infrastructure services to service providers. The first basic service considered in the access to electricity. It is measured as the % of frontline service providers with electricity. 3. Access to water. Another indicator of basic infrastructure services is the access to water supply. It is measured as the % of frontline service providers with drinkable water 4. Access to sanitation. This other indicator of basic service is the access to modern sanitation. It is measured as the % of frontline service providers with sanitation 5. Access to telephone. The final indicator of basic infrastructure is illustrates access to communication. It is measured as the % of frontline service providers with telephone. 6. Facilities per capita. This indicator seeks to measure the availability of basic facilities within the sector in the country. It is measured as the number of primary facilities per capita (health clinics or primary schools). Three subcategories are constructed, the per capita index at the national level and broken down between urban and rural areas.
24
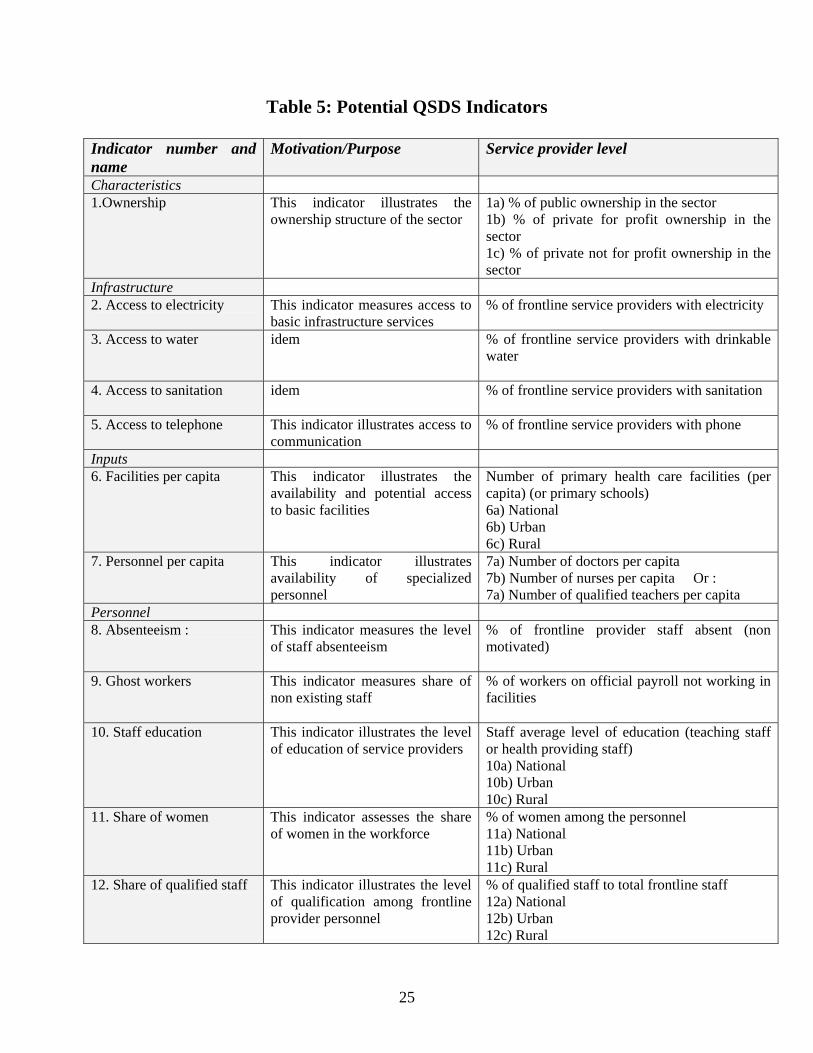
Table 5: Potential QSDS Indicators
Indicator number and name
Motivation/Purpose Service provider level
Characteristics 1.Ownership This indicator illustrates the
ownership structure of the sector 1a) % of public ownership in the sector 1b) % of private for profit ownership in the sector 1c) % of private not for profit ownership in the sector
Infrastructure 2. Access to electricity This indicator measures access to
basic infrastructure services % of frontline service providers with electricity
3. Access to water idem % of frontline service providers with drinkable water
4. Access to sanitation idem % of frontline service providers with sanitation
5. Access to telephone This indicator illustrates access to communication
% of frontline service providers with phone
Inputs 6. Facilities per capita This indicator illustrates the
availability and potential access to basic facilities
Number of primary health care facilities (per capita) (or primary schools) 6a) National 6b) Urban 6c) Rural
7. Personnel per capita This indicator illustrates availability of specialized personnel
7a) Number of doctors per capita 7b) Number of nurses per capita Or : 7a) Number of qualified teachers per capita
Personnel 8. Absenteeism : This indicator measures the level
of staff absenteeism
% of frontline provider staff absent (non motivated)
9. Ghost workers This indicator measures share of non existing staff
% of workers on official payroll not working in facilities
10. Staff education This indicator illustrates the level of education of service providers
Staff average level of education (teaching staff or health providing staff) 10a) National 10b) Urban 10c) Rural
11. Share of women This indicator assesses the share of women in the workforce
% of women among the personnel 11a) National 11b) Urban 11c) Rural
12. Share of qualified staff This indicator illustrates the level of qualification among frontline provider personnel
% of qualified staff to total frontline staff 12a) National 12b) Urban 12c) Rural
25
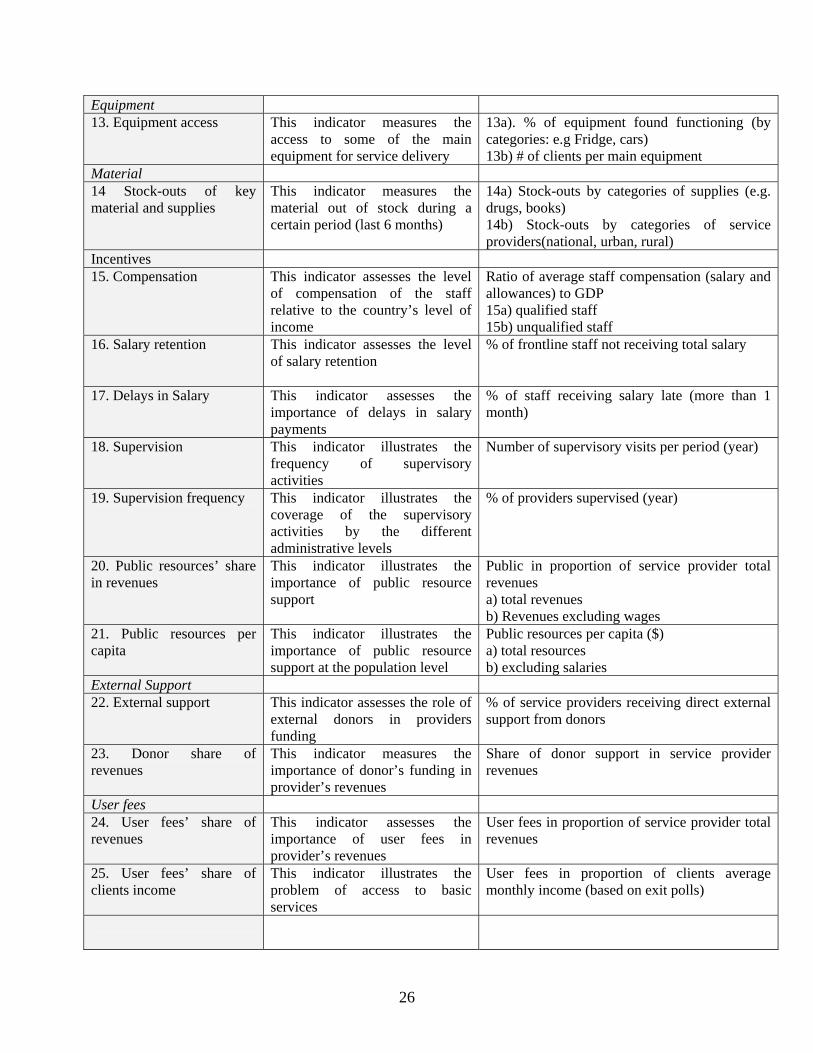
Equipment 13. Equipment access This indicator measures the
access to some of the main equipment for service delivery
13a). % of equipment found functioning (by categories: e.g Fridge, cars) 13b) # of clients per main equipment
Material 14 Stock-outs of key material and supplies
This indicator measures the material out of stock during a certain period (last 6 months)
14a) Stock-outs by categories of supplies (e.g. drugs, books) 14b) Stock-outs by categories of service providers(national, urban, rural)
Incentives 15. Compensation This indicator assesses the level
of compensation of the staff relative to the country’s level of income
Ratio of average staff compensation (salary and allowances) to GDP 15a) qualified staff 15b) unqualified staff
16. Salary retention This indicator assesses the level of salary retention
% of frontline staff not receiving total salary
17. Delays in Salary This indicator assesses the importance of delays in salary payments
% of staff receiving salary late (more than 1 month)
18. Supervision This indicator illustrates the frequency of supervisory activities
Number of supervisory visits per period (year)
19. Supervision frequency This indicator illustrates the coverage of the supervisory activities by the different administrative levels
% of providers supervised (year)
20. Public resources’ share in revenues
This indicator illustrates the importance of public resource support
Public in proportion of service provider total revenues a) total revenues b) Revenues excluding wages
21. Public resources per capita
This indicator illustrates the importance of public resource support at the population level
Public resources per capita ($) a) total resources b) excluding salaries
External Support 22. External support This indicator assesses the role of
external donors in providers funding
% of service providers receiving direct external support from donors
23. Donor share of revenues
This indicator measures the importance of donor’s funding in provider’s revenues
Share of donor support in service provider revenues
User fees 24. User fees’ share of revenues
This indicator assesses the importance of user fees in provider’s revenues
User fees in proportion of service provider total revenues
25. User fees’ share of clients income
This indicator illustrates the problem of access to basic services
User fees in proportion of clients average monthly income (based on exit polls)
26
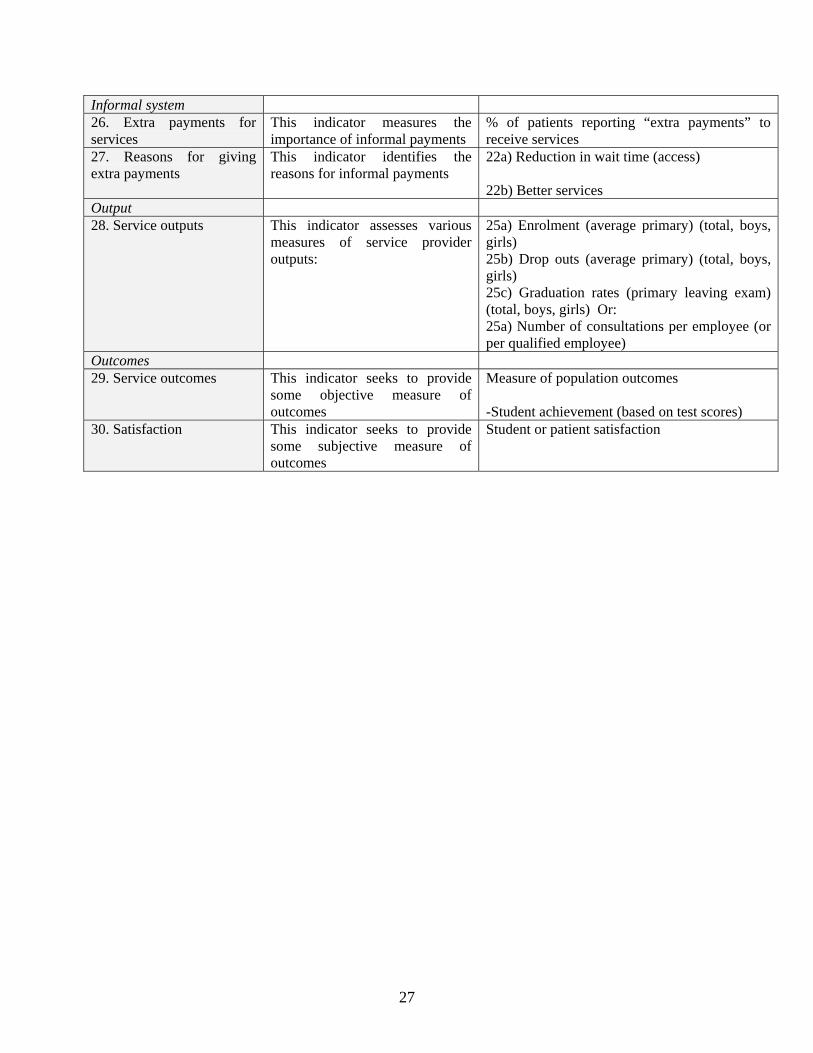
Informal system 26. Extra payments for services
This indicator measures the importance of informal payments
% of patients reporting “extra payments” to receive services
27. Reasons for giving extra payments
This indicator identifies the reasons for informal payments
22a) Reduction in wait time (access) 22b) Better services
Output 28. Service outputs This indicator assesses various
measures of service provider outputs:
25a) Enrolment (average primary) (total, boys, girls) 25b) Drop outs (average primary) (total, boys, girls) 25c) Graduation rates (primary leaving exam) (total, boys, girls) Or: 25a) Number of consultations per employee (or per qualified employee)
Outcomes 29. Service outcomes This indicator seeks to provide
some objective measure of outcomes
Measure of population outcomes -Student achievement (based on test scores)
30. Satisfaction This indicator seeks to provide some subjective measure of outcomes
Student or patient satisfaction
27

7. Personnel per capita. This indicator seeks to illustrate the availability of specialized personnel at the frontline level. It is composed of various subcategories reflecting the services provided in the social sector. In the health sector, the indicator is composed of the number of doctors per capita, and the number of nurses per capita. In the education sector, it is composed of the number of qualified teachers per capita. 8. Absenteeism. This indicator seeks to measures the level of staff absenteeism which translates into low quality of services. It is measured as the % of frontline staff which is absent (not motivated). 9. Ghost workers. This indicator measures the share of ghost workers, that is, teachers or health workers who continue to receive a salary but who no longer are in the government service, or who have been included in the payroll without ever being in the service. It is measured as the % of workers on official payroll not working in the frontline facilities. 10. Staff education. This indicator seeks to proxy some elements of the quality of services by measuring the level of education of service providers. It is measured as the average level of education of the personnel (teaching or health providing staff). Three subcategories are constructed, the average education level at the national level and broken down between urban and rural areas. 11. Share of women. This indicator assesses the share of women in the workforce. Preference for gender is frequently an important element for usage and client satisfaction. It is measured as the % of women among the personnel. Three subcategories are constructed, the % of women at the national level and broken down between urban and rural areas. 12. Share of qualified staff. This indicator illustrates the level of qualification among frontline personnel. It is measured as the % of qualified staff within total frontline staff (health personnel and education staff). Three subcategories are constructed, the % of qualified staff at the national level and broken down between urban and rural areas. 13. Equipment access. This indicator measures the access to some of the main equipment used for frontline service delivery. Two subcategories are constructed, the % of main equipment functioning (by categories: e.g fridge, cars), and the number of main equipment per capita. 14. Stock-outs of key material and supplies. This indicator measures the key material for service delivery out of stock during a certain period (last year). It is measured as the stock-outs by categories of supplies (e.g. drugs, books). Subcategories are constructed for stock-outs by categories of service providers at the national level and broken down between urban and rural areas. 15. Compensation. Various indicators reflecting the incentive structure facing staff are constructed. This indicator assesses the incentive structure by measuring the level of compensation of the staff relative to the country’s level of income. It is measured at the
28
ratio of average staff compensation (salary and allowances) to GDP. Two subcategories are constructed for qualified staff and unqualified staff. 16. Salary retention. This indicator assesses the level of salary retention at the service provider level. It is measured as the % of frontline staff not receiving their total salary during the period. 17. Delays in Salary. This indicator assesses the importance of delays in salary payments at the frontline level. It is measured as the % of staff receiving their salary late (more than 1 month). 18. Supervision. This indicator illustrates the frequency of supervisory activities. It is measured as the number of supervisory visits per period (year) from the various administrative levels. 19. Supervision frequency. This indicator illustrates the coverage of the supervisory activities by the different administrative levels. It is measured as the % of service providers supervised during the period (one year). 20. Public resources’ share in revenues. This indicator assesses the level of support from the public administration by measuring the public resources available at the provider levels. It is measured as the share of public resources in proportion to service provider total revenues. Two subcategories are constructed: public resources in proportion to total revenues and public resources excluding wages. 21. Public resources per capita. This indicator assesses the level of support from the public administration by measuring public resources per capita. It is measured as the amount of public resources available at the provider level per capita (in $). Two subcategories are constructed: total public resources per capita and public resources per capita excluding wages. 22. External support. This indicator assesses the role of external donors in providers’ financial resources. It is measured as the % of service providers receiving direct external support from donors. 23. Donors’ share in revenues. This indicator measures the importance of donor’s funding in service provider’s revenues. It is measured as the share of donor support in service provider revenues. 24. User fees’ share in revenues. This indicator assesses the importance of user fees in provider’s revenues. It is measured as the amount of user fees in proportion of service provider’s total revenues during a period. 25. User fees’ share in clients’ income. This indicator illustrates the problem of access to basic services to the population. It is constructed as the amount of user fees in proportion of clients’ average monthly income. This information could be based on exit polls.
29
26. Extra payments for services. This indicator measures the importance of informal payments in the service providers’ environment. It is measured as the % of patients reporting “extra payments” to receive services. 27. Reasons for giving extra payments. This indicator identifies the reasons given by clients for providing informal payments. It is composed of two subcategories, the % of clients reporting payments for better access (e.g. reduction in wait time) and % reporting payments to receive better services. 28. Service outputs. This indicator assesses various measures of service provider outputs. Various types of output are measured in the social sector under study. In the education sector, indexes are built for enrolment (average primary level), drop outs (average primary level) and graduation rates (primary leaving exam). Subcategories are constructed for at the national level and broken down between bys and girls. In the primary health sector, service output is measured as the number of consultations per employee. It is further broken down as the number of consultations by qualified employee. 29. Service outcomes This indicator seeks to provide some objective measure of outcomes. It is composed of various measures of population outcomes in the social sector under study. In primary education, it is measured as the ratio of student achievement based on test scores. 30. Satisfaction. Finally, this last indicator seeks to provide some subjective measure of service provision outcomes. It is composed of various measures of client satisfaction in the social sector under study, such as student or patient satisfaction. 7. Conclusion While good governance has been recognized in the last decade in the scientific literature as well as in World Bank activities as fundamental for policy environment and emphasized in terms of lending practices, little progress has been made on the front of identifying indicators for good governance that would allow to monitor improvements in the functioning of civil service and sectors. This study has examined potential indicators of public service performance and governance that could be collected with a consistent methodology using PETS/QSDS. Micro level surveys are important tools for measuring the performance and quality of service delivery. PETS and QSDS in particular have been very useful in identifying inefficiencies, capture of funds and problems of incentives in the service delivery supply chain. They help analyze how much of the allocated budget actually reaches frontline providers and how effectively service providers utilize these resources.
30

Consistent public sector indicators based on PETS and QSDS could prove very useful for monitoring the evolution of public service quality and performance. In this regard, the success in the diffusion of Doing Business type indicators could be a good example to emulate for public sector indicators given the positive effect that country competition could bring. They would certainly fit very well in the Bank governance and anti-corruption strategy for greater accountability of results in order to improve efficiency of public spending and donor allocation.
These indicators which should be comparable across countries and over time would seek to provide evidence on various characteristics and functioning of particular sectors and administrative systems. These indicators are essential to asses how well the Bank and other donors are supporting client country to ease the Instruments and indicators allowing benchmarking and comparability among countries could be extremely valuable and efficient in a globalized context where information circulates and countries have incentive to compete. Once information becomes available, and not just at the local level, but at the international levels, population will have instrument to put pressure on their government, countries will have incentives to modify their ranking, and donors would be able to use the information to push for changes.
31
R e f e r e n c e s
Ablo, Emmanuel and Ritva Reinikka (1998) “Do Budgets Really Matter? Evidence from Public Spending on Education and Health in Uganda” Policy Research Working Paper 1926, The World Bank, Washington, DC.
Ahmad, Junaid, Shantayanan Devarajan, Stuti Khemani and Shekhar Shah (2005) “Decentralization and Service Delivery”, World Bank Policy Research Working Paper 3603, Washington, DC. May.
Amin, Samia and Nazmul Chaudhury (2007) “An Introduction to Methodologies for Measuring Service Delivery in Education” in Amin, Samia, Das Jishnu and Marcus Goldstein (editors) (2008) Are you Being Served? New Tools for Measuring Service Delivery, The World Bank, Washington, D.C.
Atkinson, Tony (2005) Atkinson Review: Final Report, Measurement of Government Output and Productivity for the National Accounts, Palgrave Macmillan, Hampshire.
Bandiera, O.,A. Prat and T. Valletti (2007) “Active and Passive Waste in Government Spending: Evidence from a Policy Experiment”, London School of Economics, April, processed.
Banerjee, Abhijit, Angus Deaton and Esther Duflo (2004) “Wealth, Health and Health Services in Rural Rajasthan”, AER Papers and Proceedings, 94 (2): 326-330.
Banerjee, Abhijit and Esther Duflo (2006) “Addressing Absence” Journal of Economic Perspectives, 20 (1): 117-132.
Banerjee, Abhijit, Esther Duflo, Rachel Glennerster, Daniel Kenniston, Stuti Khemani and Marc Shotland (2006) “Can Information Campaign Raise Awareness and Local Participation in Primary Education? A study of Jaunpur district in Uttar Pradesh”, MIT, July, mimeo.
Barr, Abigail, Magnus Lindelow and Pieter Serneels (2005) “Choosing Between Self and Service: An Experimental Analysis of Corruption and Monitoring”, University of Oxford, mimeo.
Besley, Timothy and R. Burgess (2003) “The Political Economy of Government Responsiveness: Theory and Evidence from India”, Quarterly Journal of Economics, 117 (4): 1415-51.
Besley, Timothy and Maitreesh Ghatak (2003) “Incentives, Choice and Accountability in the Provision of Public services” Oxford Review of Economic Policy, 19 (2): 235-249.
Besley, Tim, Rohini Pande and Vijayendra Rao (2005) “Participatory Democracy in Action: Survey Evidence from Rural India”, Journal of the European Economic Association.
Binnendijk, A. (2000) Result-based Management in Development Co-operation Agencies: A Review of Experience, Paris, OCDE, 158 p.
32
Bjorkman, Martina, Ritva Reinikka and Jakob Svensson (2006) “Local Accountability”, Stockholm University, mimeo.
Burgess, Simon and Marisa Ratto (2003) “The Role of Incentives in the Public Sector: Issues and Evidence” Oxford Review of Economic Policy, 19 (2): 285-300.
Chaudhury, N. and J.S. Hammer (2004) “Ghost Doctors: Absenteeism in Rural Bengladeshi Health Facilities”, World Bank Economic Review, 18 (3): 423-441.
Chaudhury, N., J. S. Hammer, M. Kremer, K. Muralidharan and F. Halsey Rogers (2006) “Missing in Action: Teacher and Health Worker Absence in Developing Countries”, Journal of Economic Perspectives, 20 (1): 91-116.
Collier, Paul, Stefan Dercon and John Mackinnon (2002) “Density versus Quality in Health Care provision: Using Household Data to Make Budgetary Choices in Ethiopia”, World Bank Economic Review, 16 (30): 425-448.
Das, Jishnu (2004) “Equity in Educational Expenditures: Can Government Subsidies Help?” Policy Research Working Paper 3249, The World Bank, Washington, DC.
Das, Jishnu, Stefan Dercon, James Habyarimana and Pramila Krishnan (2004a) « Public and Private Funding Basic Education in Zambia: Implications of Budgetary Allocations for Service Delivery” Africa Region Human Development Working Paper Series No. 62, The World Bank, Washington, DC.
-------- (2004b) “When Can School Inputs Improve Test Scores”, Policy Research Working Paper 3217, The World Bank, Washington, DC.
--------- (2005) “Teacher Shocks and Student Learning: Evidence from Zambia” Policy Research Working Paper 3602, The World Bank, Washington, DC.
Das, Jishnu, Bernard Gauthier and Tomas Philipson (2004) “Black Market for Medication in Developing Countries”, University of Chicago, mimeo.
Das, Jishnu and Jeffrey Hammer (2005) “Which Doctor? Combining vignettes and item response to measure clinical competence”, Journal of Development Economics, 78: 348-383.
Das Gupta, M, V. Gauri and S. Khemani (2003) “Primary Health Care in Nigeria: Decentralized Service Delivery in the States of Lagos and Kogi.” Africa Region Human Development Working Paper Series No. 70, The World Bank, Washington, DC. September.
Davis, Jennifer (2003) “Corruption in Public service delivery: Experience from South Asia’s water and Sanitation Sector”, World Development, 32 (1): 53-71.
Deininger, Klaus and Paul Mpuga (2004) “Does Greater Accountability improve the Quality of Public Service Delivery? Evidence From Uganda”, World Development, 33 (1): 171-191.
33

---------- (2005) “Economic and Welfare Impacts of the Abolition of Health User Fees: Evidence from Uganda” Journal of African Economies, 14 (1): 55-91
Dehn, Jan, Ritva Reinikka and Jakob Svensson (2003) “Survey Tools for Assessing Performance in Service Delivery.” In Francois Bourguignon and Luiz Pereira da Silva (eds.). The Impact of Economic Policies on Poverty and Income Distribution: Evaluation Techniques and Tools. A copublication of the World Bank and Oxford University Press.
Del Monte A. and E. Papagni (2001) “Public expenditure, corruption and economic growth: the case of Italy” European Journal of Political Economy 17 : 1-16
Dranove, David, Daniel Kessler, Mark McClellan and Mark Satterthwaite (2003) “Is More information Better? The Effects of “Report Cards” on Health Care Providers”, Journal of Political Economy, 111 (31): 555-
Duflo, Esther and Rema Hanna (2006) “Monitoring Works: Getting Teachers to Come to School, MIT, May, mimeo.
Filmer, Deon and Lant H. Pritchett (1999) “The impact of Public Spending on Health: Does Money Matter?” Social Science and Medicine, 58: 247-258.
Filmer, Deon (2003) « The Incidence of Public Expenditures on Health and Education » Background Note for the World Development Report 2004, Washington, DC., processed.
Filmer, Deon; Jeffrey S. Hammer and Lant H. Pritchett (2000) “Weak Links in the Chain: A Diagnosis of Health Policy in Poor Countries”, World Bank Research Observer, 15 (2): 199-224.
Gauthier, Bernard (2006) “PETS and QSDS in Sub-Saharan Africa: A Stocktaking Study”, HEC Montréal and The World Bank, Washington D.C., September, processed.
Gauthier, Bernard (2008) “Harmonizing and Improving the Efficiency of PETS/QSDS” The World Bank, March, processed.
Gauthier, Bernard and Waly Wane (2005) “Suivi des dépenses publiques à destination dans le secteur santé au Tchad: Analyse des résultats d’enquête," Development Research Group, The World Bank, Washington, DC., processed.
--------- (2007) “Leakage of Public Resources in the Health Sector: An Empirical Investigation of Chad”, Policy Research Working Paper # 4351, The World Bank, Washington D.C., September.
Gauthier, Bernard and Ritva Reinikka (2007) “Methodological Approaches to the Study of Institutions and Service Delivery: PETS, QSDS and CRCS”, African Economic Research Consortium Framework paper, The World Bank, August.
Gershon, Peter Sir (2004) Releasing Resources to the Front Line: Independent Review of Public Sector Efficiency, UK Treasury, HMSO, London.
34
Keefer, Philip and Stuti Khemani (2005) “Democracy, Public Expenditures and the Poor: Understanding Political Incentives for Providing Public Services", World Bank Research Observer, 20 (1): 1-27.
Khemani, Sutti (2004) “Political Cycles in a Developing Economy: Effect of Elections in the Indian States”, Journal of Development Economics 73 (1): 125-154.
--------- (2006) “Local Government Accountability for Health Service Delivery in Nigeria”, Journal of African Economies, 15: 285-312.
Kremer, Michael, Sylvie Moulin and Robert Namunyu (2003) “Decentralization: A Cautionary Tale”, Harvard University, March, mimeo.
Lewis, Maureen (2006) “Governance and Corruption in Public Health Systems” Working Paper 78, Center for Global Development, Washington D.C., January.
Lindelow, Magnus (2004), “Health Care Decisions as a Family Matter: Intrahousehold Education Externalities and the Utilization of Health Services.” Policy Research Working Paper 3324. Development Research Group, The World Bank,Washington, D.C.
Lindelow, Magnus and Adam Wagstaff (2003) “Health Facility Surveys: An Introduction” Policy Research Working Paper 2953, The World Bank, Washington DC.
Lindelow, Magnus, Ritva Reinikka and Jakob Svensson (2003) “Health Care on the Frontlines: Survey Evidence on Public and Private Providers in Uganda” Africa Region Human Development Working Paper Series, The World Bank, Washington DC.
Lindelow, Magnus, Patrick Ward and Nathalie Zorzi (2004), “Primary Health Care in Mozambique: Service Delivery in a Complex Hierarchy”, Africa Region Human Development Working Paper 69, Development Research Group, The World Bank, Washington, DC.
Lindelow, Magnus, Inna Kushnarova and Kai Kaiser (2006) “Measuring corruption in the health sector: what we can learn from public expenditure tracking and service delivery surveys in developing countries”, In J. Kotalik and D. Rodriguez (Eds.) Global Corruption Report 2006: Corruption and Health, London: Pluto Press.
Lindelow, Magnus and Pieter Serneels (2006) “The Performance of Healh Workers in Ethiopia: Results from Qualitative Research”, Social Science and Medicine, 62: 2225-2235
Morgan, P. and A. Qualman (1996) Institutional and Capacity Development: Result-Based Management and Organizational Performance, Canadian International Development Agency, Gatineau, Canada.
Musgrove, Philip (1996) « Public and Private Roles in Health: Theory and financing patterns » World Bank Discussion Paper 339, Washington D.C.
35
Over, Mead, Mattias Lundberg, Waly Wane and Sergio Bautista (2006) “Estimating and explaining the efficiency of health service delivery in developing countries: with applications to HIV prevention in five countries and primary care in Chad”, Presentation at the workshop on measuring service delivery, World Bank, Washington, DC., April 28, processed.
OCDE (2005) Paris Declaration on Aid Effectiveness: Baseline and Suggested Targets for the 12 indicators of Progress, OECD, Paris
Oxford Policy Management (2005) “Public Expenditure Tracking Surveys in Health: Lessons from Bangladesh”, November, Oxford, UK.
Paul, Samuel (2002) Holding the State to Account: Citizen Monitoring in Action. Bengalore: Books for Change.
PEFA (2005) Gestion des finances publiques: Cadre de la mesure de la performance, Public Expenditure and Financial Accountability, PEFA Secretariat, World Bank, Washington DC.
Rajkumar, Andrew Sunil and Vinaya Swaroop (2002) “Public Spending and Outcomes: Does Governance Matter?” Policy Research Working Paper 2840, The World Bank, Washington, DC.
Reid, Gary J. (2008) “Actionable Governance Indicators: Concept and Measurement” Administrative and Civil Service Reform (ACSR) Thematic Group, The World Bank, Washington DC, February, processed
Reinikka, Ritva (2001) “Recovery in service delivery: evidence from schools and health centers” In R. Reinikka and P. Collier (Eds), Uganda’s recovery: The role of farms, firms and government. World Bank Regional and Sectoral Studies, Washington DC: World Bank.
Reinikka, Ritva and Nathanael Smith (2004) Public Expenditure Tracking Surveys in Education, International Institute for Educational Planning, UNESCO, Paris.
Reinikka, Ritva and Jakob Svensson (2001) “Explaining Leakage of Public Funds” Policy Research Working Paper 2709. The World Bank, Washington, DC.
------------ (2003) “Measuring and Understanding Corruption at the Micro Level.” In Donatella Della Porta and Susan Rose-Ackerman (eds.), Corrupt Exchanges: Empirical Themes in the Politics and the Political Economy of Corruption. Baden-Baden: Nomos Verlasgesellschaft.,
------------ (2004a) Efficiency of Public Spending: New Microeconomic Tools to Assess Service Delivery.” In Tony Addison and Alan Roe (eds.). Fiscal Policy for Development: Poverty, Reconstruction and Growth. Palgrave Macmillan. May
------------ (2004b) “Local Capture: Evidence from a Central Government Transfer Program in Uganda”, Quarterly Journal of Economics, 119 (2): 1-28.
36
------------ (2004c) “Citizen report card at the community level: an impact evaluation” DECRG, The World Bank, processed.
----------- (2005a), “Fighting Corruption to Improve Schooling: Evidence from a Newspaper Campaign in Uganda.” Journal of the European Economic Association, 3 (2-3): 259-267.
----------- (2005b) “Using Micro Surveys to Measure and Explain Corruption.” World Development, 33 (12) (December).
----------- (2005c) The Power of Information: Evidence from a Newspaper Campaign to Reduce Capture of Public Funds, Policy Research Working Paper Series 3239, The World Bank, Washington, DC.
------------ (2006) “Working for God? Evidence from a change in financing of not-for-profit health care providers in Uganda”, Stockholm University, October, mimeo.
Rogers, F. Halsey, J.R. Lopez-Calix, N. Cordoba, N. Chaudhury, J. Hammer, M. Kremer and K. Muralidharan (2004) “Teacher Absence and incentives in Primary Education: Results from a New National Teacher tracking Survey in Ecuador,” in Ecuador: Creating Fiscal Space for Poverty Reduction, Washington DC.: World Bank, chapter 6.
Serneels, Pieter, Magnus Lindelow, Jose Garcia-Montalvo and Abigail Barr (2005) “For Public Service or Money: Understanding geographical Imbalances in the Health Workforce”, World Bank Policy Research Working Paper 3686, Washington, DC., August.
Wane, Waly (2007) “PETS in a difficult environment: The case of Chad”, in Amin, Samia, Das Jishnu and Marcus Goldstein (editors) (2008) Are you Being Served? New Tools for Measuring Service Delivery, The World Bank, Washington, D.C.
World Bank (2003) World Development Report 2004: Making Services Work for Poor People, The World Bank and Oxford University Press, Washington, DC.
Ye, Xiao and Sudharshan Canagarajah (2002) “Efficiency of Public Expenditure Distribution and Beyond: A Report on Ghana’s 2000 Public Expenditure Tracking Survey in the Sectors of Primary Health and Education”. Africa Region Working Paper Series No. 31, The World Bank, Washington, DC
37