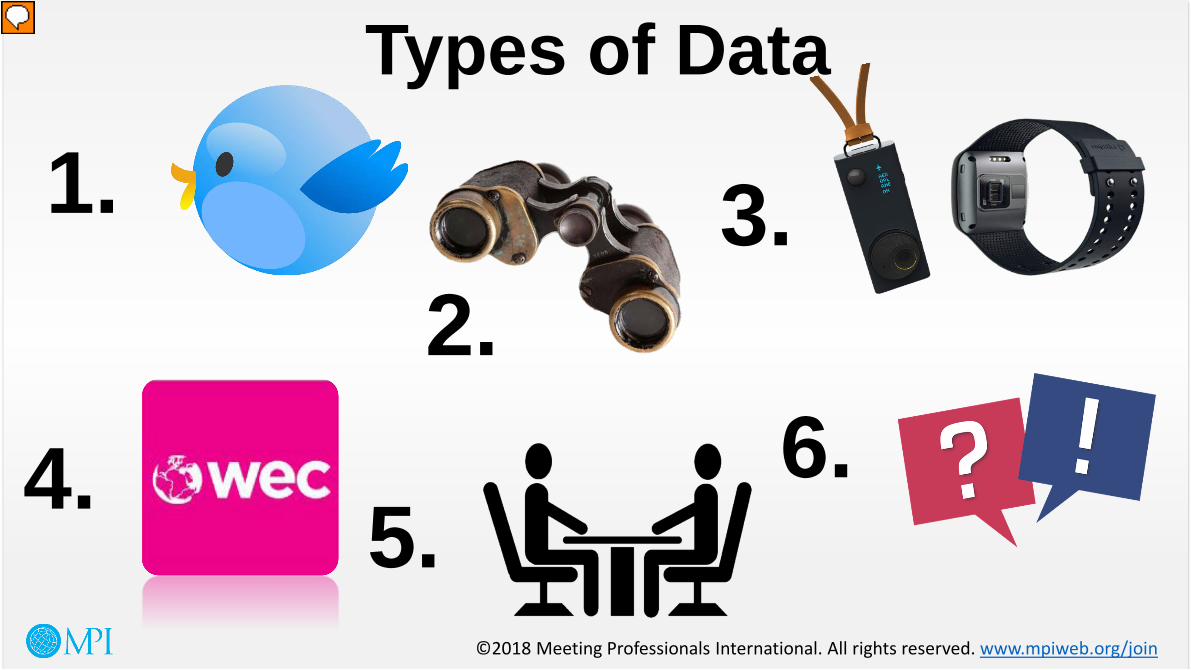
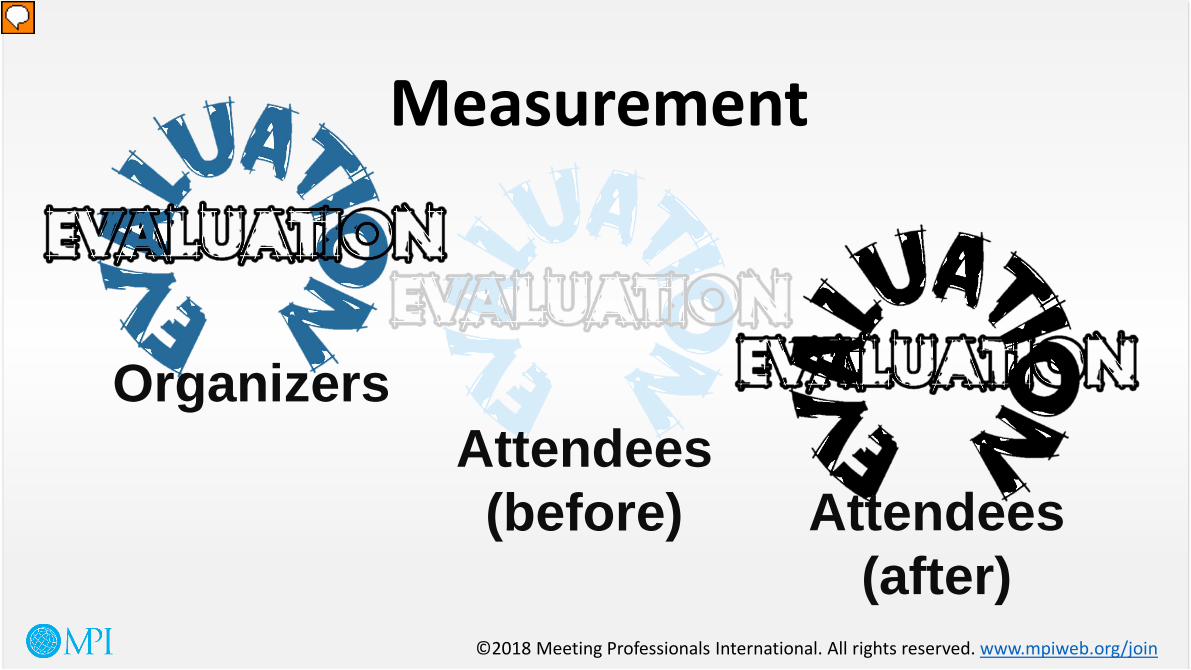
Researchers began to try and answer this question by undertaking a literature review of previous research in the areas of loyalty, learning and networking to see what could be measured. They investigated tools that could be used to measure and considered ways in which research had been carried out. The team then set about testing a variety of tools at two events: Meetings Show in the UK, a large trade show for meeting organisations, and World Education Congress (WEC) in the USA, a large Association meeting held by MPI. The team used a variety of methods to measure the outcomes: interviews with organisers and participants before and after the event, observations, session feedback forms and live intercepts, as well as wristbands to record electro-dermal activity and autographers and smart phones to record the live experience. In addition the team collected app data, session feedback and social media so that over 50,000 data points were analysed The tools were tested for both their practical application to meetings and their capacity to accurately measure the outcomes being tested. As a result, numerous tools are now at the disposal of professionals that go far beyond the post-event survey. The research showed that a multi-method approach can increase engagement, help enhance the robustness of any ROI claims and improve the chance of those returns being achieved.
The old adage ‘less is more’ is never more true than when sampling for meeting evaluation surveys. Forget about sending it out to as many as possible and annoying the majority. Instead focus in on a ‘good’ sample. The most important characteristic of a ‘good’ sample is that it represents the whole group you are interested in, without bias. The best way to achieve this is to have a random sample and to ensure that all of those chosen respond. Non-response is the worst form of bias as it cannot be accurately measured. We do not know how biased it is or in what way but we do know it’s biased. Therefore a sample will be better (i.e. more representative) if you, for example, choose 300 and get those 300 to respond rather than if you send to 2000 and get 500 responses. The key is to ensure that the chosen 300 are selected randomly from all the delegates. Random selection works due to the laws of probability: the trick is to determine the right number to make the sample manageable and as representative as possible. The good news is that there are many other robust ways to gather deep and meaningful data: think ‘customer insights’ rather than surveys. That’s the basis upon which many companies including Coca Cola and Apple build their success. Smaller samples but studied in depth provide ‘thick’ data that can generate these insights and be the basis for real innovation. Live the participant’s experience, get under their skin, into their shoes, as Steve Jobs, the late Apple CEO did. There are many ways to achieve this. For example you can focus on two or three participants as case studies. Chat to them beforehand about their expectations and objectives, get them to record their experience in photos, notes, Tweets. Use these as the basis for a post event discussion. You’ll be surprised at the insights gained from a few people that could never have been captured in a survey of 400. Combine the two and you’ll really have data you can use effectively.
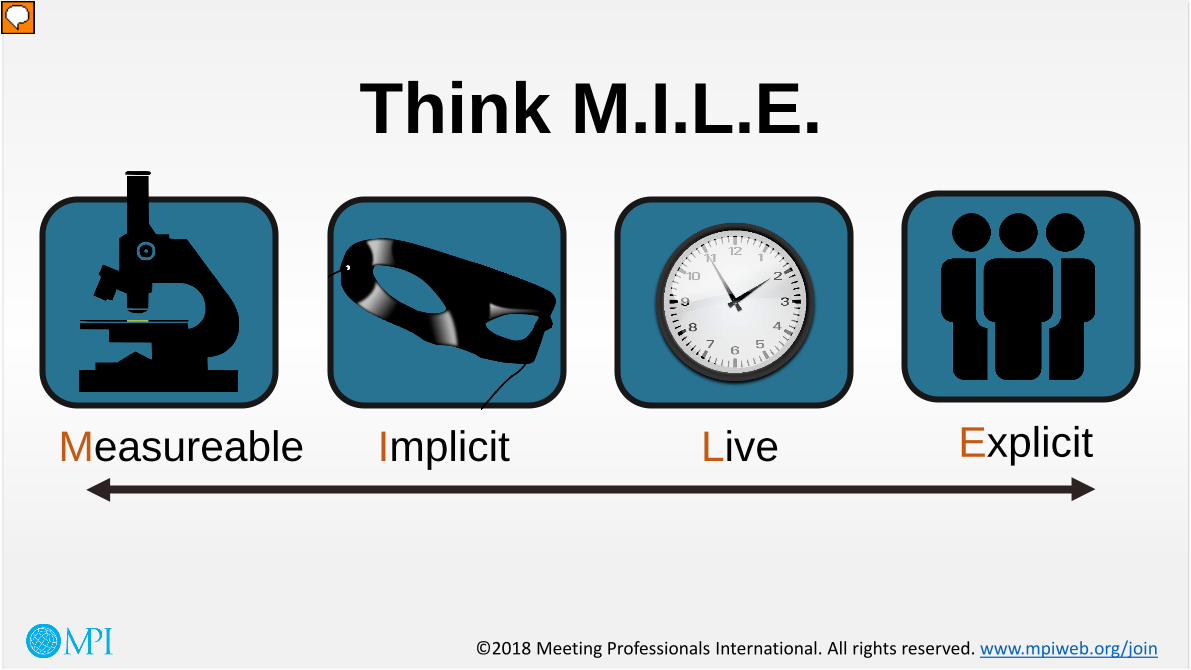
Measure: This means putting data as much as possible into numbers – quantifying, measuring, scoring consistently so that you can calculate using numbers to make your ROI. Implicit: So much feedback we gain is free and never asked for such as the way people behave during a session, how people use our websites, apps and social media in before, during and even after meetings. All of this gives us ways to measure the experience without asking all of our participants to fill in a survey. Live: Once the meeting is over, if your participants did not like it, it is too late to make any changes. Measuring the live experience and recording it in some way can help planners make adjustments to the meeting in real time. Doing research at the event can also make participants more aware of what they should be expected to achieve. For example asking participants what they are learning and what they might use it for, would remind participants that they should be learning and thinking of how they can use the learning. Explicit: The traditional methods of surveying and interviewing are not dead, so gaining explicit feedback to questions you ask if still a very critical part of evaluations.
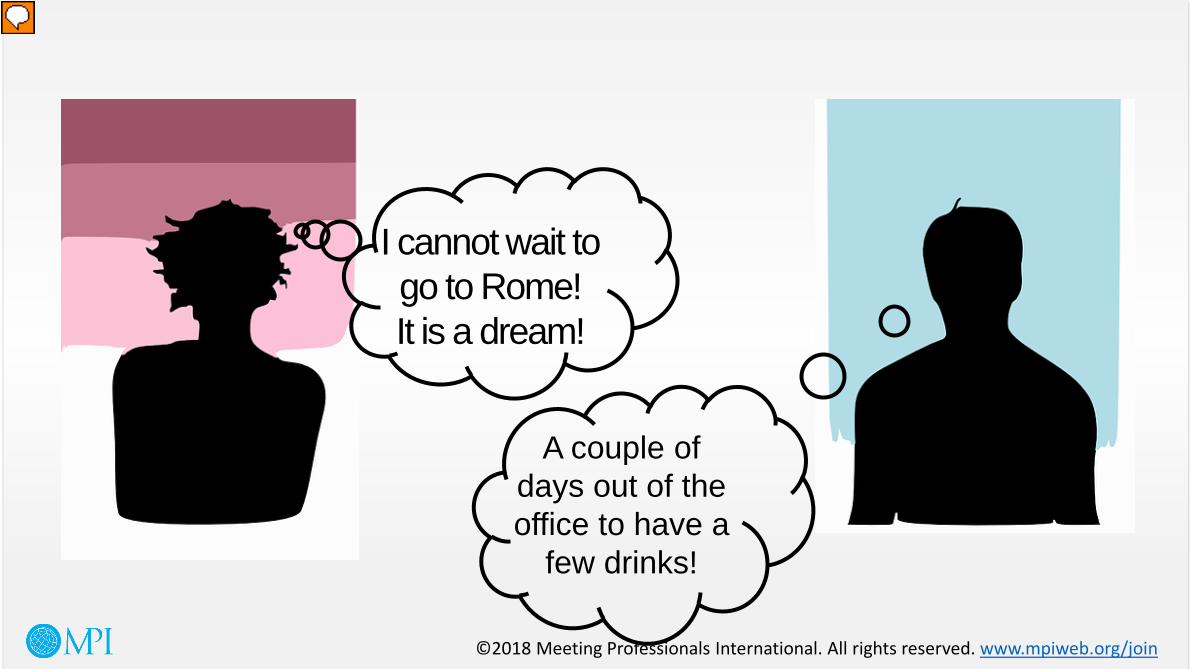
Research has shown that the objectives for the meeting are not always aligned with the participant objectives…. What can you do? Communicate Make it clear what objectives are? Measure these at the event to make participants conscious of them? Listen to the participants too and make sure their needs are considered too – can you blend them? Most importantly….
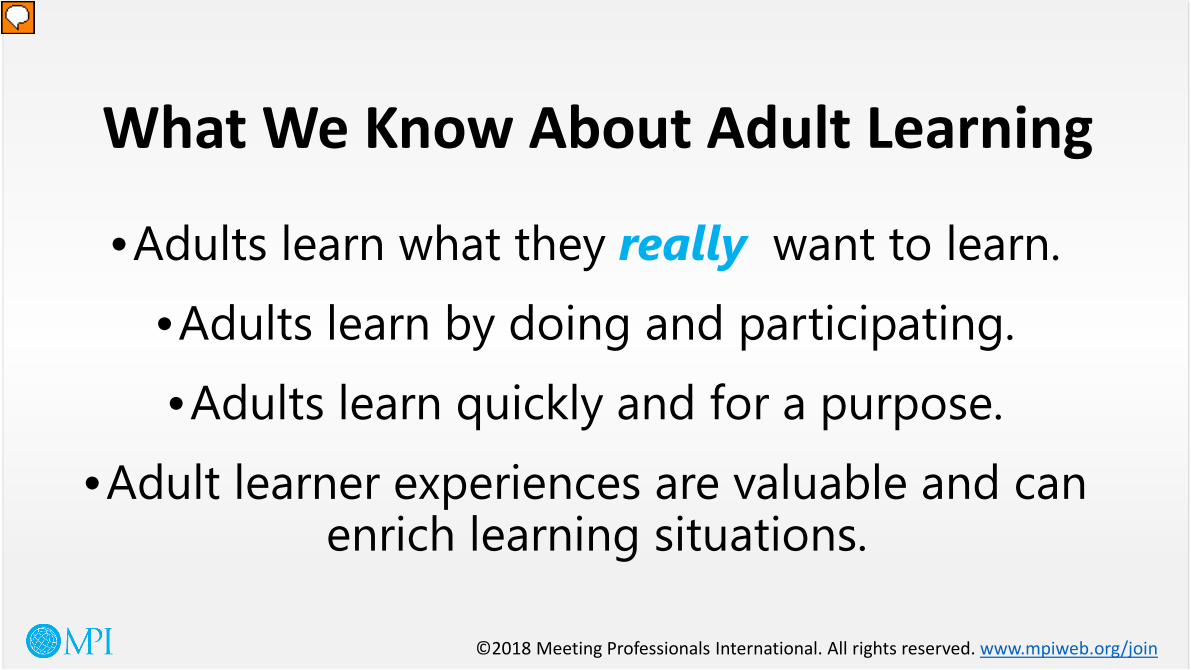
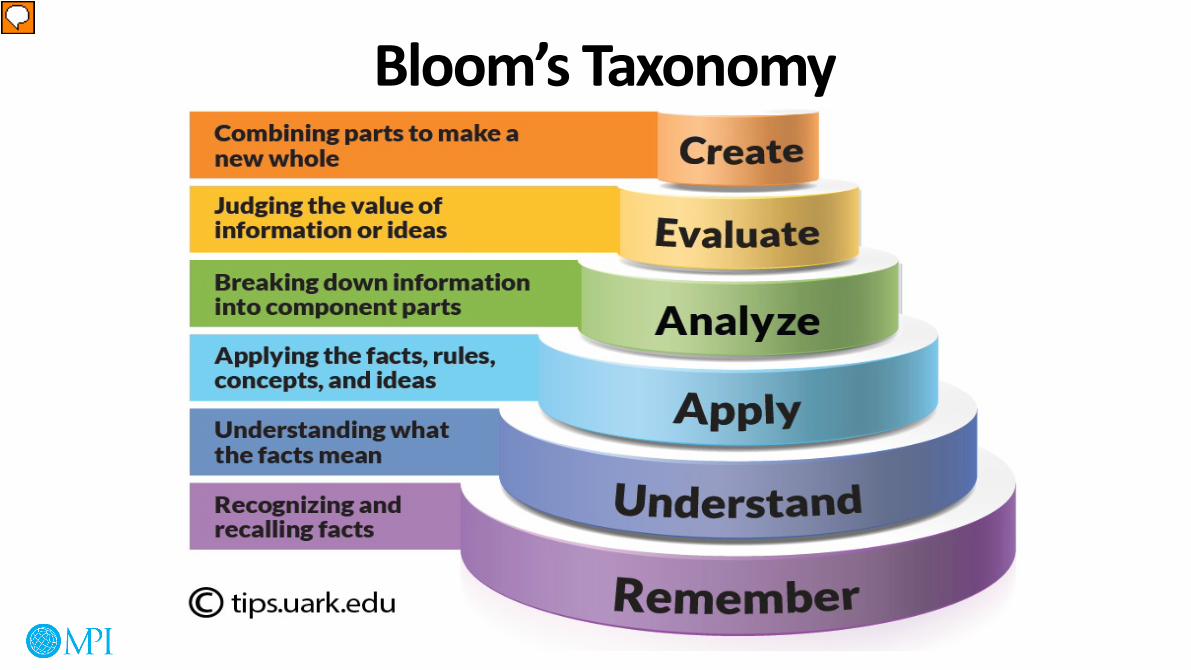
Accepting the above, what becomes clear is that the learning outcome has more likelihood of being achieved if the subjects are relevant and have individual meaning, where there is some degree of action and interaction and where peer-to-peer as well as expert teaching is in place. These factors help us to break down what will be helpful to know in advance about our learners and what types of design and structure might support the outcome.
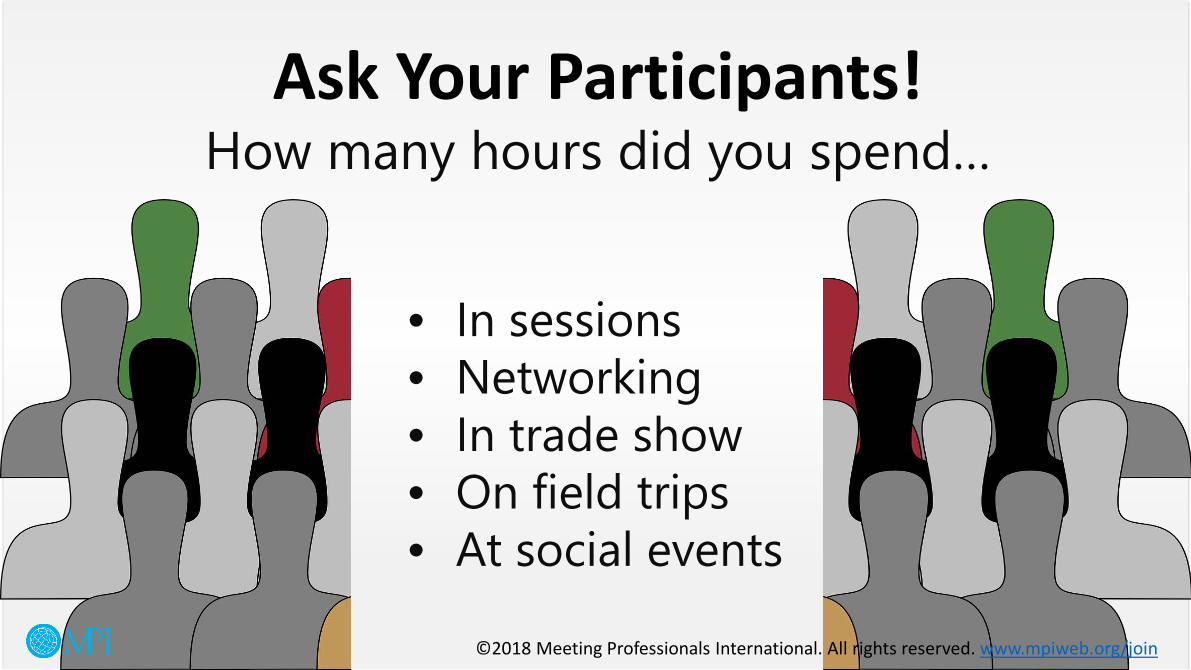
There are lots of ways to find out how your attendees are processing their learning at the event both implicitly and explicitly. You can look at twitter and see how many people are repeating information, how many are questioning it, how many are moved emotionally by it? You can ask participants in the session to tell you what they have learned You can ask participants to write down on pads what they have learned You can ask participants as they leave what they have learned and record it or write it down…. All of these methods have been tried and tested and help to ensure that they remind participants what they were supposed to be achieving…. Learning.
These are the words to look out for to make your judgement on these kinds of open feedback that will be shared at live events in any case – the key is you want people to share that with you so you can hear, see and feel the value!
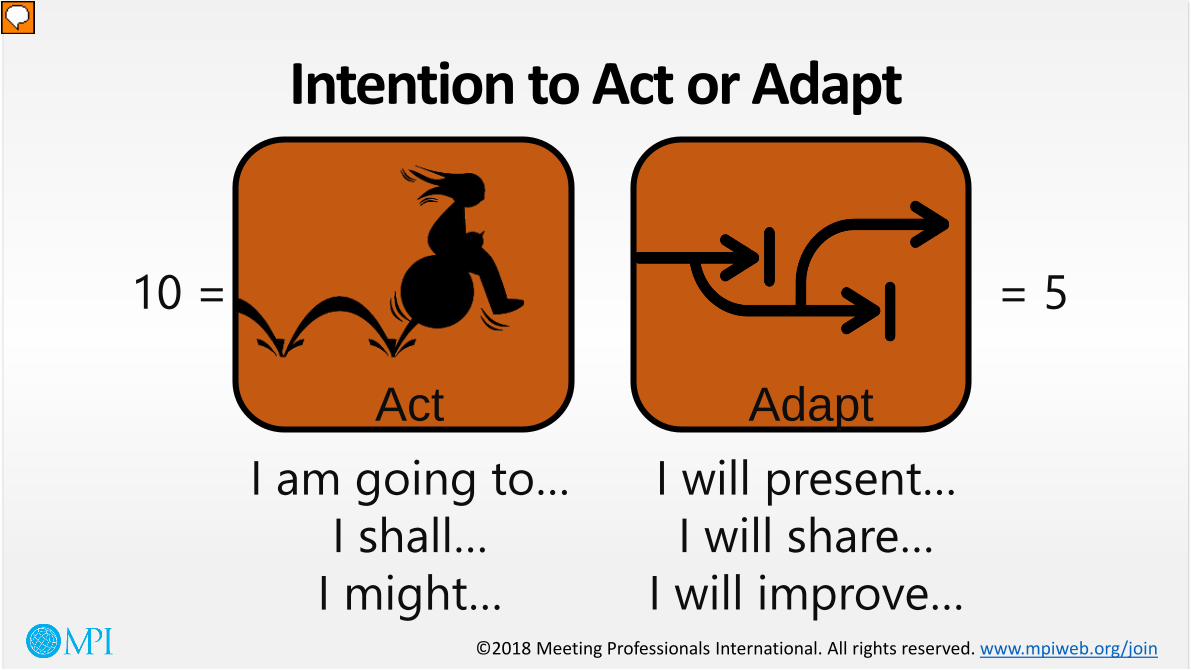
Scores for these statements are the extent to which someone intends to act on the learning I will implement all of my learning from WEC in my current job I think my learning will improve our business performance I think my learning will help increase profits for my business Scores for these statements are the extent to which someone will adapt the learning I will share my learning with one colleague I will present my learning from WEC to colleagues in my company I think my learning will make me better at my job I think my learning will improve my chances of promotion
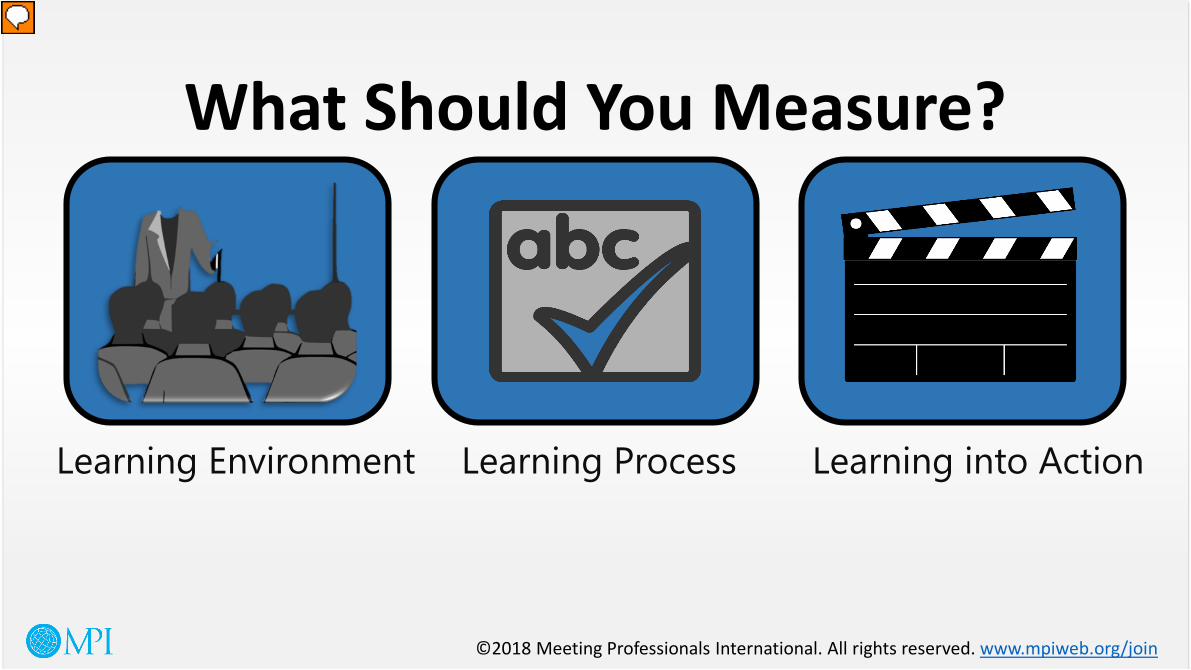
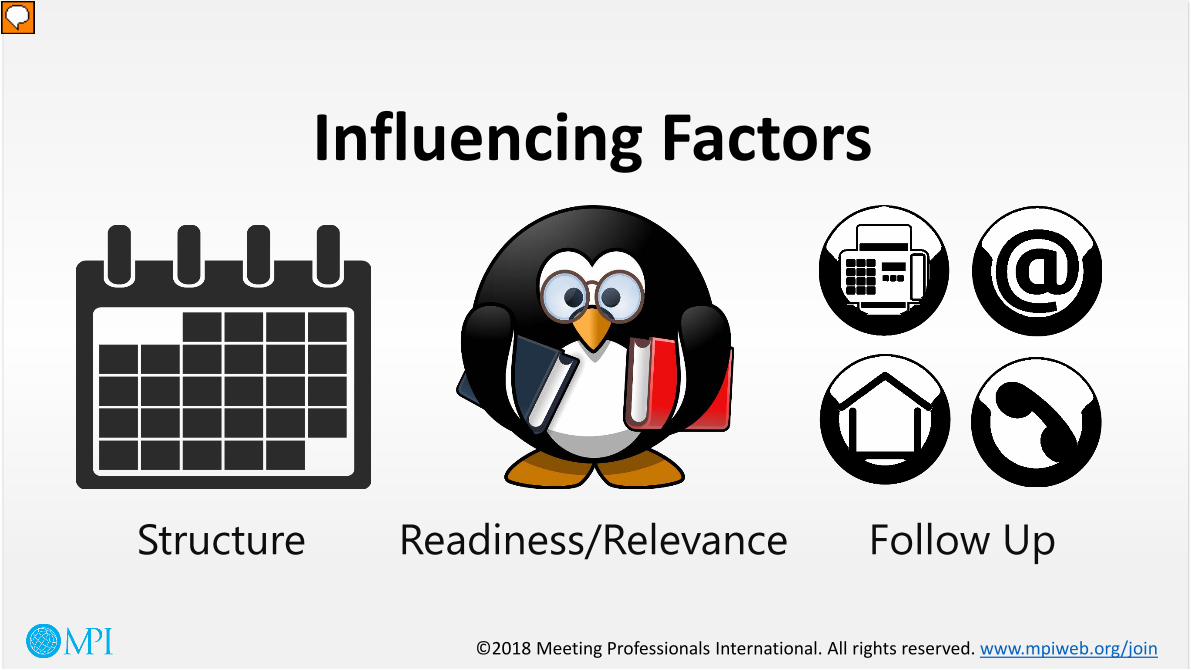
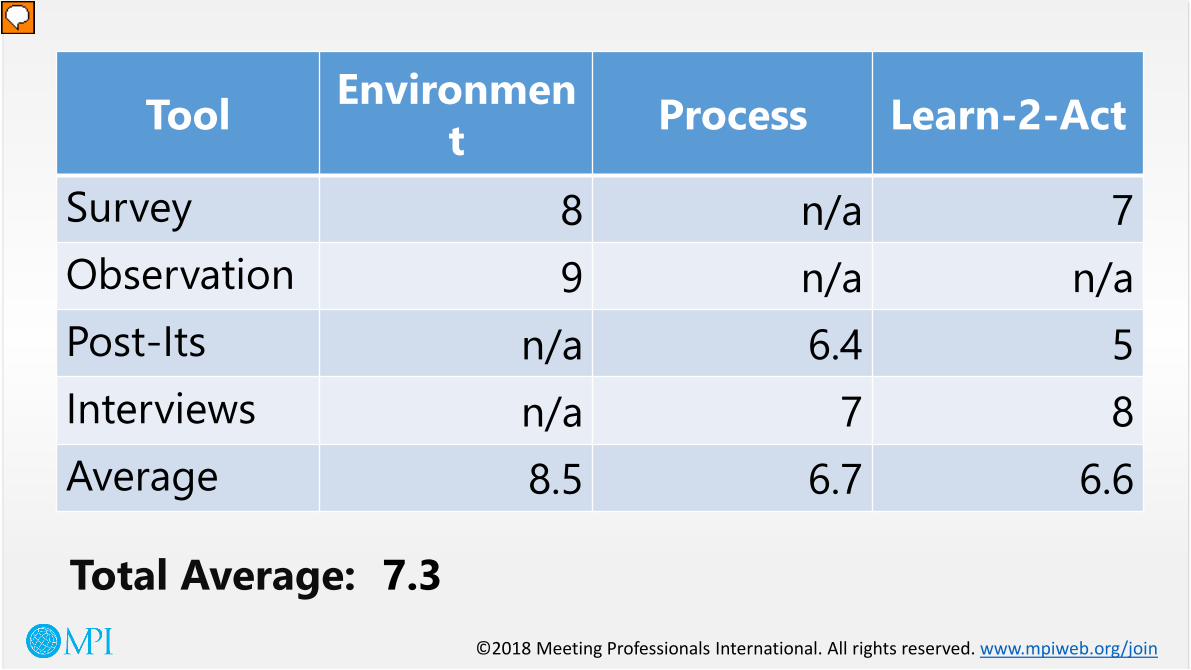
The Toolkit breaks down the measurement of learning into three areas: Learning Environment – this includes factors relating to structure, design, setting as well as learner readiness and follow-up; Learning Process – this includes stages of the process to assess the depth of learning taking place; Learning into Action – this helps to identify the value of the ‘what next?’. How much of the learning will be acted upon or adapted? Adult learning principles illustrate that the more relevant, meaningful and interactive a learning experience is, the better the odds are that the learning outcome will be achieved. These factors help us to break down what will be helpful to know in advance about our learners and what types of design and structure might support the outcome.
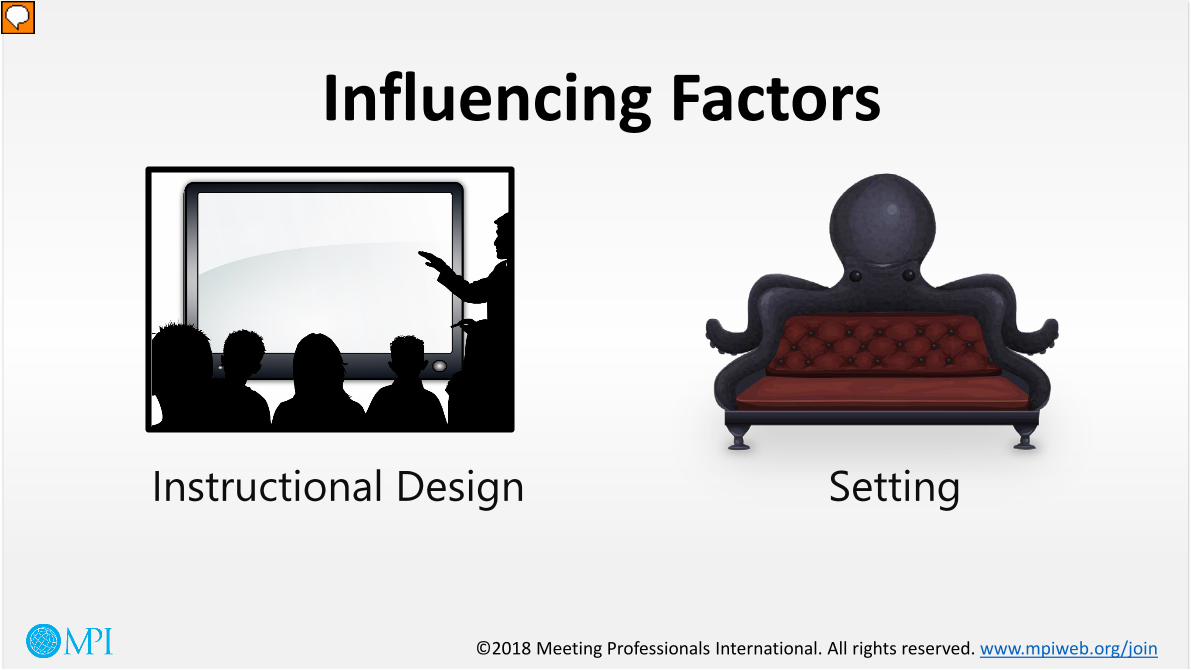
Design: measures factors that relate to level of challenge, nature of participants, the content, style and level of interaction Structure: measures factors that relate to timing, breaks, structure to process learning Setting: measures factors that might optimize a learning setting such as varied room layouts, daylight and interaction Readiness/relevance: measures factors on content, speaker and learner interest Follow-up: measures factors relating to technology, hand-outs and continued communications.
Design: measures factors that relate to level of challenge, nature of participants, the content, style and level of interaction Structure: measures factors that relate to timing, breaks, structure to process learning Setting: measures factors that might optimize a learning setting such as varied room layouts, daylight and interaction Readiness/relevance: measures factors on content, speaker and learner interest Follow-up: measures factors relating to technology, hand-outs and continued communications. Assessing these aspects before and after a meeting will help meeting professionals to prepare and adjust their designs to maximize the probability of learning outcomes. The Toolkit includes a scoring grid to help to reflect on all the components designed to maximize the probability of learning outcomes being achieved from best practices and adult learning theory. Meeting professionals may choose to complete it a few times to see if scoring will improve in advance of the event. Learning environment is made up of a minimum of two instruments. If you can only use one due to resource constraints or other issues, use the scoring grid (choose as many questions as apply or all and use the same statements for your participants)