measuring upper body position in sleep apnoea …...i am pleased to submit this thesis, entitled “...
TRANSCRIPT
1
Measuring Upper Body Position in Sleep Apnoea
Patients
Oliver Fry
20155829
School of Mechanical Engineering, University of Western Australia
Supervisor: Dr. Adrian Keating
School of Mechanical Engineering, University of Western Australia
Co-Supervisor: Dr. Peter Eastwood
Department of Anatomy & Human Biology, University of Western Australia
Co-Supervisor: Dr. Jennifer Walsh
Department of Anatomy & Human Biology, University of Western Australia
Final Year Project Thesis
School of Mechanical Engineering
University of Western Australia
Submitted 6th June 2011

2
Project Summary
This project aims to complete and improve previous work on developing a system to
track upper body movement in sleeping patients to assist in diagnosing and treating
sleep apnea. This project consisted of completing and implementing a previous design
using accelerometers as tilt sensors, and improving upon this design. The previous
design has been implemented and is ready to be used within the clinical environment,
and an improved design is proposed which incorporates gyroscopes as well as
accelerometers to increase the accuracy of the system, and allow tracking of head
movement in situations where accelerometers are unable to do so.
To combine the accelerometer and gyroscope data a Kalman filter is used, with the
ability to switch between the filter and purely gyroscope determined values when
accelerometer data is no longer available. Initial testing of the design shows that the
combined accelerometer and gyroscope data is much more accurate in certain regions,
but the design has failed to accurately measure head position when no accelerometer
data is available for long periods of time due to gyroscope drift.

3
Letter of Transmittal
Oliver Fry
10/11 Melville Pde
South Perth, WA, 6151
6th June, 2011
Winthrop Professor John Dell
Dean
Faculty of Engineering, Computing and Mathematics
University of Western Australia
35 Stirling Highway
Crawley, WA, 6009
Dear Professor Dell
I am pleased to submit this thesis, entitled “Measuring Upper Body Position in Sleep Apnea Patients”, as part of the requirement for the degree of Bachelor of Engineering.
Yours Sincerely
Oliver Fry
20155829

4
Table of Contents Project Summary ........................................................................................................................... 2
Letter of Transmittal ..................................................................................................................... 3
Nomenclature ................................................................................................................................ 6
Introduction ................................................................................................................................... 7
Project Restrictions ................................................................................................................... 8
Previous Work .......................................................................................................................... 8
Literature Review .................................................................................................................... 11
Project Objectives ................................................................................................................... 14
Project Implications ................................................................................................................ 14
Safety .......................................................................................................................................... 15
Laboratory Safety .................................................................................................................... 15
Implementation Issues ............................................................................................................ 16
State of Received Project ............................................................................................................ 17
Extending code to calculate relative angles ............................................................................ 17
Ruggedizing Accelerometers .................................................................................................. 17
System Housing and Cabling .................................................................................................. 18
Debugging ............................................................................................................................... 19
Design Process ............................................................................................................................ 20
Amplification of gyroscope outputs ........................................................................................ 20
Circuit Design ..................................................................................................................... 22
Amplifier Selection ............................................................................................................. 25
Noise analysis ......................................................................................................................... 25
Sensor Fusion .......................................................................................................................... 28
The Kalman Filter ............................................................................................................... 28
System model ...................................................................................................................... 30
Filter Requirements ............................................................................................................. 31
Combining Accelerometer and non-Accelerometer regions ................................................... 31
Data Collection ....................................................................................................................... 32
Results ......................................................................................................................................... 33

5
Implementation of accelerometer only system ....................................................................... 33
Amplification Circuit .............................................................................................................. 34
Data Fusion ............................................................................................................................. 36
Conclusions and Future Work..................................................................................................... 38
References ................................................................................................................................... 38
Appendix ..................................................................................................................................... 40
Device Description for WASDRI ........................................................................................... 40
Final code used for accelerometer system .............................................................................. 41

6
Nomenclature
WASDRI – Western Australian Sleep Disorders Research Institute
IMU – Inertial Measurement Unit
OSA – Obstructive Sleep Apnea
KF – Kalman Filter
ZRO – Zero Rate Output
7
Introduction
Sleep apnea is a sleep disorder characterised by pauses in breathing or periods of
abnormally low breathing. The predominant form is Obstructive Sleep Apnea
(OSA)which makes up 87% of all sleep apnea cases(Morgenthaler et al., 2006). In this
form breathing is interrupted because of an obstruction in the airway or a collapse of the
airway.
Depending on the severity of the disorder, sleep apnea can have many consequences.
The most obvious of these is general fatigue and a drop in productivity due to a lack of
sleep. It is estimated that sleep apnea costs the Australian economy in excess of $7
billion annually through a combination of productivity loss and health consequences.
(Hillman et al., 2006). In severe cases, sleep apnea can lead to other health concerns
including heart disease and stroke.
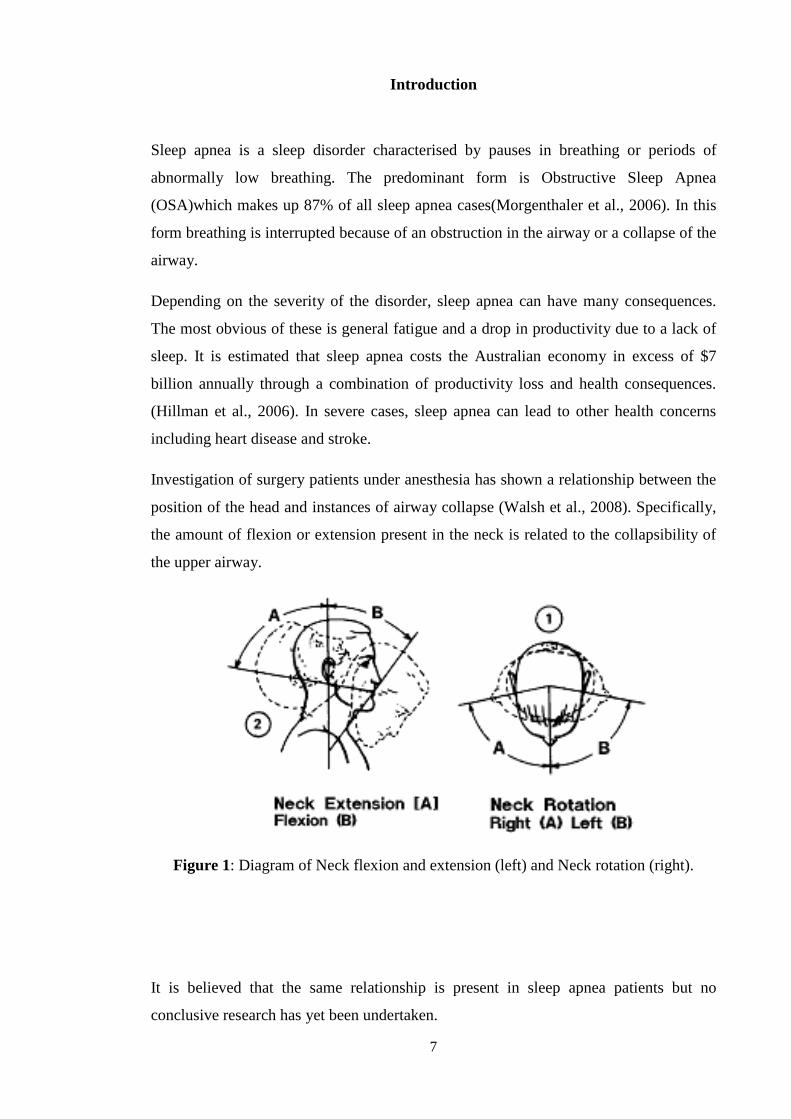
Investigation of surgery patients under anesthesia has shown a relationship between the
position of the head and instances of airway collapse (Walsh et al., 2008). Specifically,
the amount of flexion or extension present in the neck is related to the collapsibility of
the upper airway.
Figure 1: Diagram of Neck flexion and extension (left) and Neck rotation (right).
It is believed that the same relationship is present in sleep apnea patients but no
conclusive research has yet been undertaken.

This project is undertaken in collaboration with the West Australian Sleep Disorders
Research Institute (WASDRI). WASDRI are interested in investigating this link
between upper body position and sleep apnea events for research and diagnostic
purposes. This project
position in patients undergoing sl
Charlie Gardner’s hospital.
Project Restrictions
The design of the system
is that the system is compact enough to enable placement on patient
Figure 2 shows the limited space currently available on patients. The sensors to be used
must be capable of fitting on the body, without disturbing the movement of the patient.
The guideline given for this
exceed the size of an Australian 50cent coin.
Another issue highlighted by WASDRI was a quick to setup and calibrate system.
Significant amounts of time are already spent setting up the sleep stu
the other sensors, ideally a solution to this problem would be very easy to use and have
minimal setup time.
The final issue is cost. Although no upper limit is specified, the cheaper option is
preferable to a more expensive one.
Previous Work
The project is a continuation of previous work done by Michael Crocker in 2009
During the course of his investigation he determined that using accelerometers to 8
This project is undertaken in collaboration with the West Australian Sleep Disorders
e (WASDRI). WASDRI are interested in investigating this link
between upper body position and sleep apnea events for research and diagnostic
This project aims to develop a device suitable for measuring upper body
position in patients undergoing sleep studies at the WASDRI sleep clinic located at Sir
Charlie Gardner’s hospital.
design of the system needs to follow guidelines set by WASDRI. The first of these
is that the system is compact enough to enable placement on patient
Figure 2: Patient Wired up for a sleep study
shows the limited space currently available on patients. The sensors to be used
must be capable of fitting on the body, without disturbing the movement of the patient.
The guideline given for this project was that sensors to be placed on patients should not
exceed the size of an Australian 50cent coin.
Another issue highlighted by WASDRI was a quick to setup and calibrate system.
Significant amounts of time are already spent setting up the sleep stu
the other sensors, ideally a solution to this problem would be very easy to use and have
The final issue is cost. Although no upper limit is specified, the cheaper option is
preferable to a more expensive one.
The project is a continuation of previous work done by Michael Crocker in 2009
During the course of his investigation he determined that using accelerometers to
This project is undertaken in collaboration with the West Australian Sleep Disorders
e (WASDRI). WASDRI are interested in investigating this link
between upper body position and sleep apnea events for research and diagnostic
aims to develop a device suitable for measuring upper body
eep studies at the WASDRI sleep clinic located at Sir
needs to follow guidelines set by WASDRI. The first of these
is that the system is compact enough to enable placement on patients.
: Patient Wired up for a sleep study
shows the limited space currently available on patients. The sensors to be used
must be capable of fitting on the body, without disturbing the movement of the patient.
project was that sensors to be placed on patients should not
Another issue highlighted by WASDRI was a quick to setup and calibrate system.
Significant amounts of time are already spent setting up the sleep study and calibrating
the other sensors, ideally a solution to this problem would be very easy to use and have
The final issue is cost. Although no upper limit is specified, the cheaper option is
The project is a continuation of previous work done by Michael Crocker in 2009-2010.
During the course of his investigation he determined that using accelerometers to

measure head position was the best approach. The implementation outlined relies up
using two accelerometers as tilt sensors and determining the individual orientation of
each accelerometer. From this, the relative difference
accelerometers can be determined
Figure
As described earlier, the movements of interest to WASDRI are the flexion or extension
of the neck. These are found using the pitch of the
representing a rotation moveme
the accelerometers, as defined by the angle the x and y axis of the accelerometers makes
with the horizontal plane.
The equations to determine the pitch and ro
below. , and
and are proportional to the angle each axis makes with gravity.
9
measure head position was the best approach. The implementation outlined relies up
using two accelerometers as tilt sensors and determining the individual orientation of
each accelerometer. From this, the relative difference in pitch between two
accelerometers can be determined and the flexion or extension of the neck can be found.
Figure 3: Diagram of accelerometer locations on patient
As described earlier, the movements of interest to WASDRI are the flexion or extension
of the neck. These are found using the pitch of the accelerometers, with the roll
representing a rotation movement in the neck. Figure 4 shows the pitch and rotation of
the accelerometers, as defined by the angle the x and y axis of the accelerometers makes
with the horizontal plane.
Figure 4: Diagram of relevant angles
The equations to determine the pitch and rotation angles are given in equations
are the vertical components of the x y and z vectors respectively
and are proportional to the angle each axis makes with gravity.
Accelerometer Positions
measure head position was the best approach. The implementation outlined relies upon
using two accelerometers as tilt sensors and determining the individual orientation of
in pitch between two
the flexion or extension of the neck can be found.
: Diagram of accelerometer locations on patient
As described earlier, the movements of interest to WASDRI are the flexion or extension
, with the roll
nt in the neck. Figure 4 shows the pitch and rotation of
the accelerometers, as defined by the angle the x and y axis of the accelerometers makes
tation angles are given in equations 1 and 2
are the vertical components of the x y and z vectors respectively
Accelerometer Positions
10
� � � ����� ��
� (1)
� � � ����� ��
� (2)
Since pitch is defined relative to ground, rotation will cause the pitch to not be
representative of the angle to the original x-axis. This value relative to ground is not
representative of the flexion or extension in the neck, so the pitch needs to be corrected
for the amount of roll present in the head or chest.
� arcsin � sin pcos Φ�
(3)
Gamma now represents the corrected pitch. With this value, the relative flexion and
extension can be determined in the neck.
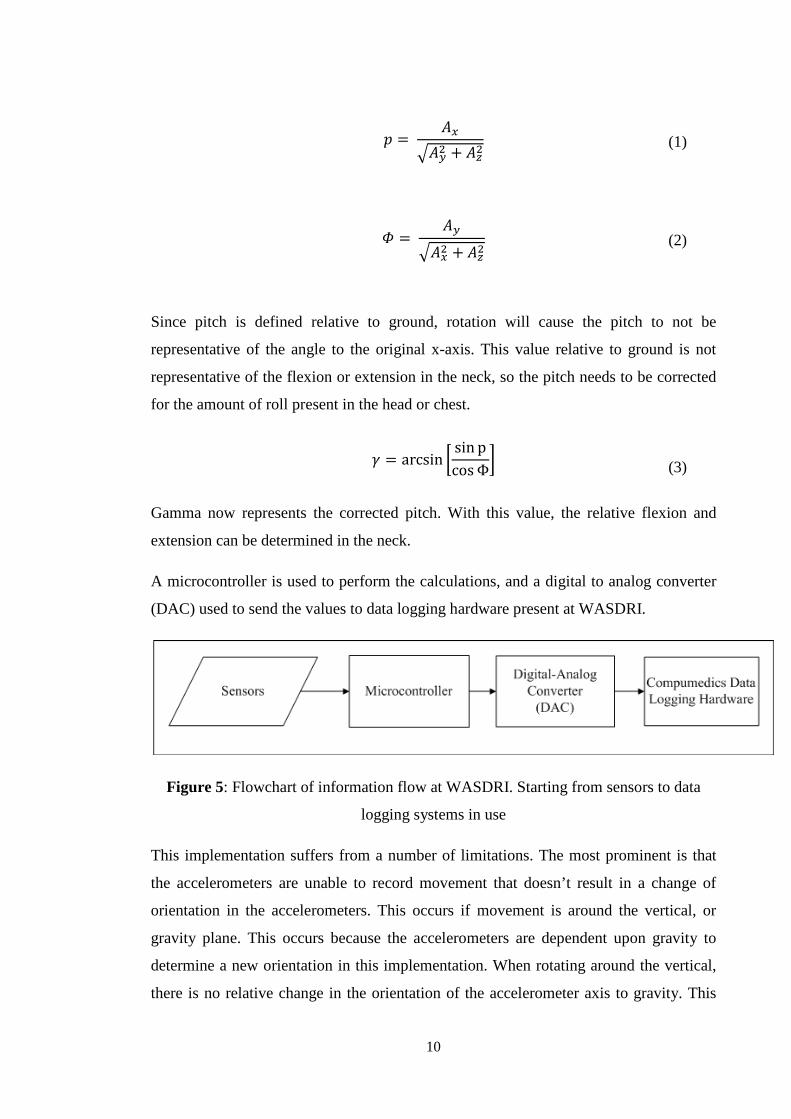
A microcontroller is used to perform the calculations, and a digital to analog converter
(DAC) used to send the values to data logging hardware present at WASDRI.
Figure 5: Flowchart of information flow at WASDRI. Starting from sensors to data
logging systems in use
This implementation suffers from a number of limitations. The most prominent is that
the accelerometers are unable to record movement that doesn’t result in a change of
orientation in the accelerometers. This occurs if movement is around the vertical, or
gravity plane. This occurs because the accelerometers are dependent upon gravity to
determine a new orientation in this implementation. When rotating around the vertical,
there is no relative change in the orientation of the accelerometer axis to gravity. This
effectively means that when the head is rotated at 90 degrees (The patient is lying on
their side) any flexion or extension movement will be
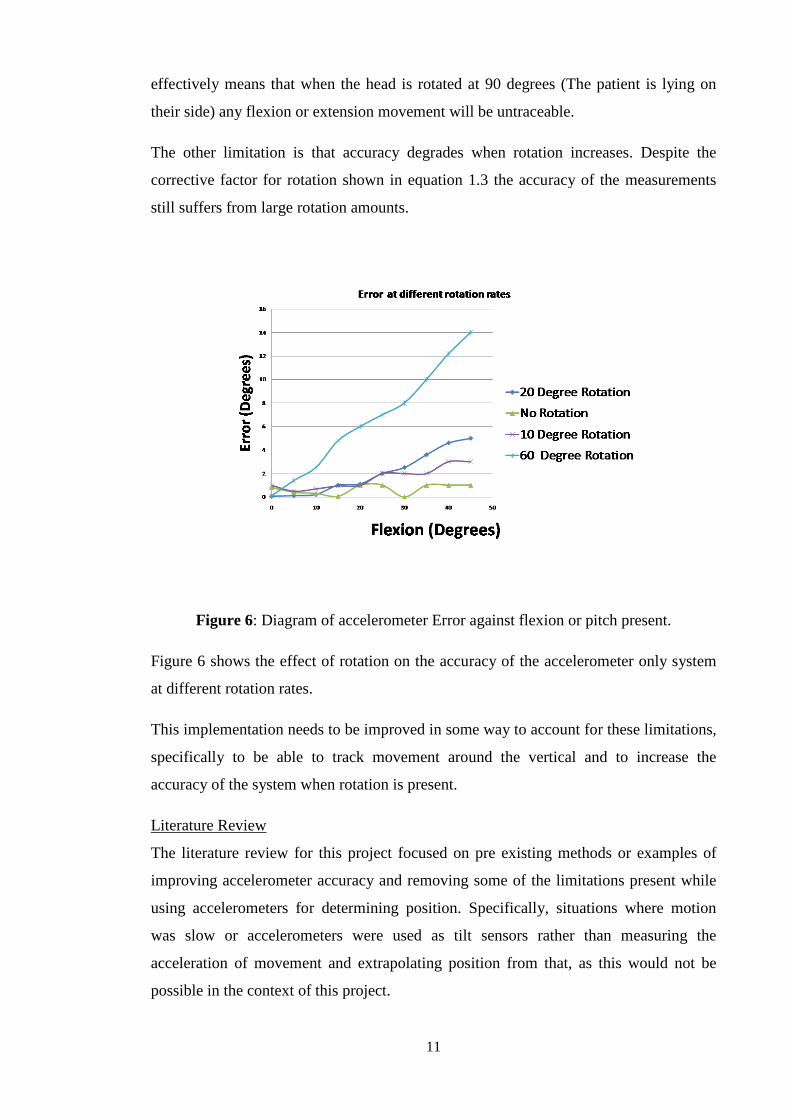
The other limitation is that accuracy degrades when rotation increases. De
corrective factor for rotation shown in equation 1.3 the accuracy of the measurements
still suffers from large rotation amounts.
Figure 6: Diagram
Figure 6 shows the effect of rotation on
at different rotation rates.
This implementation needs to be improved in some way to account for these limitations,
specifically to be able to track movement around the vertical and to increase the
accuracy of the system when rotation is present.
Literature Review
The literature review for this project focused on pre existing methods or examples of
improving accelerometer accuracy and removing some of the limitations present while
using accelerometers for deter
was slow or accelerometers were used as tilt sensors rather than measuring the
acceleration of movement and extrapolating position from that, as this would not be
possible in the context of this projec
11
effectively means that when the head is rotated at 90 degrees (The patient is lying on
their side) any flexion or extension movement will be untraceable.
The other limitation is that accuracy degrades when rotation increases. De
corrective factor for rotation shown in equation 1.3 the accuracy of the measurements
still suffers from large rotation amounts.
Diagram of accelerometer Error against flexion or pitch
shows the effect of rotation on the accuracy of the accelerometer only system
at different rotation rates.
This implementation needs to be improved in some way to account for these limitations,
specifically to be able to track movement around the vertical and to increase the
the system when rotation is present.
The literature review for this project focused on pre existing methods or examples of
improving accelerometer accuracy and removing some of the limitations present while
using accelerometers for determining position. Specifically, situations where motion
was slow or accelerometers were used as tilt sensors rather than measuring the
acceleration of movement and extrapolating position from that, as this would not be
possible in the context of this project.
effectively means that when the head is rotated at 90 degrees (The patient is lying on
.
The other limitation is that accuracy degrades when rotation increases. Despite the
corrective factor for rotation shown in equation 1.3 the accuracy of the measurements
of accelerometer Error against flexion or pitch present.
the accuracy of the accelerometer only system
This implementation needs to be improved in some way to account for these limitations,
specifically to be able to track movement around the vertical and to increase the
The literature review for this project focused on pre existing methods or examples of
improving accelerometer accuracy and removing some of the limitations present while
mining position. Specifically, situations where motion
was slow or accelerometers were used as tilt sensors rather than measuring the
acceleration of movement and extrapolating position from that, as this would not be

12
With the relatively recent advent of miniature sensors, a wide range of work has been
conducted in tracking human motion with accelerometers and other sensors.
To analyse arm orientation during movement, a research team used a sensor system
consisting of accelerometers, gyroscopes and magnetometers(Luinge et al., 2007). The
movements were assumed to contain negligible acceleration, and accelerometers were
used as inclinometers as they are in this project. The use of magnetometers is
interesting, but appears to suffer from a few limitations. The primary one is that any
ferrous materials will interfere with the magnetometers results, as will electrical
activity. In the paper, the system was used in outdoor environments.
However for use in a clinical setting, the common use of ferrous materials in beds,
desks and buildings may render the magnetometers unsuitable for the task. There is also
likely to be significant electrical activity present.
To fuse the magnetometer, gyroscope and accelerometer data a Kalman Filter was
used. The Kalman filter implemented shows much better accuracy then the
accelerometer results. However, even though the error due to gyroscope drift is reduced
compared to the results calculated from gyroscopes alone there is still some drifting of
error. The studies undertaken never exceeded more than an hour, and gyroscope drift
was still a problem(Luinge et al., 2007).
The comparative age of this paper and the subsequent maturation of the technology
should mean that better gyroscopes are available which suffer less drift then the ones
used in this study.
One paper develops a system to track dancers in real time, and record data via a wireless
interface (Aylward and Paradiso). The paper discusses some major issues with
gyroscopes and accelerometers. Primary issues are that determining a change in
orientation with a gyroscope requires integration, and errors are amplified through this
process. Changes in the gyroscope bias, or gyroscope drift, also quickly produce large
orientation errors once integrated.
The movement in this paper includes significant amounts of acceleration, and
accelerometers are not used as inclinometers(Aylward and Paradiso). Instead they are
double integrated to determine displacement from the recorded acceleration. Because of
this, it suffers the same problems with errors and noise being amplified upwards. In the

13
context of this project however, this use of accelerometers is not applicable as there is
no significant acceleration present in the movement of sleeping patients.
The methods of data fusion between accelerometers, and the errors caused by gyroscope
noise and bias drift are applicable. The results show that data fusion can be very
effective at reducing inaccuracies as compared to using one sensor system.
A similar example of using multiple sensors and data fusion to determine the orientation
of body segments was found and in this article the movement is considered to be
without acceleration, that is the acceleration is considered negligible and the
accelerometers are used as inclinometers. This is more applicable to this project then the
previous paper.
In measuring the orientation of various body segments accelerometers were combined
with miniature gyroscopes, and a Kalman filter was used to combine the data (Luinge
and Veltink, 2005). As explored in the previous paper, gyroscope integration and drifts
in gyroscope bias can create large integration errors. By fusing the gyroscope and
accelerometer data with a Kalman filter the gyroscope drift can be accounted for, and
the results shown in the paper show good performance in terms of accuracy and
gyroscope drift. This paper does not deal with rotation around the vertical, and thus a
situation where accelerometer data will be unavailable.
A similar study has been undertaken regarding foot and ankle kinematics (Kwakkel et
al., 2007). This paper is considered highly relevant to this project, as it is set in a similar
environment. As in this project, the sensors must be attached to the body, and thus must
be able to be used comfortable and not restrict the movement of the user.
For these reasons accelerometers and gyroscopes were combined to determine position.
Acceleration is considered to be negligible, and accelerometers are used as
inclinometers. A Kalman filter is once again used to fuse the gyroscope and
accelerometer data (Kwakkel et al., 2007).
The study does not investigate a situation where movement is purely around the vertical
and accelerometer data is not available to determine the orientation of the foot and
ankle. This paper still provided some useful insight into the use of the Kalman Filter in
data fusing, and another example where accelerometers and gyroscopes complement
each other and produce a superior output.

14
Further examples are found of systems combining accelerometer and other sensors
where acceleration is not negligible and thus not representative of the situation found in
this project. One such paper is an investigation of fusing GPS and IMU data with a
Kalman Filter (Caron et al., 2006). The paper is primarily concerned with issues relating
to GPS, and fuzzy logic for determining when certain sensors should be used. Although
GPS is unrelated to this project, the concept of choosing situations where different
sensors should be used is relevant to this project. A similar system for deciding when
accelerometer outputs are not reliable and switching to a method of using only
gyroscopes to determine rotation could be an important method of dealing with
movement around the vertical.
Project Objectives
In this project, accelerometers will be used in conjunction with gyroscopes in the form
of Inertial Measurement Units (IMU’s) to track head movement. A method of data
fusion utilizing the Kalman Filter will be used to combine the two sets of data in areas
where there is no reliable accelerometer data present. In areas where rotation is around
the vertical, and gyroscope data is all that is available, methods to reduce the effect of
gyroscope drift will be investigated.
Unique and novel aspects of this project are the comparatively low rotation rates
compared to what is seen in other applications of IMU’s. Even in cases where
acceleration is negligible and accelerometers are used as inclinometers, the levels of
rotation are higher then what is expected to be seen in a sleeping patient. The length of
the sleep studies is also an important factor that is not investigated in the other
applications of IMU’s found. Sleep studies can go for up to an hour and no recalibration
of the gyroscopes will be possible during this time without waking up the patient.
Project Implications
If this project is successful, and a means of accurately reporting the flexion and
extension present in the neck for the duration of a sleep study, it will be invaluable in
conducting further research in this area, and improve the current understanding of sleep
apnoea causes. This will also aid in the diagnosis and treatment plans for sleep apnoea
patients, improving their health and quality of life.

15
Safety
All practical work for this project has been undertaken in the Sensors and Advanced
Instrumentation Laboratory (SAIL) at UWA, with some testing done at the Sleep Clinic
at WASDRI. Safety guidelines and procedures for this project therefore are the risks and
risk mitigation procedures associated with the laboratory, and the safety implications
and concerns for the designed system when used at WASDRI in clinical trials.
Laboratory Safety
Before permitted to work in SAIL all students must undertake a laboratory safety
induction, covering evacuation and safety procedures. Within the scope of this project,
the equipment used with significant safety implications is the soldering iron, and press
drill. Some chemicals were also used in the scope of this project, but are considered a
safe material. None the less the Material Safety Data Sheet was consulted and
procedures followed. To minimize the risk of eye injury while using the soldering iron,
protective eyewear must always be used while it is operating. Protective eyewear must
also be used while using the press drill in case of flying projectiles.
The laboratory has a number of general safety procedures that must be followed. No
student is allowed to work in the laboratory after hours if no one else is present to
render assistance in the event of an accident. Covered footwear is also required at all
times in the laboratory to reduce the risk of injury from falling objects.
16
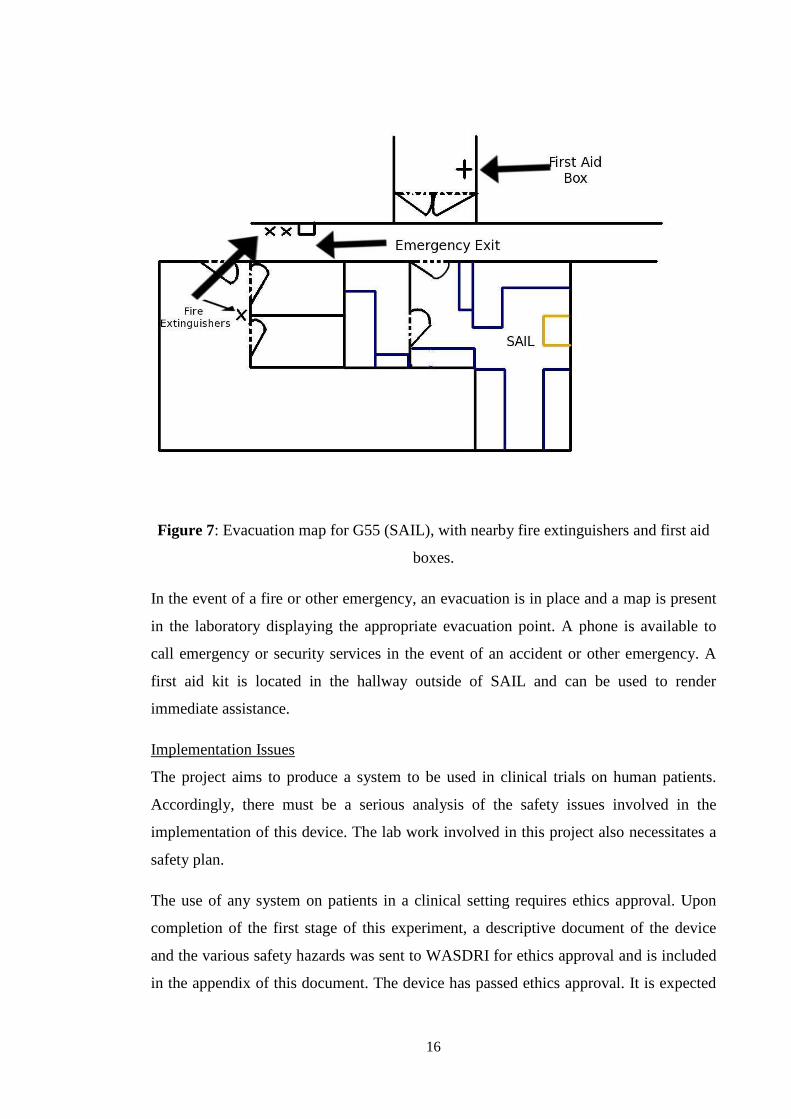
Figure 7: Evacuation map for G55 (SAIL), with nearby fire extinguishers and first aid
boxes.
In the event of a fire or other emergency, an evacuation is in place and a map is present
in the laboratory displaying the appropriate evacuation point. A phone is available to
call emergency or security services in the event of an accident or other emergency. A
first aid kit is located in the hallway outside of SAIL and can be used to render
immediate assistance.
Implementation Issues
The project aims to produce a system to be used in clinical trials on human patients.
Accordingly, there must be a serious analysis of the safety issues involved in the
implementation of this device. The lab work involved in this project also necessitates a
safety plan.
The use of any system on patients in a clinical setting requires ethics approval. Upon
completion of the first stage of this experiment, a descriptive document of the device
and the various safety hazards was sent to WASDRI for ethics approval and is included
in the appendix of this document. The device has passed ethics approval. It is expected

17
that since the improved design with IMU’s is of similar size and characteristics it will
also pass ethics approval.
The primary hazards associated with attaching sensors to sleep patients are strangulation
due to wires and cords, and electrical shocks. Miniature sensors are very low power
devices, and operate at 3.3V. The sensors are also enclosed in a non-conductive
silicone, so electrical shock is highly unlikely. Cords are the minimum length necessary,
and are subject to wire management systems already in place for other sensors and
devices at the sleep clinic.
State of Received Project
The material received consisted of a box containing accelerometers, a digital-analog
converter and some experimental vector boards and PCB’s. The code received allowed
for calculation of the orientation of one accelerometer, and the ability to send this value
to a DAC to enable data logging with WASDRI hardware.
Extending code to calculate relative angles
The accelerometer design relies upon using 2 accelerometers and calculating the relative
angle between the two of them. The code received only used 1 accelerometer for this
calculation. The code was extended to calculate the orientation of both accelerometers
using the equations outlined in the Thesis paper. Once the pitch of both accelerometers
is known, the program finds the difference between the two giving the relative angle
between two accelerometers. A copy of the completed code can be found in the
appendix.
Ruggedizing Accelerometers
To be used in practise, the accelerometers need to be enclosed in a protective material.
The material chosen for this needed to be durable, suitable for use with circuitry, non
toxic and able to be cleaned with methods in use at WASDRI. The silicone based
material Polydimethylsiloxane (PDMS) was used as it exhibits all of these
characteristics, and is able to be cleaned with rubbing alcohol used at the hospital for
sanitizing other equipment. To adequately enclose the accelerometers while keeping the
overall size of the sensors small plastic moulds were created, and the accelerometers
18
placed in these. The PDMS was mixed according to the data sheets, with a mix of
10parts PDMS to 1 part curing agent.
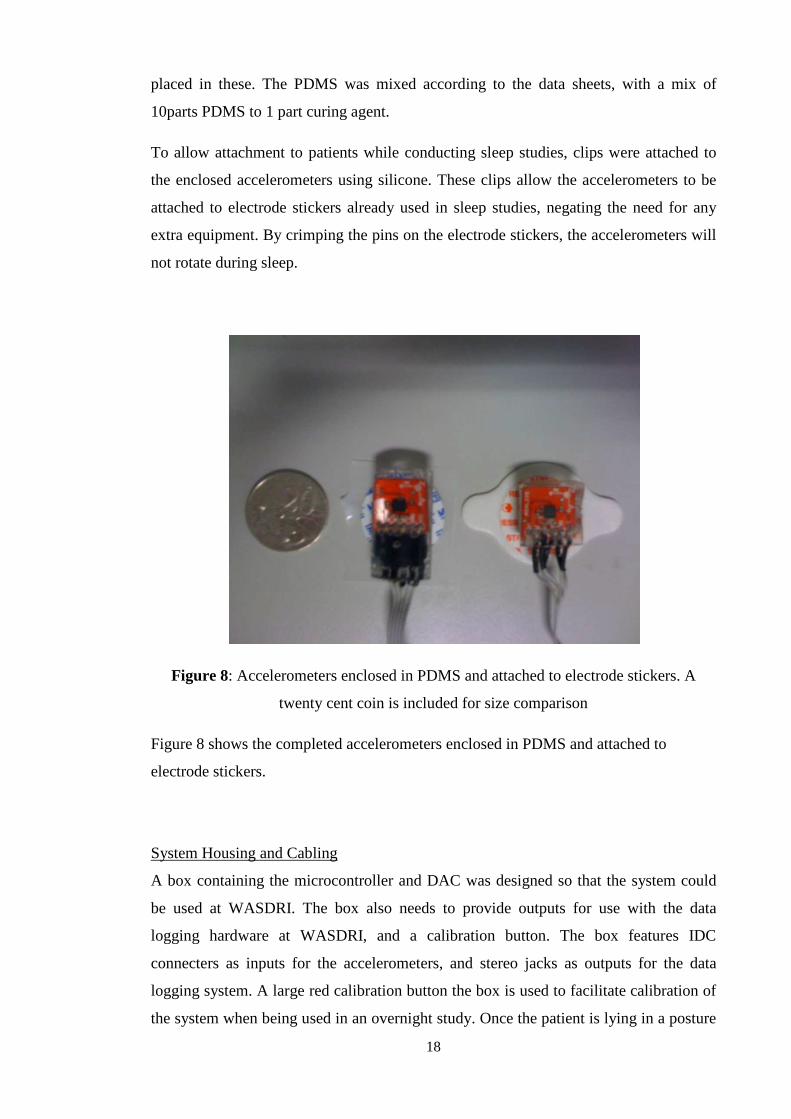
To allow attachment to patients while conducting sleep studies, clips were attached to
the enclosed accelerometers using silicone. These clips allow the accelerometers to be
attached to electrode stickers already used in sleep studies, negating the need for any
extra equipment. By crimping the pins on the electrode stickers, the accelerometers will
not rotate during sleep.
Figure 8: Accelerometers enclosed in PDMS and attached to electrode stickers. A
twenty cent coin is included for size comparison
Figure 8 shows the completed accelerometers enclosed in PDMS and attached to
electrode stickers.
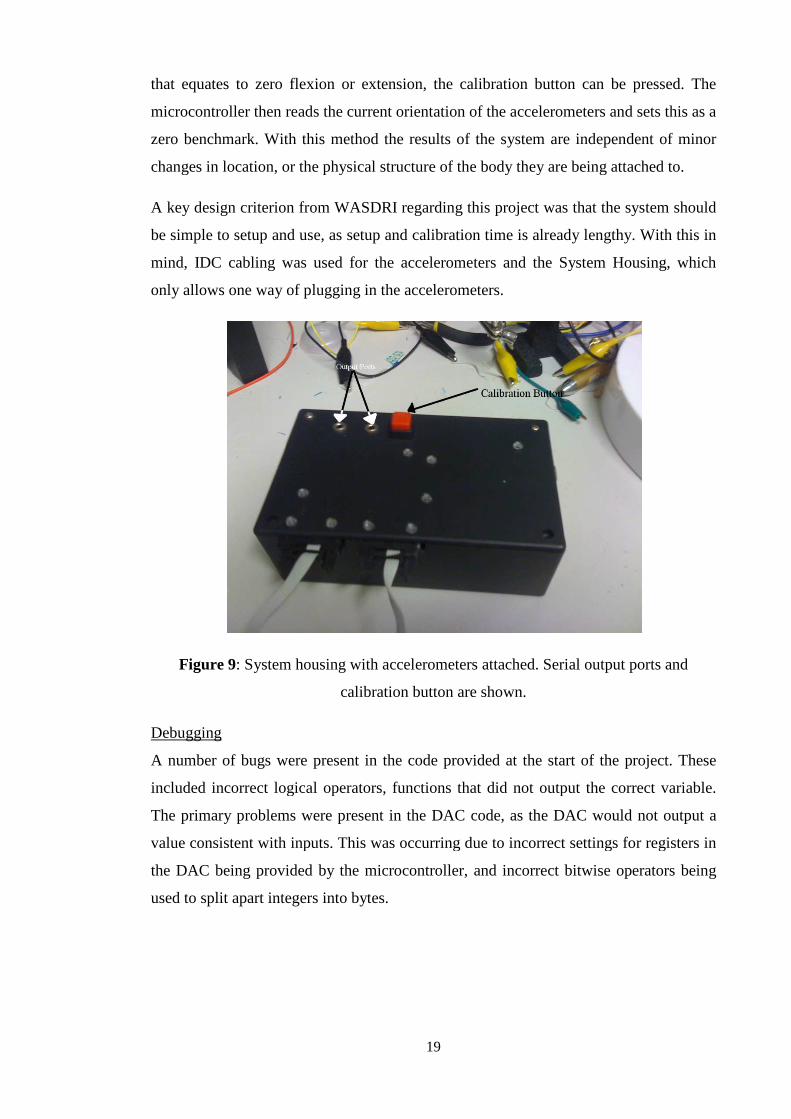
System Housing and Cabling
A box containing the microcontroller and DAC was designed so that the system could
be used at WASDRI. The box also needs to provide outputs for use with the data
logging hardware at WASDRI, and a calibration button. The box features IDC
connecters as inputs for the accelerometers, and stereo jacks as outputs for the data
logging system. A large red calibration button the box is used to facilitate calibration of
the system when being used in an overnight study. Once the patient is lying in a posture
that equates to zero flexion or extension, the calibration button can be pressed. The
microcontroller then reads the current orientation of the accelerometers and sets this as a
zero benchmark. With this method the results of the system are independent
changes in location, or the physical structure of the body they are being attached to.
A key design criterion from WASDRI regarding this project was that the system should
be simple to setup and use, as setup and calibration time is already length
mind, IDC cabling was used for the accelerometers and the System Housing, which
only allows one way of plugging in the accelerometers.
Figure 9: System housing with accelerometers attached.
Debugging
A number of bugs were present in the code provided at the start of the project. These
included incorrect logical operators, functions that did not output the correct variable.
The primary problems were present in the DAC code, as the DAC wo
value consistent with inputs. This was occurring due to incorrect settings for registers in
the DAC being provided by the microcontroller, and incorrect bitwise operators being
used to split apart integers into bytes.
19
that equates to zero flexion or extension, the calibration button can be pressed. The
microcontroller then reads the current orientation of the accelerometers and sets this as a
zero benchmark. With this method the results of the system are independent
changes in location, or the physical structure of the body they are being attached to.
A key design criterion from WASDRI regarding this project was that the system should
be simple to setup and use, as setup and calibration time is already length
mind, IDC cabling was used for the accelerometers and the System Housing, which
only allows one way of plugging in the accelerometers.
System housing with accelerometers attached. Serial output ports and
calibration button are shown.
A number of bugs were present in the code provided at the start of the project. These
included incorrect logical operators, functions that did not output the correct variable.
The primary problems were present in the DAC code, as the DAC wo
value consistent with inputs. This was occurring due to incorrect settings for registers in
the DAC being provided by the microcontroller, and incorrect bitwise operators being
used to split apart integers into bytes.
that equates to zero flexion or extension, the calibration button can be pressed. The
microcontroller then reads the current orientation of the accelerometers and sets this as a
zero benchmark. With this method the results of the system are independent of minor
changes in location, or the physical structure of the body they are being attached to.
A key design criterion from WASDRI regarding this project was that the system should
be simple to setup and use, as setup and calibration time is already lengthy. With this in
mind, IDC cabling was used for the accelerometers and the System Housing, which
Serial output ports and
A number of bugs were present in the code provided at the start of the project. These
included incorrect logical operators, functions that did not output the correct variable.
The primary problems were present in the DAC code, as the DAC would not output a
value consistent with inputs. This was occurring due to incorrect settings for registers in
the DAC being provided by the microcontroller, and incorrect bitwise operators being

20
Design Process
Amplification of gyroscope outputs
The applications for this project require detection of very low rotation rates which are
expected to be seen in the movement of a sleep patient. The degree of rotation expected
to be observed is in the order of 0.3 degrees per second. There is also the possibility of
faster movement from jerking the head during sleep, the upper threshold of this
movement has been estimated at around 130 degrees per second.
The IDG500 gyroscope used in this project offers two different sensitivity outputs. In
both modes it consists of a DC bias voltage or Zero-Rate Output (ZRO) of 1.35V. The
rotation signal is centred on this bias, and has a sensitivity of 2.1mV/degree/second or
9.2 mV/degree/second depending on the output mode of the gyroscope.
The internal ADC of the microcontroller operates with a reference of 5V and has 10-bit
resolution. This translates to a resolution of 4.9mV per unit. To fully utilize the ADC,
the gyroscope signal must be conditioned in such a way that the ZRO is in the centre of
the ADC range, and amplified to capture both the minimum and maximum rotation
rates expected to be observed in a sleep patient.
Output mode of IDG500
Output Sensitivity (mV/Degree/Second)
Output Range (Degrees/second)
Resolution available to microcontroller (Degrees/Second/Unit)
Normal 2.1 +/- 500 2.3 Internally Amplifier
9.2 +/-110 0.53
Table 1: Comparison of gyroscope output modes
Table 1 shows the characteristics of both output modes in an unamplified state. The
resolution available to the microcontroller after conversion by the ADC is shown to the
right. This is calculated as shown in equation 4
� � 4.9��
(4)
Where R and �� are the post ADC resolution and gyroscope sensitivity respectively.

21
Both of the inbuilt output modes are insufficient for this project. The normal output
mode has a sufficient output range, but the resolution post DAC is not enough to
capture the low rotation rates expected in this project. The internally amplified output
also has an insufficient output resolution, and the full scale range is not quite enough to
capture faster motions expected.
To increase the range and resolution of the system, the gyroscope outputs need to be
amplified. This allows the microcontroller to use the full range of the internal Analog to
Digital Converter (ADC) and increases the levels of rotation able to be detected using
the ADC.
Given the guidelines for rotation rates found previously the gain for the amplification
circuit is designed to be 8.5. With this gain and corresponding bias shift the resulting
signal will have the characteristics shown in table 2
Output mode of IDG500
Output Sensitivity (mV/Degree/Second)
Output Range (Degrees/second)
Resolution available to microcontroller (Degrees/Second/Unit)
Normal 2.1 +/- 500 2.3 Internally Amplifier
9.2 +/-110 0.53
Amplification Circuit
17.9 +/-140 0.27
Table 2: Gyroscope output modes including design of amplification circuits.
The new resolution is calculated using equation 1 shown on the previous page. The
output range is calculated using the new DC bias of 2.5V and the range of the
microcontroller ADC and is given by equation 5.
� � 250017.9 (5)
Where � is the resulting output range of the signal.
This process will consist of three stages – subtracting the original ZRO from the signal,
amplifying the resultant AC rotation signal, and integrating a new ZRO with the
rotation signal.

22
Figure 10: Flowchart of required signal operations.
Key design criteria for this process involve the accuracy of the output. The voltage
reference to create the new ZRO must be highly accurate and not drift, as changes in
this drift will quickly multiply through the integration stage in determining position.
The gain applied to the rotation signal must be steady, as shifts in this will also quickly
increase the error in the overall calculated position due to the cumulative effects of
integration error.
A two stage circuit was then designed to accomplish this task. The first two steps of the
signal conditioning were to be achieved using a differential amplifier, with a summing
amplifier design for the last stage of the process.
Circuit Design
The design of the circuit centred on using two operational amplifiers and a voltage
reference to appropriately condition the gyroscope signal. A differential amplifier and a
voltage reference equal to the ZRO of the gyroscope signal could be used to eliminate
the ZRO of the signal, and a suitable gain used to scale the signal appropriately. An
operational amplifier setup as a voltage summer could then be used to re-integrate a new
ZRO into the signal.

23
Figure11: Schematic of basic circuit design
Care was taken in the design of the second section of the circuit shown in figure 11 to
eliminate the effects of bias currents present in amplifier two. To mitigate the effects of
the bias currents, they were modelled in the circuit as two current sources present at the
inputs of the amplifier as shown in Figure 12.
Figure 12: Bias Current and Input Bias Current Models

24
The effect of the bias current on the output &' modelled by ()* is then found by
&' � +,()* + �- (6)
The effect of bias current (). on the output &' is determined by:
&' � (). /�02 1 /1 �
�21 (7)
By combing these two equations the total effect of bias currents on the output &'can be
found as:
&' � +,()* + �- (). /�02 1 /1 �
�21 (8)
By choosing resistors such that �2 � � � �0the effect of the bias currents can be
found to be:
&' � ().� + ()*� (9)
With this configuration it can be seen that if the bias currents are equivalent, then they
will cancel out and there will be no net effect on the voltage output. With this
configuration, the only error is caused by the input offset current, which is the
difference between the two input bias currents.
It can be seen from equation 9 that the effect of the offset current, (' on the voltage
output will be found by:
&' � ('� (10)
A second source of error in the second amplifier is one caused by an offset voltage. An
offset voltage is a voltage difference between the positive and negative inputs of the
amplifier. This can be modelled as a voltage source on either amplifier input, but
analysis is simplified by applying it to the inverting terminal of the amplifier.
This voltage difference &'33will be amplified through the gain of the circuit. As the
summing amplifier has an inbuilt gain of 2 the effect of &'33 on &' is given by equation
12.
&' � 2&'33 (12)

25
Amplifier Selection
The differential amplifier used for the first stage of the amplification is the instrumentation amplifier INA125P by Texas Instruments. This component was deemed suitable for the task as it was already available within the SAIL laboratory and it offers excellent characteristics: Gain accuracy is within ± 0.03%; maximum input bias current of 25 nA; maximum input offset current of ± 2.5 nA and maximum offset voltage of 250µV.
The second amplifier used for the summing section of the circuit is the LF412 amplifier.
The original component used was the LM741 amplifier, but the errors resulting from the
voltage bias and voltage offset were deemed too large to be used. Using equations 6 and
5, the magnitude of errors caused by the amplifier can be determined and is shown in
table 3.
Amplifier Error from Voff(Max)
Error from Io(Max)
Combined error (Max)
Error (Deg/s)
LM741 12mV 0.2mV 12.2mV 0.683 LF412 1mV 100 nV ~ 1mV 0.05 Table 3: Errors caused by amplifiers, and the maximum combined error in terms of mV
and Degrees per second.
The error in terms of degrees per second is calculated according to equation 13
45 � ��467
(13)
Where Ed is the error in terms of degrees per second, Gs is the gyroscope sensitivity
post amplification circuit shown in table 2 and 467 is the maximum combined error in
mV of found in table 3.
The overall error caused by the LF412 amplifier with 1kOhm resistors is considered
acceptable for this design.
Noise analysis
The noise introduced by the amplification circuit needed to be investigated. Given the
need to capture small rotation rates, the level of noise needed to be reduced and known
as too high of a signal to noise ratio would make it challenging to extract slow rotation
information from the gyroscopes.
The primary purpose of the investigation is to locate sources of noise and potential ways
to eliminate these from the system. To analyse the noise, the completed amplification
circuit output was connected to an oscilloscope, and the oscilloscopes Fast-Fourier

26
transform (FFT) function used to identify frequencies at which high noise is present. By
altering different factors in the circuit the extent of noise due to different components
could be analysed.
The system variables changed in this investigation are: Wiring system; electro-magnetic
(EM) shielding, resistor values; Power supply, interference from external power cables;
relative gain of the instrumentation amplifier and different operational amplifiers used
in the summing stage of the circuit.
To investigate the effect of external interference on the circuit two things were done.
Signal cables were coupled with grounded wires to ensure that any interference would
not affect the signal and grounded aluminium foil was used to enclose the circuit during
testing to eliminate background interference.
The results of these tests can be seen in Figure 13 over page. The first graph shows the
noise characteristics of the unaltered circuit. The second image shows the results when
using smaller resistors. The original circuit used 200kOhm resistors; these were
changed for 1kOhm resistors. The graph shows a significant decrease in noise across the
spectrum analysed with the greatest effect being seen in the low frequency regions
below 150Hz.
The third graph shows the FFT results of a shielded circuit. In this experiment the
circuit was enclosed in grounded aluminium and the signal wires coupled with
grounded wires to eliminate interference between the different signals. This again shows
an improvement over the unaltered circuit.

Figure 13: FFT results of original circuit (Top), Circuit with smaller resistor values
(Middle) and the shielded circuit (Bottom). Note that in all cases the vertical scale is
27
: FFT results of original circuit (Top), Circuit with smaller resistor values
le) and the shielded circuit (Bottom). Note that in all cases the vertical scale is
offset by 50 dBV.
: FFT results of original circuit (Top), Circuit with smaller resistor values
le) and the shielded circuit (Bottom). Note that in all cases the vertical scale is

28
The prototype circuit was implemented on a breadboard, when moved to a PCB for
application the external interference should be minimized. Following this investigation
the resistors for the summing stage of the circuit were changed from 200kOhms to
1kOhms to utilize the reduction in noise, and all signal wires were coupled with
grounded wires.
Sensor Fusion
The Kalman Filter
The Kalman filter is a state estimation system used to combine multiple sources of data
that contain noise or error. Within the scope of this project it will be used to combine
accelerometer and gyroscope information. The benefit of the Kalman Filter is its ability
to produce an output that generally has less error than the input values (Welch and
Bishop, 2006). The filter consists of a continual predict/update cycle.
The Kalman filter uses a dynamic model of the system to predict the next state of the
system, and a measurement to compare this estimate to.
89.2 � �89 :;9 (14)
<9 � =89 >9 (15)
Equation 7 represents the basic form of the model used. The matrix x represents the
state of the system; k is a time variable. The matrices A and B represent the model of
the system, while u is the data used to estimate the state of the system. The last piece of
this equation is the matrix w, which consists of the noise present in the process – due to
both noise in the input signal u and noise in the process that is being modelled.
Equation 8 is the measurement side of the filter. The variable y is the state of the system
as measured by a different source of information the u. The matrix z represents the error
that is expected to be seen in this measurement, and C is a matrix to relate the measured
value to the variables present in the system state x.
The Kalman filter used in this project consists of the following equations:

29
?9 � �@9=A,[email protected]=A B�-*2 (16)
8C9.2 � ,�8C9.2 :;9- ?9,<9.2 + =8C9- (17)
?9 � �@9�A BD + �@9=AB�*2=@9�A (18)
Equations 16, 17 and 18 form the basis of the measurement and prediction cycle of the
Kalman filter. The variables B� and BD are matrices containing the covariance of the
process and measurement phases of the model derived from w and k respectively.
P is the system covariance, and is formed with the process and measurement covariance
matrices. The variable K is known as the Kalman gain and is used as a weighting for
combining the measured state of the system and the estimated state of the system.
In the prediction cycle of the filter the state is updated according to equation 7, and the
covariance P is updated according to equation 11. The measurement cycle then
computes the Kalman gain shown in equation 9 and uses this to combine the predicted
state and measured state as shown in equation 10. The covariance P is then updated
again. This process is shown graphically in figure 16.
Figure 14: Graphical representation of Kalman filter showing the predict and update
cycle
Time Update (“Predict”)
1. Predict Next State (Eq. 7)
2. Project Error Covariance (Eq. 11)
Measurement Update (“Correct”)
1. Compute Kalman Gain (Eq. 9)
2. Update estimate (Eq. 10)
3. Update error covariance (Eq. 11)

30
System model
To apply the Kalman filter to this project, a model of the system needed to be
constructed. In the model, the accelerometer calculated angle would form the
measurement in the filter. The input to the system is then the rate output of the
gyroscope, and needs to be manipulated to determine a change in orientation.
The system state x consists of the current pitch present in the IMU and the estimated
bias of the gyroscope output. This allows the filter to compensate for gyroscopic drift by
changing the value of bias present in the state of the system.
The measurement <9 is the accelerometer determined level of pitch in the IMU. The
rotation rate reported by the gyroscopes needs to be converted to a level of angular
rotation for use in the system state x. This is done by multiplying the output of the
gyroscopes by a timestep dt which is equal to the time between gyroscope samples.
The equation to translate rotation rate and bias to a change in rotation is given below:
E9.2 � E9 ,;9 + FGHI-JK
(19)
With reference to equation 7 the matrices A and B are defined as follows to model this
relationship
8 � L EFGHIM
(20)
� � L1 +JK0 1 M
(21)
: � LJK0 M
(22)
31
As the error present in the accelerometer based measurement is not constant, the error
needs to be adjusted depending upon the rotation present in the system. In each iteration
of the filter the error covariance of the measurement B� is updated to compensate for the
changing error present in the accelerometers.
Filter Requirements
The Kalman filter requires that all noise in the system be independent and random. That
is the noise in the gyroscope should be independent of the noise in the accelerometer,
and noise should be randomly distributed and form a normal distribution. The
distributions of these sources of noise also need to be known for setting up the error
covariance matrices for the Kalman filter.
The noise in the bias of the gyroscope was found by leaving the gyroscope stationary
for a period of 12 hours, and digitally low passed filtered to 1Hz. To determine the
gyroscope noise distribution, the gyroscopes were left stationary or left at a constant
rotation and the variance around this recorded. The noise distributions for both bias and
gyroscope were found to be random and follow a normal distribution.
The variance found in the bias was subtracted from the overall variance found in the
gyroscope signal to determine the variance present in the gyroscope signal itself.
The filter was implemented in MATLAB for ease of analysis. Using the equations laid
out above collected data was entered as a matrix in MATLAB and then used as inputs to
the Kalman filter.
Combining Accelerometer and non-Accelerometer regions
In situations where accelerometer data is unavailable the Kalman filter can no longer be
used, and the gyroscopes must determine a change in rotation until accelerometer data is
available again.
When a high degree of roll is detected, the current estimated gyroscope bias in the
system and the current pitch is used as a starting point for the gyroscope only detection
of orientation. When rotation returns to a point where accelerometer data is available,
the current estimated pitch is returned to the Kalman filter to act as the initial estimate
for the filter.
32
Data Collection
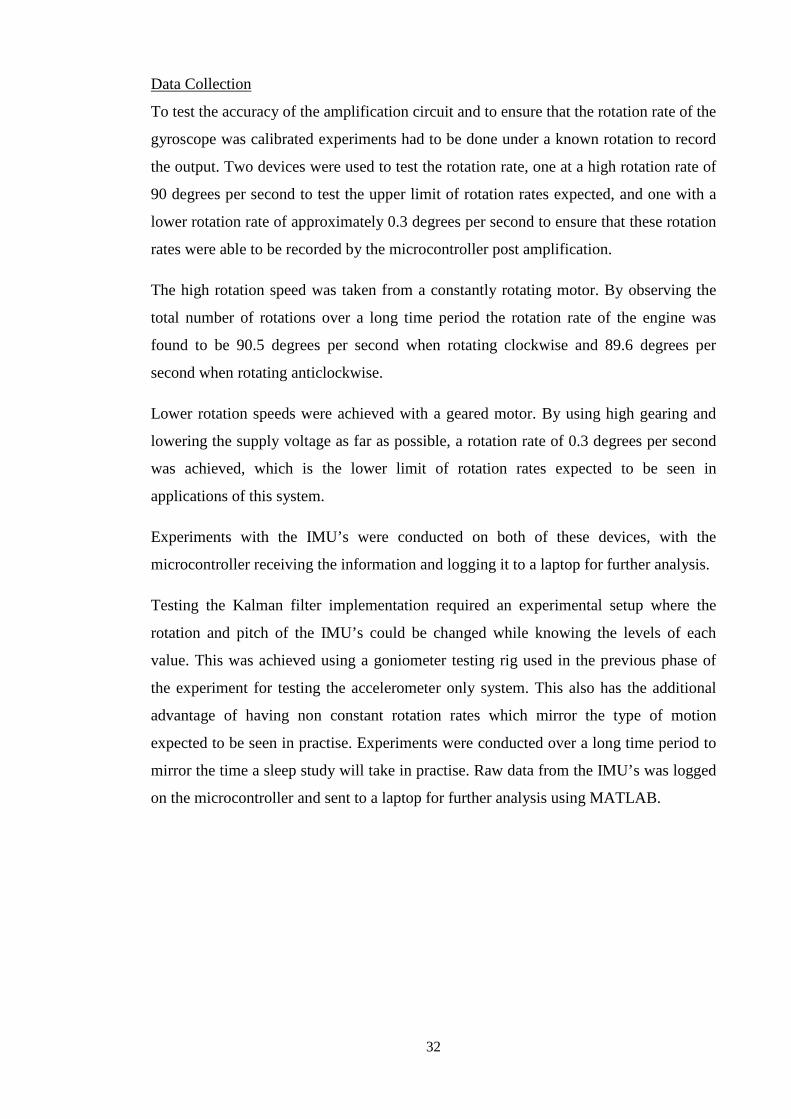
To test the accuracy of the amplification circuit and to ensure that the rotation rate of the
gyroscope was calibrated experiments had to be done under a known rotation to record
the output. Two devices were used to test the rotation rate, one at a high rotation rate of
90 degrees per second to test the upper limit of rotation rates expected, and one with a
lower rotation rate of approximately 0.3 degrees per second to ensure that these rotation
rates were able to be recorded by the microcontroller post amplification.
The high rotation speed was taken from a constantly rotating motor. By observing the
total number of rotations over a long time period the rotation rate of the engine was
found to be 90.5 degrees per second when rotating clockwise and 89.6 degrees per
second when rotating anticlockwise.
Lower rotation speeds were achieved with a geared motor. By using high gearing and
lowering the supply voltage as far as possible, a rotation rate of 0.3 degrees per second
was achieved, which is the lower limit of rotation rates expected to be seen in
applications of this system.
Experiments with the IMU’s were conducted on both of these devices, with the
microcontroller receiving the information and logging it to a laptop for further analysis.
Testing the Kalman filter implementation required an experimental setup where the
rotation and pitch of the IMU’s could be changed while knowing the levels of each
value. This was achieved using a goniometer testing rig used in the previous phase of
the experiment for testing the accelerometer only system. This also has the additional
advantage of having non constant rotation rates which mirror the type of motion
expected to be seen in practise. Experiments were conducted over a long time period to
mirror the time a sleep study will take in practise. Raw data from the IMU’s was logged
on the microcontroller and sent to a laptop for further analysis using MATLAB.
33
Results
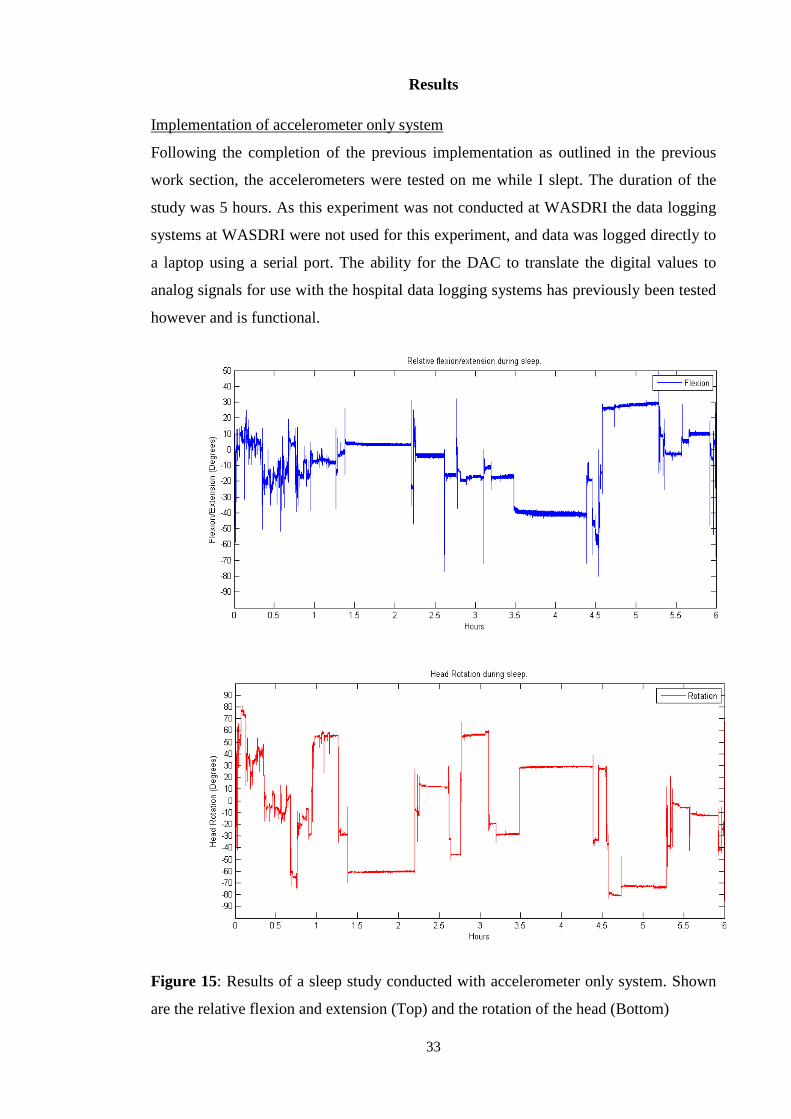
Implementation of accelerometer only system
Following the completion of the previous implementation as outlined in the previous
work section, the accelerometers were tested on me while I slept. The duration of the
study was 5 hours. As this experiment was not conducted at WASDRI the data logging
systems at WASDRI were not used for this experiment, and data was logged directly to
a laptop using a serial port. The ability for the DAC to translate the digital values to
analog signals for use with the hospital data logging systems has previously been tested
however and is functional.
Figure 15: Results of a sleep study conducted with accelerometer only system. Shown
are the relative flexion and extension (Top) and the rotation of the head (Bottom)
34
During the sleep study shown in figure 15 there are areas where the results should not
be considered accurate. In the time period of 4.5 to 5.5 hours, the head rotation stays at
around 80 degrees. As shown earlier, the accelerometer system in this situation cannot
be considered accurate. The same also holds true for other high rotation areas seen in
the figures. These areas constitute a large portion of the study and illustrate the need for
a combined system to increase the accuracy of the measurement in high rotation areas.
Amplification Circuit
As outlined in the design approach section, a gain of 8.5 is used in the circuit. The
design of the amplification circuit however can be altered by simply changing the gain
set in the instrumentation amplifier, if the range of motion needs to be revised upon
testing in a sleep study.
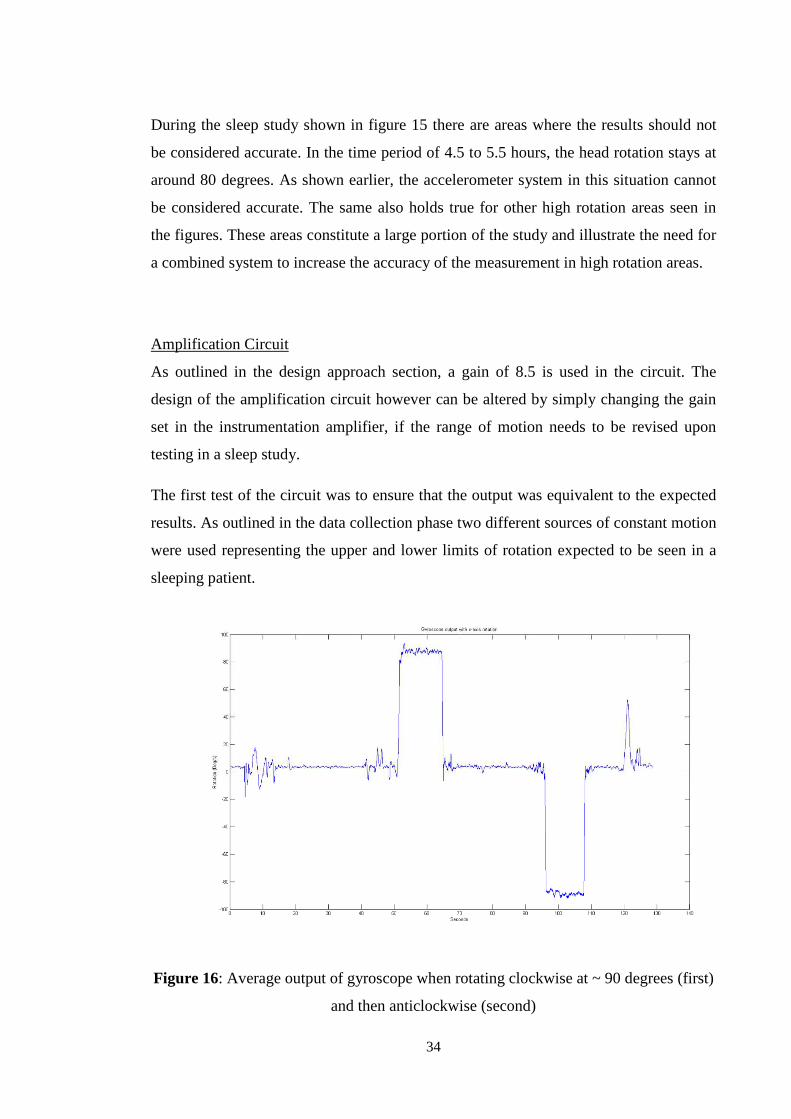
The first test of the circuit was to ensure that the output was equivalent to the expected
results. As outlined in the data collection phase two different sources of constant motion
were used representing the upper and lower limits of rotation expected to be seen in a
sleeping patient.
Figure 16: Average output of gyroscope when rotating clockwise at ~ 90 degrees (first)
and then anticlockwise (second)
35
Figure 16 shows testing results with a rotation rate of approximately 90 degrees per
second. The actual rotation rate was found by recording the number of revolutions over
a large time period to find the average rotation rate.
The actual rotation rate was calculated to be 90.1 degrees clockwise and 89.3 degrees
anticlockwise. The average value of the gyroscope output in the rotating regions are
90.6 degrees per second clockwise, and 90 degrees per second anticlockwise. This is
considered an accurate result, there are large jitters present in the rotation rate but these
may be caused by non-constant rotation of the engine itself.
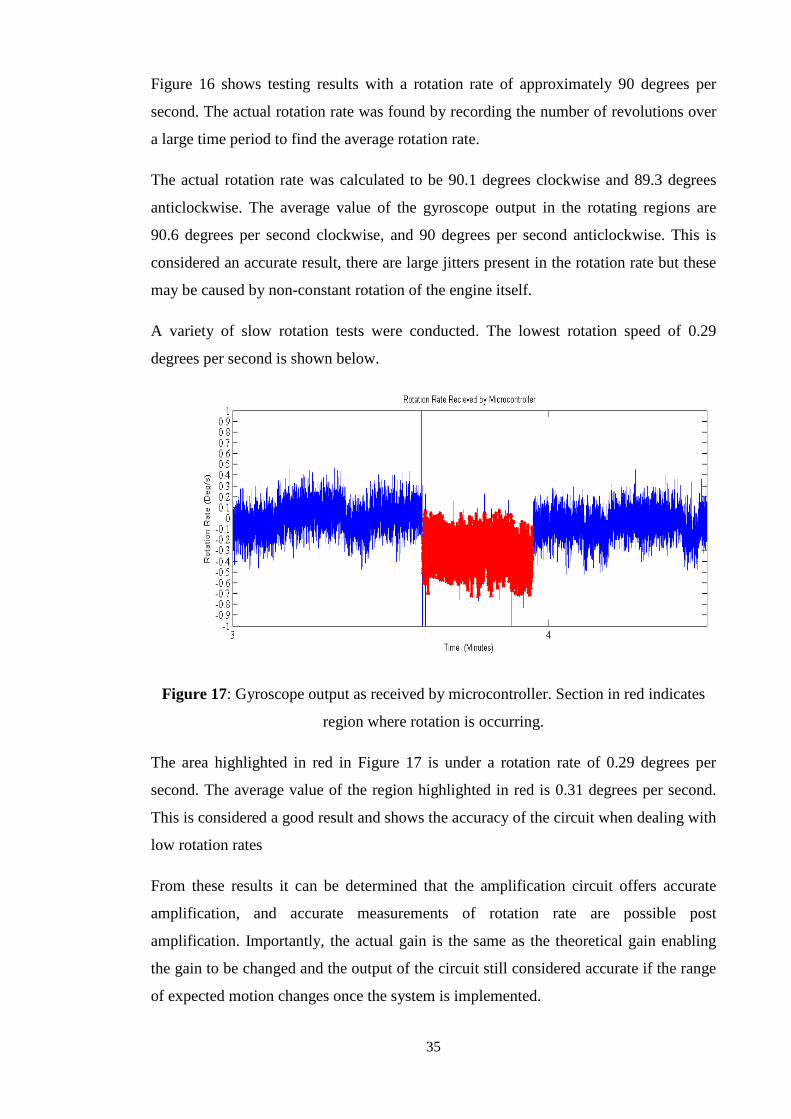
A variety of slow rotation tests were conducted. The lowest rotation speed of 0.29
degrees per second is shown below.
Figure 17: Gyroscope output as received by microcontroller. Section in red indicates
region where rotation is occurring.
The area highlighted in red in Figure 17 is under a rotation rate of 0.29 degrees per
second. The average value of the region highlighted in red is 0.31 degrees per second.
This is considered a good result and shows the accuracy of the circuit when dealing with
low rotation rates
From these results it can be determined that the amplification circuit offers accurate
amplification, and accurate measurements of rotation rate are possible post
amplification. Importantly, the actual gain is the same as the theoretical gain enabling
the gain to be changed and the output of the circuit still considered accurate if the range
of expected motion changes once the system is implemented.
Data Fusion
Data gathered using the goniometer testing rig was used to test the sensor fu
methods outlined in the design section.
the effectiveness of the filter and combined gyroscope and accelerometer system, and
regions of high rotation were of special interest as it is these areas where the accuracy
needs to be improved.
Figure 18: Output of Kalman filter. The estimated pitch is shown in b
Figure 18 shows an experiment using the Kalman Filter. In the high rotation region the
IMU is rotated to 70 degrees, and the pitch increas
steps of 5. The final ou
ideal but it is more accurate then the accelerometer only output at this rotation level.
Another experiment was undertaken using a full range of rotation levels from 0 degrees
to 90 degrees to test the ability of the design to switch from the Kalman filter to
gyroscope only measurements when no accelerometer data is available. The data
presented here occurs at the end of a 6 hour experiment to mirror the effects of the
clinical environment.
36
Data gathered using the goniometer testing rig was used to test the sensor fu
methods outlined in the design section. A large number of experiments were done to test
the filter and combined gyroscope and accelerometer system, and
regions of high rotation were of special interest as it is these areas where the accuracy
needs to be improved.
: Output of Kalman filter. The estimated pitch is shown in b
estimated gyroscope bias is shown in green.
shows an experiment using the Kalman Filter. In the high rotation region the
0 degrees, and the pitch increased from 0 degrees to 50 degrees in
steps of 5. The final output of the filter shows an overshoot of 2.5 degrees. This is not
ideal but it is more accurate then the accelerometer only output at this rotation level.
Another experiment was undertaken using a full range of rotation levels from 0 degrees
to test the ability of the design to switch from the Kalman filter to
gyroscope only measurements when no accelerometer data is available. The data
presented here occurs at the end of a 6 hour experiment to mirror the effects of the
clinical environment.
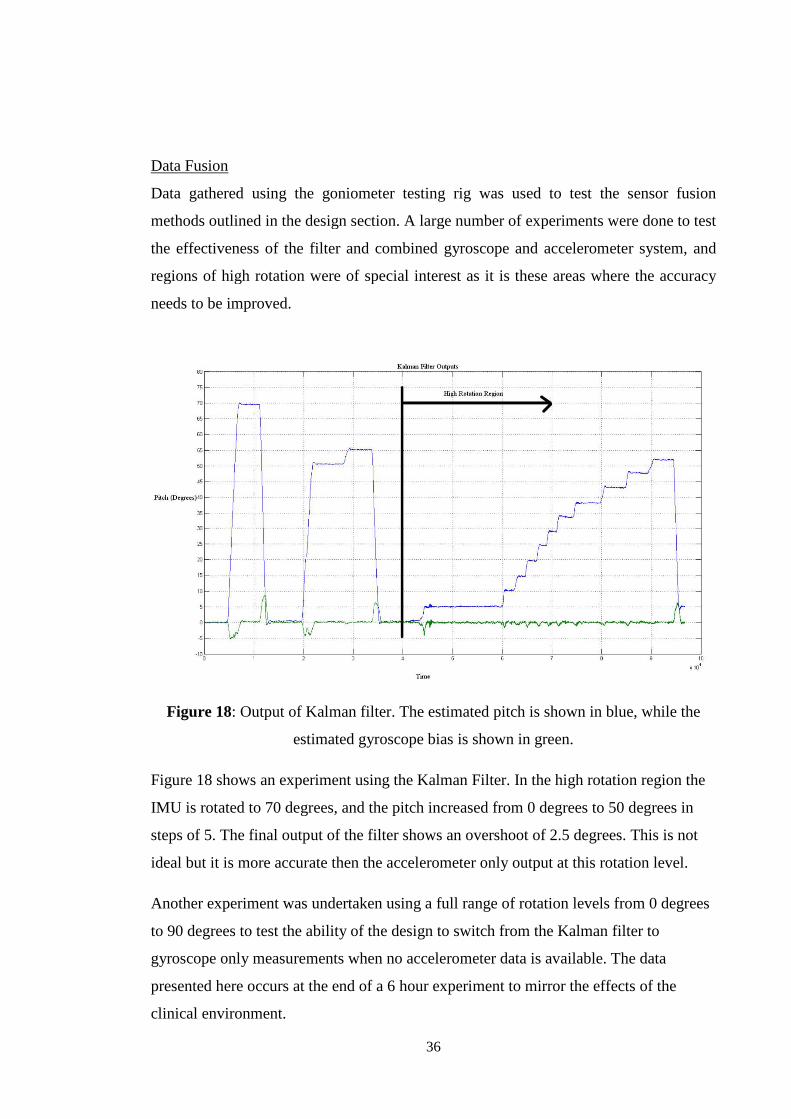
Data gathered using the goniometer testing rig was used to test the sensor fusion
A large number of experiments were done to test
the filter and combined gyroscope and accelerometer system, and
regions of high rotation were of special interest as it is these areas where the accuracy
: Output of Kalman filter. The estimated pitch is shown in blue, while the
estimated gyroscope bias is shown in green.
shows an experiment using the Kalman Filter. In the high rotation region the
ed from 0 degrees to 50 degrees in
overshoot of 2.5 degrees. This is not
ideal but it is more accurate then the accelerometer only output at this rotation level.
Another experiment was undertaken using a full range of rotation levels from 0 degrees
to test the ability of the design to switch from the Kalman filter to
gyroscope only measurements when no accelerometer data is available. The data
presented here occurs at the end of a 6 hour experiment to mirror the effects of the
37
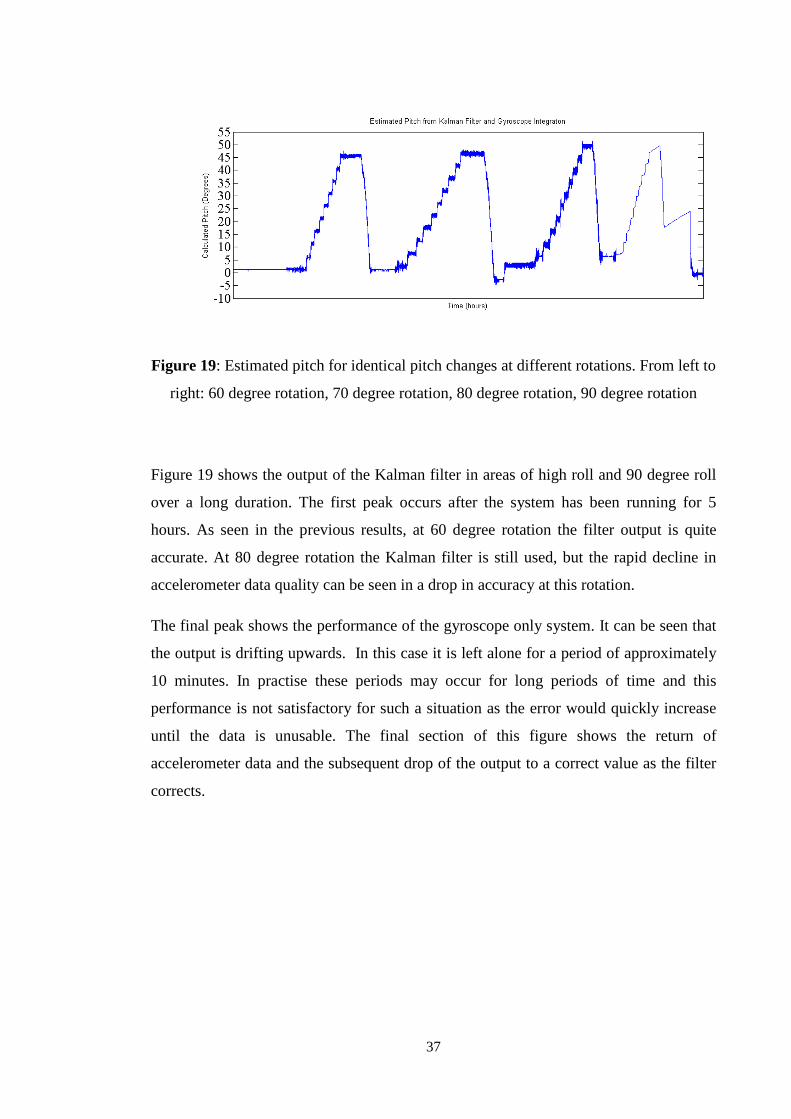
Figure 19: Estimated pitch for identical pitch changes at different rotations. From left to
right: 60 degree rotation, 70 degree rotation, 80 degree rotation, 90 degree rotation
Figure 19 shows the output of the Kalman filter in areas of high roll and 90 degree roll
over a long duration. The first peak occurs after the system has been running for 5
hours. As seen in the previous results, at 60 degree rotation the filter output is quite
accurate. At 80 degree rotation the Kalman filter is still used, but the rapid decline in
accelerometer data quality can be seen in a drop in accuracy at this rotation.
The final peak shows the performance of the gyroscope only system. It can be seen that
the output is drifting upwards. In this case it is left alone for a period of approximately
10 minutes. In practise these periods may occur for long periods of time and this
performance is not satisfactory for such a situation as the error would quickly increase
until the data is unusable. The final section of this figure shows the return of
accelerometer data and the subsequent drop of the output to a correct value as the filter
corrects.

38
Conclusions and Future Work
The Kalman filter implemented in this project has increased the accuracy of the system
substantially, and should be included in a final implementation of this project. In
regions of high rotation the accuracy has reached a point where the measured flexion or
extension will be useful in diagnosing the effect of upper body position on sleep apnoea
events. Although the system has been shown capable of determining pitch in the
absence of any accelerometer data, the result will quickly drift due to errors in the
gyroscope bias. As the periods a person may be lying on their side may extend for
hours, this solution at present is not satisfactory.
Before these techniques can be implemented in practise the filter and code needs to be
programmed into the microcontroller to perform the calculations in real time. A
multiplexor system will also need to be designed to utilize more than one IMU at a time
as the microcontroller currently in use is not capable of interfacing with more than one.
The errors in accelerometer performance at very high rotation could be improved if the
rotation is known with more accuracy then at present. By extending these techniques to
also determine the roll present in the IMU’s the accuracy of the adjusted pitch could be
increased which will increase the accuracy of the entire system.
References

39
AYLWARD, R. & PARADISO, J. A. A Compact, High-Speed, Wearable Sensor Network for Biomotion Capture and Interactive Media.
CARON, F., DUFLOS, E., POMORSKI, D. & VANHEEGHE, P. 2006. GPS/IMU Data Fusion using Multisensor Kalman Fitlering: Introduction to contextual Aspects. Information Fusion, 7, 221-230.
HILLMAN, D. R., MURPHY, A. S., ANTIC, R. & PEZZULLO, L. 2006. The Economic Cost of Sleep Disorders. SLEEP, 29, 299-305.
KWAKKEL, S. P., GODHA, S. & LACHAPELLE, G. 2007. Foot and Ankle Kinematics During Gait Using Foot Mounted Inertial System. Positioning Location and Navigation Group.
LUINGE, H. J. & VELTINK, P. H. 2005. Measuring orientation of human body segments using miniature gyroscopes and accelerometers. Medical & Biological Engineering & Computer, 43, 273-282.
LUINGE, H. J., VELTINK, P. H. & BATEN, C. T. M. 2007. Ambulatory measurement of arm orientation. Journal of Biomechanics, 40, 78-85.
MORGENTHALER, T. I., KAGRAMANOV, V., HANAK, V. & DECKER, P. A. 2006. Complex Sleep Apnea Syndrome: Is It a Unique Clinical Syndrome? SLEEP, 29, 1203-1209.
WALSH, J., MADDISON, K., PLATT, P., HILLMAN, D. & EASTWOOD, P. 2008. Influence of head extension, flexion and rotation on collapsibility of the passive upper airway. SLEEP, 10, 1440-1447.
WELCH, G. & BISHOP, G. 2006. An Introduction to the Kalman Fitler. University of North Carolina.

40
Appendix
Device Description for WASDRI
Head Position Monitoring Device
The system to monitor head movement in sleep apnoea patients during sleep studies utilizes two
ADXL355 accelerometers. One accelerometer is placed on the head of the patient, and the other
is placed on the chest. Both accelerometers are sealed in silicone (PDMS or
Polydimethylsiloxane), which is inert, non-toxic and non-flammable. It is safe to be cleaned
with alcohol wipes as already used in the clinical setting in the Sleep Disorders Clinic. The
accelerometers are placed on the patient using standard electrode backing tape and are only
slightly larger than the standard electrodes already in use clinically for staging sleep. A
photograph is shown below to show the size comparison with a standard electrode (right).
Please note that this is a prototype version, the accelerometer (left) will be completely sealed
before itsinitial use on human beings.

41
There is no risk of electrocution as the accelerometers are: (i) powered by a low voltage (3.3V)
and negligible current; (ii) the system is completely external, (iii) no direct contact is made
between the accelerometers and the patient’s skin; and the accelerometers are connected to a
microprocessor with insulated wires.
Final code used for accelerometer system
*/
//-----------------------------------------------------------------------------------------
//DECLARATION OF GLOBAL VARIABLES
//-----------------------------------------------------------------------------------------
//ACCELEROMETER VARIABLES
int head = 0; // To differentiate between the two accelerometers
int chest = 1; // Head(x,y,z) connected to analog pins 0,1,2 : chest to
3,4,5
double gravity = 0; // for calibration, determine the voltage level eq. for
gravity
int calibrate_button = 7; // to initialize calibration
boolean calibrated = false; // are accelerometers calibrated?
boolean moving = false; // Is patient moving fast?
boolean on_side = false; // Is patient on their side?
int stop_button = 6; // Emergency stop button

42
// Initialize pin variables (Changed within read_adxl function)
int xpin = 0;
int ypin = 1;
int zpin = 2;
// Initialize variables in which to store data
int x_value = 0;
int y_value = 0;
int z_value = 0;
// Initialize Acceleration variables (0 - 1023)
double A_x = 0;
double A_y = 0;
double A_z = 0;
// Initialize offset values
double x_offset = 335;
double y_offset = 333;
double z_offset = 352;
//Initialise angle offsets for initial placement
double pitch_offset = 0;

43
double roll_offset = 0;
//Intialise push-button pins & variables
int pb_pin = 2;
int active = 0;
// Initialize angles - Pitch is x relative to ground, roll y relative to ground, theta is z relative to
gravity.
double temp_pitch = 0;
double head_pitch = 0;
double chest_pitch = 0;
double temp_roll = 0;
double head_roll = 0;
double chest_roll = 0;
double temp_theta = 0;
double head_theta = 0;
double chest_theta = 0;
double relative_pitch = 0;
double relative_roll = 0;
double gamma = 0;

44
double pi = 3.1416;
//Initialize variables for averaging filter
double previous = 0;
long current = 0;
//--------------------------------------------------------------------------------------------------
//DAC VARIABLES
int DATAOUT = 11; //MOSI
int DATAIN = 12; //MISO
int SPICLOCK = 13; //sck
int SS0 = 10; //ss for DAC
int LDAC = 9; //Load pin for DAC
byte clr;
int address=0;
byte DACSELECT = 0x00; // value for selection of the DAC
int DACVALUE = 0; // value to be passed to DAC
//-------------------------------------------------------------------------------------------
//SETUP - RUNS ONCE ON STARTUP

45
//---------------------------------------------------------------------------------------------
void setup()
{
Serial.begin(9600);
pinMode(DATAIN, INPUT);
pinMode(DATAOUT, OUTPUT);
pinMode(SPICLOCK,OUTPUT);
pinMode(SS0, OUTPUT);
pinMode(LDAC,OUTPUT);
digitalWrite(SS0,HIGH);
digitalWrite(LDAC,HIGH);
SPCR = B01011001;
// interrupt disabled,spi enabled,msb 1st,master,clk high when idle,sample on falling edge,
//clock = 62.5kHz [SPCR =
(1<<SPE)|(1<<MSTR)|(1<<CPOL)|(1<<CPHA)|(1<<SPR1)|(1<<SPR0);]
clr=SPSR;
clr=SPDR;
delay(10);
}
//-------------------------------------------------------------------------------------------------
// FUNCTIONS GO HERE

46
//--------------------------------------------------------------------------------------------------
//ACCELEROMETER FUNCTIONS
void calibrate()
{
Serial.println();
Serial.print("Awaiting confirmation");
while(calibrated == false)
{
//Calibrate system -- find voltage level for zero position
//active = digitalRead(pb_pin);
active = HIGH;
do
{
active = digitalRead(pb_pin);
}
while(active == HIGH);
Serial.print("Confirmation gained.");
Serial.println();
pitch_offset = relative_pitch_f();
calibrated = true;
Serial.print("System Calibrated.");
Serial.println();
}

47
}
void read_adxl(int accelerometer)
{
// Code to read values from the accelerometers
// Variable to be passed to function - acceleromter to be read
// Variable stored: angles in range of [-pi/2,+pi/2] radians
if (accelerometer == head)
{
xpin = 0;
ypin = 1;
zpin = 2;
}
else
{
xpin = 3;
ypin = 4;
zpin = 5;
}
x_value = 0;
y_value = 0;
z_value = 0;

48
for (int i=0;i<20;i++)
{
x_value = x_value + analogRead(xpin);
y_value = y_value + analogRead(ypin);
z_value = z_value + analogRead(zpin);
delay(100);
}
x_value = x_value/20;
y_value = y_value/20;
z_value = z_value/20;
A_x = (x_value - x_offset)/(70); // Acceleration in x direction
A_y = (y_value - y_offset)/(70); // Acceleration in y direction
A_z = (z_value - z_offset)/(70); // Acceleration in z direction
temp_pitch = atan((A_x)/sqrt((A_y * A_y)+(A_z * A_z))); /*flex*/
temp_roll = atan((A_y)/sqrt((A_x * A_x)+(A_z * A_z))); /*rotation*/
temp_theta = atan(sqrt((A_x * A_x)+(A_y * A_y))/A_z);
}
double relative_pitch_f(void)
{

49
//Returns the relative pitch between two accelerometers, taking into account the
calibration offset.
//Result is in radians
read_adxl(head);
head_pitch = temp_pitch;
read_adxl(chest);
chest_pitch = temp_pitch;
relative_pitch = head_pitch - chest_pitch; //Will be in radians, convert to degrees:
return relative_pitch;
}
double relative_roll_f(void)
{
//Returns the relative roll between two accelerometers, taking into account the
calibration offset.
//Result is in radians
read_adxl(head);
head_roll = temp_roll;
read_adxl(chest);
chest_roll = temp_roll;
relative_roll = head_roll-chest_roll; //radians, convert to degrees:
return relative_roll;
}
void compare_adxl()
{

50
//Reads the two accelerometers, then computes the angles
//along a single plane, then computes the angle difference along that plane and returns
the value
//Result is passed to DAC, Result is in degrees
read_adxl(head);
head_pitch = temp_pitch;
head_roll = temp_roll;
head_theta = temp_theta;
read_adxl(chest);
chest_pitch = temp_pitch;
chest_roll = temp_roll;
chest_theta = temp_theta;
relative_pitch = head_pitch - chest_pitch - pitch_offset;
relative_roll = head_roll - chest_roll - roll_offset;
gamma = asin(sin(relative_pitch)/cos(relative_roll)) *(360/(2*pi)); //Convert to degrees
}
//-----------------------------------------------------------------------------------------------

51
//DAC FUNCTIONS
byte first(int value)
{
// Code to combine address byte and 1st 4 bits of value for DAC
// Note: DAC has 10 bit resolution [0,1023] - last 6 bits converted in another function
// IF WANT TO USE ANOTHER CHANNEL ON THE DAC, MUST CODE IT IN
HERE - DEFAULT IS DAC A
int working = 0;
working = value - (value % 64); //set last 6 bits to zero
working = working / 64; // "shift" down 6 bits
byte work = (byte) working;
work = work + DACSELECT;
return work;
}
byte last(int value)
{
// Code to extract the last 6 bits of value to pass to the DAC
byte working = 0x00;
working = (byte)value;

52
working = working << 2; // Shift bits two places to the left.
return working;
}
byte send_data(int value)
{
// code to send data to the DAC
// d15->d12 direct to address of register, d11->d2 contains data to be converted
//(TLV5608 only has 10 bit resolution -> ignores d1->d0)
byte data;
digitalWrite(SS0,LOW); //activates DAC
spi_transfer(first(value));
data = spi_transfer(last(value));
delay(10);
digitalWrite(LDAC,LOW); // Loads data into DAC
digitalWrite(LDAC,HIGH); // Releases DAC
digitalWrite(SS0,HIGH); //deactivates DAC
return data;
}

53
byte spi_transfer(volatile char data)
{
SPDR = data; // Start the transmission
while (!(SPSR & (1<<SPIF))) // Wait the end of the transmission
{};
return SPDR; // return the received byte
}
//------------------------------------------------------------------------------------------------
//LOOP - FUNCTIONS RUN CONTINUOUSLY IN ORDER
//-------------------------------------------------------------------------------------------------
void loop()
{
if (!calibrated) {
calibrate();
}
compare_adxl();

54
gamma = map(gamma,-45,45,0,200);
int result = (int) gamma;
if (result % 2 == 1) {
result++;
}
Serial.println();
send_data(result);
S
delay(100);
}

55