measuring value for money in healthcare: concepts and tools · 1.4 another fundamental decision is...
TRANSCRIPT

Measuring value for money in healthcare: concepts and toolsPeter C Smith
Centre for Health Economics
University of York
September 2009


QQUIP and the Quality Enhancing Interventions project
QQUIP (Quest for Quality and Improved Performance) is a five-year research initiative of the Health Foun-dation. QQUIP provides independent reports on a wide range of data about the quality of healthcare in the UK. It draws on the international evidence base to produce information on where healthcare resources are currently being spent, whether they provide value for money and how interventions in the UK and around the world have been used to improve healthcare quality.
The Quality Enhancing Interventions component of the QQUIP initiative provides a series of structured evidence-based reviews of the effectiveness of a wide range of interventions designed to improve the quality of healthcare. The six main categories of Quality Enhancing Interventions for which evidence will be reviewed are shown below.
Acknowledgements
This work was funded by the Health Foundation under the QQUIP initiative. I should like to thank Sheila Leatherman, Vin McLoughlin, Dale Webb and four splendid referees for their helpful comments.
For more information visit www.health.org.uk/qquip

Published by:
The Health Foundation90 Long AcreLondon WC2E 9RATelephone: 020 7257 8000Facsimile: 020 7257 8001
www.health.org.uk
Registered charity number 286967Registered company number 1714937
First published 2009
ISBN 978-1-906461-11-9
Copyright The Health Foundation
All rights reserved, including the right of reproduction in whole or in part in any form.
Every effort has been made to obtain permission from copyright holders to reproduce material. The publishers would be pleased to rectify any errors or omissions bought to their attention.
Contents
Summary 6
1. Introduction 101.1. Why is VfM important? 111.2. What is value for money? 12
1.2.1. Allocative efficiency: guiding purchasing decisions 151.2.2. Technical efficiency: operational performance assessment 19
1.3. What is the unit of analysis? 201.4. Comprehensive or partial VfM measures? 211.5 Some examples of VfM performance measures 22
2. What are the components of VfM? 292.1. What is valued? 29
2.1.1. Health gain 292.1.2. The patient experience 322.1.3. Inequalities 332.1.4. Externalities and broader economic outcomes 332.1.5. Outputs: counting activity and processes 34
2.2. Valuing system outputs 352.3. What are the inputs? 362.4. Environmental constraints 372.5. Short run or long run? 39
3. Measuring VfM 413.1. Adjusting for environmental constraints 413.2. Analytic models of VfM 43
3.2.1. Statistical methods 443.2.2. Descriptive methods 45
4. Conclusions 47
References 51
Summary
6
Measuring value for money in healthcare: concepts and tools
Smith
Summary
Section 1
The concept of value for money (VfM) has been central to health policy and the delivery of healthcare for some time. In its abstract form, the concept of VfM is straightforward: it represents the ratio of some measure of valued health system outputs to the associated expenditure, and few would argue that its pursuit is not a worthy goal. The main reasons for an interest in VfM relate to accountability: to reassure payers, in particular taxpayers, that their money is being spent wisely, and to reassure patients that their claims on the health system are being treated fairly and consistently.
1.1 In practice, the measurement of VfM is challenging and gives rise to some important methodological questions. The main aim is to offer an understanding of how resources are successfully transformed into valued health system outputs. But there are several stages to that transformation, each of which can be measured with different degrees of accuracy and ease. The result has been a profusion of partial indicators of VfM, but a relative dearth of definitive measures that capture the whole transformation process in the form of a cost-effectiveness measure.
1.2 The two fundamental economic concepts underlying VfM are allocative efficiency and technical efficiency.
1.2.1 Allocative efficiency indicates the extent to which limited funds are directed towards purchasing the correct mix of health services in line with the preferences of payers. It is central to the work of the National Institute for Health and Clinical Excellence (NICE), which uses expected gains in quality-adjusted life years (QALYs) as the central measure of the benefits of a treatment, and cost per QALY as a prime cost-effectiveness criterion for whether or not to mandate adoption of a treatment by the NHS. The assumption underlying this approach is that the taxpaying public wishes to see the taxes assigned to the NHS used to maximise health gain. Thus, in deciding what services to purchase, the main (but not sole) focus of allocative efficiency is prospective.
1.2.2 Technical efficiency is quite distinct. It indicates the extent to which a provider is securing the minimum cost for the maximum quality in delivering its agreed outputs. The prime interest in technical efficiency is in operational performance assessment and the extent to which resources are being wasted. The main focus of technical efficiency is therefore retrospective. This paper focuses mainly on retrospective VfM measurement.
1.3 In undertaking any VfM analysis, it is essential first to decide on the nature of the entity under scrutiny. At one extreme this might be the whole health system. At the other extreme, it might be the treatment of an individual patient.
1.4 Another fundamental decision is whether to seek out a comprehensive measure of the cost-effectiveness of the entire entity or to rely on partial indicators of some aspects of VfM. In the latter case, incompleteness can take two forms: omission of some aspects of the transformation from resources to valued outcomes (for example, no health outcome data), or omission of some of some of the functions of the entity (for example, analysis of only the inpatient activities of a hospital).
1.5 There have been numerous efforts to implement VfM measurement schemes. These include whole-system productivity estimates, as attempted by the World Health Organization (WHO) in the World health report (WHR) 2000 and by the Office for National Statistics (ONS) in UK trends over time. These comprehensive, whole-system measures are experimental. More practical approaches have offered useful but incomplete indicators of VfM. All efforts have encountered severe methodological challenges and lack of data in key domains.
Summary
7
Measuring value for money in healthcare: concepts and tools
Smith
Section 2
There are a number of components of VfM that need to be considered when developing any VfM measure. These may include the eventual outcomes of interest, intermediate outputs and activities, inputs, possible external constraints on achieving VfM, and whether a long or short time horizon is being adopted.
2.1 Outcomes are the valued outputs of the health services. Although there is room for debate about what is valued, in the NHS they can be grouped according to four broad categories: health gains, the patient experience, inequalities, and the broader social and economic benefits of health services.
2.1.1 Considerable progress has been made in the conceptualisation and measurement of health gain in the form of QALYs and associated measurement instruments such as EQ5D. These have been used mainly for the purposes of health technology assessment, not for the routine surveillance of provider performance, and there are major challenges involved in measuring health gain throughout the health system. However, the NHS has recently made a start by mandating collection of ‘before and after’ health status measurement for four common surgical procedures.
2.1.2 There is a growing acknowledgement that patients and their families place considerable value on the experience of their interactions with the health services, independent of health outcome. WHO grouped these patient experience concerns in the category of ‘responsiveness’, which includes concepts such as choice, communication, confidentiality, quality of amenities and prompt attention. Surveys of the patient experience have become commonplace, and the challenge is to develop adequate summary measures of provider performance.
2.1.3 Inequalities in health and inequalities in access to health services have been a persistent cause for concern in many health systems. There are two broad schools of thought on how to handle equity issues in VfM measurement. One looks to develop separate measures of equity, based on divergence of outcomes for different social groups, for example, while the other weights the outcomes of health system performance, such as health gain, more heavily for disadvantaged groups. Although the latter approach is probably more promising, quantification of differential weights is in its infancy.
2.1.4 Health services yield benefits beyond the immediate heath gain to patients, such as increased worker productivity, increased personal independence and reduced burden on carers and social care agencies. Depending on the context, there may be a case for integrating these considerations into any VfM analysis, although measurement issues are often challenging.
2.1.5 Because of data limitations, many VfM analyses are forced to rely on measures of outputs (quantities of activities) rather than measures of the eventual outcomes for patients and society. This can be unproblematic if the outputs are known to lead to good eventual outcomes and there is known to be little variation in quality of providers. However, it clearly can be seriously misleading if this is not the case.
2.2 Once the valued outputs have been identified, there will often be a need to combine them into a single measure of attainment. Some exploratory research has explored the relative weights people attach to diverse outcomes, such as waiting time, travel distance and health outcome, using methods such as ‘stated preference’ experiments. However, this work is in its infancy, and the analysis will usually have to rely on a rudimentary rule of thumb to combine different outcome measures.
2.3 Inputs represent the ‘money’ component of the VfM analysis. They can be readily identified if the units are discrete organisations such as hospitals. However, they can be much more
Smith
Measuring value for money in healthcare: concepts and tools
8
difficult to identify if the unit of analysis is smaller, such as a hospital department, as it becomes increasingly difficult to estimate what fraction of the hospital’s resources are devoted to producing the outputs of the department. There are a number of unresolved challenges associated with costing methodology.
2.4 Different health service organisations work in the context of different external constraints, such as the health characteristics of the local population, local transport, geography and economic conditions, and the activities of other agencies both inside and outside the health sector. Any comparative VfM analysis should take account of these differences.
2.5 The naive VfM assumes that contemporary inputs give rise to contemporary outcomes. Yet in most healthcare there is a need to adopt a longer time perspective. Some of today’s outcomes arise from health service endeavours, such as disease prevention, in previous periods. And some of today’s endeavours affect outcomes only at some time in the future. Therefore, when analysing the VfM of some services, it will be necessary to adopt a longer time horizon.
Section 3
Traditionally, efforts to measure VfM have been piecemeal and partial. Indicators such as inpatient length of stay are helpful and suggestive, but tell only part of the VfM story, and can lead to inappropriate responses and adverse consequences if not used with care. Technical analytic efforts have therefore been directed at developing more comprehensive VfM measures to complement the partial indicators. This section summarises some of that work.
3.1 A great deal of analytic effort has gone into developing methods of adjusting for the environmental differences discussed in 2.4. The simplest approach is to compare only like with like, by selecting for comparison only organisations working in similar environments and using methods such as cluster analysis. However, this is a crude expedient, and researchers have developed more subtle methods of risk adjustment to address some aspects of environmental variation. These enjoy wide acceptance in some domains (such as adjusting surgical outcomes for casemix), but are not so advanced in many other health services.
3.2 Two broad approaches have been adopted for developing ‘single number’ measures of an organisation’s VfM. I class these as statistical and descriptive methods.
3.2.1 Statistical methods are based on the conventional econometric regression models. A statistical model of costs seeks to estimate an organisation’s expected costs given the outputs it produces. In its simplest form, efficiency is simply indicated by the organisation’s observed deviation from this prediction. Approaches such as stochastic frontier analysis (SFA) seek to decompose the deviation into a random element (not caused by inefficiency) and an inefficiency element, the issue of interest. However, SFA methods do not enjoy universal endorsement from researchers.
3.2.2 Descriptive approaches are based on the class of technique known as data envelopment analysis (DEA). DEA searches for the organisations that ‘envelop’ all other organisations on the basis of a composite estimate of VfM. For each organisation, it looks for all other organisations that secure the same, or better, outputs with the lowest use of inputs. Or, conversely, it can be used to search for the other organisations that use the same, or lower, inputs to secure the highest level of outputs. For each organisation, the ratio of actual to optimal performance is referred to as ‘inefficiency’. DEA can yield useful information, but needs to be used with extreme care for the purpose of benchmarking performance.

Summary
9
Measuring value for money in healthcare: concepts and tools
Smith
4. Conclusions
The report highlights two fundamental roles for VfM measurement: prospective assessment of technologies (for resource allocation purposes) and retrospective assessment of the VfM of individual providers (performance assessment). In combination, these roles comprise a major element of the functions of healthcare purchasers (or PCT commissioners as they have become known in England). The purchasing function is immensely complex and has hitherto been undertaken with only limited success in most health systems (Figueras, Robinson et al, 2005). Concerted attention to VfM measurement offers a central focus for improving purchasing for health and healthcare.
The resource allocation role of VfM measurement is relatively well understood, albeit mainly in the context of individual treatments. By contrast, the performance assessment role of VfM measurement is underdeveloped. Until now, there has been a reliance on partial indicators of VfM. These can act as useful diagnostic tools, but can also give misleading signals if used carelessly. There is an urgent need to complement these partial measures with more comprehensive measures of VfM performance. The arguments in favour of pursuing increased comprehensiveness are:
• Itoffersaroundedassessmentofanorganisation’sperformanceacrossalldomainsofendeavour.
• Itcanfacilitateafocusonpatientoutcomes,regardlessofthespecifictreatmentsordiseasesunder consideration.
• Itfacilitatescommunicationwithordinarycitizensandpromotesaccountability.
• ItindicateswhichoftheentitiesunderscrutinyrepresentthebeaconsofbestVfM.
• Itindicateswhichentitiesshouldbeprioritiesforimprovementefforts.
• Itcanstimulatethesearchforbetterdataandbetteranalyticeffortsacrossallhealthcare.
• Itoffersmangersoflocalorganisationsthefreedomtosettheirownprioritiesandtoseekoutimprovements along dimensions of performance where gains are most readily secured, and it does not seek to micromanage (a possible consequence of piecemeal VfM indicators).
Nevertheless, partial indicators also offer benefits:
• Theycanidentifyseriousfailingsinsomepartsoftheorganisation,evenifmoreaggregatemeasures of VfM indicate no cause for concern.
• Theyofferadiagnostictoolforidentifyingwhattoattributepoorperformanceto,andthereforewhat remedial action to take.
• Theymaybetheonlyrealisticapproachifanattempttobecomprehensiveleadstoarelianceon very feeble or opaque data in some dimensions of performance.
• Whenaggregatingdifferentdimensionsofperformance,comprehensivemeasuresmayhavetorely on preference weights that are highly contested.
The paper indicates that there are many challenges in embedding VfM considerations into the scrutiny and improvement of the health system. It concludes by summarising the priorities for three key constituencies: policy makers and regulators, managers, and researchers.
1. Introduction
10
Measuring value for money in healthcare: concepts and tools
Smith
1. Introduction
The pursuit of value for money has become the holy grail of health systems worldwide. It appears self-evident that policy makers should wish to deploy health system expenditure with the aim of securing maximum value in the form of benefits to patients and the broader population. It may therefore seem somewhat surprising that the topic of VfM generates fierce debate and controversy around methodology. This paper describes the various concepts of VfM in common use, examines how VfM measures are constructed, discusses the challenges inherent in measuring VfM, and assesses the priorities for future efforts in this domain.
The concept of value for money is straightforward: it represents the ratio of some measure of valued health system outputs to the associated expenditure, and few would argue that its pursuit is not a worthy goal. But, in practice, discussion of VfM gives rise to some fundamental questions. What is valued? Can we necessarily identify the volume of ‘money’ going into the health system? And what precisely is the health system entity under scrutiny? It turns out that it is important to secure some clarity about these and related issues if the notion of VfM is to be made operationally useful in guiding policy makers and practitioners towards a health system in line with policy objectives.
It is worth noting at the outset that not all stakeholders necessarily advocate the pursuit of VfM. In systems such as the English NHS, for example, in which patients do not personally bear the full costs of their treatment, most patients are more interested in the effectiveness of healthcare rather than its VfM. Indeed, they might well view the pursuit of VfM as antipathetic to their own interests in securing the best possible treatment regardless of expense. Similarly, clinicians may view an interest in VfM with some scepticism because it might place limitations on the healthcare they are able to offer, perhaps inhibiting them from doing what they feel is best for their patients.
Yet, whatever the chosen system of finance, someone must always pay for the healthcare delivered, and those payers’ interests are served by focusing on VfM. In particular, in a tax-funded system such as the NHS, taxpayers want to be assured that their payments are being used in line with their objectives. It is these objectives that create the concept of value in VfM, and the pursuit of VfM fundamentally reflects a desire to respect the interests of payers (or their representatives). In England these might include the Department of Health, primary care trusts (PCTs) and general practitioner commissioners, on behalf of the principal funder, the taxpayer.
This payer perspective means that, at times, VfM considerations may come into conflict with movements such as the safety agenda and ‘patient centredness’. The principle of VfM suggests that these agendas should be pursued, but only up to a point, to the extent that they promote value for money. In short, from a payer perspective, considerations of health system effectiveness are trumped by the notion of cost-effectiveness, which embraces most aspects of VfM.
In writing this paper I have found it very difficult to present the ideas underlying VfM in a succinct and transparent fashion. This may be due to my shortcomings as an author. However, I suspect that it also reflects the complexity of the concept of value for money. It is, for example, noteworthy that of all the Public Service Agreements (PSAs) developed by the UK government for the English public services, it is those relating to VfM that have given rise to the most conceptual and operational challenges (Smith, 2007a).
I hope, nevertheless, that this paper offers some help in navigating the conceptual and analytic jungle of VfM measurement. Throughout this paper, I concentrate on healthcare, and do not consider broader

1. Introduction
11
Measuring value for money in healthcare: concepts and tools
Smith
issues of health promotion and preventative care. The document is written for a UK readership; however, the issues discussed are universal and should be relevant for most health systems. Section 1.1 discusses why VfM measurement is important, while section 1.2 examines what is meant by the concept of VfM. Section 1.3 explains the need for a clear understanding of the entity under scrutiny in VfM analysis. Section 1.4 discusses the tension between using comprehensive, but perhaps unattainable, measures of VfM and the use of partial VfM indicators, which are practical, but possibly misleading and incomplete. Section 1.5 gives some operational examples.
1.1. Why is VfM important?
VfM is, in practice, a subtle and multidimensional concept, and in many domains it is challenging to develop satisfactory measures of VfM that are not misleading. The question therefore arises whether it is sensible to seek to develop such measures. The answer must be a resounding ‘yes’, for two fundamental reasons relating to accountability: to reassure payers that their money is being spent wisely and in line with their intentions; and to reassure patients that their claims on health system resources are being treated consistently and fairly. Pursuit of these objectives makes the search for good indicators of VfM imperative. The alternative is to leave decision makers facing a cacophony of competing claims for healthcare resources with no coherent methodology for reconciling those claims. Properly used, VfM offers the only unifying concept with which to evaluate healthcare technologies, inform the allocation of resources within the health system and the broader economy, and assess the performance of components of the health system.
Furthermore, in most health systems, an increasingly rich information base is developing, offering insights into many aspects of the epidemiology, costs, processes and outcomes of healthcare. The Health Foundation’s Quest for Quality and Improved Performance (QQUIP) initiative has demonstrated the enormous scope of data now available in the UK. It was set up to help answer three fundamental questions about healthcare in England:
• Whatisthecurrentstateofqualityandperformance?
• Whatworkstoimprovequalityandperformance?
• ArewegettingvalueformoneyfromwhatisspentontheNHS?
The QQUIP website (www.health.org.uk/qquip/) brings together data from a wide range of sources to reveal national and international trends relating to diseases and quality of care, with over 150 charts on priority areas such as cancer, heart disease, diabetes and mental health.
Data such as these are of immense importance in their own right. However, their value can be enhanced further by scrutinising them within the overarching framework of VfM analysis. This can go beyond the piecemeal scrutiny of individual data items to offer decision makers an evaluative framework. For example, for a specific treatment, a comprehensive VfM analysis can combine separate information on trends in costs, casemix, volume and outcomes in order to track the cost-effectiveness of the treatment over time.
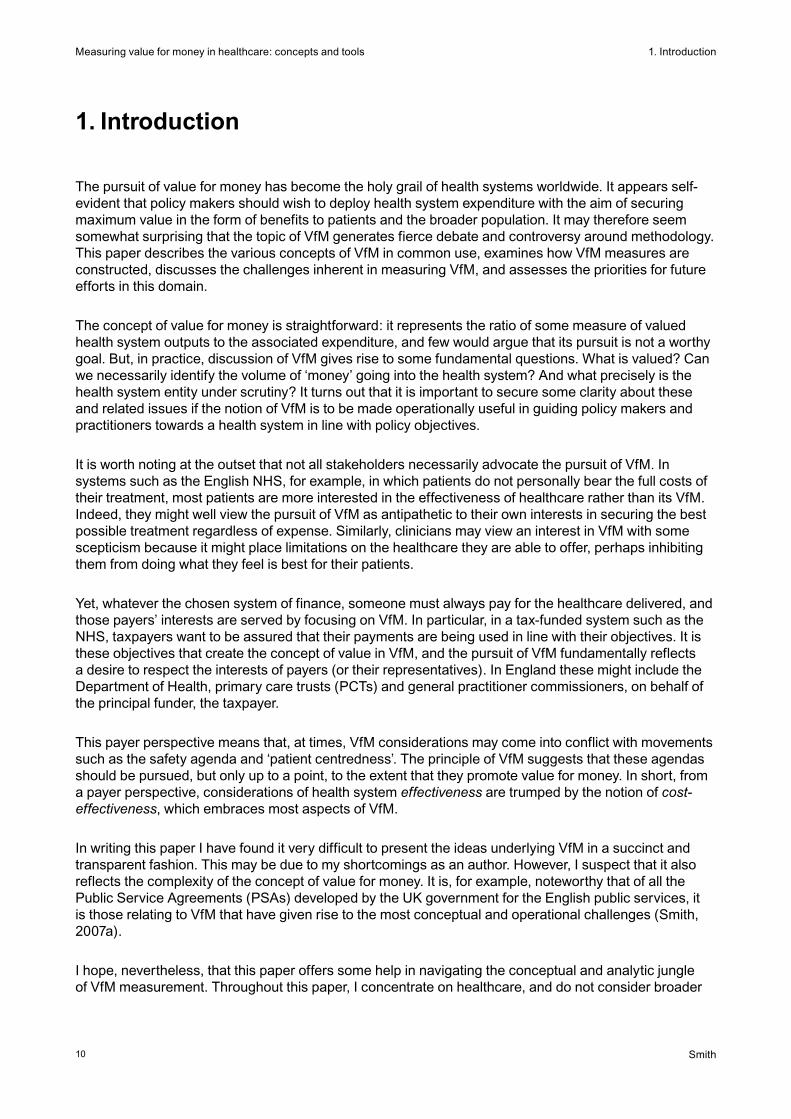
In assessing the role of VfM information in healthcare, it is usual to focus on its importance in promoting the accountability of various ‘agents’ to their ‘principals’. Figure 1 illustrates just some of the numerous agency relationships that exist within healthcare. The most obvious agency relationship is that between clinician and patient. Flows of information are essential to this relationship, for example in optimising patient care and informing patient choice. However, VfM concerns play relatively little part in the clinician/patient relationship in universal health insurance systems such as the NHS, because the patient has no direct interest in the clinician’s remuneration.
Summary
12
Measuring value for money in healthcare: concepts and tools
Smith
Figure 1: Some of the accountability relationships in healthcare
By contrast, in almost all of the other agency relationships in healthcare, VfM plays a major role, because the principal is a payer of some sort. For example, taxpayers want assurance that tax contributions to the NHS are being used to best effect. Similarly, the government needs to know that the health system is receiving the right amount of finance relative to other parts of the economy, and is using it appropriately.1 It therefore also requires assurance that the money it distributes to local purchasing organisations such as PCTs is well spent. In turn, PCTs need to know that their funds are being spent in the best way, in terms of the treatments they purchase and the organisations from which they commission care.
Notwithstanding the general concern with VfM, the different types of accountability relationship lead to the need for different types of VfM information. NHS purchasers may require very detailed benchmarking information in order to design and monitor contracts with specific providers. By contrast, taxpayers may need quite aggregate and broad-brush information on productivity trends with which to hold their government to account. There are also a number of components of VfM that address different managerial concerns and require different approaches to measurement. These are considered in the following section.
1.2. What is value for money?
The underlying intention in any VfM analysis is to offer insight into how resources are successfully transformed into valued outcomes. There are a number of stages in this transformation (the care pathway), and much of the confusion in discussing VfM arises because commentators discuss different parts of that process. In principle, the VfM part of the transformation can be captured in the notion of cost-effectiveness. However, the data demands of a full cost-effectiveness analysis are often prohibitive. And, in any case, decision makers may often require more detailed diagnostic VfM indicators for just part of the care process.
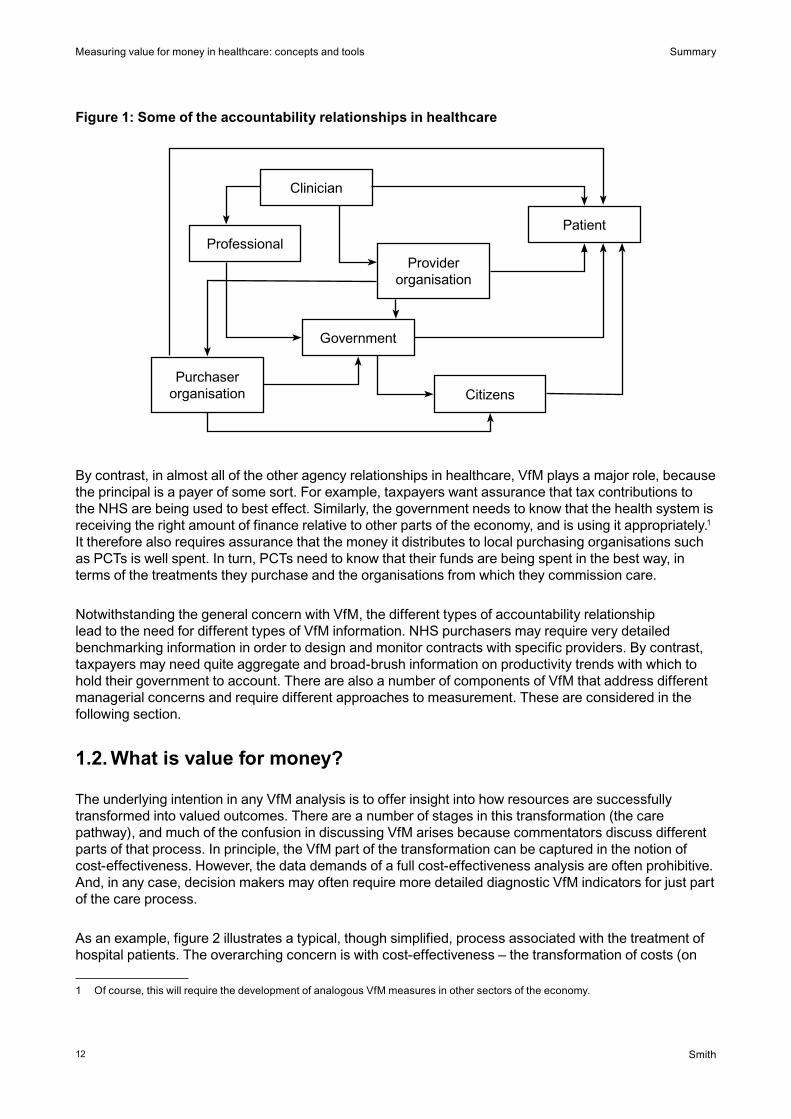
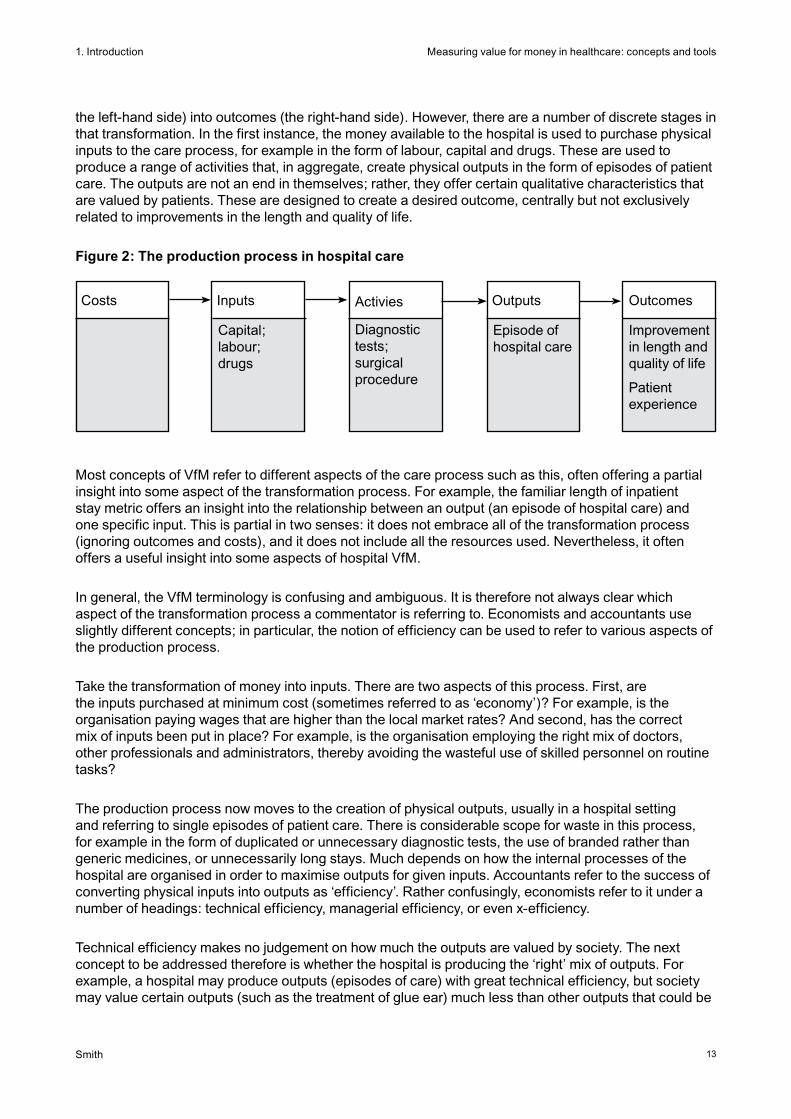
As an example, figure 2 illustrates a typical, though simplified, process associated with the treatment of hospital patients. The overarching concern is with cost-effectiveness – the transformation of costs (on
Clinician
PatientProfessional
Provider organisation
Purchaser organisation
Government
Citizens
1 Of course, this will require the development of analogous VfM measures in other sectors of the economy.
1. Introduction
13
Measuring value for money in healthcare: concepts and tools
Smith
the left-hand side) into outcomes (the right-hand side). However, there are a number of discrete stages in that transformation. In the first instance, the money available to the hospital is used to purchase physical inputs to the care process, for example in the form of labour, capital and drugs. These are used to produce a range of activities that, in aggregate, create physical outputs in the form of episodes of patient care. The outputs are not an end in themselves; rather, they offer certain qualitative characteristics that are valued by patients. These are designed to create a desired outcome, centrally but not exclusively related to improvements in the length and quality of life.
Figure 2: The production process in hospital care
Most concepts of VfM refer to different aspects of the care process such as this, often offering a partial insight into some aspect of the transformation process. For example, the familiar length of inpatient stay metric offers an insight into the relationship between an output (an episode of hospital care) and one specific input. This is partial in two senses: it does not embrace all of the transformation process (ignoring outcomes and costs), and it does not include all the resources used. Nevertheless, it often offers a useful insight into some aspects of hospital VfM.
In general, the VfM terminology is confusing and ambiguous. It is therefore not always clear which aspect of the transformation process a commentator is referring to. Economists and accountants use slightly different concepts; in particular, the notion of efficiency can be used to refer to various aspects of the production process.
Take the transformation of money into inputs. There are two aspects of this process. First, are the inputs purchased at minimum cost (sometimes referred to as ‘economy’)? For example, is the organisation paying wages that are higher than the local market rates? And second, has the correct mix of inputs been put in place? For example, is the organisation employing the right mix of doctors, other professionals and administrators, thereby avoiding the wasteful use of skilled personnel on routine tasks?
The production process now moves to the creation of physical outputs, usually in a hospital setting and referring to single episodes of patient care. There is considerable scope for waste in this process, for example in the form of duplicated or unnecessary diagnostic tests, the use of branded rather than generic medicines, or unnecessarily long stays. Much depends on how the internal processes of the hospital are organised in order to maximise outputs for given inputs. Accountants refer to the success of converting physical inputs into outputs as ‘efficiency’. Rather confusingly, economists refer to it under a number of headings: technical efficiency, managerial efficiency, or even x-efficiency.
Technical efficiency makes no judgement on how much the outputs are valued by society. The next concept to be addressed therefore is whether the hospital is producing the ‘right’ mix of outputs. For example, a hospital may produce outputs (episodes of care) with great technical efficiency, but society may value certain outputs (such as the treatment of glue ear) much less than other outputs that could be
Improvement in length and quality of life
Patient experience
Episode of hospital care
Diagnostic tests; surgical procedure
Capital; labour; drugs
Costs Inputs Activies Outputs Outcomes
1. Introduction
14
Measuring value for money in healthcare: concepts and tools
Smith
produced with the same resources. The extent to which the outputs of the organisation are maximised in line with society’s valuation2 of their characteristics is measured using the concept of allocative efficiency.
Finally, an important aspect of healthcare is that there is great scope for variation in effectiveness. This is often referred to as the ‘quality’ of the outputs produced, arising from variations in clinical practice and competence. The notion of quality in healthcare has a number of connotations. However, in this paper, I use it to refer to two broad concepts: the clinical outcomes achieved (usually measured in terms of the gain in the length and quality of life), and the patient experience (a multidimensional concept, discussed further in section 2). So, for example, even though two hospitals may produce identical numbers of hip replacements, owing to variations in clinical practice and competence, the value they confer on patients (in the form of length and quality of life, and the patient experience) may vary considerably. Quality-adjusted output is usually referred to as the ‘outcome’ of care in the productivity literature. The quality of care has become a central concern of policy makers, and its measurement is usually essential if a comprehensive picture of VfM is to be secured.
In summary, VfM can be examined in a number of ways, including:
• theeconomywithwhichphysicalinputsarepurchased
• theextenttowhichthechoseninputsarecombinedinanoptimalmix
• thetechnicalefficiencywithwhichphysicalinputsareconvertedintophysicaloutputs
• theallocativeefficiencyofthesystem’schosenoutputs
• thequalityofthecareprovided(itseffectiveness).
Each of these concepts scrutinises a particular aspect of the transformation process. However, the holy grail of value for money is the notion of cost-effectiveness, the ratio of eventual outcomes to the costs incurred, which embraces the entire production process and therefore all the separate VfM concepts mentioned above. All the other measures give important diagnostic information because they allow us to pinpoint where inefficiencies are arising. However, it is important to recognise that they give only partial insights into healthcare VfM.
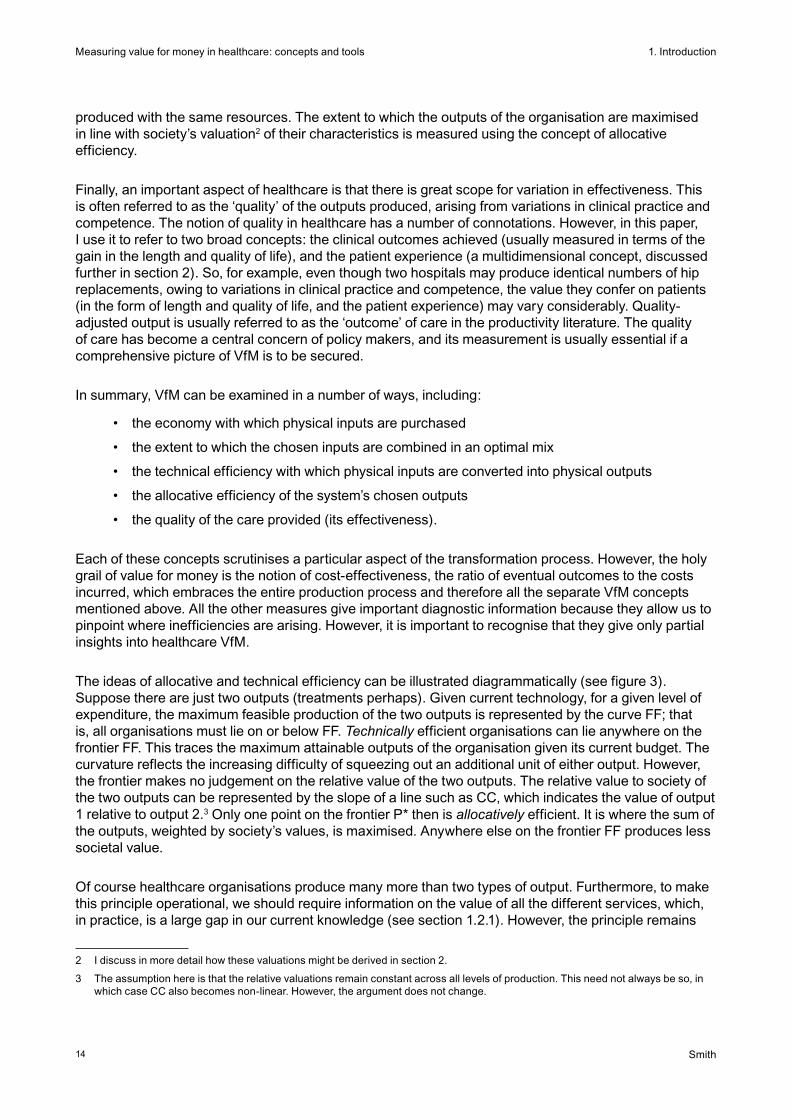
The ideas of allocative and technical efficiency can be illustrated diagrammatically (see figure 3). Suppose there are just two outputs (treatments perhaps). Given current technology, for a given level of expenditure, the maximum feasible production of the two outputs is represented by the curve FF; that is, all organisations must lie on or below FF. Technically efficient organisations can lie anywhere on the frontier FF. This traces the maximum attainable outputs of the organisation given its current budget. The curvature reflects the increasing difficulty of squeezing out an additional unit of either output. However, the frontier makes no judgement on the relative value of the two outputs. The relative value to society of the two outputs can be represented by the slope of a line such as CC, which indicates the value of output 1 relative to output 2.3 Only one point on the frontier P* then is allocatively efficient. It is where the sum of the outputs, weighted by society’s values, is maximised. Anywhere else on the frontier FF produces less societal value.
Of course healthcare organisations produce many more than two types of output. Furthermore, to make this principle operational, we should require information on the value of all the different services, which, in practice, is a large gap in our current knowledge (see section 1.2.1). However, the principle remains
2 I discuss in more detail how these valuations might be derived in section 2.
3 The assumption here is that the relative valuations remain constant across all levels of production. This need not always be so, in which case CC also becomes non-linear. However, the argument does not change.

1. Introduction
15
Measuring value for money in healthcare: concepts and tools
Smith
unchanged: organisations should, in theory, seek to maximise aggregate value according to a societal judgement on the relative values of the individual services they provide.
Only organisations located at P* in figure 3 secure full technical and allocative efficiency. Some organisations such as A might produce the right mix of the two outputs but they lie within the frontier, so, although allocatively efficient, they are technically inefficient – they could produce more of each output. Other organisations, such as B, might lie on the optimal frontier, but produce an inappropriate mix of outputs, so are allocatively inefficient. In this case, B should produce more of output 2 at the expense of output 1, given society’s valuations. Yet other organisations, such as C, neither produce the right mix of outputs nor lie on the frontier, so are both technically and allocatively inefficient They have chosen the wrong mix of outputs and they are not producing as much of them as they could. The next two sections introduce the two ideas of allocative and technical efficiency in broad conceptual terms, relating them to the two fundamental managerial tasks of purchasing decisions and performance assessment.
1.2.1. Allocative efficiency: guiding purchasing decisions
A fundamental requirement in all health systems is to determine where the limited funds available for healthcare and health promotion are best spent. The principles of VfM suggest that the objective should be to maximise the cost-effectiveness of the health system, but this begs the question of what we mean by effectiveness. This is an issue discussed in more detail in section 2.1 below, but the dominant assumption in much VfM analysis has been that the prime objective should be to pursue the maximisation of the health gain generated by the health system.4 In principle, one could measure health gain crudely by the years of life added through the intervention of the health system. However, this is manifestly unsatisfactory as it ignores variations in the quality of life. The usual approach to measuring such gain has therefore become the ‘quality-adjusted life year’ (QALY), or its disability-adjusted life year (DALY) counterpart, as explained in box 1 (Gudex and Kind, 1988).5
Figure 3: Allocative and technical efficiency with just two outputs
Output 2
Output 1
c
c
•P*•C
•A
•B
F
F
4 Other possible objectives are discussed in section 2.1.
5 Similar arguments underlie other measures of health status, such as the diability-adjusted life year (DALY).

1. Introduction
16
Measuring value for money in healthcare: concepts and tools
Smith
Box 1: The quality-adjusted life year
The QALY is a year of life, adjusted for the quality (or value) of life it offers to the individual. A year in perfect health is considered equal to 1.0 QALY. Conversely, death would be given a weight of zero. The value of a year in ill health is adjusted depending on the severity of the condition. For example, a year bedridden might be given a value equal to 0.5 of a QALY. The QALY values of imperfect health should, in principle, reflect the extent to which individuals would be prepared to exchange a year of healthy life for a year in the unhealthy state. Thus, in this example, the value of 0.5 suggests that a period of six months of life in perfect health is equivalent to one year bedridden. This equivalence means that the QALYs from different treatments can be directly compared, even though the quality of life conferred by the treatments may be very different.6
In its simplest form, cost-effectiveness is the ratio of health gain to additional expenditure incurred. Its application suggests that decision makers should create a league table of the expected cost-effectiveness of individual health technologies, as defined by the cost of securing an additional quality-adjusted life year. Williams (1985) gave a celebrated early example of a cost-effectiveness league table, summarised in table 1. Note that, for each specific condition, the table includes only the most cost-effective technology available.
Table 1: An example of an incremental cost per QALY league table
Pacemaker for atrioventricular heart block £700
Hip replacement £750
Valve replacement for aortic stenosis £900
CABG (severe angina; left main disease) £1,040
CABG (severe angina; triple vessel disease) £1,270
CABG (moderate angina; left main disease) £1,330
CABG (severe angina; left main disease) £2,280
CABG (moderate angina; triple vessel disease) £2,400
CABG (mild angina; left main disease) £2,520
Kidney transplantation (cadaver) £3,000
CABG (moderate angina; double vessel disease) £4,000
Heart transplantation £5,000
CABG (mild angina; triple vessel disease) £6,300
Haemodialysis at home £11,000
CABG (mild angina; double vessel disease) £12,600
Haemodialysis in hospital £14,000
Source: Briggs and Gray (2000) adapted from Williams (1985)
6 Of course individuals may differ considerably in their valuations of different health states, and their views may change depending on whether or not they are already in poor health. There is a continuing academic debate on how to handle this variability, but for the purposes of this paper I have assumed that a legitimate authority would be able to resolve such conflicts and impose a single set of preferences.
1. Introduction
17
Measuring value for money in healthcare: concepts and tools
Smith
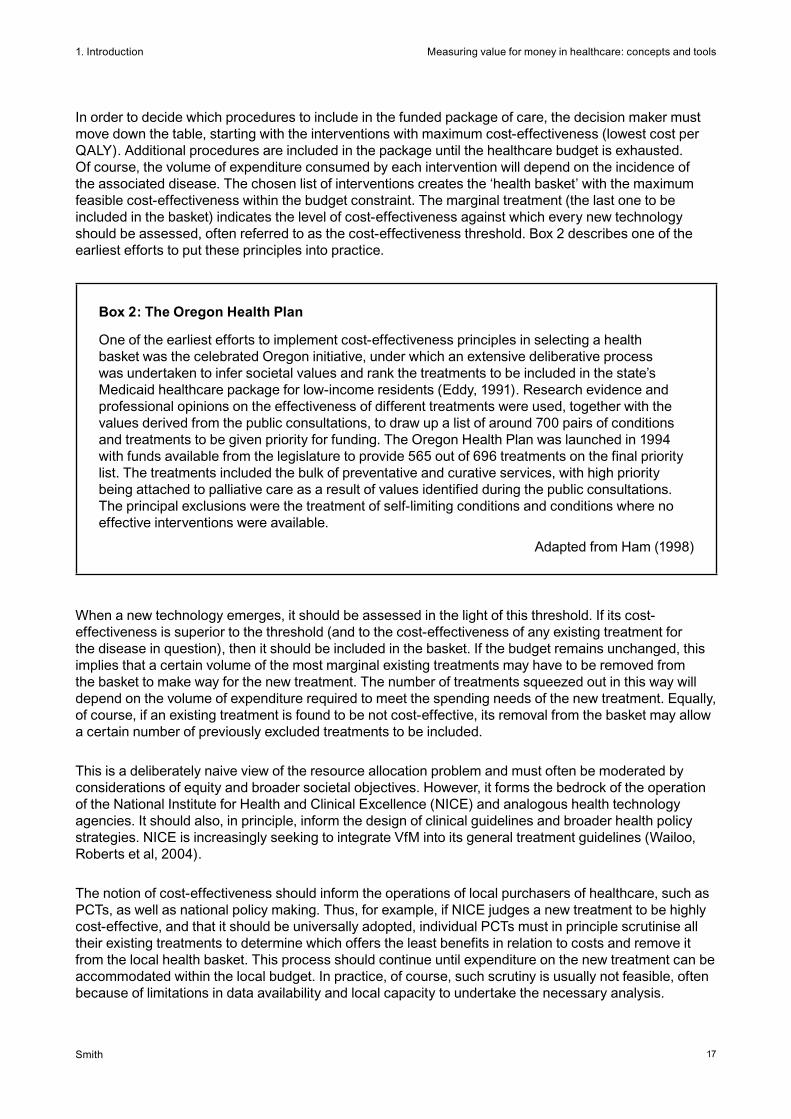
In order to decide which procedures to include in the funded package of care, the decision maker must move down the table, starting with the interventions with maximum cost-effectiveness (lowest cost per QALY). Additional procedures are included in the package until the healthcare budget is exhausted. Of course, the volume of expenditure consumed by each intervention will depend on the incidence of the associated disease. The chosen list of interventions creates the ‘health basket’ with the maximum feasible cost-effectiveness within the budget constraint. The marginal treatment (the last one to be included in the basket) indicates the level of cost-effectiveness against which every new technology should be assessed, often referred to as the cost-effectiveness threshold. Box 2 describes one of the earliest efforts to put these principles into practice.
Box 2: The Oregon Health Plan
One of the earliest efforts to implement cost-effectiveness principles in selecting a health basket was the celebrated Oregon initiative, under which an extensive deliberative process was undertaken to infer societal values and rank the treatments to be included in the state’s Medicaid healthcare package for low-income residents (Eddy, 1991). Research evidence and professional opinions on the effectiveness of different treatments were used, together with the values derived from the public consultations, to draw up a list of around 700 pairs of conditions and treatments to be given priority for funding. The Oregon Health Plan was launched in 1994 with funds available from the legislature to provide 565 out of 696 treatments on the final priority list. The treatments included the bulk of preventative and curative services, with high priority being attached to palliative care as a result of values identified during the public consultations. The principal exclusions were the treatment of self-limiting conditions and conditions where no effective interventions were available.
Adapted from Ham (1998)
When a new technology emerges, it should be assessed in the light of this threshold. If its cost-effectiveness is superior to the threshold (and to the cost-effectiveness of any existing treatment for the disease in question), then it should be included in the basket. If the budget remains unchanged, this implies that a certain volume of the most marginal existing treatments may have to be removed from the basket to make way for the new treatment. The number of treatments squeezed out in this way will depend on the volume of expenditure required to meet the spending needs of the new treatment. Equally, of course, if an existing treatment is found to be not cost-effective, its removal from the basket may allow a certain number of previously excluded treatments to be included.
This is a deliberately naive view of the resource allocation problem and must often be moderated by considerations of equity and broader societal objectives. However, it forms the bedrock of the operation of the National Institute for Health and Clinical Excellence (NICE) and analogous health technology agencies. It should also, in principle, inform the design of clinical guidelines and broader health policy strategies. NICE is increasingly seeking to integrate VfM into its general treatment guidelines (Wailoo, Roberts et al, 2004).
The notion of cost-effectiveness should inform the operations of local purchasers of healthcare, such as PCTs, as well as national policy making. Thus, for example, if NICE judges a new treatment to be highly cost-effective, and that it should be universally adopted, individual PCTs must in principle scrutinise all their existing treatments to determine which offers the least benefits in relation to costs and remove it from the local health basket. This process should continue until expenditure on the new treatment can be accommodated within the local budget. In practice, of course, such scrutiny is usually not feasible, often because of limitations in data availability and local capacity to undertake the necessary analysis.

1. Introduction
18
Measuring value for money in healthcare: concepts and tools
Smith
Moreover, as purchasing moves to the local level, local capacity and operational constraints become important considerations. For example, local providers may have slack capacity in certain specialties that, at least in the short term, might reduce the opportunity cost of implementing some new technologies relative to the assumed national costs. Conversely, in the short term, there may be substantial investment costs involved in implementing certain new technologies, perhaps because they involve major reconfiguration of services. Furthermore, there will usually be limited capacity to implement a large number of service changes. National measures of VfM may therefore have to be modified in the light of local circumstances.
Other local considerations may become important when interpreting national (or international) guidance. For example, local entities may be unable to reap the scale of economies assumed in national calculations; local populations may vary in demographic and epidemiological characteristics from the national norm; and variations in local preferences may be important, especially in health systems that seek to offer some local political autonomy in healthcare purchasing choices.
Analytic approaches such as programme budgeting and marginal analysis (PBMA) have been developed to guide local decision makers in making allocative decisions according to VfM criteria when there are significant local considerations (Mitton and Donaldson, 2004; Ruta, Mitton et al, 2005). For example, in the short to medium term, local decision makers may be constrained by factors outside their direct influence, such as the existing configuration of local hospitals, the distribution and interests of local GPs, and the supply of local social services (Birch and Gafni, 2002). Furthermore, local management is constrained in its capacity, and cannot practically address all necessary service changes immediately. The role of PBMA is to understand these limitations and to identify a feasible way of setting priorities that will lead to concrete gains in value for money.
Box 3: Stages in priority setting using programme budgeting and marginal analysis
Determine the aim and scope of the priority setting exercise: Will the analysis examine changes in services within a given programme or between programmes?
Compile a programme budget: The resources and costs of programmes combined with activity information
Form a marginal analysis advisory panel: The panel should include key stakeholders (managers, clinicians, consumers, etc) in the priority setting process
Determine locally relevant decision making criteria: The advisory panel determines local priorities (maximising benefits, improving access and equity, reducing waiting times, etc) with reference to national, regional and local objectives
Identify where services could grow and where resources could be released through improved efficiency or scaling back or stopping some services: The panel uses the programme budget along with information on decision making objectives, evidence on benefits from service, changes in local healthcare needs, and policy guidance to highlight options for investment and disinvestment
Evaluate investments and disinvestments: Evaluate the costs and benefits for each option and make recommendations for change
Validate results and reallocate resources: Re-examine and validate evidence and judgements used in the process and reallocate resources according to cost–benefit ratios and other decision making criteria
Source: Peacock, Ruta et al (2006)
1. Introduction
19
Measuring value for money in healthcare: concepts and tools
Smith
Box 3 summarises the PBMA process suggested by Peacock, Ruta et al (2006). It highlights the central role of assessing the local situation and the importance of seeking out ways to move incrementally towards a more cost-effective configuration of local services. Note that this marginal approach is the antithesis of the classical economic evaluation of health technologies described earlier in this section, which implicitly assumes that the only constraint is one of financial resources.
The principles of health technology assessment relate primarily to the prospective assessment of whether healthcare providers should adopt new technologies, and this section has emphasised the importance of allocative efficiency in prospectively guiding purchasing decisions. However, there is often a case for also embedding allocative efficiency considerations in retrospective performance assessment. It may, for example, be important to ensure that providers are providing services in line with the purchaser’s intentions and not diverting resources to services that have low societal valuations. For example, a PCT may purchase ophthalmology services assuming a certain treatment threshold for, say, cataract surgery. If the purchaser relaxes that threshold, it breaches the purchaser’s allocative efficiency assumption and therefore compromises VfM maximisation.
1.2.2. Technical efficiency: operational performance assessment
The allocation decision usually assumes that the chosen health basket will be delivered to maximum effect: that is, it is assumed that a certain level of cost-effectiveness will be secured for each of the treatments in the basket. There is a quite distinct concern about whether providers carry out their chosen activities in line with this assumption. This aspect of VfM reflects concerns about technical efficiency and, in contrast to the allocative perspective, usually adopts a retrospective, performance assessment focus.
Technical efficiency should be a central concern of national regulators such as the Audit Commission and the Care Quality Commission in England, which seek to determine, for example, whether unit costs of individual providers are excessive. Partial indicators of technical efficiency, such as average length of stay, abound, but the same overarching criterion of cost-effectiveness that underlies allocative efficiency should inform the analysis of technical efficiency. It therefore seems natural to include quality (effectiveness) issues, as well as quantity of outputs produced, within the ambit of technical efficiency wherever feasible. This broader concept of technical efficiency moves the analysis closer to a retrospective measure of cost-effectiveness. It seeks to determine whether specific providers have produced the expected health benefits at the lowest feasible expected costs.
Independent engineering standards rarely indicate the maximum attainable level of technical efficiency. The prime instruments for assessing technical efficiency have therefore become various benchmarking tools, which seek to compare different providers using partial indicators of VfM such as length of stay and unit costs, and usually focus on specific diseases or treatments. While these allow individual organisations to focus on apparent examples of good and bad practice, they are usually piecemeal and incomplete. Moreover, in interpreting input and output data, one must take account of variations in the circumstances of the different entities under scrutiny, often in the form of variations in patient characteristics or disease severity. This is essential if one is to gain insight into how much apparent variation in VfM can be attributed to the health organisation. Attribution is often addressed using techniques such as risk adjustment; these are discussed further in section 3.1.
VfM benchmarking was a central concern of the very earliest performance indicators distributed to English health authorities in the 1980s. These early data contained a number of rudimentary measures of unit costs, and were intended ‘to help [managers] to assess the efficiency of the services for which they are responsible’ (Department of Health and Social Security, 1983). Once the internal NHS market became established, such benchmarking initiatives fell out of favour, perhaps because it was believed that market forces would naturally encourage local purchasers and providers to pursue
1. Introduction
20
Measuring value for money in healthcare: concepts and tools
Smith
efficiency. However, the development of a suite of VfM indicators by the NHS Institute for Innovation and Improvement (described in section 1.5 below) suggests that there is an acknowledged need for VfM benchmarking data even in a more market-oriented environment.
Recognising the limitations of piecemeal comparison, analysts have developed a range of statistical and management science techniques. These seek to assess the global technical efficiency of individual institutions, based on measures of total inputs and total outputs (or outcomes where quality is known). Such measures attempt to measure the ratio of all outputs, aggregated in some fashion, to all inputs. Examples include techniques such as data envelopment analysis and stochastic frontier analysis, discussed further in section 3.2.
1.3. What is the unit of analysis?
Fundamental to any examination of VfM is the need for clarity about the nature of the entity under scrutiny and the scope of the associated analysis. At the micro end of the spectrum, the entity might be a single treatment, the intention being to assess its value (benefit) in relation to cost. The health technology assessment movement has made enormous progress in developing methodologies with which to assess the cost-effectiveness of individual treatments (Drummond, Sculpher et al, 2005). Some of the most advanced methods embed costing methodologies within clinical trials, so that inputs and outcomes can be directly aligned. Yet agencies such as NICE can examine only a fraction of the technologies used in healthcare, and have mainly concentrated on recent technological innovations. There is often little evidence concerning the VfM of established technologies, and the VfM of much healthcare remains an article of faith rather than an established fact. In short, great strides have been made in the methodology for examining the VfM of treatments. However, it has been satisfactorily applied to only a fraction of healthcare, and putting in place the research capacity needed to provide a broader evidence base is a daunting prospect.
At the macro end of the spectrum, the most challenging task is scrutiny of the VfM of the entire health system, defined by WHO as ‘all the activities whose primary purpose is to promote, restore or maintain health’ (World Health Organization, 2000). In practice, this definition has proved very difficult to make operational. Health system outcomes are usually defined mainly in terms of the health of the population. However, many variations in mortality and disability appear to be beyond the direct control of the health system, as defined, and even identifying all the inputs that comprise the health system is challenging.
A more usual form of retrospective VfM study therefore seeks to identify the performance of meso-level entities, such as specific practitioners, teams, hospitals or other organisations within the health system. Here the challenge is that such organisational entities may be operating in quite different circumstances, perhaps because the population being cared for or the patients being treated differ markedly. Usually, some form of risk adjustment becomes essential if meaningful comparison is to be made.
Emerging data capacity, in the form of individual patient records and long-term household surveys, is now making it increasingly feasible to focus on the individual as the basic unit of VfM analysis. Often this will take the form of a patient’s episode of care, requiring estimates of the resource inputs devoted to the patient and the outcomes secured in a circumscribed setting. The European HealthBASKET project demonstrated how this could be done on the inputs side for ten patient vignettes (Busse, Schreyögg et al, 2008). The project yielded estimates of variations in costs between individual patients, hospitals and countries. However, it did not consider outcomes, and demonstrated the major challenges involved in assigning resource use to individual patients.
Furthermore, it may on occasions be important to extend the analytic perspective to a whole population basis to capture individuals who may have benefited from but have not received treatment. In a similar
1. Introduction
21
Measuring value for money in healthcare: concepts and tools
Smith
vein, for many patients with chronic conditions, it may be more appropriate to move beyond discrete episodes of care and examine the cost-effectiveness of, say, the year of care provided by the health system in whatever provider setting.
There is no simple answer to the question of what the appropriate unit of analysis might be. There are considerable methodological challenges whichever unit is selected. However, as a general principle, it is important that the analysis reflects an entity for which there is clear accountability, whether it is the whole health system, the health services organisation or the individual patient. Only then can the relevant agent, whether it is the government, management board or physician, be held to account for the level of performance revealed by the analysis.
1.4. Comprehensive or partial VfM measures?
Whatever the unit of analysis, a major decision in VfM analyses is whether to attempt to develop a comprehensive measure of VfM, embracing all the major inputs and outputs of the whole entity under scrutiny, or to resort to partial indicators of VfM. The attraction of comprehensive measures is obvious, and is the ideal pursued by NICE in its evaluation of treatments. Yet there is a powerful argument that partial VfM measures also offer useful insights, especially when seeking to diagnose the reasons for poor VfM. This section considers the various approaches, but it should be noted that, for many purposes, it is helpful to have available both comprehensive and partial VfM metrics.
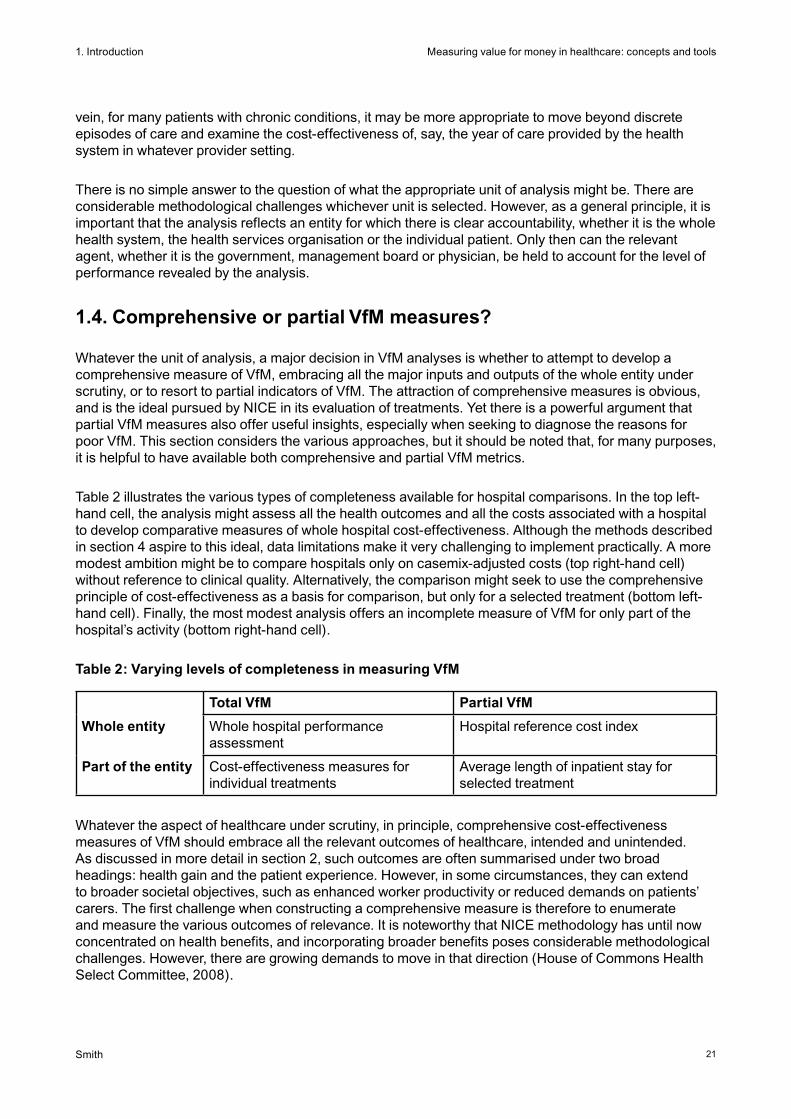
Table 2 illustrates the various types of completeness available for hospital comparisons. In the top left-hand cell, the analysis might assess all the health outcomes and all the costs associated with a hospital to develop comparative measures of whole hospital cost-effectiveness. Although the methods described in section 4 aspire to this ideal, data limitations make it very challenging to implement practically. A more modest ambition might be to compare hospitals only on casemix-adjusted costs (top right-hand cell) without reference to clinical quality. Alternatively, the comparison might seek to use the comprehensive principle of cost-effectiveness as a basis for comparison, but only for a selected treatment (bottom left-hand cell). Finally, the most modest analysis offers an incomplete measure of VfM for only part of the hospital’s activity (bottom right-hand cell).
Table 2: Varying levels of completeness in measuring VfM
Total VfM Partial VfM
Whole entity Whole hospital performance assessment
Hospital reference cost index
Part of the entity Cost-effectiveness measures for individual treatments
Average length of inpatient stay for selected treatment
Whatever the aspect of healthcare under scrutiny, in principle, comprehensive cost-effectiveness measures of VfM should embrace all the relevant outcomes of healthcare, intended and unintended. As discussed in more detail in section 2, such outcomes are often summarised under two broad headings: health gain and the patient experience. However, in some circumstances, they can extend to broader societal objectives, such as enhanced worker productivity or reduced demands on patients’ carers. The first challenge when constructing a comprehensive measure is therefore to enumerate and measure the various outcomes of relevance. It is noteworthy that NICE methodology has until now concentrated on health benefits, and incorporating broader benefits poses considerable methodological challenges. However, there are growing demands to move in that direction (House of Commons Health Select Committee, 2008).
1. Introduction
22
Measuring value for money in healthcare: concepts and tools
Smith
In developing a comprehensive measure, the associated measures of outcome must be combined according to some measure of the relative value of each outcome. This aggregation is essential if valid comparisons are to be made between different treatments for the same disease, and between different treatments for different diseases. Only if the relative benefits of treatments can be assessed in a common currency is it possible to make informed judgements about the comparative VfM of different treatments and different organisations.
In some domains, there has been extensive research on estimating values – for example, methodologies underlying the QALY have derived estimates of the trade-off between quality of life (in the form of pain, mobility, etc) and length of life implicit in many treatments. Although there exist large interpersonal variations, and therefore continued debates about how to infer a societal set of values, this approach permits comparison of diverse treatments in a common currency, a fundamental requirement for developing a comprehensive measure of outcome (as summarised in box 1). However, in areas beyond health-related quality of life, valuation is at a rudimentary stage of development – for example, there is little evidence on how much citizens are prepared to trade off, say, waiting time against the clinical quality of care (see section 2.2).
Whatever methodology is employed, once a composite measure of outcome has been derived, it can be compared with the inputs (expenditure) to derive an estimate of VfM. Even here, however, there are challenges. It can be quite challenging to estimate the inputs associated with the entity under scrutiny. In particular, in hospitals, many of the costs are associated with various forms of overheads, and it can be difficult to attribute the inputs to a specific treatment, department or team (section 2.3).
Also, on the inputs side, it should be noted that a comprehensive VfM measure might also have to include expenditure not directly borne by the health sector. For example, some treatments or delivery methods might impose substantial private costs on patients and their carers that are not borne by the health system. The issue of who pays or value for whose money has received little attention to date, but might become increasingly important as NICE broadens its remit. Furthermore, as with partial indicators, it is often important to make some sort of adjustment for the environment within which each of the entities is operating, such as the complexity of casemix (see section 2.4).
Note that comprehensive measures of VfM should also, in principle, accommodate the longer time perspective. Many of the inputs to patient care take place over a number of years – for example, in the form of preventative care – so merely comparing current inputs with current outputs may give a misleading picture of VfM. Comprehensive VfM measures may therefore have to embrace quite long time horizons. This issue is discussed further in section 2.5.
1.5. Some examples of VfM performance measures
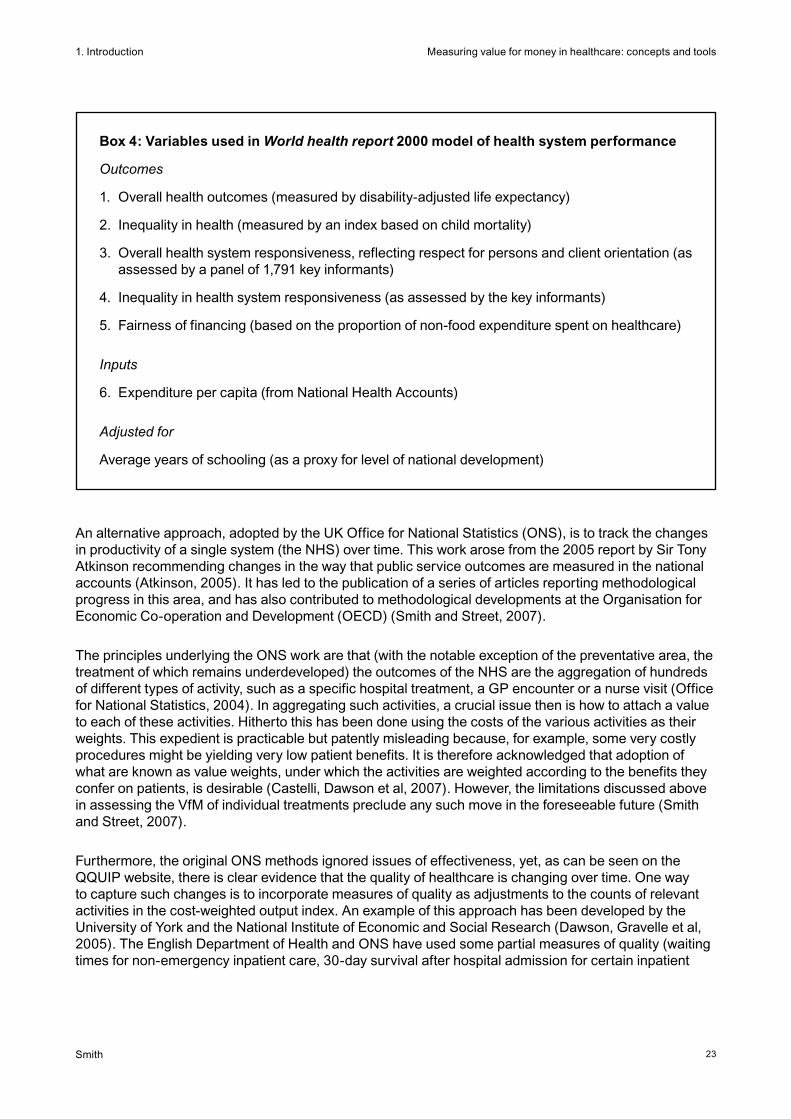
This section illustrates the principles set out above with some examples of performance assessment efforts to date. At the most ambitious level, WHO sought to derive a comprehensive measure of health system performance in its World health report (WHR) 2000, which derived estimates of the cost-effectiveness of the health system in each of its 181 member countries (World Health Organization, 2000). Box 4 describes the variables used in deriving this VfM measure. Five outcomes were specified, alongside one input of health system expenditure. In addition, an adjustment was made for the level of national development (as measured by average years of schooling). The WHO exercise provoked a vigorous debate in policy and academic circles, and the response highlighted the enormous challenges involved in deriving whole-system VfM measures (Anand, Ammar et al, 2003). In short, it demonstrated that there are major issues still to be addressed in conceptualising the notion of the health system, in measuring and valuing health system outcomes, and in quantifying the contribution of the health system to outcomes.
1. Introduction
23
Measuring value for money in healthcare: concepts and tools
Smith
Box 4: Variables used in World health report 2000 model of health system performance
Outcomes
1. Overall health outcomes (measured by disability-adjusted life expectancy)
2. Inequality in health (measured by an index based on child mortality)
3. Overall health system responsiveness, reflecting respect for persons and client orientation (as assessed by a panel of 1,791 key informants)
4. Inequality in health system responsiveness (as assessed by the key informants)
5. Fairness of financing (based on the proportion of non-food expenditure spent on healthcare)
Inputs
6. Expenditure per capita (from National Health Accounts)
Adjusted for
Average years of schooling (as a proxy for level of national development)
An alternative approach, adopted by the UK Office for National Statistics (ONS), is to track the changes in productivity of a single system (the NHS) over time. This work arose from the 2005 report by Sir Tony Atkinson recommending changes in the way that public service outcomes are measured in the national accounts (Atkinson, 2005). It has led to the publication of a series of articles reporting methodological progress in this area, and has also contributed to methodological developments at the Organisation for Economic Co-operation and Development (OECD) (Smith and Street, 2007).
The principles underlying the ONS work are that (with the notable exception of the preventative area, the treatment of which remains underdeveloped) the outcomes of the NHS are the aggregation of hundreds of different types of activity, such as a specific hospital treatment, a GP encounter or a nurse visit (Office for National Statistics, 2004). In aggregating such activities, a crucial issue then is how to attach a value to each of these activities. Hitherto this has been done using the costs of the various activities as their weights. This expedient is practicable but patently misleading because, for example, some very costly procedures might be yielding very low patient benefits. It is therefore acknowledged that adoption of what are known as value weights, under which the activities are weighted according to the benefits they confer on patients, is desirable (Castelli, Dawson et al, 2007). However, the limitations discussed above in assessing the VfM of individual treatments preclude any such move in the foreseeable future (Smith and Street, 2007).
Furthermore, the original ONS methods ignored issues of effectiveness, yet, as can be seen on the QQUIP website, there is clear evidence that the quality of healthcare is changing over time. One way to capture such changes is to incorporate measures of quality as adjustments to the counts of relevant activities in the cost-weighted output index. An example of this approach has been developed by the University of York and the National Institute of Economic and Social Research (Dawson, Gravelle et al, 2005). The English Department of Health and ONS have used some partial measures of quality (waiting times for non-emergency inpatient care, 30-day survival after hospital admission for certain inpatient
1. Introduction
24
Measuring value for money in healthcare: concepts and tools
Smith
activities, blood pressure control for patients in general practice) to demonstrate the method (Office for National Statistics, 2006).
The principle adopted has been to apply the selective quality measure to relevant activities before aggregating into the output index. For example, trends in the numbers of certain inpatient episodes are weighted by concurrent trends in post-operative survival rates to yield quality-adjusted time series of outcomes before they are aggregated into the cost-weighted activity index. The present ONS assumption is that there is a one-to-one relationship between such quality measures and the outcome of interest. I shall argue below (section 2.1.1) that this argument is open to challenge.
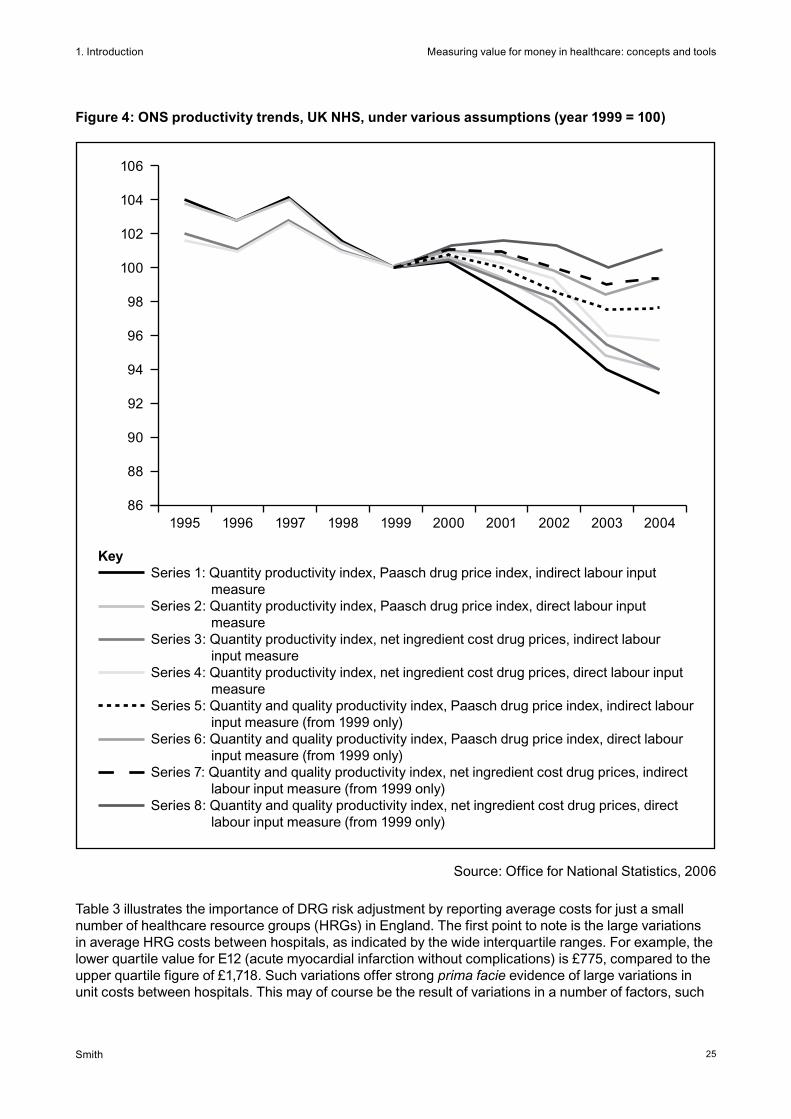
Figure 4 illustrates the trends in productivity over a ten-year period as produced by the ONS methodology under a variety of assumptions. The first four series use only a quantity measure of output (NHS activities weighted by cost), while the last four seek to include quality measures, principally in the form of post-operative survival rates. The results suggest a high level of sensitivity to the assumptions used, with changes in productivity since 1999 ranging from an average annual fall of 1.3 per cent (series 1) to an average annual rise of 0.2 per cent (series 8). It is noteworthy that the incorporation of quality adjustments markedly improves the estimates of productivity change, reflecting a steady improvement in certain aspects of NHS quality since 1999. ONS has subsequently incorporated the results of consultations on methodology, and more recent work focuses on a narrower range of options (Office for National Statistics, 2008). Over the period 2000 to 2006, these results indicate a drop in productivity of 2.5 per cent per annum with no quality adjustment, and 2.0 per cent per annum if quality improvements are taken into account.
As well as measuring VfM at the treatment level and the whole-system level, there have been numerous attempts to develop measures of the VfM of all types of organisations and practitioners within the health system in a huge range of settings (Hollingsworth, 2003). Such measures are based on the analytic statistical models described further in section 3.2. They undoubtedly offer some insights into organisational performance. However, they often treat the organisation as a ‘black box’, and do not pinpoint where in the production process inefficiencies are arising. Furthermore, to satisfy the need to be comprehensive, they often have to rely on very questionable data; most notably, they rarely use adequate outcome data. These measures therefore usually stop short of being fully comprehensive, and can be be unreliable and hard to interpret. As a result, analytic effort has concentrated on developing partial measures of VfM, as a practical response to the difficulty of developing comprehensive measures and to provide more operationally useful information about VfM.
Some of the earliest partial measures include the unit costs of a single aspect of treatment, such as an episode of inpatient care. These offer a summary measure of cost efficiency and indicate the extent to which a) inputs are being purchased at minimum price, b) the organisation is deploying them in an optimal fashion (that is, in the correct allocative mix) and c) the organisation is operating them with optimal technical efficiency. Valid comparison of unit costs requires the units of physical output to be comparable (they must entail treatment of identical types of patient) and the quality of outcome to be identical. If these conditions do not hold, then proper VfM comparison requires an extended analysis to embrace variations in outcome measures.
In practice, hospitals treat an extraordinarily heterogeneous mix of patients, so the most rudimentary requirement for valid comparison is to adjust for variations in casemix between hospitals. The celebrated system of diagnosis-related groups (DRGs) was originally developed with such adjustment in mind, so that the actual costs of each hospital could be assessed with respect to its expected costs given the casemix of patients it treats (Fetter, 1991). The intention is to aggregate patients into a manageable number of clinically meaningful treatment groups within which one could expect to observe a reasonable homogeneity of costs.
1. Introduction
25
Measuring value for money in healthcare: concepts and tools
Smith
106
104
102
100
98
96
94
92
90
88
861995 1996 1997 1998 1999 2000 2001 2002 2003 2004
Figure 4: ONS productivity trends, UK NHS, under various assumptions (year 1999 = 100)
Source: Office for National Statistics, 2006
KeySeries 1: Quantity productivity index, Paasch drug price index, indirect labour input
measure Series 2: Quantity productivity index, Paasch drug price index, direct labour input
measureSeries 3: Quantity productivity index, net ingredient cost drug prices, indirect labour
input measure Series 4: Quantity productivity index, net ingredient cost drug prices, direct labour input
measureSeries 5: Quantity and quality productivity index, Paasch drug price index, indirect labour
input measure (from 1999 only) Series 6: Quantity and quality productivity index, Paasch drug price index, direct labour
input measure (from 1999 only)Series 7: Quantity and quality productivity index, net ingredient cost drug prices, indirect
labour input measure (from 1999 only) Series 8: Quantity and quality productivity index, net ingredient cost drug prices, direct
labour input measure (from 1999 only)
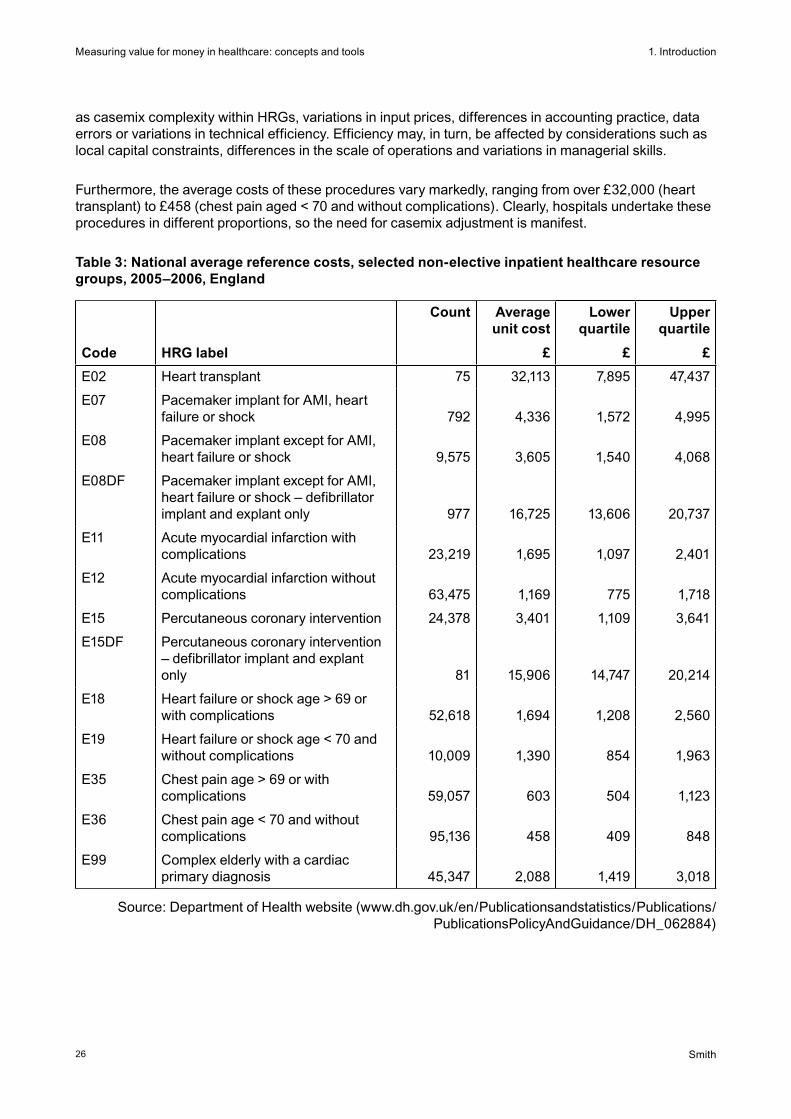
Table 3 illustrates the importance of DRG risk adjustment by reporting average costs for just a small number of healthcare resource groups (HRGs) in England. The first point to note is the large variations in average HRG costs between hospitals, as indicated by the wide interquartile ranges. For example, the lower quartile value for E12 (acute myocardial infarction without complications) is £775, compared to the upper quartile figure of £1,718. Such variations offer strong prima facie evidence of large variations in unit costs between hospitals. This may of course be the result of variations in a number of factors, such
1. Introduction
26
Measuring value for money in healthcare: concepts and tools
Smith
as casemix complexity within HRGs, variations in input prices, differences in accounting practice, data errors or variations in technical efficiency. Efficiency may, in turn, be affected by considerations such as local capital constraints, differences in the scale of operations and variations in managerial skills.
Furthermore, the average costs of these procedures vary markedly, ranging from over £32,000 (heart transplant) to £458 (chest pain aged < 70 and without complications). Clearly, hospitals undertake these procedures in different proportions, so the need for casemix adjustment is manifest.
Table 3: National average reference costs, selected non-elective inpatient healthcare resource groups, 2005–2006, England
Code HRG label
Count Average unit cost
£
Lower quartile
£
Upper quartile
£
E02 Heart transplant 75 32,113 7,895 47,437
E07 Pacemaker implant for AMI, heart failure or shock 792 4,336 1,572 4,995
E08 Pacemaker implant except for AMI, heart failure or shock 9,575 3,605 1,540 4,068
E08DF Pacemaker implant except for AMI, heart failure or shock – defibrillator implant and explant only 977 16,725 13,606 20,737
E11 Acute myocardial infarction with complications 23,219 1,695 1,097 2,401
E12 Acute myocardial infarction without complications 63,475 1,169 775 1,718
E15 Percutaneous coronary intervention 24,378 3,401 1,109 3,641
E15DF Percutaneous coronary intervention – defibrillator implant and explant only 81 15,906 14,747 20,214
E18 Heart failure or shock age > 69 or with complications 52,618 1,694 1,208 2,560
E19 Heart failure or shock age < 70 and without complications 10,009 1,390 854 1,963
E35 Chest pain age > 69 or with complications 59,057 603 504 1,123
E36 Chest pain age < 70 and without complications 95,136 458 409 848
E99 Complex elderly with a cardiac primary diagnosis 45,347 2,088 1,419 3,018
Source: Department of Health website (www.dh.gov.uk/en/Publicationsandstatistics/Publications/PublicationsPolicyAndGuidance/DH_062884)
1. Introduction
27
Measuring value for money in healthcare: concepts and tools
Smith
The information in table 3 highlights why risk adjustment is essential when comparing hospital costs. In England, national reference costs have been used to construct the reference cost index for each hospital trust. This indicates the ratio of the trust’s actual total costs to its expected total costs, if its costs for each treatment were at the national average level. Expected costs are calculated by multiplying the number of cases in each HRG by the associated national unit cost and summing across the trust’s activity. Amongst acute trusts (excluding specialist hospitals), the index in 2004–2005 ranged from 21 per cent below expected costs (West Suffolk Hospitals Trust) to 30 per cent above expected costs (Chelsea and Westminster Healthcare Trust) after adjusting for the higher input prices in London and the southeast.
Numerous other partial indicators of VfM exist. In hospital care, the most widely used is ‘length of inpatient stay’ associated with an episode. In its narrowest sense, this indicator merely indicates the use made of a single hospital resource (its beds). However, it is readily measured, and under certain assumptions acts as a proxy for use of a broader set of inputs such as the associated personnel, and therefore offers some more general insight into how technically efficient hospital resources are being used. Again, the interpretation of length of stay requires careful consideration of casemix and mitigating considerations. Furthermore, its use illustrates the risk of partial indicators, as a reduction in length of stay might be secured by sacrificing aspects of treatment quality or by shifting costs onto other parties (such as patients or social care).
None of the measures mentioned above captures variations in quality between hospitals. Do the cost or process variations reflect to some extent unmeasured variations in health outcomes (such as mortality)? To the extent that measurement instruments permit, it is therefore desirable to view measures of cost efficiency and technical efficiency in the light of quality indicators. To date, the emphasis has been on various measures of mortality associated with hospital care. However, there is currently a concerted move towards more general collection of outcome data in the form of patient-reported health outcomes and patient experience surveys (see section 2). To get a full picture of VfM, it is desirable to integrate these measures into the analysis and move towards more complete measures of cost-effectiveness.
The types of partial VfM indicators routinely used in healthcare are illustrated by the ‘Better care, better value’ productivity indicators published quarterly by the NHS Institute for Innovation and Improvement for NHS organisations (summarised in table 4; details at www.productivity.nhs.uk/). These focus on various aspects of the care process (such as length of stay and use of day case surgery), use of resources (such as consultant productivity and staff sickness absence) and financial control. It is noteworthy that many of the indicators associated with patient care are adjusted for the characteristics of the patients or the underlying population, illustrating the importance of casemix adjustment. Such measures offer useful insights into the VfM of various aspects of the transformation from inputs into physical outputs of healthcare. However, it should be noted that there is no attempt to integrate outcomes measures into this set of indicators.

1. Introduction
28
Measuring value for money in healthcare: concepts and tools
Smith
Table 4: NHS Institute for Innovation and Improvement: ‘Better care, better value’ indicators
Clinical productivity
1. Length of stay Adjusted for age, sex, diagnosis, method of admission and social deprivation
2. Day case surgery rates Percentage of a basket of 25 relevant procedures performed as a day case
3. Pre-operative bed days Pre-operative bed days as percentage of all bed days associated with operations
4. Variation in surgical thresholds
Number of operations from a basket of five relevant procedures relative to expected number given the PCT population
5. Variation in emergency admissions
Actual emergency admissions as ratio of expected level, given the age, sex and need of the population for 19 conditions
6. Variation in outpatient appointments
Actual first attended outpatient appointments as ratio of expected numbers given the age, sex and need of the local population
Finance
7. Financial balance Whether the organisation is heading for financial balance at the end of the financial year
8. Cash flow Actual year to date cash drawings compared to planned year to date cash drawings
9. Monthly ‘run rate’ Variance between actual surplus/(deficit) for the last month and planned surplus/(deficit), as a percentage of total planned income
Prescribing
10. Low-cost statin prescribing
Number of prescription items for low-cost statins as a percentage of the total number of prescriptions for all statins (excluding combination products)
Procurement
11. Uptake of national framework agreements
Uptake of national framework agreements
Workforce
12. Staff turnover Number of full-time equivalent leavers from an individual organisation as percentage of average numbers in post
13. Sickness absence rates
The number of full-time equivalent staff days lost to sickness absence as percentage of staff in post for the time period
14. Agency costs Amount spent on agency staff, expressed as a percentage of paybill plus agency spend
15. Consultant productivity Consultant activity (finished consultant episodes and cost-weighted activity) in relation to national patterns
Source: www.productivity.nhs.uk
2. What are the components of VfM?
29
Measuring value for money in healthcare: concepts and tools
Smith
2. What are the components of VfM?
Section 1 discussed the variety of VfM concepts that exist, and the challenge of interpreting incomplete or imperfect VfM measures. Whatever concept of VfM or operational measure is being used, it is essential to have a clear understanding of the component parts of the VfM calculation, to be able to understand its strengths and limitations, and to determine priorities for further data collection or analysis.
This section examines the building blocks of any VfM concept in healthcare. Section 2.1 discusses the notion of the ‘value’ of the various health system outputs, while 2.2 examines how those values might be quantified. Section 2.3 examines the resource inputs of the health system (the money side of VfM), and 2.4 discusses the important issue of environmental constraints on performance, which may be thought of as uncontrollable inputs. Section 2 concludes with a discussion of the important issue of whether a short or long run time horizon is being adopted for the analysis.
2.1. What is valued?
Once the nature of the entity under VfM scrutiny has been established, the first question to ask is what its valued output is. Some activities and outputs – such as the time spent between patient visits by community nurses – may be of little value to anyone. What matters is how much society values the various health sector outputs. In this section, we therefore discuss the outcomes of the health system that society values, and how these outcomes might be measured.
There is general agreement that the prime objective of healthcare is to improve health. Alongside this, we also consider three other important categories of objective: responsiveness to patients’ needs, addressing inequalities, and broader economic objectives. This list of outcomes is not exhaustive. In many countries, the degree of financial protection from catastrophic expenditure offered by the health system is an important outcome measure. This insurance role is often taken for granted in debates in most developed countries. And the health system can also offer substantial benefits to citizens by reassuring them that, should the need arise, relevant healthcare will be made available. I do not consider this important reassurance role here. Section 2.1 concludes with a discussion of the more prosaic measures of healthcare activity and outputs that are often used in VfM studies in the absence of proper outcome measures.
2.1.1. Health gain7
The most immediate outcome of healthcare is the additional health conferred on the patient, and the case for defining health system outcomes in terms of health gain is manifest. For most patients and carers, health gain is the central indicator of the success of an intervention. A focus on these health-related outcomes directs attention towards the patient (rather than towards the outputs produced by the organisation). Moreover, some widely accepted measures of health gain (such as the change in QUALYs) are independent of the technologies used to deliver care, obviating the need for detailed scrutiny of the physical actions of organisations when comparing performance.
The measure of health gain should indicate the value added to health as a result of contact with the health system. Such measures of added value are routinely deployed in other sectors, notably
7 Much of the health services research literature refers to health gains as the ‘outcomes’ of an intervention. This is understandable since health is the prime focus of most health service interventions. However, I avoid the convention in this paper, as I wish to reserve the term ‘outcomes’ for all the valued outputs of the health system, which sometimes extend beyond health gain.
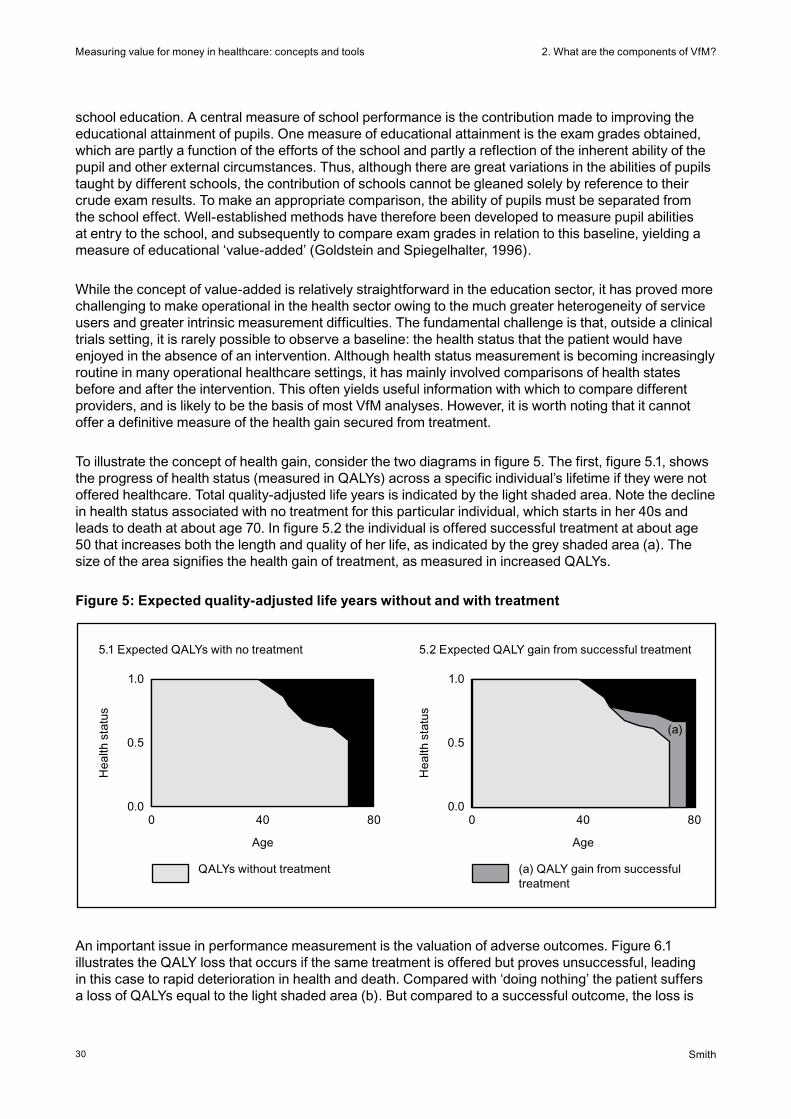
2. What are the components of VfM?
30
Measuring value for money in healthcare: concepts and tools
Smith
school education. A central measure of school performance is the contribution made to improving the educational attainment of pupils. One measure of educational attainment is the exam grades obtained, which are partly a function of the efforts of the school and partly a reflection of the inherent ability of the pupil and other external circumstances. Thus, although there are great variations in the abilities of pupils taught by different schools, the contribution of schools cannot be gleaned solely by reference to their crude exam results. To make an appropriate comparison, the ability of pupils must be separated from the school effect. Well-established methods have therefore been developed to measure pupil abilities at entry to the school, and subsequently to compare exam grades in relation to this baseline, yielding a measure of educational ‘value-added’ (Goldstein and Spiegelhalter, 1996).
While the concept of value-added is relatively straightforward in the education sector, it has proved more challenging to make operational in the health sector owing to the much greater heterogeneity of service users and greater intrinsic measurement difficulties. The fundamental challenge is that, outside a clinical trials setting, it is rarely possible to observe a baseline: the health status that the patient would have enjoyed in the absence of an intervention. Although health status measurement is becoming increasingly routine in many operational healthcare settings, it has mainly involved comparisons of health states before and after the intervention. This often yields useful information with which to compare different providers, and is likely to be the basis of most VfM analyses. However, it is worth noting that it cannot offer a definitive measure of the health gain secured from treatment.
To illustrate the concept of health gain, consider the two diagrams in figure 5. The first, figure 5.1, shows the progress of health status (measured in QALYs) across a specific individual’s lifetime if they were not offered healthcare. Total quality-adjusted life years is indicated by the light shaded area. Note the decline in health status associated with no treatment for this particular individual, which starts in her 40s and leads to death at about age 70. In figure 5.2 the individual is offered successful treatment at about age 50 that increases both the length and quality of her life, as indicated by the grey shaded area (a). The size of the area signifies the health gain of treatment, as measured in increased QALYs.
Figure 5: Expected quality-adjusted life years without and with treatment
5.1 Expected QALYs with no treatment
Hea
lth s
tatu
s
1.0
0.5
0.00 40 80
Age
QALYs without treatment
5.2 Expected QALY gain from successful treatment
Hea
lth s
tatu
s
1.0
0.5
0.00 40 80
Age
(a) QALY gain from successful treatment
(a)
An important issue in performance measurement is the valuation of adverse outcomes. Figure 6.1 illustrates the QALY loss that occurs if the same treatment is offered but proves unsuccessful, leading in this case to rapid deterioration in health and death. Compared with ‘doing nothing’ the patient suffers a loss of QALYs equal to the light shaded area (b). But compared to a successful outcome, the loss is
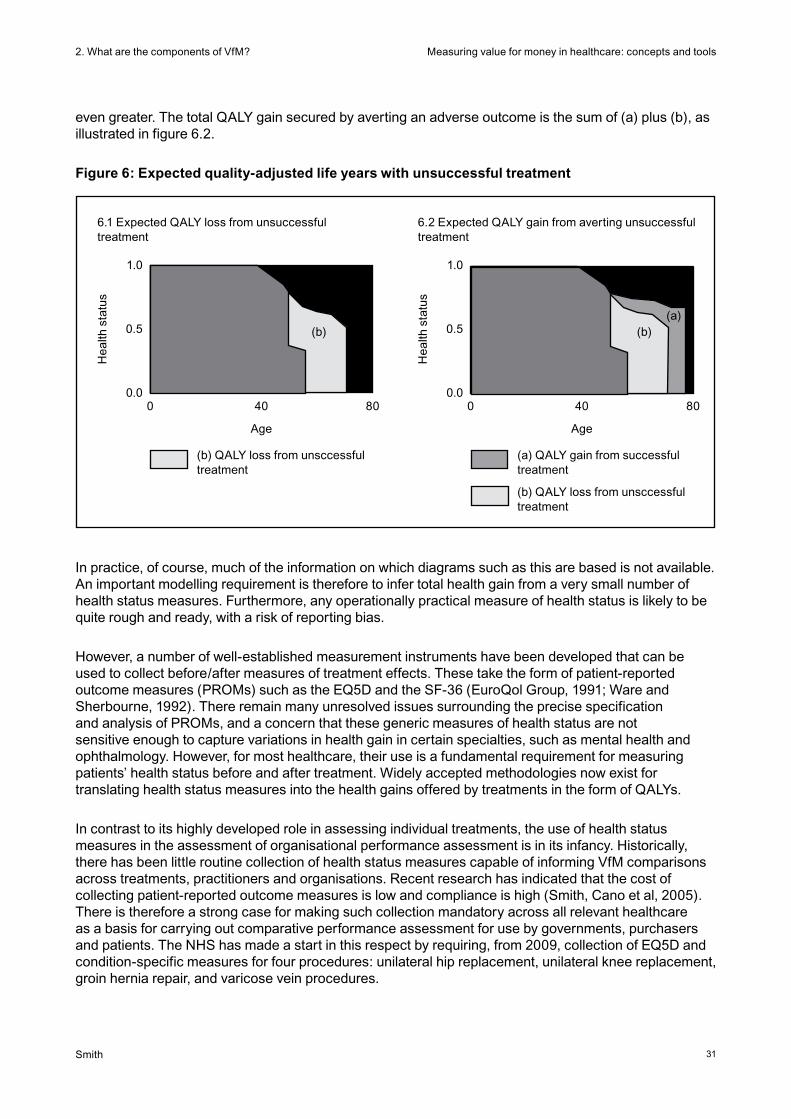
2. What are the components of VfM?
31
Measuring value for money in healthcare: concepts and tools
Smith
even greater. The total QALY gain secured by averting an adverse outcome is the sum of (a) plus (b), as illustrated in figure 6.2.
Figure 6: Expected quality-adjusted life years with unsuccessful treatment
In practice, of course, much of the information on which diagrams such as this are based is not available. An important modelling requirement is therefore to infer total health gain from a very small number of health status measures. Furthermore, any operationally practical measure of health status is likely to be quite rough and ready, with a risk of reporting bias.
However, a number of well-established measurement instruments have been developed that can be used to collect before/after measures of treatment effects. These take the form of patient-reported outcome measures (PROMs) such as the EQ5D and the SF-36 (EuroQol Group, 1991; Ware and Sherbourne, 1992). There remain many unresolved issues surrounding the precise specification and analysis of PROMs, and a concern that these generic measures of health status are not sensitive enough to capture variations in health gain in certain specialties, such as mental health and ophthalmology. However, for most healthcare, their use is a fundamental requirement for measuring patients’ health status before and after treatment. Widely accepted methodologies now exist for translating health status measures into the health gains offered by treatments in the form of QALYs.
In contrast to its highly developed role in assessing individual treatments, the use of health status measures in the assessment of organisational performance assessment is in its infancy. Historically, there has been little routine collection of health status measures capable of informing VfM comparisons across treatments, practitioners and organisations. Recent research has indicated that the cost of collecting patient-reported outcome measures is low and compliance is high (Smith, Cano et al, 2005). There is therefore a strong case for making such collection mandatory across all relevant healthcare as a basis for carrying out comparative performance assessment for use by governments, purchasers and patients. The NHS has made a start in this respect by requiring, from 2009, collection of EQ5D and condition-specific measures for four procedures: unilateral hip replacement, unilateral knee replacement, groin hernia repair, and varicose vein procedures.
6.1 Expected QALY loss from unsuccessful treatment
Hea
lth s
tatu
s
1.0
0.5
0.00 40 80
Age
(b) QALY loss from unsccessful treatment
6.2 Expected QALY gain from averting unsuccessful treatment
Hea
lth s
tatu
s
1.0
0.5
0.00 40 80
Age
(a) QALY gain from successful treatment
(b) QALY loss from unsccessful treatment
(a)(b) (b)

2. What are the components of VfM?
32
Measuring value for money in healthcare: concepts and tools
Smith
2.1.2. The patient experience
Quite apart from health gain, patients are becoming increasingly vocal in demanding that healthcare should be responsive to patient concerns beyond the health effects of treatments. This concern with the patient experience covers issues as diverse as promptness, autonomy, empowerment, privacy and choice. Many argue that these concepts should be incorporated into all VfM analyses when they make a clear contribution to patient well-being. In the UK, one of the biggest concerns in this area has been various aspects of patient waiting time. However, there is evidence that the UK also scores poorly on other elements of responsiveness, such as communication between doctor and patient (Blendon, Schoen et al, 2003).
It is unusual for VfM studies to incorporate considerations related to the patient experience. An important exception was the WHR 2000, in which WHO developed the concept of the responsiveness of the health system. This seeks to reflect the extent to which the health system succeeds in being user-oriented across a number of domains: personal autonomy; choice of providers and treatments; communication between patients and clinicians; confidentiality; dignity; quality of basic amenities; prompt attention; and social support. However, although the report contained a useful discussion of the concept of responsiveness, it was undermined by weak measurement methods. More recent work in the World health survey has sought to address the issue of responsiveness more satisfactorily (Üstün, Chatterji et al, 2003). Table 5 gives examples of questions the survey asked in each of the domains.
Table 5: Example questions used to measure responsiveness in the World health survey
Domain Question
Autonomy
Choice
Communication
Confidentiality
Dignity
Quality of basic amenities
Prompt attention
Access to family and community support
How would you rate your experience of being involved in making decisions about your healthcare or treatment?
How would you rate the freedom you had to choose the healthcare providers that attended to you?
How would you rate your experience of how clearly healthcare providers explained things to you?
How would you rate the way your personal information was kept confidential?
How would you rate the way your privacy was respected during physical examinations and treatment?
How would you rate the cleanliness of the rooms inside the facility, including toilets?
How would you rate the amount of time you waited before being attended to?
How would you rate the ease of having family and friends visit you?
There are, of course, many other ways of conceptualising and measuring the patient experience. For example, Coulter and Ellins (2006) consider concepts such as patient satisfaction, doctor–patient communication, psychological well-being, self-efficacy, and patient involvement and empowerment. Notwithstanding the complexity of such concepts, many survey instruments are now being deployed routinely to measure the patient experience. These are often extensive in scope, and therefore difficult to distil into a single number that would be suitable for use in an operational VfM assessment. However, they capture a great deal of information that could, in theory, be used for informing VfM measures. The challenge for future research is to find satisfactory ways of condensing the mass of data contained in surveys into a small number of useful summary measures of responsiveness (Coulter and Magee, 2003).
2. What are the components of VfM?
33
Measuring value for money in healthcare: concepts and tools
Smith
2.1.3. Inequalities
Most health systems pursue equity goals, indicating a concern with variations in access to healthcare and variations in health itself. These concerns play an important role in public debate about the NHS, but they are often poorly articulated and not well measured. Furthermore, equity goals sometimes conflict with other goals such as health maximisation (Williams and Cookson, 2000), and the extent to which health service organisations should be held accountable for equity issues is contested.
There are two broad schools of thought on how to handle equity issues in VfM analysis. In one sense, the fairness of the system can be thought of as just another outcome. For example, the WHR 2000 included measures of inequalities in health and inequalities in responsiveness that formed two of the five outcomes used by WHO as the basis of its measure of system attainment. The challenge using this approach is that there is no consensus on how to conceptualise or measure inequalities. For example, should the emphasis be on inequalities between individuals within society or between specific groups within the population? And, in either case, how should the inequalities be measured? Personal values and political judgements will necessarily be reflected in any solution to these questions.
Alternatively, some argue that, if equity concerns are important, outcomes (such as health gains) should be differentially weighted according to who receives them For example, a QALY gained by a disadvantaged person should be valued more highly than a QALY secured by the rest of the population (Williams, 1997). Once this principle is agreed, of course, it begs the question of how large the variations in the valuation of a QALY should be. Work in quantifying the valuation attached to achieving equity goals is in its infancy (Dolan, Shaw et al, 2005).
2.1.4. Externalities and broader economic outcomes
There is increasing recognition that healthcare yields valued outcomes beyond the immediate health benefits to the patient. Many treatments offer broader social and economic benefits to patients, for example in the form of reduced private care costs or improved opportunities to seek out paid employment. Treatments might also offer analogous benefits to patients’ families in the form of a reduced need for caring for the patient and increased employment opportunities. An even broader perspective might extend the notion of value to benefits to society, such as reduced demands on social care agencies and charities, and macroeconomic benefits such as improved productivity of the workforce (World Health Organization, 2001).
There is currently little consensus on how to measure the broader societal benefits of healthcare. The dominant methodology has been the ‘human capital’ approach, which seeks to capture the potential loss of earnings associated with illness. Human capital is, however, often poorly measured, and indicates only part of the broader economic benefits associated with health improvement. This approach also implicitly assigns larger weights to health benefits gained by people with higher earning potential, which appears to contradict some of the principles of equity adopted in the more traditional valuation of health benefits.
The decision about whether to adopt a narrow focus on the health gains secured for patients or a broader focus on societal benefits depends on the perspective of the VfM analysis. If the focus is on the performance of the NHS in producing health, it might be appropriate to examine only the costs to the NHS and the associated health benefits. However, it may often be more informative to embrace the private costs and benefits to patients and their families, and the broader economic perspective. Of course, many of the benefits (and costs) in this domain are more speculative, difficult to measure and longer term than the immediate health gain of treatment, and this is the main reason why many economic evaluations of health technologies do not consider them.
2. What are the components of VfM?
34
Measuring value for money in healthcare: concepts and tools
Smith
2.1.5. Outputs: counting activity and processes
Notwithstanding the clearer thinking now emerging on what the health system is seeking to achieve, measuring many of the eventual outcomes of healthcare is often very difficult. Most VfM analyses therefore have to fall back on rather prosaic measures of volume of activity and output, rather than focusing explicitly on desired outcomes. This is patently inadequate, as it ignores the ultimate objectives: health gain, improved responsiveness, reduction of disparities, and broader economic contributions. Indeed, increased activity might at times come at the expense of these more fundamental objectives.
Well-established outcome indicators exist for a limited range of treatments, such as post-operative mortality rates or infection rates. However, most health services organisations collect limited information about the health outcomes they produce. More commonly, information is only available about the type of activities undertaken, for example in the form of the numbers of patients treated, operations undertaken or outpatients seen. Such quantity measures fail to capture variations in the effectiveness, or quality, of the healthcare delivered. Yet, despite the growing move towards measuring the outcomes of care, there is often no alternative to using these crude counts of activity or processes as proxies for the value produced by healthcare. The generic term for such counts is ‘outputs’.
There are often good reasons why VfM measurement should be based on outputs rather than outcomes. For example, some health outcomes may take years to be realised, and it is clearly impractical to wait for them to emerge before attempting to assess performance. It therefore becomes necessary to rely on measures of activities as proxies for outcome. Measuring activities can also address a fundamental difficulty of outcome measurement – identifying how much of the variation in outcomes is directly attributable to the actions of the healthcare organisation. For example, mortality after a surgical procedure is likely to be influenced by many factors beyond the control of healthcare. In some circumstances, such considerations can be accommodated by careful use of risk-adjustment methods (see 3.1). However, there is sometimes no analytically satisfactory way of adjusting for environmental influences on outcomes, in which case analysing the activities of care instead may offer a more meaningful insight into organisational performance.
In addition, reliance on counts of activities as a basis for VfM analysis may be unproblematic when there is good research evidence that an activity (such as an inpatient procedure) on average leads to a known health improvement. Measuring such activities will give a strong indication of expected health outcomes. However, when using such measures as the basis for comparing the VfM of healthcare organisations, it is important to understand that there is an implicit assumption that there is no difference in the effectiveness with which organisations undertake the activity. Where such differences are suspected, it becomes imperative to augment activity counts with measures of the quality of outcome in individual organisations. Ideally, these would indicate health gain, but more readily measured proxies, such as hospital readmission rates, are often used for such purposes.
Thus, although the use of measures of activity and output are often the only practical option available in a VfM analysis, it is important to keep in mind the limitations it imposes. In particular, one should beware of two classes of misinterpretation that commonly result from an absence of outcome information.
• First,allelsebeingequal,organisationsthatundertakemoreactivitieswillberatedasmoreefficient. But some organisations may have developed care pathways and protocols that minimise the number of activities required to deliver care to a patient. This may eliminate unnecessary diagnostic tests, for example, and may be an efficient way of organising care. However, an activity-based VfM analysis may penalise such organisations.

2. What are the components of VfM?
35
Measuring value for money in healthcare: concepts and tools
Smith
• Second,theeffectiveness,orquality,ofthehealthcaredeliveredisnotcapturedbyacountofactivities. For instance, an activity-based analysis will consider operating theatres that incur the same costs and undertake the same number of operations to be equivalent, even if patients are more likely to suffer complications or die if treated in one theatre rather than the other.
In short, any scrutiny of VfM based on activities should acknowledge the limitations it introduces by ignoring effectiveness considerations.
2.2. Valuing system outputs
Measuring the contribution of healthcare organisations would be difficult enough if those organisations were seeking to provide a single and relatively homogeneous product. But healthcare organisations are immensely complex entities, undertaking numerous activities and producing multiple outputs with different levels of effectiveness. We have already noted the difficulties associated with attaching values to the various outcomes. The generic measures of health status such as the EQ5D have made some progress in this respect, but their use has remained fairly circumscribed to date.
The key insight related to valuing health system outputs is to note that all health treatments produce certain characteristics that are valued by patients. In the health domain, these include longer life, reduced pain and increased mobility. Under the patient experience, they might include promptness, dignity and empowerment. It is the aggregation of these qualitative characteristics that gives rise to the outcomes described above: that is, in the last resort, the valuation of outputs requires an assessment of their contribution to valued outcomes.
How much the various healthcare outcomes described above are valued are, first and foremost, personal judgements, and there is evidence to suggest that individual citizens vary greatly in the weight they place on different healthcare outcomes. Some focus principally on health gain, while others place great weight on aspects of the patient experience. A conventional economic perspective would suggest that a proper market in health services would allow patients to express their preferences and thereby reveal the market price of the different outcomes. However, for many reasons, such markets rarely exist in health services (Smith, 2000). So, in the absence of market valuations (such as prices), someone on behalf of society has to decide how much each type of outcome is valued. This is rarely a role for analysts or researchers – rather, it is the legitimate role of politicians.
Choice of values can nevertheless be informed by evidence from a range of sources, such as ‘stated preference’ economic studies. These form the basis for the development of many of the QALY instruments discussed earlier. They can also examine citizens’ willingness to pay for different healthcare characteristics by asking them to trade off factors such as, for example, waiting time, user charges, distance travelled and quality of care (Ryan and Farrar, 2000).
An example of a discrete choice experiment designed to solicit patients’ valuations of different characteristics of their treatment is given by Ryan, Bate et al (2001). Patients at a rheumatology outpatient clinic were asked to rank a number of different scenarios, described by the six characteristics listed in table 6. Each scenario comprised a different mix of levels of the six characteristics. Statistical analysis of the patients’ rankings then allowed the researchers to place a quantitative value on, say, an improvement in health gain (from no reduction in pain to a small reduction in pain) relative to a reduction in waiting time (for example, from 20 to 10 minutes).
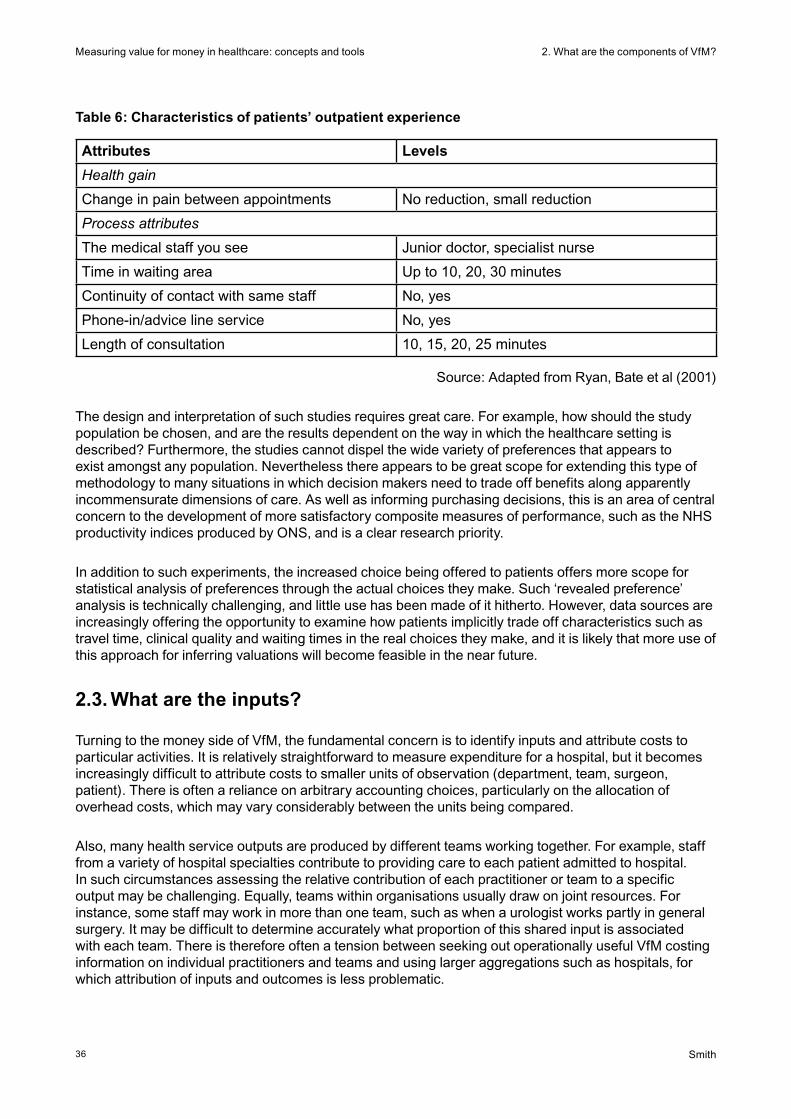
2. What are the components of VfM?
36
Measuring value for money in healthcare: concepts and tools
Smith
Table 6: Characteristics of patients’ outpatient experience
Attributes Levels
Health gain
Change in pain between appointments No reduction, small reduction
Process attributes
The medical staff you see Junior doctor, specialist nurse
Time in waiting area Up to 10, 20, 30 minutes
Continuity of contact with same staff No, yes
Phone-in/advice line service No, yes
Length of consultation 10, 15, 20, 25 minutes
Source: Adapted from Ryan, Bate et al (2001)
The design and interpretation of such studies requires great care. For example, how should the study population be chosen, and are the results dependent on the way in which the healthcare setting is described? Furthermore, the studies cannot dispel the wide variety of preferences that appears to exist amongst any population. Nevertheless there appears to be great scope for extending this type of methodology to many situations in which decision makers need to trade off benefits along apparently incommensurate dimensions of care. As well as informing purchasing decisions, this is an area of central concern to the development of more satisfactory composite measures of performance, such as the NHS productivity indices produced by ONS, and is a clear research priority.
In addition to such experiments, the increased choice being offered to patients offers more scope for statistical analysis of preferences through the actual choices they make. Such ‘revealed preference’ analysis is technically challenging, and little use has been made of it hitherto. However, data sources are increasingly offering the opportunity to examine how patients implicitly trade off characteristics such as travel time, clinical quality and waiting times in the real choices they make, and it is likely that more use of this approach for inferring valuations will become feasible in the near future.
2.3. What are the inputs?
Turning to the money side of VfM, the fundamental concern is to identify inputs and attribute costs to particular activities. It is relatively straightforward to measure expenditure for a hospital, but it becomes increasingly difficult to attribute costs to smaller units of observation (department, team, surgeon, patient). There is often a reliance on arbitrary accounting choices, particularly on the allocation of overhead costs, which may vary considerably between the units being compared.
Also, many health service outputs are produced by different teams working together. For example, staff from a variety of hospital specialties contribute to providing care to each patient admitted to hospital. In such circumstances assessing the relative contribution of each practitioner or team to a specific output may be challenging. Equally, teams within organisations usually draw on joint resources. For instance, some staff may work in more than one team, such as when a urologist works partly in general surgery. It may be difficult to determine accurately what proportion of this shared input is associated with each team. There is therefore often a tension between seeking out operationally useful VfM costing information on individual practitioners and teams and using larger aggregations such as hospitals, for which attribution of inputs and outcomes is less problematic.
2. What are the components of VfM?
37
Measuring value for money in healthcare: concepts and tools
Smith
Moreover, it can be quite challenging to match costs to outputs across time. Some contemporary costs relate to contemporary outputs, while others relate to future outputs. And conversely, some contemporary output relies on expenditure made in previous periods. For example, the considerable sums spent on medical training generate human capital that is expected to yield benefits well into the future. The issue of matching costs to outputs across time is considered in more detail in section 2.5.
Furthermore, depending on the perspective being adopted, the analysis of treatment costs might in some circumstances be limited to the purchase price of the treatment, but at other times there might be a need to assess the broader social costs of treatment (such as transport costs, the treatment’s impact on the patient’s carer, or the costs imposed on social care agencies). More generally, there remain a number of important unresolved technical issues in costing methodology (Mogyrosy and Smith, 2005).
In summary, there is continued disagreement on a) the best way to attach monetary value to resource use, including capital assets, b) the recommended perspective of the study (narrow health service or broader societal), c) the appropriate measurement and valuation method of informal caregiver time, d) the measurement and valuation of the costs of lost worker productivity associated with illness, e) the additional healthcare treatment costs associated with added years of life, and f) the best technique for allocating support centre costs to operational units.
Finally, inescapable variations in input prices across the units under scrutiny can also be important when making VfM comparisons. This is most obvious when undertaking international comparison, when it will usually be necessary to undertake some sort of currency conversion to secure comparability (Busse, Schreyögg et al, 2008). Input price variations can also be important, even within a country. England has a long tradition (through the market forces factor) of seeking to adjust NHS expenditure for the very large variations in the cost of labour and capital across the country, with differences of over 40 per cent between inner London and some of the rural counties.
In short, although costing methodology has developed considerably over recent years, there are a number of fundamental choices to be made in enumerating and quantifying the inputs used by the entity under scrutiny. Although technical, these choices can often have a fundamental impact on the outcome of any VfM analysis. Indeed, in many settings, proper costing will perhaps prove more of an enduring challenge than the measurement of outcomes, as some of the challenges of satisfactorily allocating costs to specific organisations, interventions or patients may prove intractable.
2.4. Environmental constraints
In addition to the challenges in specifying inputs, outputs and outcomes, assessment of VfM in healthcare is often further complicated by the need to take account of influences on performance that lie outside organisational control. Numerous classes of factors may influence VfM measures, including:
• differencesinthecharacteristicsofcitizensbeingserved
• theexternalenvironment–forexample,geography,culture,andeconomicconditions
• theactivitiesofotherrelatedagencies,bothinsideandoutsidethehealthsector
• thequalityofresourcesbeingused,includingthecapitalstock
• previousorganisationaleffortsinpreventionandhealthpromotion.
2. What are the components of VfM?
38
Measuring value for money in healthcare: concepts and tools
Smith
In the short run, many of these factors may be completely outside the control of the organisations under scrutiny. They are commonly labelled ‘environmental’ constraints. In particular, citizen characteristics are often considered to be exogenous influences that determine the context within which the healthcare organisation must operate, and many of the outcomes it secures are often highly dependent on the characteristics of the population group it serves. For example, population mortality rates are heavily dependent on the demographic structure of the population under consideration, and surgical outcomes usually depend on the severity of a patient’s disease.
There is often considerable debate as to what population factors are considered ‘controllable’ in any VfM analysis. For example, some critics of the WHR 2000 argued that the HIV/Aids epidemic was a crucial influence on the poor measured performance of many low-income health systems and had not been taken into account (Anand, Ammar et al, 2003). Conversely, WHO argued that control of the epidemic had been amenable to intervention, and performance should therefore be judged without adjustment for HIV/Aids prevalence rates. In the same way, hospital outcomes may be strongly related to the stage at which diseases are diagnosed, and there may be debate about the extent to which these are within the hospital’s control.
Geographical considerations may also play an important part in levels of organisational attainment. For example, hospital performance may be related to how care is organised in the local community, or the performance of emergency ambulance services may depend on local geography and settlement patterns. To the extent that it is feasible, and depending on the purpose of the analysis, it may be desirable to take account of such variations in any VfM analysis.
The performance of many healthcare organisations is in part dependent on inputs from outside agencies, such as social care, housing organisations and private families. This too should be recognised in VfM modelling. For example, many patient outcomes rely on the co-ordinated contributions of a number of organisations in the form of integrated care. If the performance of only one of these organisations is under scrutiny, it may be difficult to identify the element of patient outcome that is attributable specifically to its own endeavours. The danger is either a) its contribution towards integrated care is ignored in the analysis (under-attribution) or b) the contribution of other external agencies towards outcome is ignored (over-attribution). Whether these external efforts should be treated as exogenous may depend on the extent to which the behaviour of external agencies is amenable to influence by the organisation under scrutiny.
The problem of attribution tends to be exacerbated as the unit of VfM becomes smaller and therefore more reliant on other parts of the health system in securing desired outcomes. In one sense it is therefore desirable to adopt the whole-system approach advocated by WHO, under which the outcomes for the citizen (regardless of which part of the health system secures those outcomes) represent the outcomes of interest. However, this approach is often unfeasible and may not be helpful because it does not pinpoint which specific elements of the system are performing well or poorly. Furthermore, it requires societal values to be placed on a diverse set of outputs.
Notwithstanding the problem of attribution, it is therefore usually more practically helpful to circumscribe the VfM analysis to clearly defined organisations or practitioners within the health system, even though this may ignore some of the interactions with other parts of the system. For example, we might be interested in the cost-effectiveness of individual trauma and orthopaedics specialties in hospitals. Although this can introduce costing difficulties, taking individuals or teams as the units of analysis has much to recommend it in comparison with larger organisational aggregations. Their activities may be of a limited range and can be easily identified and quantified, and the agent accountable for performance can also be readily identified.

2. What are the components of VfM?
39
Measuring value for money in healthcare: concepts and tools
Smith
One final set of constraints to be noted are those imposed by outside regulators, such as the government or medical professions, in the form of service standards or training requirements. Such constraints may affect the extent to which comparable levels of VfM can be achieved by the organisations under scrutiny. For example, response time standards for ambulances will constrain ambulance station configuration and affect unit costs in rural areas, and medical training requirements may constrain the extent to which cost savings through reconfiguration can be achieved. Such constraints might be imposed for reasons of equity, or to promote broader economic objectives, and may lead to some unavoidable variations in measures of VfM.
2.5. Short run or long run?
Resolution of some of the debates in VfM discussed in the previous section depends on whether a long run or short run VfM perspective is being adopted. In the short run, current management must work largely within current constraints, such as capital configurations and population health characteristics, and may have little scope to change them. In the longer term, many of these issues are amenable to purposive improvement on the part of management, which should therefore rightly be held to account for low levels of associated attainment. In many circumstances it will be useful to undertake both short run (constrained) and long run (unconstrained) VfM analysis.
The dynamic VfM measurement difficulties can be illustrated in diagrammatic form. The naive (static) model of VfM in figure 7 assumes that an organisation consumes inputs in the current period and produces contemporaneous outputs. VfM is assessed by comparing current period outputs (or outcomes) with current inputs. A typical VfM analysis examines the ratio of outputs to inputs for only a single time period (say, year t) in this fashion.
Figure 7: The naive (static) representation of value for money
Organisationyear t
Valued outputsyear t
Inputsyear t
Yet the system in year t has usually enjoyed the benefits of past investments. The naive model must therefore be augmented to incorporate the ‘endowments’ generated for the organisation by its efforts in previous periods, represented in figure 8 as an additional input to the organisation in year t. And the organisation also leaves an endowment for future periods in the form of investments undertaken in this and preceding periods. The endowment might be in the form of real capital (buildings), training of doctors and other clinicians, medical research, or investment in health promotion and preventive medicine. In principle, the endowment may be an important aspect of both the inputs to and the outputs of the health system. In practice, it is very difficult to measure, but it may be a crucial consideration in assessing longer-term VfM performance.
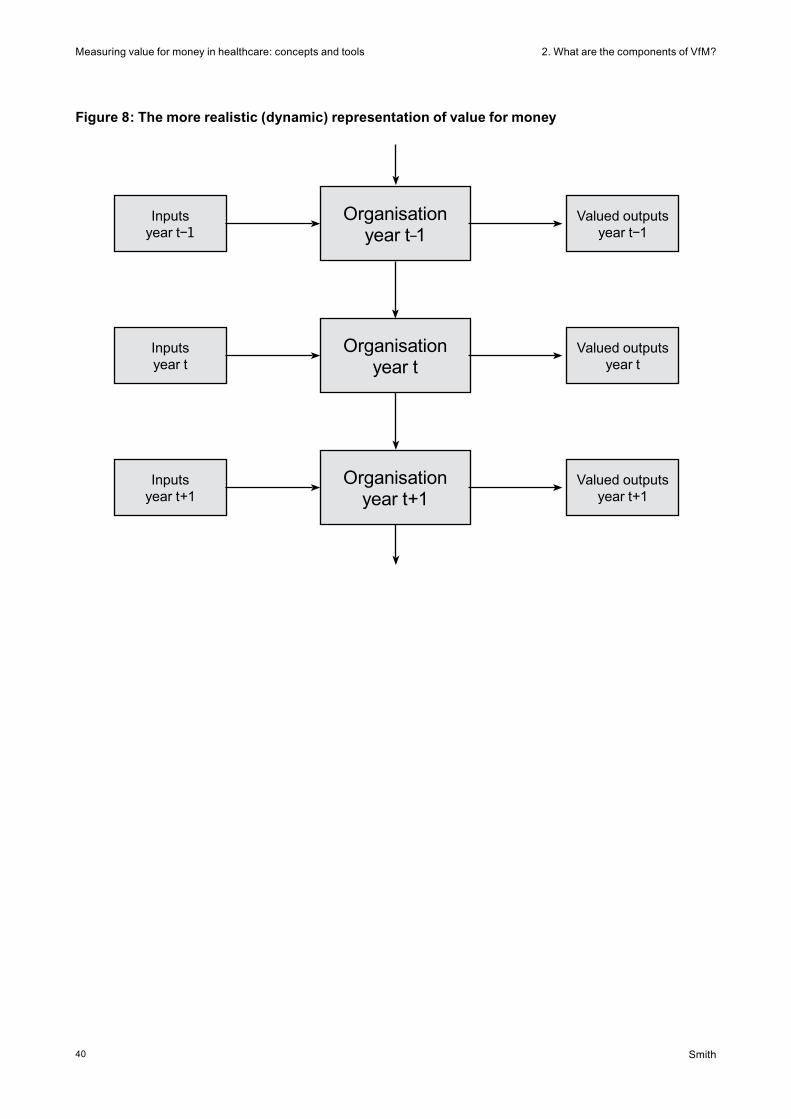
2. What are the components of VfM?
40
Measuring value for money in healthcare: concepts and tools
Smith
Figure 8: The more realistic (dynamic) representation of value for money
Organisationyear t−1
Valued outputsyear t−1
Inputsyear t−1
Organisationyear t
Valued outputsyear t
Inputsyear t
Organisationyear t+1
Valued outputsyear t+1
Inputsyear t+1
Smith
Measuring value for money in healthcare: concepts and tools3. Measuring VfM
41
3. Measuring VfM
Having identified the building blocks of VfM, how can they be used to offer meaningful and useful indicators of performance? In some circumstances, no attempt is made to integrate the various components of performance discussed above. Instead, as shown in section 1.4, a set of partial indicators is produced that provides some insights but no definitive judgement. The discussion above suggests that such indicators may often be helpful, but they can also be misleading. Their incompleteness begs the question whether the variations observed are really due to differences in VfM or to uncontrollable factors that have not been captured in the construction of the indicators. As a result, increasing efforts are being made to develop analytic tools that help to formulate a more rounded judgement of VfM.
More comprehensive approaches have reached an advanced stage of development in the realm of health technology assessment, often based on randomised clinical trails (Drummond, Sculpher et al, 2005). However, the principles of more comprehensive cost-effectiveness analysis are now also being tested out in the more challenging arena of performance assessment. This section first summarises the role of analytic techniques to adjust outputs for variations in environmental constraints (section 3.1). Even more ambitious are the analytic efforts to embody all relevant inputs, outputs and environmental constraints into a single productivity model. These are outlined in section 3.2.
3.1. Adjusting for environmental constraints
In contrast with most private sector concerns, public service organisations usually have to operate to a certain standard, however adverse the circumstances in which they find themselves. In particular, the NHS is funded by national taxation, and citizens expect a minimum level of service everywhere. This equity concern gives rise to an important consideration when assessing the VfM of individual organisations: in assessing performance, to what extent should the external environment be taken into account, defined, for example, in terms of the population served, local physical infrastructure, other public agencies or local geography?
In some very special, and highly unlikely, circumstances it may be possible to ignore the environmental problem when organisations (such as PCTs) have already been fully compensated financially for environmental circumstances through a well-designed funding formula. A funding formula seeks to enable organisations to deliver a standard level of service, given environmental factors (Smith, 2007b). So, if the funding formula is doing its job perfectly, there may be no need to incorporate environmental factors into the VfM calculations. Instead, all that is needed is to examine the extent to which the required standards have been secured. In short, one needs to examine only outcomes, and there is no need to incorporate inputs or environmental constraints into the model because the job has been done in the funding formula. Of course, in practice, most funding formulae compensate very imperfectly for environmental factors, so this approach is unfeasible in practice. However, it is important to note the important link between performance assessment and funding mechanisms.
In practice, the imperfections of funding mechanisms mean that organisations cannot ex ante be expected to secure identical levels of performance given the resources at their disposal. In whatever way the uncontrollable environment is defined, some organisations operate in more adverse environments than others in the sense that external circumstances make achievement of a given level of attainment more difficult. Therefore, for a given level of inputs, we would expect them to exhibit apparently lower levels of outputs or outcomes, and apparent VfM. Consequently, a critical requirement of many VfM analyses is to effect an adjustment for variations in environmental constraints.
Smith
Measuring value for money in healthcare: concepts and tools 3. Measuring VfM
42
Broadly speaking, there are three ways in which environmental factors can be taken into account in any VfM analysis:
• restrictcomparisononlytoorganisationswithinasimilaroperatingenvironment
• modeltheenvironmentalconstraintsexplicitly,asbeinganalogoustootherinputsintheproduction process
• undertakeriskadjustment.
I consider these in turn.
Some of the earliest and most widely deployed approaches towards comparing performance involve the use of various forms of cluster analysis, which seeks to assign organisations to a small number of homogenous groups, or clusters (Everitt, Landau et al, 2001). The first requirement of such approaches is to select various quantitative measures of an organisation’s social, economic and geographical circumstances relevant to the service in question. Based on these data, a measure of the similarity (or ‘distance’) between each organisation and all others is then calculated. The organisations can then be clustered into discrete groups exhibiting broadly similar characteristics according to the chosen measure of similarity. A closely related approach, which is often more satisfactory in the performance measurement domain, is simply to identify the ‘nearest neighbours’ of each organisation according to the chosen socio-economic similarity measure, and to use these as the basis for comparison. Such approaches form the basis for many benchmarking initiatives.
For any observed organisation, cluster analysis (or nearest neighbour analysis) effectively divides the remaining organisations into just two categories – comparable and not comparable – and comparison is made only with organisations in the same cluster. Technical choices have to be made regarding the measure of similarity to be employed and the cut-off criterion for including organisations within a comparable cluster. The main virtue of clustering techniques is transparency. Although the method of choosing comparators is technically opaque and vulnerable to arbitrary technical choices, once the analysis is complete it is a straightforward matter to compare every organisation with the other organisations within its comparator group. However, the techniques are a very crude method of adjusting for variations in environment. They assume that organisations are fully comparable with the chosen comparators but discard potentially useful information about those organisations not selected as comparators.
ONS produced a cluster analysis of English PCTs based on 42 indicators of social and economic circumstances in 2001 (National Centre for Health Outcomes Development, 2007). This resulted in 12 discrete clusters, with characterisations such as ‘new and growing towns’ or ‘manufacturing towns’. The clusters contain relatively homogeneous sets of PCTs which should form a better basis for performance comparison than, say, regional or national averages. As an example, the cluster defined as ‘industrial hinterland’ included the following PCTs: North Tyneside; Hartlepool; Knowsley; Darlington; Gateshead; South Tyneside; Sunderland; Middlesbrough; Tameside and Glossop; County Durham; Sefton; Wirral; Halton and St Helens; Hull; Stoke On Trent; and Redcar and Cleveland.
The second approach to handling environmental variation is to incorporate environmental factors directly into the production model, often treating them as exogenous inputs analogous to labour or capital. This approach effectively generalises the clustering approach by allowing extrapolation from one class of organisation to another. For example, an environmental factor might be included as an explanatory variable in statistical models of performance of the sort described further in section 3.2. While leading to a more general specification of the VfM model than the clustering approach, the direct incorporation of environmental factors into the statistical model leads to major modelling challenges.
Smith
Measuring value for money in healthcare: concepts and tools3. Measuring VfM
43
The final method to control for variation in environmental circumstances is the family of techniques known as ‘risk adjustment’. These methods adjust organisational outcomes for differences in circumstances before they are deployed in a VfM model, and can offer the most useful balance between intellectual coherence and practicality when adjusting for environmental factors. Well-understood forms of risk adjustment include the various types of standardised mortality rates routinely deployed in studies of population outcomes. These adjust observed mortality rates for the demographic structure of the population, thereby seeking to account for the higher risk of mortality amongst older people. Likewise, surgical outcomes might be adjusted for the severity of risk factors, such as age, comorbidities, and smoking status of the patients treated. The system of diagnosis-related groups (HRGs in England) was originally developed in order to adjust for the different hospital casemix before making cost comparisons (Fetter, 1991)
The methods of risk adjustment are often a highly efficient means of controlling an outcome measure for a multiplicity of environmental factors. Risk-adjusted outcomes can then be entered into the VfM model without any further need to enter environmental factors. For some health services the methods of risk adjustment have been developed to a high level of refinement (Iezzoni, 2003). However, it must be noted that risk adjustment usually has demanding data requirements in the form of information on the circumstances of individual patients. And even when adequate data do exist, it is often difficult to secure scientific consensus on the most appropriate way to undertake the risk adjustment. For example, Iezzoni, Ash et al (1996) examined 14 alternative methods of adjusting hospital death rates from pneumonia for US hospitals. They found that, although there was some correlation between the results obtained, for some hospitals, there were serious variations in the performance rankings obtained depending on the risk adjustment method used.
Whatever the method employed, adjustment for environmental factors seeks to ensure that the VfM of organisations can be compared on a level playing field. As noted above, this is a highly inexact science. There is often a balance to be struck between adjusting for every conceivable environmental reason for variation (in which case every organisation might be deemed unique, and therefore immune from comparison) and complete disregard of the issue. However, in general, the VfM analysis will lack credibility if the issue is ignored, so some attention to environmental factors will be required.
3.2. Analytic models of VfM
VfM is, in principle, a simple construct, representing the ratio of outputs, weighted by value, to inputs. However, the preceding sections suggest that there are numerous analytic difficulties involved in converting the principle into an operationally satisfactory measure of VfM. Some approaches (such as the partial indicators discussed in section 1.4) are incomplete and have to be used with caution. The concern with incompleteness has led to a search for more comprehensive measures of VfM. Yet, as indicated above, more comprehensive approaches are fraught with difficulties, including the need to:
• specifyandmeasurealloutcomesattributabletotheunitsunderscrutiny
• attachaweightwithwhichtovaluealloutcomes
• associateallrelevanthealthsysteminputstotheunitsunderscrutiny
• adjustforenvironmentalfactors
• accommodatealonger-termperspective.
Satisfying all these requirements is an immense challenge. Nevertheless, in parallel to the piecemeal analysis of individual performance measures, a great deal of research effort has also gone into developing ‘single number’ measures of organisational VfM, under the general banner of ‘productivity analysis’ (Fried, Lovell et al, 1993; Coelli, Rao et al, 1998). The objective of productivity analysis is to
Smith
Measuring value for money in healthcare: concepts and tools 3. Measuring VfM
44
secure a measure of the cost-effectiveness of an organisation, confusingly referred to almost universally as a measure of efficiency. Whatever the terminology, the measure of organisational attainment is defined as a ratio of weighted outputs to organisational inputs, adjusted where necessary for environmental constraints.
The key contribution of productivity analysis models is a) to adjust for the external environmental influences on performance and b) to handle the problem of attaching valuations to outputs. Two approaches have dominated the productivity literature: econometric methods, pre-eminently various forms of statistical methods such as stochastic frontier analysis (SFA); and the descriptive methods known as data envelopment analysis (DEA) (Jacobs, Smith et al, 2006). Although these methods approach the task in radically different ways, they have the common intention of using the observed behaviour of all organisations to infer the maximum feasible level of attainment and to offer estimates of the extent to which each individual organisation falls short of that optimum. The methods are technically challenging, and a full treatment is beyond the scope of this paper. Here I simply seek to give an intuitive description of each approach.
3.2.1. Statistical methods
Traditional statistical models of healthcare performance usually take the form of a cost function, under which an organisation’s costs are modelled as a function of a range of organisational outputs.8 The simplest statistical approach to developing a cost function is to use conventional multivariate regression analysis, in which costs are modelled as a function of a range of outputs, the organisational environment and an unexplained error term. This yields an empirical model that predicts an organisation’s expenditure given its current levels of outputs and environmental circumstances.9 The deviation from this prediction (the difference between actual and predicted costs) can be used as a basis for estimating the organisation’s overall efficiency. That is, all unexplained variation from the statistical model is assumed to be due to inefficiency.
Various refinements of the conventional regression model have been developed to examine organisational efficiency, including a suite of methods known collectively as stochastic frontier analysis (SFA) (Kumbhakar and Lovell, 2000). These retain the basic principles of regression analysis, but seek to decompose unexplained cost variations into random statistical ‘noise’ and inefficiency, the issue of interest from a VfM perspective. However, SFA requires very restrictive modelling assumptions that are highly contested and which have led some commentators to question its usefulness (Smith and Street, 2005).
Some of the difficulties brought about by applying statistical methods to a single cross-section of observations can be obviated by using panel data (that is, a time series of observations for each organisation, rather than a single measure). The important gain offered by panel data is the vastly increased ability to distinguish transient (random) variations in performance measures from persistent (systematic) variations that can form the basis for estimates of inefficiency. However, important technical assumptions must still be made, for example about how inefficiency is assumed to change over time, and there is a risk that any model is estimating historical rather than contemporary levels of inefficiency.
8 Some applications have sought to develop the mirror image ‘production function’ of healthcare organisation performance, under which a single measure of an organisation’s output is modelled as a function of a range of organisational inputs. In general, this approach poses similar technical challenges but is likely to be less useful from a VFM perspective.
9 It is worth noting that, using the conventional regression model, the coefficient on each explanatory variable in the cost function offers an estimate of the marginal price of producing the associated output and therefore an estimate of the average implicit valuation of the output in the sample.

Smith
Measuring value for money in healthcare: concepts and tools3. Measuring VfM
45
Jacobs, Smith et al (2006) present an application of cost function analysis to 171 acute English hospitals. They model hospital costs as a function of a range of outputs, including inpatient episodes, outpatient episodes, accident and emergency attendances, teaching and research, and a number of environmental factors.10 Using a conventional regression analysis, which treats all of the unexplained variation as ‘inefficiency’, they find that the average level of efficiency is 70.4 per cent. However, when they use SFA, which treats some of the unexplained variation as random, the average efficiency levels increase to 90.4 per cent.
3.2.2. Descriptive methods
Data envelopment analysis is based on similar economic principles to SFA but uses very different estimation techniques, based on linear programming models (Thanassoulis, 2001). In summary, it searches for the organisations that ‘envelop’ all other organisations on the basis of a composite estimate of VfM. For each organisation, it looks for all other organisations that secure the same, or better, outputs at the lowest use of inputs. Or, conversely, it can be used to search for the other organisations that use the same, or lower, inputs to secure the highest level of outputs. For each organisation, the ratio of actual to optimal performance is referred to as an organisation’s ‘inefficiency’.
Compared to SFA, DEA has some attractive features. It requires none of the restrictive assumptions required to undertake regression methods. It can handle multiple inputs and multiple outputs simultaneously, and it requires none of the stringent model testing that is required of statistical techniques. However, it also suffers from a number of drawbacks. It can be vulnerable to data errors, because the DEA ‘best practice’ frontier is composed of a small number of highly performing organisations, and the performance of all other units is judged in relation to that frontier. Therefore, if the measurement of one key best practice organisation is incorrect, it can result in excessively negative judgements on many of the inefficient units.
Moreover, from the point of view of ranking organisations, DEA has the profound drawback that it permits flexibility in the valuation weights attached to each output. The method is agnostic about the valuation of outputs in the sense that it allows each organisation to be judged using valuations that show it in the best possible light. Thus each organisation can, in theory, be compared to the frontier according to an entirely different set of output weights; that is, in the terminology of section 1.2, DEA measures technical efficiency, not overall cost-effectiveness. In particular, this means that an organisation might be deemed efficient using DEA, but only if a zero weight is placed on an important output. This appears to contradict the principle that organisations should be evaluated on a consistent basis, and has also exposed the technique to fierce criticism (Stone, 2002). For this reason, many commentators advocate the use of DEA as a useful tool for exploring large and complex datasets but not as regulatory device for passing judgements or setting VfM targets. Regulators would normally want to apply to all organisations a consistent set of weights in line with regulatory priorities.
Jacobs, Smith et al (2006) present an application of DEA to 171 acute English hospitals. In the simplest specification, they use total costs as a measure of inputs, and use inpatient episodes, outpatient episodes and accident and emergency attendances as outputs. They find that 14 hospitals are 100 per cent efficient and lie on the best practice frontier, and five hospitals have an efficiency level of less than 50 per cent. The average level of efficiency amongst all hospitals is 74.4 per cent. They then progressively refine the model to include outputs, such as teaching and research, and include a number of environmental factors. This leads to a dramatic increase in the number of 100 per cent efficient hospitals (150 of the 171) and an increase in the average level of efficiency to 98.8 per cent.
10 There was no consideration of the quality of outcomes in this model.

Smith
Measuring value for money in healthcare: concepts and tools 3. Measuring VfM
46
This example demonstrates a number of characteristics of comprehensive VfM measurement, most notably its sensitivity to the underlying modelling assumptions and the critical importance of value weights. If more outputs are included, it becomes increasingly difficult to identify best practice organisations without assigning valuations to the outputs produced. And, other things being equal, the inclusion of more environmental factors offers organisations more ‘excuses’ for lower levels of performance. This may be appropriate, but requires careful scrutiny. In practice, any analysis should examine a range of modelling perspectives in order to identify the sensitivity of judgements to different technical choices.
Smith
Measuring value for money in healthcare: concepts and tools
47
4. Conclusions
4. Conclusions
In the face of an apparently insatiable demand for treatments, increasing pharmaceutical and manpower costs and a vibrant market in new medical technologies, the pursuit of VfM in healthcare has become an imperative for all health systems. Furthermore, the public and its representatives are demanding increasing levels of accountability for how their tax contributions are spent. Accurate measurement of VfM has therefore become an urgent priority in healthcare, and this paper has sought to set out the major issues associated with the pursuit of this objective. The urgency of adopting a VfM perspective has been heightened further by the recent economic downturn, and the prospect of a highly constrained financial environment for the foreseeable future. In the same way that pursuit of quality without consideration of costs may lead to adverse outcomes, the pursuit of spending cuts without consideration of the health outcomes for patients may also be seriously dysfunctional.
The paper has highlighted two fundamental roles for VfM measurement: prospective assessment of technologies (for resource allocation purposes) and retrospective assessment of the VfM of individual providers (performance assessment). In combination, these roles comprise a major element of the functions of healthcare purchasers (or PCT commissioners as they have become known in England). The purchasing function is immensely complex and has hitherto been undertaken with only limited success in most health systems (Figueras, Robinson et al, 2005). Concerted attention to VfM measurement offers a central focus for improving purchasing for health and healthcare.
The resource allocation role of VfM measurement is relatively well understood, albeit mainly in the context of individual treatments. Its importance is embodied in current practice of health technology assessment, and reached its apotheosis in the creation of NICE and analogous agencies worldwide. Although many contested issues remain, and the practice of introducing VfM considerations into health technology assessment often introduces unexpected challenges, the methodologies adopted are relatively well understood and the debates well advanced. Perhaps the major underdeveloped issue highlighted in this report (section 1.2.1) is how national resource allocation advice can be integrated into local PCT decision making, where local constraints (and opportunities) become fundamental and there is a shortage of cost-effectiveness information for many routine treatments. This remains an important area for further development.
In contrast, the performance assessment role of VfM measurement is underdeveloped. There has hitherto been a reliance on partial indicators of VfM. These can act as useful diagnostic tools, but they can also give misleading signals if used carelessly. There is, in my view, an urgent need to complement these partial measures with more comprehensive measures of VfM performance.
This paper has indicated that the simple view of VfM as the ratio of valued outputs to inputs is inadequate if one is to move towards useful VfM measures. Figure 9 repeats from an earlier section the diagrammatic representation of the simple view. This discussion has shown that a more realistic representation of the VfM measurement challenge would be indicated by something like figure 10. As well as resource inputs in the current year, we should also consider environmental constraints, policy constraints and organisational endowments from previous years. On the output side, as well as direct health improvement outcomes in the current year, we should also consider outputs such as training, health promotion and other endowments for the future, as well as broader economic benefits from the health system.
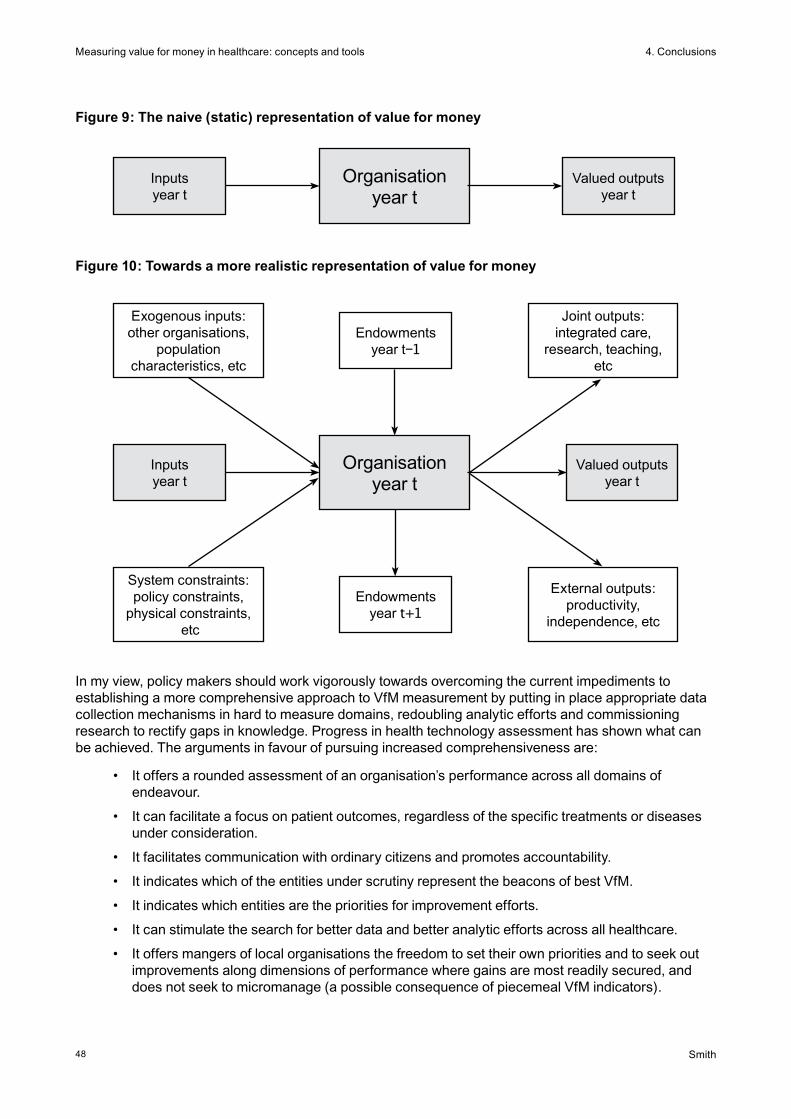
Smith
Measuring value for money in healthcare: concepts and tools
48
4. Conclusions
Figure 9: The naive (static) representation of value for money
Figure 10: Towards a more realistic representation of value for money
Organisationyear t
Valued outputsyear t
Inputsyear t
Organisationyear t
Valued outputsyear t
Inputsyear t
System constraints: policy constraints,
physical constraints, etc
Endowmentsyear t−1
Endowmentsyear t+1
Exogenous inputs: other organisations,
population characteristics, etc
External outputs: productivity,
independence, etc
Joint outputs: integrated care,
research, teaching, etc
In my view, policy makers should work vigorously towards overcoming the current impediments to establishing a more comprehensive approach to VfM measurement by putting in place appropriate data collection mechanisms in hard to measure domains, redoubling analytic efforts and commissioning research to rectify gaps in knowledge. Progress in health technology assessment has shown what can be achieved. The arguments in favour of pursuing increased comprehensiveness are:
• Itoffersaroundedassessmentofanorganisation’sperformanceacrossalldomainsofendeavour.
• Itcanfacilitateafocusonpatientoutcomes,regardlessofthespecifictreatmentsordiseasesunder consideration.
• Itfacilitatescommunicationwithordinarycitizensandpromotesaccountability.
• ItindicateswhichoftheentitiesunderscrutinyrepresentthebeaconsofbestVfM.
• Itindicateswhichentitiesaretheprioritiesforimprovementefforts.
• Itcanstimulatethesearchforbetterdataandbetteranalyticeffortsacrossallhealthcare.
• Itoffersmangersoflocalorganisationsthefreedomtosettheirownprioritiesandtoseekoutimprovements along dimensions of performance where gains are most readily secured, and does not seek to micromanage (a possible consequence of piecemeal VfM indicators).
Smith
Measuring value for money in healthcare: concepts and tools
49
4. Conclusions
Nevertheless, I acknowledge that the use of comprehensive indicators (in preference to the piecemeal scrutiny of partial VfM indicators) can in some circumstances be misleading and opaque. The benefits offered by partial indicators include:
• Theycanidentifyseriousfailingsinsomepartsoftheorganisation,evenifmoreaggregatemeasures of VfM indicate no cause for concern.
• Theyofferadiagnostictoolforidentifyingwhattoattributepoorperformanceto,andthereforewhat remedial action to take.
• Theymaybetheonlyrealisticapproachifanattempttobecomprehensiveleadstoarelianceon very feeble or opaque data in some dimensions of performance.
• Whenaggregatingdifferentdimensionsofperformance,comprehensivemeasuresmayhavetorely on preference weights that are highly contested.
There will therefore always be a role for partial indicators, especially when the more comprehensive approach is unfeasible, and also in acting as diagnostic tools.
This paper has indicated that there are many challenges to embedding VfM considerations into the scrutiny and improvement of the health system. I conclude by summarising what I consider to be the major tasks for three key constituencies: policy makers and regulators, managers, and researchers.
Policy makers need good VfM for two broad reasons: to help design better (cost-effective) policies, and to enhance the accountability to citizens of all actors within the health system. In some respects, the UK has led the world in integrating VfM into the policy process, for example through the creation of NICE and commissioning the Atkinson review. However, in other respects, progress has stalled. For example, the Healthcare Commission did not pursue VfM issues with the same vigour as its other responsibilities, and it is to be hoped that its replacement, the Care Quality Commission, will rectify that lacuna.
It might be felt that measurement of VfM is mainly a technical issue from a regulatory perspective. However, many measures of VfM are highly dependent on judgements that are properly political rather than technical (for example, the relative values that should be attached to different outputs). For this reason, a central requirement is to secure the appropriate involvement of policy makers at all stages of developing measures of VfM. In enhancing VfM measurement the main roles for policy makers are:
• todevelopcoherentconceptualframeworksforthedesignofVfMindicatorsandtheirintegration with other performance measures (such as effectiveness indicators)
• tointegratepoliticalvaluesintoVfMmeasureswhenneeded
• tomandatethecollectionofappropriatedata
• toassuretheindependence,qualityandcomprehensivenessofthosedata
• toassurehigh-qualityanalysis,disseminationandcommentaryonVfMdata
• topromoteamorematurenationalandlocaldebateonVfM
• tointegrateVfMintotheregulatoryprocess,andactonVfMperformancemeasuresinaproportionate and appropriate fashion.
Managers, including clinical leaders, should seek to integrate VfM into all their decision making. However, local NHS organisations have traditionally been weak in financial management skills, and have struggled to make cost-effectiveness central to their business. This is changing, as a result of the advocacy of the Audit Commission and the NHS Institute and in response to examples such as the ‘service line reporting’ initiative of Monitor. However, there is a large agenda for transferring best practice
Smith
Measuring value for money in healthcare: concepts and tools
50
4. Conclusions
to all NHS organisations. Perhaps the biggest challenge is to ensure that PCTs adopt VfM as the central pillar of their commissioning role, in deciding what to commission, in determining whether and where to disinvest, and in checking that providers deliver in line with expectations.
Researchers have made major contributions to the development of NICE cost-effectiveness methodology. However, they have been less active in the performance assessment domain. This is manifest in the lack of a coherent intellectual framework underlying many of the VfM performance assessment initiatives described here. There is therefore considerable scope for further methodological advance, particularly in developing usable comprehensive performance measures. However, researchers also have a role in promoting better informed policy and practice, and in nurturing public understanding of VfM issues. Finally, there remains a widespread failure to integrate VfM considerations into a great deal of medical and health services research. There is a strong case for greater awareness of cost-effectiveness issues amongst all health researchers.
The pursuit of VfM is a central concern in all health systems, made strikingly more urgent by the economic downturn. However, measurement methodology is, and will remain, highly contested and is at a developmental stage. Yet, notwithstanding its complexity, VfM offers the only concept capable of offering a unifying framework for assessing all the diverse objectives of health systems. For VfM to assume the central role that it merits, it is therefore essential that measurement methodologies advance rapidly, that relevant NHS analytic capacity is put in place at both a national and local level, and that VfM becomes embedded in all relevant functions of service delivery and policy making.
Smith
Measuring value for money in healthcare: concepts and tools
51
References
References
Anand S, Ammar W et al (2003). ‘Report of the Scientific Peer Review Group on health systems performance assessment’ in C Murray and D Evans (eds) Health systems performance assessment: debates, methods and empiricism. Geneva: World Health Organization, pp 839–913.
Atkinson T (2005). Final report: measurement of government output and productivity for the national accounts. London: Palgrave Macmillan.
Birch S and Gafni A (2002). ‘On being NICE in the UK: guidelines for technology appraisal for the NHS in England and Wales’. Health Economics, 11, pp 185–191.
Blendon R, Schoen C et al (2003). ‘Common concerns amid diverse systems: health care experiences In five countries’. Health Affairs, 22 (3), pp 106–121.
Briggs A and Gray A (2000). ‘Using cost effectiveness information’. British Medical Journal, 320, p 246.
Busse R, Schreyögg J et al (2008). ‘Special issue: Variability in health care treatment costs amongst nine EU countries: results from the HealthBASKET project’. Health Economics.
Castelli A, Dawson D et al (2007). ‘Improving the measurement of health system output growth’. Health Economics, 16 (10), pp 1091–1107.
Coelli T, Rao D et al (1998). An introduction to efficiency and productivity analysis. Boston: Kluwer Academic Publishers.
Coulter A and Ellins J (2006). Patient-focused interventions – a review of the evidence. London: The Health Foundation.
Coulter A and Magee H (2003). The European patient of the future. Maidenhead: Open University Press.
Dawson D, Gravelle H et al (2005). Developing new approaches to measuring NHS outputs and productivity. Centre for Health Economics Research Paper RP6. York: University of York.
Department of Health and Social Security (1983). Performance indicators: national summary for 1981. London: DHSS.
Dolan P, Shaw R et al (2005). ‘QALY maximisation and people’s preferences: a methodological review of the literature’. Health Economics, 14, pp 197–208.
Drummond M, Sculpher M et al (2005). Methods for the economic evaluation of health care programmes (3rd edn). Oxford: Oxford University Press.
Eddy D (1991). ‘Oregon’s plan: should it be approved?’ Journal of the Amercian Medical Association, 266, pp 2439–2445.
Smith
Measuring value for money in healthcare: concepts and tools
52
References
EuroQol Group (1991). ‘EuroQol: a new facility for the measurement of health-related quality of life’. Health Policy, 16, pp 199–208.
Everitt B, Landau S et al (2001). Cluster analysis. London: Arnold.
Fetter R (1991). ‘Diagnosis related groups: understanding hospital performance’. Interfaces, 21 (1), pp 6–26.
Figueras J, Robinson R et al eds (2005). Purchasing to improve health systems performance. Maidenhead: Open University Press.
Fried HO, Lovell CAK et al (1993). The measurement of productive efficiency. Oxford: Oxford University Press.
Goldstein H and Spiegelhalter DJ (1996). ‘League tables and their limitations: statistical issues in comparisons of institutional performance’. Journal of the Royal Statistical Society, Series A (Statistics in Society), 159, pp 385–409.
Gudex C and Kind P (1988). The QALY toolkit, Discussion Paper DP38. York: Centre for Health Economics, University of York.
Ham C (1998). ‘Retracing the Oregon trail: the experience of rationing and the Oregon Health Plan’. British Medical Journal, 316 (7149), pp 1965–1969.
Hollingsworth B (2003). ‘Non-parametric and parametric applications measuring efficiency in health care’. Health Care Management Science, 6 (4), pp 203–218.
House of Commons Health Select Committee (2008). National Institute for Health and Clinical Excellence. London: The Stationery Office.
Iezzoni LI (2003). Risk adjustment for measuring healthcare outcomes (3rd edn). Baltimore: Health Administration Press.
Iezzoni LI, Ash AS et al (1996). ‘Judging hospitals by severity-adjusted mortality rates: the influence of the severity-adjustment method’. American Journal of Public Health, 86, pp 1379–1387.
Jacobs R, Smith P et al (2006). Measuring efficiency in health care: analytic techniques and health policy. Cambridge: Cambridge University Press.
Kumbhakar SC and Lovell CAK (2000). Stochastic frontier analysis. Cambridge: Cambridge University Press.
Mitton C and Donaldson C (2004). ‘Doing health care priority setting: principles, practice and challenges’. Cost Effectiveness and Resource Allocation, 2 (3).
Mogyorosy Z and Smith P (2005). The main methodological issues in costing health care services. A literature review. CHE research paper 7. York: Centre for Health Economics, University of York.

Smith
Measuring value for money in healthcare: concepts and tools
53
References
National Centre for Health Outcomes Development (2007). Compendium of clinical and health indicators user guide. London: NCHOD.
Office for National Statistics (2006). Public service productivity: health. London: Office for National Statistics.
Office for National Statistics (2004). Public service productivity: health. London: Office for National Statistics.
Peacock S, Ruta D et al (2006). ‘Using economics to set pragmatic and ethical priorities’. British Medical Journal, 332, p 482.
Ruta D, Mitton C et al (2005). ‘Programme budgeting and marginal analysis: bridging the divide between doctors and managers’. British Medical Journal, 330, pp 1501–1503.
Ryan M, Bate A et al (2001). ‘Use of discrete choice experiments to elicit preferences’. Quality in Health Care, 10, pp i55–i60.
Ryan M and Farrar S (2000). ‘Using conjoint analysis to elicit preferences for health care’. British Medical Journal, 320 (7248), pp 1530–1533.
Smith P (2007a). ‘Performance budgeting in England: experience with Public Service Agreements’ in M Robinson (ed) Performance budgeting and funding. Washington DC: International Monetary Fund.
Smith P (2007b). Formula funding of public services. London: Routledge.
Smith P (ed) (2000). Reforming markets in health care: an economic perspective. Buckingham: Open University Press.
Smith P and Street A (2007). ‘The measurement of non-market output in education and health’. Economic and Labour Market Review, 1 (6), pp 46–52.
Smith P and Street A (2005). ‘Measuring the efficiency of public services: the limits of analysis’. Journal of the Royal Statistical Society, Series A, 168 (2), pp 401–417.
Smith S, Cano S et al (2005). Patient-reported outcome measures (PROMs) for routine use in treatment centres: recommendations based on a review of the scientific evidence. London: London School of Hygiene and Tropical Medicine.
Stone M (2002). ‘How not to measure the efficiency of public services (and how one might)’. Journal of the Royal Statistical Society, Series A, 165 (3), pp 405–422.
Thanassoulis E (2001). Introduction to the theory and application of data envelopment analysis: a foundation text with integrated software. Dordrecht: Kluwer Academic Publishers.
Üstün TB, Chatterji S et al (2003). ‘The world health surveys’ in CJL Murray and DB Evans (eds) Health systems performance assessment: debates, methods and empiricism. Geneva: World Health Organization.
Smith
Measuring value for money in healthcare: concepts and tools
54
References
Wailoo A, Roberts J et al (2004). ‘Efficiency, equity, and NICE clinical guidelines’. British Medical Journal, 328, pp 536–537.
Ware J and Sherbourne C (1992). ‘The MOS 36-item Short Form Health Status Survey (SF-36)’. Medical Care, 30, pp 473–483.
Williams A (1997). ‘Intergenerational equity: an exploration of the ‘fair innings’ argument’. Health Economics, 6, pp 117–132.
Williams A (1985). ‘Economics of coronary artery bypass grafting’. British Medical Journal, 291, pp 326–329.
Williams A and Cookson R (2000). ‘Equity in health’ in AJ Culyer and J Newhouse (eds) Handbook of Health Economics. Amsterdam: Elsevier.
World Health Organization (2001). Macroeconomics and health: investing in health for economic development. Geneva: World Health Organization.
World Health Organization (2000). The world health report 2000: Health systems: improving performance. Geneva: World Health Organization.