measuring vulnerability to food · pdf filemeasuring vulnerability to food insecurity ......
TRANSCRIPT
Measuring Vulnerability to Food Insecurity
Pasquale Scaramozzino
ESA Working Paper No. 06-12
October 2006
www.fao.org/es/esa
Agricultural and Development Economics Division
The Food and Agriculture Organization of the United Nations
ESA Working Paper No. 06-12 www.fao.org/es/esa
Measuring Vulnerability to Food Insecurity
October 2006
Pasquale Scaramozzino Dipartimento di Economia e Istituzioni, Facoltà di Economia,
Università di Roma “Tor Vergata” and Department of Financial and Management Studies , SOAS, University of London
e-mail: [email protected]
Abstract This paper develops a novel approach to the analysis of vulnerability in the context of food security. The proposed methodology incorporates recent developments in the analysis of risk management. It can be applied to estimate the probability that a household or a community might fall below a critical food security threshold at some time in the future. The methodology also aims to identify the risk management strategies which are most effective in reducing the likelihood of the occurrence of food insecurity or the severity of its effects. Key Words: Food security, poverty, vulnerability, risk management, livelihoods, value-at-risk. JEL: C53, I32, Q18. I am very grateful to Yasmeen Khwaja and Giancarlo Marini for extremely helpful discussions. This work was carried out as part of the Vulnerability work of the Agriculture and Development Economics Division of FAO, Rome. The designations employed and the presentation of material in this information product do not imply the expression of any opinion whatsoever of the part of the Food and Agriculture Organization of the United Nations concerning the legal status of any country, territory, city or area or of its authorities, or concerning the delimitation of its frontiers or boundaries.
1. Introduction
In recent years there has been increasing awareness that the analysis of food insecurity should be
carried out in a dynamic context. It is essential not just to look at the current incidence of an
inadequate nutritional outcome, but also to identify the individuals, households or the communities
who are more at risk of suffering in the future. The main analytical concept that has been developed
in order to address the issue of the future incidence of food insecurity is vulnerability analysis. The
notion of vulnerability had first been applied to the context of poverty (see Holzmann and
Jørgensen, 2000, for an early application to social risk management), but it is increasingly
acknowledged as an important approach for the analysis of food insecurity as well (Løvendal,
Knowles and Horii, 2005).
The main advantages of the vulnerability approach are twofold. First, the approach is explicitly
dynamic and forward-looking, in the sense that it is not simply concerned with current outcomes but
looks at their future incidence. Hence, it looks at food insecurity ex ante, rather than examining it as
an ex post outcome. Second, the analysis is cast in a stochastic framework and can therefore fully
consider the uncertainties associated with future food insecurity, such as the role of external shocks
and the strategies that households, communities or public institutions can adopt in order to reduce
the likelihood of negative outcomes.
An analysis of the current literature on vulnerability make it apparent that there is at present no
consensus on the conceptual framework – that is, on how to define and measure vulnerability – and
on which empirical methods are the most appropriate for the evaluation and assessment of policies
targeted at reducing vulnerability. In particular, there seems to be insufficient awareness of the
methodologies that have been developed in the Risk Management context for the dynamic analysis
of stochastic processes that can lead to inadequate on unsatisfactory outcomes (see for instance
Elton, Gruber, Brown and Goetzmann, 2003, for applications in a finance context).
The main aim of this paper is to develop a rigorous novel approach to the analysis of vulnerability
in the context of food security, which incorporates recent developments in the analysis of Risk
Management. The proposed methodology can be used in order to estimate the probability that a
household or a community might fall below a critical food security threshold at some time in the
future. This methodology can also be employed in order to identify which risk management
1
strategies can be most effective in reducing the likelihood of the occurrence of food insecurity or
the severity of its consequences.
After providing a brief summary of the main approaches to vulnerability analysis (section 2), the
paper considers some specific problems in the measurement of food security (section 3). Section 4
sets forth a new methodology for the analysis of vulnerability to food insecurity. Section 5
discusses some possible indicators of vulnerability, based on the theoretical framework developed
earlier in the paper. Section 6 considers the empirical application of the methodology. It discusses
the data requirements for the analysis and the issues in the econometric estimation of the model, and
explains how to address the relevant policy questions. Section 7 draws some conclusions.
2. Approaches to vulnerability analysis
There is no established consensus in the literature regarding the most appropriate approach to the
analysis of vulnerability. Furthermore, most analyses of vulnerability focus on poverty, rather than
on food insecurity. Traditional approaches tend to emphasise the role of assets in reducing
vulnerability. Even more crucially, some of the most common methodologies that purport to
analyse vulnerability are static in nature, and thereby fall short of an appropriate assessment of the
dynamic nature of vulnerability.
Sen’s (1988) influential entitlement approach links vulnerability to inadequate access to assets,
including intangible ones, such as social capital. However, access to assets offers no guarantee that
the assets will be used in an effective fashion to reduce vulnerability. The UK Department for
International Development (DFID), for example, develops its vulnerability assessments in terms of
the household assets and activities required to maintain or sustain livelihoods (Department for
International Development, 2003).
By contrast, the World Bank uses a risk-based approach for assessing household vulnerability (as in
World Bank, 2005). The “Social Risk Management” framework of the Bank considers the sources
of vulnerability and the ability of the community to manage the associated risk. The emphasis is
largely on minimising risk exposure, although a major weakness in the approach is the absence of
the consideration of those risks that stem from insufficient ownership or access to assets.
2
Many development agencies, including FAO, analyse vulnerability based on the sustainable
livelihood approaches (e.g., Devereux, Baulch, Hussein, Shoham, Sida and Wilcock, 2003). The
FAO identifies currently vulnerable groups in terms of geographic location, and seeks to determine
the causes of their vulnerability.
Whilst definitions of vulnerability are plentiful, the real difficulty has been in finding a robust
measurement of vulnerability that is consistent with the basic tenets of risk analysis. There are two
main approaches to vulnerability measurement. The outcome approach measures vulnerability in
terms of expected poverty (Chaudhuri, 2001; Chaudhuri, Jalan and Suryhadi 2002). The utility-
based approach measures vulnerability as the difference between the utility a household would
derive from the consumption of a particular bundle with certainty and the expected utility of
consumption (Ligon and Schecter, 2003, 2004).
Within the outcome approach the measures of vulnerability vary depending on the definition of
expected poverty. Chaudhuri (2001), Chaudhuri, Jalan and Suryhadi (2002) and Christiaensen and
Boisvert (2000) use the expected headcount measure of poverty; Ravallion (1988) uses expected
squared poverty gap to measure vulnerability, while Kamanou and Morduch (2002) consider
expected changes in poverty as opposed to expected poverty.
The outcome approach to vulnerability can help provide a quantitive measure of the incidence of
vulnerability, which is useful in placing households with respect to the reference threshold, as
policy can be directed towards particular groups. However, as Gaiha and Imai (2004) correctly
point out, vulnerability can be high even if measured poverty is low.
The utility-based measures of vulnerability contrast the expected utility derived from consumption
against the utility derived from consumption of a particular bundle with certainty. The utility
function can be decomposed into distinct components measuring poverty and risk. The risk measure
has the advantage of capturing both aggregate and idiosyncratic risk. This approach can in principle
identify whether vulnerability affects those with low asset levels, unfavourable settings or low
returns to assets.
Glewwe and Hall (1998) and Dercon and Krishnan (2000) adopt a different approach to
vulnerability by considering the ability of the household to smooth consumption through observed
changes in consumption over time in response to shocks. The approach is however, in essence, not
3
dissimilar to the expected poverty approach but uses an internal rather than a socially defined
poverty threshold.
Ligon and Schechter (2004) have attempted to evaluate different measures of vulnerability by using
various definitions and estimators of vulnerability using datasets from Vietnam and Bulgaria. The
main purpose of their study is to allow practitioners with any given dataset to identify a suitable
approach to measuring vulnerability.
A fundamental difficulty with most existing approaches to vulnerability is that they are essentially
static, and are therefore not fully appropriate to measure the dynamic aspects of risk. Chaudhuri
(2001) and Chaudhuri, Jalan and Suryhadi (2002) analyse the probability of being below a critical
consumption threshold by estimating a parametric heteroskedastic probit model, conditional on
contemporaneously-observed characteristics of the household. Ligon and Schecter (2003, 2004)
also use currently observed regressors to decompose the difference between a threshold level of
utility and the certainty equivalent level of consumption.
Gentilini and Webb (2005) suggest an interesting extension of the well-known Human
Development Index to include hunger indicators, that were originally excluded from the calculation
of the HDI. Their approach is however still a static one, since they measure the current hunger
status rather than vulnerability to food insecurity.
By contrast, the approach to the analysis of vulnerability developed in this paper is intrinsically
dynamic and captures the forward-looking aspects of vulnerability to future risks.
3. Analysing Food security
There are numerous measures of food insecurity depending on the specific focus and the aims of the
analysis. Anthropometric measures such as wasting (low weight-for-height) or stunting (low height-
for-age), for example, are nutritional outcome measures of food insecurity. They reflect the
consequences of prolonged food insecurity, but do not consider the determinants of food insecurity
as such (Dasgupta, 1993).
4

The annual report by the FAO on the State of Food Insecurity in the World (SOFI) includes several
measures of food insecurity, from those living on less than a dollar a day to those consuming less
than the recommended calories intake for a healthy life. These measures give a very clear snap-shot
of the current global situation.
There has been a recognition of the need to develop analyses to inform policies that are not only
aimed at the currently food insecure but at those who are likely to become food insecure in the
future. The emphasis on forward-looking analyses has received a great deal of attention, but most
studies on vulnerability look at poverty rather than at food security. While the two concepts are
related, there are a number of specific issues with food security that should be explicitly addressed.
To a large extent these depend on identifying the factors that result in food insecurity in the first
place, which may not always be consistent with the factors that result in poverty.
In analysing food insecurity where availability, access and stability are the key determinants of food
security (Devereux, Baulch, Hussein, Shoham, Sida and Wilcock, 2003; Løvendal and Knowles,
2005). Access refers to the means or assets needed to consume food while stability refers to the
long-term need to maintain consumption levels. A fourth element pertains to utilisation, that is, the
extent to which food is effectively transformed by the body.
The Twin-Track approach developed by the FAO provides a very comprehensive policy approach
to food insecurity based on rural development and productivity enhancement combined with safety
net measures. Crucially the approach recognises that food insecurity needs to be treated through
both direct and indirect measures depending on the context. Even in the crisis context, there is
growing acknowledgement of a scope for long-term food security interventions by ensuring access
to food and by enhancing stability in consumption (see Pingali, Alinovi and Sutton, 2005, and
Flores, Khwaja and White, 2005). By advocating policies for long-term food security, the policy
recommendations of the Twin-Track approach also have a bearing on the reduction of vulnerability
to food insecurity.
4. A new methodology for the analysis of vulnerability to food insecurity
The main difficulty with most existing approaches to the analysis of food insecurity, both
theoretically and empirically, is that they are not sufficiently distinct from a static analysis of
5
inadequate nutritional outcomes. Existing approaches directly stem from the analysis of poverty,
and tend not to exploit fully the dynamic, forward-looking potential of the notion of vulnerability.
For instance, as explained in section 2 both the approaches by Chaudhuri, Jalan and Suryhadi
(2002) and by Ligon and Schecter (2003, 2004) apply static econometric methods which only make
use of contemporaneously-observed characteristics of the household and, therefore, fail to capture
the dynamic aspects of vulnerability.
The methodologies applied in Risk Management theory, by contrast, can provide a sound
conceptual framework for an appropriate theoretical analysis of the concept of vulnerability, and
can offer the methods and tools for a dynamic empirical analysis. Risk Management has mainly
been developed precisely because of the need to identify strategies for dealing with risks in
uncertain environments. It has a rigorous foundation in probability theory and in risk analysis, and
is an extremely operational discipline insofar at its main aim is to provide practical guidance to
decision making. Crouhy, Galai and Mark (2001) and Elton, Gruber, Brown and Goetzmann (2003)
provide excellent expositions of the main concepts and methods of Risk Management.
Scaramozzino (2005) discusses some recent methodologies with applications to finance and
banking.
Rigorous methodologies from risk analysis have rarely been applied to the analysis of vulnerability
to food insecurity. Their application would therefore be a novel feature of the present approach, and
could represent an innovative contribution to the literature on food security and offer new
perspectives on policies and programme interventions.
The most relevant risk management methodology for the measurement of vulnerability in a food
insecurity context is the Value-at-Risk (VaR) analysis. This methodology is widely used for the
management of the specific risks faced by financial and banking institutions, where it is employed
in order to measure the risk associated with an investor’s asset and liability position. VaR
calculations are essential in order to identify the resources that have to be set aside for minimum
capital adequacy requirements, as set out by the revised framework of the Bank of International
Settlements Committee (Basel II: see Basel Committee on Banking Supervision, 2005; and Crouhy,
Galai and Mark, 2006). This problem is akin to the decision faced by households regarding the
resources that must be set aside as a contingency against negative future outcomes. VaR is a very
flexible tool that can be usefully employed both for measuring and for managing risk. Technical
6
discussions of VaR can be found, for instance, in Jorion (1996a and 1996b), Dowd (1998), and Hull
(2003).
The VaR methodology analyses the probability that the outcome of a risky event might fall below a
critical threshold, on the basis of the statistical distribution of all possible outcomes. Strictly
speaking, VaR measures the worst loss that can be expected, given a specified level of probability
(denoted as the confidence level). Formally, in general VaR can be defined as a percentile of the
distribution of the uncertain outcome over a specified time horizon.
The need to use a probabilistic definition is apparent once one considers that, if a household only
looks at the very worst possible outcomes without regard to their (potentially very small) likelihood,
it might be led to pursue an unduly cautious strategy. It is important to consider how likely the
various outcomes may be, so that the household can adopt a strategy that is still prudent but does
not prevent it from making decisions that could yield a potentially large expected outcome and that
only entail a moderate amount of risk.
In the context of food security, VaR can be defined in terms of the critical threshold level of the
nutritional outcome consistent with a small (given) probability of the outcome falling below this
level, over a given time horizon (section 5 discusses in detail the choice of appropriate food security
indicators). By focusing on worst case scenarios, VaR considers the very outcomes that are relevant
from the point of view of food vulnerability. The key aspects of the definition are the degree of
confidence required of the measure and the level of the nutritional outcome that is used as a
benchmark. In principle, it is of course possible to consider a number of alternative confidence
levels and threshold benchmarks. The resulting sensitivity analysis, or more elaborate forms of test
stressing or scenario analyses, can provide a comprehensive overview of the risk position of the
household.
As an example, VaR analysis could lead to estimate that, with a 95 percent confidence, a given
household will not experience food insecurity during the next six months, in terms of its nutritional
outcome relative to a pre-specified benchmark. A higher level of confidence would be associated
with increased food security, or equivalently with reduced food insecurity. Thus, if a household is
99 per cent confident that it will not experience food insecurity during the next reference period, the
household can be regarded as relatively safe under most circumstances. By contrast, if a household
7
were only 50 per cent confident that it will not experience food insecurity, then it would usually be
regarded as vulnerable.
The VaR analysis would also enable the household to assess the amount of resources that ought to
be set aside in order to achieve food security, for any chosen level of confidence. If the household
faces a relatively high probability of being food insecure in the future, the VaR methodology could
lead to an estimation of the critical resources that are necessary in order to overcome its
vulnerability. This problem is analogous to the determination of the capital adequacy requirements
that lending institutions have to satisfy in order to reduce their vulnerability to adverse market or
credit shocks. Hence, VaR is a highly operational methodology that can directly provide with
recommendations regarding the actions that should be put in place in order to reduce vulnerability.
The methodology of VaR can also be applied to clusters of households or to communities. The
calculation of VaR for a group of individuals must consider the covariance structure between their
likely future food security outcomes. This is because, consistent with the basic principles of risk
management and portfolio analysis, the risk of a group of individuals can be lower (or greater) than
the sum of the individual risks, depending on how the uncertain outcomes are correlated with each
other and with the external shocks (Elton, Gruber, Brown and Goetzmann, 2003).
An operative definition of Value-at-Risk in the context of food insecurity is the maximum shortfall
in nutrition outcome relative to a reference level over a given time period such that there is a low
probability, say a 10 percent probability, that the actual shortfall over the given period will be
larger. This shortfall must be measured relative to a benchmark that represents an acceptable
nutritional outcome for the household or the unit of analysis. If the probability of the nutritional
outcome being less than the maximum shortfall is greater than 10%, then the unit of analysis is
regarded as vulnerable to food insecurity. In this example, the confidence level would be 90%. Of
course, a different probability level could be chosen, and accordingly a different confidence level
would apply to the definition of vulnerability. The precise choice of the suitable confidence level
must be guided by the researcher’s judgement regarding the level of risk that households face. A
higher confidence level (say, 95%) would lead to a less restrictive definition of vulnerability, and a
lower confidence level (say, 80%) would lead to a more restrictive definition. In other words, fewer
household would be classified as vulnerable when the confidence level chosen in 95% than when
the confidence level is 90% or 80%. Again, a sensitivity analysis might be appropriate to select the
most informative confidence level.
8
Value-at-Risk could also be defined in absolute terms, as the worst case nutrition outcome at a
given confidence level (Absolute Value-at-Risk, or VaR'). Yet another complementary definition is
Extreme Value-at-Risk, or EVaR. This could be defined as the expected nutritional outcome in the
worst-case scenario, with say a 10 per cent probability (i.e. at the 90 per cent confidence level) (see
Crouhy, Galai and Mark, 2001, for examples and applications). These definitions of Value-at-Risk
focus on complementary aspects of risk, and could form the basis for alternative indicators of
vulnerability as will be explained in section 5.
As argued above, an important aspect of the VaR methodology is that it can be employed in order to
identify the strategies that should be put in place to prevent food insecurity and to estimate their
effectiveness. Section 6 explains how it can possible to measure the sensitivity of estimated VaR
with respect to its main determinants. These include both the exogenous risk factors and the
endogenous variables that are the outcome of the risk management or risk reduction strategies
implemented by households. The measures of the sensitivity of VaR with respect to the variables
that capture the risk management decisions of households offer a guidance as to which strategies
can be more effective for reducing vulnerability, in terms of their quantitative impact on the overall
VaR faced by the households. In other words, the size of the coefficients of the endogenous
decision variables can be important for the purposes of identifying the most useful strategies
available to households, communities or policy making institutions1.
Since VaR has been developed precisely to consider the likely consequences of events that could
happen randomly but that, when they do occur, could yield large losses, the methodology can be
extremely useful in order to identify ‘worst case scenarios’ for food insecurity. This could clearly be
extremely relevant for policy, since it could give a more precise indication about the resources that
should be mobilised and about the strategies that should be put in place to prevent the occurrence of
food insecurity, or to lessen their negative impact.
A potential generalisation of the VaR methodology could consist of looking at the conditional
transition probabilities for the stochastic process describing the nutritional status of households,
given their characteristics and the risk factors that could affect their nutritional outcome. Formally,
1 Of course, care must be taken to control for the potential endogeneity of the household decisions when estimating the model using econometric methods: see the discussion in section 6.
9
this could lead to the definition of vulnerability in terms of the probability of an individual or
household being in a vulnerable status in the future2.
A nutritional outcome is by definition individual. Since the main focus of interest of the analysis is
often the household, it become necessary to define an appropriate notion of nutritional outcome for
the household as a whole. If there is perfect income and resource pooling within the household, and
in the absence of serious health problems for specific individuals, the nutritional outcomes for all
household members should be very similar. If however there is less than perfect pooling of
resources within the household, it is possible that the nutritional outcome is adequate for some
members of the household but not for others. In this case, an operational definition of adequate
nutritional outcome for the household can be based on the notion that all individual members
achieve an adequate outcome.
5. Indicators of vulnerability to food insecurity
Vulnerability is a forward-looking concept based on the notion that the food security outcome of
households is the realisation of a stochastic process, conditional on a number of risk factors at
different levels. Vulnerability can be modified by endogenous strategies implemented by
households, communities or public institutions.
An important aspect of the role of policy and of risk management strategies is the existence of lags
between when the strategies are implemented and the time when their effects have worked
themselves through to nutritional outcomes. These lags must be taken into account and factored in
when considering alternative strategies for reducing the risk of food insecurity or for mitigating
their negative consequences.
As argued in section 3, it is by now accepted that food insecurity ought to be defined according to
its different dimensions: availability, access and stability (Pingali, Alinovi and Sutton, 2005).
Hence, an appropriate notion of vulnerability should consider all these aspects. This poses no
difficulty for our suggested methodology, since it is always possible to develop a comprehensive
definition of food security that combines the different dimensions of food security according to an
2 In financial applications, a number of methodologies have been suggested which define vulnerability in terms of conditional transition probabilities. One such methodology is CreditMetrics, developed by JP Morgan (see JP Morgan, 1997).
10
appropriate metrics, as is standard in economic applications3. This indicator could be an appropriate
combination of availability, access, stability and utilisation of food, as well as suitable
anthropometric measures, and can be constructed by using classical statistics techniques such as
principal components or factor analysis (see e.g. Morrison, 1967).
Let y denote the food security indicator, which summarizes the food security outcome for a
household according to its different dimensions. Then the household’s vulnerability to food
insecurity can be defined as the expected welfare loss associated with an inadequate value of the
food security indicator, conditional on a number of characteristics of the households, the strategies
they put in place, risk management policies implemented by public institutions, and factors outside
the control of households and of the public institutions, such as community-wide negative shocks.
We denote these variables by the vector x.
Consistent with the methodology of section 4 and with the discussion above, an indicator of
household vulnerability can be expressed as:
∫=*
01 )|()()*,(
y
ydFyWyV xx
where y* is a critical benchmark value for the food security indicator, x is a vector of the current
household- and community-specific conditioning variables, W(⋅) is the household welfare function,
and F(⋅|x) is the conditional distribution function of the future food security indicator, given the
vector of conditioning variables x. The vector x might include the current value of the food security
indicator. Hence, this definition allows for the possibility that a household that is not suffering from
an inadequate nutritional outcome at present might suffer in the future, as well as for the possibility
that a household that is currently food insecure might move away from its current vulnerable status.
Hence, the definition captures the dynamic, forward-looking nature of food insecurity, as well as its
stochastic properties.
The above general definition is based on an assessment of the welfare losses associated
with food insecurity. In terms of the discussion of section 4, it can therefore be seen as an
application of the notion of Extreme Value-at-Risk (see Crouhy, Galai and Mark, 2001, and
Scaramozzino, 2005).
)*,(1 xyV
3 See for instance Morrison (1967) and Leti (1979).
11
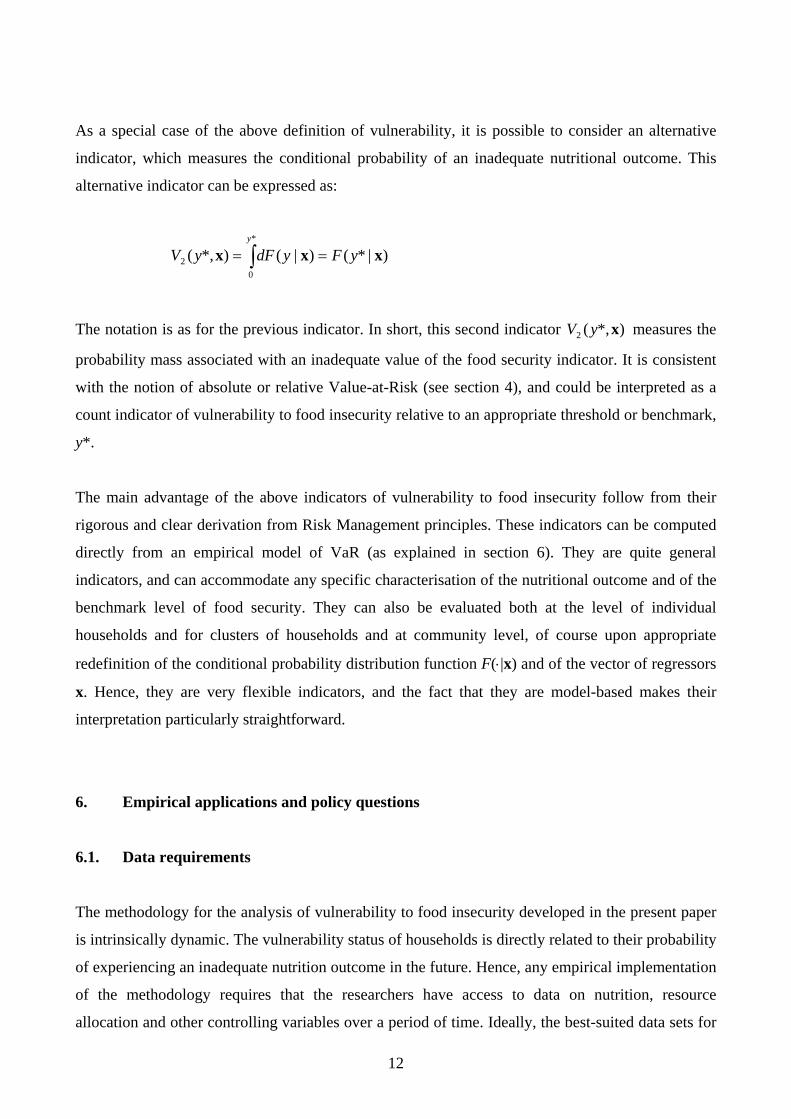
As a special case of the above definition of vulnerability, it is possible to consider an alternative
indicator, which measures the conditional probability of an inadequate nutritional outcome. This
alternative indicator can be expressed as:
)|*()|()*,(*
02 xxx yFydFyV
y
== ∫
The notation is as for the previous indicator. In short, this second indicator measures the
probability mass associated with an inadequate value of the food security indicator. It is consistent
with the notion of absolute or relative Value-at-Risk (see section 4), and could be interpreted as a
count indicator of vulnerability to food insecurity relative to an appropriate threshold or benchmark,
y*.
)*,(2 xyV
The main advantage of the above indicators of vulnerability to food insecurity follow from their
rigorous and clear derivation from Risk Management principles. These indicators can be computed
directly from an empirical model of VaR (as explained in section 6). They are quite general
indicators, and can accommodate any specific characterisation of the nutritional outcome and of the
benchmark level of food security. They can also be evaluated both at the level of individual
households and for clusters of households and at community level, of course upon appropriate
redefinition of the conditional probability distribution function F(⋅|x) and of the vector of regressors
x. Hence, they are very flexible indicators, and the fact that they are model-based makes their
interpretation particularly straightforward.
6. Empirical applications and policy questions
6.1. Data requirements
The methodology for the analysis of vulnerability to food insecurity developed in the present paper
is intrinsically dynamic. The vulnerability status of households is directly related to their probability
of experiencing an inadequate nutrition outcome in the future. Hence, any empirical implementation
of the methodology requires that the researchers have access to data on nutrition, resource
allocation and other controlling variables over a period of time. Ideally, the best-suited data sets for
12
the analysis of vulnerability are longitudinal data on households, since they display both cross-
section and time-series variability (see Baltagi, 2001). Longitudinal data sets are increasingly
becoming available for developing countries, in consideration of their importance for the analysis of
economic behaviour in a dynamic setting (Deaton, 1997).
In the absence of longitudinal data, it is at least necessary that the data set is a cross-section of
household with historical information on key variables, for instance in the form of the history of the
shocks from which the household has been affected and of past information about key economic
variables. In this way it will still be possible to consider the dynamic aspects of vulnerability, even
if it will prove problematic to control for household-specific time-invariant risk factors since fixed-
effects and random-effects econometric techniques can only be implemented using longitudinal data
(Baltagi, 2001). It is increasingly accepted that this form of retrospective information can allow the
researcher to implement panel data methodologies for the estimation of time-varying features of the
data, and therefore can be employed for a dynamic analysis of vulnerability. Retrospective
information is more and more common in questionnaire surveys and in econometric analysis.
Regarding specific data requirement, it is important to be aware that it can be difficult to measure
food insecurity from direct subjective questions in survey data. In a recent analysis, Migotto, Davis,
Carletto and Beegle (2005) use household surveys for Albania, Madagascar, Nepal and Indonesia to
examine the consistency between reported indicators of food insecurity and more objective quantity
indicators, such as calorie consumption, dietary diversity and anthropometrical measures. It is
shown that the correlations between the two categories of indicators is at best weak, therefore
suggesting that objective measures are still to be preferred to subjective indications of vulnerability.
Hence, both objective and retrospective information is required in order to estimate reliably the
vulnerability status of households.
The data sets on which the vulnerability analysis can be implemented should contain information on
the relevant categories of household and community variables that are potential risk factors, and on
the behavioural strategies that have been adopted to cope with food uncertainties.
At the very least, the categories of variables that should be present in the data set should include the
following household- or individual-specific variables:
(i) demographic characteristics (including structure of the household, age, gender);
13
(ii) health variables (morbidity, anthropometrical indicators);
(iii) labour market variables (education, employment status, agricultural and non-agricultural
labour income);
(iv) production variables (crop production, harvesting);
(v) other economic variables (assets, land, saving, investment, credit);
(vi) expenditure variables (food consumption, non-food consumption, durables);
(vii) food variables (breakdown of food consumption, dietary habits and preferences, intra-
household food distribution).
The variables should also include information on the community of which the household is a
member, such as:
(i) demographic characteristics;
(ii) geographic variables;
(iii) weather variables;
(iv) health facilities;
(v) schools;
(vi) average prices and wages in the village;
(vii) social infrastructure;
(viii) relevant food security programmes.
6.2. Econometric estimation
The empirical estimation and econometric testing of the models set out in this paper requires the use
of limited-dependent variable methods and the application of conditional Markov models.
The methodologies for the estimation of limited-dependent variables models are described in
Maddala (1983), Amemiya (1985), Pudney (1989) and Mukherjee, White and Wuyts (1998). They
include the logit and probit methods, which are appropriate when the dependent variable is
dichotomous and categorical. The logit transformation can be defined as the logarithms of the
probability odds, whereas the probit method is based on the cumulative normal distribution
function. Logit and probit analyses are appropriate when the question of interest is the estimation of
the probability that a certain characteristic is present or absent in the data, for instance, the
occurrence of food insecurity.
14
Limited-dependent variable methods require the estimation of hazard rates for households, which
are related to the conditional probabilities discussed in sections 4 and 5. It is important to note that,
since some of the variables in the regression equations are indicator or dummy variables, one has to
use estimation techniques that are appropriate for grouped data in order to correct for the potential
heteroskedasticity, common in cross-sectional data sets.
Conditional Markov models are stochastic dynamic models where past information can help predict
the future outcomes of key variables. The relevant past information can include, among others,
characteristics of the household and of the village. Hence, the predictions are conditional on the
information contained in these regressors, in addition to the lagged values of the dependent variable
itself.
The estimation of the conditional Markov models needed for the analysis of vulnerability can use
the standard Quasi-Maximum-Likelihood methods for multinomial qualitative-response models
(Amemiya, 1985; see Cox and Miller, 1965, for an analysis of stochastic Markov processes). These
are non-linear methods that are based on the statistical distribution function of the parameters,
estimated from the empirical sample information. The presence of exogenous regressors can be
accommodated by the use of minimum chi-square estimators.
One important aspect of the econometric estimation is the potential endogeneity of the regressors
pertaining to the risk management strategies implemented by the household. The value of some of
the predictors of future food insecurity are themselves the outcomes of risk-reducing strategies by
the household. A possible solution to this problem is the analysis of the propensity score of the
model, in order to establish the degree of overlapping of the stochastic distributions of sub-samples
of households in terms of pre-intervention variables. This methodology is motivated and explained,
for instance, by Holland (1986) and Imbens (2000).
A complementary strategy for the empirical analysis consists of carrying out a quantile analysis of
the key economic variables (as in World Bank, 2005). Quantile regression methods can be
extremely useful in order to identify non-linearities in the response of vulnerability to the relevant
risk factors. Quite apart from their validity as inference tools, quantile regression analysis can be
very informative about the distribution of key risk factors in the sample of households. The
econometric methodology is explained in Koenker and Basset (1978) and in Buchinsky (1995,
15
2000). Fattouh, Harris and Scaramozzino (2005) is a recent application of the quantile regression
methods.
6.3. Policy analysis
The relevance for policy analysis of our suggested methodology lies in the assessment of the
quantitative importance of main risk factors for the household vulnerability to food insecurity and in
the identification of the most effective risk management strategies, either at the household or
community level, or directly by public institutions (for instance, through agricultural extension
aimed at crop diversification, income diversification, or rural public works).
The methodology would also make it possible to identify typologies or clusters of households that
could be regarded as homogeneous in terms of their vulnerability to food insecurity. Thus, it
becomes possible to identify groups of households that can be regarded as either comparatively safe
or risky, relative to their food vulnerability status. Furthermore, by looking at the time variation in
the risk factors and at their interactions with the food instability of households, one can assess the
effectiveness of risk management or risk coping policies at the national level.
At the level of communities or public institutions, the methodology could establish which strategies
are the most effective, both in an ex ante risk management sense and as ex post coping strategies. In
the empirical estimations illustrated in section 6.2, one should look at the statistical and at the
economic significance of the variables that describe the policy variables. Their statistical
significance would reveal whether the strategies play a systematic role, and their economic
significance (which is related to the size of the coefficient relative to the values of the dependent
variable) would measure their potential quantitative impact on food security.
The above policy analyses rely on the calculation of Value-at-Risk for individual households and
for clusters of households. These can be carried out by using a conditional variance-covariance
approach based on: (i) the selection of the risk factors; (ii) the estimation of their sensitivity; (iii)
modelling of the change in the risk factors (Crouhy, Galai and Mark, 2001). Steps (i) and (ii)
directly follow from the econometric analysis discussed in section 6.2, whereas (iii) can be set by
the researcher in accordance with the specific research questions of interest. It would then become
possible to compute the vulnerability indicators set out in section 5.
16
Specific policy issues can be addressed by simulating a number of alternative shocks to the risk
factors, and by estimating their impact on the Value-at-Risk measures and on the vulnerability
indicators. The effectiveness of the alternative risk management strategies by households or by
public institutions can also be estimated using this approach.
6.4. Empirical analysis
As argued in section 6.1, the vulnerability methodology requires the use of a data set that contains
both objective and retrospective information. One country for which the methodology set out in this
paper is feasible is Bangladesh. The survey on commercial vegetable and polyculture fish
production carried out between 1996 and 1997 includes most of the required information for the
econometric estimation of the model as discussed in section 6.3 and for the implementation of the
vulnerability analysis (IFPRI, 1998). Hallman, Lewis and Begum (2003) have made use of this data
set in order to estimate the impact on poverty reduction of the introduction of different agricultural
technologies. The survey presents a wealth of information on household characteristics, including
health and nutrition variables. One shortcoming of the data set might be the relatively short nature
of the sample (four waves of observations over one year), which could make it problematic to
explore longer-term household behaviour and risk management strategies without the use of
additional information.
An alternative approach to the empirical analysis could consist in leading a survey in a country that
has been affected by food insecurity. The main advantage of this approach is that it might be
possible to design the questionnaire in order to obtain the specific information that is required for
the vulnerability analysis and for the computation of the vulnerability indicators. The main
shortcoming would be that the data set would consist of a cross-section rather than longitudinal
data. In order to analyse some dynamic aspects of the response of households, it is essential to have
some retrospective information in the data. This could be obtained by including some historical
questions in the questionnaire4.
4 With a cross-section, it is not possible to correct for fixed-effects nor to implement dynamic Generalised Methods of Moments techniques as done for instance by Gaiha and Imai (2004), who use ICRISAT panel survey to assess the vulnerability to poverty of different groups of households in India. However, it would still be possible to use Instrumental Variable techniques to correct for the potential endogeneity of some of the regressors. It should be noted that the GMM technique implemented by Gaiha and Imai, based on
17
If an original survey is carried out, it would be essential to apply rigorous sampling techniques and
methodologies as discussed for instance by Deaton (1997). The sampling variability of the response
could be reduced by stratifying the sample of households in terms of homogeneous typologies.
Furthermore, in order to reduce the overall survey cost, a two-stage stratified design may be
implemented. This could however affect the precision of the estimates of the parameters and of the
behavioural relationships of interest. Hence, use must be made of the appropriate formulae for the
computations of the standard errors of the estimates (Cochrane, 1977).
7. Conclusions
The present paper has set out an innovative approach to the analysis of vulnerability of food
insecurity, by proposing a rigorous methodology based on methods and concepts from Risk
Management theory. The methodology focuses on individuals and households and on clusters of
these. The paper has suggested a number of indicators of vulnerability to food insecurity. These
indicators can be usefully employed to assess the different risks faced by households or
communities, and how these risks have changed over time. The unit of analysis could also in
practice be livelihood groups or other homogeneous typologies.
The paper provides detailed instructions for the empirical testing of the model and for its
application in relation to policy formulation. The paper suggests a number of countries for the
analysis of vulnerability although, given the availability of ready data, Bangladesh could be an
immediate starting point for the estimation of the model.
The methodology could usefully be employed in order to identify which risk management strategies
can be the most effective in reducing the likelihood of the occurrence of food insecurity or the
severity of its effects.
Arellano and Bond (1991), could in fact be interpreted as a Generalised Instrumental Variable method, where the number of instruments is not constant but depends on the timing of the wave of the panel.
18
References
Amemiya, T. (1985), Advanced Econometrics, Oxford, Basil Blackwell.
Arellano, M., and S. Bond (1991), “Some Tests of Specification for Panel Data: Monte Carlo
Evidence and an Application to Employment Equations”, Review of Economic Studies, Vol.
58, pp. 277-297.
Baltagi, B.H. (2001), Econometric Analysis of Panel Data, 2nd ed., New York, John Wiley & Sons.
Basel Committee on Banking Supervision (2005), International Convergence of Capital
Measurements and Capital Standards. A Revised Framework, Basel, Bank for International
Settlements.
Buchinsky, M. (1995), “Estimating the Asymptotic Covariance Matrix for Quantile Regression
Models: A Monte Carlo Study”, Journal of Econometrics, Vol. 65, pp. 109-154.
Buchinsky, M. (2000), “Recent Advances in Quantile Regression Models. A Practical Guideline for
Empirical Research”, The Journal of Human Resources, Vol. 33, No. 1, pp. 88-126.
Chaudhuri, S. (2001), “Empirical Methods for Assessing Household Vulnerability to Poverty”,
Department of Economics, Columbia University, mimeographed.
Chaudhuri, S., J. Jalan and A. Suryhadi (2002), “Assessing household vulnerability to poverty:
Illustrative examples and methodological issues”. Presentation at the IFPRI- World Bank
Conference on Risk and Vulnerability: Estimation and Policy Applications, September 23-
24, Washington D.C.
Christiaensen L., and R.N. Boisvert (2000), “On Measuring Household Food Vulnerability: Case
evidence from Northern Mali”, Department of Agricultural, Resource, and Managerial
Economics, Cornell University, mimeographed.
Cochrane, W.G. (1977), Sampling Techniques, New York, Wiley.
19
Cox, D.R., and H.D. Miller (1965), The Theory of Stochastic Processes, London, Chapman and
Hall Ltd.
Crouhy, M., D. Galai, and R. Mark (2001), Risk Management, New York, McGraw Hill.
Crouhy, M., D. Galai, and R. Mark (2006), The Essentials of Risk Management, New York,
McGraw Hill.
Dasgupta, P. (1993), An Inquiry into Well-Being and Destitution, Oxford, Clarendon Press.
Deaton, A. (1997), The Analysis of Household Surveys. A Microeconometric Approach to
Development Policy, Baltimore, The World Bank and Johns Hopkins University Press.
Department for International Development (2003), “Social Protection”, chapter 20 in Policy
Planning and Implementation, April.
Dercon, S., and P. Krishnan (2000), “Vulnerability, Seasonality and Poverty in Ethiopia”, Journal
of Development Studies, Vol. 36, No.6, pp. 25-53.
Devereux, S., B. Baulch, K. Hussein, J. Shoham, H. Sida, and D. Wilcock (2003), “Improving the
Analysis of Food Insecurity. Food Insecurity Measurement, Livelihoods Approaches and
Policy: Applications in FIVIMS”, FIVIMS, mimeographed.
Dowd, K. (1998), Beyond Value at Risk, New York, John Wiley and Sons.
Elton, E.J., M.J. Gruber, S.J. Brown, and W.N. Goetzmann (2003), Modern Portfolio Theory and
Investment Analysis, 6th ed., New York, Wiley.
Fattouh, B., L. Harris, and P. Scaramozzino (2005), "Capital Structure in South Korea: A Quantile
Regression Approach", Journal of Development Economics, Vol. 76, No. 1, February 2005,
pp. 231-250.
20
Flores, M., Y. Khwaja, and P. White (2005), “Food Security in Protracted Crises: Building More
Effective Policy Frameworks”, Disasters, Vol. 29, S1, pp. S25-S51.
Gaiha, R., and K. Imai (2004), “Vulnerability, Shocks and Persistence of Poverty – Estimates for
Semi-Arid Rural South India”, Oxford Development Studies, Vol. 32, No. 2, June, pp. 261-
281.
Gentilini, U., and P. Webb (2005), “How Are We Doing on Poverty and Hunger Reduction? A New
Measure of Country-Level Progress”, World Food Programme, mimeographed.
Glewwe, P., and G. Hall (1998), “Are Some Groups More Vulnerable to Macroeconomic Shocks
than Others? Hypothesis Tests Based on Panel Data from Peru”, Journal of Development
Economics, Vol. 56, No. 1, pp. 181-206.
Hallman, K., D. Lewis, and S. Begum (2003), “An Integrated Economic and Social Analysis to
Assess the Impact of Vegetable and Fishpond Technologies on Poverty in Rural
Bangladesh”, Environment and Production Technology Division and Food Consumption
and Nutrition Division, IFPRI, EPTD Discussion Paper No. 112 and FCND Discussion
Paper No. 163.
Holland, P.W. (1986), “Statistics and Causal Inference”, Journal of the American Statistical
Association, Vol. 81, No. 396, December, pp. 945-960.
Holzmann, R., and S. Jørgensen (2000), “Social Risk Management: A New Conceptual Framework
for Social Protection, and Beyond”, Social Protection Discussion Paper No. 0006,
Washington DC, World Bank, February.
Hull, J.C. (2003), Options, Futures, and Other Derivatives, 5th ed., New Jersey, Prentice Hall.
Imbens, G.W. (2000), “The Role of Propensity Score in Estimating Dose-Response Functions”,
Biometrika, Vol. 87, pp. 706-710.
21
International Food Policy Research Institute (IFPRI) (1998), Commercial Vegetable and
Polyculture Fish Production in Bangladesh: Their Impacts on Income, Household Resource
Allocation, and Nutrition, Food Consumption and Nutrition Division, IFPRI.
Jorion, P. (1996a), Value-at-Risk: The New Benchmark for Controlling Market Risk, Chicago,
Irwin.
Jorion, P. (1996b), “Risk2: Measuring the Risk in Value-at-Risk”, Financial Analysts Journal, Vol.
52, November/December, pp. 47-56.
J.P. Morgan (1997), Creditmetrics, Technical Document.
Kamanou, G., and J. Morduch (2002), “Measuring Vulnerability to Poverty”. NYU Wagner
Working Paper No. WP1012. New York: New York University.
Koenker, R., and G. Basset, (1978), “Regression Quantiles”, Econometrica, Vol. 46, pp. 33-50.
Leti, G. (1979), Distanze e Indici Statistici, Roma, La Goliardica.
Ligon, E., and L. Schechter (2003), “Measuring Vulnerability”, Economic Journal, Vol. 113(486),
pp. C95-C102.
Ligon, E., and L. Schechter (2004), “Evaluating Different Approaches to Estimating Vulnerability”,
Social Protection Discussion Paper No. 0410, Washington DC, World Bank,.
Løvendal, C.R., Knowles, and N. Horii (2004), “Understanding Vulnerability to Food Insecurity
Lessons from Vulnerable Livelihood Profiling”, Agricultural and Development Economics
Division, FAO, ESA Working Paper No. 04-18.
Løvendal, C.R., and M. Knowles (2005), “Tomorrow’s Hunger: A Framework for Analysing
Vulnerability to Food Insecurity”, Agricultural and Development Economics Division,
FAO, ESA Working Paper No. 05-07.
22
Maddala, G. (1983), Limited-Dependent and Qualitative Variables in Econometrics, Cambridge,
Cambridge University Press.
Migotto, M., B. Davis, G. Carletto, and K. Beegle (2005), “Measuring Food Security Using
Respondents’ Perception of Food Consumption Adequacy”, Agricultural and Development
Economics Division, FAO, ESA Working Paper No. 05-10.
Morrison, D.F. (1967), Multivariate Statistical Methods, New York, McGraw-Hill.
Mukherjee, C., H. White and M. Wuyts (1998), Econometrics and Data Analysis for Developing
Countries, London, Routledge.
Pingali, P., L. Alinovi, and J. Sutton (2005), “Food Security in Complex Emergencies: Enhancing
Food System Resilience”, Disasters, Vol. 29, S1, June, pp. S5-S24.
Pudney, S. (1989), Modelling Individual Choice. The Econometrics of Corners, Kinks, and Holes,
Oxford, Blackwell.
Ravallion, M. (1988), “Expected Poverty under Risk-induced Welfare Variability”, Economic
Journal, Vol. 98, No. 393, pp. 1171-1182.
Scaramozzino, P. (2005), Risk Management: Principles and Applications, DeFiMS, SOAS,
University of London.
Sen, A. (1988), “The Concept of Development”, Handbook of Development Economics Vol. 1, Ed.
H. Chenery and T.N. Srinivasan. Amsterdam: North Holland.
World Bank (2005), Afghanistan. Poverty, Vulnerability and Social Protection: An Initial
Assessment, Human Development Unit, South Asia Region, Report No. 29694-AF,
Washington DC.
23
ESA Working Papers
WORKING PAPERS The ESA Working Papers are produced by the Agricultural and Development Economics Division (ESA) of the Economic and Social Department of the United Nations Food and Agriculture Organization (FAO). The series presents ESA’s ongoing research. Working papers are circulated to stimulate discussion and comments. They are made available to the public through the Division’s website. The analysis and conclusions are those of the authors and do not indicate concurrence by FAO. ESA The Agricultural and Development Economics Division (ESA) is FAO’s focal point for economic research and policy analysis on issues relating to world food security and sustainable development. ESA contributes to the generation of knowledge and evolution of scientific thought on hunger and poverty alleviation through its economic studies publications which include this working paper series as well as periodic and occasional publications.
Agricultural and Development Economics Division (ESA)
The Food and Agriculture Organization Viale delle Terme di Caracalla
00100 Rome Italy
Contact: Office of the Director
Telephone: +39 06 57054358 Facsimile: + 39 06 57055522 Website: www.fao.org/es/esa
e-mail: [email protected]
24