mechanical discontinuities monitoring at merapi volcano using...
TRANSCRIPT
www.elsevier.com/locate/jvolgeores
Journal of Volcanology and Geotherm
Mechanical discontinuities monitoring at Merapi volcano using
kinematic GPS
F. Beauducel a,c,*, M. Agung Nandaka b, F.H. Cornet c, M. Diament c
a Observatoire Volcanologique et Sismologique de Guadeloupe – IPGP, Le Houelmont, 97113 Gourbeyre, Guadeloupe FWIb Merapi Volcano Observatory – BPPTK, Yogyakarta, Indonesia
c Institut de Physique du Globe de Paris, France
Received 24 May 2004; received in revised form 26 January 2005; accepted 16 May 2005
Available online 18 January 2006
Abstract
Merapi volcano (Java, Indonesia) is in almost continuous activity with growth of an andesitic lava dome. This dome
frequently collapses to form potentially deadly glowing avalanches, explosions and nuees ardentes. To monitor the evolution of
surface displacements and to model the associated magmatic sources, we established a Global Positioning System (GPS)
network in 1993 and have measured it each year using the static GPS method. However, the limited number of benchmarks and
the geometry of the network did not allow us to precisely locate major mechanical discontinuities within the edifice. Precisely
locating these discontinuities is of central importance because they delimit areas of potential instability and provide means to
evaluate potential volumes of falling material.
The kinematic GPS method offers a way to partially solve the problem of temporal and spatial sampling of the displacement
field, but its accuracy is usually insufficient to monitor small displacements. We propose here a strategy of field measurements
and adjustments which combines kinematic positioning (1 min) and rapid static baselines (15 min) to get a 1.5-cm error (95%
confidence). At Merapi summit, we have installed about 50 benchmarks covering the area around the main crater. Field
measurements of this new network with our method take a few hours and the data processing has been automated.
We present the results of 8 surveys from 1999 to 2002, a period that includes a dome collapse in January 2001. Our results
show large horizontal displacements towards the northwest, starting in July 2000 and reaching about 50 cm in amplitude in
November 2000 that we interpret as precursors to the dome collapse. We also locate two presently active discontinuities at the
summit of the volcano. This approach can be implemented easily on other active volcanoes.
D 2005 Elsevier B.V. All rights reserved.
Keywords: GPS; kinematic; lava dome; Merapi
0377-0273/$ - see front matter D 2005 Elsevier B.V. All rights reserved.
doi:10.1016/j.jvolgeores.2005.07.005
* Corresponding author. Observatoire Volcanologique et Sismolo-
gique de Guadeloupe – IPGP, Le Houelmont, 97113 Gourbeyre,
Guadeloupe FWI. Tel.: +33 590 590 99 11 38; fax: +33 590 590 99
11 34.
E-mail address: [email protected] (F. Beauducel).
1. Introduction
Forecasting eruptions and rock-slope instabilities
on volcanoes requires evaluation of the location,
al Research 150 (2006) 300–312
F. Beauducel et al. / Journal of Volcanology and Geothermal Research 150 (2006) 300–312 301
extent, direction, magnitude and type (magmatic or
phreatic) of deformation sources. This information is
obtained by combining direct observations with an
interpretative numerical model. The interpretive
model needs boundary conditions (e.g., internal sub-
structure geometries) and source parameters (pressure
and stress field), which can be partially retrieved from
an analysis of the deformation field.
The use of classic techniques of geodesy (e.g.,
GPS, tiltmeters, extensometers, distancemeters) leads
to sparse data acquisition in time and space because of
the limited number of sensors. Moreover imaging
methods such as photogrammetry focus often on too
small an area and are dependent on meteorological
conditions. Satellite based remote-sensing techniques
such as InSAR are not very well adapted for monitor-
ing small areas such as lava domes. Furthermore, they
are often difficult to use for monitoring purposes
(availability of data, repeat time, loss of coherence).
Deformation monitoring of small active areas, like
lava domes, requires efficient techniques with suffi-
cient spatial density and precision, and possibly 3-D
positioning. The kinematic Global Positioning System
(GPS) method (Genrich and Bock, 1992) can partially
solve the problem of temporal and spatial sampling of
the displacement field (Genrich et al., 1997; Bock et
al., 2000; Baldi et al., 2000), but usually with insuffi-
cient precision to monitor small displacements.
Because GPS has evident advantages for volcano
monitoring applications, several data processing
methods have been proposed to improve kinematic
GPS resolution (Larson et al., 2001; Irwan et al.,
2003). We present here a simple field protocol for
measurement and adjustment that combines kinematic
(1-min measurement sessions) and rapid static base-
lines (15-min measurement sessions). This method
allows fast and simple surveys in areas that are not
easily accessible, while producing results that are
sufficiently accurate for efficient monitoring of volca-
nic edifices.
2. Merapi volcano
2.1. General background
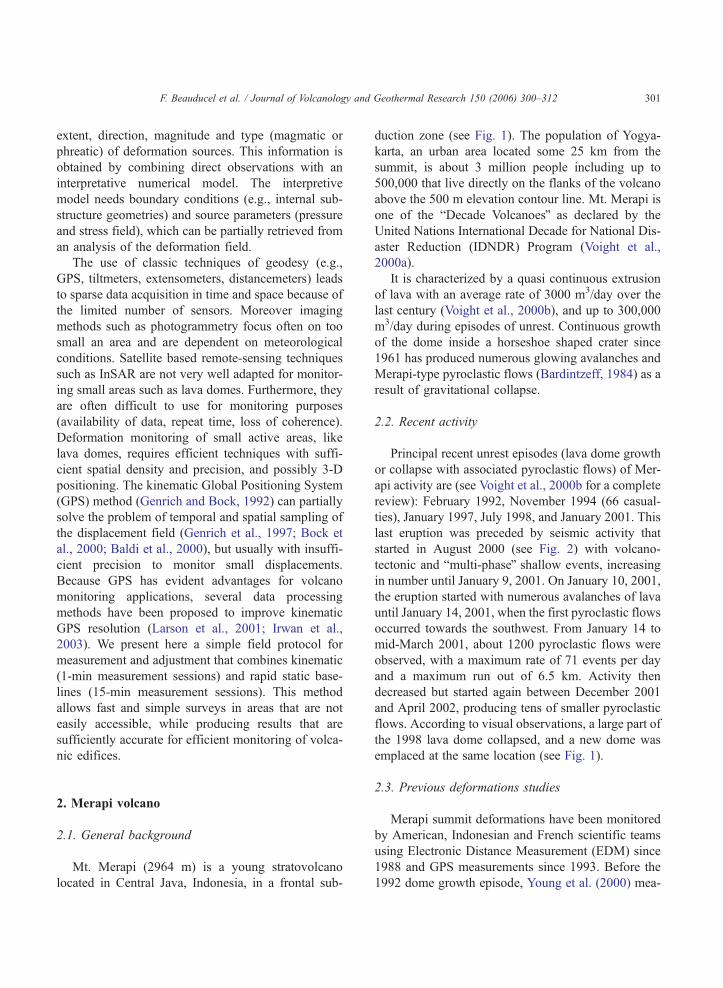
Mt. Merapi (2964 m) is a young stratovolcano
located in Central Java, Indonesia, in a frontal sub-
duction zone (see Fig. 1). The population of Yogya-
karta, an urban area located some 25 km from the
summit, is about 3 million people including up to
500,000 that live directly on the flanks of the volcano
above the 500 m elevation contour line. Mt. Merapi is
one of the bDecade VolcanoesQ as declared by the
United Nations International Decade for National Dis-
aster Reduction (IDNDR) Program (Voight et al.,
2000a).
It is characterized by a quasi continuous extrusion
of lava with an average rate of 3000 m3/day over the
last century (Voight et al., 2000b), and up to 300,000
m3/day during episodes of unrest. Continuous growth
of the dome inside a horseshoe shaped crater since
1961 has produced numerous glowing avalanches and
Merapi-type pyroclastic flows (Bardintzeff, 1984) as a
result of gravitational collapse.
2.2. Recent activity
Principal recent unrest episodes (lava dome growth
or collapse with associated pyroclastic flows) of Mer-
api activity are (see Voight et al., 2000b for a complete
review): February 1992, November 1994 (66 casual-
ties), January 1997, July 1998, and January 2001. This
last eruption was preceded by seismic activity that
started in August 2000 (see Fig. 2) with volcano-
tectonic and bmulti-phaseQ shallow events, increasing
in number until January 9, 2001. On January 10, 2001,
the eruption started with numerous avalanches of lava
until January 14, 2001, when the first pyroclastic flows
occurred towards the southwest. From January 14 to
mid-March 2001, about 1200 pyroclastic flows were
observed, with a maximum rate of 71 events per day
and a maximum run out of 6.5 km. Activity then
decreased but started again between December 2001
and April 2002, producing tens of smaller pyroclastic
flows. According to visual observations, a large part of
the 1998 lava dome collapsed, and a new dome was
emplaced at the same location (see Fig. 1).
2.3. Previous deformations studies
Merapi summit deformations have been monitored
by American, Indonesian and French scientific teams
using Electronic Distance Measurement (EDM) since
1988 and GPS measurements since 1993. Before the
1992 dome growth episode, Young et al. (2000) mea-
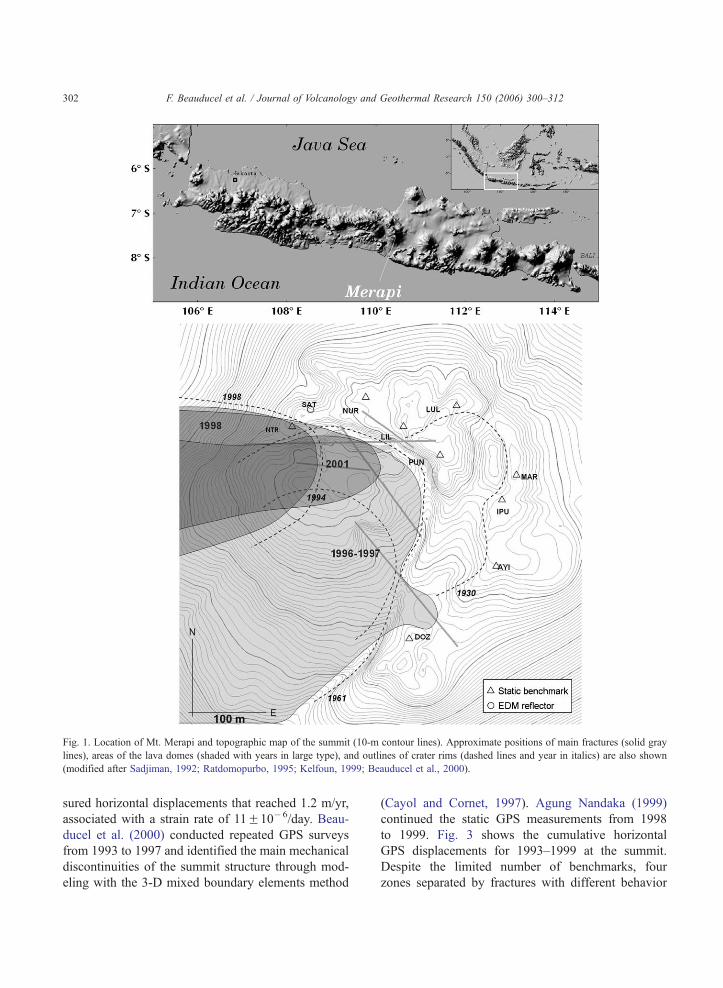
Fig. 1. Location of Mt. Merapi and topographic map of the summit (10-m contour lines). Approximate positions of main fractures (solid gray
lines), areas of the lava domes (shaded with years in large type), and outlines of crater rims (dashed lines and year in italics) are also shown
(modified after Sadjiman, 1992; Ratdomopurbo, 1995; Kelfoun, 1999; Beauducel et al., 2000).
F. Beauducel et al. / Journal of Volcanology and Geothermal Research 150 (2006) 300–312302
sured horizontal displacements that reached 1.2 m/yr,
associated with a strain rate of 11F10�6/day. Beau-
ducel et al. (2000) conducted repeated GPS surveys
from 1993 to 1997 and identified the main mechanical
discontinuities of the summit structure through mod-
eling with the 3-D mixed boundary elements method
(Cayol and Cornet, 1997). Agung Nandaka (1999)
continued the static GPS measurements from 1998
to 1999. Fig. 3 shows the cumulative horizontal
GPS displacements for 1993–1999 at the summit.
Despite the limited number of benchmarks, four
zones separated by fractures with different behavior
Fig. 2. Number of seismic events per day recorded between 1999 and 2002: VTA=volcano-tectonic N2 km deep, VTB=volcano-tectonic b1.5
km deep, LF=low frequency, MP=multi-phase (associated with magma production), NA=pyroclastic flows, GG=rock avalanches (source
MVO). Dates for GPS surveys are also shown as dashed vertical lines.
F. Beauducel et al. / Journal of Volcanology and Geothermal Research 150 (2006) 300–312 303
are clearly evidenced. These fractures have been
mapped in the field and introduced into the 3-D
numerical modeling. The northwestern displacement
at site NTR of about 55 cm was interpreted as a rock-
slope instability potential, just before this zone col-
lapsed in July 1998 (Beauducel et al., 2000).
Routine monitoring of deformation is achieved by
EDMmeasurements between the Babadan observation
post located some 4.5 km WNW from the summit and
four reflectors installed on the western part of the
summit. This provides frequent distance measure-
ments on the most active part of the summit area.
However, analysis of the deformation field is strongly
limited by the small number of monitored points.
Static GPS measurements at these 10 benchmarks
take about 2 days with 2 receivers and 2-h occupations,
and lead to position precisions of few mm (Beauducel
et al., 2000). Because of the large displacements
usually observed at the summit area before and during
unrest episodes, we decided to increase the number of
monitored points and to use a kinematic processing
technique in order to decrease the survey duration, at
the cost of a lower precision on the positioning.
3. Data acquisition and processing
3.1. Network setup
Considering the limited extent of the area of inter-
est (a few hundreds of meters wide), we decided to set
up a new network around the existing one. About 50
benchmarks were installed on the crater rim (Fig. 3),
covering the whole accessible area with an average
spacing of about 25 m. Some of the benchmarks are
clustered around visible fractures (see Fig. 4a). Bench-
marks consist of geodetic nails (10-cm long, 8-mm
diameter, hollow head) fixed into massive lava blocks.
Only the northern and eastern zones around the crater
rim can be monitored, due to the steep topography
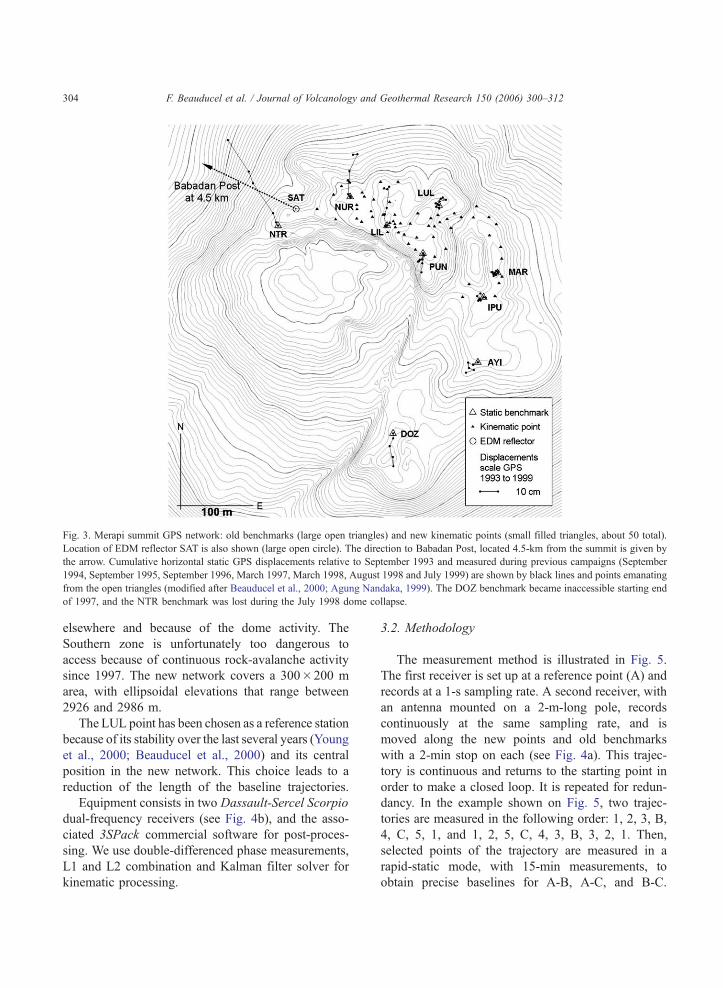
Fig. 3. Merapi summit GPS network: old benchmarks (large open triangles) and new kinematic points (small filled triangles, about 50 total).
Location of EDM reflector SAT is also shown (large open circle). The direction to Babadan Post, located 4.5-km from the summit is given by
the arrow. Cumulative horizontal static GPS displacements relative to September 1993 and measured during previous campaigns (September
1994, September 1995, September 1996, March 1997, March 1998, August 1998 and July 1999) are shown by black lines and points emanating
from the open triangles (modified after Beauducel et al., 2000; Agung Nandaka, 1999). The DOZ benchmark became inaccessible starting end
of 1997, and the NTR benchmark was lost during the July 1998 dome collapse.
F. Beauducel et al. / Journal of Volcanology and Geothermal Research 150 (2006) 300–312304
elsewhere and because of the dome activity. The
Southern zone is unfortunately too dangerous to
access because of continuous rock-avalanche activity
since 1997. The new network covers a 300�200 m
area, with ellipsoidal elevations that range between
2926 and 2986 m.
The LUL point has been chosen as a reference station
because of its stability over the last several years (Young
et al., 2000; Beauducel et al., 2000) and its central
position in the new network. This choice leads to a
reduction of the length of the baseline trajectories.
Equipment consists in two Dassault-Sercel Scorpio
dual-frequency receivers (see Fig. 4b), and the asso-
ciated 3SPack commercial software for post-proces-
sing. We use double-differenced phase measurements,
L1 and L2 combination and Kalman filter solver for
kinematic processing.
3.2. Methodology
The measurement method is illustrated in Fig. 5.
The first receiver is set up at a reference point (A) and
records at a 1-s sampling rate. A second receiver, with
an antenna mounted on a 2-m-long pole, records
continuously at the same sampling rate, and is
moved along the new points and old benchmarks
with a 2-min stop on each (see Fig. 4a). This trajec-
tory is continuous and returns to the starting point in
order to make a closed loop. It is repeated for redun-
dancy. In the example shown on Fig. 5, two trajec-
tories are measured in the following order: 1, 2, 3, B,
4, C, 5, 1, and 1, 2, 5, C, 4, 3, B, 3, 2, 1. Then,
selected points of the trajectory are measured in a
rapid-static mode, with 15-min measurements, to
obtain precise baselines for A-B, A-C, and B-C.
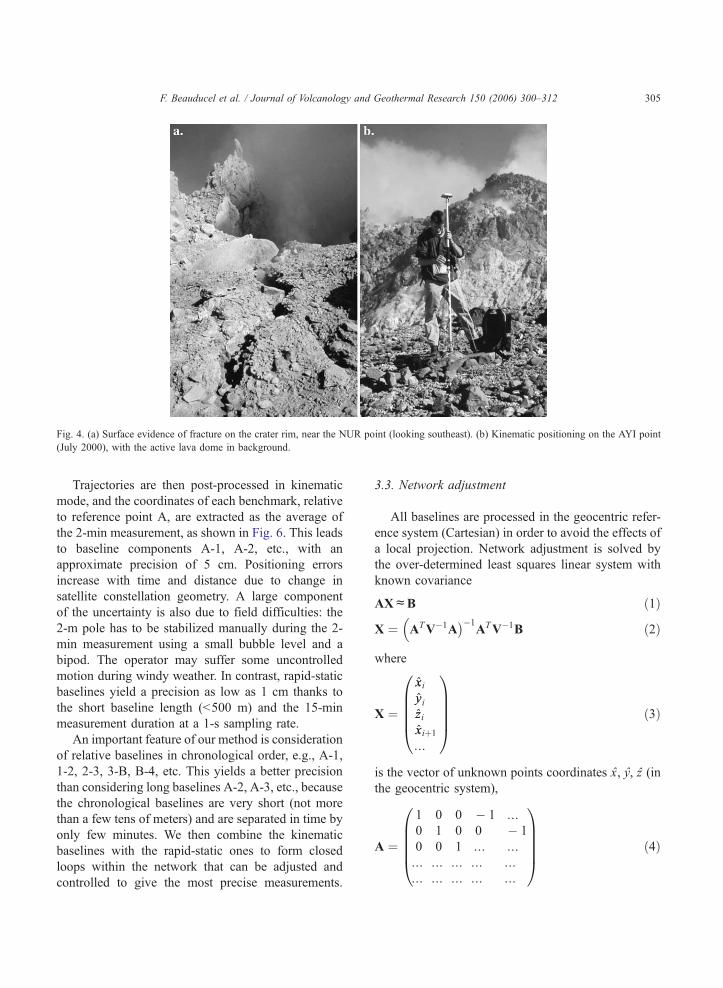
Fig. 4. (a) Surface evidence of fracture on the crater rim, near the NUR point (looking southeast). (b) Kinematic positioning on the AYI point
(July 2000), with the active lava dome in background.
F. Beauducel et al. / Journal of Volcanology and Geothermal Research 150 (2006) 300–312 305
Trajectories are then post-processed in kinematic
mode, and the coordinates of each benchmark, relative
to reference point A, are extracted as the average of
the 2-min measurement, as shown in Fig. 6. This leads
to baseline components A-1, A-2, etc., with an
approximate precision of 5 cm. Positioning errors
increase with time and distance due to change in
satellite constellation geometry. A large component
of the uncertainty is also due to field difficulties: the
2-m pole has to be stabilized manually during the 2-
min measurement using a small bubble level and a
bipod. The operator may suffer some uncontrolled
motion during windy weather. In contrast, rapid-static
baselines yield a precision as low as 1 cm thanks to
the short baseline length (b500 m) and the 15-min
measurement duration at a 1-s sampling rate.
An important feature of our method is consideration
of relative baselines in chronological order, e.g., A-1,
1-2, 2-3, 3-B, B-4, etc. This yields a better precision
than considering long baselines A-2, A-3, etc., because
the chronological baselines are very short (not more
than a few tens of meters) and are separated in time by
only few minutes. We then combine the kinematic
baselines with the rapid-static ones to form closed
loops within the network that can be adjusted and
controlled to give the most precise measurements.
3.3. Network adjustment
All baselines are processed in the geocentric refer-
ence system (Cartesian) in order to avoid the effects of
a local projection. Network adjustment is solved by
the over-determined least squares linear system with
known covariance
AXcB ð1Þ
X ¼ ATV�1A��1
ATV�1B�
ð2Þ
where
X ¼
xxiyyizzixxiþ1
N
1CCCCA
0BBBB@
ð3Þ
is the vector of unknown points coordinates x, y, z (in
the geocentric system),
A ¼
1 0 0 � 1 N0 1 0 0 � 1
0 0 1 N NN N N N NN N N N N
0BBBB@
1CCCCA
ð4Þ
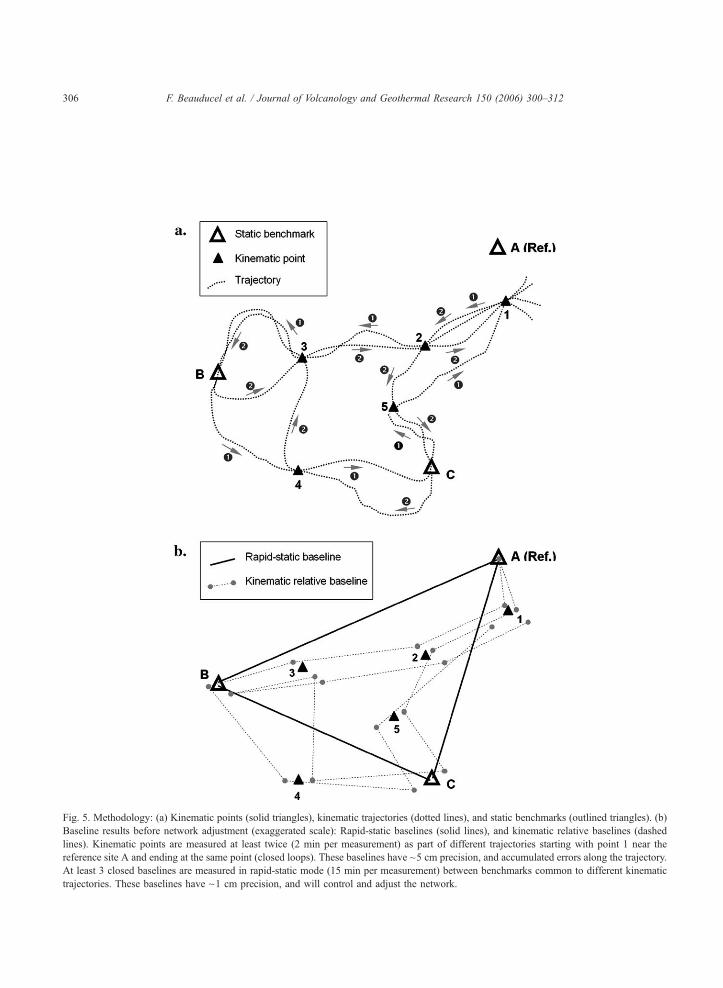
Fig. 5. Methodology: (a) Kinematic points (solid triangles), kinematic trajectories (dotted lines), and static benchmarks (outlined triangles). (b)
Baseline results before network adjustment (exaggerated scale): Rapid-static baselines (solid lines), and kinematic relative baselines (dashed
lines). Kinematic points are measured at least twice (2 min per measurement) as part of different trajectories starting with point 1 near the
reference site A and ending at the same point (closed loops). These baselines have ~5 cm precision, and accumulated errors along the trajectory.
At least 3 closed baselines are measured in rapid-static mode (15 min per measurement) between benchmarks common to different kinematic
trajectories. These baselines have ~1 cm precision, and will control and adjust the network.
F. Beauducel et al. / Journal of Volcanology and Geothermal Research 150 (2006) 300–312306
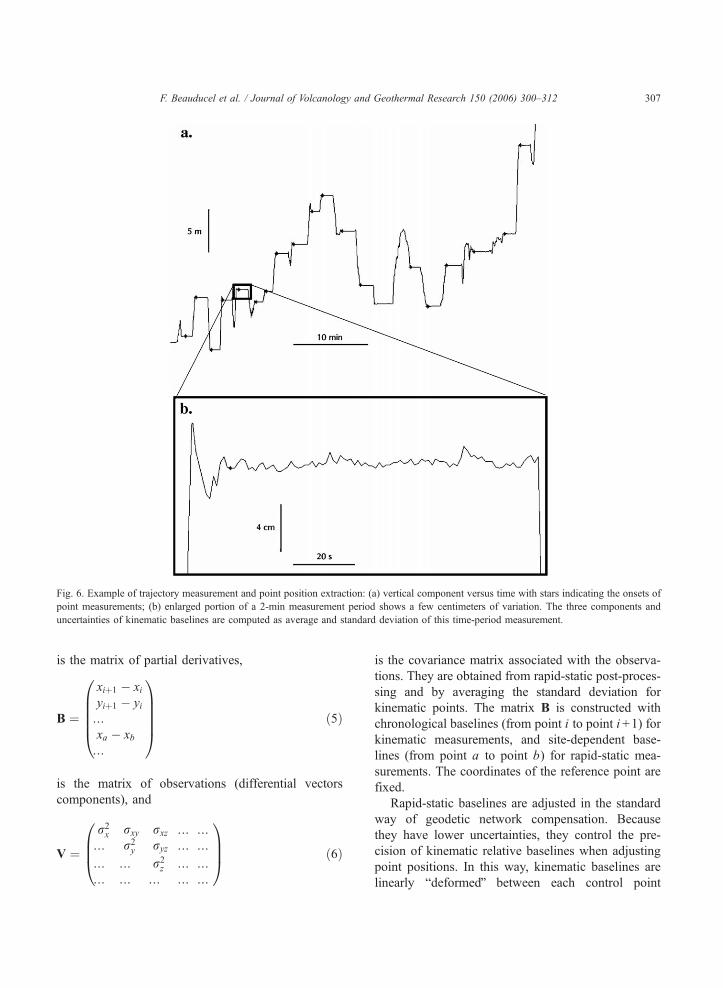
Fig. 6. Example of trajectory measurement and point position extraction: (a) vertical component versus time with stars indicating the onsets of
point measurements; (b) enlarged portion of a 2-min measurement period shows a few centimeters of variation. The three components and
uncertainties of kinematic baselines are computed as average and standard deviation of this time-period measurement.
F. Beauducel et al. / Journal of Volcanology and Geothermal Research 150 (2006) 300–312 307
is the matrix of partial derivatives,
B ¼
xiþ1 � xiyiþ1 � yiNxa � xbN
1CCCCA
0BBBB@
ð5Þ
is the matrix of observations (differential vectors
components), and
V ¼
r2x rxy rxz N N
N r2y ryz N N
N N r2z N N
N N N N N
1CCA
0BB@ ð6Þ
is the covariance matrix associated with the observa-
tions. They are obtained from rapid-static post-proces-
sing and by averaging the standard deviation for
kinematic points. The matrix B is constructed with
chronological baselines (from point i to point i +1) for
kinematic measurements, and site-dependent base-
lines (from point a to point b) for rapid-static mea-
surements. The coordinates of the reference point are
fixed.
Rapid-static baselines are adjusted in the standard
way of geodetic network compensation. Because
they have lower uncertainties, they control the pre-
cision of kinematic relative baselines when adjusting
point positions. In this way, kinematic baselines are
linearly bdeformedQ between each control point
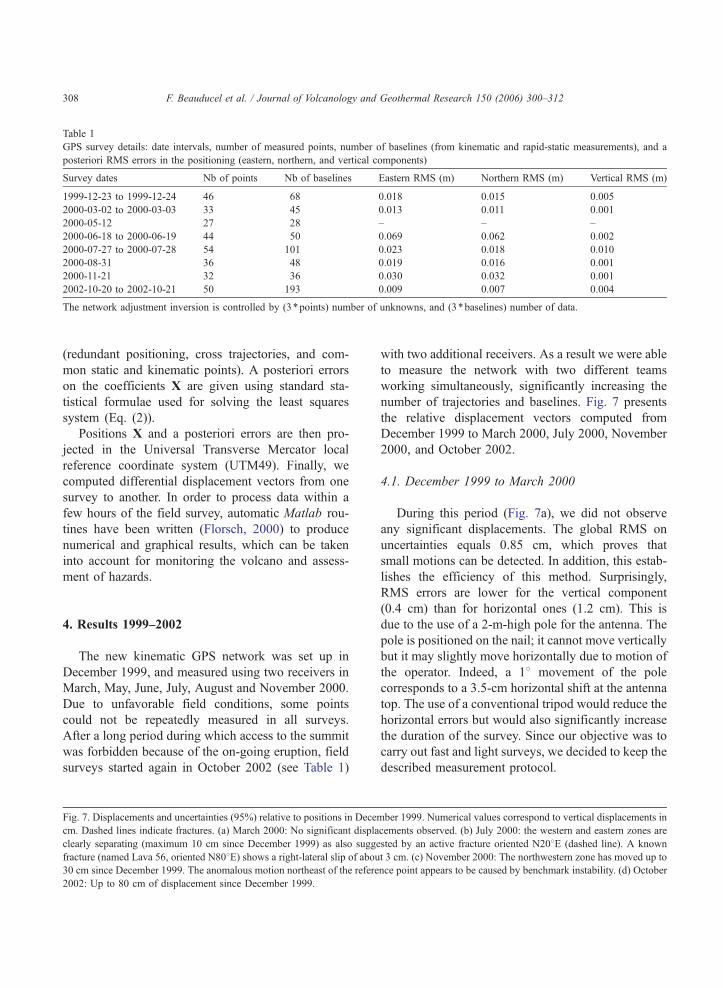
Table 1
GPS survey details: date intervals, number of measured points, number of baselines (from kinematic and rapid-static measurements), and a
posteriori RMS errors in the positioning (eastern, northern, and vertical components)
Survey dates Nb of points Nb of baselines Eastern RMS (m) Northern RMS (m) Vertical RMS (m)
1999-12-23 to 1999-12-24 46 68 0.018 0.015 0.005
2000-03-02 to 2000-03-03 33 45 0.013 0.011 0.001
2000-05-12 27 28 – – –
2000-06-18 to 2000-06-19 44 50 0.069 0.062 0.002
2000-07-27 to 2000-07-28 54 101 0.023 0.018 0.010
2000-08-31 36 48 0.019 0.016 0.001
2000-11-21 32 36 0.030 0.032 0.001
2002-10-20 to 2002-10-21 50 193 0.009 0.007 0.004
The network adjustment inversion is controlled by (3*points) number of unknowns, and (3*baselines) number of data.
F. Beauducel et al. / Journal of Volcanology and Geothermal Research 150 (2006) 300–312308
(redundant positioning, cross trajectories, and com-
mon static and kinematic points). A posteriori errors
on the coefficients X are given using standard sta-
tistical formulae used for solving the least squares
system (Eq. (2)).
Positions X and a posteriori errors are then pro-
jected in the Universal Transverse Mercator local
reference coordinate system (UTM49). Finally, we
computed differential displacement vectors from one
survey to another. In order to process data within a
few hours of the field survey, automatic Matlab rou-
tines have been written (Florsch, 2000) to produce
numerical and graphical results, which can be taken
into account for monitoring the volcano and assess-
ment of hazards.
4. Results 1999–2002
The new kinematic GPS network was set up in
December 1999, and measured using two receivers in
March, May, June, July, August and November 2000.
Due to unfavorable field conditions, some points
could not be repeatedly measured in all surveys.
After a long period during which access to the summit
was forbidden because of the on-going eruption, field
surveys started again in October 2002 (see Table 1)
Fig. 7. Displacements and uncertainties (95%) relative to positions in Dece
cm. Dashed lines indicate fractures. (a) March 2000: No significant displa
clearly separating (maximum 10 cm since December 1999) as also sugge
fracture (named Lava 56, oriented N808E) shows a right-lateral slip of abou30 cm since December 1999. The anomalous motion northeast of the refere
2002: Up to 80 cm of displacement since December 1999.
with two additional receivers. As a result we were able
to measure the network with two different teams
working simultaneously, significantly increasing the
number of trajectories and baselines. Fig. 7 presents
the relative displacement vectors computed from
December 1999 to March 2000, July 2000, November
2000, and October 2002.
4.1. December 1999 to March 2000
During this period (Fig. 7a), we did not observe
any significant displacements. The global RMS on
uncertainties equals 0.85 cm, which proves that
small motions can be detected. In addition, this estab-
lishes the efficiency of this method. Surprisingly,
RMS errors are lower for the vertical component
(0.4 cm) than for horizontal ones (1.2 cm). This is
due to the use of a 2-m-high pole for the antenna. The
pole is positioned on the nail; it cannot move vertically
but it may slightly move horizontally due to motion of
the operator. Indeed, a 18 movement of the pole
corresponds to a 3.5-cm horizontal shift at the antenna
top. The use of a conventional tripod would reduce the
horizontal errors but would also significantly increase
the duration of the survey. Since our objective was to
carry out fast and light surveys, we decided to keep the
described measurement protocol.
mber 1999. Numerical values correspond to vertical displacements in
cements observed. (b) July 2000: the western and eastern zones are
sted by an active fracture oriented N208E (dashed line). A known
t 3 cm. (c) November 2000: The northwestern zone has moved up to
nce point appears to be caused by benchmark instability. (d) October

F. Beauducel et al. / Journal of Volcanology and Geothermal Research 150 (2006) 300–312 309
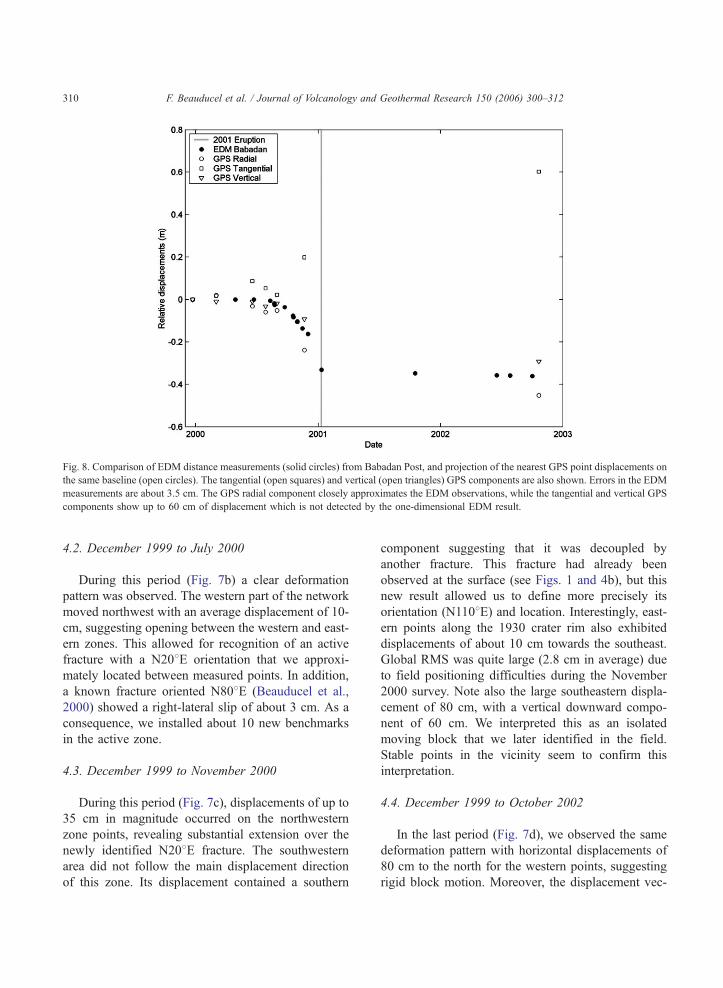
Fig. 8. Comparison of EDM distance measurements (solid circles) from Babadan Post, and projection of the nearest GPS point displacements on
the same baseline (open circles). The tangential (open squares) and vertical (open triangles) GPS components are also shown. Errors in the EDM
measurements are about 3.5 cm. The GPS radial component closely approximates the EDM observations, while the tangential and vertical GPS
components show up to 60 cm of displacement which is not detected by the one-dimensional EDM result.
F. Beauducel et al. / Journal of Volcanology and Geothermal Research 150 (2006) 300–312310
4.2. December 1999 to July 2000
During this period (Fig. 7b) a clear deformation
pattern was observed. The western part of the network
moved northwest with an average displacement of 10-
cm, suggesting opening between the western and east-
ern zones. This allowed for recognition of an active
fracture with a N208E orientation that we approxi-
mately located between measured points. In addition,
a known fracture oriented N808E (Beauducel et al.,
2000) showed a right-lateral slip of about 3 cm. As a
consequence, we installed about 10 new benchmarks
in the active zone.
4.3. December 1999 to November 2000
During this period (Fig. 7c), displacements of up to
35 cm in magnitude occurred on the northwestern
zone points, revealing substantial extension over the
newly identified N208E fracture. The southwestern
area did not follow the main displacement direction
of this zone. Its displacement contained a southern
component suggesting that it was decoupled by
another fracture. This fracture had already been
observed at the surface (see Figs. 1 and 4b), but this
new result allowed us to define more precisely its
orientation (N1108E) and location. Interestingly, east-
ern points along the 1930 crater rim also exhibited
displacements of about 10 cm towards the southeast.
Global RMS was quite large (2.8 cm in average) due
to field positioning difficulties during the November
2000 survey. Note also the large southeastern displa-
cement of 80 cm, with a vertical downward compo-
nent of 60 cm. We interpreted this as an isolated
moving block that we later identified in the field.
Stable points in the vicinity seem to confirm this
interpretation.
4.4. December 1999 to October 2002
In the last period (Fig. 7d), we observed the same
deformation pattern with horizontal displacements of
80 cm to the north for the western points, suggesting
rigid block motion. Moreover, the displacement vec-
F. Beauducel et al. / Journal of Volcanology and Geothermal Research 150 (2006) 300–312 311
tors for the southwestern points also clearly differ
from those of the northern block, confirming that
the previously identified fracture oriented N1108Ewas located somewhere north of the southwestern
points. In addition, the eastern part of the summit
showed displacements of about 10 cm which suggest
the existence of a discontinuity to the north of K. Mati
crater. Development of this amount of displacement
over a long time period of 2 years may indicate that
some displacements occurred prior to the January
2001 dome collapse.
5. Discussion
The lack of data during the last time interval
prevents an assessment of whether the observed
displacements are due to pre-eruptive effects, post-
eruptive effects, or to both. To answer this question,
we compared our measurements with EDM obser-
vations obtained from the Babadan Post (located on
the northwest flank) during the same time interval.
One of the reflectors (SAT) is located about 20 m
to the west of the western-most kinematic GPS
point (see Fig. 3). Fig. 8 shows relative distance
measurements at this point, as compared to pro-
jected GPS displacements on the Babadan-summit
baseline. EDM variations and radial GPS compo-
nents (circles) are consistent within uncertainties
(3.5 cm for EDM data), and the approximately 10
cm difference between both values may be
explained by the different locations of the points.
Because GPS vectors are 3-D, we also reported
variations in tangential and vertical components
through time, e.g., the two components that are
not detected by EDM. This suggests that distance
measurements from Babadan cannot detect cumula-
tive horizontal displacements to the North as large
as 60 cm, i.e., the main component of the displace-
ment field.
On the other hand, EDM measurements carried out
during the 2001–2002 (while summit access was for-
bidden for GPS surveys) indicated about 20 cm of
displacement between November 2000 and January
2001, and then remained stable until October 2002.
This suggests that at least a component of the GPS
displacements measured in October 2002 was due to
precursory deformation.
6. Conclusion
Rock-slope monitoring in exposed areas like the
Merapi summit requires a dense geodetic network
and brief measurement campaign. The methodology
we propose here reduces the time spent in the field
while increasing the number of points that are mon-
itored with acceptable errors on positioning. Uncer-
tainties after joint adjustment (kinematic and rapid-
static) are less than 1.5 cm for the entire network
(about 50 points) for all 3 components. The method
requires at least 2 trajectories and 3 rapid-static base-
lines (equivalent to a 1-day campaign) in order to be
effective.
During the period of our investigation, significant
displacements were observed starting in July 2000
which continued and accelerated through November
2000. This deformation anticipated the January 2001
dome collapse and may be associated with magma
production. Kinematic GPS surveys of the high
density network also revealed a major new disconti-
nuity within the edifice and helped to refine the
location of known fractures. Moreover, it revealed
deformation in the area of a future dome collapse.
This method may be easily implemented on other
volcanoes that cannot be easily monitored, or in
places where the amount of available equipment is
limited.
Acknowledgments
The authors thank M. Poland, E. Calais, Ph. Jous-
set, W. Crawford, J.-C. Komorowski, and an anon-
ymous reviewer for useful comments on the
manuscript. This work was supported by the Delega-
tion aux Risques Majeurs (French Ministry of Envir-
onment) and the Volcanological Survey of Indonesia
in the framework of the French–Indonesian coopera-
tion in volcanology. GPS receivers were provided to
the MVO staff trough this cooperation. We are very
grateful to A. Ratdomopurbo for its continuous sup-
port, and to MVO staff, French volunteers and K.
Kelfoun for their participation in field campaigns.
Special thanks to G. Florsh for developing the first
Matlab graphic user interface, and J. Ammann for his
help in GPS hardware tests and software develop-
ments. IPGP contribution 2029.
F. Beauducel et al. / Journal of Volcanology and Geothermal Research 150 (2006) 300–312312
References
Agung Nandaka, M., 1999. Etude des deformations d’un volcan
actif a dome. Application au Merapi. DEA report, Institut de
Physique du Globe de Paris, 52 pp.
Baldi, P., Bonvalot, S., Briole, P., Marsella, M., 2000. Digital
photogrammetry and kinematic GPS applied to the monitoring
of Vulcano Island, Aeolian Arc, Italy. Geophys. J. Int. 142,
801–811.
Bardintzeff, J., 1984. Merapi volcano (Java, Indonesia) and Merapi-
type nuee ardente. Bull. Volcanol. 47, 433–446.
Beauducel, F., Cornet, F., Suhanto, E., Duquesnoy, T., Kasser, M.,
2000. Constraints on magma flux from displacements data at
Merapi volcano, Java. J. Geophys. Res. 105, 8193–8204.
Bock, Y., Nikolaidis, R., de Jonge, P., Bevis, M., 2000. Instanta-
neous geodetic positioning at medium distances with the Global
Positioning System. J. Geophys. Res. 105, 28223–28254.
Cayol, V., Cornet, F., 1997. 3D mixed boundary elements for
elastostatic deformation field analysis. Int. J. Rock Mech.
Min. Sci. 34, 275–287.
Florsch, G., 2000. Apport du GPS cinematique a l’etude du champ
de deformations au volcan Merapi. Internal Report, Ecole Natio-
nale Superieure des Arts et Industrie de Strasbourg, Strasbourg.
Genrich, J., Bock, Y., 1992. Rapid resolution of crustal motion at
short ranges with the Global Positioning System. J. Geophys.
Res. 97, 3261–3269.
Genrich, J., Bock, Y., Mason, R., 1997. Crustal deformation across
the Imperial Fault: results from kinematic GPS surveys and
trilateration of a densely-spaced, small aperture network.
J. Geophys. Res. 102, 4985–5004.
Irwan, M., Fumiaki, K., Naoyuki, F., Shigeo, N., Hidehumi, W.,
Shinichi, S., Motoo, U., Eisuki, F., Koji, K., 2003. Rapid ground
deformation of the Miyakejima volcano on 26–27 June 2000
detected by kinematic GPS analysis. Earth Planets Space 55,
13–16.
Kelfoun, K., 1999. Processus de croissance et de destabilisation des
domes de lave du volcan Merapi (Java Centrale, Indonesie).
Doctorate Thesis, Univ. Blaise Pascal Clermont-Ferrand II,
France, 261 pp.
Larson, K., Cervelli, P., Lisowski, M., Miklius, A., Segall, P.,
Owen, S., 2001. Volcano monitoring using the Global Posi-
tioning System: filtering strategies. J. Geophys. Res. 106,
19453–19464.
Ratdomopurbo, A., 1995. Etude sismologique du volcan Merapi et
formation du dome de 1994. Doctorate Thesis, Univ. Joseph
Fourier Grenoble I, Grenoble, France, 208 pp.
Sadjiman 1992. Pola perkembangan rekahan di puncak Gunung
Merapi 1992, perubahan morfologi kubah lava dan lokasi reflek-
tor. Internal Report, Merapi Volcano Observatory, Yogyakarta,
Indonesia.
Voight, B., Sukhyar, R., Wirakusumah, A., 2000a. Introduction to
the special issue on Merapi volcano. J. Volcanol. Geotherm.
Res. 100, 1–8.
Voight, B., Constantine, E., Siswowidjoyo, S., Torley, R., 2000b.
Historical eruptions of Merapi volcano, Java, Indonesia. J.
Volcanol. Geotherm. Res. 100, 69–138.
Young, K., Voight, B., Subandriyo, Sajiman, Miswanto, Casadevall,
T., 2000. Ground deformation at Merapi volcano, Java, Indone-
sia: distance changes, June 1988–October 1995. J. Volcanol.
Geotherm. Res. 100, 233–259.