medical cost trend: behind the numbers 2018 - pwc · 2 medical cost trend: behind the numbers 2018...
TRANSCRIPT

Medical cost trend:Behind the numbers 2018
June 2017
Table of contents
The heart of the matter 2
Medical cost trend in 2018 4
Putting trend in perspective 6Growth in employer medical costs settles into a “new normal” 6Future reductions in cost trend will require more focus on price 7Not all components of healthcare spending have the same impact 8 on employer benefit costs
Factors affecting 2018 medical cost trend 9Medical cost trend’s usual suspects 9Inflator #1: Rising general inflation impacts healthcare 10Inflator #2: Movement to high-deductible health plans loses steam 12Inflator #3: Fewer branded drugs come off patent 13Deflator #1: Political and public scrutiny puts pressure on drug prices 15Deflator #2: Employers target right people with right treatments to minimize waste 17How could Trump administration policy impact employers and 19their healthcare spending?
What this means for your business 21
Acknowledgments 29
About this research and HRI 30
2 Medical cost trend: Behind the numbers 2018
The heart of the matterThe era of volatile swings and double-digit growth in employer medical costs appears to be ending. With medical cost trend hovering in the single digits for several years, the industry has been waiting for the inflection point when spending will take off. But that spike appears unlikely to happen. The New Health Economy is settling into a “new normal,” typically characterized by more attenuated fluctuations and a single-digit trend.
For four years, medical cost trend has hung between 6 and 7 percent, seeming to settle into a “new normal.” PwC’s Health Research Institute (HRI) anticipates a 6.5 percent growth rate for calendar year 2018, half a percentage point higher than in 2017. After likely changes in benefit plan design, such as changes to co-pays and network size, the net growth rate is expected to be 1 percentage point lower, at 5.5 percent.
HRI’s analysis measures anticipated spending growth in the employer-based market, which covers about half of all Americans.¹ Changes to government health insurance, including Medicare, Medicaid and plans sold on the public exchanges created by the Affordable Care Act (ACA), are not within this analysis’ purview.
HRI’s research found that three factors will put upward pressure on medical cost trend in 2018.
• Rising general inflation impacts healthcare. An upswing in the US economy, now in its third-longest expansion in American history, is gaining strength, and higher general inflation rates will affect the labor-intensive health sector, driving up wages and medical prices.²
• Movement to high-deductible health plans loses steam. After shifting healthcare costs to employees for years, employers are starting to ease off. Growth in high-deductible employer-based health plans is slowing, leaving less opportunity to stem increases in the use of healthcare services.³
• Fewer branded drugs come off patent. With fewer branded, small molecule drugs coming off patent, employers will have fewer opportunities to encourage employees to buy cost-saving generics, another strategy they’ve employed historically to keep costs down.4
Two forces may partially offset these health spending increases.
• Political and public scrutiny puts pressure on drug prices. Heightened political and public attention could pressure drug companies to hold price hikes in check.
• Employers target right people with right treatments to minimize waste. In an effort to ensure employee access to care while minimizing waste, employers are learning to better manage and deploy new treatments, technologies and information.
In addition to these new and emerging issues in 2018, there also are forces that perennially influence healthcare costs. These include economywide drivers, such as demographics and American lifestyle trends, as well as sector-specific influences, such as hospital consolidation and changes in payment models. In 2018, these recurring factors will place upward and downward pressure on cost trend.

3 Medical cost trend: Behind the numbers 2018
Even with medical cost trend between 6 and 7 percent, health spending continues to outpace the economy. From 2011 to 2016, the average health premium for family coverage purchased through an employer rose 20 percent.5 In the same period, wages increased just 11 percent.6 This gap erodes consumers’ ability to pay for other goods and services, including housing, food and transportation. Nationally, as medical costs are projected to continue to grow faster than gross domestic product (GDP), healthcare will continue to take up a greater share of the economy.7 This could lead to larger budget deficits or less spending in areas such as education, infrastructure and defense. Even the “new normal” is not sustainable.
For several years, employers largely have stabilized trend growth by increasing cost-sharing with employees, who in turn slow their use of health goods and services. However, consumers are becoming more attuned to what they spend on their health.8 They are voicing dissatisfaction with high-deductible health plans.9 They also are forgoing cost-effective services such as preventive care, which can result in the need for higher-cost health services later.10
For medical cost trend to sink lower than its “new normal,” health organizations and businesses will have to consider tackling the price of services as well as the rate of utilization. Heading into 2018, employers should look to new contract arrangements with providers to tackle healthcare prices without shifting more
costs to employees. And healthcare providers, with opportunities to take on more risk and work with employers directly, should focus on improving care management and optimizing their use of physician extenders and nonclinical staff to keep costs down. Health insurers, in an effort to prove their value to employers, could work to steer patients to the most effective treatments and help providers accelerate pricing transparency efforts. Drug companies also should focus on increasing collaboration across the industry, giving stakeholders greater insight into their pricing and the role they play in keeping patients healthy and out of high-cost delivery settings.

4 Medical cost trend: Behind the numbers 2018
Medical cost trend in 2018
Figure 1: HRI’s projected medical cost trend 2007-2018
Source: PwC Health Research Institute medical cost trends 2007-2018. HRI recalibrated its trend estimates down for 2016 and 2017. See Figure 2 for more information.
HRI projects 2018’s medical cost trend to be 6.5 percent (see Figure 1). Insurance companies use medical cost trend to help set premiums by estimating what the same health plan this year will cost the following year. Benefit design changes typically hold
down spending growth by reducing utilization of services through cost sharing. The net growth rate in 2018, after accounting for benefit design changes such as higher co-pays and narrow provider networks, is expected to be 5.5 percent.
What is medical cost trend?
Medical cost trend is the projected percentage increase in the cost to treat patients from one year to the next, assuming that benefits remain the same. While it can be defined in several ways, this report estimates the projected increase in per capita costs of medical services that affect commercial insurers and large, self-insured businesses. Insurance companies use the projection to calculate health plan premiums for the coming year. For example, a 10 percent trend means that a plan that costs $10,000 per employee this year would cost $11,000 next year. The cost trend, or growth rate, is influenced primarily by:
• Changes in the price of medical products and services, known as unit cost inflation
• Changes in the number or intensity of services used, or changes in per capita utilization
201820172016201520142013201220112010200920082007
6.5%6.2% 6.0%
6.8%6.5%
7.5%
8.5%9%9%9.2%
9.9%
11.9%
Medical cost trend:Behind the numbers 2018
June 2017

5 Medical cost trend: Behind the numbers 2018
HRI also has adjusted its trend estimates down for 2016 and 2017 to recalibrate for the industry’s “new normal” trend-growth pattern (see Figure 2). The adjusted estimates are based on new data showing medical costs were lower than anticipated in 2016 and 2017. As a result, HRI’s projection of 6.5 percent for 2018 reflects a slight uptick in cost trend—the first in three years.
Figure 2: HRI recalibrated its medical cost trend estimates down for 2016 and 2017
Source: PwC Health Research Institute analysis
For this research, HRI interviewed industry executives, health policy experts and health plan actuaries whose companies cover more than 100 million employer-sponsored members. HRI also analyzed results from PwC’s 2017 Health and Well-being Touchstone Survey of more than 780 employers from 37 industries, and an
HRI national consumer survey of 1,500 US adults. This projection is based on HRI’s analysis of medical costs in the employer insurance market, which covers more than 150 million active employees.11
7%
6%
5%
4%
3%
2%
1%
0%
What we projected
Current estimate
6.5% 6.2% 6.5%6.0%
2016 2017 2018
6.5%

6 Medical cost trend: Behind the numbers 2018
Putting trends in perspective
Growth in employer medical costs settles into a “new normal”
As healthcare continues to take up a larger part of the overall economy, structural changes—such as the push toward paying for value, greater emphasis on care management and increased cost sharing with consumers—are taking stronger hold, pulling back against rapid healthcare spending growth. The industry is settling into a “new normal” marked by trend growth in the single digits that oscillates moderately from year to year (see Figure 3).
Figure 3: Growth in employer medical costs—which has been gradually declining for decades—is settling into a “new normal” characterized by flatter, single-digit trend
Growth in employer healthcare spending has been gradually slowing over the past 30 years. However, that deceleration has not been linear. Cost trend has risen and fallen in cycles, peaking after several years of double-digit increases, falling for several years, hitting a trough and then rebounding back to double digits. These cycles have tended to span about 10 years.12
The latest downward trend to single-digit annual growth began even before the lower economic growth surrounding the 2009 recession and subsequent recovery. With medical cost growth hanging in the single
Source: PwC Health Research Institute analysis of CMS National Health Expenditure Accounts, Kaiser Family Foundation, and Bureau of Labor and Statistics data13
The industry’s “new normal” is marked by trend growth in the single digits that oscillates moderately from year to year.
18%
15%
12%
9%
6%
3%
0%
Ann
ual g
row
th in
em
ploy
er b
enef
it co
sts
1988 14121008060402009896949290 2016
PwC employer benefit
cost index
digits for over a decade now, many employers have been expecting an inflection point when costs will once again grow at double digits. However, that spike doesn’t appear to be coming. Even as the economy now picks up steam, growth in cost trend has remained at historic lows.

7 Medical cost trend: Behind the numbers 2018
Figure 4: Price continues to be a major driver of medical cost trend
Components of growth in employer benefit costs, 2007-2016
Future reductions in cost trend will require more focus on price
Healthcare cost growth can be divided into two primary components: the unit price of services and the volume and intensity of their use, known as utilization. In recent years, growth in utilization has been low as employers and health insurers have increased cost-sharing requirements—deductibles, copayments and coinsurance—for American consumers. As consumers bear more financial responsibility for their healthcare costs, they tend to use fewer health goods
Source: PwC Health Research Institute analysis of Bureau of Labor and Statistics data14
and services. Low utilization growth has helped counteract prices that have continued to rise, tempering the growth in overall healthcare cost trend (see Figure 4).
However, employers and health insurers can only shift so much cost to consumers, so annual utilization growth could start to rise. Without low utilization serving as a counterbalance, rising prices likely will put upward pressure on overall healthcare costs. For medical cost trend to start dipping below its “new normal,” health organizations and businesses should more fully concentrate on tackling the price of services.
Without low utilization serving as a counterbalance, rising prices likely will put upward pressure on overall healthcare costs.
201520142013201220112010200920082007 2016
Ann
ual g
row
th
8%
6%
4%
2%
0%
-2%Utilization
Medical price
PwC employer benefit cost index

8 Medical cost trend: Behind the numbers 2018
Figure 5: Pharmacy and outpatient costs will likely take up a larger portion of employer health spending in 2018 than they did in 2008
Not all components of healthcare spending have the same impact on employer benefit costs
Healthcare costs also can be broken into service components such as hospital inpatient and outpatient services, physician services and prescription drug spending. Not all components contribute equally to employer costs (see Figure 5). In 2018, hospital spending will likely account for half of all medical costs. About 30 percent can be attributed to inpatient spending; 19 percent to outpatient.
Physicians will account for 29 percent; prescription drugs, 18 percent.15
Over the past 10 years, the share of prescription drug and hospital outpatient spending has been increasing relative to inpatient hospital spending, which has remained steady, and physician spending, which has been shrinking. For example, the share of spending on drugs grew to 18 percent from 15 percent between 2008 and 2018, while the physician services share shrunk to 29 percent from 35 percent in the same period. These shifts have resulted from higher trend growth in some components and lower growth in others.
Source: Milliman Medical Index for 2008 and PwC Health Research Institute projections of 2018 medical spending based on the 2017 Milliman Medical Index. http://us.milliman.com/17
However, a component’s overall contribution to employers’ total health spending may not be proportional to its growth rate. For instance, in 2015, new hepatitis C drugs helped drive up drug spending by 14 percent, while inpatient spending grew by only 5 percent that year.16 Although the drug spending growth rate was nearly three times more than inpatient growth, prescription drugs only accounted for 20 percent more of the increase in employers’ premium costs due to its smaller share of overall employer health costs.
Sha
re o
f em
ploy
er h
ealth
ben
efits 35%
30%
25%
20%
15%
10%
5%
0%Pharmacy
20%
15%18%
Other
12%4% 4%
Outpatient
18%
16%19%
Inpatient
1%30% 30%
Physician
16%35%
29%
2008 share (Milliman) 2018 share (PwC projection) Percent change since 2008
9 Medical cost trend: Behind the numbers 2018
Medical cost trend’s usual suspects
An analysis of historical medical cost trend reveals forces that repeatedly influence healthcare costs. These perennial factors, combined with inflators and deflators tied to a particular year, place upward and downward pressures on cost trend. They include economywide drivers such as demographics and American lifestyle trends, and healthcare-specific influences, such as technology and treatment innovations and payment model changes.
Many of these “usual suspects” have been discussed in previous Behind the numbers reports. The primary inflators and deflators in Behind the numbers highlight new and emerging issues in a particular year. But it is important to recognize that these recurring forces also affect cost trend considerably in any given year.
Economywide drivers18
• Income: Higher incomes are associated with relatively higher health spending.19 Although growth has been slow in the past decade, incomes are rising on average, and with them, healthcare spending.20
• Demographics: The workforce has been aging as Baby Boomers reach retirement.21 In 2012, 15.9 percent of the civilian labor force was between the ages of 55 and 64. That percentage is expected to increase to 17.3 by 2022.22 An older workforce typically has more health needs, resulting in higher healthcare expenditures. Across the full civilian labor force over the age of 16, aging will account for 0.4 percent of annual employer medical spending increases in the decade from 2012 to 2022, according to an HRI analysis.23
• Lifestyle: Obesity, smoking, substance abuse, poor nutrition and physical inactivity intensify utilization of health services.24 Over 70 percent of Americans are considered overweight, and abuse of opioids such as heroin and prescription pain relievers is on the rise.25 These growing health risks drive healthcare costs upward. However, more focus on wellness initiatives that target these risks could help to stem the tide of increasing costs.
Healthcare-specific drivers
• Technology and treatment innovation: The pharmaceutical, life sciences and medical device industries are funding research and development budgets and launch new products every year, some with hefty price tags and potential to boost utilization.26 For example, a more sensitive diagnostic test may detect a problem that would have otherwise gone unnoticed, resulting in treatment that could be unnecessary. Cost-saving innovation also can put downward pressure on healthcare spending. Hospital inpatient care has been falling as an increasing number of procedures can be performed at lower costs on an outpatient basis thanks to technological advances.27 In addition, new technology increasingly renders virtual visits and telehealth more efficient and convenient than traditional medical care.28
• Consolidation: Providers, payers, and pharmaceutical and life sciences companies have engaged in a surge of merger and acquisition activity in recent years.29 With organizations gaining greater market share and negotiating power, a consolidated healthcare market can drive prices up.30
• Government regulation: From nurse staffing levels to the use of health information technology, government regulation has long had an influence on healthcare costs. For instance, recent state regulations expanding nurse practitioners’ scope of practice have been shown to reduce primary care costs.31
• Payment models: Historically, fee-for-service payment has helped to drive up medical cost trend, creating incentives to increase the volume of services delivered and favoring more expensive specialty care. But the shift to pay for value, instead of volume, is underway. While the scale of value-based payment models remains relatively small, early findings suggest that they could help curtail growth in healthcare spending by making transparency, quality and stronger care management higher priorities.
Factors affecting 2018 medical cost trend

10 Medical cost trend: Behind the numbers 2018
Growth of the Consumer Price Index (CPI) has been slowing since 2011. Over the past year, it has become obvious that is changing. As the US economy heats up, general inflation will likely put more upward pressure on wages, medical prices and overall cost trend in 2018.
With employers hiring and consumers and businesses spending, all indicators point to the US economy being in an upswing and, with it, general inflation.32 From 2015 to 2016, the CPI growth rate jumped 1.2 percentage points. In March 2017, the Federal Reserve raised interest rates for the second time in three months—the third time since 2009—signaling an expectation that the economy will continue to expand.33 With wages
increasing, gross domestic product rising and the unemployment rate dropping to 4.4 percent in April 2017—a 10-year low that economists consider to be near “full employment”—inflation is being nudged higher.34 Growth in CPI is expected to increase again in 2017 and in 2018, when it will hit 2.6 percent, the highest it has been since 2012 (see Figure 6). In 2015, it was 0.1 percent.
General inflation impacts all prices in an economy, and healthcare costs are no exception. Healthcare costs historically have tracked general inflation, if not always in perfect lockstep. For instance, if energy costs are higher, hospitals have to spend more to heat and cool their facilities. “It’s easy to forget that overall prices in
Inflator #1: Rising general inflation impacts healthcare
Figure 6: US healthcare spending historically tracks the Consumer Price Index
Source: PwC Health Research Institute analysis of CMS National Health Expenditure Accounts and Bureau of Labor Statistics data. Dashes represent projections.35
the economy were putting downward pressure on healthcare,” said Paul Hughes-Cromwick, co-director of the Ann Arbor, Mich.-based Altarum Institute’s Center for Sustainable Health Spending. “This story is over now, though.”
Growth in personal healthcare expenditures versus CPI, 1970 - 2018
“It’s easy to forget that overall prices in the economy were
putting downward pressure on healthcare.”
Paul Hughes-Cromwick, co-director of the Altarum
Institute’s Center for Sustainable Health Spending
16%
14%
12%
10%
8%
6%
4%
2%
0%
-2%
2000199019801970 2010 2018
Change in Consumer Price Index for all urban consumers (CPI-U)
Change in per capita personal healthcare (Total)
Ann
ual g
row
th
11 Medical cost trend: Behind the numbers 2018
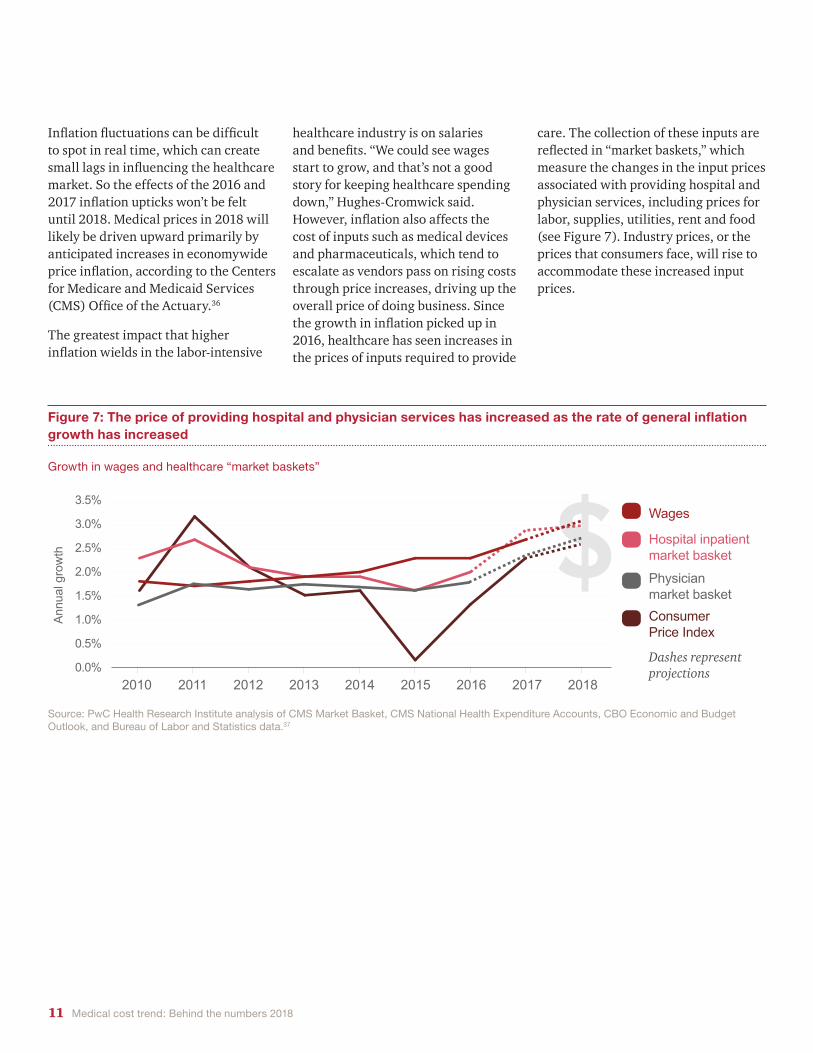
Inflation fluctuations can be difficult to spot in real time, which can create small lags in influencing the healthcare market. So the effects of the 2016 and 2017 inflation upticks won’t be felt until 2018. Medical prices in 2018 will likely be driven upward primarily by anticipated increases in economywide price inflation, according to the Centers for Medicare and Medicaid Services (CMS) Office of the Actuary.36
The greatest impact that higher inflation wields in the labor-intensive
healthcare industry is on salaries and benefits. “We could see wages start to grow, and that’s not a good story for keeping healthcare spending down,” Hughes-Cromwick said. However, inflation also affects the cost of inputs such as medical devices and pharmaceuticals, which tend to escalate as vendors pass on rising costs through price increases, driving up the overall price of doing business. Since the growth in inflation picked up in 2016, healthcare has seen increases in the prices of inputs required to provide
Figure 7: The price of providing hospital and physician services has increased as the rate of general inflation growth has increased
Source: PwC Health Research Institute analysis of CMS Market Basket, CMS National Health Expenditure Accounts, CBO Economic and Budget Outlook, and Bureau of Labor and Statistics data.37
Growth in wages and healthcare “market baskets”
care. The collection of these inputs are reflected in “market baskets,” which measure the changes in the input prices associated with providing hospital and physician services, including prices for labor, supplies, utilities, rent and food (see Figure 7). Industry prices, or the prices that consumers face, will rise to accommodate these increased input prices.
3.5%
3.0%
2.5%
2.0%
1.5%
1.0%
0.5%
0.0%
Physician market basket
Hospital inpatient market basket
Consumer Price Index
Wages
20172016201520142013201220112010 2018
Ann
ual g
row
th
Dashes represent projections

12 Medical cost trend: Behind the numbers 2018
they can curb unnecessary care, they also can lead to consumers forgoing cost-effective, beneficial services such as preventive care and prescription drugs.38 Deferring such treatment can lead to decreased productivity and increased cost of chronic care management in the long term.39
High-deductible health plans were designed to encourage consumers to be more prudent healthcare shoppers by giving them greater responsibility for their expenses. A 2017 HRI consumer survey revealed that individuals enrolled in high-deductible plans were almost 60 percent more likely to have skipped or delayed receiving medical care or getting medication in the prior year than those with lower deductibles. Some employers have experienced a more than 11 percent reduction in health spending as employees use less care.40 These plans’ proliferation have helped keep medical cost trend down in recent years.41
With increased competition for labor in the US economy reaching “full employment,” employers have less appetite for scaling back benefits and
The wave of growth in high-deductible health plans, employers’ go-to strategy in recent years to curb health spending, may be plateauing. According to the 2017 PwC Health and Well-being Touchstone Survey of major US companies, only 28 percent of employers are considering offering high-deductible health plans as the only benefit option to their employees in the next three years, down from a peak of 44 percent in 2014. And the share of employers already offering high-deductible plans as their only option has been flat for the last three years (see Figure 8).
Employers are beginning to recognize that cost sharing has its limits. They “are realizing there is only so much that shopping does and that there is only so much of the healthcare dollar that is shop-able,” said Micah Weinberg, president of the Bay Area Council Economic Institute, a San Francisco-based center for economic and policy research.
High-deductible plans also can have unintended consequences. While
Inflator #2: Movement to high-deductible health plans loses steam
Figure 8: The share of employers considering a high-deductible health plan as a full replacement option is falling
Source: PwC Health Research Institute analysis of PwC Health and Well-being Touchstone Surveys, 2012-2017
Percentage of employers who say they have adopted or are considering adopting a high-deductible plan as a full replacement option for medical benefits, 2012-2017
continuing with a plan design that has proven largely unpopular with consumers. According to HRI’s consumer survey, 69 percent of high-deductible enrollees likely would choose a different plan type next year if it’s available, even if it means making a higher monthly premium contribution. At the same time, 72 percent of consumers not enrolled in a high-deductible health plan said they were not likely to choose a high-deductible plan in the future.
Ongoing health reform efforts could reinvigorate interest in high deductibles in future years by expanding the use of health savings accounts, or tax-advantaged medical savings accounts that are paired with high-deductible plans.42 However the current slowdown in the shift to high-deductible plans will ease some of the downward pressure on utilization and, therefore, nudge medical cost trend up in 2018. Without the lever of high deductibles to reduce costs, employers may consider supply-side management strategies—such as narrower provider networks and centers of excellence—that focus on bringing price, rather than utilization, down.
Percentage of employers who say they have adopted or are considering adopting a high-deductible plan as a full replacement option for medical benefits, 2012-2017
Per
cent
of e
mpl
oyer
s
50%
40%
30%
20%
10%
0%
20162015201420132012 2017
Adopted high-deductible plan as full replacement option for medical benefits
Considering high-deductible plan as full replacement option for medical benefits in next 3 years

13 Medical cost trend: Behind the numbers 2018
Beginning in 2016, the dollar sales of branded, small molecule drugs going off patent protection have been declining. As a result, fewer cost-saving generics likely will come to market in 2018, leading to a faster drug price growth rate and upward pressure on overall healthcare spending.
For two consecutive years, the US pharmaceutical sales revenue associated with patent expirations for branded, small molecule drugs—which are simpler, chemically manufactured
Inflator #3: Fewer branded drugs come off patent
Figure 9: US pharmaceutical sales revenue associated with branded, small molecule drugs going off patent protection declined in 2016 and 2017
Source: PwC Health Research Institute analysis of Optum data45
compounds—has declined. In 2016, branded, small molecule drugs losing patent protection represented $18.9 billion in US pharmaceutical sales revenue, nearly 32 percent less than the pharmaceuticals that went off patent in 2015 (see Figure 9). In 2017, $11.1 billion worth of pharmaceuticals will go off patent—a sharp 41.3 percent drop from 2016.
When branded, small molecule drugs lose patent protection, generic equivalents can enter the market.
Generics—with prices that frequently average 80 to 85 percent less than the branded originals within a few years after patent expiration—can create significant cost savings.43 Replacing branded drug purchases with generics has become a key strategy for employers and health plans looking to combat increasing medical costs. Companies replace branded drugs on formularies with generics and encourage their use by lowering—or even eliminating—copayments or out-of-pocket costs.44
Cha
nge
in s
ales
reve
nue
at ri
sk 200%
150%
100%
50%
0%
-50%
-100%20152014201320122011 2016 2017
14 Medical cost trend: Behind the numbers 2018
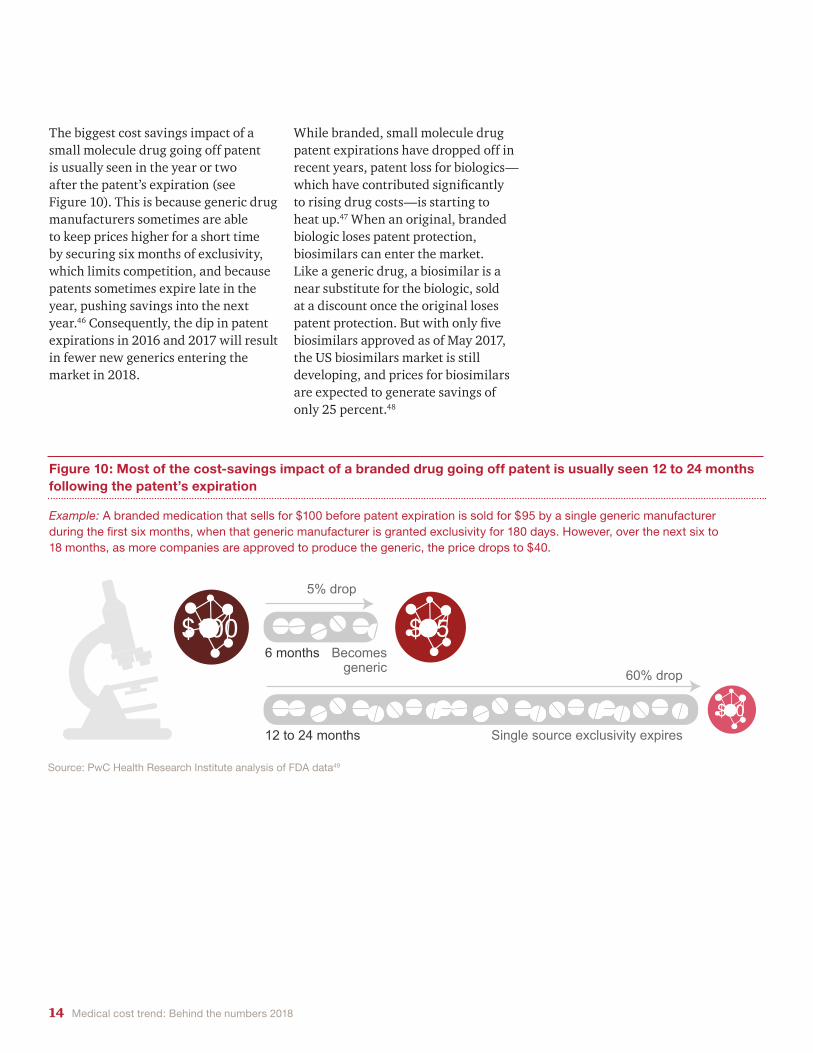
The biggest cost savings impact of a small molecule drug going off patent is usually seen in the year or two after the patent’s expiration (see Figure 10). This is because generic drug manufacturers sometimes are able to keep prices higher for a short time by securing six months of exclusivity, which limits competition, and because patents sometimes expire late in the year, pushing savings into the next year.46 Consequently, the dip in patent expirations in 2016 and 2017 will result in fewer new generics entering the market in 2018.
While branded, small molecule drug patent expirations have dropped off in recent years, patent loss for biologics—which have contributed significantly to rising drug costs—is starting to heat up.47 When an original, branded biologic loses patent protection, biosimilars can enter the market. Like a generic drug, a biosimilar is a near substitute for the biologic, sold at a discount once the original loses patent protection. But with only five biosimilars approved as of May 2017, the US biosimilars market is still developing, and prices for biosimilars are expected to generate savings of only 25 percent.48
Figure 10: Most of the cost-savings impact of a branded drug going off patent is usually seen 12 to 24 months following the patent’s expiration
Source: PwC Health Research Institute analysis of FDA data49
Example: A branded medication that sells for $100 before patent expiration is sold for $95 by a single generic manufacturer during the first six months, when that generic manufacturer is granted exclusivity for 180 days. However, over the next six to 18 months, as more companies are approved to produce the generic, the price drops to $40.
$100 $95
$40
Example: A branded medication that sells for $100 before patent expiration is sold for $95 by a single generic manufacturer during the first six months, when that generic manufacturer is granted exclusivity for 180 days. However, over the next six to 18 months, as more companies are approved to produce the generic, the price drops to $40.
6 months Becomes generic
12 to 24 months Single source exclusivity expires
5% drop
60% drop

15 Medical cost trend: Behind the numbers 2018
Triple- and quadruple-digit percentage hikes in certain drug prices over the previous three years have made front-page news.50 As political and public scrutiny grows—amplified by negative opinions on social media—drug companies are becoming more price cautious, feeling pressure to hold price hikes in check to avoid negative media attention and legislative action.
Since his campaign, President Donald Trump—who has a penchant for calling out individual companies and industries on social media—has used his bully pulpit to take aim at the pharmaceutical industry. In his first 2017 press conference, he said drug companies are “getting away with murder” and that the US is “the largest buyer of drugs in the world and yet we don’t bid properly … we’re going to start bidding and we’re going to save billions of dollars.”51 After that, pharmaceutical and biotech stocks slumped—the Nasdaq Biotechnology Index by 3 percent and the Standard & Poor’s 500 Pharmaceuticals, Biotechnology & Life Sciences Index by about 2 percent. Those were the biggest one-day drops for the indexes since October 2016.52
Some federal and state lawmakers—including Rep. Elijah Cummings, D-Md., and Sen. Bernie Sanders, I-Vt.—also have been critical, launching hearings to investigate dramatic rate
whose strategy has been acquiring drugs from other companies and hiking their prices, rather than developing new products.
Some pharmaceutical companies are addressing pricing and value on their own. Last fall Allergan CEO Brent Saunders published a “social contract” with patients committing itself to greater transparency and to limiting percent price increases within the year to the single digits.57 Since then, other manufacturers, including Novo Nordisk and AbbVie, have made similar pledges.58
Heightened political and public attention—and the self-regulation from drugmakers that ensues—has shown before that it can seriously affect drug price growth. In the early 1990s, drug price growth started to slow after a special election for a Pennsylvania US
hikes and introducing legislation to allow drugs to be imported from countries where prices are held in check.53 This scrutiny from lawmakers is indicative of growing unrest among their constituents. In 2017, 69 percent of consumers felt that a pharmaceutical company—even if it could justify the price—should not be allowed to charge indiscriminately for a medication, according to an HRI survey. Two years earlier only 52 percent of consumers felt the same way. Consumers also told HRI that establishing government controls on drug prices should be President Trump’s top priority when considering ways to lower healthcare costs.
Drug companies are responding to this heightened scrutiny. After the uproar over EpiPen’s price surpassing $600, Mylan took the unusual step of launching a generic version of its own product at a 50 percent discount.54 Other companies have delayed the launch of drugs or shed products.55
Sector trade group, the Pharmaceutical Research and Manufacturers of America (PhRMA), also has re-evaluated its membership criteria. The group has changed its bylaws to require members to spend a certain amount of money on research and development efforts.56 The new rules distance the group, which ousted 22 members with the rule change, from companies
Deflator #1: Political and public scrutiny puts pressure on drug prices
69 percent of consumers feel that a pharmaceutical company—even if it could justify the price—should not be allowed to charge indiscriminately for a medication, according to a 2017 HRI survey.

16 Medical cost trend: Behind the numbers 2018
Senate seat in November 1991. The election of underdog candidate Harris Wofford—who ran on a single-issue platform to introduce national health insurance—positioned healthcare reform as a major issue in the 1992 presidential campaign.59 After winning the election, President Bill Clinton continued to attack the high prices of vaccines and other pharmaceuticals.60 The scrutiny resulted in a precipitous, fivefold decrease in the drug price growth rate (see Figure 11).61 Before the 1991 special election, CPI for prescription drugs was growing at
nearly 10 percent; by 1995, the year after the Clinton administration’s health reform effort collapsed, the CPI for prescription drugs was growing at 2 percent.62
In a highly concentrated market—the top 10 pharmaceutical companies based on US sales made up 53 percent of the US market in 2016—a few mentions on social media could have a devastating effect.63 Pharmaceutical executives would rather take matters into their own hands than run the risk of more heavy-handed caps. “It’s a fear
of every single company, industry, you name it,” said Mary Grealy, president of the Healthcare Leadership Council. “No one wants to be the subject of a tweet. Everyone wants to stay off the radar.”
Figure 11: Public scrutiny and political pressure on pharmaceutical companies put downward pressure on the growth in drug costs in the 1990s
Source: PwC Health Research Institute analysis
1998199619941992199019881986 2000
12%
10%
8%
6%
4%
2%
0%
Harris Wofford wins Pennsylvania Senate special election with
promise of health reform
Election of President Bill Clinton Health reform effort collapses
Nominal GDPCPI Prescription Drugs
Ann
ual g
row
th
President Bill Clinton health reform plan introduced

17 Medical cost trend: Behind the numbers 2018
Figure 12: More employers say they are using strategies to minimize waste
Source:PwC Health Research Institute analysis of PwC Health and Well-being Touchstone Surveys, 2015-2017
Deflator #2: Employers target right people with right treatments to minimize waste
Heading into 2018, employers are looking to maintain access to care for their employees, but in more efficient ways, lowering costs by minimizing waste and targeting spending where it’s most effective. New treatment technologies, medical devices and pharmaceuticals are increasingly expensive.64 “If you’re in the kitchen and one of these new specialty drugs rolls under the refrigerator, you’ll throw out your fridge, because the pill costs more,” said employer benefit expert Mike Thompson, president and CEO of the National Alliance of Healthcare Purchaser Coalitions. Employers don’t want to deny their employees access to expensive new treatments and technologies, because they recognize their potential to improve or save lives.65 Employers are
employers pinpoint treatment that will result in the best patient outcomes.67 As the price of genetic testing has come down, there is also growing interest in the power of personalized medicine—once thought to be at the bleeding edge of the industry—to identify the most appropriate treatment for an individual.68
Employers also are ramping up traditional strategies, such as requiring prior authorizations for costly, new specialty drugs; instituting step therapies, which require that people first try a less expensive drug before “stepping up” to a more expensive option; and limiting the number of drugs in an initial prescription (see Figure 12). Quantity limits ensure that a product, such as an antidepressant, is
doubling down on tools and tactics such as prescription quantity limits and stronger care management that ensure the right people get the most appropriate treatment, in the most appropriate setting, and that they adhere to it.
Most prescription drugs work for less than 60 percent of patients who take them.66 As costly products come to market, employers are exploring new technology, such as artificial intelligence, to match people with the best treatments. In its agenda for 2017 and beyond, the Health Transformation Alliance—a newly formed employer consortium focused on lowering healthcare spending for its 38 member companies—highlighted plans to use IBM’s Watson software to help
Percentage of employers who say they are using controls to manage specialty drug costs, 2015-2017
80%
70%
60%
50%
40%
30%
20%
10%
0%
Prior authorizationQuantity limits Step therapyRequired approval
for a drugLimiting the number of drugs
in a prescriptionRequiring a lower cost drug be used
before a more expensive option
2016
2015
2017
Per
cent
of e
mpl
oyer
s
18 Medical cost trend: Behind the numbers 2018
going to be effective for a person before a full supply is authorized, which helps employers avoid wasting healthcare dollars on ineffective medications.
In addition, employers are paying closer attention to where treatments are delivered, looking for opportunities to shift care to lower cost settings.69 Treatments that require the help of medical personnel can be far cheaper outside of the hospital. For instance, the cost of an infusion of intravenous immune globulin, a treatment administered to people with autoimmune disorders, in the home can be 62 percent lower than in a medical office and 87 percent lower than in the hospital outpatient setting.70 Home infusion delivery also is associated with improved outcomes, reducing the risk of infection or other adverse events thanks to greater clinical oversight by specially trained clinicians.71
Encouraging patients to adhere to their regimens represents another hurdle employers are addressing.72 Employers are increasingly turning to healthcare providers to help them manage care well so money spent treating their employees isn’t wasted. The Health Transformation Alliance plans to begin
negotiating value-based contracts with providers to care for employees with conditions such as diabetes and lower back pain in 2018. These arrangements will reimburse providers based on outcomes, which will likely incentivize better care coordination.
Employers also are seeking solutions to improve care management and increase adherence in the medical device sector. Catalia Health, a San Francisco-based patient care management company, has combined artificial intelligence technology with robotics to help patients manage chronic conditions such as diabetes and heart disease, keep their healthcare teams up to date on their symptoms and adhere to drug regimens. Pharmaceutical companies, health systems and home health organizations are using Catalia’s Mabu, a personal healthcare companion robot that interacts with patients in their homes. The robot works to understand the challenges a person faces with their particular conditions and can root out why patients may not be adhering to their regimens through conversation and observation.73
“If you’re in the kitchen and one of these new specialty drugs rolls under the refrigerator, you’ll throw out your fridge,
because the pill costs more.” Mike Thompson, president and CEO
of the National Alliance of Healthcare Purchaser Coalitions
19 Medical cost trend: Behind the numbers 2018
• Reduces the employer mandate penalty: Under the ACA’s employer mandate, companies with more than 50 employees are required to offer insurance to those working more than 30 hours per week. The House-passed AHCA would reduce employer mandate penalties to $0, effectively repealing the mandate. That would reduce reporting requirements and financial penalties associated with noncompliance for employers. Some companies, particularly small employers with slightly more than 50 employees and companies with many lower-wage employees, may find it more advantageous to drop coverage. Most large employers likely would retain coverage, however. More than 90 percent of all employers surveyed in PwC’s 2017 Health and Well-being Touchstone Survey said they would not change employee eligibility if they were no longer required to offer coverage.74
• Reduces the individual mandate penalty to $0: The ACA requires that most individuals carry a minimum level of health insurance coverage or pay a penalty. The House-passed AHCA would reduce the penalty to $0. Eliminating that
mandate could increase nongroup market premiums as healthier people forgo coverage because they no longer face a penalty for doing so. Higher premiums in the nongroup market would create further incentive for workers to seek out employer-sponsored insurance.75
• Further delays the “Cadillac tax”: The House-passed AHCA delays the 40 percent excise tax on high-cost employer-sponsored health plans until 2026. While employers would welcome the delay, some of them would opt to reduce employee health benefits to avoid the tax if and when it takes effect, which could create ill will among workers.
• Allows states to waive some ACA consumer protections: Under the House-passed AHCA, states could opt to waive three key ACA consumer protections, which would allow states to redefine essential health benefits, allow insurers to charge some consumers nongroup premiums based on their health status, and offer insurers the option of charging older consumers in the nongroup and small group markets more than five times the premiums they charge younger ones.76
19 Medical Cost Trend: Behind the Numbers 2018
How could Trump administration policy impact employers and their healthcare spending?
Lawmakers in Washington are continuing with plans to at least partially repeal and replace the Affordable Care Act (ACA), moves that could affect employers directly and indirectly. While the House has passed its version of an ACA repeal and replace bill, Senate Republicans are discussing an alternative bill that can pass the Senate. The ultimate fate of this effort remains in question since both the House and Senate must agree on a final bill. In its current state, the House’s repeal and replace bill—the American Health Care Act (AHCA)—contains several provisions that employers should watch:
20 Medical cost trend: Behind the numbers 201820 Medical Cost Trend: Behind the Numbers 2018
With the state waivers, self-insured employers and large group health plans would be able to choose which state’s definition of essential health benefits they would abide by—a choice they were granted under the ACA—giving them more flexibility in plan design. Some employers could choose to offer employees lower-cost, “slimmed down” plans. It remains to be seen if employers would take this option, particularly as competition increases in the labor market.77 When asked what features they would continue if ACA plan design mandates were repealed, 72 percent of employers said they’d continue to fully pay for required preventive services, 63 percent would continue without pre-existing condition limitations and 53 percent would continue no annual dollar limits, according to PwC’s 2017 Health and Well-being Touchstone Survey.78 If states win waivers to widen the age-band ratings and charge premiums based on health status, employers could see younger employees drop employer-sponsored coverage for less expensive nongroup health plans, making employers’ risk pools more adverse and premium costs higher.
• Creates age-based tax credits to help pay for premiums; eliminates cost-sharing subsidies: Consumers would no longer receive help buying coverage based on their ability to pay. Instead, they would receive age-based tax credits, which the Congressional Budget Office has determined would leave millions of consumers unable to afford coverage. This could lead to increases in uncompensated
care, which could be passed on to employers in the form of higher premiums or higher provider charges. Under the House-passed AHCA, states would receive federal money to help offset some of these issues. Moving to age-based tax credits also could incent young and healthy employees to drop their employer-sponsored coverage in favor of less expensive nongroup health plans. The loss of young and healthy employees would make employers’ risk pools more adverse and might raise the cost of employer coverage.
Another potential effect of efforts to repeal and replace the ACA is that it could cause hospitals—often the largest employers in a given area—to slow hiring. Many hospitals hired additional staff to handle the increased demand for services that came with the ACA’s newly insured patients. But if millions lose coverage, it would be challenging to continue with the same staffing levels, particularly as the cost of doing so rises in a strong economy.79 ACA repeal could result in a loss of 2.6 million jobs, 1 million of which would be in the healthcare field, according to an analysis by George Washington University’s Milken Institute of Public Health.80
In addition to “repeal and replace” legislation, changes in leadership at regulatory agencies also could impact employer healthcare spending. At the Food and Drug Administration (FDA), newly appointed commissioner Dr. Scott Gottlieb has expressed a desire to modernize and speed-up the approval of novel treatments, a move which eventually could push healthcare prices up.81
Outside of healthcare, efforts by the Trump administration and Congress to overhaul the US tax code also would have implications for employers. Key business tax reform proposals include lowering the corporate tax rate and implementing a mandatory one-time tax rate on unremitted foreign earnings.82 Tax reform in any shape or size would affect the way employers do business, impacting considerations around when to take deductions and whether to outsource labor.83
Overall, the impact of Trump administration policy on employers and their healthcare costs is likely to be modest in the near term. However, employers can act to better navigate this period of uncertainty.84 For instance, employers can consider what changes they would make to eligibility requirements and health plan design under different scenarios. Regardless of reform efforts’ outcome, the focus on value and push to reduce healthcare costs won’t abate. Employers should continue to explore potential cost-control measures such as transparency, value-based payments and delivery system options, such as accountable care organizations and direct contracting with providers. Uncertainty about the future of the nongroup and Medicaid markets may prompt health insurers to focus more on the employer market for continued growth, increasing competition. To meet employers’ demands for value, health insurers will need to better engage consumers and collaborate with providers to deliver better outcomes and lower costs.

21 Medical cost trend: Behind the numbers 2018
Employers
Though health benefit costs are growing at a low rate compared with historical trends, growth in employer premiums is still outpacing wage growth, making benefit costs unsustainable in the long run.85 In a competitive labor market, employers are looking for new cost containment strategies beyond shifting more costs to employees.
Things to consider Target work site health promotion programs to the right people. Work site wellness programs have become a critical tool for employers to improve their employee population’s health and reduce healthcare spending. But these programs often appeal most to employees who are already healthy and will see marginal benefit from the intervention.
Employers should consider harnessing biometric data and analytics tools to target health programs to the right people, treating their populations as individuals rather than averages. Such tools can give employers insight into their employees’ health status and help the employees understand how behavioral choices, environmental factors and clinical interventions can affect their well-being. With this information, employers can discover which programs will likely improve health measurably for specific populations. By pinpointing higher-risk individuals, employers can focus investments on initiatives that will yield the greatest health improvement and cost savings, building programs that have a meaningful impact on their healthcare spending.
Evaluate the value of drug spending. Employers should take a deep dive into their claims data to identify what conditions and drugs drive most of their spending. In doing so, they will be better able to evaluate new therapeutics’ potential value and weigh added costs against potential benefits for their employees. Employers should then work with pharmacy benefit managers (PBMs) to restructure formularies accordingly, providing more incentive to use drugs that will likely deliver more value to their employees.
For example, members of the Health Transformation Alliance—a newly formed consortium of 38 large employers—have formed a first-of-its-kind arrangement with two PBMs. It allows Alliance members to have a seat at the table during deliberations on formulary placement. Companies will be able to customize their benefit plans and choose to include drugs the PBM may have excluded.86 This arrangement means that employers will be able to create formularies based on evidence from their claims data and tailored to their employees’ needs, ensuring greater value for every dollar spent.
Focus more on provider arrangements to tackle price. Facing limitations to how much they can share costs with employees, employers may want to focus on supply-side management, or how they work with providers, to keep prices down. One potential strategy is using products with more limited networks of providers to deliver high-quality care at affordable prices. According to the 2017 PwC Health and Well-being Touchstone Survey, 8 percent
What this means for your business
of employers are already using a performance-based network, and 30 percent are considering it for the future.
Another potential strategy is to contract directly with specific providers for high-cost or high-risk procedures such as joint replacements, back surgery, transplants, bariatric surgery and cancer care. Direct contracting could be done through centers of excellence, which establish the best care sites for specific conditions, or bundled healthcare payments. Employers could partner with new entrants who are bridging the gap between employers and providers.
One example is San Francisco-based Carrum Health, which has created a comprehensive bundled payment solution that connects employers to regional healthcare providers, identifies top-performing providers, manages those providers, and engages employees to use their services. The company’s customers have seen cost savings of at least 40 percent for knee and hip replacement, cervical spinal fusion, lumbar spinal fusion and coronary bypass episodes.87
Both strategies present challenges. For one thing, healthcare markets differ widely in provider concentration and competition, which affect employers’ negotiating power. For another, employees may be reluctant to have their provider choice limited. If that’s the case, employers could educate employees on the trade-offs between provider choice and cost, and give workers incentives to use selected providers by offering lower premiums or waiving co-payments.88

22 Medical cost trend: Behind the numbers 2018
Healthcare providers
As general inflation and wages rise, healthcare providers are feeling the strain of their labor-intensive cost structure. They should consider their practice models and how to best use physician extenders and nonclinical staff to keep costs down and optimize patient care. Providers also should seize opportunities to take on more risk and work with employers directly. Focusing on better engaging patients, improving care management and delivering services more cost-effectively could be winning strategies to better demonstrate their value.
Things to consider
Assess skills mix. As labor costs continue to account for over half of providers’ budgets, providers should consider how to make the most of their staff’s skills and productivity.89 All staff should be practicing to the top of their license. Within care teams, each member should perform duties that use the full extent of their education and training instead of doing tasks that someone with less training could do. For example, a medical assistant—rather than a nurse—can show patients to rooms and check their vitals. Such measures can yield higher patient flow and satisfaction. Providers also should consider investing in technologies that improve staff productivity.
Look for new opportunities to manage drug costs. Rising drug costs have been just as problematic for providers as for employers, insurers and consumers, particularly as they shift to value-based payment models and take on greater responsibility for managing the total cost of care.90 Historically, however, providers have remained on the sidelines of discourse over this issue. However, as political and public scrutiny of drug pricing grows, providers should consider allying themselves with health insurers, patient advocacy organizations and the government to work with drug companies on pricing models the market can bear that would hold price hikes in check. Doing so might also help providers keep their own costs down.
In the near term, providers should determine if they are eligible for cost reductions through the Health Resources and Services Administration’s 340b Drug Discount program, which supplies discounted outpatient drugs to government-funded hospitals, health systems and clinics serving low-income patients. Those already participating in the program should confirm that they meet the requirements for participation—and have the documentation to prove it—in the event of an audit. Another option some providers are taking is launching their own specialty pharmacies. That helps them curb drug costs by closely overseeing appropriate drug use through clinical protocols, formularies and inventory management.91
Demonstrate value to employers. Employers’ interest in working directly with providers is growing, so providers should seize the opportunity to participate in pay-for-performance models. An HRI analysis found that providers may be more prepared than they realize to have their reimbursements based on quality outcomes.92 Providers that can guarantee prices and outcomes early can establish relationships with employers ahead of competitors. Strong actuarial capabilities can measure costs and performance accurately, and strong leadership in setting priorities can accelerate change.
Invest in care management. Providers looking to trim costs often have taken aim at nonclinical staff such as case managers and social workers. But these employees can be critical to keeping costs down, and providers should consider doubling down on them. Employers and health insurers are demanding greater care coordination, and case managers provide that. They also can prevent costly, avoidable readmissions. Unit-based pharmacists, who work directly with clinicians to recommend therapies and dosage, can manage overall drug spending. All of these measures help providers with their bottom lines, while simultaneously becoming more patient-centric.

23 Medical cost trend: Behind the numbers 2018
Health insurers
Health insurers are under pressure from employers to reduce costs. In some instances, employers are opting to stop working with them altogether.93 Insurers need to prove their value to employers by supporting closer management of high-risk patients, steering patients to the most effective treatments and pushing for greater pricing transparency.
Things to consider Look for ways to automate processes. Health insurers have made some investments in technology, but their costs are still heavily driven by an increasingly expensive labor force. Automation can help. Advanced analytics and cloud-based technologies can automate call center processes, and robotics can increase the adjudication rate in claims processing.94 If health insurers can reduce their costs with technology, they can pass their savings on to employers through lower premiums.
Consider alternative therapies. Health insurers are facing less opportunity to shift branded, small-molecule drug purchases to cost-saving generics. Instead, they should consider incentives to persuade patients to engage in alternative methods—such as lifestyle management—to manage chronic conditions without costly drugs.95 For instance, some plans have tied financial incentives such as gift cards and premium reductions to progress on such measures as blood pressure or body mass index.
Others are prioritizing access to counseling and other behavioral health treatment to better address comorbidities that can exasperate chronic conditions. And as more branded biologics come off patent,
insurers should explore building less costly biosimilars into their plans, even if they may not offer as much savings as traditional generics.
Explore value-based purchasing with biopharmaceutical companies. According to a survey of health insurance executives conducted by HRI, less than 20 percent of health insurers are using risk-sharing agreements, outcomes-based payments or bundled payments with biopharmaceuticals.96 Such value-based purchasing models could help employers and health insurers see a return on their investments.
As drug companies face greater scrutiny of their prices, they may be more interested in these arrangements, and health insurers may have more negotiating leverage.97 However, some challenges remain with these models. Identifying measures that accurately evaluate value can be difficult for certain conditions, as can collecting the necessary data to assess performance.
Take ownership of collaborating with pharmaceutical companies and providers to manage high-risk patients. Health insurers should work more closely with providers and pharmaceutical companies to identify high-risk patients and make sure they are adhering to their treatment. This can be accomplished by placing those patients in programs that use such methods as check-in calls from nurses, in-home social worker visits and email reminders from physicians. Since health insurers own a large volume of patient data, they are equipped to be the driving force pushing for better patient adherence.
Be providers’ partner in reducing medical costs. Eighty-five percent of health insurers’ costs—which are ultimately passed on to employers—are dependent on providers’ care delivery. Insurers should see themselves as providers’ partners in keeping medical costs down. One way to do this is for insurers to take ownership of consumer engagement by deploying their own care managers, social workers and community health workers to help providers manage patients better. These nonclinical professionals conduct home visits, provide education, schedule appointments, connect patients with resources in the community and monitor adherence to treatment.98 They tackle the roots of health problems by focusing heavily on social determinants that affect health, such as socioeconomic status, education and physical environment. By proactively helping consumers to navigate the healthcare system, health insurers establish themselves as more attractive partners for providers and advocates for consumers, both of which help them to improve care management and ultimately reduce medical costs.
Insurers also can use data and analytics to give providers insights into patients and patient populations so the providers can better anticipate consumers’ needs and engage them before more costly issues arise. Insurers’ data also can accelerate cost transparency initiatives by helping providers to determine their true cost of care. Making this information available to consumers can then help them to shop for care and make more cost-conscious decisions about the services they receive.
24 Medical cost trend: Behind the numbers 2018
Pharmaceutical and life sciences
Facing ever-growing scrutiny, the pharmaceutical industry must focus on demonstrating its products’ value. Increased collaboration with other industry stakeholders and greater transparency on pricing can help companies demonstrate their role in keeping patients healthy and out of high-cost delivery settings.
Things to consider Re-evaluate sales and marketing needs. As the costs of labor and other inputs increase in an expanding economy, pharmaceutical and life sciences companies should re-evaluate their budgets. In addition to clinical outsourcing, companies can consider outsourcing nonclinical operations, including sales, marketing and manufacturing. Keeping operational costs down could leave companies with savings they can reinvest in strategic initiatives to accelerate growth.
Model drug pricing policy impacts. Increased attention and inquiries into drug pricing strategies by the government could result in far greater transparency, with drug firms forced to make corporate documents and financial information public.99 From 2015 to 2017, over 20 states introduced legislation that would require companies to make disclosures about drug pricing and costs.100 Because of these developments, drug companies should proactively model various drug pricing policy impacts so they can give clear justifications for pricing decisions from the perspective of different customers.
Collaborate on pricing decisions upfront. The pressure to provide more transparency into pricing has led some drug companies to collaborate with PBMs and third-party drug value assessors such as the Institute for Clinical and Economic Review to set prices before launch. These efforts helped avoid public backlash.101 If buyers can work behind the scenes on a particular pricing strategy, they will put up less resistance to new products that hit the market. Also, if buyers have advance knowledge about treatments coming to market, they can budget for them accordingly.
Educate providers on personalized medicine’s benefits. As the price of genetic testing has come down and genetic information has become more useful in the last decade, opportunities are growing for personalized medicine to improve patient outcomes and save money in the long run by helping providers pinpoint the right treatment up front.102 But a majority of today’s front line doctors don’t have a genetics background or the tools needed to take full advantage of precision medicine’s power.
Pharmaceutical, life sciences and medical device companies should educate physicians on the latest genetic technology’s benefits and its potential to eliminate costs from ineffective treatments. Indications exist to suggest they will likely have a receptive audience. In fall 2017, Inova Health System in Virginia will start training employees in genetics and pharmacogenomics to fill the demand for genetic experts at its new Center for Personalized Health campus.103 And Stanford Medicine has teamed with Google Genomics to launch a new Clinical Genomics Service, aiming to make genetic testing a routine part of care.104

25 Medical cost trend: Behind the numbers 2018
Notes
17. “Other” includes miscellaneous other items and services such as durable medical equipment, prosthetics, medical supplies, ambulance and home health. Numbers may not add due to rounding.
18. General inflation, which is highlighted as a primary inflator for 2018, is also a perennial “usual suspect” in the economywide category.
19. Alliance for Health Reform, “Cost Drivers in Health Care,” http://www.allhealth.org/wp-content/uploads/2017/03/Cost_Drivers_in_Health_Care_109.pdf.
20. US Census Bureau, “Income and Poverty in the United States: 2015,” Sept. 2016, https://www.census.gov/data/tables/2016/demo/income-poverty/p60-256.html. The growth in healthcare spending tends to increase with respect to income but with an average lag of more than two years. PwC Health Research Institute, “Medical Cost Trend: Behind the Numbers 2015,” June 2014, https://www.pwc.com/us/en/health-industries/top-health-industry-issues/assets/pwc-hri-medical-cost-trend-2015.pdf.
21. The National Institute for Occupational Safety and Health (NIOSH), “Productive aging and work,” Centers for Disease Control and Prevention, https://www.cdc.gov/niosh/topics/productiveaging/.
22. Bureau of Labor Statistics, https://www.bls.gov/opub/ted/2014/ted_20140124.htm.
23. HRI analyzed Bureau of Labor Statistics data on the distribution of the civilian labor force by age in 2012 versus the BLS projected distribution in 2022. See: Bureau of Labor Statistics, "Share of labor force projected to rise for people age 55 and over and fall for younger age groups," Jan. 24, 2014, https://www.bls.gov/opub/ted/2014/ted_20140124.htm. HRI used the Medical Expenditure Panel Survey to determine 2012 per capita healthcare costs by age for individuals with employer sponsored health insurance for the full year. Holding per capita healthcare costs by age constant, the aging of the civilian labor force by 2022 will increase health care expenditures per capita by 0.4 percent.
24. Klea D. Bertakis and Rahman Azari, “The influence of obesity, alcohol abuse and smoking on utilization of health care services,” Health Services Research, Vol. 38, No. 6, June 2006, https://www.stfm.org/fmhub/fm2006/June/Klea427.pdf.
25. Department of Health and Human Services, “The Opioid Epidemic: By the Numbers,” June 2016, https://www.hhs.gov/sites/default/files/Factsheet-opioids-061516.pdf. National Center for Health Statistics, “Obesity and Overweight,” Centers for Disease Control and Prevention, https://www.cdc.gov/nchs/fastats/obesity-overweight.htm.
26. Medical Device Technology magazine, “Report: Medical Device Company R&D Remains Stable,” June 1, 2016, https://www.mdtmag.com/news/2016/06/report-medical-device-company-r-d-remains-stable.
27. Girod, Christopher S., Weltz, Scott A., Hart, Susan K., “2017 Milliman Medical Index”, May 16, 2017, http://us.milliman.com/uploadedFiles/insight/Periodicals/mmi/2017-milliman-medical-index.pdf.
28. PwC Health Research Institute, “Medical Cost Trend: Behind the Numbers 2016,” June 2015, http://pwchealth.com/cgi-local/hregister.cgi/reg/pwc-hri-medical-cost-trend-2016.pdf.
29. Alyssa Rege, “3 healthcare M&A predictions for 2017”, Becker’s Hospital Review, Dec. 16, 2016, http://www.beckershospitalreview.com/hospital-transactions-and-valuation/3-healthcare-m-a-predictions-for-2017.html
30. Paul B. Ginsberg, “Health care market consolidations: Impacts on costs, quality and access,” Brookings Institute, March 16, 2016, https://www.brookings.edu/testimonies/health-care-market-consolidations-impacts-on-costs-quality-and-access/.
31. Pennsylvania Coalition of Nurse Practitioners, “Five New Studies: Nurse Practitioners Expand Access to Health Care, Lower Costs, Improve Outcomes,” News & Press, March 1, 2016, http://www.pacnp.org/news/277542/Five-New-Studies-Nurse-Practitioners-Expand-Access-to-Health-Care-Lower-Costs-Improve-Outcomes.htm.
1. Kaiser Family Foundation, “2016 Employer Health Benefits Survey,” Sep. 14, 2016, http://kff.org/report-section/ehbs-2016-summary-of-findings/.
2. Josh Zumbrun, “This is Now the Third-Longest Economic Expansion in U.S. History,” Wall Street Journal, March 1, 2017, https://blogs.wsj.com/economics/2017/03/01/this-is-now-the-third-longest-economic-expansion-in-u-s-history/.
3. PwC Health Research Institute analysis of PwC Health and Well-being Touchstone Survey for 2017, Spring 2017.
4. Kaiser Health News, “More companies encourage increased use of generic medications,” June 11, 2009, http://khn.org/morning-breakout/dr00040769/.
5. Kaiser Family Foundation, “2016 Employer Health Benefits Survey,” Sep. 14, 2016, http://kff.org/report-section/ehbs-2016-summary-of-findings/.
6. Bureau of Labor Statistics, “Average Hourly Earnings of Production and Nonsupervisory Employees,” https://data.bls.gov/timeseries/CES0500000008.
7. Sean P. Keehan, Devin A. Stone, John A. Poisal, et al. “National Health Expenditure Projections, 2016-25: Price Increases, Aging Push Sector to 20 Percent of Economy,” Health Affairs 36, No. 3, 2017.
8. Strategy&, “The birth of the healthcare consumer: Growing demands for choice, engagement and experience,” Oct. 2014, https://www.strategyand.pwc.com/media/file/The-birth-of-the-healthcare-consumer.pdf.
9. PwC Health Research Institute Consumer Survey, Spring 2017
10. Urban Institute, “Payment methods and benefit designs: How they work and how they work together to improve health care,” April 2016, http://www.urban.org/sites/default/files/02_high-deductible_health_plans.pdf.
11. Congressional Budget Office, “Federal subsidies for health insurance coverage for people under age 65: 2016 to 2026,” March 24, 2016, https://www.cbo.gov/sites/default/files/114th-congress-2015-2016/reports/51385-healthinsurancebaselineonecol.pdf.
12. PwC Health Research Institute, “Medical cost trend: Behind the Numbers 2017,” June 2016, http://pwchealth.com/cgi-local/hregister.cgi/reg/pwc-hri-medical-cost-trend-2017.pdf.
13. PwC’s Employer Benefit Cost Trend Index is the average of three of the most respected measures of employee benefit costs: 1.) Growth in Average Annual Health Insurance Premiums from the Kaiser/HRET Survey of Employer-Sponsored Health Benefits, 1988-2016. 2.) Growth in Per Enrollee Expenditures for Employer Sponsored Health Insurance from the Centers for Medicare and Medicaid Services, National Health Accounts, Historical NHE Table 21: Expenditures, Enrollment and Per Enrollee Estimates Health Insurance: United States, Calendar Years 1987-2015. (For 2016 growth, see NHE Projections 2016-2025 Table 17: Health Insurance Enrollment and Enrollment Growth Rates, Calendar Years, 2009-2025. 3.) Growth in Employee Cost for Employee Health Insurance from the Bureau of Labor Statistics, 1988-2016.
14. The utilization trend in Figure 4 is estimated as a “residual”—what is left after price is removed from growth in benefit costs. As such it includes other elements that affect spending such as measurement errors in the CPI price component, declining numbers of workers with health benefits and less comprehensive health insurance.
15. PwC Health Research Institute estimates for 2018 are based on medical cost spending data obtained from the 2017 Milliman Medical Index (MMI) and the annual rate of increase in costs by component of medical care from 2016 to 2017. http://us.milliman.com/uploadedFiles/insight/Periodicals/mmi/2017-milliman-medical-index.pdf.
16. PwC Health Research Institute analysis of medical cost spending data obtained from the 2015 Milliman Medical Index (MMI) and the annual rate of increase in costs by component of medical care from 2014 to 2015. http://us.milliman.com/insight/Periodicals/mmi/2015-Milliman-Medical-Index/

26 Medical cost trend: Behind the numbers 2018
32. Despite slower growth in the first quarter of 2017, indicators show that the U.S. economy is in an upswing and is expected to continue solid growth into 2018. US Department of Commerce Bureau of Economic Analysis, “National Income and Product Accounts Gross Domestic Product: First Quarter 2017,” April 28, 2017, https://www.bea.gov/newsreleases/national/gdp/gdpnewsrelease.htm. Nelson Schwartz, “G.D.P report shows U.S. economy off to slow start in 2017,” New York Times, April 28, 2017, https://www.nytimes.com/2017/04/28/business/economy/economy-gross-domestic-product-first-quarter.html.
33. Jeff Cox, “Fed raises rates at March meeting,” CNBC, March 15, 2017, http://www.cnbc.com/2017/03/15/fed-raises-rates-at-march-meeting.html.
34. Bureau of Labor Statistics, “The Employment Situation—April 2017,” May 5, 2017, https://www.bls.gov/news.release/empsit.nr0.htm. Reuters, “Janet Yellen says the US is close to full employment,” Fortune, Jan. 18, 2017, http://fortune.com/2017/01/18/janet-yellen-federal-reserve-full-us-employment/.
35. HRI analysis of historical and projected total per capita personal healthcare costs from the National Health Expenditure Accounts. Historical figures (1970 - 2015) were released in November 2016. Projected figures (2016 - 2018) were released in February 2017. HRI analysis of historical growth in the consumer price index from the Bureau of Labor Statistics (1970 - 2016). HRI analysis of projected growth in the consumer price index for the 2017 and 2018 time period from the National Health Expenditure Accounts (released February 2017).
36. Sean P. Keehan, Devin A. Stone, John A. Poisal, et al. “National Health Expenditure Projections, 2016-25: Price Increases, Aging Push Sector to 20 Percent of Economy,” Health Affairs 36, No. 3, 2017.
37. HRI analysis of historical growth in the consumer price index from the Bureau of Labor Statistics (2010 - 2016). HRI analysis of projected growth in the consumer price index for the 2017 and 2018 time period from the National Health Expenditure Accounts (released February 2017). HRI analysis of wage data from Bureau of Labor Statistics and CBO's Employment Cost Index (Private Wages and Salaries). This represents all private wages and salaries across the economy, not just healthcare. Historical growth in wages from Bureau of Labor Statistics (2010 – 2016). HRI analysis of projected growth in wages for the 2017 and 2018 time period from CBO's January 2017 Budget and Economic Outlook. HRI analysis of hospital inpatient and physician market baskets from CMS Market Basket Index Levels and Four-Quarter Moving Average Percent Changes, https://www.cms.gov/Research-Statistics-Data-and-Systems/Statistics-Trends-and-Reports/MedicareProgramRatesStats/MarketBasketData.html.
38. Paul Fronstin and M. Christopher Roebuck, “The impact of an HSA-eligible health plan on health care services use and spending by worker income,” Employee Benefit Research Institute, Issue Brief No. 425, August 2016, https://www.ebri.org/pdf/briefspdf/EBRI_IB_425.Aug16.HSAs.pdf.
39. PwC Health Research Institute, “Medical Cost Trend: Behind the Numbers 2016,” June 2015, http://pwchealth.com/cgi-local/hregister.cgi/reg/pwc-hri-medical-cost-trend-2016.pdf.
40. Zarek C. Brot-Goldberg, Amitabh Chandra, Benjamin R. Handel, Jonathan T. Kolstad, “What does a deductible do? The impact of cost-sharing on health care prices, quantities, and spending dynamics,” National Bureau of Economic Research, October 2015, http://www.nber.org/papers/w21632.
41. PwC Health Research Institute, “Medical Cost Trend: Behind the Numbers 2014,” June 2013, https://www.pwc.com/us/en/health-industries/behind-the-numbers/assets/medical-cost-trend-behind-the-numbers-2014.pdf.
42. PwC Health Research Institute, “Trump administration health policy agenda: House passes the American Health Care Act,” May 4, 2017, http://www.pwc.com/us/en/health-industries/health-research-institute/assets/pwc-hri-trump-policy-agenda-house-passes-american-health-care-act.pdf.
43. US Food and Drug Administration, “Facts about Generic Drugs,” https://www.fda.gov/drugs/resourcesforyou/consumers/buyingusingmedicinesafely/understandinggenericdrugs/ucm167991.htm#_ftn3.
44. Kaiser Health News, “More companies encourage increased use of generic medications,” June 11, 2009, http://khn.org/morning-breakout/dr00040769/.
45. In 2018, sales revenue associated with branded, small molecule drugs going off patent rebounds to $20.7 billion, an 86.5 percent increase over 2017. However, this is still lower than 2015 when sales revenue for branded drugs with patent expirations was $27.7 billion. In addition, the impact of 2018 patent expirations will be felt mostly in 2019 and beyond. Optum, “2016: a ‘mini-cliff’ for drug patents,” May 6, 2016, https://www.optum.com/resources/library/2016-mini-cliff-for-drug-patents.html.
46. A generic drug’s manufacturer can secure six months of exclusivity by being the first to file an abbreviated new drug application containing a paragraph IV certification. A paragraph IV certification claims that a branded drug’s patent(s) is invalid, unenforceable, or will not be infringed by the manufacture, use, or sale of the new generic drug. See: Federal Drug Administration, "Guidance for Industry 180-Day Exclusivity: Questions and Answers," January 2017, https://www.fda.gov/downloads/Drugs/GuidanceComplianceRegulatoryInformation/Guidances/UCM536725.pdf.
47. IMS Institute for Healthcare Informatics, “Delivering on the potential of biosimilar medicines: The role of functioning competitive markets,” March 2016, http://www.imshealth.com/files/web/IMSH%20Institute/Healthcare%20Briefs/Documents/IMS_Institute_Biosimilar_Brief_March_2016.pdf.
48. Zachary Brennan, "FDA Approves 5th Biosimilar, 2nd for Remicade," Regulatory Affairs Professionals Society, April 21, 2017, http://raps.org/Regulatory-Focus/News/2017/04/21/27390/FDA-Approves-5th-Biosimilar-2nd-for-Remicade/. Pink Sheet, “Biosimilar cost savings in Europe beyond 25% might cull sponsors, EGA warned,” June 8, 2015, https://pink.pharmamedtechbi.com/PS056916/Biosimilar-Cost-Savings-In-Europe-Beyond-25-Might-Cull-Sponsors-EGA-Warned.
49. Food and Drug Administration, “Generic Competition and Drug Prices,” May 13, 2015, https://www.fda.gov/aboutfda/centersoffices/officeofmedicalproductsandtobacco/cder/ucm129385.htm.
50. Andrew Pollack, “Drug goes from $13.50 a tablet to $750, overnight,” New York Times, Sept. 20, 2015, https://www.nytimes.com/2015/09/21/business/a-huge-overnight-increase-in-a-drugs-price-raises-protests.html.
51. “Donald Trump’s News Conference: Full Transcript and Video,” The New York Times, Jan. 11, 2017, https://www.nytimes.com/2017/01/11/us/politics/trump-press-conference-transcript.html.
52. Zachary Tracer and Anna Edney, “Drug stocks plunge as Trump threatens to force price bidding,” Bloomberg Markets, Jan. 11, 2017, https://www.bloomberg.com/news/articles/2017-01-11/drug-stocks-plunge-as-trump-threatens-to-force-price-bidding.
53. “Reviewing the rising price of EpiPens,” Hearing, Full House Committee on Oversight and Government Reform, Sept. 21, 2016, https://oversight.house.gov/hearing/reviewing-rising-price-epipens-2/. “S. 469 – 115th Congress: Affordable and Safe Prescription Drug Importation Act,” Congress.gov, Feb. 28, 2017, https://www.congress.gov/bill/115th-congress/senate-bill/469?q=%7B%22search%22%3A%5B%22Affordable+and+Safe+5+Prescription+Drug+Importation+Act%22%5D%7D&r=3.

27 Medical cost trend: Behind the numbers 2018
54. PRNewswire, “Mylan Launches the First Generic for EpiPen Auto-Injector as an Authorized Generic,” Dec. 16, 2016, http://newsroom.mylan.com/2016-12-16-Mylan-Launches-the-First-Generic-for-EpiPen-epinephrine-injection-USP-Auto-Injector-as-an-Authorized-Generic.
55. Lisa Schencker, “Marathon sheds $89,000 muscular dystrophy drug after pricing uproar,” Chicago Tribune, March 16, 2017, http://www.chicagotribune.com/business/ct-marathon-sells-89000-drug-0317-biz-20170316-story.html.
56. Jared Hopkins and Cristin Flanagan, “Pharma lobby ousts 22 drugmakers amid U.S. pricing debate,” Bloomberg, May 9, 2017, https://www.bloomberg.com/news/articles/2017-05-09/pharma-lobby-ousts-22-drugmakers-amid-u-s-pricing-debate.
57. Allergan, “Our Social Contract with Patients,” CEO Blog, Sept. 6, 2016, https://www.allergan.com/news/ceo-blog/september-2016/our-social-contract-with-patients.
58. Novo Nordisk, “Our Position on Pricing and Affordability,” http://www.novonordisk-us.com/whoweare/about-novo-nordisk/our-position-on-pricing-and-affordability.html. Bill Berkrot, “AbbVie vows to keep drug price increases below 10 percent,” Reuters, Jan. 11, 2017, http://www.reuters.com/article/us-abbvie-pharmaceuticals-prices-idUSKBN14V2FK.
59. Jacob S.Hacker, “The Road to Nowhere: The Genesis of President Clinton’s Plan for Health Security,” Princeton University Press, January 1997, http://www.nytimes.com/books/first/h/hacker-nowhere.html.
60. Milt Freudenheim, “Clinton’s Health Plan; Drug Companies Feeling Pressure of Clinton’s Plan to Keep Their Prices Down,” New York Times, Sept. 30, 1993, http://www.nytimes.com/1993/09/30/us/clinton-s-health-plan-drug-companies-feeling-pressure-clinton-s-plan-keep-their.html?pagewanted=all.
61. Sara Ellison and Catherine Wolfram, “Coordinating on lower prices: pharmaceutical pricing under political pressure,” RAND Journal of Economics, Vol. 37, No. 2, Summer 2006, https://www.jstor.org/stable/25046244?seq=14#page_scan_tab_contents.
62. Sara Ellison and Catherine Wolfram, “Coordinating on lower prices: pharmaceutical pricing under political pressure,” RAND Journal of Economics, Vol. 37, No. 2, Summer 2006, https://www.jstor.org/stable/25046244?seq=14#page_scan_tab_contents.
63. US market share of top 10 pharmaceutical companies based on PwC Health Research Institute analysis of EvaluatePharma data.
64. According to a survey conducted by the Midwest Business Group on Health, managing specialty drugs has moved to the No. 1 health benefit priority for employers for 2017 and 2018 with 63% of employers indicating it’s a top priority—up from No. 3 last year. Midwest Business Group on Health, “Managing specialty drugs and employee engagement are of greatest concern to employers in 2017,” Nov. 29, 2016, https://www.mbgh.org/blogs/mbgh-information/2016/12/09/managing-specialty-drugs-and-employee-engagement-are-of-greatest-concern-to-employers-in-2017?CommunityKey=35b5b617-72ae-4da3-b166-3ca44628b60b&tab=.
65. Darla Dernovsek, “Specialty Medication Tools and Tactics for Employers,” The Alliance, March 19, 2015, http://www.the-alliance.org/Blog/Specialty_Medication_Tools___Tactics_for_Employers/.
66. Mara G. Aspinall and Richard G. Hamermesh, “Realizing the Promise of Personalized Medicine,” Harvard Business Review, https://hbr.org/2007/10/realizing-the-promise-of-personalized-medicine.
67. Joseph Walker, “Alliance of Companies Unveil First Steps Aimed at Cutting Health-Care Costs,” Wall Street Journal, March 6, 2017, https://www.specialtyrxtoolkit.org/sites/www.specialtyrxtoolkit.org/files/assets/Ind%20News%20Article%200317.pdf.
68. Evan Sweeney, “Inova Health System bets big on precision medicine,” FierceHealthcare, Feb. 28, 2017, http://www.fiercehealthcare.com/analytics/inova-health-system-bets-big-precision-medicine.
69. Suzanne Delbanco and Andrea Elizabeth Caballero, “The payment reform landscape: For employers, keep pushing ahead,” Health Affairs, April 21, 2017, http://healthaffairs.org/blog/2017/04/21/the-payment-reform-landscape-for-employers-keep-pushing-ahead/.
70. Benjamin Sien, “Infused Therapies: Cost Savings Benefits Through Home Infusion,” Specialty Pharmacy Times, Feb. 2014, https://www.specialtypharmacytimes.com/publications/specialty-pharmacy-times/2014/february-2014/infused-therapies-cost-savings-benefits-through-home-infusion.
71. Brenda Wright, “The growing home infusion industry,” HomeCare, November 2016, http://www.homecaremag.com/operations-strategies/november-2016/growing-home-infusion-industry.
72. About 20 to 30 percent of new prescriptions are never filled at the pharmacy, and medication is not taken as prescribed approximately half the time. Such non-adherence is estimated to cause approximately 125,000 deaths per year and cost the healthcare system $100 billion to $290 billion annually. Food and Drug Administration, “Why you need to take your medications as prescribed or instructed,” Feb. 16, 2016, https://www.fda.gov/drugs/resourcesforyou/specialfeatures/ucm485545.htm. Lisa Rosenbaum and William Shrank, “Taking our medicine—Improving adherence in the accountability era,” New England Journal of Medicine, Aug. 23, 2013, http://www.nejm.org/doi/pdf/10.1056/NEJMp1307084.
73. Conn Hastings, “The Mabu Personal Healthcare Companion: Interview with Dr. Cory Kidd, Founder & CEO of Catalia Health,” Medgadget.com, March 30, 2017, https://www.medgadget.com/2017/03/mabu-personal-healthcare-companion-interview-dr-cory-kidd-founder-ceo-catalia-health.html.
74. PwC Health Research Institute analysis of PwC Health and Well-being Touchstone Survey for 2017, Spring 2017.
75. PwC Health Research Institute, “Health reform 2.0: A guide to developing resilience amid an uncertain future for the Affordable Care Act,” April 2017, https://www.pwc.com/us/en/health-industries/health-research-institute/publications/assets/us-hri-health-reform-2.0.pdf.
76. “H.R. 1628, American Health Care Act of 2017,” 115th Congress (2017-2018), https://www.congress.gov/bill/115th-congress/house-bill/1628/text.
77. Patricia Cohen, “Jobless Rate at 10-Year Low as Hiring Grows and Wages Rise,” New York Times, May 5, 2017, https://www.nytimes.com/2017/05/05/business/economy/jobs-report-unemployment.html.
78. PwC Health Research Institute analysis of PwC Health and Well-being Touchstone Survey for 2017, Spring 2017.
79. Bob Herman, “Hospitals have a labor problem,” Axios, March 20, 2017, https://www.axios.com/hospitals-have-a-labor-problem-2318410045.html.
80. Leighton Ku, Erika Steinmetz, Erin Brantley and Brian Bruen, “The Economic and Employment Consequences of Repealing Federal Health Reform: A 50 State Analysis,” Milken Institute of Public Health, January 5, 2017, https://publichealth.gwu.edu/sites/default/files/downloads/HPM/Repealing_Federal_Health_Reform.pdf.
81. Melissa Healy, “Four things Americans should know about Dr. Scott Gottlieb, the new head of the FDA”, Los Angeles Times, May 10, 2017, http://www.latimes.com/science/sciencenow/la-sci-sn-scott-gottlieb-fda-20170510-htmlstory.html.
82. PwC Health Research Institute, “Health reform 2.0: A guide to developing resilience amid an uncertain future for the Affordable Care Act,” April 2017, https://www.pwc.com/us/en/health-industries/health-research-institute/publications/assets/us-hri-health-reform-2.0.pdf.

28 Medical cost trend: Behind the numbers 2018
83. PwC Washington National Tax Services, “What you need to know about tax reform,” http://www.pwc.com/us/en/washington-national-tax/us-tax-reform.html.
84. PwC Health Research Institute, “Health reform 2.0: A guide to developing resilience amid an uncertain future for the Affordable Care Act,” April 2017, https://www.pwc.com/us/en/health-industries/health-research-institute/publications/assets/us-hri-health-reform-2.0.pdf.
85. Kaiser Family Foundation, “2016 Employer Health Benefits Survey,” Sep. 14, 2016, http://kff.org/report-section/ehbs-2016-summary-of-findings/. Bureau of Labor Statistics, “Average Hourly Earnings of Production and Nonsupervisory Employees,” https://data.bls.gov/timeseries/CES0500000008.
86. Pharmaceutical Commerce, “Health Transformation Alliance sets its 2017 agenda,” April 4, 2017, http://pharmaceuticalcommerce.com/business-and-finance/health-transformation-alliance-sets-2017-agenda/.
87. Carrum Health Results: https://www.carrumhealth.com/#results.
88. Midwest Business Group on Health, “Employers ready to implement new payment approaches and high performance networks to reduce health costs and improve outcomes,” Aug. 2, 2016, https://www.mbgh.org/blogs/mbgh-information/2016/12/09/employers-ready-to-implement-new-payment-approaches-and-high-performance-networks-to-reduce-health-costs-and-improve-outcomes?CommunityKey=35b5b617-72ae-4da3-b166-3ca44628b60b&tab=.
89. Bob Herman, “10 Statistics on Hospital Labor Costs as a Percentage of Operating Revenue”, Becker’s Hospital Review, December 10, 2013, http://www.beckershospitalreview.com/finance/10-statistics-on-hospital-labor-costs-as-a-percentage-of-operating-revenue.html.
90. Ed Silverman, “Rising drug prices are making hospitals feel ill,” STAT News, Oct. 11, 2016, https://www.statnews.com/pharmalot/2016/10/11/hospitals-drug-prices/.
91. Melanie Evans, “Hospitals launch specialty pharmacies to curb drug costs,” Modern Healthcare, Dec. 12, 2015, http://www.modernhealthcare.com/article/20151212/MAGAZINE/312129963.
92. PwC Health Research Institute, “Top health industry issues of 2017: A year of uncertainty and opportunity,” Dec. 2016, https://www.pwc.com/us/en/health-industries/pdf/pwc-hri-top-healthcare-issues-2017.pdf.
93. PwC Health Research Institute, “The health insurer of the future: Consumers’ advocate, providers’ partner,” March 2017, https://www.pwc.com/us/en/health-industries/health-research-institute/publications/pdf/pwc-hri-payer-of-the-future.pdf.
94. Rod Dunlap, “Robotic Process Automation: A Better Way to Boost Auto-Adjudication Rates,” HFMA, June 6, 2016, https://www.hfma.org/Content.aspx?id=48424.
95. Katie Thomas, "Companies get strict on health of workers,” New York Times, March 25, 2013, http://www.nytimes.com/2013/03/26/business/companies-offer-workers-more-incentives-for-health-changes.html.
96. PwC Health Research Institute, Health insurance executive survey, 2016-2017.
97. Rachel Sachs, Nicholas Bagley and Darius Lakdawalla, “Value-based pricing for pharmaceuticals in the Trump administration,” Health Affairs, April 27, 2017, http://healthaffairs.org/blog/2017/04/27/value-based-pricing-for-pharmaceuticals-in-the-trump-administration/.
98. PwC Health Research Institute, “The health insurer of the future: Consumers’ advocates, providers’ partners,” March 2017, https://www.pwc.com/us/en/health-industries/health-research-institute/publications/pdf/pwc-hri-payer-of-the-future.pdf.
99. United States Senate Committee on Finance, “Wyden-Grassley Sovaldi Investigation Finds Revenue-Driven Pricing Strategy Behind $84,000 Hepatitis Drug,” Dec. 1, 2015, https://www.finance.senate.gov/ranking-members-news/wyden-grassley-sovaldi-investigation-finds-revenue-driven-pricing-strategy-behind-84-000-hepatitis-drug.
100. National Conference of State Legislatures, “2015-2017 State Legislation on Prescription Drugs”, April 10, 2017, http://www.ncsl.org/research/health/prescription-drug-statenet-database.aspx.
101. Ed Silverman, “How a $37,000-a-year medicine sets a good model for drug pricing,” STAT News, April 3, 2017, https://www.statnews.com/2017/04/03/regeneron-drug-price-model/.
102. Evan Sweeney, “Inova Health System bets big on precision medicine,” FierceHealthcare, Feb. 28, 2017, http://www.fiercehealthcare.com/analytics/inova-health-system-bets-big-precision-medicine.
103. Gienna Shaw, “Help wanted Inova Health System expands training to build a precision medicine workforce,” Fierce Healthcare, April 11, 2017, http://www.fiercehealthcare.com/it/inova-health-precision-medicine-health-information-technology-job-openings.
104. Stanford Medicine, “Stanford Medicine, Google team up to harness power of data science for health care,” News Center, Aug. 8, 2016, http://med.stanford.edu/news/all-news/2016/08/stanford-medicine-google-team-up-to-harness-power-of-data-science.html.

29 Medical cost trend: Behind the numbers 2018
Acknowledgments
Brian MarcottePresident and CEONational Business Group on Health
Charles Roehrig, PhDFounding Director, Center for Sustainable Health Spending, Institute FellowAltarum Institute
Paul Hughes-CromwickCo-director, Center for Sustainable Health SpendingAltarum Institute
Ani TurnerCo-director, Center for Sustainable Health SpendingAltarum Institute
Micah WeinbergPresidentBay Area Council Economic Institute
Greg MaloneActuarial Senior DirectorCigna
Brian MackintoshChief ActuaryNeighborhood Health Plan
Larry BoressPresident and CEOMidwest Business Group on Health
Jim KohanSenior Vice President and Chief ActuaryExcellus BlueCross BlueShield
John SivoriPresidentHealthNet Pharmaceutical Services
Mick DiedeChief ActuaryKaiser Permanente
Dan RachfalskiSenior Vice President and Chief ActuaryHarvard Pilgrim Health Care
Michele CusackSenior Vice President, FinanceNorthwell Health
Mary R. GrealyPresidentHealthcare Leadership Council
Dan Polsky, PhDExecutive DirectorUniversity of Pennsylvania, Leonard Davis Institute of Health Economics
John PoisalDeputy Director, National Health Statistics GroupOffice of the ActuaryCenters for Medicare and Medicaid Services
Sean KeehanEconomist, National Health Statistics GroupOffice of the ActuaryCenters for Medicare and Medicaid Services
Michael ThompsonPresident and CEONational Alliance of Healthcare Purchaser Coalitions
Steve SellPresident, Western RegionHealthNet
Amy YaoSenior Vice President and Chief ActuaryBlue Shield California
John BertkoChief ActuaryCovered California
Opoku ArchampongActuarial DirectorGeisinger Health Plan
John StensonVice President and Chief ActuaryAetna
Steve WhitcraftDirector of Healthcare Turner Construction Company
David LanskyPresident and CEOPacific Business Group on Health
30 Medical cost trend: Behind the numbers 2018
About this researchEach year, PwC’s Health Research Institute (HRI) projects the growth of private medical costs in the coming year and identifies the leading trend drivers. Insurance companies use medical cost trend to help set premiums by estimating what the same health plan this year will cost next year. In turn, employers use the information to make adjustments in benefit plan design to help offset cost increases. The report identifies and explains what it refers to as “inflators” and “deflators” to describe why and how the healthcare spending growth rate is affected.
This forward-looking report is based on the best available information through May 2017. HRI conducted interviews in February, March and April 2017 with 12 health plan executives (whose companies cover more than 100 million people) about their estimates for 2018 and the factors driving those trends. Findings from PwC’s 2017 Health and Well-being Touchstone Survey of more than 780 employers from 37 industries, and PwC’s national consumer survey of more than 1,000 US adults also are included. HRI also examined government data sources, journal articles and conference proceedings in determining the 2018 growth rate.
Behind the Numbers 2018 is HRI’s twelfth report in this series.
About Health Research Institute
PwC’s HRI provides new intelligence, perspectives and analysis on trends affecting all health-related industries. HRI helps executive decision-makers navigate change through primary research and collaborative exchange. Our views are shaped by a network of professionals with executive and day-to-day experience in the health industry. HRI research is independent and not sponsored by businesses, government or other institutions.
About PwCPwC US helps organizations and individuals create the value they’re looking for. Our 208,000 people are committed to delivering quality in assurance, tax and advisory services. Tell us what matters to you and find out more by visiting us at www.pwc.com/us.

31 Medical cost trend: Behind the numbers 2018
Other ContributorsDavid Atkinson, Lesley Bakker, Ron Barlow, Igor Belokrinitsky, Meredith Berger, Amy Bergner, Fabian Caceres, Joyjit Choudhury, Rob Franco, Jeff Gitlin, Barbara Gniewek, Jay Godla, John Grossomanides, Ken Hardy, Sandra Hunt, Karen LaChiana, Mike Longacre, Emily Medina, Barb Page, Parwen Parhat, Mary Ross, Dinkar Saran, Hindy Shaman, Sundar Subramanian, Will Suvari, Penny Timmerman, Paul Veronneau, Brian Williams
PwC Health Research Institute
Alexander GaffneySenior [email protected] Laura McLaughlinSenior [email protected]
Rebecca MurphyResearch [email protected]
Jack Rodgers, PhD Managing Director, Health Policy Economics [email protected]
Kristen Bernie Manager, Health Policy Economics [email protected]
HRI Advisory Team
Rick [email protected]
Kulleni [email protected]
Jim PrutowPrincipaljim.prutow @pwc.com
Jinn-Feng [email protected]
Mark St. [email protected]
Kelly Barnes Partner US Health Industries and Global Health Industries Consulting [email protected]
Benjamin Isgur Health Research Institute [email protected]
Trine Tsouderos Director [email protected]
Sarah [email protected]
Ben ComerSenior [email protected]
© 2017 PwC. All rights reserved. PwC refers to the US member firm or one of its subsidiaries or affiliates, and may sometimes refer to the PwC network. Each member firm is a separate legal entity. Please see www.pwc.com/structure for further details. This content is for general information purposes only, and should not be used as a substitute for consultation with professional advisors. 329528-2017.
www.pwc.com/us/medicalcosttrendswww.pwc.com/us/healthindustrieswww.pwc.com/hritwitter.com/PwCHealth
To have a deeper conversation about how this subject may affect your business, please contact:
Kelly BarnesPartner, US Health Industries and Global Health Industries Consulting [email protected] 754 5172
Rick JudyPrincipal [email protected] 498 5218
Benjamin Isgur Health Research Institute [email protected] 214 754 5091