medium-range hydrometeorological forecasts of the big wood basin in 2006 (plus a look forward at...
Post on 19-Dec-2015
213 views
TRANSCRIPT

Medium-range Hydrometeorological Forecasts Medium-range Hydrometeorological Forecasts of the Big Wood Basin in 2006of the Big Wood Basin in 2006
(plus a look forward at 2007…)(plus a look forward at 2007…)
A Project for the Pacific Northwest Regional Collaboratory

Contributors
University of Idaho, Dept. of Geography:
Troy R. Blandford, M.S. in 2006Brian J. Harshburger, PhD Candidate Karen S. Humes, Associate ProfessorBrandon C. Moore, M.S. in 2006Von P. Walden, Associate Professor
Idaho National Laboratory (INL):
Ryan Hruska, Senior Engineer/Scientist

Snowmelt Runoff Model
• SRM is a semi-distributed, temperature index (degree-day) model designed to simulate and forecast streamflow in snowmelt-dominated (mountainous) basins.
– Model inputs: • Current temperature and precipitation from SNOTEL sites
• Snow-covered Area– Derived from MODIS images
» INL (Ryan Hruska)
» NSIDC (Tom Painter)
• Forecasted Temperatures– Medium-range, 15-day from NCEP GFS (downscaled to SNOTEL sites)
– Short-range, 7-day from NDFD (4 day - precipitation)
– Temporal resolution: daily

Downscaling of Met Forecasts
• Example of downscaling of four NCEP Global Forecasting System (GFS) grid points (large yellow dots) to individual SNOTEL station locations (small black dots)
Clark and Hay, (2004)

Errors in NCEP and NDFD Temperatures
Moore et al., 2006

SRM Enhancements
• The use of both maximum and minimum critical temperatures (Tcritmax and Tcritmin) to partition precipitation into rain, snow, and rain/snow mixed.
– model currently uses a single critical temperature value
• The use of an antecedent temperature index (ATI) method to track snowpack cold-content and account for the delay in melt associated with diurnal refreezing.
– used to determine when the snowpack is ripe
– also to determine when the rain falling on the snowpack should contribute to the runoff

SRM Enhancements
15 DayDownscaled Temperature Forecasts
(Tmax, Tmin)Global Forecasting System
NCEP
Enhanced version of SRM
15 DayDownscaled Precipitation Forecasts
Global Forecasting System NCEP
Observed Temperature(Tmax, Tmin)
SNOTEL, NRCSObtained 1 day after measured
Observed Precipitation SNOTEL, NRCS
Obtained 1 day after measured
Observed Streamflow USGS
Obtained 1 day after measured
Forecasted Inputs
Model Updating(Day n-1)
Model Parameters(Retrospective Analysis)
Snow Depth and SWE observations SNOTEL, NRCS
(monitor degree-day factors)
Snow-covered Area (SCA)(Obtained from
snow depletion curves)
Ensemble StreamflowForecasts
Schaake Shuffle(reorder the ensembles)
Ensemble Streamflow Forecasts

Study Area for 2006
Big Wood River Basin
Stream Gauge: Hailey, ID
Contributing Area: 1,625 km2
Elevation Range: 250-3,630 m
location of SNOTEL sites

March 1 April 1 May 1 June 1 July 1 July 310
10
20
30
40
50
60
Date
Str
eam
flow
(cm
s)
Retrospective Model SimulationLeadtime 1
2002
Measured Discharge
Forecasted Discharge
Retrospective Forecast Results (2002)
0.00
0.10
0.20
0.30
0.40
0.50
0.60
0.70
0.80
0.90
1.00
1 2 3 4 5 6 7 8 9 10 11 12 13 14 15
Forecast lead time (days)
Co
effi
cie
nt o
f De
term
ina
tion
0.000.501.001.502.002.503.003.504.004.505.005.506.00
1 2 3 4 5 6 7 8 9 10 11 12 13 14 15
Forecast lead time (days)
Me
an
Ab
solu
te E
rro
r (c
ms)
-6.00-5.00-4.00-3.00-2.00-1.000.001.002.003.004.005.006.00
1 2 3 4 5 6 7 8 9 10 11 12 13 14 15
Forecast lead time (days)
Me
an
Bia
s E
rro
r (c
ms)
March 1 April 1 May 1 June 1 July 1 July 310
10
20
30
40
50
60
Date
Str
eam
flow
(cm
s)
Retrospective Model SimulationLeadtime 15
2002
Measured Discharge
Forecasted Discharge
March 1 April 1 May 1 June 1 July 1 July 310
10
20
30
40
50
60
Date
Str
eam
flow
(cm
s)
Retrospective Model SimulationLeadtime 7
2002
Measured Discharge
Forecasted Discharge
March 1 April 1 May 1 June 1 July 1 July 310
10
20
30
40
50
60
Date
Str
eam
flow
(cm
s)
Retrospective Model SimulationLeadtime 4
2002
Measured Discharge
Forecasted Discharge
Coefficient of Determination (R2)
Mean Bias Error (cms)Mean Absolute Error (cms)

Retrospective Forecast Results (2003)
0.00
0.10
0.20
0.30
0.40
0.50
0.60
0.70
0.80
0.90
1.00
1 2 3 4 5 6 7 8 9 10 11 12 13 14 15
Forecast lead time (days)
Co
effi
cie
nt o
f De
term
ina
tion
0.000.501.001.502.002.503.003.504.004.505.005.506.00
1 2 3 4 5 6 7 8 9 10 11 12 13 14 15
Forecast lead time (days)
Me
an
Ab
solu
te E
rro
r (c
ms)
-6.00-5.00-4.00-3.00-2.00-1.000.001.002.003.004.005.006.00
1 2 3 4 5 6 7 8 9 10 11 12 13 14 15
Forecast lead time (days)
Me
an
Bia
s E
rro
r (c
ms)
March 1 April 1 May 1 June 1 July 1 July 310
20
40
60
80
100
120
Date
Str
eam
flow
(cm
s)
Retrospective Model SimulationLeadtime 1
2003
Measured Discharge
Forecasted Discharge
March 1 April 1 May 1 June 1 July 1 July 310
20
40
60
80
100
120
Date
Str
eam
flow
(cm
s)
Retrospective Model SimulationLeadtime 15
2003
Measured Discharge
Forecasted Discharge
March 1 April 1 May 1 June 1 July 1 July 310
20
40
60
80
100
120
Date
Str
eam
flow
(cm
s)
Retrospective Model SimulationLeadtime 7
2003
Measured Discharge
Forecasted Discharge
March 1 April 1 May 1 June 1 July 1 July 310
20
40
60
80
100
120
Date
Str
eam
flow
(cm
s)
Retrospective Model SimulationLeadtime 4
2003
Measured Discharge
Forecasted Discharge
Coefficient of Determination (R2)
Mean Bias Error (cm)Mean Absolute Error (cm)

Retrospective Forecast Results (2004)
0.00
0.10
0.20
0.30
0.40
0.50
0.60
0.70
0.80
0.90
1.00
1 2 3 4 5 6 7 8 9 10 11 12 13 14 15
Forecast lead time (days)
Co
effi
cie
nt o
f De
term
ina
tion
-6.00-5.00-4.00-3.00-2.00-1.000.001.002.003.004.005.006.00
1 2 3 4 5 6 7 8 9 10 11 12 13 14 15
Forecast lead time (days)
Me
an
Bia
s E
rro
r (c
ms)
0.000.501.001.502.002.503.003.504.004.505.005.506.00
1 2 3 4 5 6 7 8 9 10 11 12 13 14 15
Forecast lead time (days)
Me
an
Ab
solu
te E
rro
r (c
ms)
March 1 April 1 May 1 June 1 July 1 July 310
5
10
15
20
25
30
Date
Str
eam
flow
(cm
s)
Retrospective Model SimulationLeadtime 1
2004
Measured Discharge
Forecasted Discharge
March 1 April 1 May 1 June 1 July 1 July 310
5
10
15
20
25
30
Date
Str
eam
flow
(cm
s)
Retrospective Model SimulationLeadtime 15
2004
Measured Discharge
Forecasted Discharge
March 1 April 1 May 1 June 1 July 1 July 310
5
10
15
20
25
30
Date
Str
eam
flow
(cm
s)
Retrospective Model SimulationLeadtime 7
2004
Measured Discharge
Forecasted Discharge
March 1 April 1 May 1 June 1 July 1 July 310
5
10
15
20
25
30
Date
Retrospective Model SimulationLeadtime 4
2004
Measured Discharge
Forecasted Discharge
Coefficient of Determination (R2)
Mean Bias Error (cm)Mean Absolute Error (cm)

Real-time Forecasting in 2006

Real-time Forecasting in 2006
• SRM correctly forecasted the timing of the peak discharge (May 22, 2006) out 6 days in advance.
– Early by 1 day at a lead time of 7 days and 2 days at 10 days
• The magnitude of the peak was slightly under-predicted for all of the lead-times illustrated here.
• The forecasts of the secondary peak, which occurred in early June, require further investigation and may be due to errors in the input data (i.e. snow covered area).
• The timing of the forecasts are off (timing of smaller peaks) during the early and late portions of the snowmelt season.– May be due to time lag between snowmelt and precipitation events and
the resulting stream discharge

• Create a decision support system for interested parties that is– Easy to use– Accurate
• Intention is to create tools for many basins, not just a single basin, for end-users (NRCS, COE)– UI training session on basin disaggregation and
how to process snow-cover images (snow-covered area)
Preparation for 2007

Preparation for 2007
• Automation - Improved tools for ArcGIS

ArcGIS Tools

ArcGIS Tools
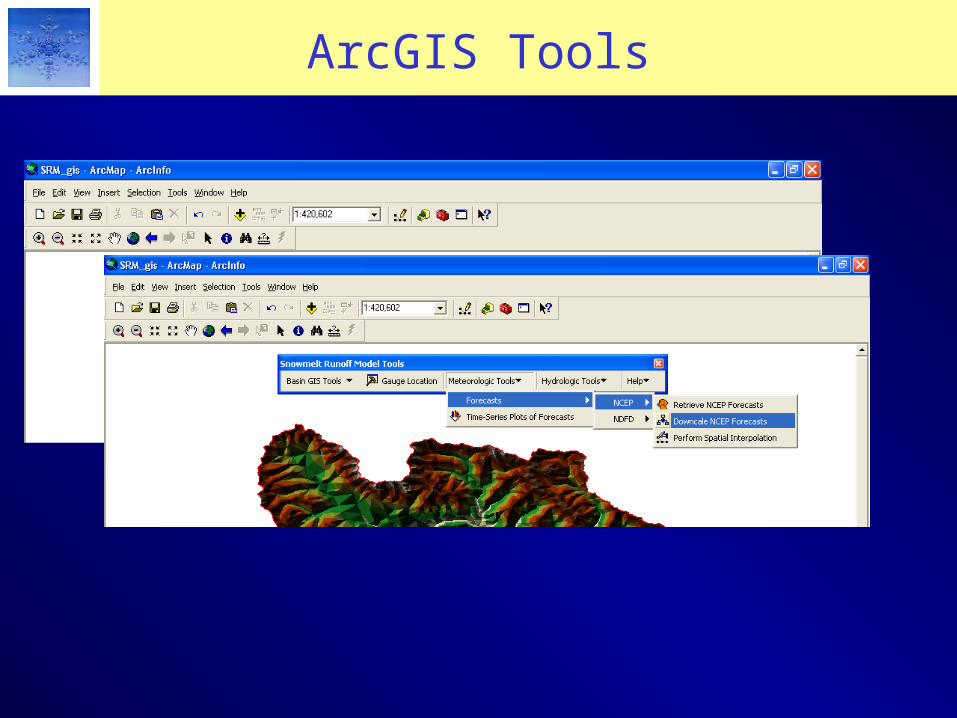
ArcGIS Tools

ArcGIS Tools

Preparation for 2007
• Automation - Improved tools for ArcGIS
• Additional basins

• North Fork of the Clearwater
• St. Joe River
• Big Lost River
• Little Wood River
• Fisher River (Montana)
• South Fork of the Flathead (Montana)
• And perhaps basins in Washington and Oregon as well
Potential New Basins for FY07

Preparation for 2007
• Automation - Improved tools for ArcGIS
• Additional basins
• Ensemble and Single-value (like 2006) forecasting
• Downscaling of global climate model output for simulation of future stream flow conditions in the PNW