dallascityhall.comdallascityhall.com/government/council meeting documents/eco... · project...
TRANSCRIPT


Technical Criteria
for
Economic Development
2017 Bond Program
May 2, 2016

dallas-ecodev.org
2
Purpose
• Review technical criteria for the Office
of Economic Development

dallas-ecodev.org
3
Technical Criteria & Policy
• What is Technical Criteria?
• A set of measuring tools that city staff uses to rate project from a technical standpoint
• It allows staff to categorize and prioritize projects objectively
• Projects in the needs inventory undergo a technical criteria review
• Needs inventory projects are compared within categories

dallas-ecodev.org
4
Technical Criteria –
Economic Development
• Criteria for project funding with Economic Development propositions differs from typical Needs Inventory technical criteria
• Projects are not necessarily known in advance
• Projects not scored and compared based on point accumulation basis
• Availability of bond funding allows City to capitalize on moments of opportunity as they arise
• Provides for flexibility of utilization (assuming the public purpose of economic development is met) in order to achieve City goals

dallas-ecodev.org
Technical Criteria –
Economic Development
• Project evaluation criteria includes:• Accomplishes/advances an established City
Council priority or plan
• Meets parameters outlined in the approved
Proposition (e.g. – Southern Dallas or TOD)
• Council adopted Public/Private Partnership
Program Eligibility (e.g. – jobs and/or investment)
• Needs Inventory Items
• Ability to leverage direct and indirect private and
public investment
• Fiscal and Economic Impact Analysis5

dallas-ecodev.org
Economic Development Technical
Criteria for Needs Inventory
• Streets - Thoroughfare Category: 40 points
possible out of 100 total points for projects
based on economic development criteria
below (60 points for mobility and safety
criteria scored by other departments)
6
Scoring Items Description Potential Points
Target Area Area represents council identified
enhanced activity area such as
Neighborhood Plus
5 pts: business park, TIF, etc.
5 pts: southern Dallas
5 pts: other priority location
Distressed Area Census tract median home values
compared to county median
0 pts: if 100%+
5 pts: >75% <100%
15 pts: < 75%
Project Adjacency Design complete and adjacent to
approved project
0 pts: if no
10 pts: if yes

dallas-ecodev.org
Economic Development Technical
Criteria for Needs Inventory• Streets - Resurfacing and Reconstruction
Categories:
• 10 pts out of 100 possible points allocated for
projects in commercial opportunity areas
supporting ongoing private economic/business
activity such as West Dallas, Asian Trade District,
UNT-Dallas Campus, CBD, Vickery Meadows,
DART stations, etc.
7

dallas-ecodev.org
8
Next Steps
• Integrate Committee suggestions in
evaluation methodology
• Prepare for October 3rd presentation of
needs

Dallas Love Field
Rental Car OperationsEconomic Development Committee
May 2, 2016

Purpose
• Provide an overview of Rental Car operations at Dallas Love Field (DAL)
• Review challenges facing DAL operations
• Evaluate Consolidated Rental Car Facility (ConRAC) options – Site location options
– Funding
– Industry trends
• Review Next Steps
2
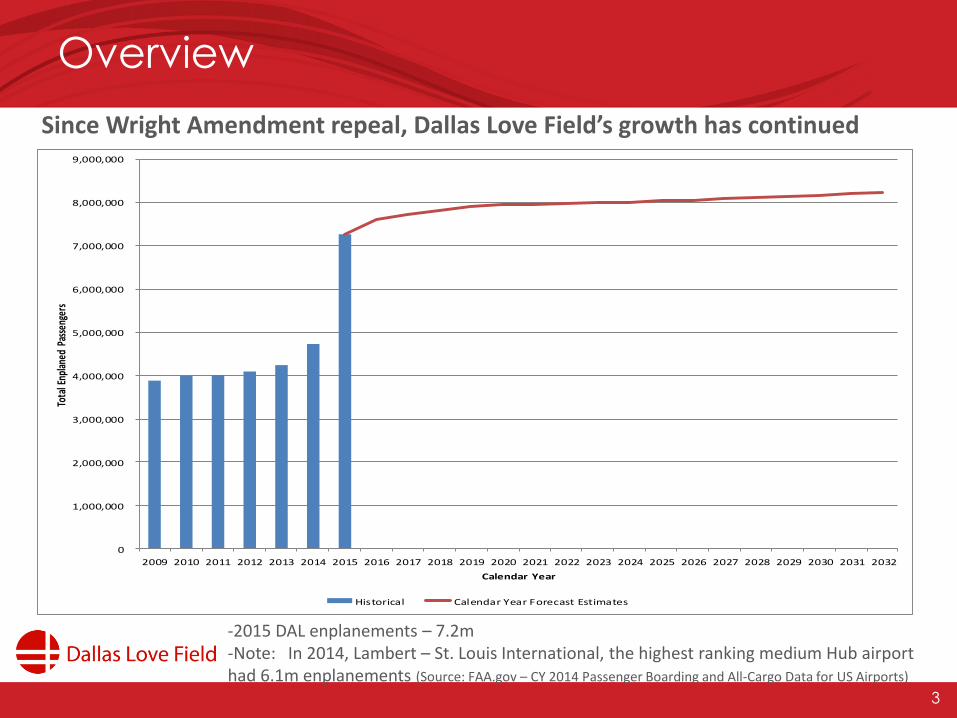
Overview
Since Wright Amendment repeal, Dallas Love Field’s growth has continued
-2015 DAL enplanements – 7.2m-Note: In 2014, Lambert – St. Louis International, the highest ranking medium Hub airport had 6.1m enplanements (Source: FAA.gov – CY 2014 Passenger Boarding and All-Cargo Data for US Airports)
3
0
1,000,000
2,000,000
3,000,000
4,000,000
5,000,000
6,000,000
7,000,000
8,000,000
9,000,000
2009 2010 2011 2012 2013 2014 2015 2016 2017 2018 2019 2020 2021 2022 2023 2024 2025 2026 2027 2028 2029 2030 2031 2032
Tota
l Enp
lane
d Pa
ssen
gers
Calendar Year
Historical Calendar Year Forecast Estimates

Overview
Increased passenger traffic impact
• Increased Parking and Ground Transportation traffic (on airport)
– Parking garages come close to capacity on Tuesdays, Wednesdays and Thursdays
• During holidays and peak travel season 7,000 space parking garages exceed capacity
4
• Experienced a surge in Ground Transportation modes causing an increased demand for airport roads and curbs
• Impact on terminal area roadways due to high demand for new off-airport rental car, Transportation Network Companies and existing taxi, shared ride shuttle, hotel and parking shuttle traffic
TNC pick-up area along lower level roadway curb

Overview
Increased passenger traffic impact
• Congested Roadways (off airport)
– Airport Access Roadways become congested with a large mix of vehicles during peak times
– Intersection of Herb Kelleher Way and Mockingbird Lane is the only entry/exit point to DAL
– Increased congestion at Herb Kelleher Way and Mockingbird Lane cause long dwell times (Reduced Level of Service)
5
LOS Control Delay per Vehicle (Seconds/Vehicle)
A <10
B >10-20
C >20-35
D >35-55
E >55-80
F >80
Level of Servicecriteria for signalized intersections

Intersection Level Of Service (LOS)
Mockingbird Lane @ Herb Kelleher Way/Cedar Springs
RAC
Location
AM
Level of
Service
PM
Level of
Service
On Airport D D
Off Airport C D
Source: Transportation Research Board, Highway Capacity Manual, 2010.
Prepared by: Ricondo & Associates, Inc., November 2015.
- Traffic study conducted in November 2015 to determine LOS with and without Remote ConRAC
- Would conditions improve should we build ConRACon-airport or off-airport?
- Building off-airport improvesservice to Level C
6
7
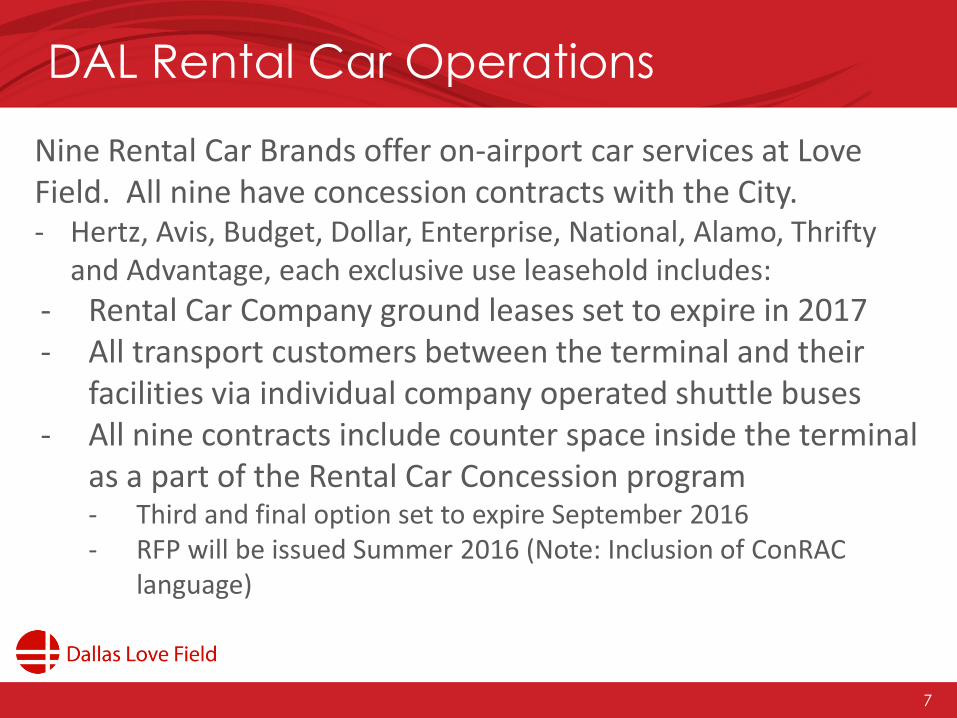
DAL Rental Car Operations
Nine Rental Car Brands offer on-airport car services at Love Field. All nine have concession contracts with the City. - Hertz, Avis, Budget, Dollar, Enterprise, National, Alamo, Thrifty
and Advantage, each exclusive use leasehold includes:
- Rental Car Company ground leases set to expire in 2017- All transport customers between the terminal and their
facilities via individual company operated shuttle buses- All nine contracts include counter space inside the terminal
as a part of the Rental Car Concession program- Third and final option set to expire September 2016- RFP will be issued Summer 2016 (Note: Inclusion of ConRAC
language)

8
DAL Rental Car OperationsIn addition to their main facilities, Rental Car companies have leased additional property for vehicle storage

DAL Rental Car Concession Sales
9
• Rental Car Sales are gross sales, of which, DAL receives a percentage or minimum annual guarantee (MAG)
• Lease rentals relate to Facilities leases and overflow storage lot leases*Percent difference over previous year**Total percent difference over 2013
Rental Car Concession Sales
2013 2014 % diff.* 2015 % diff.* Total diff. **
Sales $67,787,198 $77,509,852 +14% $102,448,223 +32% +51%
Revenues $7,428,765 $8,075,098 +9% $10,265,166 +27% +38%
Effective %
Rental Rate
10.96% 10.42% 10.02%
Lease
Rentals
$422,871 $431,991 $562,093
Concession
Revenue
$7,851,636 $8,507,089 $10,827,259

10
DAL Rental Car Challenges
• Nine rental car brands operate on-airport on approx. 20acres
– Shuttle buses and customers returning vehicles to on-site location contributes to roadway congestion
– No adequate space for rental car vehicle storage to meet demand
– Current rental car ground leases expire 2017
• Recommend constructing Consolidated Rental Car Facility to increase LOS for landside facilities
11
Consolidated Rental Car Facility
(ConRAC)

12
Consolidated Rental Car Facility (ConRAC)
• A facility that combines all rental car operations, including vehicle pick up and drop off, car storage, cleaning and fueling into a single facility
• Functional Components of a ConRAC include:
• Customer service area
• Ready/return area
• Overflow Vehicle Storage
• Vehicle Service Area/Quick Turnaround (QTA)
- Fuel Islands- Wash bays- Maintenance bays- Admin Space- Employee Parking

Preliminary Space Requirements
• To determine space requirements for DAL RAC operations, Ricondo& Associates, Inc. issued a Questionnaire to DAL rental car companies in May 2015
• Used a conglomerate
of all space needs
to determine future
space requirements
13
• Annual/Monthly Activity• # of Rental transactions • # of returns• # of counter positions,
self service, back office space needed in 2015, 2022, 2032
• # of ready/return spaces needed
• Employee parking • Service/Maintenance,
Storage needs

Preliminary Space Requirements
Methodology
• Requirements were developed using DAL-specific hourly rental car transactions for a peak rental day
– A peak rental day was selected as the design day; ready vehicles occupy more space than the same number of return vehicles and represent the maximum space requirement during a peak period
• Planning hour activity was defined as the peak hour number of rentals and returns
• Standard industry planning factors were used to recommend other facility requirements
14

Preliminary Space Requirements
Results Summary 2015 SPACE PROGRAM 2024 SPACE PROGRAM 2032 SPACE PROGRAM
Low Baseline High Low Baseline High Low Baseline High
Quantity Quantity Quantity Quantity Quantity Quantity Quantity Quantity Quantity
Customer Service Area
Regular Counter Positions 49 49 49 58 59 64 59 60 66
Subtotal Customer Service Area 49 49 49 58 59 64 59 60 66
Ready/Return/Storage Areas
Ready Spaces 1,101 1,101 1,101 1,295 1,306 1,417 1,311 1,306 1,460
Return Spaces 478 478 478 562 567 615 569 582 634
Subtotal area Ready/Return 1,579 1,579 1,579 1,857 1,873 2,032 1,881 1,888 2,095
Storage Spaces 1,169 1,169 1,169 1,374 1,386 1,504 1,392 1,424 1,550
Subtotal Storage Area 1,169 1,169 1,169 1,374 1,386 1,504 1,392 1,424 1,550
Exit Booths 12 12 12 14 15 16 15 15 16
Subtotal Exit Booths 12 12 12 14 15 16 15 15 16
QTA/Service Site
Fueling Positions 48 48 48 56 57 62 57 58 63
Wash Bays 8 8 8 9 9 10 9 10 11
Stacking and Staging Spaces 288 288 288 336 342 372 342 348 378
Maintenance Bays 39 39 39 45 46 50 46 47 51
Administrative Area 8,824 8,824 8,824 10,376 10,465 11,355 10,511 10,748 11,705
Employee Parking 481 481 481 566 571 619 573 586 638
Subtotal QTA/Service Site 9,688 9,688 9,688 11,389 11,489 12,468 11,539 11,797 12,846
TOTAL REQUIREMENT - SQUARE FEET 919,924 919,924 919,924 1,081,276 1,091,065 1,184,155 1,095,711 1,109,448 1,219,305
TOTAL REQUIREMENT - ACRES 21 21 21 25 25 27 25 25 28
15

Preliminary Site Concept Analysis
Overview
• Based on the requirements, four potential sites for a ConRAC were identified
– Some sites include multiple layout and parcel configurations
• Facility “massing” layouts were developed to determine each site’s ability to accommodate the 2032 baseline facility requirements
• Key pros and cons were identified
• Each site will be evaluated based upon the site’s ability to meet an established set of evaluation criteria
16

Evaluation Criteria
17
Customer Service– Customer wayfinding to and from facility
– Customer access (time to rent vehicle)
– Customer convenience
– Airport image
Rental Car Operations– Operating cost considerations
– Ability to accommodate long-term needs
– Ability to accommodate space program
– Adjacency of critical operational components
Common Busing Operation– Distance
– Drive time
Environmental Consequences– Air quality
– Wetlands
– Hazardous materials
Site Considerations– Ownership of land
– Offsite infrastructure improvements required
– Terps/Part 77 restrictions
– Constructability
– Length of time to commence construction
– Traffic
Airport Compatibility– Existing operations
– Impact on other Master Plan priorities
– Security
Project Cost

Facility Siting Objectives
• Sufficient land to accommodate space requirements through the planning horizon and to permit future expansion of facilities
• Provide easy customer access/egress to the airport area’s major roadway system
• Maintain reasonable RAC customer consolidated shuttle bus driving time between the terminal and the ConRAC – 15 minute maximum with the objective being under 10 minutes
• Create stable rental car operating and facility environment while maintaining/enhancing customer service
18

Potential ConRAC Site Locations
19

Conceptual Cost Estimate Summary
20
• Rough order of magnitude of $233-$271m depending on site and capacity of facility:- Parking Garage with Customer Service Building
- DAL estimates accommodate 100% of storage needs- Industry standard is to accommodate 30% of storage needs, if
possible, which will bring down cost significantly
- Quick Turnaround Facility- Site Development- Does not include transportation/shuttles or property costs
• Additional revenue streams include rents charged to rental car companies and concession fees

ConRACs (Planned or Recent Openings)
21
Airport 2014
Destination
pax (m)
2014
RAC
gross
sales (m)
# of floors Common
Busing v.
People Mover
Total
Vehicle
Capacity
Project
Cost (m)
Current
CFC rate
Funding
San Diego(Opened Jan. 2016)
8.5 $241.8 Grade +3 Common busing 4,930 $341.0 $7.50/day CFC backed taxablespecial facility rev bond issued by San Diego Regional Airport Authority
Tampa International (opening Nov. 2017)
7.8 $275.7 Grade +3 People mover 6,000 $318.7 $5.95/day CFC backed taxablespecial facility rev bond issued by Hillsborough County Aviation Authority, Florida Dept. of Transportation Grant
Salt Lake City(opening 2018)
5.5 $180.6(approx.)
Walk Not provided Not provided
$5/day GARBS issued by City of Salt Lake City
Austin (opened Nov. 2015)
4.8 $112.9 4 above grade levels (grade level is publicparking)
Walk 2,992 $155.0 $5.95/day CFC backed taxablespecial facilities rev bond issued by City of Austin
San Antonio (projectedopening Mar. 2018)
4.0 $101.8 Top 5 levels of public parking structure; parking on 1st 2 levels
Walk 3,100 $135.0Includes 2 public parking levels
$5/day CFC backed taxablespecial facilities rev bonds issued by City of San Antonio; GARB issued for public parking portion of facility
Sources: 2014 ARN Fact Book: Ricondo & Associates Consolidated Rental Car Center Database, December 2015Prepared by: Ricondo & Associates, Inc., March 2016

Funding
22

Customer Facility Charge (CFC)
• CFC revenue stream is the principal method utilized by airports to pay for rental car facilities and common use transportation systems (busing, APM)
• CFC is a user fee; Not a tax or surcharge
• In effect at over 130 airports
• Industry: ranges from $1.00 to $8.00 per transaction day; or $3.00 to $10.00 per transaction
• Airport pledges CFC revenue stream to pay debt service on financing instrument used to fund rental car facilities
• CFCs are collected in advance of specific project definition
• To fund planning and future construction of ConRAC, staff recommends collecting a CFC at DAL
23

Implementation
• DAL is city-owned and operated, DAL CFC would be implemented by Ordinance
– Ordinance would determine CFC-eligible costs, which can include:• Debt Service
• Facility Operations & Maintenance
• Common use transportation system (Fleet acquisition, O & M, Bus maintenance facilities, APM)
• Other (Terminal roadway and curbside improvements, Infrastructure including utilities and airport access roadways, Environmental remediation)
• When?
– Collection of CFCs can start as soon as a project is identified
– Project does not have to be defined
– Early collection CFCs used as “pay-go” for preliminary planning, design, environmental studies, etc.
24

25
CFCs at Texas Airports
Airport Fee
Abilene $3.00/day
Amarillo $3.00/day
Austin $5.95/day
Corpus Christi $3.50/day
DFW $4.00/day + $2.20/day transportation fee
El Paso $3.50/day
Harlingen $3.00/day
Houston Hobby None (but under consideration)
Houston IAH $4.25/day +$4.49/transaction transportation fee
Killeen $2.00/day
Lubbock $3.50/day
San Antonio $5.00/day
Waco $1.95/day

26
CFCs at Other Airports
Airport CFC Collection Rate
BWI $3.75 per day
Tampa $5.95 per day
Fort Lauderdale $3.95 per day
Chicago Midway $4.75 per day
San Diego $7.50 per day
Oakland $10.00 per transaction
Chicago O’Hare $8.00 per day
Philadelphia $8.00 per day
Raleigh Durham pending

27
Trends
• Average CFC rates recently enacted are rising; $5-$6 per transaction day; California CFC statute permits CFC rate of up to $9 per transaction day starting in 2017
• Facility development costs rising
• Consolidated facility O&M costs rising
• Common use transportation system vs. busing
• Affordability—a specific airport rental car market may not support facility debt service
• CFC revenue combined with other revenue sources
• Expanded definition of CFC-eligible costs

28
Post CFC-Implementation Demand
Impacts
Chicago O’Hare - $8.00/day CFC implemented in 2010• Rental car transactions increased 8.9% in 2011 and increased 5.7% in 2012 • O&D passengers increased 4.2% in 2011 and 1.3% in 2012
Philadelphia - $8.00/day CFC implemented in 2014• Rental car transactions increased 1.3% in 2015 • O&D passengers increased 5.3% between Q3 2014 and Q3 2015
Austin - CFC rate increased from $3.50/day to $5.95/day effective 1/1/2011• Rental car transactions increased 9.2% in 2011 and increased 1.0% in 2012• O&D passengers increased 5.1% in 2011 and 3.4% in 2012

Completed to assist DAL with determination of funding capacity of various CFC levels at $5.00, $6.50 or $8.00 per transaction day
• Model also includes annual cash flow and debt service coverage ratios for each of the various CFC rate scenarios
PAYGO Leveraged Total
CFCs 1/ CFCs 2/ Project Cost
CFC Rate
$5.00 Per Transaction Day $19,254,169 $136,957,366 $156,211,535
$6.50 Per Transaction Day $25,030,420 $178,044,576 $203,074,996
$8.00 Per Transaction Day $30,806,671 $219,131,786 $249,938,457
1/ CFCs pro jected to be available to fund pro ject costs on a pay-as-you go basis through FY 2017.
2/ Leveraged CFCs represent the net CFC bond proceeds available for pro ject cost.
Source: Dallas Love Field Airport, Ricondo & Associates, Inc., M ay 2015
Prepared by: Ricondo & Associates, Inc., M ay 2015
Summary of Estimated CFC Funding Capacity for Project Costs
CFC Funding Capacity Analysis
29

Third Party Development
• Several third party developers have approached the City with a request to develop, build, operate, and/or maintain a ConRAC facility
– Some other airports have utilized third party developers to construct, and operate facilities
– All developers require CFC’s and airport financing
– Third party may bring new potential site not currently under control by the airport
• Third party development shifts some risk, but may add cost to project for development fees
– Rental car companies are not opposed to a third party development
30

Next Steps
• Draft ordinance to begin collection of CFC at a rate to be determined - Summer 2016
– Final rate to be determined after consultation with Rental Car Companies as to final design programming for CONRAC
– Fund future rental car facility planning efforts and ultimately fund future rental car facility projects at DAL
• Issue RFP for third party developer to assist with ConRACconstruction
• Evaluate cost/benefit of third party development
• Complete evaluation of site location options and recommend project implementation
– Identify most desirable location/ development option, and start preliminary planning
31