meeting health insurance exchange consumers’ expectations...rising to the challenge: meeting...
TRANSCRIPT
Executive summary
The public health insurance exchanges have been in operation for nearly three years. In Deloitte’s 2016 Survey of US Health Care Consumers, we sought to understand exchange consumers’ satisfaction with coverage, knowledge of costs, confidence in handling future health care costs, use of online services, and how they shop for coverage.
We found that:
• Exchange respondents are as likely to say they are satisfied with their coverage as respondents with employer coverage.
• Many exchange consumers say they had no difficulty paying out-of-pocket (OOP) costs and more feel prepared to handle future health care costs than in 2015.
• More than twice as many exchange consumers report using online information sources to shop for a plan than the average consumer, including those with employer coverage.
• More exchange consumers say they understand their costs than consumers with employer coverage, and when they used their coverage, one quarter of exchange enrollees says they had surprise OOP costs.
• Exchange enrollees who report having at least one chronic disease say they understand their coverage better than those who report no chronic disease.
• Many exchange consumers shop around for coverage and evaluate the total costs before making decisions, and they continue to be willing to accept network tradeoffs for lower payments. Also, brand matters: When deciding between coverage options, many exchange consumers start with brands they know and then look at total plan costs.
These findings suggest that people who obtain health insurance through the public health insurance exchanges continue to shop around for coverage. They are showing signs of increased confidence in coverage affordability and appear to be just as satisfied with their coverage as people with employer coverage. Exchange consumers’ focus on factors beyond cost and their demand for tools and technologies to support their shopping experience emphasize how important it can be for health plans to review consumer engagement techniques to enhance touchpoints. For health plans in this market, meeting these expectations today may lead to even more confident and satisfied customers in the future.
Rising to the challenge: Meeting health insurance exchange consumers’ expectationsFindings from the Deloitte Center for Health Solutions 2016 Survey of US Health Care Consumers
About the surveyDeloitte’s 2016 Survey of US Health Care Consumers included 3,751 adults (18 years and older). The national sample is representative of the US Census with respect to age, gender, race/ethnicity, income, geography, insurance status, and insurance source. A subsample of 804 respondents reported getting coverage through HealthCare.gov or a state health insurance marketplace, exchange, or connector (“exchange”). Respondents in the exchange subsample varied with respect to demographic characteristics, prior insurance status, and type of exchange used. See more about the methodology in the appendix.

Rising to the challenge: Meeting health insurance exchange consumers’ expectations
2
Introduction
As of March 31, 2016, 11.1 million individuals had health insurance coverage through the federal and state-based exchanges established by the Affordable Care Act (ACA).1 This is an increase over 2015, when 10.2 million individuals enrolled in exchange plans.2
While enrollment continues to increase, the exchange markets remain in flux. Many health plans have reported losses on their public exchange business, as companies continue to evolve their strategies to navigate the post-ACA individual market.3
Risk pool composition, medical cost projections, premium adjustments over time, and regulatory issues outside health plans’ control are among the factors driving company performance in the exchanges.4 For many organizations, success in these new markets may largely depend on their understanding and approach to consumer engagement. To that end, we sought to better understand the behaviors, attitudes, and perceptions that enrollees bring with them to the public exchanges.
Success in these new markets may largely depend on health plans’ understanding and approach to consumer engagement.

Rising to the challenge: Meeting health insurance exchange consumers’ expectations
3
Surveyed exchange consumers are as likely to say they are satisfied with their coverage as respondents with employer coverage.
More than half (53 percent) of exchange consumers are satisfied with their health plan overall, statistically the same as respondents with employer insurance (54 percent). Satisfaction rates are highest among respondents with Medicare (74 percent) and Medicaid (71 percent). (See Figure 1.)
Figure 1. Exchange consumers say they are satisfied with their coverage at the same rate as respondents with employer coverage
Chart shows percentage of respondents who selected 8, 9, or 10 on a scale of 1 to 10, where 10 is “Very satisfied” and 1 is “Very dissatisfied.”
Source: Deloitte 2016 Survey of US Health Care Consumers.
Total Employer Medicare Medicaid Exchange
61% 54%
74% 71%
53%
Figure 2. OOP costs, premiums, and network issues are chief complaints among exchange consumers who are less than satisfied with their coverage
Among consumers who said they were dissatisfied with their overall health insurance policy/plan (selected 1, 2, or 3 on a scale of 1 to 10, where 10 is “Very satisfied” and 1 is “Very dissatisfied.")
Source: Deloitte 2016 Survey of US Health Care Consumers.
Total Employer Exchange
42% 45% 44% 37%
42% 50%
18% 15% 23%
14% 13% 14% 13% 11% 18%
My insurance doesn't pay enough of my
health care expenses(copayments, coinsurance,
and deductibles are too high)
My premium is too high
The network of doctors, hospitals, and health care
providers covered by the health insurance policy/plan is too restricted and does not give
me the choices I want
I don't get good enough advice and information
from the health insurance company about my
benefits and costs to me
Customer service and assistance is
unsatisfactory
Even though satisfaction rates are the same between exchange enrollees and people with employer coverage, the reasons for dissatisfaction differ somewhat. Unsatisfied consumers in both groups note concerns about premiums and OOP costs, while more people in exchanges also mention network restrictions. (See Figure 2.)

Rising to the challenge: Meeting health insurance exchange consumers’ expectations
4
Most surveyed exchange consumers say they had no difficulty paying OOP costs, and more feel prepared to handle future health care costs.
Surveyed exchange consumers are showing signs of increased confidence in affordability of health care. Seven-in-10 exchange consumers say they had no financial difficulty paying OOP costs in the last year. (See Figure 3.)
While still low, consumers’ views of health care affordability appear to have improved. In 2016, one-in-three exchange consumers (34 percent) say they feel prepared to handle future health care costs, compared with 16 percent in 2015.5 Nearly half of exchange consumers (45 percent) say they feel confident about being able to get affordable care, and confidence appears to have increased over last year (24 percent in 2015) (not shown).
Figure 3. Most exchange consumers say they had no difficulty paying OOP costs last year
74% 75% 76%
68% 70%
No financial difficulty in the last 12 months
Total Employer Medicare Medicaid Exchange
Source: Deloitte 2016 Survey of US Health Care Consumers.

Rising to the challenge: Meeting health insurance exchange consumers’ expectations
5
More than twice as many exchange respondents report using online information sources to shop for a plan than average consumer respondents, including those with employer coverage.
The public exchanges offer potential purchasers on the individual market access to websites—hosted through the federal HealthCare.gov platform or through one built by their state—to learn about coverage options and see if they qualify for a subsidy. In addition to the public exchanges, various online sites exist for health care consumers to shop for and enroll in coverage, and many consumers appear to be using those sites. Sixty-seven percent of exchange consumers went online to look for information to help them choose a plan, compared with 31 percent of the overall sample and 30 percent with employer coverage. (Not shown.) Most exchange consumers say they used HealthCare.gov or one of the state-based exchange sites (63 percent), but many looked to other sites to help them enroll in a plan. Nearly one-fifth (19 percent) say they used a health plan’s website, and 15 percent say they used an independent website (e.g., eHealthInsurance.com, HealthPlanOne.com, HealthInsurance.com, InsureMonkey.com) the most to help them choose a plan (not shown).
For the 2016 open enrollment period, there were new tools to help consumers understand coverage options before signing up for a plan. When asked about the site they used most to choose a plan, many exchange consumers say that the site had tools that they used to help them compare OOP costs across options (66 percent) and features that allowed them to window shop (59 percent). Satisfaction with the tools is high—exchange consumers who used the different online tools give them all passing grades. (See Figure 4.)
Use of tools varies by age. For example, 41 percent of exchange consumers age 18 to 34 say they used a smartphone or mobile device to access the site they used the most to enroll in coverage. This compares with only 21 percent of exchange consumers age 35 to 54. Likewise, more exchange enrollees age 18 to 34 say they trust social networking sites as reliable sources for information and advice regarding health insurance plans (38 percent vs. 22 percent) (not shown).
Figure 4. In many cases, more exchange consumers used online tools for estimating OOP costs than other consumers
The "total" and "exchange" bars above indicate the percentage of survey respondents who said the site they used the most to enroll had this tool and they used it. "Satisfaction" indicates the percentage of exchange consumers who used the tool and selected a 4 or 5 on a 5-point scale, where 1 is "Not satisfied" and 5 is "Extremely satisfied."
Source: Deloitte 2016 Survey of US Health Care Consumers.
Total Exchange Satisfaction
Access to the site via an app on your smartphone/mobile device
28%22%87%
Add information about your physician(s) to tailor health insurance plan options to your specific health care needs
37%40%77%
Add information about your prescription drug(s) to tailor health insurance plan options to your specific health care needs
40%39%78%
Estimate your expected medical care or needs for the next year to tailor health insurance plan options to your specific health care needs
41%40%80%
Estimate out-of-pocket costs using information about your expected medical care or needs for the next year
48%50%74%
Window shop (i.e., compare health insurance plans without creating a login or signing up)
52%59%78%
Compare out-of-pocket costs across different health insurance plan options
55%66%77%
Rising to the challenge: Meeting health insurance exchange consumers’ expectations
6
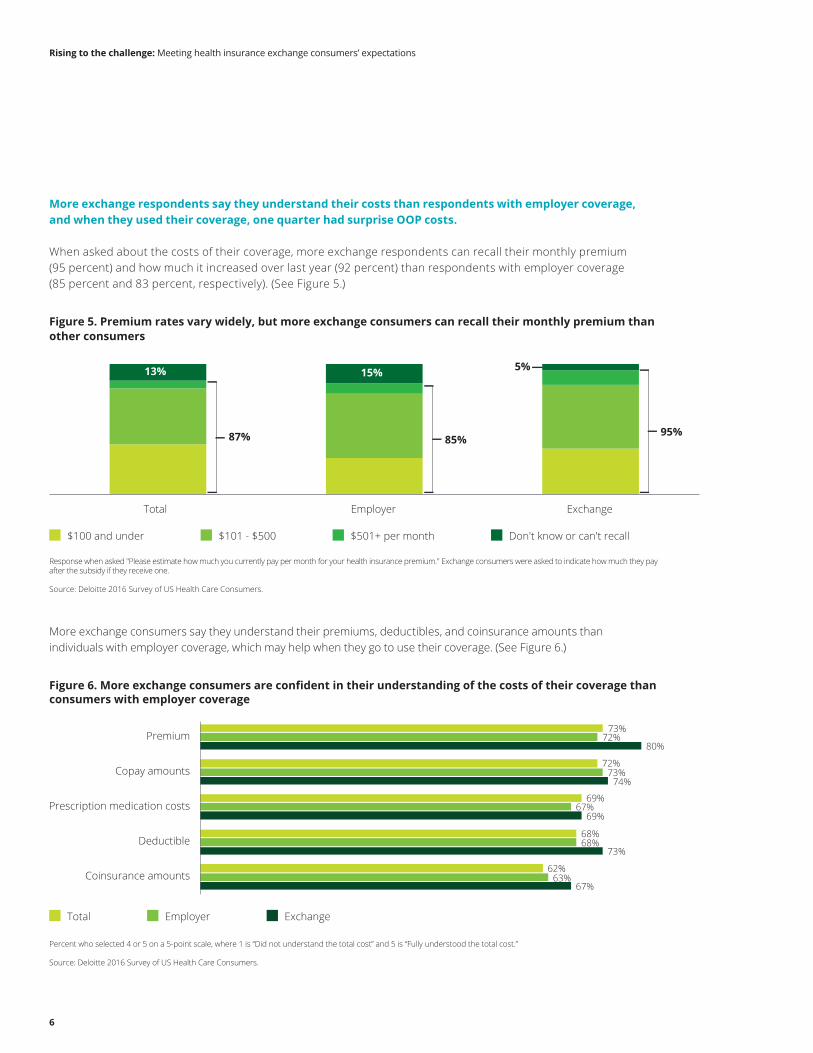
More exchange respondents say they understand their costs than respondents with employer coverage, and when they used their coverage, one quarter had surprise OOP costs.
When asked about the costs of their coverage, more exchange respondents can recall their monthly premium (95 percent) and how much it increased over last year (92 percent) than respondents with employer coverage (85 percent and 83 percent, respectively). (See Figure 5.)
Figure 5. Premium rates vary widely, but more exchange consumers can recall their monthly premium than other consumers
Response when asked "Please estimate how much you currently pay per month for your health insurance premium." Exchange consumers were asked to indicate how much they pay after the subsidy if they receive one.
Source: Deloitte 2016 Survey of US Health Care Consumers.
$100 and under $101 - $500 $501+ per month Don't know or can't recall
13% 15%
Total Employer Exchange
5%
95% 85% 87%
More exchange consumers say they understand their premiums, deductibles, and coinsurance amounts than individuals with employer coverage, which may help when they go to use their coverage. (See Figure 6.)
Figure 6. More exchange consumers are confident in their understanding of the costs of their coverage than consumers with employer coverage
Percent who selected 4 or 5 on a 5-point scale, where 1 is “Did not understand the total cost” and 5 is “Fully understood the total cost.”
Source: Deloitte 2016 Survey of US Health Care Consumers.
Total Employer Exchange
Premium
Copay amounts
Prescription medication costs
Deductible
80% 72%
73%
74% 73%
72%
69% 67%
69%
73% 68% 68%
67% 63%
62% Coinsurance amounts

Rising to the challenge: Meeting health insurance exchange consumers’ expectations
7
Seventy-two percent of exchange consumers say they have used their current plan to visit a doctor, hospital, or other health care provider, or to pay for prescription drugs. When asked about surprise OOP spending after using their coverage, one-in-four of those consumers (25 percent) say that the amount they had to spend OOP for a visit to a provider, prescription drugs, or treatment or service was greater than they expected. This is on par with people with employer coverage, 27 percent of which said they had surprise OOP costs after using their coverage. (See Figure 7.)
Figure 7. When using their coverage, one quarter of exchange consumers had surprise OOP costs
Percent who said the amount they had to spend OOP for the doctor, hospital, or other health care provider visit; prescription drugs; or treatment/service needed was greater than they expected.
Source: Deloitte 2016 Survey of US Health Care Consumers.
Employer Medicare Medicaid Exchange
27%
18%
10%
25%

Rising to the challenge: Meeting health insurance exchange consumers’ expectations
8
Most exchange consumers say they know about the rules surrounding health insurance, the exchanges, and open enrollment. Seventy-nine percent of exchange consumers say they knew open enrollment is once a year, and 86 percent say they knew about availability of premium assistance for people with certain incomes before taking the survey. Fewer exchange consumers say they knew about special enrollment periods (66 percent), which allow people to obtain coverage outside of open enrollment, or the amount of the fine for not getting coverage in 2016 (67 percent). (See Figure 8.)
Figure 8. Most exchange consumers are aware they can get financial help paying for premiums
Percentage of exchange consumers who selected “Yes, I was aware of this,” when asked if they were aware of this before taking the survey.
Source: Deloitte 2016 Survey of US Health Care Consumers.
66%
67%
73%
79%
79%
86%
Individuals who have certain changes in circumstance (e.g.,financial, having a child, marriage, moving) can apply for
health insurance coverage any time of the year
The fine for not having health insurance coveragein 2016 increased to $695 or 2.5% of yourhousehold's income, whichever is greater
Individuals with a certain level of income can qualifyfor financial help paying additional OOP costs like
deductibles, coinsurance, and copayments
Individuals who go without health insurance coveragefor more than three months may have to pay a fine
Individuals who do not have any changes in their circumstances(e.g., financial, having a child, marriage, moving) may only
be able to apply for health insurance coverage during onepart of the year, generally referred to as open enrollment
Individuals with a certain level of income canqualify for financial help paying for premiums

Rising to the challenge: Meeting health insurance exchange consumers’ expectations
9
Exchange respondents who report having at least one chronic condition say they understand their coverage better than respondents who report no chronic conditions.
Nearly half (47 percent) of surveyed exchange consumers report being diagnosed by a doctor with at least one chronic condition (e.g., diabetes, high blood pressure, asthma, bronchitis, emphysema, cancer, arthritis, heart disease). These consumers expect to use more services over the next year, appear to have a good understanding of their coverage costs, and are less willing to accept network tradeoffs for lower costs. The rate of chronic disease differs for newcomers (39 percent) compared with people who returned to the exchange from a previous year (51 percent), which suggests that the rate might stabilize over time.
More exchange enrollees with chronic conditions say they felt they had a good understanding of their costs when they first enrolled than people with no chronic conditions. More say they understood their premium (83 percent vs. 77 percent), copay amounts (78 percent vs. 71 percent), and prescription costs (73 percent vs. 66 percent) compared with people with no chronic conditions. (Not shown.) However, fewer exchange enrollees with chronic conditions say they are willing to accept network tradeoffs for lower payments. (See Figure 9.)
Figure 9. Fewer people with chronic conditions say they are willing to accept network tradeoffs if it meant that their payments would be lower as a result
Chart shows respondents’ answers when asked how willing the respondent would be to accept each alternative if it resulted in lower payments for either health insurance and/or health care services and lower copays for health care services. Showing percent who selected 8, 9, or 10 on a 10-point scale where 1 is “Not at all willing” and 10 is “Extremely willing.”
Source: Deloitte 2016 Survey of US Health Care Consumers.
Has chronic conditions No chronic conditions
20%
35%
20%
33%
19%
32%
A smaller network of hospitals (which would give
you less choice/fewer options)
A network that doesnot include your current
primary care provider
A smaller network ofdoctors (which would giveless choice/fewer options)
More exchange enrollees with chronic disease look at factors in addition to premiums than people with no chronic disease. One-fourth (26 percent) of people with chronic conditions say that when they consider coverage options, they look at the best benefit package based on premiums, other OOP costs, and benefits covered, and they do not pay much attention to the company offering them. This compares with only one-in-five (20 percent) of respondents with no chronic disease.
Finally, and perhaps unsurprisingly, more exchange enrollees with chronic conditions expect to use a lot of health care in the next 12 months: 18 percent of exchange enrollees expect to have six or more doctor’s visits over the next year, compared with only six percent of people with no chronic conditions. Moreover, 25 percent of exchange consumers with chronic conditions say they expect to fill 11 or more prescriptions in the next 12 months, compared with only eight percent of exchange enrollees with no chronic conditions.

Rising to the challenge: Meeting health insurance exchange consumers’ expectations
10
Exchange respondents shop around for coverage and evaluate the total costs before making decisions, and they continue to be willing to accept network tradeoffs for lower payments.
Many exchange consumers show willingness to shop around for different coverage, even if they end up staying in the same plan. Among exchange consumers who have been enrolled in the same plan for more than one year, 34 percent say they shopped around for other options, but found their current plan to be the best fit. Another third (34 percent) say they stayed with that plan because it met all of their needs. (See Figure 10.)
Figure 10. One-third of exchange consumers that had the same plan for more than one year say they shopped for another plan but found their current one to be the best fit
Chart shows reasons why respondents that had been enrolled in the same health insurance policy for more than one year did not switch plans.
Source: Deloitte 2016 Survey of US Health Care Consumers.
34%
34%
9%
8%
6%
5%
The health insurance policy/plan I currently have meets all of my needs, so I did not look for a different plan
I shopped around for other health insurance policy/plan optionsduring the open enrollment/annual enrollment period, but found
my current health insurance policy/plan to be the best fit
I did not think that my insurance company had any otherhealth insurance policy/options that would fit my needs,
so I did not look at other health insurance policy/plans
I tried to shop for other health insurance policy/plans, butfound comparing my current health insurance policy/plan
to new plans too complicated or difficult to understand
I have not used my health insurance policy/plan recently and do not expect to use it in the next year, so I had no
reason to look for a new health insurance policy/plan
I did not realize that I could only change my health insurancepolicy/plan in a designated period of time during the year
or if I qualified through specific events (e.g., marriage)

Rising to the challenge: Meeting health insurance exchange consumers’ expectations
11
Many exchange consumers evaluate the total costs of their coverage before they choose a plan, whether or not brand plays a role in that decision. When asked how they go about shopping for coverage, 38 percent of exchange consumers say they start with companies they know and then look at premium, deductibles, copays, coinsurance, and benefits covered. Another 23 percent say they look for the best benefit package based on premium, deductibles, copays, coinsurance, and benefits covered, and do not pay much attention to the company offering them. (See Figure 11.)
However, more young adults rely solely on premium to select their coverage: 30 percent of exchange enrollees age 18 to 34 say they start with health insurance companies they know and then pick the best plan based solely on the premium and not accounting for other cost or network factors. This is in comparison to 20 percent of exchange enrollees age 35 to 54. (Not shown.)
Figure 11. Only 10 percent of exchange consumers look solely at the premium when selecting their coverage
Chart shows respondents’ answers when asked to think back to the last time they shopped for health insurance coverage and select how they went about considering different options.
Source: Deloitte 2016 Survey of US Health Care Consumers.
Total Employer Exchange
20%
38%
10%
23%
5%
18%
25%
5%
17%
30%
15%
23%
6%
18%
31%
I started with offerings from health insurancecompanies I knew and then picked the best benefit
package for me based solely on the premium
I started with offerings from companies I knew and thenpicked the best benefit package for me based on the premium,
deductibles, copays, coinsurance, and benefits covered
I looked for the best benefit package based solelyon the premium and did not pay much attention
to the company offering them
I looked for the best benefit package based onpremium, deductibles, copays, coinsurance, and
benefits covered and did not pay much attentionto the company offering them
Never shopped for health insurance/Do notremember shopping for health insurance

Rising to the challenge: Meeting health insurance exchange consumers’ expectations
12
More exchange consumers are willing to accept tradeoffs for lower payments than people with other insurance. More than one-fourth of exchange consumers say they would accept a smaller network of hospitals (27 percent vs. 21 percent), a network that does not include their current primary care provider (26 percent vs. 22 percent), or a smaller network of doctors (26 percent vs. 21 percent) if it resulted in lower payments for either health insurance and/or health care services than people with employer coverage (not shown).
More exchange consumers say they are willing to accept tradeoffs for lower payments in 2016 than in 2015. (See Figure 12.) And, more people who are new to the exchanges say they are willing to accept these tradeoffs for lower payments. (See sidebar on the following page.)
Figure 12. More exchange consumers are willing to accept tradeoffs for lower payments in their coverage than in 2015
18%
27%
16%
26%
18%
26%
A smaller network of hospitals(which would give you less
choice/fewer options)
A network that does not include your current primary care provider
A smaller network of doctors(which would give less choice/fewer options)
Chart shows respondents’ answers when asked how willing the respondent would be to accept each alternative if it resulted in lower payments for either health insurance and/or health care services and lower copays for health care services. Showing percent who selected 8, 9, or 10 on a 10-point scale where 1 is “Not at all willing” and 10 is “Extremely willing.”
Source: Deloitte 2016 Survey of US Health Care Consumers; Deloitte 2015 Survey of US Health Care Consumers.
2015 2016

Rising to the challenge: Meeting health insurance exchange consumers’ expectations
13
One-third (32 percent) of exchange consumers who responded to the survey say that 2016 is the first year they used the health insurance exchange to enroll in an insurance plan (newcomers). The remaining respondents (67 percent) are returning customers.
Key differences between these two groups indicate that the exchange population as a whole is transforming. For example, more newcomers than people who are return customers report a household income of $75,000 to $149,000 (29 percent vs. 19 percent). And, fewer newcomers report a household income of $25,000 to $74,999 (52 percent vs. 57 percent).
Several findings suggest that the longer enrollees have used the exchanges for coverage, the savvier they have become:
• More returning customers used OOP cost-comparison tools than newcomers (69 percent vs. 60 percent).
• More returning customers say they understand their copay amounts (78 percent vs. 66 percent) than newcomers.
• More returning customers say that they rate the range of doctors, hospitals, and health care providers included in their plan's network as important or very important than newcomers (84 percent vs. 79 percent).
However, more newcomers say they want access to a mobile application for enrolling, managing their account, checking on claims, and paying bills than returning customers (41 percent vs. 35 percent), suggesting that newer consumers are bringing greater technology demands with them. And, more newcomers are willing to accept a smaller network of hospitals (33 percent vs. 25 percent) or doctors (32 percent vs. 23 percent) than returning customers, suggesting that many are bringing flexible mindsets to their shopping approach. This could mean that consumers joining the exchanges later may understand the risk of remaining uninsured and wish to avoid the penalties for going without coverage.
13%
52%
29%
4%
2%
First year on exchange
16%
57%
19%
5% 4%
Returning customer to exchange
Chart shows household income.
<$25,000
$150,000+
$25,000–$74,999
Prefer not to answer
$75,000–$149,999
$75,000-$149,999
People who are new to the exchanges differ in several key ways from people who returned from a previous year

Rising to the challenge: Meeting health insurance exchange consumers’ expectations
14
Exchange consumers show signs that they factor more than cost into their decisions about health insurance plans. While cost (94 percent) is respondents’ highest-rated factor, network (88 percent), range of benefits (86 percent), and good value (85 percent) follow shortly behind. Furthermore, three-out-of-four respondents say that quick access to customer service representatives for help on care or billing issues is important to them. (See Figure 13.) Nearly seven-in-10 place high value on technology and brand aspects of their coverage.
Figure 13. Exchange consumers factor in a range of issues when selecting their health insurance plan
Percent of respondents who selected 4 or 5 on a 5-point scale where 1 is “Not at all important” and 5 is “Extremely important” when asked how important the above factors were to respondents when choosing current health insurance policies/plans.
Source: Deloitte 2016 Survey of US Health Care Consumers.
46%
51%
55%
63%
65%
68%
69%
76%
85%
86%
88%
94%
Recommendations from friends, family, coworkers, or fellow students
Programs, resources, and online tools that can help memonitor my health and/or make health care decisions
Availability of an online tool that suggests thebest health insurance policy/plan for me
Quality
Assistance from trained people to help me fully understandwhat I am buying and help me with enrollment
Brand/reputation of the health insurance policy/plan
Technology
Quick access to customer service representatives who can helpme resolve questions about care or issues related to billing
Good value—benefits are good for what I pay; I canpick the benefits I want at the price I want to pay
Range of benefits covered by the health insurance policy/plan
Network
Costs

Rising to the challenge: Meeting health insurance exchange consumers’ expectations
15
Implications
Exchange consumers appear to be increasingly knowledgeable about making health insurance purchases and using their coverage. First-time purchasers also appear to be changing the mix and raising the bar for expectations. Many exchange enrollees routinely use tools and technologies to examine aspects of the health plan’s value beyond cost. As a result, health plans may need to adapt and shift their exchange strategies, as outlined below, to meet evolving consumer demands.
Understand the drivers behind consumers’ decisions: While cost concerns are driving many decisions for exchange consumers, choosing the lowest-cost premium may not be the sole driver. As exchange consumers grow more sophisticated, total cost and brand appear to matter. And, as the exchange population grows and changes, newer enrollees—ones who have less experience and different expectations—may require different engagement approaches. For example, more returning customers say they are unwilling to accept network tradeoffs for lower payments than newer enrollees, who appear to be less attached to their networks. Issues around networks and benefits continue to be important, as are factors including technology and brand.
Build tools that enhance transparency and help consumers understand costs, benefits, and networks: Satisfaction among consumers is often driven by cost factors—whether they are premiums or OOP costs. Exchange consumers appear to be paying attention to these details at the enrollment and re-enrollment stage, indicating that they may change plans if they find an option that better meets their needs. Improved online tools may lead to more confident consumers and may help them make informed decisions about coverage options. Newer exchange consumers appear to have higher technology expectations than those who entered earlier.
Meet consumers where they are: Generally, exchange consumers focus on factors beyond cost, and their general demand for tools and technologies to support their shopping experience emphasize how important it can be for health plans to review consumer engagement techniques to enhance touchpoints. Consumers’ willingness to switch plans and/or companies means that health plans should consider providing an adaptive, seamless, and compelling consumer experience beginning with enrollment and continuing throughout the plan year.
Health plans may need to adapt and shift their exchange strategies to meet evolving consumer needs.

Rising to the challenge: Meeting health insurance exchange consumers’ expectations
16
Methodology
Since 2008, the Deloitte Center for Health Solutions has annually polled a nationally representative sample of US adults about their experiences and attitudes related to their health, health insurance, and health care and their views about the health care system. The general aim of the survey is to track changes in consumer engagement over time and investigate key questions of interest to the health plan, provider, life sciences, and government sectors. The 2016 survey included 3,751 adults (18 years
and older). The national sample is representative of the US Census with respect to age, gender, race/ethnicity, income, geography, insurance status, and insurance source. A subsample of 804 respondents reported getting coverage through HealthCare.gov or a state health insurance marketplace, exchange, or connector (“exchange”). Respondents in the exchange subsample varied with respect to demographic characteristics, prior insurance status, and type of exchange used.
Survey fielding time period Late February through mid-March 2016 Note: after open enrollment period ended
Data collection The survey was conducted online and was offered in English and Spanish
Sample description National sample of 3,751 adults (18+ years) plus a subsample of 804 exchange enrollees
Representativeness National sample is representative of the US population (18+) with respect to:
• Demographics: age, generation, gender, race, ethnicity, region, income
• Insurance: status (insured/uninsured) and source (employer, exchange, Medicare, Medicaid, other)
The exchange sample varied with respect to demographic characteristics, prior insurance status, and type of exchange used.

Rising to the challenge: Meeting health insurance exchange consumers’ expectations
17
Endnotes
1. Centers for Medicare and Medicaid Services, “March 31, 2016 Effectuated Enrollment Snapshot,” June 30, 2016. Accessed at https://www.cms.gov/Newsroom/MediaReleaseDatabase/Fact-sheets/2016-Fact-sheets-items/2016-06-30.html.
2. US Department of Health and Human Services, “March Effectuated Enrollment Consistent with Department’s 2015 Goal,” June 2, 2015. Accessed at http://www.hhs.gov/about/news/2015/06/02/march-effectuated-enrollment-consistent-with-departments-2015-goal.html#.
3. Bruce Japsen, Forbes, “Insurer Obamacare Losses Reach Billions of Dollars After Two Years,” February 7, 2016. Accessed at http://www.forbes.com/sites/brucejapsen/2016/02/07/insurer-obamacare-losses-reach-billions-of-dollars-after-two-years/#6f9422487f0a.
4. American Academy of Actuaries, “Drivers of 2016 Health Insurance Premium Changes,” August 2015. Accessed at http://www.actuary.org/files/Drivers_2016_Premiums_080515.pdf.
5. Deloitte Center for Health Solutions, Public health insurance exchanges: Opening the door for a new generation of engaged health care consumers, 2015.

Rising to the challenge: Meeting health insurance exchange consumers’ expectations
18
Authors
Gregory ScottHealth Plans National Sector LeaderPrincipalDeloitte [email protected]
Paul LambdinManaging DirectorDeloitte Consulting LLP [email protected]
Claire B. Cruse, MPHHealth Policy ManagerDeloitte Center for Health SolutionsDeloitte Services [email protected]
Leslie Korenda, MPHResearch ManagerDeloitte Center for Health [email protected]
Acknowledgements
We wish to extend special thanks to Bill Copeland for his sponsorship of this consumer research, without which this report would not have been possible.
We acknowledge Bernice Ramirez for volunteering her time and effort on the Spanish translation of the survey instrument.
We thank Sarah Thomas, Kate Chojnacki, Ellen Conti, Kathryn Honeycutt, Samantha Gordon, Andrea Charmorro, and Lauren Wallace and the many others who contributed their ideas and insights to this project.
To download a copy of this report, please visitwww.deloitte.com/us/hix-consumer-experience.
Deloitte Center for Health Solutions
To learn more about the Deloitte Center for Health Solutions, its projects, and events, please visitwww.deloitte.com/centerforhealthsolutions.
Harry Greenspun, MDManaging DirectorDeloitte Services [email protected]
Sarah Thomas, MSManaging Director, ResearchDeloitte Services [email protected]
Web: www.deloitte.com/centerforhealthsolutions Twitter: @DeloitteHealth

This publication contains general information only and Deloitte is not, by means of this publication, rendering accounting, business, financial, investment, legal, tax, or other professional advice or services. This publication is not a substitute for such professional advice or services, nor should it be used as a basis for any decision or action that may affect your business. Before making any decision or taking any action that may affect your business, you should consult a qualified professional advisor. Deloitte shall not be responsible for any loss sustained by any person who relies on this publication.
About Deloitte Deloitte refers to one or more of Deloitte Touche Tohmatsu Limited, a UK private company limited by guarantee (“DTTL”), its network of member firms, and their related entities. DTTL and each of its member firms are legally separate and independent entities. DTTL (also referred to as “Deloitte Global”) does not provide services to clients. Please see www.deloitte.com/about for a detailed description of DTTL and its member firms. Please see www.deloitte.com/us/about for a detailed description of the legal structure of Deloitte LLP and its subsidiaries. Certain services may not be available to attest clients under the rules and regulations of public accounting.
Copyright © 2016 Deloitte Development LLC. All rights reserved.Member of Deloitte Touche Tohmatsu Limited
About the Deloitte Center for Health SolutionsThe source for health care insights: The Deloitte Center for Health Solutions (DCHS) is the research division of Deloitte LLP’s Life Sciences and Health Care practice. The goal of DCHS is to inform stakeholders across the health care system about emerging trends, challenges, and opportunities. Using primary research and rigorous analysis, and providing unique perspectives, DCHS seeks to be a trusted source for relevant, timely, and reliable insights.