meeting standards, winning markets€¦ · the initial analysis of import rejection data on...
TRANSCRIPT

Meeting Standards, Winning Markets
UNITED NATIONS INDUSTRIAL DEVELOPMENT ORGANIZATIONVienna International Centre, P.O. Box 300, 1400 Vienna, AustriaTelephone: (+43-1) 26026-0, Fax: (+43-1) 26926-69E-mail: [email protected], Internet: http://www.unido.org
Printed in Slovakia November 2013 - 700
MEETING STANDARDS, W
INNING MARKETS – EAST ASIA 2013
Regional Trade Standards Compliance Report
East Asia 2013
INSTITUTE OF DEVELOPING ECONOMIES, JAPAN EXTERNAL TRADE ORGANIZATIONWakaba 3-2-2, Mihamaku, Chiba, Chiba Prefecture, 261-8545, JapanTelephone: (+81) 43-299-9535, Fax: (+81) 43-299-9736E-mail: [email protected], Internet: www.ide.go.jp/English/
Disclaimer:No part of this report may be reprinted by any means without written permission from the institute (IDE-JETRO) or UNIDO. This document has been produced without formal United Nations editing. The designations employed and the presentation of the material in this document do not imply the expression of any opinion whatsoever on the part of the Secretariat of the United Nations Industrial Development Organization (UNIDO) concerning the legal status of any country, territory, city or area or of its authorities, or concerning the delimitation of its frontiers or boundaries, or its economic system or degree of development. Designations such as “developed”, “industrialized” and “developing” are intended for statistical convenience and do not neces sarily express a judgment about the stage reached by a particular country or area in the development process. Mention of firm names or commercial products does not constitute an endorsement by UNIDO. The opinions, statistical data and estimates contained in signed articles are the responsibility of the author(s) and should not necessarily be considered as reflecting the views or bearing the endorsement of UNIDO.Similarly, IDE-JETRO maintains that the views expressed in the book are those of the author(s) and neither the Institute of Developing Economies nor the Japan External Trade Organization bears responsibility for them. Although great care has been taken to maintain the accuracy of infor-mation herein, neither UNIDO nor its Member States assume any responsibility for consequences which may arise from the use of the material.
Cover photo: © Paramat Keereewan / Shutterstock.com

Meeting Standards, Winning Markets
Regional Trade Standards Compliance Report
East Asia 2013

ii Regional Trade Standards Compliance Report - East Asia 2013

iii
Acknowledgements
This Regional Trade Standards Compliance Report (TSCR) for East Asia is the outcome of a strategic partnership and coop-eration between UNIDO and IDE-JETRO that started in the spring 2012. The objective of this cooperation is to conduct joint re-search and to present new analytical approaches that help to gain insights about the challenges that East Asian developing countries face in complying with product quality and safety standards and regulations in agri-food trade towards both re-gional and global markets. UNIDO and IDE-JETRO intend that this work will lead to a series of such regional reports.
The present report was prepared by an IDE-JETRO team led by Kaoru Nabeshima (IDE-JETRO) and comprising Tsunehiro Otsuki (Osaka University), Aya Suzuki (University of Tokyo), Vu Hoang Nam (Foreign Trade University), Etsuyo Michida (IDE-JETRO), Ro-mio Mori (JETRO), and Nanae Yamada (IDE-JETRO).
At UNIDO, our counterpart team was led by Steffen Kaeser with Thomas Bernhardt providing research and analytical contribu-tions.
Spencer Henson and John Humphrey from the Institute of Devel-opment Studies (IDS) in Brighton, United Kingdom, carried out the initial analysis of import rejection data on UNIDO’s behalf and prepared the corresponding datasets that were used for this report. They also reviewed and commented earlier drafts.
Dr. Sui Shuyan (Qingdao Agricultural University) provided us with valuable information regarding vegetable production in China while Dr. Nguyen Tri Khiem (An Giang University), Mr. Truong Dinh Hoe (Viet Nam Association of Seafood Export-ers and Producers), Dr. Le Xuan Sinh and Dr. Le Nguyen Doan Khoi (Can Tho University), and Dr. Tu Van Binh (CFVG – French-Vietnamese Center for Management Education) shared with us many insights into the pangasius (catfish) and shrimp sectors in Viet Nam.
The following regulatory authorities provided the original datasets on their rejections of agri-food imports: the Austral-ian Government Department of Agriculture, Fisheries and For-estry (DAFF), the European Commission’s Directorate General for Health and Consumers (DG SANCO), the Japanese Ministry of Health, Labour and Welfare (MHLW), and the United States Food and Drug Administration (FDA). This generous granting of unprecedented access to their import rejection data laid a key foundation for our analyses and the present report.
Ms. Judy Hartley worked as editor and gave the final touch to this report.
The preparations for the report have been greatly facilitated by the financial support that the Norwegian Agency for Develop-ment Cooperation (NORAD) provided to UNIDO for its work on trade standards compliance challenges of developing countries in the framework of the global Trade Standards Compliance Re-port.
Comments and feedback on the report and the analyses under-taken are welcome and can be addressed to: [email protected] and [email protected].

iv Regional Trade Standards Compliance Report - East Asia 2013
Table of Contents
Acknowledgements iii
Acronyms viii
country AbbreviAtions viii
Foreword ix
executive summAry 1
1. AnAlysis oF rejections oF AsiAn Agri-Food exports to globAl mArkets 7
1.1 Introduction 8 1.2 Trends in agricultural and food product exports from East Asia 10 1.3 General trends in import rejections of East Asian agri-food products 13 1.4 Performance of Asian countries in the major markets 15 1.5 Potential pitfalls along the supply chain 21
2. AnAlysis oF jApAnese import rejections oF AsiAn Agri-Food products 25
2.1 Imported food safety inspection system in Japan 25 2.2 General trends in import rejections of agri-food products at Japanese ports 26 2.2.1 Overview of rejected products 27 2.2.2 Reasons for rejections 31 2.2.3 Selected focus on China, Viet Nam, and Thailand 33
3. cAse study: chinese Frozen vegetAble exports 37
3.1 Introduction 37 3.2 Production and distribution of vegetables in China 39 3.2.1 Domestic production of vegetables 39 3.2.2 Vegetable distribution system in China for the domestic and global markets 40 3.3 Exports of Chinese vegetable products 42 3.3.1 The distribution of major importing countries for Chinese vegetable products 43 3.4 Supply chain management by multinational corporations 45 3.5 Conclusions and policy implications 46
4. cAse study: chinese eel exports 49
4.1 Introduction 49 4.2 Trends in trade in live and processed eels 50 4.2.1 Trends in exports of live eels from China 50 4.2.2 Trends in exports of processed eels from China 51 4.3 Import rejections by Japan and underlying reasons for rejections 52 4.3.1 Live eels 52 4.3.2 Processed eels 53 4.3.3 Summary 53 4.4 Eel production in China 53 4.4.1 Moving locations of main production sites 53 4.4.2 The characteristics of eel production in China 53 4.4.3 The schedule of eel culture 54 4.5 Case study of Firm Y 54 4.5.1 Production process 54 4.5.2 Manufacture and export of processed eels 55 4.5.3 Inspections of eels 56

v
Table of Contents
4.5.4 Inspection of growing ponds by the Chinese government 58 4.5.5 Investments in inspection and testing infrastructure 59 4.5.6 Traceability 59 4.5.7 The causes of residues of agricultural chemicals and drugs 59 4.6 Case study of Firm T 60 4.6.1 Distribution of eels 60 4.6.2 The quality control problem from the perspective of middlemen 60 4.7 Conclusions and policy implications 61
5. cAse study: vietnAmese Frozen pAngAsius And shrimp exports 63
5.1 Introduction 63 5.2. History and current trends 65 5.2.1 Overview of the seafood sector in Viet Nam 65 5.2.2 History of and trends in the pangasius industry 70 5.2.3 History of and trends in the shrimp industry 71 5.3 Pangasius value chain and production process 73 5.3.1 Pangasius value chain 73 5.3.2 Pangasius production process 74 5.4 Shrimp value chain and production process 76 5.4.1 Shrimp value chain 76 5.4.2 Shrimp production processes 77 5.5 Compliance with what standards is required by importing countries? 77 5.5.1 What measures are taken in Viet Nam? 80 5.5.2 Observed effects of standards on stakeholders along the value chains 81 5.6 Major issues in import standards compliance 82 5.6.1 Inadequate incentive mechanisms to comply with standards/certificates 82 5.6.2 Weak control of upstream market 83 5.6.3 Still room for non-compliance 83 5.7 Conclusions and policy implications 84
6. conclusion 85
7. reFerences 87
8. Annexes 91
Annex A: Contextualizing trade-related standards 91 Annex B: Overview of Agricultural and Food Exports from East Asia 94 Annex C: Cambodia 95 Annex D: China (including Hong Kong) 97 Annex E: Indonesia 99 Annex F: Malaysia 103 Annex G: Myanmar 105 Annex H: Philippines 107 Annex I: Republic of Korea 110 Annex J: Singapore 113 Annex K: Thailand 115 Annex L: Viet Nam 118

vi Regional Trade Standards Compliance Report - East Asia 2013
List of Tables
Table 1.1: Share of agricultural sector in GDP in East Asian countries (%) 8
Table 1.2: GDP share of food processing industry in East Asian countries (%) 9
Table 1.3: Share of food processing industry in manufacturing in East Asian countries 10
Table 1.4: Share of agriculture/food in total exports (%), 2010 11
Table 1.5: Export market shares of EAP in 2010 (%) 12
Table 1.6: Exports from EAP countries (including Japan) to the EAP region in 2009 (US$1,000) 12
Table 1.7: Vegetables and fish exported to all regions from EAP countries in 2009 (US$1,000) 12
Table 1.8: Import rejection frequency of food and feed in the four markets in 2010 13
Table 1.9: Import rejection cases by product category in 2010 14
Table 1.10: Reasons for import rejections in 2010, rankings in parentheses 14
Table 1.11: Fifteen countries with the most frequent agri-food import rejections and their import shares in 2010 (%) 15
Table 1.12: Rejections per US$ billion imported for food and feed exports from Asian countries in 2010 15
Table 1.13: Reasons for import rejections of agri-food products from Cambodia (%) 17
Table 1.14: Reasons for import rejections of agri-food products from China (%) 17
Table 1.15: Reasons for import rejections of agri-food products from Indonesia (%) 17
Table 1.16: Reasons for import rejections of agri-food products from Lao People’s Democratic Republic (%) 18
Table 1.17: Reasons for import rejections of agri-food products from Malaysia (%) 18
Table 1.18: Reasons for import rejections of agri-food products from Myanmar (%) 18
Table 1.19: Reasons for import rejections of agri-food products from the Philippines (%) 19
Table 1.20: Reasons for import rejections of agri-food products from Thailand (%) 19
Table 1.21: Reasons for import rejections of agri-food products from Viet Nam (%) 19
Table 1.22: Reasons for import rejections of agri-food products from Japan (%) 20
Table 1.23: Reasons for import rejections of agri-food products from The Republic of Korea (%) 20
Table 1.24: Reasons for import rejections of agri-food products from Singapore (%) 20
Table 2.1: Top 10 countries with reported cases of Japanese import rejections, 2006–2010 26
Table 2.2: Shares in food/agriculture imports in Japan (%) 27
Table 2.3: Trends in the number of Japanese import rejections, 2006–2010 27
Table 2.4: Common commodity groups rejected at Japanese ports, 2006–2010 28
Table 2.5: Trends in products with large numbers of Japanese import rejections, 2006–2010 28
Table 2.6: Number of Japanese import rejections of fish and fishery products, 2006–2010 28
Table 2.7: Number of Japanese import rejections of fruit and vegetable products, 2006–2010 30
Table 2.8: Reasons for Japanese import rejections, 2006–2010 32
Table 2.9: Trends in food product groups rejected for “bacterial contamination”, 2006–2010 32
Table 2.10: Countries with a large number of rejections for “bacterial contamination”, 2006–2010 32
Table 2.11: Trends in food product groups rejected for “hygienic conditions”, 2006–2010 33
Table 2.12: Countries with a large number of rejections for “hygienic conditions”, 2006–2010 33
Table 2.13: Trends in food product groups rejected for “pesticide residues”, 2006–2010 33
Table 2.14: Countries with a large number of rejections for “pesticide residues”, 2006–2010 33
Table 2.15: Trends in food product groups of Chinese exports rejected in Japan, 2006–2010 34
Table 2.16: Reasons for Japanese rejections of Chinese food products, 2006–2010 34
Table 2.17: Trends in food product groups of Vietnamese exports rejected in Japan, 2006–2010 34
Table 2.18: Trends in food product groups of Thai exports rejected in Japan, 2006–2010 36
Table 4.1: Main fish and seafood products exported from China in 2010 50
Table 4.2: Trends in Chinese live eel exports, 2008–2012 (first half) 50
Table 4.3: Trends in Chinese processed eel exports, 2006–2012 (first half) (tons) 51
Table 4.4: Trends in unit values of processed eel exports, 2006–2012 (first half) (US$/kg) 51
Table 4.5: Number of Japanese import rejections of fish and fishery products, 2006–2010 52
Table 4.6: Basic characteristics of eel culture of firms dealing with Firm Y 55
Table 4.7: Steps in eel processing 56
Table 4.8: Products inspected by CIQs 58
Table 5.1: Rejections of Vietnamese agri-food exports at major markets 63
Table 5.2: Average rejections of fish and fishery product imports from Viet Nam (per US$ million imports) 64
Table 5.3: Reasons for import rejections of Vietnamese fish and fishery products in selected markets 65
Table 5.4: World seafood producers (in million tons) 66
Table 5.5: Water surface area for seafood production in Viet Nam (in thousand hectares) 66
Table 5.6: Major export products of Viet Nam 67
Table 5.7: Top ten exporters of seafood products 68
Table 5.8: Ten leading importers of Vietnamese aquatic products (US$ million) 68
Table 5.9: Three Vietnamese aquatic products with the largest export values in 2008 69
Table 5.10: Share of import markets for Vietnamese pangasius (%) 69
Table 5.11: Characteristics of pangasius farming sites 73
Table 5.12: List of relevant certifications 78

vii
List of Figures
Figure 1: Prototype of agri-food supply chain - production stages and potential sources of non-compliance 2
Figure 1.1: Agricultural employment (per cent of total employment) in East Asia 8
Figure 1.2: Relevance of agriculture for the economy (2000 and 2010) 9
Figure 1.3: Trends in agricultural and food exports from East Asia, 2000-2010 11
Figure 1.4: Agricultural exports by region 11
Figure 1.5: Food exports by region 11
Figure 1.6: Comparison of agricultural and food product exports for LAC and EAP 11
Figure 1.7: Value of exports to various regions from East Asian countries, 2000-2010 13
Figure 1.8: Share of the Japanese market in exports from East Asia, 2000-2010 13
Figure 1.9: Number of food and feed import rejections in four markets 13
Figure 1.10: Prototype of agri-food supply chain - production stages and potential sources of non-compliance causing rejections 22
Figure 2.1: Japanese import rejections of fish and fishery products per US$ million imports, 2006–2010 29
Figure 2.2: Relationship between the shares in Japanese imports and rejections in fish and fishery products, 2006–2010 29
Figure 2.3: Japanese import rejections of fruits and vegetables per US$ million imports, 2006–2010 30
Figure 2.4: Relationship between import shares and rejections in fruit and vegetable products 31
Figure 2.5: Reasons for Japanese rejections of Vietnamese food products, 2006–2010 35
Figure 2.6: Reasons for rejections of Thai food products in Japan, 2006–2010 35
Figure 3.1: Chinese agro-food trade trends, 1980–2010 38
Figure 3.2: The composition of Chinese agro-food exports (in value terms), 1992–2010 38
Figure 3.3: Share in Japanese rejections of Fruit and Vegetable products among selected East Asian countries, 2006–2010 39
Figure 3.4: Vegetable production trends in China, 1978–2010 40
Figure 3.5: Vegetable distribution system for domestic/global markets in China 41
Figure 3.6: Exports of various vegetable product groups from China (in US$ value) 42
Figure 3.7: Distribution of importers of Chinese fresh vegetables in 2011 (in value) 43
Figure 3.8: Distribution of importers of Chinese frozen vegetables in 2011 (in value) 44
Figure 3.9: Procurement systems for vegetables for export processors in Shandong before and after 2002 45
Figure 3.10: Inspection system for export vegetables 46
Figure 4.1: Production of seafood products in China, 1978–2010 49
Figure 4.2: Main export markets for Chinese seafood products in 2010 (volume base) 50
Figure 4.3: Timeline of eel culture 54
Figure 4.4: Flow of inspections for processed eels in China 57
Figure 4.5: Distribution routes for live and processed eels in China 60
Figure 5.1: Number of rejections by major agriculture commodity group for Vietnamese products exported to four markets, 2006–2010 63
Figure 5.2: Seafood exports from different regions of Viet Nam in 2011 66
Figure 5.3: Total capacity of Vietnamese offshore fishing vessels (thousand CV) 67
Figure 5.4: Export value of Vietnamese fishery products (US$ million) 67
Figure 5.5: Export value of shrimp and pangasius (1997–2011) 68
Figure 5.6: Destinations for Vietnamese pangasius exports 70
Figure 5.7: Pangasius value chain in Viet Nam 72
Figure 5.8: Pangasius products 74
Figure 5.9: Pangasius farm sizes in An Giang province 75
Figure 5.10: Shrimp production value chain (Black Tiger) in Viet Nam 76
Figure 5.11: Quality inspections conducted at each level along the value chain 79

viii Regional Trade Standards Compliance Report - East Asia 2013
ADI acceptable daily intake AQIS Australian Quarantine and Inspection ServiceAQSIQ General Administration of Quality Supervision, Inspection and Quarantine, ChinaASEAN Association of Southeast Asian NationsASTAC Ad Hoc Shrimp Trade Action Committee, United StatesBAP Best Aquaculture PracticesBMP Best Management PracticesBRC British Retail Consortium CFA Catfish Farmers of America CFVG French-Vietnamese Center for Management EducationCIQ Commodity Inspection Quarantine Bureau, China DDT dichlorodiphenyltrichloroethaneDOC United States Department of Commerce EAP ASEAN10 countries, China, Hong Kong (China) and Republic of KoreaFAO Food and Agriculture Organization of the United NationsFDA United States Food and Drug AdministrationGMP Good Manufacturing PracticeGSO General Statistics Office, Viet NamHACCP Hazard Analysis and Critical Control Point HS Harmonized Commodity Description and Coding SystemIDE Institute of Developing EconomiesISO International Organization for StandardizationJAS Japanese Agriculture Standard Law
JETRO Japanese External Trade OrganizationMARD Ministry of Agriculture and Rural Development, Viet Nam MBV monodon baculovirus MHLW Ministry of Health, Labour and Welfare, JapanMNCs multinational corporationsMRLs maximum residue levelsNAFIQAD National Agro-Forestry-Fisheries Quality Assurance Department, Viet Nam NGO non-governmental organizationOASIS Operational and Administrative System for Import Support of the United States FDAOHSAS Occupational Health and Safety Advisory ServicesPAD Pangasius Aquaculture Dialogueppb parts per billionppm parts per millionPRC People’s Republic of ChinaPRD Pearl River DeltaRASFF Rapid Alert System for Food and Feed, EU SEAPRODEX Sea Product Import-Export Corporation, Viet NamSQF Safe Quality FoodsUNIDO United Nations Industrial Development OrganizationUSITC United States International Trade CommissionVASEP Viet Nam Association of Seafood Exporters and ProducersVINAFIS Viet Nam Fisheries SocietyWTO World Trade OrganizationWWF Worldwide Fund for Nature
Acronyms
Country abbreviations
Country Name 3-digit Country Code 2-digit Country Code
Brunei Darussalam BRN BN
Cambodia KHM KH
China, People’s Republic of CHN CN
Hong Kong, China HKG HK
Indonesia IDN ID
Japan JPN JP
Lao People's Democratic Republic LAO LA
Malaysia MYS MY
Myanmar MMR MM
Philippines PHL PH
Singapore SGP SG
Republic of Korea KOR KR
Taiwan Province of China TWN TW
Thailand THA TH
Viet Nam VNM VN

ix
Foreword
East Asian countries have been among the winners of globaliza-tion. In recent decades, a number of East Asian economies have, famously, managed to achieve export-led growth and been rec-ognized for increasing their share in global industrial output and manufacturing trade. This has resulted in more domestic employment, wealth creation and poverty reduction. What has received less attention is that a number of these countries have also been quite successful in expanding their agricultural and food exports.
Yet, even East Asian countries continue to face challenges that prevent them from reaping the full benefits of market opportu-nities in both international and intra-regional trade. To do so, countries need to comply consistently with product quality and safety standards which play an increasingly important role in shaping international trade flows and which are among the main gatekeepers to accessing global markets or supply chains.
In this context, since 2008, UNIDO has taken up the task of systematically analyzing the challenges faced by developing countries as regards compliance with trade standards in the agri-food sector. The results of this work have been widely dis-seminated and published in UNIDO’s Trade Standards Compli-ance (TSC) Report series and its Trade Standards Compliance Footprints.
Building upon a history of joint research on a variety of devel-opment issues including trade capacity-building since 2007, IDE-JETRO and UNIDO have recently entered into a fruitful col-laboration to regionalize this trade standards analysis as a complement to the global TSC work. Such regionalized analyses take specific regional circumstances and conditions into ac-count more effectively, which in turn allows for a more specific tailoring of policy recommendations. In preparing these stud-ies, IDE-JETRO is contributing its expertise on supply chains and the trade challenges faced by developing countries in various regions and particularly in East Asia.
The publication of the present UNIDO–IDE-JETRO Regional Trade Standards Compliance Report for East Asia represents the first outcome of this collaboration. The Institute of Development Studies (IDS) in Brighton, United Kingdom, the main partner for the global TSC work, also contributed to this research.
With the publication of this regional TSC Report, our organiza-tions aim to enhance transparency on trade standards and to increase awareness and understanding of compliance chal-lenges among all stakeholders in East Asian countries, thereby facilitating and supporting the identification of country needs and priorities.
This TSC Report also represents a strategic decision-making support and policy guidance tool. It is intended to assist policymakers, private sector actors, donor agencies, and techni-cal assistance organizations in taking more informed decisions regarding how to best strengthen the trade standards compli-ance performance of East Asian countries and how and where to make related investments. The report, thus, aims to support these stakeholders in the design and development of capacity-building programmes in the fields of trade and compliance.
We intend that this pioneering work by IDE-JETRO and UNIDO will lead to a series of regional reports. We are confident that the present and future regional TSC Reports will prove to be useful resource documents and provide important advocacy support for “smarter” and more targeted trade capacity-building and related quality infrastructure development. Ultimately, it is our hope that these reports and analyses, as global public goods, will contribute to stimulating trade and to increasing both the safety of consumers and the prosperity of producers in East Asia.
Takashi Shiraishi
President
Institute of Developing Economies, Japan External Trade Organization
Li Yong
Director General
United Nations Industrial Development Organization

x Regional Trade Standards Compliance Report - East Asia 2013

1
Executive Summary
Trends in exports and rejections of agricultural food products from East AsiaSince 2000, the value of agricultural and food exports from East Asia1 has steadily increased, although the exports dipped sub-stantially in 2009 reflecting the global slowdown. The growth was such that in 10 years the value of exports has almost dou-bled to US$149 billion, which is similar to the value of exports from Latin America.
Within East Asia, Japan represents a large market for agricul-tural and food exports. In this market, there are a number of East Asian countries that have experienced frequent rejections of their agri-food exports at Japanese ports. These rejections are the result of inspections undertaken by Japanese authorities and indicate that the products in the rejected shipment do not comply with the regulations prevailing in the Japanese market. Similarly, public authorities in other countries refuse and reject the import of agri-food products that are not compliant with their food quality and safety standards and requirements. This report focuses on agri-food products from East Asian countries and analyzes trends, patterns and root causes of such import rejections in four major international markets, namely Australia, the European Union (EU), Japan, and the United States (US).
Among the 10 countries with the highest number of such rejec-tions in the Japanese market, five are from East Asia, including China, Viet Nam, Thailand, Republic of Korea, and Indonesia. Among the agri-food products rejected at Japanese borders, “fish and fishery products” and “fruits and vegetables” are re-jected most frequently. Reasons for such rejections vary. The most common root causes of import rejections by Japanese authorities are bacterial contamination, inadequate hygienic condition/controls, and the presence of pesticide residues, my-cotoxins, and food and feed additives.
When looking at the rate of rejections per US$ billion of imports (an indicator that is termed unit rejection rate) for Asian export-ing countries, food and feed products originating from Japan, Philippines and the Republic of Korea are among the most frequently rejected in the Australian market. In the EU market, China, Thailand and Republic of Korea are among the countries with the highest number of rejections. In the United States mar-
1 In this report, we use the following abbreviation: EAP (East Asia and Pacific), LAC (Latin America and Caribbean), SSA (Sub-Saharan Africa), EU27 (EU 27 countries), SAR (South Asia), AUS (Australia), USA (the United States) and ROW (Rest of the World). This categorization follows the World Bank.
ket, Hong Kong (China), Republic of Korea, Singapore, Viet Nam and China have rather high rejection rates. So, interestingly, not only lower-income countries but also relatively higher-income countries such as Japan and Republic of Korea perform poorly in some markets. For instance, among Asian countries, Japan saw the largest number of rejections in the Australian market in 2010. Food exports from the Republic of Korea seem to struggle in the Australian, EU and United States markets.
There is also a variation in the predominant reasons for rejec-tion across the four markets analyzed here. In Australia and the United States, non-compliance with labelling requirements re-sults in significant levels of rejection while Japan does not reject for labelling reasons and the EU only makes relatively few rejec-tions on this basis. In contrast, bacterial contamination is the most prominent reason for rejections in Japan. Rejections in re-lation to hygiene conditions are significant in the United States.
These rejection reasons all point to certain kinds of problems along the supply chain. Figure 1 displays a prototype of an agri-food supply chain, showing the different production stages and highlighting potential sources of non-compliance which possi-bly lead to rejections by authorities in the importing market. One of the big challenges for East Asia is that food processors cannot meet regulations/standards only with their own efforts but com-pliance often requires farmers and suppliers in the value chain to take measures as well. These farmers and suppliers could be (and typically are) located throughout the world. Hence, various requests to meet food safety regulations/standards need to be communicated well beyond borders.
Measures or incidents that lead to non-compliance with trade standards and international market requirements related to food quality and safety can occur at different stages along the supply chain, as follows (see also Figure 1):
(a) Pesticide residues, contaminants, mycotoxins, heavy metal, and veterinary drugs residues could enter to the food chain at the farming/growing/primary production stage. The oc-currence of non-compliance at this stage of the supply chain may be related to the environment, input procurement or improper usage of these inputs.

2 Regional Trade Standards Compliance Report - East Asia 2013
(b) Compliance issues related to bacterial contamination and hygienic conditions, food and feed additives, adulteration/missing documents, packaging and labeling could occur at the processing stage of the value chain. To avoid or counter this, a proper production management for hygiene controls needs to be in place.
(c) Problems with regard to labeling and documents could oc-cur at the trading stage. As some exporters have more than one market to sell products, they differentiate products de-pending on the quality grade and the requirements of export markets.
(d) At the final stage of the supply chain, problems can occur in the form of non-compliance with private standards and conducting tests required by buyers. Some uncertainties re-main even after product testing is done because importing countries require different testing methods and sampling methods.
(e) Throughout the value chain, hygienic control is crucial. It is needed not only at farm and processors levels but also during transportation and storage. A well-functioning cold chain is also needed to ensure product quality.
The present report examines the challenges of East Asian coun-tries related to the compliance of their agri-food exports with international market requirements and food quality and safety standards, as reflected in the occurrence of import rejections. The report also presents the following four in-depth case stud-ies on important export commodities: frozen vegetables and eel exports from China; and pangasius and shrimp exports from Viet Nam.
Case Studies on Chinese Frozen Vegetables and Eel Value ChainsThe value of Chinese agro-food exports grew rapidly after the late 1990s, and China’s accession to the WTO in 2001 further accelerated this growth. The total export value in 2011 exceed-ed US$40 billion, 3.6 times that of 2000. As Chinese agricul-ture deepened its linkage to the global agro-food market and became a major exporter of all kinds of agro-food products, a number of disputes regarding food safety occurred and the Chinese government has started to pay more attention to food safety problems.
Frozen vegetables value chain
Looking at the vegetables sector, it can be observed that, in the past, Chinese agribusinesses invested in the processing stage and introduced cold chain facilities. Some large-scale foreign-invested firms obtained global certifications for sani-tation management in the processing stage of the value chain to demonstrate compliance with Hazard Analysis and Critical Control Point (HACCP) requirements and ISO standards. But less attention was paid to the safety of production and procurement of inputs (e.g. raw vegetables) and this has led to significant problems regarding compliance.
The prevailing system was deemed insufficient to correct the problem by the Chinese government and the national General Administration of Quality Supervision, Inspection and Quaran-tine (AQSIQ) decided to solve the problem by allowing only large and uncontaminated land to be used for vegetable production aimed at exports. AQSIQ’s Announcement on Inspection and Quarantine of Import and Export Vegetables was put into force in 2002 and specified that a vegetable export firm must have more than 20 hectares of farmland which is assembled into
Figure 1: Prototype of agri-food supply chain - production stages and potential sources of non-compliance
Farmer 1
Farmer 2
Farmer 3
Traders Processors Exporter Importer
Export Market 1
Export Market 2
Export Market 3
Exporting country Importing country
(a)*Input control *Certification *Testing*The environment
(b)*Input control*Production process management*Traceability* Certification*Testing
(c)TestingDifferentiate markets
(d)Inspection at portsSome uncertainties
Source: Author’s own illustration
(e) Hygienic control: necessary throughout value chains including transportation and storage

3
large plots with no prior contamination by banned substances; manage proper pesticide use; ensure traceability; and conduct sample inspection of chemical residuals. Export firms are not al-lowed to purchase vegetables from places other than registered farms; and each registered farm should have a technical exten-sion officer called field man. This system is called the produc-tion base (PB). After the introduction of this system, small-scale processors and brokers who did not have access to PBs were shut out from lucrative export markets completely.
Processed eels value chain
In the case of processed eels imported from China, it was the discovery of antibiotic residues in processed eel in 2002 and the detection of residues of malachite green in subsequent years that raised red flags among Japanese authorities. These incidents have led Japanese authorities to implement moni-toring inspections of eels exported from Guangdong province, which is the main cultured eel production site in China, and to temporary halt all exports from Guangdong province. As a re-sult, exports of live and processed eels from China to Japan de-creased dramatically.
These incidents of antibiotic and malachite green residues in Chinese eel revealed four basic problems. First, sales of agricul-tural chemicals and drugs are poorly managed in China. While the government bans sales and distributions of certain chemi-cals and drugs, these are still widely available in the domestic market. Second, even if proper agricultural chemicals, feeds and drugs are purchased, their applications, usages and dos-ages are not followed properly. Third, contamination of water for eel growing ponds and soil contamination from rotating several different crops and aquaculture are identified as another cause for rejections by importing countries. Sometimes this is beyond the control of farmers because contaminated water could be in-troduced to their ponds through flooding especially during the typhoon season. Fourth, there is a problem of mixing of eels from different producers with varying quality at the aggregation and processing stages. Large processing firms typically are verti-cally integrated and own growing ponds. Once the cultivation is done, eels are exported as live eels or sent to processing plants for further processing. In addition to eels from their own ponds, large firms also purchase from other ponds through middlemen. Small and medium processing firms typically do not have their own growing ponds but rely exclusively on middlemen for the supply of eels needed for processing. Many small and medium firms grow eels for sale in the Chinese domestic market where the standard is less stringent. Some firms buy these eels and mix them with eels meant for exports.
To solve these problems, the Chinese government is now con-sidering revising the current “Regulations on Pesticide Admin-istration”. The envisaged revision would mandate the sellers of agricultural chemicals and drugs to keep sales records and to conduct inspections of these chemicals. It would also place li-censing requirements on vendors of agricultural chemicals and drugs and it would mandate them to properly educate buyers in order to control the sales, distribution and use of agricultural chemicals and drugs.
To ensure the quality of ponds, the Chinese government re-quires that eels meant for exports are now grown in registered
and certified ponds, and they are to be processed only in regis-tered factories. Complementing these official efforts at control-ling inputs and their usages is the increase in the frequency of inspections at various stages of production by both processing firms and government bodies. Some firms have invested in cre-ating a specialized room for inspection, purchased necessary testing equipment, and hired specialized personnel. By doing so, firms can avoid high testing fees and are able to offer testing services to other firms to generate more revenue. In addition, measures like these help to introduce a traceability system.
Case Study on Vietnamese Pangasius and Shrimp Value ChainsViet Nam is now among the top ten exporters of fish and fish-ery products and has moved up quickly in the ranking from the ninth rank in 2000 to the fourth in 2010. In 2010, Viet Nam was only after China, Norway, and Thailand in exporting fish and fishery products. Among Viet Nam’s seafood exports, pangasi-us and shrimp play important roles. Yet, in recent years some of the seafood exports from Viet Nam have had difficulties in meeting the regulations of importing countries.
In Japanese ports, consignments of Vietnamese seafood have been the major target of intensive inspection in recent years. In May 2012, a shipment of shrimp to a Japanese port from Viet Nam was found to contain Ethoxyquin and this has triggered even more scrutiny regarding shrimp imports from Viet Nam by Japanese authorities. This incident was preceded by the detec-tions in Vietnamese shrimps of Trifluralin in 2010 and Enrofloxa-cin in 2011. Both are banned substances in shrimp according to Japanese regulations. Shrimp exporters interviewed are ex-pressing great concern over this issue and mentioned that many of the exporters are now refraining from exporting to Japan due to the fear of being detected once again. This could jeopardize future export growth in shrimp.
Data collected by EU, United States, Australian and Japanese authorities all point to relatively high incidents of rejections of Vietnamese fishery and aquaculture products. Over the last couple of years, 2,400 export consignments of Vietnamese fish and fishery products have been rejected by United States au-thorities (between 2002 and 2010), 422 shipments have been rejected by EU authorities (2002-2010) while Japanese and Aus-tralian authorities have refused market entry to 464 (between 2006-2010) and 206 Vietnamese shipments (2003-2010), re-spectively.
Among various agriculture commodities, fish and fishery prod-ucts on average seem to face rather high rejection rates when scaled by US$ million imports (i.e. unit rejection rates). In the Japanese market, Viet Nam’s unit rejection rate is the highest among all exporters of fish and fishery products while in the EU Viet Nam ranks ninth.
Looking at the root causes of non-compliance underlying the im-port rejections, one sees that fish and fishery products from Viet Nam are rejected for various reasons in the different markets. In the Japanese market, many rejections occur due to the pres-ence of bacterial contaminants and veterinary drug residues. In

4 Regional Trade Standards Compliance Report - East Asia 2013
the EU market, veterinary drugs residues, bacterial contamina-tion, and detection of heavy metal appear to be problems. In the United States market, compliance with requirements related to hygienic conditions, bacterial contamination, and labeling seem to pose difficulties for Viet Nam fishery exporters. In the Australian market, the bulk of rejections is caused by bacterial contamination, labeling issues, and veterinary drugs residues. This tells us that various weak links exist in the supply chain of fishery and aquaculture products from Viet Nam.
A key problem of the Vietnamese fishery industry seems to lie in the improper usage of inputs. Intensive cultivation of pangasius has led to high frequency of disease and this, in turn, has in-creased the application of prophylactic therapeutic treatments. Similarly, intensive farming of shrimp has necessitated increas-ing usage of antibiotics.
Many processing firms in the Vietnamese pangasius industry have obtained certification on quality management systems such as HACCP, ISO 9001:2000, and SQF 2000. Shrimp process-ing firms typically also obtain various certificates. In addition, most of the exporters also have in-house laboratories to check chemical residue levels in the products destined for export markets. They test the residue level before purchasing from traders or smallholders and before shipping to export. In inter-views conducted for this study, some Vietnamese exporters also mentioned the use of outside labs which can detect antibiotics more accurately for shipment to countries like Japan where the requirements are very stringent. Processors which have a spe-cial relationship with foreign importing firms (i.e., subsidiary firms, long-term suppliers, contractors) are in a better position to receive technical advice and information about the required standards relative to independent firms.
Over time, the pangasius industry has seen an increase in the number of large farms and a decline in the number of relatively small farms. It is noted that pangasius production is more capi-tal intensive compared to other aquaculture production so that smaller farmers cannot compete with larger ones. Processors are shifting the sourcing from smaller farmers to larger ones be-cause the latter can provide them with fish that are of higher quality and better meet standard requirements.
Meanwhile, in the shrimp industry, collectors and/or wholesale buyers collect shrimps from different grow-out farmers and mix them together. This makes it more difficult for the processing companies to trace out the shrimps and ensure their quality than when buying shrimps directly from contracted farmers.
Overall, the greatest difficulty of compliance appears to lie at the level of small-scale producers as there are a large number of them and many even do not know the relevant standards and what they require.
Various governmental and nongovernmental organizations are regulating and facilitating the development of the aquatic sec-tor in Viet Nam. The Ministry of Agriculture and Rural Develop-ment (MARD) and provincial Departments of Agriculture and Rural Development are the central and local governmental agen-cies, respectively, that manage the development of Viet Nam’s aquaculture industry. Under MARD, the National Agro-Forestry-Fisheries Quality Assurance Department (NAFIQAD) consisting of six regional centers in Viet Nam is in charge of food safety as-surance and quality control in the aquaculture industry. Among their activities and responsibilities, one that is important to the seafood export sector is the regular implementation of moni-toring inspections for harmful substances, which are conducted annually according to the “Residue Monitoring Programme for Certain Harmful Substances in Aquaculture Fish and Products”. The monitoring programme is considered to follow the levels of requirements by the EU. Besides these state administration agencies, the Viet Nam Association of Seafood Exporters and Producers (VASEP) and the Viet Nam Fisheries Society (VINAFIS) play an effective role in promoting the development of the in-dustry.
Summary of key findings and policy lessons
This report analyzes trends and patterns in rejections of agri-food exports from East Asian countries to the Japanese and oth-er key international markets. Special attention is given to four commodities from two countries: frozen vegetables and eels from China; and pangasius and shrimp exports from Viet Nam. These case studies were chosen because they are significant export commodities for these countries that, at the same time, face difficulties in clearing inspections at ports.
One finding that clearly came out from looking at these four commodities and their supply chains is that export activities in these countries are increasingly vertically integrating. This is because to meet the standards set by importing countries (es-pecially those of advanced countries), exporting firms need to put in place some kind of traceability system so that they can identify where the problem occurred and how to deal with such problems when faced with import rejections.

5
The implication of this trend to vertically integrate is the bifur-cation of these industries into export-oriented and domestic-oriented segments. Those that are export-oriented are typically led by large firms that can invest in their own quality control and inspection equipment. They also tend to contract with large farmers for their inputs and provide technical assistance if nec-essary. In contrast, domestic-oriented firms do not have such capacity to strictly control the quality of their products to the level required by importing countries. Both in China and Viet Nam the government is putting in place stricter domestic stand-ards regarding agricultural and food products, partly motivated by the requirements coming from the export sectors. As income rises, the demand for safer food will only increase also in the domestic markets. Action plans and measures to improve the quality of agricultural and food products should be initiated now so that even smallholder farmers can adjust their produc-tion processes to meet higher standards in both international and domestic markets. Without such efforts, small-hold farm-ers will be further left behind which could potentially lead to an increase in inequality between export- and domestic-oriented sectors, and also between rural and urban areas.
The case studies in these two countries reveal that throughout the supply chain, there are still knowledge gaps among different players with respect to the proper usage of agriculture chemi-cals and medicines. For cultured aquatic products, in addition to the knowledge on medicines, sufficient knowledge on feeds is also required. To improve upon this knowledge aspect, two efforts need to be undertaken. The first is to raise the aware-ness among farmers and processors on the proper usages of agriculture chemicals, medicines, and feeds. Such effort needs to be coupled with proper technical assistance so that farmers can readily apply their knowledge in practice. In addition to the awareness raising efforts, the distribution of these chemicals, medicines, and feeds needs to be controlled and recorded more stringently to enable traceability. Furthermore, this kind of ef-forts should not be restricted to certain sectors but should be
applied to a wider variety of commodities if applicable to allow rotation of crops or aquatic products to be cultured and to pre-vent negative spillovers coming from other farming activities conducted nearby.
Some markets (notably the EU and the United States) put em-phasis on obtaining internationally recognized certification (e.g. to ISO or HACCP standards) and this is becoming a nec-essary condition to export. These certificates work as signaling devices at the processing stage. While difficulties in obtaining such certificates differ across Asian export countries, public as-sistance to firms may be necessary.
Some firms find it difficult to continuously scan and gather information on the required rules and standards of importing countries, especially when these rules and standards are sub-ject to frequent changes. Industrial associations or similar or-ganizations should have enough capacities to follow the trends in these standards. What is important is that such effort should include not only notifying concerned actors on the changes in the rules and standards, but also to let these players know of anticipated changes in these standards so that they have enough lead time to prepare until changes take effect.
Finally, as the case of China illustrates, the presence of foreign direct investment often provides great benefit to the develop-ment of the local industry. Multinational corporations (MNCs) typically have enough experience and capacity to meet the re-quirements set by importing countries. In addition, they tend to provide necessary technical assistance to local producers so that their products can meet prevailing trade standards. Through these kinds of vertical technology transfer, the com-petitiveness of local industries can be greatly enhanced. Thus, in addition to strengthening the capabilities through domestic efforts, liberalization of foreign direct investment in this sector could be pursued simultaneously.

6 Regional Trade Standards Compliance Report - East Asia 2013

7
For developing countries, securing export markets for their agri-food products is an important source of economic growth and employment. However, to be successful, exporters need to meet the food safety and quality regulations and requirements imposed by the importing countries through sanitary and phy-tosanitary measures. Inability to meet public regulations re-sults in shipments being rejected at the border. Many countries continue to experience challenges to consistently comply with quality and safety standards and requirements that prevail in international markets. Such instances of non-compliance are reflected in incidents where agri-food products that they want to export are rejected by authorities in the import market. These import rejections do not only have an immediate impact in the form of interrupted trade flows and foregone export revenues but might also harm the country’s reputation as an exporter of a certain commodity or product group.
Furthermore, there have been increasing concerns on food safe-ty issues in recent years because of a number of highly publi-cized “food scares” and “food scandals” both in developed and developing countries. As a consequence, related regulations and requirements have become more stringent. This can have a large impact on the exporters from developing countries, and their development prospects and their efforts to reduce poverty.
Identifying what causes import rejections will help export-ing countries better comply with the food safety and quality standards of importing countries and reduce the number of re-jections. The standards or requirements are often not uniform across countries. Rather, there are variations among countries reflecting differences stemming from climate, geography, peo-ple’s tastes and other factors. Therefore it is necessary to deter-mine whether products are rejected because of the standards or requirements imposed by a certain importing country or be-cause of root causes that are common across different import markets. If commonalities and differences in reasons for rejec-tion in different markets are identified, it is easier for exporting countries to understand what kinds of general measures to take to reduce rejections across markets and what specific measures are needed in certain markets. Yet, this issue has been rather neglected in economic research until recently because of pauci-ty of data. Much of the previous research on quality compliance issues of agri-food product exports from developing countries is based on specific case studies.
In light of this situation, UNIDO has compiled an internation-ally comparable dataset on import rejections for major import-ing markets (the United States and the EU) and published the first Trade Standards Compliance Report (TSCR) (UNIDO 2010)
in 2010. The data gathered and presented in the TSCR ena-bled stakeholders (including policymakers, international de-velopment organizations, donor agencies and researchers) to compare the performance of each country in terms of its trade standards compliance capabilities. The data also allow for an estimation of the financial implications of non-compliance. For instance, an estimated US$18 million worth of fish and fishery products exported from Asian countries to the United States market were lost in 2010 due to import rejections. From 2002 to 2010, the accumulated figure was US$285 million. Similarly, for other products, the lost opportunities loom large.
The present report builds on the previous TSCR while expand-ing the data coverage by adding Japan and Australia as import-ing markets. In addition, this report regionalizes the analysis by paying specific attention to exporting countries in East Asia. Countries examined in this report are: Brunei Darussalam, Cam-bodia, China, Indonesia, Japan, Republic of Korea, Lao People’s Democratic Republic, Malaysia, Myanmar, the Philippines, Sin-gapore, Thailand, and Viet Nam. The TSCR 2010 provided an analysis of global trends and patterns in import rejections in the agri-food sector. Meanwhile, the present regional report focuses on the performance of East Asian countries and analyzes their trade standards compliance capabilities in more detail, using the updated import rejection data compiled by UNIDO as well as providing in-depth case studies of selected agri-food supply chains in China and Viet Nam. Trade in agri-food products is or-ganized through specific supply chains linking different stages of production and marketing, although such supply chains are shorter and simpler compared to those associated with manu-factured goods. Because supply chains play an important role, the capacity to meet food safety standards rests on the capabili-ties of actors along the supply chain. The case studies in this report will examine each element in a supply chain in order to clearly identify the weak(est) links in a specific chain that may result in rejections in export markets. This kind of analysis will enable policymakers to identify the issues that warrant public interventions.
The structure of the report is as follows: chapter 1 provides an overview of overall trends in the export performance and trade standards compliance performance of East Asian countries in the agri-food sector. Chapter 2 examines the performance of East Asian countries in an important importing market in East Asia, namely the Japanese market. Chapters 3 to 5 look at specific agri-food product supply chains. Chapter 3 presents a case study on frozen vegetable exports from China. Chapter 4 provides a case study on the supply chain for cultured eels exported from China. Chapter 5 looks into seafood (pangasius
1. Analysis of Rejections of Asian Agri-food Exports to Global Markets

8 Regional Trade Standards Compliance Report - East Asia 2013
and shrimp) exports from Viet Nam. The annexes provide more information for each country to complement the analyses pro-vided in the report.
1.1 Introduction
As industrialisation has progressed in East Asia, agriculture’s share in GDP declined from a substantial 22.1 per cent, on aver-age, in 1990 to 15.6 per cent by 2000 and further to 11.9 per cent in 2010. The share of agricultural employment in total employ-ment has also declined from 32.3 per cent in 2000 to 15.8 per cent in 2009. These figures imply that East Asia is rapidly turn-ing away from agriculture. However, a country-by-country exami-nation reveals that agriculture still plays an essential role in eco-nomic development in many East Asian countries although the way in which agriculture contributes to economic development differs across countries.
In high-income countries – namely, Brunei Darussalam, Japan, Singapore and Republic of Korea – the GDP share of agriculture is small (less than 3 per cent in 2010) whereas in low-income countries such as Cambodia and Lao People’s Democratic Re-public it is over 30 per cent, showing a high dependency on the agricultural sector (see Table 1.1). Table 1.1 shows that middle-income countries such as Thailand, Malaysia, Indonesia, the Philippines and Viet Nam are also highly dependent on agri-culture, with its share in GDP ranging from 10 to 20 per cent. They are also active exporters of agricultural and food products. When we focus on the low- and middle-income countries in the region, the share of agricultural employment is still high, ac-counting for around 40 to 50 per cent. The importance of agri-culture in creating employment is explicitly described by Richter (2006: 46) for Thailand:
While the importance of agriculture as job provider has declined across the country, agriculture remains the dominant employer, even during the off-season, still providing jobs to more than 45 to 50 per cent of workers in the north, northeast and south. The key sector that provides monthly wage jobs in the northeast, north or south is services rather than industry.
This tendency can be observed in other East Asian countries as well (see Figure 1.1).
Note: East Asia is defined as comprising Brunei Darussalam, Cambodia, Indonesia, Malaysia, Lao People’s Democratic Re-public, Myanmar, Philippines, Singapore, Thailand, Viet Nam, China, Hong Kong (China), Macao (China), Japan, Democratic People’s Republic of Korea and Republic of Korea.
The importance and role of the agricultural sector can vary ac-cording to stage of economic development. The World Develop-ment Report 2008 (World Bank, 2008) categorises the way that agriculture contributes to a country’s economic development into three types: agriculture-based, transforming, and urban-ised countries. In agriculture-based countries, which are typi-cally low-income countries, agriculture itself contributes to eco-nomic growth due to its dominance in the country’s production. In transforming countries, which are mostly middle-income agri-cultural exporting countries in East Asia, agriculture is no longer
the engine of growth, but the engine of poverty reduction along with structural transformation (see Figure 1.2). In urbanised or industrialised countries, agriculture is a minor industry, but it remains important through its direct and indirect role in protect-ing the natural environment alongside further industrialisation.In agriculture-based countries such as Lao People’s Democratic Republic, Cambodia and Myanmar, growth in their agricultural sectors through technological progress has considerably con-tributed to economic growth. As a result, economic growth has led to poverty reduction for the majority of their populations be-cause poor people tend to be concentrated in rural areas. These countries mainly produce agricultural products for domestic consumption, as shown in Figure 1.2, because they do not have
Table 1.1: Share of agricultural sector in GDP in East Asian countries (%)
Country 1990 2000 2010
Brunei Darussalam 1.0 1.0 0.8
Cambodia - 37.8 36.0
China 27.1 15.1 10.1
Hong Kong, China - 0.09 -
Indonesia 19.4 15.6 15.3
Japan 2.1 1.5 1.2
Republic of Korea 8.9 4.6 2.6
Lao PDR 61.2 45.2 32.7
Macao, China - 0 0
Malaysia 15.2 8.6 10.6
Myanmar 57.3 57.2 -
Philippines 21.9 14.0 12.3
Singapore 0.3 0.1 0.03
Thailand 12.5 9.0 12.4
Viet Nam 38.7 24.5 20.6
Average (all East Asia) 22.1 15.6 11.9
Average (Japan and Republic of Korea excluded)
25.5 17.6 13.7
Source: World Bank World Development Indicators database
Figure 1.1: Agricultural employment (per cent of total employment) in East Asia
10
15
20
25
30
35
40
1990
1991
1992
1993
1994
1995
1996
1997
1998
1999
2000
2001
2002
2003
2004
2005
2006
2007
2008
2009
Shar
e of
Agr
icul
tura
l Em
ploy
men
t
(% o
f tot
al e
mpl
oym
ent)
East Asia
East Asia (except JPN and KOR)
Source: World Bank World Development Indicators database

9
Table 1.2: GDP share of food processing industry in East Asian countries (%)
Year
Countries
Cambodia ChinaHong Kong,
China
Macao,
ChinaIndonesia Japan
Republic of
KoreaMalaysia Philippines Thailand Viet Nam
1991 - 4.77 - 0.27 5.54 2.37 2.90 2.71 8.29 2.61 -
1992 - 4.35 - 0.21 5.51 2.47 2.81 2.76 7.58 - -
1993 4.71 4.34 - 0.23 5.20 2.46 2.70 2.58 8.23 5.92 -
1994 - 4.72 - 0.26 4.72 2.48 2.56 2.49 7.50 4.76 -
1995 1.90 4.56 - 0.23 4.59 2.45 2.32 2.73 7.36 - -
1996 - 5.07 - 0.27 4.14 2.41 2.37 2.45 6.59 6.37 -
1997 - 5.31 - 0.30 - 2.37 2.27 2.37 6.44 - -
1998 - 5.14 - 0.34 5.33 2.50 2.43 - 8.16 7.66 5.19
1999 - 4.90 - 0.34 5.12 2.59 2.48 3.04 6.56 - -
2000 1.11 4.62 0.24 0.38 4.99 2.54 2.33 2.47 - 5.95 5.60
2001 - 4.49 0.28 0.39 6.08 2.51 2.15 2.59 7.03 - -
2002 - 4.50 0.32 0.31 5.59 2.58 2.04 2.54 - 5.76 -
2003 - 4.22 0.29 0.20 7.07 2.51 1.94 2.53 5.98 - -
2004 - 3.87 0.27 0.19 6.95 2.46 2.02 2.38 - - -
2005 - 3.95 0.25 0.17 6.84 2.37 1.82 2.74 5.66 - -
2006 - 3.90 0.27 0.17 7.03 2.28 1.71 2.64 5.28 5.50 -
2007 - 3.88 0.30 0.29 6.94 2.30 - 2.52 2.51 - -
2008 - - 0.28 0.25 - - - - 2.56 - -
Source: World Bank World Development Indicators database
Figure 1.2: Relevance of agriculture for the economy (2000 and 2010)
Agriculture position across countries in 2000
Share of Agriculture Export (% of Export)
•Cambodia
•Thailand
•Indonesia•China
•
• •
•••Japan
•ASEAN 10
Shar
e of
Agr
icul
ture
Sec
tor (
% o
f GDP
)
60
40
20
00 10 20 30
• •
Agriculture position across countries in 2010
Share of Agriculture Export (% of Export)
•Cambodia
•Thailand•Indonesia
•Malaysia
•
••
••Korea•Japan
•ASEAN 10
Shar
e of
Agr
icul
ture
Sec
tor (
% o
f GDP
)
30
10
40
20
00 105 15 20 25
• •
Philippines
East AsiaSingapore
Korea
Macao Lao Macao
East Asia
Lao Singapore
AveragePhilippines
Average
•Malaysia
•Vietnam •Vietnam
•China
Source: World Bank World Development Indicators database
sufficient capacity to produce enough for export. Thus, growth in agricultural value added through adoption of advanced tech-nology and new crops can serve as a key engine of economic growth, and it is an essential step towards becoming an active exporter of agricultural products.
Thailand, Viet Nam, the Philippines, and Indonesia as well as China, are categorised as transforming countries according to World Development Report 2008 (World Bank, 2008), and have exhibited rapid economic growth through industrialisation. While industrialisation primarily benefits the urban population, rural poverty tends to be less severe than in the pre-industri-

10 Regional Trade Standards Compliance Report - East Asia 2013
alisation period because industrialisation is often made possi-ble by sufficient agricultural productivity. Agriculture no longer plays the prominent role that it did in the early stages of devel-opment in these countries. Thus, it is more appropriate to view growth in the agricultural sector as a means of reducing pov-erty and inequality, particularly between rural and urban areas in the transforming countries. History tells us that the growth success stories in England, the United States, Japan, and Re-public of Korea were initiated with an increase in agricultural productivity and this view is postulated by a number of studies. Most importantly, the agricultural sector provides labour for the manufacturing sector (e.g., Johnston and Mellor, 1961).
Furthermore, transforming countries tend to be actively engaged in agricultural and food export on account of their technological capacity and comparative agricultural advantage, even though their main strategic interest is in moving towards manufacturing production. Thus, it is important for the region and other regions to liberalise trade through reduction of tariff and non-tariff bar-riers so that these countries can take full advantage of export opportunities.
At the initial stages of industrialisation, the food processing in-dustry typically emerges and serves as a primal buyer of agri-cultural products. In East Asia, the food processing industry ac-counted on average for 2.7 per cent of GDP and 14.0 per cent of manufacturing industry in 2007. In agriculture-based countries, the GDP share of the processing industry is very low (for exam-ple, 1.1 per cent in Cambodia), but in transforming countries the share ranges from roughly 2 to 5 per cent (see Table 1.2 and Table 1.3). The food processing industry also employs a large
number of workers in terms of total manufacturing employment. It has strong backward linkages with the agricultural sector, and the growth of the food processing sector leads to growth of the agricultural sector (Anriquez and Stamoulis, 2007).
1.2 Trends in agricultural and food product exports from East AsiaSince 2000, the value of agricultural and food exports from East Asia1 has steadily increased, although exports dipped sub-stantially in 2009 reflecting the global slowdown. The growth was such that in ten years the value of exports almost doubled. When agricultural and food products are separated, the trend is similar, with the value of agricultural products about twice that of the food exports. In fact, both move almost hand-in-hand (see Figure 1.3). In terms of total exports, agricultural and food products account for only 2.3 per cent and 1.3 per cent of ex-ports in East Asia2, respectively (see Table 1.4). Relative to other countries or regions, the share of these products in total exports is rather small, reflecting the fact that the bulk of East Asia’s ex-ports are dominated by manufactured goods. In contrast to East
1 This report uses the following abbreviations: EAP (East Asia and the Pacific); LAC (Latin America and Caribbean); SSA (Sub-Saharan Africa); EU27 (EU 27 countries); SAR (South Asia); AUS (Australia); US (the United States); and ROW (Rest of the World). These categories reflect World Bank practice.2 East Asia consists of ASEAN10 countries (Brunei Darussalam, Cam-bodia, Indonesia, Lao People’s Democratic Republic, Malaysia, Myanmar, The Philippines, Singapore, Thailand, Viet Nam), China (including Hong Kong), Japan and Republic of Korea.
Table 1.3: Share of food processing industry in manufacturing in East Asian countries
Year
Countries
Cambodia ChinaHong Kong,
China
Macao,
ChinaIndonesia Japan
Republic of
KoreaMalaysia Philippines Thailand Viet Nam
1991 53.17 14.67 10.18 1.87 25.97 8.91 10.58 10.60 32.76 9.26 -
1992 20.02 13.30 10.09 1.80 25.09 9.63 10.56 10.71 31.33 - -
1993 - 12.77 10.29 2.59 23.33 10.18 10.06 9.96 34.70 19.96 -
1994 - 14.05 12.68 3.16 20.23 10.70 9.39 9.34 32.26 16.10 -
1995 - 13.54 10.50 3.10 19.00 10.58 8.41 10.34 32.01 - -
1996 - 15.12 11.80 3.50 16.18 10.37 8.87 8.80 28.88 21.43 -
1997 - 16.00 10.33 3.73 - 10.28 8.61 8.37 28.91 - -
1998 - 16.15 11.62 3.68 21.32 11.08 8.89 - 34.80 24.81 30.30
1999 - 15.51 7.93 4.00 19.69 11.70 8.83 9.84 27.96 - -
2000 6.56 14.39 7.16 4.87 18.00 11.43 8.26 7.99 - 17.70 30.19
2001 - 14.18 9.04 4.45 20.92 12.01 8.09 8.82 28.52 - -
2002 - 14.34 11.38 3.30 19.45 12.49 7.79 8.68 - 17.10 -
2003 - 12.84 10.99 3.59 25.03 11.97 7.52 8.44 24.27 - -
2004 - 11.97 10.77 4.06 24.78 11.58 7.30 7.85 - - -
2005 - 12.15 10.27 4.36 24.96 10.98 6.60 9.24 23.55 - -
2006 - 11.85 11.57 10.19 25.54 10.71 6.32 8.98 22.34 15.69 -
2007 - 11.81 14.48 12.01 25.64 10.83 - 9.07 - - -
2008 - - 14.42 - - - - - - - -
Source: World Bank World Development Indicators database

11
Asia, Latin American countries rely heavily on agricultural and food product exports. Close to one fifth of exports from Latin American countries comes from agricultural and food products (see Table 1.4). Other countries and regions also rely on exports of agricultural goods and/or food products.
Although the shares of agricultural and food product exports are small in East Asia, in value terms, East Asia’s exports of agricul-tural and food products are substantial. The EU is by far the larg-est exporter of agricultural and food products in the world (see Figure 1.4 and Figure 1.5). After the EU, East Asia is the second or third largest exporting region in the world, competing head-to-head with Latin American countries. In fact, East Asia and Latin America export similar amounts of agricultural and food prod-ucts (see Figure 1.6). Even though East Asian countries export widely to many countries, for agricultural and food exports the regional market of East Asia is the main market. In 2010, close to half (47.5 per cent) of agricultural and food exports from East Asia were destined for East Asian countries, followed by 11.8 per cent to the EU and 10.5 per cent to the United States (see Table 1.5). Although the export share to the East Asia region has de-clined by 8.3 per cent since 2000, in terms of absolute export values, East Asia itself is still the major market and is rapidly growing (see Figure 1.7). At country level, agricultural and food exports from China (including Hong Kong) to the East Asian mar-ket are the largest (see Table 1.6). Special attention should be given to frozen fishery products and frozen vegetable products because they account for a significant proportion of exports from East Asian countries (in 2009 frozen fishery products accounted for 17.6 per cent of foodstuff exports from East Asia and frozen vegetable products for 7.4 per cent (see Table 1.7)). China is a
Table 1.4: Share of agriculture/food in total exports (%), 2010
EAP AUS EU27 LAC SAR SSA US ROW
Agriculture 2.3 8.7 4.6 11.3 7.9 6.2 6.9 3.7
Food 1.3 2.1 3.8 6.9 2.0 5.1 2.5 2.3
Ag + Food 3.6 10.8 8.2 18.2 9.9 11.3 9.4 6.0
Other 96.4 89.3 91.7 81.8 90.1 88.8 90.6 94.1
Source: UN Comtrade database
Figure 1.4: Agricultural exports by region
0
50,000
100,000
150,000
200,000
250,000
2000 2002 2004 2006 2008 2010
mill
ion
US$
EAP
SAR
USA
LAC
SSA
EU27
AUS
Source: UN Comtrade database
Figure 1.5: Food exports by region
0
50,000
100,000
150,000
200,000
2000 2002 2004 2006 2008 2010
mill
ion
US$
EAP
SAR
USA
LAC
SSA
EU27
AUS
Source: UN Comtrade database
Figure 1.3: Trends in agricultural and food exports from East Asia, 2000-2010
0
10,000
20,000
30,000
40,000
50,000
60,000
70,000
80,000
90,000
100,000
Agro
Food
2000
2001
2002
2003
2004
2005
2006
2007
2008
2009
2010
mill
ion
US$
Source: UN Comtrade database
Figure 1.6: Comparison of agricultural and food product exports for LAC and EAP
0
20,000
40,000
60,000
80,000
100,000
120,000
2000 2002 2004 2006 2008 2010
mill
ion
US$
LAC_Ag
EAP_Ag
LAC_Food
EAP_Food
Source: UN Comtrade database

12 Regional Trade Standards Compliance Report - East Asia 2013
Table 1.5: Export market shares of EAP in 2010 (%)
Agriculture Food Agriculture + Food
Total Export Value US$95,781,988 US$52,964,880 US$148,746,868
AUS 0.9 3.0 1.6
EAP 44.7 52.7 47.5
EU27 12.7 10.2 11.8
LAC 1.9 1.8 1.9
SAR 11.3 2.0 8.0
SSA 4.6 2.2 3.8
US 8.5 14.1 10.5
ROW 15.4 14.0 14.9
Total 100.0 100.0 100.0
Source: UN Comtrade database
Table 1.6: Exports from EAP countries (including Japan) to the EAP region in 2009 (US$1,000)
Agriculture Food
Total 36,954,990 Total 23,078,8002
China
(incl. Hong Kong)
12,798,299 China
(incl. Hong Kong)
8,692,790
Indonesia 5,706,039 Thailand 4,935,365
Malaysia 5,912,405 Singapore 2,801,643
Thailand 4,558,444 Malaysia 1,858,311
Viet Nam 4,098,922 Indonesia 1,363,946
Republic of Korea 1,303,970 Republic of Korea 1,296,740
Japan 1,064,869 Japan 1,151,994
Singapore 762,033 Viet Nam 638,476
Philippines 738,053 Philippines 333,977
Myanmar NA Myanmar NA
Cambodia 11,956 Cambodia 5,560
Source: UN Comtrade database
Table 1.7: Vegetables and fish exported to all regions from EAP countries in 2009 (US$1,000)
Vegetables
7.4% of Agriculture
Fish/Shrimps/Eels
17.6% of Agriculture
Total 6,251,024 Total 14,933,252
China (incl. Hong Kong) 5,491,024 (87.8%) China (incl. Hong Kong) 5,575,876 (37.3%)
Indonesia 60,477 (1.0%) Viet Nam 3,313,391 (22.2%)
Thailand 589,030 (9.4%) Thailand 3,255,106 (21.8%)
Viet Nam 48,556 (0.8%) Indonesia 1,337,594 (9.0%)
Malaysia 45,249 (0.7%) Republic of Korea 513,284 (3.4%)
Singapore 7,430 (0.1%) Malaysia 367,960 (2.5%)
Japan 6,295 (0.1%) Japan 372,068 (2.5%)
Republic of Korea 1,744 (<0.1%) Philippines 98,992 (0.7%)
Philippines 1,219 (<0.1%) Singapore 98,980 (0.7%)
Note: Vegetables include codes 0710 and 2004 of the Harmonized Commodity Description and Coding System (HS). The HS codes for fish are 030269, 030379, 030410, 030420 and 030490; 030613, 030623 and 160520 for shrimps; and 030192, 030266 and 030376 for eels.
Source: UN Comtrade database

13
leading exporter of both frozen fishery and vegetable products in East Asia. Within East Asia, Japan is a main importer of both agricultural and food products. In 2010, the Japanese market represented 20 per cent of the market for agricultural exports from East Asian countries and one-third of food product exports (see Figure 1.8). In addition, the Japanese market is considered to be highly sophisticated (i.e. exporters and sellers can expect higher margins) and also to have stricter standards. Success in the Japanese market can be a sign of better competitiveness in other markets. Because the Japanese market is a significant market in East Asia, this report emphasises Japanese import re-jections of shipments coming from other East Asian countries.
1.3 General trends in import rejections of East Asian agri-food products
Figure 1.9 shows the numbers of import rejections in four key in-ternational markets between 2002 and 2010. The United States records the highest number of rejections of around 8,000 to 10,000 each year while the EU, Australia and Japan reject around 1,000 to 2,000 consignments of imported food every year.
As the number of rejections depends, amongst other things, on the number of imports, the frequency of rejections per im-port value, the so-called unit rejection rate (UNIDO, 2010), is a more telling indicator than the absolute numbers. Table 1.8, thus, compares this unit rejection rate across the four markets. Australia rejects food and feed products most frequently among the four markets with 214 detentions per US$ billion imported, followed by 86 for the United States, 22 for Japan, and 17 for the EU.
The frequency of rejections varies among the importing coun-tries for various reasons. Among these, the most important is that types of imported food and feed products vary across mar-kets. In Australia, imports of beverages accounted for 0.7 per cent of Australia’s total import value in 2010 and these are the largest category within the food sector, followed by preserved food (0.4 per cent), baking-related products (0.4 per cent), and fish and seafood (0.3 per cent). In the EU, fish and seafood (0.9 per cent) form the largest import category among food products followed by edible fruits (0.8 per cent), and nuts, spices, cof-fee and tea (0.5 per cent). In Japan, fish and seafood account
Figure 1.7: Value of exports to various regions from East Asian countries, 2000-2010
0
20,000
40,000
60,000
80,000
10,000
30,000
50,000
70,000
2000 2002 2004 2006 2008 2010
US$
Mill
ion
USA
SSA
SAR
LAC
EU27
EAP
AUS
Source: UN Comtrade database
Figure 1.8: Share of the Japanese market in exports from East Asia, 2000-2010
0%
10%
30%
50%
60%
20%
40%
2000 2002 2004 2006 2008 20102001 2003 2005 2007 2009
Ag
Food
Source: UN Comtrade database
Figure 1.9: Number of food and feed import rejections in four markets
0
2,000
6,000
10,000
4,000
8,000
2002 2004 2006 2008 20102003 2005 2007 2009
EU
USA
AU
Japan
Note: Data for Australia start from 2003, data for Japan start from the latter half of 2006.
Source: UNIDO dataset and analysis, based on EU RASFF, US OASIS, AQIS, and Japanese MHLW data
Table 1.8: Import rejection frequency of food and feed in the four markets in 2010
Japan Australia EU USA
Import value (US$ million) 61,421 6,974 125,436 99,258
Rejections 1,338 1,492 2,171 8,513
Unit rejection rate (Rejections per US$ billion)
22 214 17 86
Source: UNIDO dataset and analysis, based on EU RASFF, US OASIS, AQIS, and Japanese MHLW data

14 Regional Trade Standards Compliance Report - East Asia 2013
for most food imports, making up 1.7 per cent of total imports, followed by meat (1.2 per cent) and cereals (1.0 per cent). In the United States, beverages are the largest product category consisting of 0.8 per cent, then fish and seafood (0.6 per cent), edible fruit and nuts (0.5 per cent) and spices, coffee and tea (0.3 per cent) follow. As Table 1.9 shows, rejection frequency dif-
fers across food products, which might lead to different rejec-tion frequencies across countries with different product import structures. Secondly, as discussed earlier, food safety stand-ards and related requirements, including those regarding label-ling and packaging, differ between countries. Table 1.10 shows the reasons for rejection in the four major importing markets in
Table 1.9: Import rejection cases by product category in 2010
Product category
Australia EU United States Japan
Cases Share (in %) Cases Share (in %) Cases Share (in %) Cases Share (in %)
Beverage 188 11.8 43 2 504 6.0 172 12.9
Cereals and bakery products 349 22.0 111 5.1 1,164 13.9 195 14.6
Confectionery and sugar 44 2.8 37 1.7 829 9.9 139 10.4
Dairy 94 5.9 26 1.2 329 3.9 19 1.4
Fats and vegetable and animal oils
26 1.6 17 0.8 32 0.4 19 1.4
Feed materials 0 0.0 116 5.3 206 2.5 0 0.0
Fish and fishery products 237 14.9 421 19.4 1,627 19.4 295 22.0
Food additives 0 0.0 0 0 35 0.4 18 1.3
Fruits and vegetables and products
207 13.0 425 19.6 2,053 24.5 231 17.3
Herbs and spices 77 4.8 205 9.4 889 10.6 41 3.1
Meat and meat products 18 1.1 88 4.1 14 0.2 95 7.1
Nuts, nut products and seeds
75 4.7 522 24 159 1.9 104 7.8
Other processed foods 272 17.1 159 7.3 527 6.3 9 0.7
Other products of animal origin
1 0.1 1 0 0 0.0 1 0.1
Total 1,588 100 2,171 100 8,368 100 1,338 100
Source: UNIDO dataset and analysis, based on EU RASFF, US OASIS, AQIS, and Japanese MHLW data
Table 1.10: Reasons for import rejections in 2010, rankings in parentheses
Reason for rejection Australia Japan United States EU
Labelling 1,165 (1) 0 5,843 (1) 16 (13)
Bacterial contamination 219 (2) 311 (1) 1,350 (5) 253 (4)
Adulteration/missing document 218 (3) 8 (9) 1,472 (4) 166 (6)
Other contaminants 89 (4) 32 (7) 188 (7) 132 (7)
Pesticide residues 73 (5) 265 (3) 738 (6) 347 (2)
Heavy metal 25 (6) 11 (8) 38 (9) 71 (9)
Mycotoxins 39 (7) 149 (5) 26 (10) 679 (1)
Veterinary drugs residues 20 (8) 86 (6) 180 (8) 58 (11)
Additive 21 (9) 178 (4) 1,816 (3) 291 (3)
Hygienic condition/controls 0 287 (2) 2,046 (2) 238 (5)
Other microbiological contaminants 0 0 N/A 123 (8)
Packaging N/A 0 13 (12) 40 (12)
Others 41 11 (8) 19 (11) 69 (10)
Total 1,910 1,338 13,729 2,483
Note: Reasons for rejections are sorted according to Australia’s ranking of reasons. The number in parentheses indicates the rank.
Source: UNIDO dataset and analysis, based on EU RASFF, US OASIS, AQIS, and Japanese MHLW data

15
2010. For example, Australia does not list packaging as a rea-son for rejection while the EU does not list “other microbiologi-cal contaminants”. Moreover, among the consolidated list of reasons, their composition is diverse across the four markets. While Australia and the United States record labelling as the most frequent reason for rejection, Japan reports no cases of rejection through non-compliance in labelling and the EU re-ports very few problems related to labelling. The weights and stringency of each rejection reason vary across countries; some markets have more stringent food safety standards than others and some markets have more detailed labelling requirements and so on. Thirdly, the methods used to check, sample and test can also differ. Fourth, the frequency of inspections also differs across markets.
1.4 Performance of Asian countries in the major markets
To improve capacity to meet the standards imposed by an im-porting country, the commonalities and differences in rejections across markets need to be analyzed. Specifically, one needs to examine in detail the reasons for rejections to identify rejection reasons that are common across the importing countries and those that are specific to certain markets. By identifying com-mon challenges across importing markets, an exporting country could take effective general measures to enhance competitive-ness across the markets. In addition, some markets have spe-cific requirements that exporting countries are finding difficult to meet, in which case it is in the interests of exporting countries to pinpoint the exact causes of these difficulties in order to over-come them.
Table 1.11 lists the 15 countries with the most frequent agri-food import rejections in each importing market to show the relative performance of exporting countries. Among Asian countries, China, Indonesia, Thailand and Viet Nam tend to experience more rejections across the four major markets. Comparing the rejection rates and import shares reveals that the number of re-jections is not well correlated with the import shares. For exam-
Table 1.11: Fifteen countries with the most frequent agri-food import rejections and their import shares in 2010 (%)
Japan Australia EU United States
Rank Import share Import share Import share Import share
1 China 14.0 China 6.9 Iran 0.3 Mexico 15.4
2 United States 24.4 Japan 0.6 Turkey 3.5 India 1.9
3 Viet Nam 1.7 India 1.6 China 5.2 China 6.4
4 Thailand 6.1 United States 10.6 India 3.0 UK 2.2
5 Ghana 0.2 Thailand 7.0 United States 7.6 Canada 16.6
6 Ecuador 0.3 Italy 4.1 Thailand 2.6 Viet Nam 2.0
7 Indonesia 1.8 Philippines 0.4 Brazil 8.4Dominican Republic
0.5
8 Italy 1.2 Rep. of Korea 0.7 Argentina 4.2 Thailand 4.2
9 Rep. of Korea 2.9 Malaysia 4.1 Viet Nam 2.1 Japan 0.8
10 Canada 6.4 Viet Nam 2.9 Indonesia 3.1 Indonesia 2.4
11 India 1.5 Indonesia 1.8 Egypt 0.6 Rep. of Korea 0.5
12 France 2.6 France 3.2 Ghana 0.3 Philippines 1.2
13 Philippines 2.0 UK 3.2 Morocco 2.8 France 3.5
14 Brazil 4.0 South Africa 0.9 Ukraine 1.6 Italy 3.5
15 Australia 7.1 Sri Lanka 0.4 Nigeria 0.6 Pakistan 0.1
Note: Ranking is according to total cases during 2006–2010 for Japan, 2003–2010 for Australia, 2002–2010 for the EU, and 2002–2010 for the United States
Source: UNIDO dataset and analysis, based on EU RASFF, US OASIS, AQIS, and Japanese MHLW data, UN Comtrade
Table 1.12: Rejections per US$ billion imported for food and feed exports from Asian countries in 2010
Japan Australia EU US
Cambodia 0 0 0 0
China 29 298 45 150
Hong Kong, China 18 888 0 431
Indonesia 40 215 6 142
Japan - 1,972 11 183
Republic of Korea 22 1,649 32 363
Lao PDR 150 0 0 0
Malaysia 5 85 5 60
Myanmar 47 106 0 0
Philippines 15 1,111 8 162
Singapore 8 18 0 231
Thailand 30 108 36 75
United States 11 127 16 -
Viet Nam 111 164 27 181
Source: UNIDO dataset and analysis, based on EU RASFF, US OASIS, AQIS, and Japanese MHLW data

16 Regional Trade Standards Compliance Report - East Asia 2013
ple, in the three importing markets of Japan, Australia and the EU, China ranks higher than the United States in terms of the number of rejections, despite the fact that there are more im-ports from the United States than from China in these markets. Similarly, in Japan and the United States, Viet Nam is reported to have higher rejection rates than Thailand, Republic of Korea and France, all of which have larger import shares than Viet Nam in these markets.
Rejections per US$ billion imported or rejection rates for Asian exporting countries are calculated in Table 1.12. In the Japanese market, Lao People’s Democratic Republic and Viet Nam have higher rejection rates relative to other exporting countries. In Australia, food and feed products exported from Japan, Repub-lic of Korea and the Philippines are most frequently rejected. In the EU, China, Thailand and Republic of Korea have relatively more rejections. Most of the Asian countries perform relatively well against their competitors in one market and less well in other markets. And there is a variation of rejection frequency across the four markets. Interestingly, relatively higher-income countries such as Japan and Republic of Korea perform poorly in some markets. For instance, among Asian countries, Japan saw the largest number of rejections in the Australian market in 2010 while Republic of Korea seems to struggle in the Australian, EU and United States markets.
Table 1.13 to Table 1.20 show the reasons for rejections of agri-food exports from Asian countries across four markets. Some characteristics of the markets can be observed. In Australia and the United States, non-compliance with labelling requirements results in significant levels of rejection while Japan does not re-ject for labelling reasons and the EU only makes relatively few rejections on this basis. In contrast, bacterial contamination is the most prominent reason for rejections in Japan. Rejections in relation to hygiene conditions are significant in the United States. Let us now look more closely at the individual East Asian countries’ performance.
Cambodia has relatively few rejections in each market (see Ta-ble 1.13): One case for the EU in 2002–2010, one case for Japan in 2006–2010, two cases for Australia in 2003–2010 and 10 cases for the United States in 2002–2010. Among the reasons for rejection, bacterial contamination is common across all four markets.
China experiences far more rejections than Cambodia (see Table 1.14). Every year, the number of rejections is 317 for Australia, 238 for the EU, 369 for Japan and 1,080 for the United States on average. Reasons for rejection of Chinese exports vary among the four markets. The most frequent reason for rejection in the EU is detection of mycotoxins, while bacterial contamination as well as pesticide residues are more frequently cited in Japan. The United States rejects Chinese exports most frequently for non-compliance with hygienic standards while Australia rejects most frequently for labelling non-compliance.
For Indonesia, the average number of rejections each year is 40 for the EU, 375 for the United States, 38 for Japan and 59 for Australia. In the United States, bacterial contamination and hygienic condition/control are among the top reasons for rejec-tions. In Japan, veterinary drugs residues and bacterial contami-nation are the most important causes of import rejections. The
major reason for rejection in the EU is detection of heavy metals as well as veterinary drugs residues (see Table 1.14).
For Lao People’s Democratic Republic, there are no rejection cases reported in Australia, the EU or United States. There were only three cases recorded in Japan during 2006–2010. The top rejection reason is pesticide residues (see Table 1.15).
For Malaysia, the annual average number of rejections is 17 for the EU, 85 for the United States, four for Japan, and 63 for Aus-tralia. In both the EU and Japan, bacterial contamination and additives are the major reasons to reject Malaysian imports (see Table 1.16). Labelling is the most frequent reason given in Aus-tralia.
For Myanmar, the number of rejections is small: 12 for the Unit-ed States; eight for Australia; two for the EU; and 17 for Japan. Labelling is the most frequent reason for rejection in the United States and Australia. Veterinary drugs and other contaminants are the most frequent reasons cited by the EU while in Japan, major rejection reasons are pesticide residues and mycotoxins (see Table 1.17).
For the Philippines, the number of rejections is 343 for the United States, 76 for Australia, 27 for Japan and 16 for the EU. Adulteration and/or missing documents are among the top re-jection reasons for the United States, Australia, and the EU (see Table 1.18). Japan rejected a lot of Philippine products because of bacterial contamination.
For Thai exports, 392 rejections for the United States, 119 for the EU, 110 for Japan and 97 for Australia are recorded every year on average. Among those rejections, bacterial contamination is the most frequent reason in Japan, the EU, the United States and Australia (see Table 1.19). Pesticide residues are also an important reason for rejection in the EU, Japan and Australia. Veterinary drugs residues matter in the EU. Hygienic condition/controls are problems in the United States and Japan. Labelling is the most frequent reason cited in Australia.
For Viet Nam, the number of rejections is 64 for Australia, 81 for the EU, 113 for Japan and 512 for the United States on average. Bacterial contamination is a common reason for rejection in all four countries (see Table 1.20). In addition to these rejections, veterinary drugs residues are the major reason for rejections in Japan and the EU. Reflecting market characteristics, non-com-pliance with hygienic conditions in the United States and label-ling in Australia are frequent reasons for rejections.
Rejection reasons such as bacterial contamination, pesticide residues and veterinary drugs residues indicate that compli-ance issues have their origin at the farming stage of the produc-tion process. And these appear among the most frequent rea-sons for rejections of food exported from developing countries, including in East Asia.
To compare the situation between developed countries and developing countries, Japan, Republic of Korea, and Singapore are taken as examples. For Japan as an exporter, the number of rejections is 473 for the United States, 148 for Australia and 75 for the EU. The most frequent reason cited in the United States and Australia is either non-compliance with labelling require-

17
Table 1.13: Reasons for import rejections of agri-food products from Cambodia (%)
Myc
otox
ins
Addi
tives
Bact
eria
l con
tam
inat
ion
Vete
rinar
y dr
ugs
resi
dues
Pest
icid
e re
sidu
es
Oth
er c
onta
min
ants
Hea
vy m
etal
s
Adul
tera
tion/
mis
sing
do
cum
ent
Hyg
ieni
c co
nditi
on/
cont
rols
Oth
er m
icro
biol
ogic
al
cont
amin
ants
Labe
lling
Pack
agin
g
Oth
ers
EU 0 0 100 0 0 0 0 0 0 0 0 0 0
US 0 0 20 10 0 10 0 0 30 NA 30 0 0
JPN 100 0 0 0 0 0 0 0 0 0 0 NA 0
AUS 0 0 50 0 0 0 0 0 0 0 50 0 0
Note: The recorded period is 2002–2010 for the EU and United States, 2003–2010 for Australia and 2006–2010 for Japan. The number represents the share of rejection reasons in each market.
Source: UNIDO dataset and analysis, based on EU RASFF, US OASIS, AQIS, and Japanese MHLW data
Table 1.14: Reasons for import rejections of agri-food products from China (%)
Myc
otox
ins
Addi
tives
Bact
eria
l con
tam
inat
ion
Vete
rinar
y dr
ugs
resi
dues
Pest
icid
e re
sidu
es
Oth
er c
onta
min
ants
Hea
vy m
etal
s
Adul
tera
tion/
mis
sing
do
cum
ent
Hyg
ieni
c co
nditi
on/
cont
rols
Oth
er m
icro
biol
ogic
al
cont
amin
ants
Labe
lling
Pack
agin
g
Oth
ers
EU 30.0 15.3 3.2 13.9 1.4 8.5 4.0 10.6 3.4 4.1 1.2 0.9 3.6
US 0.1 19.6 4.9 7.9 5.0 2.5 0.1 15.3 24.1 NA 19.9 0.2 0.5
JPN 6.7 15.1 26.5 15.9 23.5 2.2 0.2 2.1 2.9 0.1 0.0 0.1 4.7
AU 4.1 1.0 7.2 3.6 2.4 0.9 8.4 5.4 0.4 0.0 61.9 NA 4.8
Note: The recorded period is 2002–2010 for the EU and United States, 2003–2010 for Australia and 2006–2010 for Japan. The number represents the share of reasons for rejections in each market.
Source: UNIDO dataset and analysis, based on EU RASFF, US OASIS, AQIS, and Japanese MHLW data
Table 1.15: Reasons for import rejections of agri-food products from Indonesia (%)
Myc
otox
ins
Addi
tives
Bact
eria
l con
tam
inat
ion
Vete
rinar
y dr
ugs
resi
dues
Pest
icid
e re
sidu
es
Oth
er c
onta
min
ants
Hea
vy m
etal
s
Adul
tera
tion/
mis
sing
do
cum
ent
Hyg
ieni
c co
nditi
on/
cont
rols
Oth
er m
icro
biol
ogic
al
cont
amin
ants
Labe
lling
Pack
agin
g
Oth
ers
EU 7.6 12.0 7.6 20.4 0.6 14.0 26.3 0.6 3.1 5.0 0.3 0.3 2.2
US 0.2 4.9 24.4 4.3 0.0 4.4 0.0 11.1 38.8 NA 11.8 0.0 0.1
JPN 4.8 3.7 26.1 33.5 9.6 4.8 0.0 0.0 16.0 0.0 0.0 0.0 1.6
AUS 8.7 1.5 5.9 0.4 1.3 7.8 6.1 7.8 0.0 0.0 59.0 1.5 NA
Note: The recorded period is 2002–2010 for the EU and United States, 2003–2010 for Australia and 2006–2010 for Japan. The number represents the share of rejection reasons in each market.
Source: UNIDO dataset and analysis, based on EU RASFF, US OASIS, AQIS, and Japanese MHLW data

18 Regional Trade Standards Compliance Report - East Asia 2013
Table 1.16: Reasons for import rejections of agri-food products from Lao People’s Democratic Republic (%)
Myc
otox
ins
Addi
tives
Bact
eria
l con
tam
inat
ion
Vete
rinar
y dr
ugs
resi
dues
Pest
icid
e re
sidu
es
Oth
er c
onta
min
ants
Hea
vy m
etal
s
Adul
tera
tion/
mis
sing
do
cum
ent
Hyg
ieni
c co
nditi
on/
cont
rols
Oth
er m
icro
biol
ogic
al
cont
amin
ants
Labe
lling
Pack
agin
g
Oth
er
JPN 25.0 0.0 0.0 0.0 75.0 0.0 0.0 0.0 0.0 0.0 0.0 0.0 0.0
Note: The recorded period is 2006–2010 for Japan. The number represents the share of rejection reasons in each market.
Source: UNIDO dataset and analysis, based on EU RASFF, US OASIS, AQIS, and Japanese MHLW data
Table 1.17: Reasons for import rejections of agri-food products from Malaysia (%)
Myc
otox
ins
Addi
tives
Bact
eria
l con
tam
inat
ion
Vete
rinar
y dr
ugs
resi
dues
Pest
icid
e re
sidu
es
Oth
er c
onta
min
ants
Hea
vy m
etal
s
Adul
tera
tion/
mis
sing
do
cum
ent
Hyg
ieni
c co
nditi
on/
cont
rols
Oth
er m
icro
biol
ogic
al
cont
amin
ants
Labe
lling
Pack
agin
g
Oth
ers
EU 4.0 13.9 44.4 7.3 0.7 13.9 0.7 4.6 0.7 2.6 2.0 0.0 5.3
US 0.0 10.2 10.5 3.7 0.1 1.7 0.0 27.7 21.5 0.0 24.4 0.0 0.1
JPN 5.0 45.0 35.0 5.0 0.0 10.0 0.0 0.0 0.0 0.0 0.0 0.0 0.0
AUS 4.2 0.0 7.8 0.2 1.2 0.6 1.2 3.4 1.2 0.2 78.1 NA 2.0
Note: The recorded period is 2002–2010 for the EU and United States, 2003–2010 for Australia and 2006–2010 for Japan. The number represents the share of rejection reasons in each market.
Source: UNIDO dataset and analysis, based on EU RASFF, US OASIS, AQIS, and Japanese MHLW data
Table 1.18: Reasons for import rejections of agri-food products from Myanmar (%)
Myc
otox
ins
Addi
tives
Bact
eria
l con
tam
inat
ion
Vete
rinar
y dr
ugs
resi
dues
Pest
icid
e re
sidu
es
Oth
er c
onta
min
ants
Hea
vy m
etal
s
Adul
tera
tion/
mis
sing
do
cum
ent
Hyg
ieni
c co
nditi
on/
cont
rols
Oth
er m
icro
biol
ogic
al
cont
amin
ants
Labe
lling
Pack
agin
g
Oth
ers
EU 0.0 0.0 0.0 58.8 0.0 35.3 0.0 0.0 0.0 5.9 0.0 0.0 0.0
US 0.0 0.9 11.7 0.0 0.0 0.9 0.0 0.0 16.2 NA 70.3 0.0 0.0
JPN 29.4 0.0 0.0 0.0 58.8 11.8 0.0 0.0 0.0 0.0 0.0 0.0 0.0
AUS 6.5 0.0 0.0 0.0 0.0 4.8 0.0 6.5 0.0 NA 67.7 NA 14.5
Note: The recorded period is 2002–2010 for the EU and United States, 2003–2010 for Australia and 2006–2010 for Japan. The number represents the share of reasons for detentions in each market.
Source: UNIDO dataset and analysis, based on EU RASFF, US OASIS, AQIS, and Japanese MHLW data

19
Table 1.19: Reasons for import rejections of agri-food products from the Philippines (%)
Myc
otox
ins
Addi
tives
Bact
eria
l con
tam
inat
ion
Vete
rinar
y dr
ugs
resi
dues
Pest
icid
e re
sidu
es
Oth
er c
onta
min
ants
Hea
vy m
etal
s
Adul
tera
tion/
mis
sing
do
cum
ent
Hyg
ieni
c co
nditi
on/
cont
rols
Oth
er m
icro
biol
ogic
al
cont
amin
ants
Labe
lling
Pack
agin
g
Oth
ers
EU 17.0 22.0 3.5 7.8 0.0 19.1 3.5 19.1 2.1 0.0 0.7 1.4 3.5
US 0.1 13.7 7.3 0.0 0.4 2.8 0.0 26.2 28.1 NA 21.2 0.2 0.1
JPN 1.5 15.0 52.6 0.0 17.3 3.8 1.5 0.0 5.3 0.8 0.0 0.0 2.3
AUS 5.6 0.3 1.1 0.0 0.2 4.8 2.5 15.1 0.3 0.0 67.9 NA 2.3
Note: The recorded period is 2002–2010 for the EU and United States, 2003–2010 for Australia and 2006–2010 for Japan. The number represents the share of rejection reasons in each market.
Source: UNIDO dataset and analysis, based on EU RASFF, US OASIS, AQIS, and Japanese MHLW data
Table 1.20: Reasons for import rejections of agri-food products from Thailand (%)
Myc
otox
ins
Addi
tives
Bact
eria
l con
tam
inat
ion
Vete
rinar
y dr
ugs
resi
dues
Pest
icid
e re
sidu
es
Oth
er c
onta
min
ants
Hea
vy m
etal
s
Adul
tera
tion/
mis
sing
do
cum
ent
Hyg
ieni
c co
nditi
on/
cont
rols
Oth
er m
icro
biol
ogic
al
cont
amin
ants
Labe
lling
Pack
agin
g
Oth
ers
EU 2.2 11.7 25.8 17.9 23.6 5.9 5.1 0.9 1.6 2.0 0.1 0.5 2.7
US 0.1 8.4 13.2 0.6 2.2 0.7 0.0 20.9 31.9 NA 21.9 0.0 0.1
JPN 6.9 6.8 53.8 2.7 11.3 1.5 0.0 0.0 16.8 0.0 0.0 0.0 0.2
AUS NA 0.4 5.7 1.0 5.2 9.2 2.8 5.8 1.8 0.0 63.0 NA 2.1
Note: The recorded period is 2002–2010 for EU and United States, 2003–2010 for Australia and 2006–2010 for Japan. The number represents the share of rejection reasons in each market.
Source: UNIDO dataset and analysis, based on EU RASFF, US OASIS, AQIS, and Japanese MHLW data
Table 1.21: Reasons for import rejections of agri-food products from Viet Nam (%)
Myc
otox
ins
Addi
tives
Bact
eria
l con
tam
inat
ion
Vete
rinar
y dr
ugs
resi
dues
Pest
icid
e re
sidu
es
Oth
er c
onta
min
ants
Hea
vy m
etal
s
Adul
tera
tion/
mis
sing
do
cum
ent
Hyg
ieni
c co
nditi
on/
cont
rols
Oth
er m
icro
biol
ogic
al
cont
amin
ants
Labe
lling
Pack
agin
g
Oth
ers
EU 3.2 10.8 23.4 27.3 2.1 9.1 8.4 2.5 3.9 4.8 0.3 0.6 3.7
US 0.7 8.7 23.6 3.8 0.4 4.6 0.0 10.6 25.4 NA 21.6 0.0 0.5
JPN 1.2 5.7 25.8 52.8 8.9 0.2 0.0 0.0 4.1 0.0 0.0 0.4 1.1
AUS 1.4 2.7 25.1 8.6 1.0 3.9 1.8 2.1 0.2 0.0 51.7 NA 1.6
Note: The recorded period is 2002–2010 for the EU and United States, 2003–2010 for Australia and 2006–2010 for Japan. The number represents the share of rejection reasons in each market.
Source: UNIDO dataset and analysis, based on EU RASFF, US OASIS, AQIS, and Japanese MHLW data

20 Regional Trade Standards Compliance Report - East Asia 2013
Table 1.22: Reasons for import rejections of agri-food products from Japan (%)
Myc
otox
ins
Addi
tives
Bact
eria
l con
tam
inat
ion
Vete
rinar
y dr
ugs
resi
dues
Pest
icid
e re
sidu
es
Oth
er c
onta
min
ants
Hea
vy m
etal
s
Adul
tera
tion/
mis
sing
do
cum
ent
Hyg
ieni
c co
nditi
on/c
on-
trol
s
Oth
er m
icro
biol
ogic
al
cont
amin
ants
Labe
lling
Pack
agin
g
Oth
ers
EU 1.3 52.0 0.0 4.0 6.7 6.7 17.3 6.7 0.0 0.0 0.0 0.0 5.3
US 0.0 9.2 2.2 0.0 0.2 0.5 0.0 44.6 8.4 NA 34.9 0.0 0.0
AUS 0.0 0.1 2.5 0.1 0.3 3.0 0.2 25.1 0.0 0.0 67.1 NA 1.5
Note: The recorded period is 2002–2010 for the EU and United States, 2003–2010 for Australia. The number represents the share of rejection rea-sons in each market.
Source: UNIDO dataset and analysis, based on EU RASFF, US OASIS, AQIS, and Japanese MHLW data
Table 1.23: Reasons for import rejections of agri-food products from The Republic of Korea (%)
Myc
otox
ins
Addi
tives
Bact
eria
l con
tam
inat
ion
Vete
rinar
y dr
ugs
resi
dues
Pest
icid
e re
sidu
es
Oth
er c
onta
min
ants
Hea
vy m
etal
s
Adul
tera
tion/
mis
sing
do
cum
ent
Hyg
ieni
c co
nditi
on/c
on-
trol
s
Oth
er m
icro
biol
ogic
al
cont
amin
ants
Labe
lling
Pack
agin
g
Oth
ers
EU 1.0 26.2 5.8 6.8 1.9 3.9 9.7 8.7 1.0 1.0 1.9 3.9 28.2
US 34.6 12.8 4.8 0.0 0.9 0.7 0.0 37.0 9.0 NA 34.6 0.0 0.2
JPN 0.6 12.8 42.8 1.1 33.3 0.0 0.0 1.1 5.6 0.0 0.0 0.0 2.8
AUS 0.0 0.6 5.1 0.0 1.3 2.1 0.0 15.7 0.9 0.0 72.9 NA 1.3
Note: The recorded period is 2002–2010 for the EU and United States, 2003–2010 for Australia and 2006–2010 for Japan. The num-ber represents the share of rejection reasons in each market.Source: UNIDO dataset and analysis, based on EU RASFF, US OASIS, AQIS, and Japanese MHLW data
Table 1.24: Reasons for import rejections of agri-food products from Singapore (%)
Myc
otox
ins
Addi
tives
Bact
eria
l con
tam
inat
ion
Vete
rinar
y dr
ugs
resi
dues
Pest
icid
e re
sidu
es
Oth
er c
onta
min
ants
Hea
vy m
etal
s
Adul
tera
tion/
mis
sing
do
cum
ent
Hyg
ieni
c co
nditi
on/c
on-
trol
s
Oth
er m
icro
biol
ogic
al
cont
amin
ants
Labe
lling
Pack
agin
g
Oth
ers
EU 9.2 4.2 0.8 0.8 0.0 3.4 75.6 0.8 0.0 0.0 0.0 0.0 5.0
US 1.1 3.7 13.7 0.0 0.0 19.2 0.0 13.7 37.3 NA 11.4 0.0 0.0
JPN 14.3 71.4 0.0 0.0 0.0 0.0 0.0 14.3 0.0 0.0 0.0 0.0 0.0
AUS 1.6 0.5 1.6 1.1 3.3 1.6 2.7 0.5 1.6 0.0 83.2 NA 2.2
Note: The recorded period is 2002–2010 for the EU and United States, 2003–2010 for Australia and 2006–2010 for Japan. The number represents the share of rejection reasons in each market.
Source: UNIDO dataset and analysis, based on EU RASFF, US OASIS, AQIS, and Japanese MHLW data

21
ments or adulteration/missing documents (see Table 1.21). Meanwhile, in the EU, additives and heavy metals are among the most common reasons for rejections.
For Republic of Korea, the average number of rejections is 379 for the United States, 66 for Australia, 36 for Japan and 11 for the EU. Labelling and adulteration/missing documents are again the major reasons for Australian and United States rejections (see Table 1.22). Among other major reasons, improper use of additives for the EU, detections of mycotoxins for the United States and bacterial contamination and pesticide residues for Japan need to be noted.
For Singapore, the number of rejections is 30 for the United States, 23 for Australia, 13 for the EU and 7 for Japan. The most frequent reason for Australia is labelling non-compliance. Heavy metals provoke the most rejections in the EU while in Japan it is the improper use of additives (see Table 1.23).
So, to sum up, for relatively higher-income countries, knowl-edge and implementation of importer food safety standards such as labelling and documentation are the major source of problems. In addition, reflecting the fact that exports from these countries are concentrated more in processed foods with higher value added, non-compliance with additive requirements is a common reason for rejections.
In general, the distribution of rejection reasons reflects the characteristics of export product categories and suggests which food production processes can be upgraded to meet import standards. In the next section, we therefore delineate the re-lationship between supply chain management and its implica-tions for standards compliance.
1.5 Potential pitfalls along the supply chain
While the total value of agricultural and food products exported from East Asia has steadily increased, it is mainly driven by intra-regional trade, and export growth to key markets in developed countries such as the EU, the United States, Japan and Australia is slower. One of the reasons is that these markets require ex-porters to meet tighter mandatory food safety regulations estab-lished by public authorities as well as standards set by various private and international entities. As we have seen, rejections of agriculture and food products exported from Asia have occurred due to non-compliance with national/regional mandatory food safety regulations for various reasons such as pesticides, mi-crobacteria and hygiene standards. Judged by import rejection rates, cases of non-compliance are not an insignificant phe-nomenon. Therefore, to win key markets, meeting regulations has remained a major challenge. Moreover, food safety regula-tions imposed by importing countries are becoming increas-ingly stringent over time, especially in developed countries. In addition, driven by consumer demand and competition among larger supermarket chains in the developed countries which aim to differentiate their products from others (Henson and Rear-don, 2005), various private standards have been introduced, especially in the EU. In an environment where regulations and standards become stricter, it is important for developing coun-tries in Asia to be compliant and competitive food suppliers to
the important markets such as the United States, EU, Australia and Japan by meeting their regulations and standards. This re-port has assumed the task of examining the challenges facing Asian farmers and food producers and of outlining possible ac-tion plans and measures to tackle compliance problems in order to improve product quality and meet market requirements. In the following, we will look at the issue of compliance (capacity and challenges) through a supply chain lens.As was highlighted in previous sections, the most common reasons for rejections of agri-food imports cited by Australian, EU, Japanese and United States authorities are bacterial contamination, pesticide resi-dues, other contaminants and mycotoxins.
Figure 1.10 summarizes the root causes and possible sources of these problems along food value chains.
In a globalised world, suppliers of materials such as feed for fish or pesticides for agro products are located around the globe and supply of such inputs may come from domestic producers or foreign ones. For example, in a typical shrimp product value chain in Viet Nam, feed is imported from Chile or Peru, chemi-cals from Canada and other inputs are from domestic markets. Cultured shrimps are finally exported to multiple markets over-seas. One of the big challenges for East Asia is that a processor cannot meet import regulations and/or standards on its own; it is often necessary for farmers and suppliers along the entire value chain to take measures as well. Various requests to meet food safety regulations and standards need to be communicat-ed well beyond an exporter’s national borders.
As can be seen in Figure 1.10, issues of non-compliance can emerge at different stages of the supply chain, as follows:
(a) Pesticide residues, contaminants, mycotoxins, heavy met-als, veterinary drug residues could all enter the food chain at the the farming/growing/primary production stage. This is primarily related to input procurement. Let’s start with the processor. The processor procures inputs from farmers, say shrimp farms. In order for their processed food to comply with regulations/standards, the processor needs to procure from farmers who grow shrimps in a compliant way. If farm-ers are not familiar with requirements or do not recognise their importance, they may be tempted to use prohibited but cheap pesticides, antibiotics, feed and so on. In this way, contaminants exceeding permitted levels can be in-troduced into the food chain through farmer inputs. Insuf-ficient knowledge or recognition of inputs and regulations is definitely among the key explanations for import rejections. There are further reasons for inadequate input control. For instance, even if farmers are familiar with the requirements, they might not know the good substitutes. As the Viet Nam case study shows, shrimp feed is imported from Chile and Peru because domestic feed isn’t suitable for growing qual-ity shrimps, but mycotoxins have been introduced through the imported feed. Despite being aware of the problem, it is not easy for farmers to find a better substitute and it takes time for farmers to reduce the contamination level by chang-ing inputs. Another example relates to a tea leaves proces-sor who only procures tea leaves from domestic small-scale farmers. When the tea processor tried to sell the products to a brand company, excessive levels of pesticides and mi-

22 Regional Trade Standards Compliance Report - East Asia 2013
crobacteria were found. Despite the processor knowing the problem, the processor has no way of changing the farm-ing methods used by many small-scale farmers (Michida and Nabeshima 2012). In developing countries, produc-ers, especially small and medium producers, are often not well equipped with the financial and technical capac-ity to comply with foreign import regulations or standards. A clean environment that can accommodate food produc-tion that satisfies regulations is a must. However, owning land with good soil and having access to safe and clean wa-ter is usually beyond the reach of many farmers/processors. As a consequence, small-scale farmers can lose access to the regulated markets.
(b) Compliance issues related to bacterial contamination and unhygienic conditions, improper use of additives, adultera-tion/missing documents, packaging and labelling could oc-cur at the processing stage of the supply chain. Beyond pro-curing adequate inputs, processors need to install proper production management for hygiene control. To do so, buy-ers might ask processors as well as farmers to obtain vari-ous certifications such as for HACCP (Hazard Analysis and Critical Control Point). Also there are private standards such as GlobalGAP and the British Retail Consortium (BRC), which are often applied in the EU market. Certifications like these help buyers to determine and confirm that the processor in-stalled processing management properly, and that hygiene controls are therefore in place. Meeting private standards helps reduce import rejections at port. However, certifica-tions are not always easy to obtain, especially for small-scale processors and farmers. Moreover, obtaining and re-newing certifications involve cost.
Similarly, in order to make sure products do not contain ex-cessive levels of contaminants, processors need to test their products before sale. As testing fees can be very expensive and sweep out all the profit, small- and medium-scale farm-ers/processors are not willing to test unless it is absolutely necessary. Moreover, small-scale processors may not able to bear the high cost of testing.
When a test result shows a product has some contaminants, how do processors deal with the problems? Processors us-ing inputs from various farmers need to sort out the source of the problem. To do so, a traceability system is important to track which farmers or inputs cause the problems so that the problematic inputs can be separated. Yet, developing a traceability system takes time and this is another hurdle for processors in developing countries like Viet Nam.
(c) Problems with regard to labelling and documents could oc-cur at the trading stage of the supply chain. As some export-ers sell to more than one market, they differentiate products depending on the grade quality and other requirements of export markets.
(d) At the final stage of the supply chain, problems can occur in the form of non-compliance with private standards and con-ducting tests required by buyers Some uncertainties remain even after products are tested and exporters and the prod-ucts are found to meet the regulation thresholds. However, different countries use different testing and sampling meth-ods which means that, even if pre-shipping testing does not reveal contaminants, testing in the importing country (e.g. at the port) could still reveal problems. Testing helps proces-
Figure 1.10: Prototype of agri-food supply chain - production stages and potential sources of non-compliance causing rejections
Farmer 1
Farmer 2
Farmer 3
Traders Processors Exporter Importer
Export Market 1
Export Market 2
Export Market 3
Exporting country Importing country
(a)*Input control *Certification *Testing*The environment
(b)*Input control*Production process management*Traceability* Certification*Testing
(c)TestingDifferentiate markets
(d)Inspection at portsSome uncertainties
Source: Authors’ own illustration
(e) Hygienic control: necessary throughout value chains including transportation and storage

23
sors to meet regulations/standards, but it is complementary to reliable value chain management.
(e) Throughout the value chain, hygiene control is essential. It is needed not only at the farm and processor levels but also during transportation and storage. Moreover, to ensure product quality it is also important to develop and properly manage the cold chain.
Asian exporting countries continue to face many challenges in attempting to reduce import rejections of their agri-food prod-ucts. The challenges seem to differ across export markets. While EU markets or buyers often require processors to obtain certifications, Japanese buyers do so less. The causes for rejec-tions also vary across exporting countries and some countries manage better than others. In terms of reducing rejection, China seems to have had some success, as we will see in the case studies to follow. In China, the whole food chain has been put
under strict public control, covering clean soil farmland, pro-cessing, and exports. This seems to imply, however, that small-scale farmers will have little or no chance to enter the export market.
The Viet Nam case study, on the other hand, shows that there are many small-scale farmers involved in food chains, which creates problems if some contaminants cannot be well controlled, thus jeopardising whole supply chains. At the same time, accom-modating small-scale farmers and processors is important for policymakers in terms of economic development and poverty reduction. Otherwise, they will gradually be pushed out of the food chain for regulated markets.
Before moving on to the case studies, in the next chapter, we examine more closely the trends in import rejections in the Jap-anese market.

24 Regional Trade Standards Compliance Report - East Asia 2013

25
Given that Japan is only about 40 per cent self-sufficient in foods (based on caloric intake), 60 per cent of foodstuffs are im-ported, implying that Japan is a large market for agricultural and food products. In 2010, about 2 million items of food, additives, equipment, containers and packages and toys3 (weighing 31.8 million tons in volume) entered Japan for commercial purposes. Some of these are inspected to ensure their safety before en-try into Japan (MHLW, 2012). In addition to paying attention to foods imported into Japan, Article 8 of the Food Sanitation Act (1947) stipulates that food business operators (including im-porters) must recognise their own responsibility for food safety and take appropriate measures at each stage of the food supply process to ensure it. The Act also requires food business opera-tors to retain detailed records relating to the imported foods. The Japanese Ministry of Health, Labour and Welfare (MHLW) provides guidelines4 to food business operators in how to con-duct voluntary safety controls to ensure food safety. Article 55 specifies that repeated violation of the food safety regulations can lead to suspension of or ban on importation by the food business operators (MHLW, 2012).
The guidelines to importers and food business operators sug-gest that they should make sure that food is manufactured and processed in compliance with the laws and regulations of the exporting countries. In addition, the standard of establish-ments, facilities and equipment of the manufacturer should be at least equal to the standards concerning establishments, fa-cilities and equipment stipulated in related Japanese laws and ordinances. This also covers hygiene control in manufacture and introduction of the HACCP system is recommended (MHLW, 2008).
Once the quality of manufacturing and processing has been controlled, importers should confirm that the food (including raw materials) complies with the specifications and standards of the Japanese laws. This includes proper use of food addi-tives, sterilisation, drug substances, preservatives, agricultural chemicals, veterinary drugs and feed additives. Furthermore, even if monitoring is done in the exporting countries, import-ers should confirm the results by importing and testing samples inside Japan whenever necessary (MHLW, 2008).
To ensure that food imported complies with Japanese laws, im-
3 The Food Sanitation Act (1947) also covers toys (Article 68 of the Act) targeted at children under the age of six years because these toys can be in contact with the mouth or accidentally ingested.4 These are listed in Schedule 2 of the “Development of Imported Foods Monitoring and Guidance Plan for FY2012” (MHLW, 2012).
porters are encouraged to provide education and guidance on Japanese food hygiene regulations. Importers should also dis-patch technicians or other personnel to local establishments whenever necessary to harmonise levels of technology, knowl-edge and awareness with respect to Japanese food hygiene regulations. Furthermore, importers should retain all relevant documentation so that the condition of imported foods can be confirmed at all times (MHLW, 2008). Thus, the guidelines to food business operators pay specific attention to the manage-ment of food safety across the value chain.
The next section describes briefly the regulatory system in place in Japan for imported food safety, and is followed by an analysis of rejections of imports from East Asian countries.
2.1 Imported food safety inspection system in Japan
The food safety regulations in Japan are governed by the Food Safety Basic Act of 2003 (Act No. 48, 2003) and the MHLW is in charge of ensuring the safety of foods imported into Japan. The responsibilities of the MHLW include promotion of aware-ness of food safety during the production, manufacture, and processing of foodstuffs in exporting countries; provision of information on Japanese food safety regulations to embassies located in Japan and to importers; publication of the informa-tion through the MHLW website; holding bilateral discussions with exporting countries;5 conducting onsite inspections; and provision of technical support. In addition, the MHLW conducts onsite inspection at facilities in exporting countries to verify safe management practices if necessary. The MHLW also has the authority to enforce an import ban on food products from a certain country or those produced by a certain manufacturer. It can also ban or suspend importation of foods manufactured by a firm that has repeatedly violated the food safety regulations (MHLW, 2012).
The MHLW conducts regular inspections based on the guide-lines (Article 28 of the Act) and in line with a schedule laid out in Schedule 1 of the “Development of Imported Foods Monitoring and Guidance Plan for FY2012”. According to the interim report for the Inspection Results of the Imported Foods Monitoring and
5 For instance, in May 2010, the first ministerial-level international con-ference on Japan–China Food Safety Promotion Initiative was held and the “Memorandum on Japan–China Food Safety Promotion Initiative” was signed by the ministers in Japan and China (MHLW, 2012).
2. Analysis of Japanese Import Rejections of Asian Agri-food Products

26 Regional Trade Standards Compliance Report - East Asia 2013
Guidance Plan for FY2011, there were notifications of more than 1 million imports (weighing 13 million tons) from April to Sep-tember 2011. Of these notifications, around 11.5 per cent were inspected, resulting in identification of 619 violations (MHLW, 2012).
The MHLW also conducts “enhanced inspections” when viola-tions (such as residues of agricultural chemicals) are identified. In such cases, for a limited time period the MHLW will inspect foods exported from the violating country more frequently and more thoroughly.6 If no similar violations are found within one year or 60 additional inspections, the inspections will return to normal. In addition, the MHLW will inspect those foods that are imported into Japan for the first time when accidents were re-ported during transportation or in other circumstances (MHLW, 2012).
Furthermore, Article 26 of the Act stipulates that the MHLW can order additional inspections of imported foods manufactured by the same manufacturer, processed by the same processor or imported from the same exporting country when certain foods have caused or are likely to cause health-related problems7 or when aflatoxin, pathogenic micro-organisms, or other severe contaminations are found (MHLW, 2012).8
In the case of repeated offences such as detections of banned substances or excess levels of substances in foods from the same manufacturer, same processor, or imported from the same country, the MHLW can order inspections of all or part of the imported foods concerned, taking into account regulations and safety control in the exporting country, and its past history of compliance (MHLW, 2012).
Inspections ordered in accordance with Article 26 can be can-celled in a number of ways. The first is when the MHLW has determined that the exporting country has taken preventive measures, such as investigation of causes, issuance of new regulations corresponding to the results of investigations and enhancement of controls on agricultural chemicals and inspec-tion systems,9 and such measures are deemed to be effected through bilateral discussions,10 onsite inspections or inspec-
6 In fact, ethoxyquin was discovered in cultured shrimp imported from Viet Nam. Because of this, the enhanced inspection of shrimp imports from Viet Nam was ordered (30 per cent sampling) (Notification by the Imported Food Inspection Services, 2012/05/18, www.forth.go.jp/keneki/kanku/syokuhin/tsuuchi/2012/5/18_2.pdf).7 For instance, in April 2012, the Chinese government discovered that certain drugs manufactured in China had used industrial gelatin (which contains chrome) supplied by Chinese firms. The Chinese government has subsequently identified and released the names of the offending manufacturers. Given this news, the MHLW alerted quarantine stations to halt imports of gelatin products and any products that contain gelatin manufactured by the identified offending firms (www.mhlw.go.jp/topics/yunyu/other/2012/dl/120601-02.pdf).8 One of the most recent cases is the presence of methoxyfenozide (used in insecticides) in blueberries imported from the United States in June 2012 (www.mhlw.go.jp/topics/yunyu/kensa/2012/dl/120607-01.pdf). Similarly, aflatoxin was found in Sichuan pepper imported from China in June 2012 (www.mhlw.go.jp/topics/yunyu/kensa/2012/dl/120604-01.pdf). Accordingly, the MHLW ordered enhanced inspections of these commodi-ties from these countries.9 For instance, an enhanced inspections for ham imported from a par-ticular manufacturer in Italy was listed in March 2012 (www.mhlw.go.jp/topics/yunyu/kensa/2011/dl/120330-01.pdf).10 For instance, Chinese government approves eel farming firms for
tions at the time of import. If no such violation is found for two years from the most recent violation or when there is no further violation found after more than 300 inspections within one year of the violation, then the inspection orders can be cancelled.11 However, enhanced inspections will be conducted for a limited time to ensure no future violations. If violations are found again, the inspection orders will be re-issued immediately (MHLW, 2012).
Articles 8 and 17 of the Act can ban the import of food produced in a specific country or area by a specific business entity, if the violation rate stands above approximately 5 per cent of the over-all number of inspections and it is highly likely that this rate will persist in future because of the state of food sanitation controls in the exporting country. In order to ensure public awareness, Article 63 of the Act stipulates that the MHLW will promptly pub-lish the names of importers who have violated the Act as well as the names of the violating imported foods (MHLW, 2012).
2.2 General trends in import rejections of agrifood products at Japanese ports
Between 2006 and 2010, there were 6,365 cases of rejections at various Japanese ports reported by the MHLW. Table 2.1 lists the 10 countries with the highest number of import rejections in Japan. China tops the list with 1,646 cases in this five-year span. The number of rejections of Chinese exports is more than double that of United States exports. Of course, Japan imports quite a large quantity of agricultural and food items from these countries so the number of rejections for these countries is bound to be relatively large compared with other countries (see Table 2.2). Among the top 10 countries, five are from East Asia: China, Viet Nam, Thailand, Republic of Korea, and Indonesia (in ranking order).
exports (www.mhlw.go.jp/topics/yunyu/kensa/2012/dl/120615-01.pdf).11 For instance, green peas from Viet Nam and Oolong tea leaves from China were taken off the list in June 2012 after no violations were found (www.mhlw.go.jp/topics/yunyu/kensa/2012/dl/120621-01.pdf).
Table 2.1: Top 10 countries with reported cases of Japanese import rejections, 2006–2010
Rank Country Cases
1 China 1,646
2 United States 804
3 Viet Nam 563
4 Thailand 548
5 Ghana 338
6 Ecuador 202
7 Indonesia 188
8 Italy 184
9 Republic of Korea 180
10 Canada 138
Source: UNIDO dataset and analysis, based on EU RASFF, US OASIS, AQIS, and Japanese MHLW data

27
Table 2.3 lists the rank and number of Japanese rejections of exports from major agricultural and food exporting countries. The table is sorted by the 2010 rankings. What is notable is that the top four countries – China, the United States, Viet Nam and Thailand – have had problems with port rejections from 2006 to 2010. It seems that the rejections of Chinese exports are more frequent relative to the values of Chinese shipments. For in-stance, at least in terms of shares, the United States is the larg-est trading partner of Japan in agricultural and food products, yet the United States has fewer import rejections than China (see Table 2.2). Similarly, although the value of imports from Viet Nam is relatively small, the number of rejection cases is high (see Table 2.3), implying possible difficulties in Viet Nam in terms of meeting the required standards of importing countries.
Among East Asian countries but excluding China, Viet Nam and Thailand, Indonesia, and Republic of Korea seem to experience most port rejections.
2.2.1 Overview of rejected products
The largest group of agricultural and food commodities rejected by Japanese authorities is “Fish and fishery products”, account-ing for more than one-quarter of all import rejections (see Table 2.4). This is followed by “Fruits and vegetables” (21 per cent), “Cereals and bakery products”, “Nuts and edible seeds”, and “Herbs and spices”. Seafood and fruits and vegetables, thus, account for by far the largest proportions of Japanese import rejections.
Table 2.2: Shares in food/agriculture imports in Japan (%)
2006 2007 2008 2009 2010
United States 22.0 24.07 28.13 25.45 24.19
China 17.25 15.46 11.73 13.27 13.97
Thailand 5.0 4.81 5.31 6.0 5.97
Republic of Korea 2.4 2.22 2.19 2.73 2.9
Viet Nam 1.9 1.65 1.56 1.67 1.61
Indonesia 1.84 1.72 1.56 1.82 1.77
Philippines 1.78 1.78 2.03 2.55 1.94
Malaysia 1.0 1.35 1.56 1.4 1.48
Singapore 0.64 0.69 0.78 0.76 0.77
Note: Food and agricultural imports are calculated as taking Chapters 1 to 23 (excluding Chapter 6) of the Harmonized System.
Source: UN Comtrade database
Table 2.3: Trends in the number of Japanese import rejections, 2006–2010
2006 2007 2008 2009 2010
Country Rank Cases Rank Cases Rank Cases Rank Cases Rank Cases
China 1 474 1 430 1 225 1 270 1 247
United States 2 236 3 122 2 105 2 172 2 169
Viet Nam 3 130 2 165 4 74 5 77 3 117
Thailand 4 118 4 101 3 101 4 117 4 111
Ghana 6 60 9 32 14 17 3 154 5 75
Brazil 17 10 14 20 16 12 15 22 6 50
Italy 9 29 11 23 9 33 7 50 7 49
Indonesia 11 24 6 59 11 26 11 35 8 44
Rep. of Korea 11 24 8 38 7 50 12 28 9 40
Canada 19 8 22 5 15 14 6 71 9 40
India 8 30 17 8 12 20 9 40 11 37
Spain 26 4 19 6 13 19 17 15 13 30
Australia 15 11 15 19 21 5 18 11 14 28
Colombia - 0 - 0 44 1 13 25 14 28
Note: Sorted by 2010 rankings.
Source: UNIDO dataset and analysis, based on Japanese MHLW data

28 Regional Trade Standards Compliance Report - East Asia 2013
The trend in the number of cases and ranking of product groups that are often rejected at Japanese ports is fairly stable. “Fish and fishery products” and “Fruits and vegetables” were consist-ently the two product groups most frequently rejected during the period from 2006 to 2010 (see Table 2.5). These are followed by “Cereals and bakery products”, “Nuts, and edible seeds”, and “Herbs and spices”.
Among East Asian countries exporting fish and fishery products to Japan, exports from China have been rejected the most fre-
quently between 2006 and 2010 (see Table 2.6). Other coun-tries experiencing significant numbers of rejections include Viet Nam and Thailand. In terms of shares, the rejections of exports from the abovementioned three countries account for three-quarters of all rejections in fish and fishery products.
However, if the number of rejections is normalised by the value of imports, a different story emerges. Even though China had the largest number of rejections, this was influenced by the size of the imports. When the values of imports are taken into ac-count, the rejection rates for Chinese fish and fishery products are similar to those for other countries in East Asia. Once nor-malised by the value of imports, products from Viet Nam and to some extent the Philippines are rejected more often (see Figure 2.1). In particular, the rejection rates for Vietnamese fish and fishery products were high in 2006 and 2007. The rejection rate improved drastically in 2008 and 2009, but increased again in 2010.
How do East Asian countries fare relative to other countries? Are products from East Asia more likely to be rejected relative to their import shares compared with other countries? Figure 2.2 plots the natural logarithm of the share of Japanese rejections of fish and fishery products against the natural logarithm of the share of imports from all exporting countries between 2006 and
Table 2.4: Common commodity groups rejected at Japanese ports, 2006–2010
Commodity Cases
1 Fish and fishery products 1,686
2 Fruits and vegetables 1,308
3 Cereals and bakery products 920
4 Nuts and edible seeds 425
5 Herbs and spices 199
6 Other processed food 89
Source: UNIDO dataset and analysis, based on Japanese MHLW data
Table 2.5: Trends in products with large numbers of Japanese import rejections, 2006–2010
2006 2007 2008 2009 2010
Cases Rank Cases Rank Cases Rank Cases Rank Cases Rank
Fish and fishery products 410 1 452 1 277 1 252 2 295 1
Fruits and vegetables 286 2 274 2 222 2 295 1 231 2
Cereals and bakery products 250 3 161 3 119 3 195 3 195 3
Nuts and edible seeds 84 4 74 4 72 4 91 4 104 4
Herbs and spices 49 5 38 5 26 5 45 5 41 5
Other processed food 38 6 17 6 7 6 18 6 9 6
Note: Sorted by 2010 rankings.
Source: UNIDO dataset and analysis, based on Japanese MHLW data
Table 2.6: Number of Japanese import rejections of fish and fishery products, 2006–2010
Country 2006 2007 2008 2009 2010 Average
Brunei Darussalam 0 0 0 0 0 0
Cambodia 0 0 0 0 0 0
China 170 145 76 73 96 112
Hong Kong, China 0 1 1 1 2 1
Indonesia 18 47 20 8 17 22
Republic of Korea 9 23 27 13 25 19
Lao PDR 0 0 0 0 0 0
Malaysia 1 1 0 2 0 1
Myanmar 1 0 0 0 0 0
Philippines 10 9 24 11 4 12
Singapore 0 0 0 0 0 0
Thailand 49 39 38 47 38 42
Viet Nam 117 147 60 57 83 93

29
Figure 2.1: Japanese import rejections of fish and fishery products per US$ million imports, 2006–2010
China
Hong Kong, China
Indonesia
Republic of K
orea
Philippines
Thaila
nd
Viet Nam
0.00
0.05
0.10
0.15
0.20
0.25
2006
2007
2008
2009
2010
Source: UNIDO dataset and analysis, based on Japanese MHLW data
Figure 2.2: Relationship between the shares in Japanese imports and rejections in fish and fishery products, 2006–2010
VN
PH
MY
MM
HK
-5
-4
-3
-2
-1
1
2
3
4
5
-
-
-
-
-
-
-
-
-
-
-5 -4 -3 -2 -1 1 2 3 4 5+ + + + + + + + + +
IDKR
Ln S
hare
of R
ejec
tions
Ln Share of Imports
TH
CN
Note: Share of imports and share of rejections are averages between 2006 and 2010 and converted into natural logarithms. East Asian countries are represented by the triangle marker and other countries by dots.
Source: UNIDO dataset and analysis, based on UN Comtrade and Japanese MHLW data

30 Regional Trade Standards Compliance Report - East Asia 2013
2010.12 As a reference, a 45-degree line is also drawn. Those points located above (below) the 45-degree line mean that im-ports from these countries are rejected more (less) often than suggested by the share of imports. Figure 2.2 shows that China, Viet Nam and the Philippines seem to experience more rejec-
12 For details on the calculation of this relative rejection rate, see UNIDO (2010: chapter 1).
tions relative to the size of their exports. The rejection rates of fish and fishery products from Hong Kong (China), Thailand, Republic of Korea and Indonesia seem to be in line with their shares. Imports from Myanmar so far have done well in this re-gard but it is also a very minor exporter.
As with fish and fishery products, the number of Japanese rejec-tions of fruit and vegetable products between 2006 and 2010
Table 2.7: Number of Japanese import rejections of fruit and vegetable products, 2006–2010
Country 2006 2007 2008 2009 2010 Average
Brunei Darussalam 0 0 0 0 0 0
Cambodia 0 0 0 0 0 0
China 137 131 55 104 63 98
Hong Kong, China 1 2 0 1 0 1
Indonesia 2 10 1 11 3 5
Republic of Korea 8 7 18 8 10 10
Lao PDR 0 1 1 0 0 0
Malaysia 0 2 0 0 0 0
Myanmar 0 1 2 0 0 1
Philippines 10 12 27 2 9 12
Singapore 0 0 0 0 1 0
Thailand 31 27 19 26 17 24
Viet Nam 5 5 5 8 11 7
Total 216 203 158 180 122 176
Source: UNIDO dataset and analysis, based on Japanese MHLW data
Figure 2.3: Japanese import rejections of fruits and vegetables per US$ million imports, 2006–2010
China
Indonesia
Philippines
Thaila
nd
2006
2007
2008
2009
2010
00.05
0.10.150.2
0.250.3
0.350.4
0.45
Republic of K
orea
Viet Nam
Note: Excluded Brunei Darussalam, Cambodia, Hong Kong (China), Lao People’s Democratic Republic, Malaysia, Myanmar, and Singapore.
Source: UNIDO dataset and analysis, based on Japanese MHLW data

31
was largest for products imported from China (see Table 2.7). In fact, the rejections of fruit and vegetable products from China accounted for 37.5 per cent of all rejections of fruits and vegeta-ble products. A trend that can be seen from Table 2.7 is that the number of rejections of products from China has been decreas-ing during this period. As with fish and fishery products, prod-ucts from Thailand and Viet Nam are also frequently rejected.
In terms of rejections of fruit and vegetable products per value of imports, rejection rates of products from Indonesia, Viet Nam and Thailand are rather high (see Figure 2.3), although the re-jection rate for Thailand has come down significantly. As with fishery products, rejection rates in Viet Nam are relatively high.
Comparing the performance of East Asian countries to other countries, fruit and vegetable products imported from East Asian countries tend to experience more than their fair share of rejections (see Figure 2.4). With fruit and vegetable products, many countries seem to lie above the 45-degree line, unlike the case with fish products, suggesting that controlling and ensur-ing the required quality and food safety may be harder for fruit and vegetable products. Only the Philippines manages a lower level of rejection relative to its exports. Other countries, espe-cially Thailand, Viet Nam, and Indonesia, seem to have a hard time clearing quarantine and inspections at Japanese borders.
2.2.2 Reasons for rejections
Next, we will examine the reasons for rejections at Japanese ports. Among various reasons for rejections at Japanese ports, six reasons account for 94 per cent of them. The most frequently cited reason is “Bacterial contamination”, accounting for 23 per cent, followed by “Pesticide residues” (22 per cent), “Addi-tives”(13 per cent), “Mycotoxins” (13 per cent), “Hygienic condi-tion/controls” (12 per cent), and “Veterinary drugs residues”(11 per cent) (see Table 2.8). Bacterial contamination occurs mainly because of unsanitary conditions at the point of production (including processing factories) and/or during transport. Im-proper use of additives or use of prohibited additives will result in these products being rejected at the port. The problem with pesticide and veterinary drugs residues occurs because of the inappropriate use of pesticides and drugs at the farms as the first stage of production. If the raw materials have problems with pesticide or veterinary drug residues, then this will con-tinue to affect processed products made from these raw materi-als. Thus, the problems of import rejections are the problems of supply chain management. The final exporter (whether of raw agricultural materials or processed food items) has to ensure the quality and safety of the product. This would require a good product quality control system throughout the supply chain. We examine this issue in more detail in Chapter 3 (frozen vegetable products from China), Chapter 4 (eel products from China) and Chapter 5 (pangasius and shrimp products from Viet Nam).
Figure 2.4: Relationship between import shares and rejections in fruit and vegetable products
CN
PH
TH
KRVNID
MM
MY
-5
-4
-3
-2
-1
1
2
3
4
5
-
-
-
-
-
-
-
-
-
-
-5 -4 -3 -2 -1 1 2 3 4 5+ + + + + + + + + +
Ln S
hare
of R
ejec
tions
Ln Share of Imports
Source: UNIDO dataset and analysis, based on UN Comtrade and Japanese MHLW data

32 Regional Trade Standards Compliance Report - East Asia 2013
Looking at the trends in reasons for rejections during 2006 and 2010 suggests that the number of rejections due to “Hygienic condition/controls” have increased quite rapidly since 2007. The number of rejections due to heavy metals, packaging and labels is quite low and there is no discernible trend associated with them.
Among various food product groups, fish and fishery products are by far the most often identified offenders in relation to bac-terial contamination, followed by fruit and vegetable products (see Table 2.9). Other product groups are rarely rejected for this reason.
Looking at these overall trends, it is apparent that many ex-porters have experienced port rejections especially in fish and fishery products, and fruit and vegetables (including processed products of these). These exporters also seem to have troubles with bacterial contamination, maintaining hygienic conditions throughout the supply chain, and procuring safe and proper raw materials (either for direct exports or for processing). In addi-tion, reflecting the large volume of trade in agricultural goods and food, among East Asian countries, China, Viet Nam, and Thailand are some of the countries with frequent violations.
When we focus on the countries of origin of food products re-jected because of bacterial contamination, six out of the worst offenders are from East Asia, and the product categories with the highest rejection rates are seafood and fruit and vegetables. The rest are countries with significant exports of meat products (see Table 2.10).
Table 2.11 shows the trend in food product groups rejected for “hygienic conditions and control” reasons. Fruit and vegetables are rejected most frequently among these food products.
Table 2.8: Reasons for Japanese import rejections, 2006–2010
Reason for Rejection
Year
2006 2007 2008 2009 2010 Total %
Bacterial contamination 306 277 260 277 311 1,431 22.5
Pesticide residues 329 303 181 318 265 1,396 21.9
Additive 269 169 94 143 178 853 13.4
Mycotoxins 269 145 137 124 149 824 12.9
Hygienic condition/controls 31 54 115 282 287 769 12.1
Veterinary drugs residues 160 230 115 103 86 694 10.9
Other contaminants 24 32 37 41 32 166 2.6
Adulteration/missing document 5 29 15 14 8 71 1.1
Heavy metal 3 3 2 4 11 23 0.4
Packaging 0 2 4 0 0 6 0.1
Others microbiological contaminants 0 0 0 2 0 2 0.0
Labeling 1 0 0 0 0 1 0.0
Others 28 44 26 20 11 129 2.0
Source: UNIDO dataset and analysis, based on Japanese MHLW data
Table 2.9: Trends in food product groups rejected for “bacterial contamination”, 2006–2010
2006 2007 2008 2009 2010 Total
Fish and fishery products 188 166 139 139 145 776
Fruits and vegetables 44 41 50 55 45 235
Herbs and spices 2 2 3 1 3 11
Nuts and edible seeds 3 0 0 1 4 8
Source: UNIDO dataset and analysis, based on Japanese MHLW data
Table 2.10: Countries with a large number of rejections for “bacterial contamination”, 2006–2010
Number of rejections
China 437
Thailand 295
Viet Nam 145
Italy 81
Republic of Korea 77
Philippines 70
Indonesia 49
France 36
Spain 29
United States 27
Source: UNIDO dataset and analysis, based on Japanese MHLW data

33
Some East Asian countries such as Thailand, Indonesia, and Viet Nam have experienced a high incidence of import rejec-tions in Japan due to insufficient hygienic conditions (see Table 2.12). In addition to these East Asian countries, countries from Latin America (Brazil, Colombia, and Ecuador) and from Africa (Ghana) as well as the United States and Canada have experi-enced a high incidence of import rejections in Japan. Coffee, co-coa beans, rice, wheat, and other grains are the dominant prod-ucts to be rejected because of improper hygiene conditions. A typical reported cause is moisture damage to products, which could occur either before loading or during transport.
Table 2.13 lists food groups that were rejected because of pesti-cide residues between 2006 and 2010. Two of the largest prod-uct groups are “Fruits and vegetables” and “Nuts and edible seeds”. Although the numbers were initially small, the number of cases with pesticide residues is increasing in “fish and fish-ery products” and this product group is now ranked third.13
Countries experiencing a large number of Japanese import re-jections because of detection of pesticide residues are listed in Table 2.14. China tops the list, followed by Ghana and Ecuador. China is one of the largest exporters of seafood and vegetable products to Japan. Viet Nam is also one of the major exporters of seafood to Japan. Ghana and Ecuador experience these prob-lems with cocoa beans.
2.2.3 Selected focus on China, Viet Nam, and Thai-land
Next, we focus our attention on three countries in East Asia: China, Viet Nam and Thailand. These three countries experience the most import rejections in Japan. A brief overview of the trend in import rejections of agricultural and food products from East
13 The detection of pesticides in fish and fishery products may be caused by intrusion of water contaminated with pesticides into growing ponds for fish and fishery products.
Table 2.11: Trends in food product groups rejected for “hygienic conditions”, 2006–2010
Year
2006 2007 2008 2009 2010 Total
Fruits and vegetables 2 17 48 27 17 111
Nuts and edible seeds 2 2 3 1 3 11
Herbs and spices 2 2 2 1 0 7
Fish and fishery products 1 0 0 1 0 2
Source: UNIDO dataset and analysis, based on Japanese MHLW data
Table 2.12: Countries with a large number of rejections for “hygienic conditions”, 2006–2010
Number of rejections
Ghana 131
United States 107
Thailand 92
Canada 51
China 48
Brazil 37
Colombia 33
Indonesia 30
Ecuador 28
Viet Nam 23
Source: UNIDO dataset and analysis, based on Japanese MHLW data
Table 2.13: Trends in food product groups rejected for “pesticide residues”, 2006–2010
Year
2006 2007 2008 2009 2010 Total
Fruits and vegetables 128 115 62 146 87 538
Nuts and edible seeds 21 23 6 30 36 116
Fish and fishery products 12 14 13 9 48 96
Herbs and spices 13 19 4 22 14 72
Source: UNIDO dataset and analysis, based on Japanese MHLW data
Table 2.14: Countries with a large number of rejections for “pesticide residues”, 2006–2010
Number of rejections
China 386
Ghana 204
Ecuador 173
Thailand 62
Republic of Korea 60
Ethiopia 54
United States 53
Viet Nam 50
Canada 47
India 39
Source: UNIDO dataset and analysis, based on Japanese MHLW data

34 Regional Trade Standards Compliance Report - East Asia 2013
Asian countries at Japanese ports is provided in Annex B, fol-lowed by detailed country-level information from Annex C to L in alphabetical order.
Table 2.15 lists the number of rejections of food product groups exported by China. The table demonstrates that two food prod-uct groups account for the bulk of the rejections. These are: “Fish and fishery products” and “Fruit and vegetables and products”.
For various reasons, Chinese products suffer from prob-lems associated with “Bacterial contamination”, “Pesticide residues”and “veterinary drug residues” (see Table 2.16). These have been consistently problematic for food products exported from China, although the number of detections of these viola-tions has been declining. Rejections associated with “Addi-tives” have decreased significantly in number, suggesting that Chinese firms may have learned and adapted to the regulations concerning allowed additives in Japan.14
In the case of Viet Nam, the largest number of rejections is found in the “Fish and fishery products” food group (see Table 2.17). While still small in number, rejections of “Fruits and vegetables and products” have been increasing since 2009.
In terms of the reasons for rejections, “veterinary drugs resi-dues” have accounted for the largest share, followed by “Bacte-rial contamination” and “pesticide residues” (see Figure 2.5). We examine the problem associated with “veterinary drugs resi-dues” in more detail in Chapter 5.
As with China, the most frequently rejected categories among those exported from Thailand include “Fish and fishery prod-ucts” and “Fruits and vegetables” as well as “Cereals and bak-ery products” (see Table 2.18).
Thai products are rejected mainly because of “Bacterial con-tamination”, “Hygienic condition/controls” and “Pesticide resi-dues” (see Figure 2.6). Furthermore, the number of rejections due to poor “Hygienic condition/controls” has been increasing since 2009, highlighting a potential problem area in the future.
14 It is also possible that Chinese firms have diverted those products with additives prohibited in the Japanese market to other markets.
Table 2.15: Trends in food product groups of Chinese exports rejected in Japan, 2006–2010
2006 2007 2008 2009 2010
Fish and fishery products 170 145 76 73 96
Fruits and vegetables 137 131 55 104 63
Nuts and edible seeds 44 38 23 21 20
Herbs and spices 19 15 7 3 7
Cereals and bakery products 24 44 12 7 7
Other processed foods 8 7 5 13 4
Source: Calculated by authors using MHLW data
Table 2.16: Reasons for Japanese rejections of Chinese food products, 2006–2010
Number of rejections
Bacterial contamination 437
Pesticide residues 386
Veterinary drugs residues 262
Additive 248
Mycotoxins 111
Others 78
Hygienic condition/controls 48
Other contaminants 36
Adulteration/missing document 34
Heavy metal 3
Packaging 2
Others microbiological contaminants 1
Labeling 0
Source: UNIDO dataset and analysis, based on Japanese MHLW data
Table 2.17: Trends in food product groups of Vietnamese exports rejected in Japan, 2006–2010
2006 2007 2008 2009 2010
Fish and fishery products 117 147 60 57 83
Fruits and vegetables 5 5 5 8 11
Nuts and edible seeds 2 1 0 0 0
Herbs and spices 2 1 0 0 2
Cereals and bakery products 2 8 5 1 2
Other processed foods 2 0 0 0 0
Source: UNIDO dataset and analysis, based on Japanese MHLW data

35
Figure 2.5: Reasons for Japanese rejections of Vietnamese food products, 2006–2010
Veterinary drugs re
sidues
Bacteria
l contaminatio
n
Pesticide re
sidues
Additive
Hygienic co
ndition/co
ntrols
Mycotoxins
Others0
50
100
150
200
250
300
350
Source: UNIDO dataset and analysis, based on Japanese MHLW data
Figure 2.6: Reasons for rejections of Thai food products in Japan, 2006–2010
Bacteria
l contaminatio
n
Hygien
ic co
ndition/c
ontrols
Pestic
ide res
idues
Mycoto
xins
Additive
Veterin
ary dru
gs res
idues
Other
contaminants
0
50
100
150
200
250
300
350
Source: UNIDO dataset and analysis, based on Japanese MHLW data

36 Regional Trade Standards Compliance Report - East Asia 2013
The overview of rejection cases at Japanese ports reveals that many East Asian countries are facing problems in complying with the regulations in Japan. This problem is typically found in the two food product groups: “Fish and fishery products” and “Fruits and vegetables and products”. Among the reasons for rejections, “Bacterial contamination”, “Veterinary drug resi-dues”, and “Pesticide residues” seem to be persistent for food product exports from East Asian countries to Japan. In the fol-lowing chapters, we will take a closer look at exports of vegeta-
ble and fishery products from China (see Chapters 3 and 4), and fishery product exports from Viet Nam (see Chapter 5). These chapters will examine in some more detail the import rejections and underlying compliance challenges along the value chains of frozen vegetables and eel products from China and pangasius and shrimp products from Viet Nam. These case studies will il-luminate some of the difficulties that firms and supply chains in these countries have in complying with the regulations of im-porting countries, particularly in Japan.
Table 2.18: Trends in food product groups of Thai exports rejected in Japan, 2006–2010
2006 2007 2008 2009 2010 total
Fish and fishery products 49 39 38 47 38 211
Cereals and bakery products 19 21 24 29 34 127
Fruits and vegetables 31 27 19 26 17 120
Herbs and spices 5 5 3 4 5 22
Other processed foods 5 0 0 1 0 6
Nuts and edible seeds 1 1 0 0 1 3
Source: UNIDO dataset and analysis, based on Japanese MHLW data

37
3.1 Introduction
In late 2001 and 2002, Chinese frozen spinach imported by Ja-pan was found to contain residues of the pesticide chlorpyrifos. In August 2002, the Japanese government issued advisory no-tices to halt imports of Chinese frozen spinach, but this stopped the imports of all frozen vegetables from China into Japan. In February 2003, the Japanese market was reopened to imports of frozen vegetables from China, though it closed again because new tests revealed continued problems with the same pesticide (Calvin, Hu, Gale and Lohmar, 2006). This incident put food safety at the top of the agenda regarding imports from China to Japan.
This case study focuses on exports of frozen vegetable products from China (with a particular focus on the Japanese market), analyzes the factors associated with the rejections of these products at Japanese ports, and remedial actions taken by pro-ducers in China. The remainder of this section provides a brief overview of vegetable production in China and the way in which China has been participating in exports of these products. The next section will closely examine the frozen vegetable sector in China, identify causes for import rejections, and the actions taken by the Chinese government and by producers, proces-sors, and exporters to improve the quality of frozen vegetable exports.
After the Opening-up and Reform policy in the late 1970s, the new economic regime called Household Production Responsi-bility System spread all over rural China by the early 1980s. This decreed that the right to use farmland should be distributed to individual farmers while the right to own farmland was given to each village. This new system, which led to the appearance of numerous small-scale household farming units, stimulated farmers’ willingness to produce, which had long been depressed under the Peoples’ commune system. By the mid-1990s China achieved almost sufficient domestic food production, which made it possible for China, a country with a huge population to feed, to aggressively open its door to the global agricultural market.
The institutional reforms liberalising the international agro-food trade in the late 1980s led to a rush of foreign investments in the agricultural processing sector, although only authorised trading companies were allowed to participate. Japan, the larg-est agro-food importer in the world, was the chief investor in coastal China, followed by Republic of Korea, Taiwan Province of China, and Singapore. Japan initially invested in Shandong province – the largest agricultural production region in north
China – and later spread to Jiangsu, Guangdong, Fujian and other coastal provinces endowed with good access to ports. These foreign agribusiness firms encouraged local farmers to grow crops specifically for importers’ markets by providing them with a holistic package of production materials including seeds, pesticides and technical assistance, which is the so-called De-velopment and Import strategy.
In combination with this development of the food processing industry led by foreign-financed agribusiness, a series of dras-tic rural institutional reforms, including distribution liberalisa-tion for agricultural products since the 1990s, encouraged fur-ther development of agribusiness. Since the late 1990s, one of the main strategies of Chinese agricultural policy has always been the development of agribusiness and food processing industries to add value to agricultural products by utilising the abundance of low-cost labour to ameliorate domestic income disparity between agriculture and other industries. The Chinese government promoted the development of agribusiness and the agricultural vertical integration system by providing lead firms and farmer organizations with tax incentives and subsidies. This policy is specified in the Agricultural Industrialization Policy. The main purpose of this policy is to create leading agribusi-nesses which in turn lead large-scale farmers or local farmers’ cooperatives and their member farmers. This policy has contrib-uted to the development of agribusiness since the late 1990s.
Chinese agro-food export value has grown rapidly since the late-1990s, and China’s accession to the World Trade Organiza-tion (WTO) in 2001 accelerated this growth. Figure 3.1 indicates trends in the value of Chinese agro-food exports and imports during the 30 years from 1980 to 2010. The value of exports in 2000 was US$12 billion, more than four times that in 1980, about US$3 billion in nominal terms. In the 2000s the WTO ac-cession accelerated the growth, with the total export value in 2011 exceeding US$40 billion, 3.6 times that of 2000. While the share of agro-food exports in total agricultural GDP had been stable, at around 3 to 5 per cent over time, the share of agro-food export value in total national export value decreased dra-matically from 26.7 per cent to 3.3 per cent in the same time period because of the rapid growth of manufacturing export industries.
Figure 3.2 shows trends in the composition of agro-food export values from 1992 to 2010. From this figure, it can be seen that the share of raw materials has decreased during this period, while various kinds of processed products grew rapidly. In 1992, raw
3. Case Study: Chinese Frozen Vegetable Exports

38 Regional Trade Standards Compliance Report - East Asia 2013
Figure 3.1: Chinese agro-food trade trends, 1980–2010
1980
1982
1984
1986
1988
1990
1992
1994
1996
1998
20002002
20042006
20082010
0 0.0%5.0%
10.0%15.0%20.0%25.0%30.0%35.0%40.0%45.0%
5.0 10.0 US
$ Bi
llion
15.0 20.0 25.0 30.0 35.0 40.0 45.0
Exports value of agro-food products
Imports value of agro-food products
The rate of agro-food export value in total agriculture GDP
The rate of agro-food import value in total agriculture GDP
Agricultural export value rate in total export
Agricultural import value rate in total import value
Source: National Statistical Bureau of China, Ministry of Agriculture (China), various years
Figure 3.2: The composition of Chinese agro-food exports (in value terms), 1992–2010
1994
1996
1998
20002002
20042006
20082010
0%
10%
20%
30%
40%
50%
60%
70%
80%
90%
100%
1992
1995
1997
1999
20012003
20052007
200919
93
others Suger, tabaccoBeverages, Spirits and Vinegar Fats, Oils and Waxes Preparations of Vegetables, Fruits and Nuts Vegetable, fruits and nuts Preparations of Meat and Aquatic products Aquatic productsLive animals and meat Oil Seeds, Industrial or Medicinal PlantsCereals Coffee, Tea and Spices
Source: National Statistical Bureau of China, Ministry of Agriculture (China), various years

39
agricultural products including coffee, tea and spices, cereals, oil seeds, industrial or medical plants, live animals and meat accounted for 40.2 per cent of exports. This dropped to 15.7 per cent in 2010. In contrast, the share of various processed prod-ucts of meat, vegetables and aquatic products has increased. For instance, the sum of fresh vegetables and preparations of vegetables and fruits grew from 19.3 per cent in 1992 to 33.0 per cent in 2010. Within vegetable and fruit exports, the share of the preparations was 33.9 per cent of the values in 1992, peaked at 48.9 per cent in 2007, and then decreased to 35.3 per cent.
The share of fish and other aquatic products has remained sta-ble during this period, at about 12–16 per cent of total export value. The ratio of preparations of meat and aquatic products accounted for 3.6 per cent in 1992, then touched 10 per cent in the late 1990s, peaked at 18.2 per cent in 2006 and then started to decline to 11–12 per cent in the late-2000s. This declining tendency is partly because of the adoption in 2006 by the Japa-nese government of a Positive List System for Agricultural Chem-ical Residues in foods, which will be referred to in detail later.
As Chinese agriculture deepened its linkage to the global market and became a major exporter in the global agro-food market, a number of disputes regarding food safety occurred. In the 2000s successive serious incidents re-garding the safety of Chinese agro-food products occurred.
In the Japanese market, imported fruits and vegetables from China are rejected more frequently than those from other East Asian countries (see Table 2.7).
Under pressure from the international community, the Chinese government has placed more emphasis on food safety and has started to establish more efficient and effective controls over the entire food supply chain in China.
In this chapter and the next, we will analyze two typical Chinese export items, frozen vegetables and eels, as examples of prod-ucts or value chains with serious food safety problems in the 2000s in the international market. These chapters aim to clarify the basic characteristics of production, distribution and export of each item, how exporting firms manage supply chains to con-trol and ensure the quality, the potential export capacities, and implications for necessary policy actions.
3.2 Production and distribution of vegetables in China
3.2.1 Domestic production of vegetables
Since the introduction of a market economy, the area under pro-duction and the output of vegetables in China have steadily in-creased (see Figure 3.4). The total area for vegetable cultivation was 3,330,000 hectares in 1978. Within 12 years, the cultivation area doubled and the rate of increase accelerated during the 1990s. In 2010, the total cultivation area reached 19 million hec-tares, nearly six times as large as that in 1978. The quantity of production has also increased very rapidly, to 651 million tons in 2010, which was about 3.8 times as much as in 1978 (195 million tons).
Figure 3.3: Share in Japanese rejections of Fruit and Vegetable products among selected East Asian countries, 2006–2010
China
Indonesia
Philippines
Thaila
nd0.0%
10.0%
20.0%
30.0%
40.0%
50.0%
60.0%
2006
2007
2008
2009
2010
Republic of K
orea
Viet Nam
Note: Excludes Brunei Darussalam, Cambodia, Hong Kong (China), Lao People’s Democratic Republic, Malaysia, Myanmar, and Singapore.
Source: UNIDO dataset and analysis, based on Japanese MHLW data

40 Regional Trade Standards Compliance Report - East Asia 2013
Among vegetables, leaf vegetables are the most popular, ac-counting for 35.1 per cent of the cultivation area and 36.0 per cent of output. This is followed by solanaceous crops (this in-cludes tomatoes and aubergines) with 14.7 per cent of the total production area and 16.1 per cent of total production. The third variety is root vegetables, accounting for 14.1 per cent and 14.1 per cent, followed by cucumbers and gherkins at shares of 11.5 per cent in area and 12.9 per cent in output, respectively.
The top five production areas in 2009 were located in Shan-dong, Henan, Guangdong, Sichuan and Hebei provinces. Their shares were 9.5 per cent, 9.1 per cent, 6.2 per cent, 6.2 per cent, and 6.1 per cent of total vegetable production area, respective-ly. The majority of the main production areas are located in the coastal areas where soils are more fertile and with better access to international markets.
3.2.2 Vegetable distribution system in China for the domestic and global markets
After the introduction of a market economy, the distribution of agricultural products was liberalised in a step-by-step manner.
Since 1988, the government has been promoting the estab-lishment of agricultural wholesale markets. According to the 2010 China Agricultural Development Report, more than 70 per cent of vegetables, fruits and aquaculture are now distributed through wholesale markets.
However, there still are still more than 250,000 free markets at the end of 2008, although the number is declining slowly.
The vegetable distribution system in China since the 1980s is shown in Figure 3.5. Agricultural products for international mar-kets (on the right of the figure), especially the products for de-veloped countries which require higher quality standards, are basically separated from those for the domestic market (on the left) in the process of production, processing and distribution. It should be emphasised that most Chinese vegetables and their products are consumed locally, and in increasing amounts along with income growth, while only a small percentage of the production is exported, though this is a sizeable amount com-pared with other foreign countries. The major players and their functions in the Chinese vegetable distribution system regard-ing products for domestic and international markets will be de-scribed separately below.
Products for the Chinese domestic market
The main vegetable producers for the domestic market can be divided into two types. The first type are small-scale farmers. According to the Second Chinese Agricultural Census in 2006, the average cultivated land area per household is only 0.55 hec-tares. There are also large-scale farmers, although their number is still small. This is because the development of contract farm-ing remains limited, partly because of the still underdeveloped food processing industry and farmland rental market. Only 10.8 per cent of a household’s farmland was rented from the land market on average and only 12.2 per cent of farmers participate in the farmland rental market.
Most farming households sell their vegetables to Brokers who visit villages in harvest season to purchase their products.
Figure 3.4: Vegetable production trends in China, 1978–2010
1980
1978
1982
1984
1986
1988
1990
1992
1994
1996
1998
20002002
20042006
20082010
0 0
10,000
20,000
30,000
40,000
50,000
60,000
70,000
2,000
4,000
6,000
8,000
10,000
12,000
14,000
16,000
18,000
20,000
production area (thousand hectares) production (ten thousand tons)
ten thousand tonsthousand hectares
Source: Ministry of Agriculture (China), various years

41
Some of the brokers are local farmers who entered into the distribution business. The brokers then sell the vegetables to wholesale markets and processors. Some vegetables would be sold to a local free market or fairs for local consumption. Some of the farmers are members of Farmers’ Professional Coopera-tives (FPCs), that will be elaborated later, and sell their products to them, though the shares of vegetables sold through FPCs are rather small currently.
According to the 2010 China Agricultural Development Report, rural wholesale markets handle vegetables from 60 per cent of the total vegetable production area. About 80 per cent of the rural wholesale markets are located in the east and central ar-eas of China. They work as hubs of horticulture products, and from them these products are distributed to urban wholesale markets, supermarkets and other retailers and traditional free markets in large and medium cities via distributors. Registered wholesale markets are equipped with quality control (safety check) facilities and, according to the Policy on Market Entrance Permission of Vegetables based on the Law of PRC on Quality and Safety of Agricultural Products, local officials can imple-ment compulsory pesticide residual inspection by random sam-pling at rural and urban wholesale markets and large retailers that deal with vegetables.
Agribusiness firms engaging in the processing and distribution of food products usually procure their materials from large-scale farms on contract, their own farms, or from rural whole-sale markets (only in the case of the domestic market). The do-mestic market for processed vegetables is still underdeveloped because only a limited number of agribusinesses are equipped with cold storage and processing facilities. In addition, at this
stage of development, most domestic consumers prefer fresh vegetables and fruits rather than highly processed products such as frozen vegetables and other preparations, apart from younger generations with a high enough income level and living in large cities such as Beijing and Shanghai.
Since the early 1990s, supermarkets have spread throughout large cities in China and the value of supermarket sales of hor-ticultural products already exceeds that for exports, though tra-ditional outlets still remain important (Wang et al., 2009). The Chinese government promoted the conversion of traditional wet markets to supermarkets and the development of direct trade between farms or farmers’ cooperatives and supermarkets in order to streamline the current thick-layered distribution system in China to improve efficiency and safety control along the sup-ply chain.
Chinese products for the international market
The year 2002 saw a dramatic change in the procurement sys-tem for exports in the agriculture business. This was the year when spinach imported from China was found in Japan to con-tain excessive amounts of agricultural chemical residues. After the incident, export firms were restricted to the use of materials from registered producers according to the AQSIQ Announce-ment on Inspection and Quarantine of Import and Export Veg-etables enforced in 2002. This specified that a vegetable export firm must purchase vegetables from a registered large-scale farm called a Production Base (PB) that satisfies certain condi-tions (PB will be referred to later in this chapter. Before 2002, some exporters bought materials from rural wholesale markets, from brokers, or from farmers directly. After 2002, small-scale
Figure 3.5: Vegetable distribution system for domestic/global markets in China
Household farming Large-scale farm
Broker
Free Market
Agriculturalarea
Urbanarea
Farmers Cooperatives
Rural Wholesale Market Agribusiness & MNCs
Distributor
Urban Wholesale Market
Free Market Supermarket, retailers
Customs & Quarantine
International Market
Restaurant and Catering
Domestic Consumer
Processor
(before 2002)
(before 2002)
Source: Authors’ own illustration

42 Regional Trade Standards Compliance Report - East Asia 2013
processers and brokers who did not have access to PBs were completely shut out from lucrative export markets.
As for agribusiness firms, only the firms that have import and export licences are allowed to make contracts with foreign traders, though the application processes have become much easier than before. With respect to frozen vegetables and highly processed preparations of vegetables, export agribusinesses have created an integrated quality management system start-ing from production in PBs, processing, packing and all the way through to the shipping process. The main exporters of frozen vegetables are large-scale agribusinesses who also have large PBs, processing facilities with strict temperature control, and chemical residual inspection facilities.
In 2003, there were more than 13,000 food processing firms engaging in some export activities. Of these, 836 enterprises had annual export values of more than US$5 million, and 60 per cent of them are vertically integrated from production, process-ing, and through to export. One of the largest such exporters is A Groups in Shandong province, which originated from a so-called rural township enterprise (TVE) in the 1980s and later grew into a group of companies including dozens of domestic and foreign-invested firms. One-sixth of frozen spinach exports from China are produced by them (Oshima, 2007). In Shandong, foreign investment in the food processing sector is quite active, most being investments from Japan and Taiwan Province of China,
and specialising in export to the Japanese market. At present, exports of frozen vegetables are dominated by such large-scale agribusinesses with PBs that can guarantee the quantity, qual-ity and safety of materials, this being the strongest advantage of such enterprises.
3.3 Exports of Chinese vegetable products
The composition of vegetable products exported from China has undergone several changes since it began in the late 1980s. Ini-tially, Chinese exports consisted of mainly preserved or pickled products. Then the development of domestic infrastructure ena-bled China to export fresh vegetables in the early 1990s, starting with the vegetables requiring least preservation, such as garlic, ginger or root vegetables, and expanding to a wider range of va-rieties later. As the main importer, Japan deepened its depend-ence on Chinese fresh and processed vegetables produced at lower prices. In the mid-1990s Japanese frozen food compa-nies and trading companies invested in Shandong province
and other coastal area and started to export vegetables to Ja-pan in accordance with the Development and Import strategy.
Figure 3.6 shows the export trends of various vegetable product groups after 1992. Among these products, fresh vegetables have remained the major category, growing rapidly during the 2000s,
Figure 3.6: Exports of various vegetable product groups from China (in US$ value)
0
1,000
2,000
3,000
4,000
5,000
6,000
7,000
8,000
9,000
Mill
ion
US$
Fresh vegetables
Frozen vegetables
Dried vegetables, mushrooms, peas and beans
Preserved vegetables
1994
1996
1998
20002002
20042006
20082011
201019
9219
9519
9719
992001
20032005
20072009
1993
Source: UN Comtrade
In this report, the category of Fresh vegetables includes HS codes 0701, 0702, 0703, 0704, 0705, 0706, 0708, 0709, 0714, 0910; Frozen vegetables comprise HS codes 0710, 071490, 2004; Dried vegetables, mushrooms, peas and beans include HS codes 0712.39-010, 0712, 0713; Preserved vegetables include HS codes 2001, 2002, 2003.

43
with the speed of growth skyrocketing after 2009. Dried veg-etables have a similar trend to fresh vegetables. The growth of frozen vegetable exports saw slower growth compared with the above two commodities, growing by 2012 to more than US$1.4 billion, a level 14 times higher than that in 1992. The share of frozen vegetables has not been increasing since 2006. This is partly because of the decrease in exports to Japan, the biggest importer of frozen vegetables, after the introduction of the posi-tive list system in May 2006. The share of each product group in total vegetable export values in 2011 were as follows: fresh vegetables are dominant, accounting for about half of the total value, followed by dried vegetables (31 per cent), preserved veg-etables (10 per cent), and frozen vegetables (9 per cent).
3.3.1 The distribution of major importing countries for Chinese vegetable products
The major overseas market for Chinese fresh vegetables is East Asia, accounting for more than 40 per cent, followed by the EU, the United States, Russian Federation and the Middle East (see Figure 3.7). Japan had been the largest importer of Chinese veg-etables – both fresh and frozen – until 2008, although after the introduction of the positive list system in May 2006 the value started decreasing.
Japan adopted the Positive List System for Agricultural Chemi-cal Residues in 2006. The positive list system established maxi-mum residue limits (MRLs) for 799 agricultural chemicals for thousands of commodities, and imported foods cannot exceed these MRLs. If the imported food is found to contain a chemical which is not on the list, it cannot exceed 0.01 parts per million (ppm). This new policy required exporters to apply the strictest quality controls in the world and created a new challenge for Chinese exporters. Only the exporters who had been produc-ing frozen vegetables for Japan for years survived. These firms either had good connections with Japanese customers or had Japanese investors. In most cases, these firms had investments from Japanese frozen food producing companies and trading companies, and they could prepare for the new standard be-forehand by collecting the latest information and enjoying tech-nical assistance from Japan.
Fresh vegetable exports to new importers – mainly ASEAN countries, especially Malaysia and Thailand – increased dra-matically in values as a result of gradual tariff reductions on agricultural products after 2005 under the ASEAN–CHINA FTA (ACFTA) scheme. Russian Federation imports Chinese vegeta-bles through border trade mainly from the three northeastern provinces (Agriculture and Livestock Industries Corporation (ALIC), 2011).
Figure 3.7: Distribution of importers of Chinese fresh vegetables in 2011 (in value)
ASEAN 18.4%
Japan 13.6%
EU-27 37.3%
USA 6.6%
Hong Kong,China
5.4%
Republic of Korea 5.0%
Russian Federation
3.7%
United Arab
Emirates 1.9%
Canada 1.2% Australia
0.6% Others 6.4%
Source: UN Comtrade database

44 Regional Trade Standards Compliance Report - East Asia 2013
As with fresh vegetables, Japan has been the largest importer of Chinese frozen vegetables, although Japan’s share has declined from 71 per cent in 2002 to 44.9 per cent in 2011. The second largest importer in 2011 was the EU (16.4 per cent), followed by Republic of Korea (13.1 per cent), and the United States (10.4 per cent). As with fresh vegetables, frozen vegetables are also exported to developing countries, where the standards are less strict. However, the demand for frozen vegetables typically is higher in developed countries than in developing countries.
Since detecting residual agricultural chemicals in Chinese-produced vegetables in 2002, Japan has banned imports from China several times and has introduced stricter standards for imported products. Hence Chinese exporters have diversified their export markets to avoid the risk, some of them shifting to markets in developing countries or even shifting to focus-ing solely on the domestic market, where quality standards are less strict than for export products. However, more and more prosperous Chinese residents are demanding safer and higher-quality food. This tendency continued after the introduction of the positive list system in 2006.
After the adoption of the positive list system in Japan in 2006, the China Inspection and Quarantine Service (CIQ) required exporters to double-check export commodities by CIQ and by private inspection centres before shipping. Some processors
without any self-inspection facilities have to request inspection by other processing firms’ inspection centres or private inspec-tion companies specialised in inspecting export products. The costs of safety inspections have risen as the number of items to be checked increased and the variety of standards diversi-fied. These cumbersome procedures and high costs have forced some firms to shift export markets to those with less strict standards.
Some exporters, mostly with Japanese or Taiwanese investors, have long engaged in producing products aimed at the Japa-nese market. Because the requirements and specifications for Japanese customers are so precise, these firms cannot easily change their products and destination markets. As part of this study, various Chinese vegetable producing and processing firms were interviewed in 2012. One of them had Taiwanese in-vestors. Another had investors from Taiwan Province of China, Japan and China. For these two firms, more than 90 per cent of their frozen vegetables are exported to Japan, and the remain-der are exported to EU and ASEAN countries. The third firm in-terviewed – a large domestic group company with investors of various nationalities – shifted their focus to the domestic mar-ket by diversifying away from horticulture crops, although one key advantage that this firm possesses is its food safety control system that was transferred by the foreign investor.
Figure 3.8: Distribution of importers of Chinese frozen vegetables in 2011 (in value)
Japan 44.9%
Republic of Korea 13.1%
USA 10.4%
EU-27 16.4%
Australia 2.1%
New Zealand 0.7% Others
12.4%
Source: UN Comtrade database

45
3.4 Supply chain management by multinational corporations
The incidents in Japan in 2002 regarding residual pesticides in Chinese frozen vegetables dramatically changed supply chain management by Chinese exporters. After the incidents, the national General Administration of Quality Supervision, Inspection and Quarantine (AQSIQ) directed the China Inspec-tion and Quarantine Service (CIQ) at provincial and city levels to report countermeasure plans for food safety control. Among
various proposals submitted by CIQs, the idea of construct-ing large-scale farms specialised for export suggested by the Shandong Yantai CIQ was adopted. AQSIQ Announcement on Inspection and Quarantine of Import and Export Vegetables was enforced in 2002 and specified that a vegetable export firm must have more than 20 hectares of farmland, which must be assembled into large plots with no prior contamination by
banned substances; must manage proper pesticide use; en-sure traceability; conduct sampling inspection of chemical residuals; must not purchase vegetables from places other than registered farms; and each registered farm should have a technical extension officer called a Field Man, and so on.
This system is called the Production Base. The costs of ensur-ing food safety, including land rental fee and inspection fees, became a large burden for exporters.
Before the 2002 incident, agribusinesses invested in the pro-cessing stage and introduced cold chain facilities. Some large-scale foreign-invested firms obtained global certifications for sanitation management in the processing process, such as Haz-ard Analysis and Critical Control Point (HACCP) and ISO (Interna-tional Organization for Standardization), but less attention was paid to the safety of the production and procurement stages.
Figure 3.9 shows the change of procurement system for fresh vegetables for export processors in Shandong province before and after 2002, based on extensive interviews with several export enterprises by Sakazume, Park and Sakashita (2006), partly supplemented by fieldwork by the author in the same area. Before 2002, most agribusinesses procured fresh vegeta-bles from village committees (Type A) or from rural free markets via brokers (Type B). Export processors collected the vegeta-bles through loose production contracts with nearby villages in which farmers produced the vegetables. In this way, production quality control was left completely to farmers and traceability was very weak, though the processors provided basic technical assistance by sending officials to villages. At that time, another procurement method was Type B or local broker procurement from a rural free market. Traceability was not possible with this approach either. Even before 2002, some of the large agribusi-nesses had directly managed large-scale farms, though the aim of running such farms was mainly to stabilise the quality and quantity of materials, not to avoid the problems associated with residual agricultural chemicals.
After 2002, export materials were required to be produced on authorised plots of land, and export processors abandoned former procurement systems and constructed new systems as Type C and D show in the figure. According to the AQSIQ An-nouncement on Inspection and Quarantine of Import and Export Vegetables enforced in 2002, all export processors must now use vegetables from registered farmlands of appropriate size and with the right conditions. Because of this requirement, ex-port processors either have to rent land from nearby villages by aggregating smaller plots or contract with large-scale farmers who have their own rented land.15 In Type C, a processor rents farmland and directly manages the production by providing a manager employed by the firm or a specialised large-scale farm-er who is made responsible for daily management of produc-tion and quality control based on the firm production plan. The Field Man is a technical extension official who is responsible for technical assistance to the manager and workers (usually the
15 According to the Chinese Land Management Law, farmland is owned by Rural Collectives, or municipal villages, except for some land owned by government. Farmers only have the right to use land.
Figure 3.9: Procurement systems for vegetables for export processors in Shandong before and after 2002
Processor
Type A: Village Committee procurement
Type B: Local broker procurement
Before 2002
Type C: Directly managed farm (land is rented by processor)
Type D: Contract farm (land is rented by large-scale farmer)
After 2002
FarmersVillageCommittee
Village
Processor Workers
Manager/Large-scale
farmer
Field man
Processor Workers
Large-scalefarmer
Field man
Processor Farmers
Wholesale market
LocalBroker
Source: Sakazume, Park and Sakashita (2006), partly supplemented by interviews with three export enterprises in Yantai, Shandong by author in June 2012

46 Regional Trade Standards Compliance Report - East Asia 2013
villagers). On the one hand, if the manager is provided by the firm, the quality control level tends to be better, so this kind of arrangement is usually adopted for leaf vegetables which re-quire a higher management level. However, in this scheme, the enterprise takes all the risks with regard to production, and the costs for land rental and administration are large. On the other hand, if the farm is managed by an individual farmer, a part of the risk is shared with him by requiring deposits to be paid to the processor, to mitigate against the risk of poor production skills or detection of pesticide residues in the vegetable.
In Type D, production is contracted to individual farmers, and essential technical assistance is provided by the processor. Type D is used when the farmer can afford to rent large enough plots of land and trusts and has a good relationship with the vil-lage that the farmer is renting from. This method offers the loos-est control over quality and is adopted only for vegetables with lower risk levels, such as root vegetables. In this type, the Field Man does not stay on the farm all the time but regularly checks production from each plot when needed.
In all types, most of the production materials such as seeds, pesticides and fertilisers are provided by the processing firm. Many of the former brokers who are now shut out from the ex-port channel have become managers of the newly formed farms, since they are familiar with the required quality controls for veg-etables for export and also have a trusting relationship with ex-port firms.
Figure 3.10 shows the flow of a supply chain for vegetable ex-ports and its supply management by the government and firms. All along the supply chain from the farm to the exporting port,
the vegetables are checked voluntarily three to four times by firms. Export processors usually check the vegetables in the PBs before harvest through random sampling. If excessive amounts of chemical residues are found, the processor would not har-vest all the plot’s vegetables, and would abandon the crop or, if possible, sell it to another market. Some processors check the harvested vegetables again before sending to the processing factory. Third, processed products will be checked before ship-ment. Finally, local CIQs check the products at the port. Some large export processors in Shandong have already established their own inspection centres for checking product safety. Some of these inspection centres are even authorised by the local CIQ and have the ability to test for all substances targeted by the importing countries to eliminate the risk of being rejected and shipped back after inspection in the destination country.
3.5 Conclusions and policy implications
China has the potential to expand vegetable exports to markets in developed countries, but only if it improves quality and meets importers’ standards, although export to developing countries with less strict standards has already increased rapidly. The Chinese government started to deal seriously with food safety problems in both the domestic and global markets in the early 2000s. It aims to improve the quality and thus competitive edge of products to expand exports, which was originally motivated by pressures from importers of Chinese agricultural products. According to the “National plan for the development of vege-table production regions (2009–2015)” issued by the Ministry of Agriculture, five main vegetable production regions for the
Figure 3.10: Inspection system for export vegetables
Contract farm/Direct-managed farm
Control by administrative regulation: Farm registration/ Traceability system establishment
Quality control by HACCP, ISO Voluntary sample testing of finished products by firm
Voluntary sample testing before harvest by firm
Voluntary sample testing before processing by firm
Sample testing by CIQ & firm before shipping
Input control by firm
Processing
Customs & Quarantine
Source: Author, partly based on Mori (2009)
47
domestic market and three regions for vegetable exports were identified and the government is said to support the develop-ment of these areas intensively.16 The plan aims to increase the export and processing rates of vegetables, and to raise the per capita incomes of local farmers by providing necessary support through infrastructure construction and technical extension.
The major hurdle for domestic food processors, most of them small in size, to participating in export activities to markets in developed countries is the large initial investment needed to create a vertically integrated system that enables firms to im-plement stricter supply chain management. Such vertically integrated systems include: the acquisition of large areas of farmland with suitable conditions and high rental fees; the con-struction of a processing system specialised for a target market; continuous monitoring of the rules and regulations of importing countries since these often change; and the costs associated with inspections. What is more, rapidly increasing domestic wages and shortage of labour are occurring in the coastal area, making Chinese products less competitive relative to products from other countries. Some domestic processors may feel that shifting their focus to the domestic vegetable market is more attractive.
The transportation infrastructure, especially a reliable cold chain linking production regions to ports, is also crucial for export products that need accurate temperature control. At present, cold chains for frozen vegetable exports in China are all provided by exporters because of the lack of domestic cold chain facilities. The National Develop and Reform Commission issued “Guidelines for the development plan for agro-food cold chain” in June 2010 and started to tackle the reform of domestic cold chains. According to the guidelines, the annual distribu-tion of fresh agro-food products in China was about 400 million tons, while the ratio of distribution by cold chain in horticulture, meat and aquaculture reached 5 per cent, 15 per cent and 23 per cent, and the rate of those chilled reached 15 per cent, 30 per cent and 40 per cent respectively. The availability of cold stor-age chambers is still not sufficient and only 0.3 per cent of the container trucks are equipped with temperature control facili-ties. What is worse, the facilities are ageing and urgently need refurbishments.
Finally, domestic firms are limited in their ability to search for suitable customers. As the safety of Chinese food products became one of the most sensitive issues in the international market, an allergic reaction by some foreign consumers is fre-quently observed. To try to overcome this, most Chinese agro-food exporters targeting the Japanese market have one or two Japanese staff to improve communication with Japanese buyers who were very anxious about their consumers’ suspicions about the safety of imported food. Even though the Japanese market may be exceptionally sensitive and strict, if new domestic pro-cessors are starting to consider exporting frozen vegetables, technical support, not only for production and processing, but
16 The three export regions are: 114 cities and counties located in the southeast coastal area including Shandong, Fujian, Zhejiang, Guangdong, Jiangsu, Liaoning, Hebei, Tianjin, Shanghai and Guangxi provinces; 31 cities and counties in the northwest inner regions including Xinjiang, Gansu, Ningxia, Inner Mongolia, Shanxi and Shanxi provinces; 16 cities and counties in the northeast area including Jilin, Heilongjiang and Inner Mongolia.
also for marketing know-how, is essential. Some policy implica-tions for better management of the quality and safety of export agro-food products in China follow.
�� Assistance with the development of large-scale produc-ers and contract farming: Currently, the development of large-scale farming and contract farming is limited in China, while small-scale family farming remains dominant. To im-prove the efficiency, quality and safety control of Chinese food, reductions in the number of channels and layers of distribution will be most effective. What is more, this will also bring about better traceability. As we have seen earlier, producers for the domestic and international markets are completely separate and detached from each other. There is only limited production for international markets by large-scale farmers who have contracts with exporting firms. In the domestic market, most family household farmers sell their products directly to local brokers. In the latter case, farmers are not well organised and extension services for farmers on production techniques and knowledge of cor-rect usage of production materials including pesticides and other chemicals, are very limited. Some possible solutions to this problem follow.
�� Support for the development of leading firms: As we have seen in this report, the development of agro-food export-ing and processing firms led to the expansion of contract farming and this in turn led to improvement in quality con-trol at the production stage in coastal areas. Empowering small- and medium-sized firms to enter the agro-food busi-ness would improve domestic food safety, though contracts between agro-food firms and farmers should be reasonable to protect the income of farmers. Essential technical and fi-nancial support should be provided to these new entrants to the international market. However, for some importing countries with specific, strict standards, only large-scale foreign-invested firms specialising in particular products for the targeted market survived after several food safety inci-dents and policy changes.
�� Land market development: When a firm starts contract farming for export, the most critical problem is how to ac-quire a large, contiguous piece land that is free of contami-nants. Currently, farmland rental market development is not very common in China. Farmers usually lease or rent land use rights at very low prices to other farmers. In most cases, land transactions occur among relatives. Sometimes they usually let the renter cultivate their land for free, although national land policy allows farmers to trade land use rights at a reasonable price based on the market. The reason why landowners are not willing to rent their land use rights to others when agriculture is less profitable than other jobs is that they regard their land use rights as an important insur-ance and they tend to lend them to those within their per-sonal network, or a reliable person such as a relative. This phenomenon is partly because of the lack of an adequate formal social security system for rural residents, including financial and insurance services. As a result, most large-scale land aggregations are implemented by villages (col-lectives) that have legal ownership of rural land, and then these aggregated pieces of land would be rented to firms.

48 Regional Trade Standards Compliance Report - East Asia 2013
An intermediate platform to provide information on rent and lending is required for the development of a land rental mar-ket, and implementation of a social security system for rural residents is also an emergent and urgent task so that they easily can sell their land use rights.17
�� Technical assistance and information services for farm-ers: Current provision of formal agricultural technical exten-sion services in China is very weak.18 Most farmers are not able to receive such services even for very basic training on how to properly use pesticides or chemical fertilisers. Fur-thermore, they seldom have the chance to acquire informa-tion on the latest variety of profitable crops or how to grow them. The only time farmers come across such information is when they participate in contract farming with large pro-cessing firms. In that case, technical extension specialists are typically sent to farmers to teach them and monitor their production processes. The capability of private technical extension services (farmers’ cooperatives, for example) still remains weak, and government support is required to both empower public extension services and develop private sector service providers.
�� Financial support for large-scale farming: Large-scale farming for international markets is a rather risky business in China at present because of the unstable price of agri-cultural products, weather variability, high land rental prices and frequent changes of import countries’ standards. Large-scale producers should be supported with rural finance ser-vices like long-term or low-interest loans.
17 The need to reform and establish a national social security system in China has been identified as a major issue for a long time (see for instance, World Bank, 1997). This issue is made more urgent by a rapidly ageing population. If the current fertility rate continues, the Chinese population is expected to peak in 2026 and start to decline thereafter. While other countries – mainly advanced countries – are facing problems associated with an ageing population, the problem facing China is more severe since she will be faced with this problem at a relatively low income level (The Economist, 2012). For the current discussion on pension reforms in China, see World Bank and DRC (2012).18 For a review of this, please see Gao and Zhang (2008). Hu et al. (2009) find that separating commercial activities and extension services from the provider greatly improves the actual delivery of extension services to farmers. In addition, more inclusive agriculture extension services are found to be more effective in China (Hu et al., 2012).
�� Investment in cold chain facilities: Investment in cold chain facilities is necessary for further export development because currently export firms have to invest in these them-selves, increasing production costs. To maintain product quality and prevent port rejections because of bacterial and microbial issues, construction of an infrastructure for proper temperature control throughout the supply chain is crucial and urgently needed.
�� Strict control of pesticides and other production input materials: While basic regulations on materials such as pesticides and fertilisers exist, the distribution channels for these materials are complex in China and completely un-controlled in most parts of China. Farmers usually buy their production materials from nearby shops or unspecified bro-kers, some of may sell illegal, poisonous or inferior quality materials. Some farmers are even willing to buy banned pes-ticides for immediate results so that they can sell their prod-ucts at higher prices by improving their appearance. Official strict control on these materials with credible enforcement, as well as punishment for violators, is required.

49
4. Case Study: Chinese Eel Exports
4.1 Introduction
While currently the high price of eels is stealing the headlines in Japan – the country with the highest consumption of eels – a more significant problem is food safety issues related to im-ported eels. More than 90 per cent of live and processed eel imports in Japan come from China. Ever since malachite green19 was detected in eels imported from China in 2003, among other incidents (see Chapter 3), there has been a renewed focus on the safety of imported food, especially from China.
In 2003, antibiotics were found in processed eels imported from China. This is a violation of the Food Safety Act in Japan, and in-spections were ordered. As a result, the volume of imports from China dropped significantly. In 2004, some signs of recovery were seen, but in August 2005 malachite green was found in eels imported from China, and this has led to inspections monitoring eels imported from Guangdong province, the main cultured eel production site in China, and this caused a temporary halt in all imports from Guangdong. In June 2006, the MHLW adopted the positive list system. Eel imports from China increased in the first half of 2006 to avoid the risk of bans imposed under the new system but in the latter half of 2006 import volumes tumbled. Around the same time in 2006, the media widely reported on the questionable safety of eels imported from China.20
Box 4.1 Preparation for the Japanese Positive List System
In preparing for the transition to a positive list system in Japan, the Ministry of Commerce of the People’s Republic of China (PRC) and the China Chamber of Commerce of Foodstuffs and Native Produce produced a risk assessment of Chinese ag-ricultural and food exports to Japan.21 The assessment report analyzed the impact of the Japanese positive list system on 11 products (green onions, tea leaves, live and processed eels, matsutake mushrooms, shiitake mushrooms and others) and grouped them into four different categories based on the like-
19 Malachite green is a synthetic antibacterial drug. This substance has been banned from food in the United States since 1981 and in the EU since 2002. Similarly, Japan bans the use of this substance in food.20 Since 2002, eels imported from China have committed a number of violations. First, it was the detection of antibiotics in eels, followed by detection of malachite green. China has strengthened its domestic effort to improve food safety by certifying eel culture ponds and processing factories, but problems persist to date.21 See www.china-embassy.or.jp/jpn//jmhzs/t254123.htm (in Japanese).
lihoood of violating Japanese food safety requirements. Ac-cording to this report, live and processed eels were classified as products at most risk. Nonetheless, the imports of eels from China increased a little in 2006, mainly reflecting the rush to export eels from China before implementation of the positive list in June. Also, the demand cycle of eel consumption in Japan contributed to this. The high demand season for eels is from April to July and by August the demand subsides.
China is the largest eel-producing country in the world. Since the opening of her economy, China has steadily increased pro-duction of both freshwater and marine products (see Figure 4.1). Japan has been the largest export market for Chinese seafood products, accounting for about one-fifth of total exports, fol-lowed by the United States and the EU (see Figure 4.2). Eels ac-count for about 8 per cent of aquatic product exports from China (see Table 4.1).
Japan consumes the largest amount of eels in the world, ac-counting for 70 per cent of global consumption (Japan Times, 2012). At its peak in 2000, Japan consumed 160,000 tons of eels but in 2011 the shipment volume of eels declined to 56,000 tons in the face of rising eel prices.22
22 From the Eel Growers Association, www.wbs.ne.jp/bt/nichimanren/yousyoku.html
Figure 4.1: Production of seafood products in China, 1978–2010
0
1,000
2,000
3,000
4,000
5,000
6,000
marine product freshwater product
19801978
19821984
19861988
19901992
19941996
19982000
20022004
20062008
2010
Source: Ministry of Agriculture (China) (2009)

50 Regional Trade Standards Compliance Report - East Asia 2013
This case study focuses on live and processed eel exports from China and analyzes the factors associated with rejections of these products at Japanese ports. In the following sections, we examine trends in trade in these products; document causes of the rejections at Japanese ports by the MHLW; provide over-
views of policies implemented by Japan and China to secure the safety of these products; and analyze conditions currently fac-ing cultured eel producers and processors in China.
4.2 Trends in trade in live and processed eels
4.2.1 Trends in exports of live eels from China
Trends in live eel exports in terms of volume and unit prices from 2008 to the first half of 2012 are shown in Table 4.2. Since 2008, live eel exports from China have been decreasing. In 2008, China exported 14,369 tons of live eels to Japan, but the amount has decreased to less than one-third in 2012 (although the figure is only for the first half of 2012). The main cause of this decline in exports is the short supply of leptocephali (eel fry). In general, eels used for food consumption are either Japanese eels (Anguilla japonica) or European eels (Anguilla anguilla). The eel market is fairly unstable, influenced greatly by changes in natural conditions and the overfishing of lepto-cephali. This results in wide fluctuations in eel prices. Although in the past eel prices have seen several steep rises, the year 2012 witnessed the most significant price rise. This instability is caused by the lack of a cost-effective way to artificially incu-bate eels and secure enough leptocephali. To arrest the rapid decline of the European eel, the leptocephalus of the European eel has been designated as a protected species under the Con-vention on International Trade in Endangered Species of Wild Fauna and Flora (the Washington Convention) in 2007 following an EU proposal. Because of this, trade in the European eel has been highly restricted and this in turn led to higher demand for Japanese eels, leading to higher prices. Accompanying the de-crease in volume, the unit price of eels has been rising. In 2008, the unit price was $12.65. By 2012, the unit price had more than trebled to US$44.58.
The top destination for live eel exports from China is Japan. The share exported to Japan was 66.1 per cent in 2009. Even though the overall volume is decreasing, the proportion of ex-ports destined for Japan increased to 85.9 per cent in the first half of 2012. The reason for this increase in the Japanese share of the exports is the rising prices in the Japanese market. The unit price for the Japanese market was $13.41 in 2009, but this has increased to $47.81 in 2012. The other major export markets are Hong Kong (China) and Republic of Korea. These three mar-
Figure 4.2: Main export markets for Chinese seafood products in 2010 (volume base)
Japan
19%
US
17%
EU
16%
Republic ofKorea13%
ASEAN
11%
Hong Kong, China 4%
Taiwan Province of China 3%
Russian Federation 3%
others
14%
Source: Bureau of Fisheries Ministry of Agriculture (China), various years
Table 4.1: Main fish and seafood products exported from China in 2010
Items
Percentage in total export
value of sea-food products
Amount
(10,000 tons)
Value
(US$100 million)
Shrimp 16.3 21.61 15.36
Shellfish 12.3 26.07 11.58
Tilapia 10.7 32.28 10.06
Eel 8.4 4.52 7.9
Pseudosciaena crocea
2.2 5.01 2.07
Others 50.1 134.81 47.24
Total 100.0 224.3 94.21
Source: Bureau of Fisheries Ministry of Agriculture (China), various years
Table 4.2: Trends in Chinese live eel exports, 2008–2012 (first half)
Importer
2008 2009 2010 2011 2012
volume (tons)
unit price (US$/ton)
volume (tons)
unit price (US$/ton)
volume (tons)
unit price (US$/ton)
volume (tons)
unit price (US$/ton)
volume (tons)
unit price (US$/ton)
Total 14,369 12.65 10,591 11.37 8,672 15.69 5,107 27.66 2,052 44.58
Japan 9,982 14.23 7,002 13.41 6,116 18.13 4,270 30.33 1,763 47.81
Hong Kong, China 1,956 7.45 1,759 7.98 1,203 10.92 632 17.70 253 25.20
Republic of Korea 2,431 10.53 1,809 6.86 1,353 8.92 203 13.60 13 29.80
Note: Data are the aggregation of volumes from January to December. For 2011, the data are from January to November, and for 2012, from January to June.
Source: Department of Foreign Trade, PRC Ministry of Commerce

51
kets account for almost all of the exports of live eels from China. However, the Republic of Korea has been unable to import live eels from China since May 2011 because the prices offered in its market were lower than those prevailing in the other markets.
4.2.2 Trends in exports of processed eels from China
The exports of processed eels from China increased stead-ily until 2007, reaching 48,187 tons in 2007 (see Table 4.3). In 2008, the export volume decreased to 28,650 tons, recovering to 32,088 tons in 2008 and 36,485 tons in 2010. However, in 2011, it decreased again to 35,221 tons. Even though the data for 2012 are only for the first half of 2012, the expectation is that the declining trend will continue. The reason for a more gradual decline in exports of processed eels compared to live eels is because processed eels can be frozen for storage.
As with live eel exports, the Japanese market is the largest desti-nation for processed eels. However, exports to the United States and Russian Federation are increasing recently, mainly because of the rising popularity of Japanese cuisine in these markets. Until 2006, the Japanese market accounted for more than 80 per cent of processed eel exports from China. Since 2007, the Japanese share of the exports has been in decline. The Japa-
nese market share was 57.0 per cent in 2008, increased to 69.1 per cent in 2009 but declined again to become 60.8 per cent in 2011 and 57.6 per cent in 2012. In contrast, the shares of the United States and Russian Federation were only 3.3 per cent and 0.7 per cent in 2005 respectively, but have seen tremendous growth since then so that, in 2011, the United States and Rus-sian market shares were 11.1 per cent and 9.6 per cent, respec-tively. Meanwhile, Hong Kong’s market share has seen a decline from 8.1 per cent in 2008 to 4.4 per cent in 2011.
The movement of unit prices for processed eels is opposite to the trend in volumes, as can be seen in Table 4.4. Unit values have been increasing since 2007, particularly since 2010. The unit price in 2011 was about double of that in 2009 and the in-flation trend was continuing to 2012. The reason for the ever higher prices for processed eels is twofold. First, the supply of leptocephali was low in recent years and, second, the anticipa-tion is that the supply of leptocephali will not improve in future. Worse, the expectation is for an ever dwindling supply of lepto-cephali because of overfishing.23 Unlike the case with live eels, there is little difference between unit prices in the Japanese mar-
23 The United States is considering putting all species of eel under the Washington Convention. Currently only the European eel is listed.
Table 4.3: Trends in Chinese processed eel exports, 2006–2012 (first half) (tons)
Importer 2006 2007 2008 2009 2010 2011 2012
Total 46,646 48,187 28,650 32,089 36,485 35,221 18,002
Japan 38,874 37,197 16,338 22,175 23,371 21,427 10,382
United States 2,452 2,560 3,176 2,901 4,424 3,896 2,130
Russian Federation 811 1,742 1,903 1,944 2,765 3,369 2,534
Hong Kong, China 769 2,296 1,805 835 976 1,548 882
Ukraine NA NA NA 294 498 609 NA
Republic of Korea 241 582 1,056 884 938 529 122
Singapore 180 434 457 475 686 381 128
Canada NA NA 288 477 306 350 NA
Note: Data are the aggregation of volumes from January to December. For 2012, from January to June.
Source: Department of Foreign Trade, PRC Ministry of Commerce
Table 4.4: Trends in unit values of processed eel exports, 2006–2012 (first half) (US$/kg)
2006 2007 2008 2009 2010 2011 2012
Total 12.6 11.9 12.6 12.8 18.0 25.6 34.3
Japan 12.8 11.9 12.9 12.9 17.9 25.3 34.4
United States 10.8 11.3 12.7 12.6 18.5 28.8 40.4
Russian Federation 10.8 12.0 12.6 13.1 18.5 27.5 36.0
Hong Kong, China 10.3 13.5 15.1 14.7 19.8 28.5 22.5
Ukraine NA NA NA 12.6 18.7 26.0 NA
Republic of Korea 9.7 12.6 10.4 12.0 19.2 24.5 25.6
Singapore 12.3 13.9 15.9 14.7 19.9 28.3 37.1
Canada NA NA 13.5 12.3 19.8 29.9 NA
Note: Data are the aggregation of volumes from January to December. For 2012, from January to June.
Source: Department of Foreign Trade, PRC Ministry of Commerce

52 Regional Trade Standards Compliance Report - East Asia 2013
ket and elsewhere. This is because the costs associated with maintaining the food safety and quality of processed eels does not differ significantly across markets. In addition, processed eels destined for the Japanese market use both Japanese and European eels.
4.3 Import rejections by Japan and underlying reasons for rejectionsThe purpose of this section is to analyze past cases of import rejections in an attempt to uncover the underlying reasons for such rejections and food safety violations. A particular focus will be on the analysis of live and processed eels exported from China to Japan. The Japanese MHLW publicises on its website information on imported shipments in violation of food safety regulation detected through regular inspections at various en-try ports.24 The information provided by the MHLW includes the reasons why food safety violations occurred, firms responsible for production, and importing firms. Based on these data, we analyze at which stage of production the violations were prob-ably caused.
Table 4.5 lists the number of import rejections of fish and fish-ery products reported by the MHLW between 2006 and 2010. It shows that China experienced the most rejections throughout the period. However, China is also the largest trading partner of Japan and, as a consequence, Japan imports large quantities of products including fish and fishery products from China. Fig-ure 2.1 above displays the number of rejections scaled by the amount of imports. Using this measure shows that imported fishery products from China do not face rejections as frequently as those from Viet Nam and the Philippines. Nonetheless, the frequency of rejection is higher compared to Indonesia, Repub-lic of Korea, and Thailand.
24 See www.mhlw.go.jp/english/topics/importedfoods/index.html.
4.3.1 Live eels
Since June 2006, there have been 39 violations associated with live eel imports from China to Japan with 23 import rejections in 2006 alone. The number of rejections was reduced to 10 in 2007, and since then only a handful of cases have been found. Within the last six years, detections of malachite green have been the major reason for rejections. Other causes include de-tections of furazolidone (AOZ), dicofol and endosulfan. In some cases, the reasons for rejections include mixing live eels with accumulated malachite green among those without; residues of these drugs and chemicals in the soils where culture ponds are located; use of eels with accumulated malachite green as feed; and runoffs of agricultural chemicals into culture ponds (see Mori, Nabeshima and Yamada (2013) for details).
Leucomalachite green is created when a living being metabo-lises malachite green, which is a synthetic antibacterial agent. Malachite green has been used as a dyestuff and anti-mould agent for ornamental fish. It is also used in forensic science, mainly for detection of latent blood. In Japan, malachite green in cultured seafood and foodstuffs is banned by the Pharma-ceutical Affairs Law. A study conducted by the Food Safety Com-mittee of Japan in November 2005 on the effects of malachite green and leucomalachite green on human health revealed no conclusive evidence for cancer risks associated with these sub-stances. However, similar experiments on rodents suggest that these substances could be carcinogenic and genotoxic. Also, the recommendation was that it is not appropriate to set an ac-ceptable daily intake (ADI) for malachite green and leucomala-chite green.
In China, malachite green was included on the “list of banned drugs and chemicals for the use in animals mainly as food con-sumption” in May 2002. After this inclusion, the use of mala-chite green was completely banned. However, the cases involv-ing leucomalachite green do not seem to stop. In the United States and the EU, the carcinogenic potential of malachite green
Table 4.5: Number of Japanese import rejections of fish and fishery products, 2006–2010
Country 2006 2007 2008 2009 2010 Average
Brunei Darussalam 0 0 0 0 0 0
Cambodia 0 0 0 0 0 0
China 179 154 82 81 110 121
Hong Kong, China 0 1 1 1 2 1
Indonesia 18 47 20 8 17 22
Republic of Korea 9 23 27 13 25 19
Lao PDR 0 0 0 0 0 0
Malaysia 1 1 0 2 0 1
Myanmar 1 0 0 0 0 0
Philippines 10 9 24 11 4 12
Singapore 0 0 0 0 0 0
Thailand 49 39 38 47 38 42
Viet Nam 117 147 60 57 83 93
Source: UNIDO dataset and analysis, based on Japanese MHLW data

53
was identified as early as the 1970s. The United States banned its use for food in 1981 and the EU (along with Norway) in 2002.
Endosulfan is a chlorine-based agricultural chemical, used mainly as an insecticide and anti-mould agent. This chemical is effective on a wide range of insects and its superior bioaccumu-lation characteristics produce long-lasting effects. This in turn makes its use controversial. Because of its toxicity to human health, the use of this chemical was negotiated under the Stock-holm Convention in April 2011 and ratified. The ban will take ef-fect in 2012, but many countries including the United States and the EU have already banned its use. The MHLW reported that the detection of endosulfan in live eels imported from China came from the agricultural runoffs containing endosulfan from nearby farms pouring into culture ponds.
Dicofol is a pesticide (especially effective on red spider mites) closely related to DDT (dichlorodiphenyltrichloroethane). Fura-zolidone is a synthetic antibiotic. Even though it is an effective antibiotic, it has been identified as a possible carcinogenic and this prompted the United States Food and Drug Administration (FDA) to ban its use in 1991.
4.3.2 Processed eels
Between the second half of 2006 and the first half of 2012, Japa-nese authorities rejected 50 shipments of processed eels from China, half of them because of the detection of leucomalachite green. Other cases of rejections involved detections of coliform (seven cases), enrofloxacin (seven cases), and three cases with furazolidone (there were several cases with multiple violations). So, even for processed eels, violations due to leucomalachite green are the most frequent. In addition to these chemical resi-dues, there were seven cases with coliform violations related to the sanitary conditions of the factories. Enrofloxacin is an anti-biotic mainly used for domestic animals (such as pigs and rab-bits). Reported side effects of enrofloxacin include skin rashes and vomiting. In Japan, the use of enrofloxacin as a food addi-tive is prohibited.
Based on publicly available data,25 the reasons for leucomala-chite green violations are: accidental inclusion of products that were rejected by prior inspections; accidental inclusion of live eels that have been inspected on behalf of other farms; lefto-vers from the previous year; lack of proper management at the eel culture farm; accidental inclusion of eels destined for the Chinese market; soil contamination by malachite green; soil contaminations by other drugs and chemicals; and storing eels to regulate shipment volumes.
4.3.3 Summary
From looking at the rejection data made public by the MHLW, the reasons for food safety violations of live and processed eels originate mainly at the eel culture farm. The predominant rea-son for violations for live and processed eels is the detection of chemicals such as malachite green that are prohibited in food. This could be caused by the shortage of leptocephali. Since completely artificial breeding of eels is still impossible, eel cul-
25 See information from the MHLW available at www.mhlw.go.jp/topics/yunyu/tp0130-1ae.html.
ture firms need to rely on a steady supply of leptocephali. How-ever, in recent years, these have been in short supply, prompt-ing firms to make sure that as many as possible of them grow. This in turn leads to excessive use of medicines and chemicals. Relative to this, violations (such as coliform) caused at the fac-tory or in transit are few in number. In addition, there are several cases where agricultural chemicals have spilled over into ponds where eels are cultured. In the next section, we focus our atten-tion on quality control at the eel culture farm.
4.4 Eel production in China
4.4.1 Moving locations of main production sites
From the 1970s to the 1990s live eels imported by Japan mainly came from Taiwan Province of China. But with rapid economic development in Taiwan Province of China and associated ap-preciation in land prices in Taiwan Province of China, many eel culture farms were converted to other uses. In addition, manu-facturing facilities that sprung up near eel culture farms caused severe water pollution. At the same time, with the opening of China to the global market, China has become an attractive place for eel culture because of abundant cheap land available for eel culture, suitable climate conditions, and ease of exports from China. Gradually the centre of eel culture has moved from Taiwan Province of China to mainland China.
In the 2000s, those Taiwanese eel culture farmers chose Guang-dong province as the favourite place for relocation of their activi-ties. Guangdong province is located in the coastal area of China. Especially important was the existence of the mouth of the Pearl River there, where the leptocephali swim up from the ocean into the river. This meant that leptocephali could be caught and eel culture ponds could be established along with processing fac-tories. The agglomeration of eel industries appeared in Shunde, located in the western part of the Pearl River Delta (PRD). How-ever, with the rapid economic growth of Shunde, the concentra-tion of eel culture ponds has shifted to Taishan, farther west-ward in the Pearl River Delta in search of cheap abundant land.
4.4.2 The characteristics of eel production in China
In the latter half of the 2000s, eel production spread from Guang-dong and Fujian provinces to Shandong and Jiangxi provinces. In China, it is mostly firms that are involved in eel industries, rather than farmers. However, in some areas, large farmers with enough financial resources operate eel culture ponds. Culturing or processing eels requires substantial capital and smallholder famers cannot enter this industry in China.
Two of the main producing regions, Guangdong and Fujian, dif-fer in their characteristics. Guangdong province mainly rears Japanese eels. In contrast, Fujian province specialises in Euro-pean eels. Because Guangdong province produces Japanese eels, their products (live and processed eels) are mainly des-tined for the Japanese market. The necessary technologies for eel culture and processing came from Taiwan Province of China. Since the reason for relocation of production from Taiwan Prov-ince of China to mainland China was lack of available land in Taiwan Province of China, the land areas for eel culture oper-

54 Regional Trade Standards Compliance Report - East Asia 2013
ated by Taiwanese firms are fairly large in Guangdong province. As their products are for the Japanese market, the unit prices of their products are also high. About 70 per cent of eel indus-try firms in Guangdong specialise in exports. The remaining 30 per cent or so produce mainly for the Chinese domestic market. Since Guangdong province is subtropical with warm tempera-tures throughout the year, culture ponds are located outdoors.
By contrast, Fujian province specialises in European eels, which are not marketed widely in Japan, so firms there do not export live eels to Japan but instead focus on processed eel exports. There are a number of small to medium firms culturing lepto-cephalus in Fujian and many firms export to the United States, Russian Federation and the EU. Also, more firms produce for the Chinese domestic market than is the case in Guangdong prov-ince. Because the distance between Taiwan Province of China and Fujian is small, some Taiwanese firms also established their operations in Fujian. However, since the late 2000s, Chinese firms with ample financial resources have entered the industry. Since the average temperature in Fujian is lower than in Guang-dong, eel culture is mainly done indoors.
4.4.3 The schedule of eel culture
The eel lifecycle is still very much a mystery. However, what is known is that they are spawned somewhere in the ocean, and leptocephali swim along the Kuroshio Current (the Japan Current) and make their way northward from the Philippines, Taiwan Province of China, and to Japan. There are specialised dealers for leptocephali and eel culture firms buy leptocephali from them. A brief schedule of eel culture is shown in Figure 4.3. The “Eel Year” starts in August, lasting until July in the following year. The reason why it starts in August is that by that time, eels are large enough to be harvested and shipped. It takes about a year for eels to grow from leptocephali to elvers, and from elvers to eels. There are about 5,000 leptocephali per kilogram, but about 4–5 grown eels per kilogram. Leptocephali are typically caught in November and put into rearing ponds during Decem-ber. From the end of January to the beginning of February, they are grown in ponds, and by August, they are ready for cultiva-tion.
4.5 Case study of Firm Y
Firm Y is a large firm with local headquarters located in Shunde, Guangdong. Originally it was established in Taiwan Province of China as a seafood processing firm. It started to export live eels from Taiwan Province of China to Japan in 1985. In 2001, it estab-lished a local subsidiary in Shunde, Guangdong with an initial capital of US$5.65 million to start processing live eels. In 2004, it started operating eel culture ponds in China and from 2005 it has cultured eels from leptocephali to fully grown eels. In 2006 it cultured 5 million pieces, and in 2007 3 million pieces. In ad-dition to four directly managed ponds, Firm Y procures live eels from 16 different firms (see Table 4.6). Some of these live eels are processed, and some are exported to Japan.
Firm Y employs about 200 workers at Shunde location, 120 of whom are working in the processing plant. The plant covers 50,000m2, of which the building area is 25,000m2. The plant has obtained HACCP and ISO 9000 certification and is also certified by the EU. The plant produces roasted eel (long kabayaki, skew-ered kabayaki, and cut kabayaki).
4.5.1 Production process
The Firm Y site comprises a processing plant, fry ponds and in-spection buildings. Firm Y purchases leptocephali of Japanese eels from specialised dealers and rears them in their ponds till they are elvers. It transports the elvers by trucks to their growing ponds located in Taishan which takes about two hours.
The size of each Firm Y growing pond is about 10–15mu.26 Each pond can hold 3,000 eels. Alongside the growing ponds, this firm also has a processing plant. Feed for the eels is prepared by this firm itself in order to assure the feed safety and quality. Some small- and medium-scale eel culture firms buy feedstuffs of unknown quality (and ingredients) from outside vendors and this can lead to food safety and quality violations down the road.
Firm Y manages the drugs and medicines for the eels through a specific warehouse for these chemicals which it established right next to the administrative office. The warehouse is kept locked at all times and only certain personnel have the right to unlock the warehouse. These specialised personnel are respon-sible for keeping the records of drug use and inventories in the
26 Mu is a traditional way of measuring land areas in China. One mu is about 0.067ha.
Figure 4.3: Timeline of eel culture
rearing of fry → fry and fingerling ponds (from leptocephalus to elvers)
→ eel culture ponds
Jan. Feb. March April May June July August Sept. Oct. Nov. Dec. Jan. Feb. March April May June July
culture period (about 120 days) cultivation period (Peak time is Nov. to April )
Shipment (Peak time is April to July)
elvers
Source: Author’s illustration based on interview with Firm Y

55
Table 4.6: Basic characteristics of eel culture of firms dealing with Firm Y
Location Size of ponds Annual output Number of fry ponds
(10,000m2) (tons) (10,000 pieces)
Firm 1 Zhongshan City 75.4 500 220
Firm 2 Taishan City Doushan Township 60.0 750 200~300
Firm 3 Taishan City Doushan Township 66.6 1,100 400~500
Firm 4 Taishan City Doushan Township 22.0 300 200
Firm 5 Shunde District Lundun Township 20.0 200 80~100
Firm 6 Shunde District Lundun Township 8.9 150 50
Firm 7 Taishan City Doushan Township 70.0 2,000 800
Firm 8 Shunde District Junan Township 16.8 150 50~62
Directly managed pond 1 Sanshui City 35.0 500 20
Firm 9 Taishan City Chonglou Township 21.4 200 80
Firm 10 Taishan City Duanfen Township 53.2 800 300
Firm 11 Taishan City Doushan Township 20.0 200 80
Firm 12 Shunde District 33.3 500 200
Firm 13 Taishan City Haiyan Township 53.3 370 150
Directly managed pond 2 Enping City Hengbei Township 30.0 200 75
Directly managed pond 3 Enping City Hengbei Township 23.0 200 75
Firm 14 Taishan City Chixi Township 40.0 700 200
Directly managed pond 4 Taishan City 23.0 300 130
Firm 15 Zhongshan City Minzhong Township 25.0 500 200
Firm 16 Taishan City Wencun Township 26.0 550 150
Source: Author’s compilation based on interview with Firm Y
firm’s tailor-made electronic system in order to establish drug use traceability. Firm Y also hires security guards to safeguard the chemical warehouse and eel ponds to prevent thefts. Ac-cording to the managers of Firm Y, a large firm such as this can invest in the facilities and processes necessary to control eel quality and safety. However, smaller firms may not have enough resources for these investments, and their quality control falls short of export quality. Many of these smaller firms, thus, con-centrate on the Chinese domestic market instead.
One of the main concerns when raising eels is the outbreak of diseases. Diseases tend to occur from spring to fall when tem-perature fluctuations are more volatile.
Exports of live eels from Firm Y are based on eels raised in their own ponds where the quality of eels can be assured and traced. Firm Y procures eels from outside growers for processed eel ex-ports. There are 16 firms that Firm Y procures eels from. They are all located in the PRD region. The capacity of their ponds is 35.82 million pieces of leptocephalus. Firm Y provides technical assistance to these outside growers. The main assistance is in the use of feeds: what kind of feeds to buy; from where to buy the feeds; the timing of feeding; and the amount of feeding. This kind of technical assistance to outside growers is necessary to ensure eel quality.
4.5.2 Manufacture and export of processed eels
Table 4.7 lists the typical steps associated with eel processing. When Firm Y prepares eels for processing, the first thing it does is to check the eels for agricultural chemicals, drug residues and the existence of heavy metals. They do this voluntarily to ensure that the quality of eels used for inputs meets the safety regula-tions of the export market. After eels pass the inspection, they are cut, cleansed, and charcoal-broiled. After the initial broil-ing, taste inspection is conducted to check for flavour, smell, texture, and aesthetic qualities (four human senses). After this taste inspection, the eels are steamed and broiled again.27 This point marks the end of primary eel processing. Depending on customer requests, the firm also provides secondary process-ing which involves cutting processed eels suitable for sushi and Unaju (eel bowl), and Uzaku (eel and cucumber salad). Custom-ers typically requesting secondary processing include grocery stores, Gyudon chains,28 and convenience stores.
The processed eels are then vacuum-sealed, frozen, and packed in a box. Once these boxes are loaded onto trucks, they go through Shunde Government Export Quarantine on their own site and are exported from Shunde port to Japan via Hong Kong
27 This is a typical preparation method for the Kanto region of Japan. In the Kansai region, eels are prepared without steaming.28 Gyudon, literally beef bowl, is a very popular Japanese dish. It can be found in many Japanese restaurants and some fast food chains specialise exclusively in it.

56 Regional Trade Standards Compliance Report - East Asia 2013
(China). Live eels are transported from Taishan to Guangzhou Airport and from there exported by air to Narita Airport in Tokyo. Those destined for Nagoya or Kansai Airports are exported from Guangzhou Airport via Shanghai Airport.
4.5.3 Inspections of eels
Figure 4.4 shows the flow of inspections along the production line for processed eel products by Firm Y. Growing ponds listed in Table 4.6 were registered as “growing ponds for exports” at
Guangdong China Inspection and Quarantine Service (CIQ). Firm Y conducts sample inspections of eels from outside growers. Once these eels pass inspection, Firm Y buys them and reports them to Shunde CIQ, where their processing factory is located, as inputs into goods for export. If eels do not pass Firm Y’s in-spection, Firm Y may cancel cultivation of eels from that pond, or purchase these eels for products destined for the Chinese market or to sell them to eel traders. The inspection standards at this stage are based on the standards of Guangdong CIQ but modified by Firm Y.
Table 4.7: Steps in eel processing
Stages Processes Location
1
culture
purchase of fry
Shunde2 rearing of fry (in-house facility)
3 culturing of elvers (vertical buckets, 150 pieces/bucket)
4 transfer of elvers to own ponds (own trucks)Taishan
5 cultivation (from own ponds)
6
input procurement
transfer of adult eels from ponds to factory (own truck)
Shunde
7 purchase of adult eels from outside growers (trucks of logistics firms)
8 storage in vertical buckets (for one day, removal of mud, weighing, cutting tails)
9 inspection voluntary inspection for agricultural chemicals, drugs, heavy metals (two days)
10
primary processing
cutting of eels, cleansing
11 butterflied and skewered
12 charcoal-broiled
13 check temperature of meat
14 check for taste
15 steam
16 kabayaki (additional broiling)
17 rapid freeze (50 minutes)
18
(secondary processing)
defrost
19 cut based on customer orders
20 vacuum-sealed
21 inspection
22 rapid freeze (120 minutes)
23 inspection metals inspection
24
shipping
sorting
25 sorting by lot (5kg, typically 43 pieces)
26 boxing, labelling
27 loading onto trucks
28 record and photograph the shipment
29
export
China Export quarantine
30 To Hong Kong, China (from Shunde to Hong Kong takes one day, ships every Friday) Hong Kong, China31 loaded into containers
32 arrival at Japan (from Shunde to Japan takes 6 days, arriving on Thursdays) Japan
Source: Author’s illustration based on interview with Firm Y

57
Figure 4.4: Flow of inspections for processed eels in China
Failed Canceling ofcultivation
Returnshipments
Voluntaryinspection
(inspection ofthe loads)
Returnshipments
Failed
Fail
Pass
Registered to quarantine office as an export-oriented eel culture firm
Voluntary inspection(Preliminary inspection)
Reporting of inputs to Shunde CIQ
Inputs inspected by Guangdong CIQ, Shunde CIQ
Certificate of the load (Name of the pond, pond number, number of eels)
Cultivation
Storage
Processing
Voluntary inspection (Inspection of processed goods)
Inspection by Shunde CIQ
Export
Source: Author’s illustration based on interview with Firm Y
Box 4.2: Cooperation between Japan and China on improving the safety of food products exported from China: Registration requirements for eel culture and eel processing plants in ChinaThere have been a number of cases where antibiotics and agri-cultural chemical residues that are banned from food products in Japan have been discovered in live and processed eel prod-ucts imported from China. In principle, importation of eels is ful-ly liberalised in Japan; however, if one wishes to import live eels and processed eel products for commercial purposes, importers need to notify the Office of Import Food Safety of the MHLW in line with the Food Sanitation Act. For those reported imported commodities, if the Office finds it necessary to verify that these commodities meet safety standards, these commodities would need to be inspected. If no violations were found, the approval letter will be returned and the importer would submit this along with other documentation to the Customs office.
In Japan, there were a couple of cases where “eel laundering” (fraudulent claims on eel origins, which would greatly affect the price) was discovered. To counter these kind of claims, eel prod-ucts sold in Japan now have to attach proper labels based on the Japanese Agriculture Standards (JAS) Law. For live eels, the labelling standards follow those for fresh and aquatic products. For processed eels, it will depend on the type of products. For imported food, the country of origin needs to be clearly speci-fied. After the “eel laundering” incidents, the revised JAS Law (revised in May 2009) introduced strict punishments associ-ated with fraudulent claims on the country of origin. The revised JAS Law now requires processed food products to bear a label specifying the country of origin of the raw materials and also sets stricter standards on quality and safety.
Within this context, there have been a number of cases where malachite green was detected in live and processed eel prod-ucts exported from China to Japan. For those products identified

58 Regional Trade Standards Compliance Report - East Asia 2013
as containing malachite green, the MHLW conducts “ordered in-spections” based on the provisions of Paragraph 3, Article 26 of the Food Sanitation Law. In addition, processed eel products (roasted eels and processed eel liver products) detected as containing enrofloxacin are also subject to ordered inspections. Because the volume of eel product exports to Japan plummeted after these incidents, the Chinese government launched a reg-istration system to certify eel-growing ponds and processing plants to prevent the use of malachite green in the entire eel production for exports.
In contrast, for inspections for the agricultural chemical resi-dues oxolinic acid (mainly used as antibiotics) and sulfameth-azine (growth-enhancing chemicals), if the following conditions are met, the agreement between China and Japan is that these products do not need to go through ordered inspections. The conditions are that the raw materials (live eels) must come from registered eel-growing ponds; products must be processed in registered processing firms; and, for oxolinic acid, must be certi-fied by the CIQs.
In 2012, there were 86 registered eel culture firms for live eels in China, of which 66 are located in Guangdong and 13 are in Fujian. There are 382 firms registered as eel culture firms exclu-sively for processing and 55 processing plants are registered in China.
After this, there are random sampling inspections of eels by Guangdong and Shunde CIQs. If the eels pass inspection, then Firm Y initiates the export process by obtaining the certificates and starting cultivation of the cultured eels. Once the eels ar-rive at the processing factory in Shunde by truck, they are sorted according to size. At this stage, Firm Y conducts further inspec-tions. If eels purchased from outside growers fail inspection, they are returned to the growers. If eels grown in ponds man-aged by Firm Y fail, they are directed to eel products meant for the Chinese domestic market or sold to eel traders. Those that pass inspection will be processed for export.
During the processing stage, Firm Y conducts inspections as noted in Table 4.7. The main focus of inspection during this stage is on metals detection. Once products pass all these in-spections, they go through final inspections by Shunde CIQ, which has jurisdiction over the port of Shunde, from where this firm exports. The export inspection is conducted by Shunde CIQ officials within Firm Y’s facility. The inspection of live eels for export is conducted by Taishan CIQ, where the growing ponds are located.
4.5.4 Inspection of growing ponds by the Chinese government
The CIQ inspections are conducted at three different stages: before purchase; at the time of purchase; and at the time of ex-port. CIQs also conduct additional random inspections on the management and chemical usage of registered growing ponds
for live and processed eels destined for the Japanese market. The standards adopted by CIQs for each inspection are listed in Table 4.8.
Table 4.8: Products inspected by CIQs
1. Before purchase
Inspections for residual synthetic antibacterial drugs (HPLC method)
Sulfonamide 100ppb
Oxolinic acid 10ppb
Enrofloxacin 20ppb
Malachite green 2ppb
Leucomalachite green 2ppb
Furazolidone 0.5ppb
Semicarbazide 0.5ppb
(Monitoring inspection: CP: 0.3ppb; CIP: 20ppb; NOR: 20ppb)
Inspections for heavy metals (AAS method)
Mercury 300ppb
Cadmium 50ppb
Once these inspections have been passed, eels can be ordered.
2. At the time of purchase
Inspections for residual synthetic antibacterial drugs (HPLC method)
Oxolinic acid 10ppb
Enrofloxacin 20ppb
Malachite green 2ppb
Leucomalachite green 2ppb
Furazolidone 0.5ppb
Semicarbazide 0.5ppb
Furaltadone 0.5ppb
Nitrofurantoin 0.5ppb
Monitoring inspection
Sulfonamide 100ppb
Oxolinic acid 10ppb
Chloramphenicol 0.3ppb
Ciprofloxacin 20ppb
Norfloxacin 20ppb
Endosulfan 2ppb
Inspections for heavy metals (AAS method)
Mercury 300ppb
Cadmium 50ppb
Once these inspections have been passed, eels can be exported to Japan

59
4.5.5 Investments in inspection and testing infra-structure
Since 2005, Firm Y has strengthened its own inspection capabil-ity. There are two reasons why Firm Y has invested in doing this. First, the costs of inspection by outside vendors have increased substantially and this made it economical for Firm Y to own its own testing equipment. Second, by having in-house testing fa-cilities, Firm Y can offer inspection services to other firms, gen-erating additional cash flow. Firm Y has invested in creating a specialised room for inspections, purchased necessary testing equipment and hired specialist personnel.
Firm Y had enough financial resources to invest in its own test-ing facility. However, only a handful of eel-related firms have sufficient means to purchase rather expensive equipment. The price of some equipment is as high as US$1 million. Firm Y owns testing equipment that even Shunde District AQSIQ does not possess.
In the inspection room, Firm Y possesses testing equipment for chloramphenicol, for various metals, for malachite green, and for AOZ (oxazolidone), as well as liquid chromatography equip-ment (purchased in April 2006) and gas chromatography equip-ment (purchased in October 2006). In addition to purchasing testing equipment, Firm Y also strengthened its internal inspec-tion routine to check for micro-organisms (such as coli form, staphylococcus, salmonella), water quality and chemical resi-dues.
4.5.6 Traceability
Firm Y has created an electronic system which makes the pro-cessing history and inspection results available to potential buyers and governments within and outside China. In this sys-tem, a user can input an inspection number and it will produce the history of processing carried out. The production lot number is 15 digits, composed of the pond number; eel grower number; production management number; and the date of production.
In addition to this, Firm Y also publishes the history of drug us-age on their website. Users can input the drug record number and find the name of the drug used in the pond where the eels came from; the dosage of drug applied; and the date of usage. By using these two systems, users can search the records on water use in the growing ponds, drug usage, feed records and preserved samples by production lot.
4.5.7 The causes of residues of agricultural chemicals and drugs
Japanese import rejections of live and processed eels peaked in 2006 and have decreased since then. In addition to official MHLW reports on the reasons for the rejections (mainly pres-ence of prohibited chemicals), the authors also interviewed the CEO of Firm Y about the possible causes of chemical residues in eels. During the interview, seven possible causes were identi-fied.
First is impatience on the part of eel growers. It takes a certain period of time for eels to metabolise drugs and growers should therefore wait for a set time after drugs were applied before releasing eels into ponds. But some growers do not wait long enough and release eels prematurely into ponds, leading to drug residue problems.
Secondly, some growers do not know how to apply drugs appro-priately. Some growers give too much drugs, which eels cannot metabolise so the drug starts to accumulate in their bodies.
Third, application of inappropriate feeds and drugs such as those containing malachite green continues. In addition, some feeds circulating in the market may contain inappropriate ingre-dients.
Fourth, water contamination of eel ponds can occur when ty-phoons hit the region. Guangdong and Fujian provinces are reg-ularly hit by typhoons. Severe rainfall and associated floods can cause water from agricultural fields, irrigation, ponds for shrimp and other fish to run into eel ponds. These waters could contain substances that are prohibited in eels.
Fifth is the problem of soil contamination. Some eel growers ro-tate the type of seafood for culture, especially when leptocepha-li are hard to get. Some of the eel growers are shifting to shrimp and blowfish culture. In addition, rich farmers sometimes oper-ate a seafood culture business on the side, and determine what to grow depending on the market price movements of various seafoods. When a farmer grows shrimp, the typical length of the contract with the buyer is for two to three years. Because cultured shrimp is mainly for the Chinese domestic market, the quality control and management of the ponds are not as strict as for exported eels. Various kinds of drugs and chemicals could be used and they could accumulate in the soil. When these ponds are converted into eel-growing ponds, problems associ-ated with contaminated soils could arise.
Sixth, there is a problem of mixing eels from different produc-ers. Many small and medium firms grow eels for the Chinese domestic market. Some firms buy these eels and mix them with eels meant for export.
3. At the time of export
Inspections for residual synthetic antibacterial drugs (HPLC method)
Oxolinic acid 10ppb
Enrofloxacin 20ppb
Malachite green 2ppb
Leucomalachite green 2ppb
Furazolidone 0.5ppb
Semicarbazide 0.5ppb
Furaltadone 0.5ppb
Nitrofurantoin 0.5ppb
Inspections for residual synthetic antibacterial drugs (GC method)
Endosulfan 2ppb
Note: HPLC is high performance liquid chromatography; AAS is atomic absorption spectrometry; GC is gas chromatography; ppb denotes parts per billion.
Source: Author’s compilation based on interview with Firm Y

60 Regional Trade Standards Compliance Report - East Asia 2013
Finally, the problem with a lack of proper management of ag-ricultural chemicals and drugs persists. Even though the laws concerning management of agricultural chemicals and drugs are enacted and regulations are updated, enforcement of these laws and regulations is still wanting. On the production side, the problem of usage of copy-products and inferior products still exists. At the distribution and retail stage, there are a num-ber of cases when these chemicals and drugs are sold to those sectors prohibited from using them and, in some cases, mixing of other materials and products. On the user’s side, there are still a number of growers who do not understand the proper us-age of these chemicals and drugs. As for malachite green, even though it is now banned in China, it can still be purchased quite freely from small agricultural shops or over the internet. The Chi-nese government is now considering revising the “Regulations on Pesticide Administration” (Promulgated by Decree No. 216 of the State Council of the People’s Republic of China on May 8, 1997, amended in accordance with the Decision of the State Council on Amending the Regulations on Pesticide Administra-tion on November 29, 2001). The revision would mandate sell-ers of agricultural chemicals and drugs to keep sales records and conduct inspection of these chemicals; it would require a licence to sell agricultural chemicals and drugs; and it would mandate sellers of these drugs and chemicals to properly edu-cate the buyers.
4.6 Case study of Firm T
Firm T is a middleman with investors from Taiwan Province of China, located in Taixi, the western part of the Pearl River Delta. Their main line of business is the sale and purchase of eels for processing. The firm originally moved from Taiwan Province of China to Shunde in 2002. As the growing ponds were migrating towards Taixi, the firm also moved their local headquarters to Taixi four years ago. Firm T purchases cultured eels from growers in Taixi, sorts them according to size, and sells them to process-ing firms. There are ten firms like Firm T in Taixi. Of these ten firms, five (including Firm T) specialise in eels for processing.
Of these five firms, only Firm T is a foreign-invested firm and the rest are domestically owned firms.
In 2012, leptocephali were in a short supply and their price increased from 3RMB to 45RMB. Reflecting the rising prices of leptocephali, the price of eels that Firm T buys also increased to 45–50RMB per piece in 2012 compared with only 12–13RMB per piece in 2011. Typically middlemen can make about 3RMB/kg profit, but in 2012 the expectation is that profit will be almost zero. The amount of eels for processing that Firm T handles has not changed significantly between 2011 (600–700 tons) and the first half of 2012 (200–300 tons), but it has declined compared to 2010.
4.6.1 Distribution of eels
Figure 4.5 shows the various routes associated with distribution of eels in China. Specialised firms catch leptocephali and sell these to eel growers. Large firms typically grow leptocephali into elvers in different growing ponds from where the elvers become fully grown eels. Small and medium firms typically grow lepto-cephali and elvers in the same location.
Large processing firms typically are vertically integrated and have their own growing ponds. Once cultivation is complete, eels are exported as live eels or sent to processing plants for further processing. In addition to eels from their own ponds, large firms also purchase from other ponds through middle-men. Small and medium processing firms do not typically own growing ponds; they rely exclusively on middlemen for eels to process and sell them to the Chinese domestic market.
4.6.2 The quality control problem from the perspec-tive of middlemen
Firm T purchases eels from eel growers and transports these eels to processing plants using their own trucks. Typically, the time taken from purchase to delivery of eels to processing plant is less than nine hours. This is to keep the eels fresh. Since op-erating and managing growing ponds is costly, only a handful
Figure 4.5: Distribution routes for live and processed eels in China
Overseas (excl.Japan)
China
Culture Distribution Processing Markets
Registered eel growers registered processing plants
Japan
Verticallyintegrated ponds
large firms
independentponds
middlemen
small and mediumfirms
unregistered eel growers unregistered processing plants
Source: Author, based on interviews with local firms

61
of processing firms own growing ponds. While these large inte-grated firms take quality control matters into their own hands, small and medium firms rely on middlemen to control eel qual-ity. As traders, they need to ensure that they can deal with a large quantity of eels. At the same time, the ability to secure enough high-quality eels is also important. At this point, if pro-cessed eels are rejected at the ports of importing countries, the responsibility (including liability) lies on the shoulders of the traders, not on the processing firms. Processing firms will dis-continue business with traders who supplied lower-quality eels. Even though processing firms purchase eels from outside grow-ers, they do not provide any technical assistance to those grow-ers. It is the traders who need to ensure that eels grown in these ponds are of high quality and, in a sense, traders face most risk. Because of this and to secure enough high-quality eels, these traders provide essential information to eel growers. However, even with the best of intentions, when eel production is low or there are high costs and prices, these traders may be forced to purchase lower-quality eels. This in turn could lead to rejections at the ports of importing countries down the road.
4.7 Conclusions and policy implications
The purpose of this case study is to shed light on the underlying reasons for rejections of live and processed eels exported from China to Japan. Using publicly available data from the Japanese MHLW and field surveys in China, we examined possible causes and suggest the following conclusions:
First, the analysis of MHLW data reveals that rejections of live and processed eels were mainly caused by detections of mala-chite green in eels. Other reasons for rejections are also related to the use of drugs in eel-growing ponds. Because of this, the most fruitful remedial actions can be taken at the eel-growing ponds, especially regarding proper management of drugs and chemicals. This is especially so for processing firms and inde-pendent eel culture firms.
For processed eels, there were a number of cases with coliform detections. Improvements in sanitary conditions at the process-ing plants are essential to weed out this kind of problem.
Large firms tend to be vertically integrated and they manage and operate their own growing ponds. However, directly managed ponds cannot supply enough eels and even large firms need to rely on traders to obtain additional inputs from independent eel growers. By doing so, the processing firms cannot directly man-age and ensure the quality of eels. The responsibility for this quality control is shifted to traders and this can be a source of problems down the road and needs to be addressed. However, changes in business practices are hard if not impossible to im-plement through policy.
Instead, policies should focus on providing technical assistance to independent eel growers so that they understand and can fully implement quality control. Similar kinds of training can be offered to traders. Funding for this kind of activity could be mo-bilized by the eel grower association locally to could cover the cost of technicians and/or advisers who would be stationed in Taixi to provide technical assistance to small- and medium-sized growers. In addition, agricultural chemicals and drugs could be managed by independent operators who can keep track of us-age of these chemicals by individual growers.
Even if the system of quality control is strengthened in the eel-growing industry, if basic inputs such as drugs and other chemi-cals are mislabelled or product imitations are widely available, then the whole effort could be for naught. For this reason, tougher enforcement of product imitations, especially feeds and agricultural chemicals and drugs, is essential.
Finally to raise awareness of the importance of quality control, an “eel-growing manual” could be produced and distributed to small and medium firms and traders, along with requiring each eel grower to post a schedule of proper drug application on their sites.

62 Regional Trade Standards Compliance Report - East Asia 2013

63
5.1 Introduction
With market liberalisation in 1990, Viet Nam expanded its ex-port volumes and was ranked as the fourth largest exporter of seafood in the world in 2010 (FAO, 2012). Viet Nam exports to as many as 153 countries, including very high-end markets in developed countries. Among Viet Nam’s seafood exports, pangasius and shrimp play important roles. Yet, in recent years, some seafood exports from Viet Nam have faced difficulties meeting the regulations of importing countries.
At Japanese ports, Viet Nam seafood imports have been the ma-jor target of intensive inspection in recent years. In May 2012, one shipment of Vietnamese shrimp to a Japanese port was found to contain ethoxyquin and this triggered more scrutiny of shrimp imports from Viet Nam by Japanese authorities. This
incident was preceded by detections of trifluralin in 2010 and enrofloxacin in 2011. Both are banned substances in shrimp ac-cording to Japanese regulations. Shrimp exporters interviewed
5. Case Study: Vietnamese Frozen Pangasius and Shrimp Exports
Table 5.1: Rejections of Vietnamese agri-food exports at major markets
MarketViet Nam’s
RankCases Period
Japan 1 563 2006–2010
United States 6 3,443 2002–2010
EU 9 613 2002–2010
Australia 10 418 2003–2010
Source: UNIDO dataset and analysis, based on EU RASFF, US OASIS, AQIS, and Japanese MHLW data
Figure 5.1: Number of rejections by major agriculture commodity group for Vietnamese products exported to four markets, 2006–2010
0
50
100
150
200
250
300
350
Fish
and
Fis
hery
pro
duct
s
Frui
t and
veg
etab
le
Herb
s an
d sp
ices
Nuts
and
edi
ble
seed
Fish
and
Fis
hery
pro
duct
s
Frui
t and
veg
etab
le
Herb
s an
d sp
ices
Nuts
and
edi
ble
seed
Fish
and
Fis
hery
pro
duct
s
Frui
t and
veg
etab
le
Herb
s an
d sp
ices
Nuts
and
edi
ble
seed
Fish
and
Fis
hery
pro
duct
s
Frui
t and
veg
etab
le
Herb
s an
d sp
ices
Nuts
and
edi
ble
seed
JP US EU AU
2006
2007
2008
2009
2010
Source: UNIDO dataset and analysis, based on EU RASFF, US OASIS, AQIS, and Japanese MHLW data
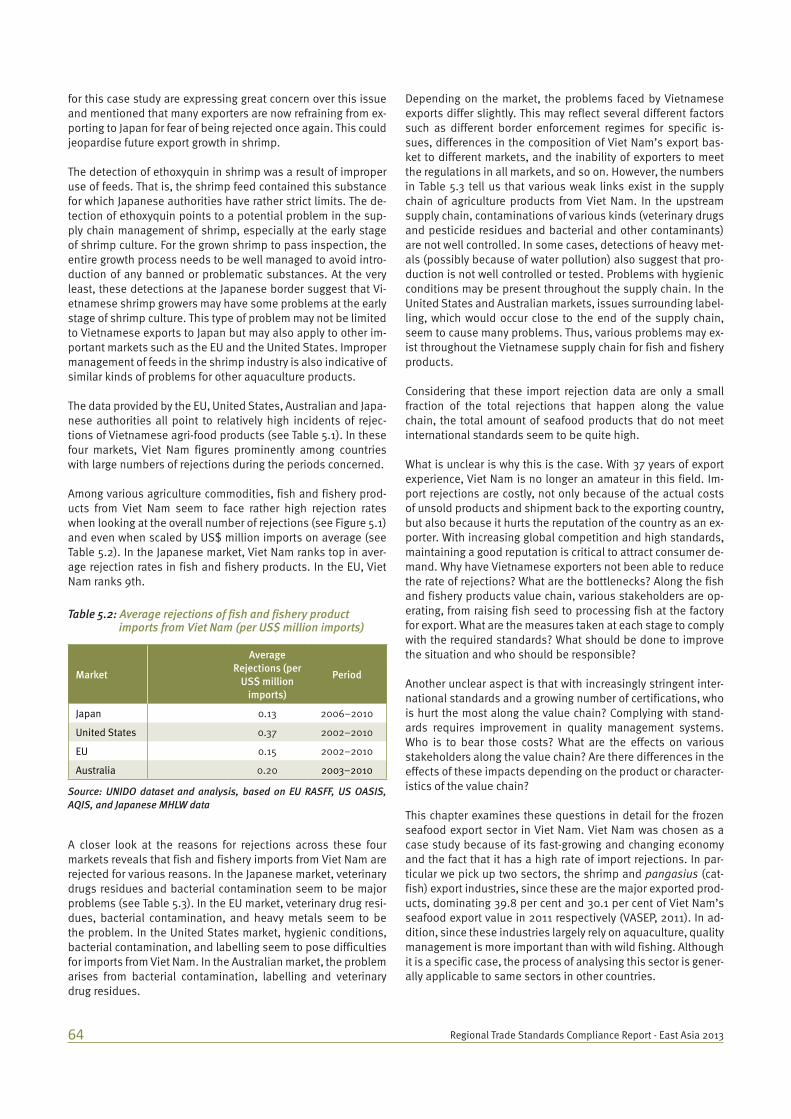
64 Regional Trade Standards Compliance Report - East Asia 2013
for this case study are expressing great concern over this issue and mentioned that many exporters are now refraining from ex-porting to Japan for fear of being rejected once again. This could jeopardise future export growth in shrimp.
The detection of ethoxyquin in shrimp was a result of improper use of feeds. That is, the shrimp feed contained this substance for which Japanese authorities have rather strict limits. The de-tection of ethoxyquin points to a potential problem in the sup-ply chain management of shrimp, especially at the early stage of shrimp culture. For the grown shrimp to pass inspection, the entire growth process needs to be well managed to avoid intro-duction of any banned or problematic substances. At the very least, these detections at the Japanese border suggest that Vi-etnamese shrimp growers may have some problems at the early stage of shrimp culture. This type of problem may not be limited to Vietnamese exports to Japan but may also apply to other im-portant markets such as the EU and the United States. Improper management of feeds in the shrimp industry is also indicative of similar kinds of problems for other aquaculture products.
The data provided by the EU, United States, Australian and Japa-nese authorities all point to relatively high incidents of rejec-tions of Vietnamese agri-food products (see Table 5.1). In these four markets, Viet Nam figures prominently among countries with large numbers of rejections during the periods concerned.
Among various agriculture commodities, fish and fishery prod-ucts from Viet Nam seem to face rather high rejection rates when looking at the overall number of rejections (see Figure 5.1) and even when scaled by US$ million imports on average (see Table 5.2). In the Japanese market, Viet Nam ranks top in aver-age rejection rates in fish and fishery products. In the EU, Viet Nam ranks 9th.
A closer look at the reasons for rejections across these four markets reveals that fish and fishery imports from Viet Nam are rejected for various reasons. In the Japanese market, veterinary drugs residues and bacterial contamination seem to be major problems (see Table 5.3). In the EU market, veterinary drug resi-dues, bacterial contamination, and heavy metals seem to be the problem. In the United States market, hygienic conditions, bacterial contamination, and labelling seem to pose difficulties for imports from Viet Nam. In the Australian market, the problem arises from bacterial contamination, labelling and veterinary drug residues.
Depending on the market, the problems faced by Vietnamese exports differ slightly. This may reflect several different factors such as different border enforcement regimes for specific is-sues, differences in the composition of Viet Nam’s export bas-ket to different markets, and the inability of exporters to meet the regulations in all markets, and so on. However, the numbers in Table 5.3 tell us that various weak links exist in the supply chain of agriculture products from Viet Nam. In the upstream supply chain, contaminations of various kinds (veterinary drugs and pesticide residues and bacterial and other contaminants) are not well controlled. In some cases, detections of heavy met-als (possibly because of water pollution) also suggest that pro-duction is not well controlled or tested. Problems with hygienic conditions may be present throughout the supply chain. In the United States and Australian markets, issues surrounding label-ling, which would occur close to the end of the supply chain, seem to cause many problems. Thus, various problems may ex-ist throughout the Vietnamese supply chain for fish and fishery products.
Considering that these import rejection data are only a small fraction of the total rejections that happen along the value chain, the total amount of seafood products that do not meet international standards seem to be quite high.
What is unclear is why this is the case. With 37 years of export experience, Viet Nam is no longer an amateur in this field. Im-port rejections are costly, not only because of the actual costs of unsold products and shipment back to the exporting country, but also because it hurts the reputation of the country as an ex-porter. With increasing global competition and high standards, maintaining a good reputation is critical to attract consumer de-mand. Why have Vietnamese exporters not been able to reduce the rate of rejections? What are the bottlenecks? Along the fish and fishery products value chain, various stakeholders are op-erating, from raising fish seed to processing fish at the factory for export. What are the measures taken at each stage to comply with the required standards? What should be done to improve the situation and who should be responsible?
Another unclear aspect is that with increasingly stringent inter-national standards and a growing number of certifications, who is hurt the most along the value chain? Complying with stand-ards requires improvement in quality management systems. Who is to bear those costs? What are the effects on various stakeholders along the value chain? Are there differences in the effects of these impacts depending on the product or character-istics of the value chain?
This chapter examines these questions in detail for the frozen seafood export sector in Viet Nam. Viet Nam was chosen as a case study because of its fast-growing and changing economy and the fact that it has a high rate of import rejections. In par-ticular we pick up two sectors, the shrimp and pangasius (cat-fish) export industries, since these are the major exported prod-ucts, dominating 39.8 per cent and 30.1 per cent of Viet Nam’s seafood export value in 2011 respectively (VASEP, 2011). In ad-dition, since these industries largely rely on aquaculture, quality management is more important than with wild fishing. Although it is a specific case, the process of analysing this sector is gener-ally applicable to same sectors in other countries.
Table 5.2: Average rejections of fish and fishery product imports from Viet Nam (per US$ million imports)
Market
Average Rejections (per
US$ million imports)
Period
Japan 0.13 2006–2010
United States 0.37 2002–2010
EU 0.15 2002–2010
Australia 0.20 2003–2010
Source: UNIDO dataset and analysis, based on EU RASFF, US OASIS, AQIS, and Japanese MHLW data

65
Table 5.3: Reasons for import rejections of Vietnamese fish and fishery products in selected markets
Japan EU United States Australia
Bacterial contamination 145 127 961 121
Other contaminants 1 24 209 13
Additives 32 33 120 0
Pesticide residues 50 4 0 -
Adulteration/missing document 0 7 103 2
Hygienic condition/controls 23 20 981 1
Mycotoxins 7 0 - 0
Packaging 2 2 0 -
Veterinary drug residues 297 172 170 44
Labelling 0 2 349 77
Heavy metals 0 61 0 7
Others 6 6 21 1
Other microbiological contaminants 0 26 - -
Total 563 484 2,914 266
Source: UNIDO dataset and analysis, based on EU RASFF, US OASIS, AQIS, and Japanese MHLW data
The next section describes the brief history of and current trends in these industries. The third and fourth sections ex-plain the value chain structures and production processes for the pangasius and shrimp sectors. Section five discusses what quality and safety requirements are set by importing countries and section six discusses the major compliance challenges for exports from Viet Nam. Conclusions and policy recommenda-tions follow.
5.2 History and current trends
5.2.1 Overview of the seafood sector in Viet Nam
Viet Nam has 3,260 km of coastline and more than 3,000 islands with an area of inland and territorial waters of 226,000km2 and an area of 1 million km2 of Exclusive Economic Zone, providing favourable natural conditions for the development of the aq-uaculture sector. There is a long history and tradition in Asia in general and Viet Nam in particular of growing rice and fish together on the same plot of land or on adjacent plots. In Viet Nam, there is a traditional saying that “rice and fish are like mother and children”.
In fact, the aquaculture sector has been considered one of the priority sectors for agricultural diversification, economic devel-opment, and poverty reduction in Viet Nam. The seafood pro-duction value in 2010 accounted for more than 35 per cent of the total production value of the entire agriculture, forestry and fisheries sector – a large increase from around 16 per cent in 2002. This sector contributed more than 7 per cent of the GDP in 201029, generates incomes through exports, and creates jobs
29 This was calculated by the author using data from the General Statis-tics Office of Viet Nam, www.gso.gov.vn/default_en.aspx (accessed July
for about three million people, which is about one twenty-fifth of the total population of Viet Nam (Tung, Thanh and Phillips, 2004).
The Mekong River delta, which is a flat wide plain located in southern Viet Nam, is the main aquaculture production area. The delta lies along the last part of the lower section of the Mekong River, which is the world’s second richest river basin in terms of biodiversity. Before pouring into the East Sea, the Mekong River reaches the delta through nine estuaries and a dense canal network. The river’s unique interaction with Tonle Sap Lake in Cambodia provides young fish to the delta down-stream. According to Baran, Starr and Kura (2007), the Tonle Sap Lake has 23 fish species whose annual migrations are triggered by changes in water levels. Every year, this region is flooded, bringing new organic matter from upstream. This area contrib-uted more than 41 per cent to the total export value of seafood products in the whole country in 2011 (see Figure 5.2).
Three stages of development
There were three major periods in the development of the aqua-culture sector in Viet Nam. During the first period from 1957 to 1980, there were few state-owned processing companies in the industry. The first one was Halong Canned Seafood, which was established in 1957 in northern Viet Nam. Later on during this period, ten more processing companies were set up in southern Viet Nam. In 1978, the Sea Product Import-Export Corporation (SEAPRODEX) was established and became the largest state-owned seafood processing and exporting company in Viet Nam. The second period from 1980 to 1990 saw the establishment of more than 100 state-owned sea food processing companies belonging to SEAPRODEX all over the country. The third period is
2012).

66 Regional Trade Standards Compliance Report - East Asia 2013
Table 5.4: World seafood producers (in million tons)
Countries 2000 2002 2004 2006 2008 2010
China 21.52 24.14 26.57 29.86 32.73 36.73
India 1.94 2.19 2.80 3.18 3.85 4.65
Viet Nam 0.50 0.70 1.20 1.66 2.46 2.67
Indonesia 0.79 0.91 1.05 1.29 1.69 2.30
Thailand 0.74 0.95 1.26 1.35 1.33 1.29
Bangladesh 0.66 0.79 0.91 0.89 1.00 1.31
World Total 32.42 36.78 41.90 47.28 52.93 59.87
Source: FAO (2011) and FAO (2012)
Table 5.5: Water surface area for seafood production in Viet Nam (in thousand hectares)
2000 2002 2004 2006 2008 2010
TOTAL 641.9 797.7 920.1 976.5 1052.6 1066.0
Area of sea and brackish water 397.1 556.1 642.3 683.0 713.8 728.5
Area for fish 50.0 14.3 11.2 17.2 21.6 26.5
Area for shrimp 324.1 509.6 598.0 612.1 629.2 645.0
Area for mixed and other aquatic products 22.5 31.9 32.7 53.4 62.7 57.0
Area for breeding 0.5 0.3 0.4 0.3 0.3 0.0
Area of fresh water 244.8 241.6 277.8 293.5 338.8 337.5
Area for fish 225.4 232.3 267.4 283.8 326.0 324.5
Area for shrimp 16.4 6.6 6.4 4.6 6.9 7.0
Area for mixed and other aquatic products 2.2 0.4 1.1 1.7 2.2 2.3
Area for breeding 0.8 2.3 2.9 3.4 3.7 3.7
Source: General Statistics Office, www.gso.gov.vn/default_en.aspx (accessed July 2012)
Figure 5.2: Seafood exports from different regions of Viet Nam in 2011
Southeast provinces
19.81% Coastal provinces in
Southern Central
Viet Nam 11.33%
Coastal provinces in
Northern Central Viet Nam
0.37%
Mekong Delta 41.79%
Inland provinces 26.7%
Source: VASEP (2011)

67
from 1990 up to now. Economic reform policies (Doi Moi) started in 1986 and became effective in the 1990s, creating favourable conditions for the production and export of aquaculture prod-ucts.30 Reforms included trade liberalisation, provision of trans-ferable land use rights, and encouragement of the private sector including household enterprises. In this period, the number of seafood processing and exporting enterprises has increased considerably. These private enterprises have been competing with and replacing the state-owned enterprises in processing and exporting aquaculture products.
30 Doi Moi (reform policy) was officially enacted by the Sixth Party Congress in December 1986 when Viet Nam faced an economic crisis and needed policy reforms aimed at reducing macroeconomic instability and accelerating economic growth. The Sixth Party Congress started replacing the centrally planned economy with a system of bureaucratic centralised management based on state subsidies, and moving towards a market-ori-ented economy with the encouragement of the private sector. More details can be found in Kien and Heo (2008).
Growth in production and exports
Since then the aquaculture sector has had remarkable success in both production and export. In the world of seafood produc-tion, Viet Nam ranks third, after China and India (see Table 5.4). There has been a substantial growth in aquaculture production in Viet Nam. In 1997, the seafood production was only 40,000 tons, which is less than one tenth of that in 2000. In 2010, the production was more than five times that of 2000.
Such increases in production were possible because Viet Nam has a growing domestic resource base and only imports a lim-ited amount of inputs for its aquatic production. In 2010, Viet Nam had to import only around 150 tons of seafood, which ac-counted for 5.6 per cent of its total production output (VASEP, 2011). Between 2000 and 2010, the area for seafood production increased constantly (see Table 5.5).
Figure 5.3: Total capacity of Vietnamese offshore fishing vessels (thousand CV)
0
1,000
2,000
3,000
4,000
5,000
2000 2002 2004 2006 20082001 2003 2005 2007 2009 2010
Note: CV is cheval vapeur, i.e., horsepower.
Source: General Statistics Office, www.gso.gov.vn/default_en.aspx (ac-cessed July 2012)
Figure 5.4: Export value of Vietnamese fishery products (US$ million)
0
1,000
2,000
3,000
4,000
6,000
5,000
1996
1998
20002002
20042006
20082010
1995
1997
1999
20012003
20052007
2009
Source: General Statistics Office, www.gso.gov.vn/default_en.aspx (ac-cessed July 2012)
Table 5.6: Major export products of Viet Nam
Unit 2006 2007 2008 2009 2010
Crude oil Thous. tons 16,442.0 15,062.0 13,752.3 13,373.0 7,977.0
Electronic parts, computers and their parts US$ million 1,807.8 2,165.2 2,640.3 2,763.0 3,590.2
Articles of plastic US$ million 452.3 709.5 933.7 867.4 1,049.3
Electrical wire and cable US$ million 705.7 882.3 1,009.0 891.8 1,311.1
Footwear US$ million 3,595.9 3,999.5 4,769.9 4,071.3 5,122.3
Textiles, sewing products US$ million 5,854.8 7,732.0 9,120.5 9,065.6 11,209.7
Fine art products US$ million 119.5 217.8 385.5 1,296.2 …
Coffee Thous. tons 980.9 1,232.1 1,060.9 1,183.0 1,218.0
Rice Thous. tons 4,642.0 4,580.0 4,744.9 5,969.0 6,886.0
Wood and wooden products US$ million 1,943.1 2,384.6 2,767.2 2,989.3 3,435.6
Fishery products US$ million 3,358.0 3,763.4 4,510.1 4,255.3 5,016.3
Of which:
Frozen shrimps US$ million 1,262.8 1,387.6 1,315.6 1,293.3 …
Frozen fish US$ million 1,083.4 1,379.1 1,968.7 1,766.9 …
Frozen cuttlefish US$ million 92.5 60.8 64.8 82.7 …
Source: General Statistics Office, www.gso.gov.vn/default_en.aspx (accessed July 2012)

68 Regional Trade Standards Compliance Report - East Asia 2013
Also contributing to the expansion of the production base has been a significant increase in the capacity of offshore fishing vessels in Viet Nam during the last ten years (see Figure 5.3).
The increase in production led to a remarkable increase in ex-port value of Vietnamese aquatic products (see Figure 5.4). De-spite a slight decrease in the value of aquatic exports in 2009 due to the global financial crisis, the export value reached a new record in 2010 at more than US$5 billion.
In recent years, fishery products have become one of the major export items of Viet Nam (see Table 5.6), accounting for more than 7 per cent of the total export value of Viet Nam in 2009.31
31 This was calculated by the author using data from the General Statistics Office of Viet Nam, www.gso.gov.vn/default_en.aspx (accessed July 2012).
Table 5.7: Top ten exporters of seafood products
2000 2010
CountriesExport value
(US$ million)World export market share
Export value
(US$ million)World export market share
China 3,603 6.5% 13,268 4.3%
Norway 3,533 6.3% 8,817 2.9%
Thailand 4,367 7.8% 7,128 2.3%
Viet Nam 1,481 2.7% 5,109 1.7%
United States 3,055 5.5% 4,661 1.5%
Denmark 2,756 4.9% 4,147 1.3%
Canada 2,818 5.1% 3,843 1.2%
Netherlands 1,344 2.4% 3,558 1.2%
Spain 1,597 2.9% 3,396 1.1%
Chile 1,794 3.2% 3,394 1.1%
World Total 55,750 308,562
Source: FAO (2012)
Table 5.8: Ten leading importers of Vietnamese aquatic products (US$ million)
Rank Importers Jan–Mar 2012Compared to the same period of 2011
(%)
1 EU 260.4 -7.9
2 United States 253.9 +18.7
3 Japan 228.6 +34.1
4 Republic of Korea 109.2 +24.1
5 China and Hong Kong 82.8 +24.7
6 ASEAN 69.9 +17.4
7 Mexico 35.9 +19.2
8 Canada 31.4 +6.6
9 Australia 36.9 +42.3
10 Russian Federation 22.6 -9.0
Others 192.3 +22.3
Source: VASEP (2012a)
Figure 5.5: Export value of shrimp and pangasius (1997–2011)
1998
20002002
20042006
20082010
201119
9719
992001
20032005
20072009
0
500
1,000
1,500
2,000
2,500
US$
mill
ion
shrimp
pangasius
Source: VASEP (2009, 2011)

69
Out of the total export value of fishery products, frozen shrimp and frozen fish accounted for nearly 72 per cent in 2009, indi-cating that shrimp and fish, of which pangasius is the most im-portant product, are two important export products in the aqua-culture sector of Viet Nam. In fact, there has been a remarkable increase in the export value and export volume of pangasius and export value of shrimp in recent years (see Figure 5.5).
As a result, Viet Nam is now among the top ten exporters of fish and fishery products and has moved up quickly in the ranking from the ninth rank in 2000 to the fourth in 2010 (see Table 5.7). In 2010, Viet Nam was only outranked by China, Norway, and Thailand in exporting fish and fishery products.
Major destinations
The increase in production was also in parallel with great di-versification of export markets. Export markets have been ex-panded to more than 150 countries worldwide including major markets such as the EU (in particular Germany, Spain, Italy and The Netherlands), the United States, China, ASEAN countries, Russian Federation, and Australia in 2011 (see Table 5.8). Be-fore 2000, Japan had been the largest market. The United States has become a more important market, especially since the Viet Nam–United States Bilateral Agreement came into force in 2001. In 2002, Viet Nam ranked second after Thailand in export-ing shrimps to the United States.
In the major markets for Vietnamese aquatic products including the EU, the United States, Japan, Republic of Korea, and China and Hong Kong (China), Viet Nam exports mainly shrimps and pangasius (see Table 5.9)
Regarding the two most important aquatic export products, major countries that were importing shrimps from Viet Nam in the first quarter of 2012 were Japan, the United States, the EU, China and Hong Kong (China), Republic of Korea, Australia, and Canada (VASEP, 2012a). Major countries that were importing Vi-etnamese pangasius in the first nine months of 2011 were the EU, the United States, Mexico, Brazil, Russian Federation, Aus-tralia and Saudi Arabia (see Table 5.10).
The United States used to be the largest importer of Vietnamese pangasius. However, since the application of anti-dumping tar-iffs by the United States, the share of pangasius exported to this market in terms of the total exported pangasius products has declined substantially, leading to the increasing importance of
other markets such as the EU and Russian Federation (see Fig-ure 5.6 and Box 5.1).
Current challenges
Despite fast expansion in the past and effective and encourag-ing government policies, the seafood sector is facing three ma-jor bottlenecks: dwindling resources; quality and safety issues; and difficulty in expanding export markets (VASEP, 2011). These bottlenecks have various causes:
�� Marine fish stock has been reduced because the coastal area has been overfished with unsustainable fishing meth-ods for many years;
�� Fishing has become more difficult because of instability in weather conditions and rising fuel prices, labour, capital and other costs;
Table 5.9: Three Vietnamese aquatic products with the largest export values in 2008
Destination markets Largest Second largest Third largest
EU Pangasius Frozen shrimps Cephalopods
United States Frozen shrimps Pangasius Tuna
Japan Frozen shrimps Cephalopods Other saltwater fish
Republic of Korea Frozen shrimps Cephalopods Other saltwater fish
China and Hong Kong Frozen shrimps Pangasius Dried saltwater fish
ASEAN Pangasius Frozen shrimps Dried saltwater fish
Source: VASEP (2009)
Table 5.10: Share of import markets for Vietnamese pangasius (%)
Destination Markets Share
EU 30%
United States 16%
Mexico 5%
Australia 3%
Saudi Arabia 3%
Russian Federation 3%
Brazil 3%
Ukraine 2%
UAE 2%
Singapore 2%
Hong Kong, China 2%
Colombia 2%
Canada 2%
Egypt 2%
The Philippines 1%
Others 20%
Source: VASEP (2011)

70 Regional Trade Standards Compliance Report - East Asia 2013
�� The quality of broodstock has been downgraded because selection has not been managed appropriately;
�� Prices of imported feed and other inputs keep increasing over time;
�� Disease outbreaks have been more frequent and serious;
�� Inappropriate usage of chemicals, antibiotics, and pes-ticides;
�� Planning of aquaculture production has not been appro-priate;
�� Farmers and processors lack management knowledge, information, capital and technology, deterring them from expanding their business and improving the quality of their products;
�� Fish prices in the international market have been fluctu-ating wildly;
�� Various trade barriers, especially non-tariff barriers such as anti-dumping measures (see later sections for details), have been set up in many countries that import Vietnamese aquaculture products; and
�� More complicated quality and safety standards have been increasingly applied in developed countries.
5.2.2 History of and trends in the pangasius industry
Production of pangasius dates back more than 50 years and takes place only in the Mekong River delta, which is the main area of freshwater fish production in Viet Nam. The pangasius in Viet Nam belong to genus Pangasius, which includes Pangasius hypoththalmus, Pangasius bocourti, and several other species that are called “catfish” in English (Phillips, 2002). Pangasius
is mainly grown in freshwater provinces of the Mekong River delta including An Giang, Dong Thap, Can Tho and Vinh Long. Before 1975, pangasius used to be domestically consumed and exported to markets such as Hong Kong (China), Singapore and Taiwan Province of China. It started to be exported to Australia in the mid-1980s and to the United States and Europe in the mid-1990s.
Viet Nam is the world largest producer of pangasius, which is low-priced freshwater fish. There are two pangasius species in commercial aquaculture in the Mekong River delta: Pangasius bocourti (Basa in Vietnamese), and Pangasius hypophthalmus (Tra in Vietnamese) (hereinafter called pangasius). These two pangasius species originated from the former, farmed in cages in this region a few decades ago. Compared with Pangasius hy-pophthalmus, Pangasius bocourti has a longer production cy-cle, which is eight months compared to six months for Pangasi-us hypophthalmus, requires better water quality, and has a lower dress-out weight, which is the amount of fish required to produce one kilo of fillet. Despite the fact that Pangasius hypophthalmus is of lower quality, it has gradually replaced Pangasius bocourti and accounts for 95 per cent of pangasius production. While Pangasius hypophthalmus has increasingly been exported, Pangasius bocourti is mainly for the local mar-ket. In 2002, only 72 per cent of Pangasius hypophthalmus was exported (Young and Son, 2002). In 2007, that percentage had increased to 90 per cent (VASEP, 2009).
In 2011, there were more than 230 pangasius exporters in Viet Nam. Vietnamese pangasius was exported to more than 130 countries with an export volume of 600,000 tons and an export value of US$1.8 billion. The major exported product was frozen pangasius fillets (VASEP, 2011).
Figure 5.6: Destinations for Vietnamese pangasius exports
0
20%
40%
60%
80%
100%
2000 2002 2004 20062001 2003 2005 2007 2008
Mar
ker s
hare
by
valu
e
USA ASEANEU RussiaChina Other
Source: Khiem et al. (2010: 15)

71
5.2.3 History of and trends in the shrimp industry
Shrimp growing has a longer history than pangasius and dates back about 100 years. In fact, brackish water aquaculture in both southern and northern Viet Nam is dominated by shrimp farming. The Mekong River delta is the most important region for cultivating aquaculture products in general and shrimp in particular. According to Le (2012), Black Tiger prawn is the ma-jor aquaculture product in Viet Nam with a cultivation area of 570,000 hectares covering 94 per cent of the total brackish and marine culture area. In Viet Nam, the Mekong River delta is the most important area, accounting for around 80 per cent of the farming area and the same percentage of production of Black Tiger prawn. The Whiteleg shrimp, Penaeus vannamei, was only introduced in 2000.
The expansion of shrimp production really took off only after the 1990s due to advancements in technology allowing the produc-tion of artificial shrimp seed, and the opening of the Vietnam-ese economy to international trade following the Doi Moi policy implemented in 1986. The government policy that allows the
conversion of rice fields and salt pans into shrimp ponds was considered one of the important factors contributing to the de-velopment of this industry.
Shrimp products for exports include block frozen shrimps, canned shrimps and processed shrimps. Of these, block frozen shrimps account for the largest proportion of total export value. Processed shrimps are, however, gradually expected to over-take traditional frozen shrimps in the future. Apart from being exported, shrimps are sold in the domestic markets. Big cities in Viet Nam are destinations for fresh and boiled shrimps.
In 2011, the export value of Vietnamese shrimps reached a new record of US$2.4 billion. Of these, which Black Tiger shrimps ac-counted for 59.7 per cent and Whiteleg shrimps accounted for 29.3 per cent of the total export value of aquaculture products. Vietnamese shrimps were exported to more than 91 countries (VASEP, 2011).
Box 5.1: Cases of international dispute over Vietnam-ese pangasius and shrimps
As a milestone in the course of its development, the pangasius industry in Viet Nam was the subject of an anti-dumping case in the United States market in 2003. Viet Nam started export-ing pangasius to the United States in 1996 and its market share in 2002 was 12 per cent. Vietnamese pangasius was famous in the United States market for its quality, taste and especially low price, which was only 50 per cent of United States catfish. Be-cause of competition from the Vietnamese pangasius, the price of the United States catfish dropped remarkably: the price of whole Ictalurus fish fell from US$1.65 to US$1.25/kg, and for Ictalurus fillet from US$4.5 to US$3.8/kg (Tung, Thanh and Phil-lips, 2004).
The continuous drop in price initiated aggressive actions from United States domestic producers. They first attacked Vietnam-ese pangasius on environmental and sanitary grounds. In 2001, the Catfish Farmers of America (CFA), comprising producers and agribusinesses in six southern states, lobbied for a ban on im-ports of catfish from Viet Nam, alleging that Vietnamese catfish was grown in unhygienic conditions in the Mekong River. After investigating the situation in the Mekong River delta, the United States Embassy in Viet Nam, however, rejected this claim.
The second attack on Vietnamese pangasius was on the name “catfish”. A group of lawmakers in the United States claimed that Vietnamese pangasius cannot be scientifically called “cat-fish” and should not be sold under the label of “catfish” in the United States market. Vietnamese enterprises had to label their pangasius as “Basa fish” and “Tra fish” to sell to the United States market. In spite of this change, exports of Vietnamese pangasius to the United States market continued to increase because it was already very popular among United States con-sumers.
The United States producers did not stop. In 2002, when the
market share of Vietnamese pangasius was up to 12 per cent in the United States, the CFA and eight catfish processors al-leged that the Vietnamese frozen fish fillets were sold in the United States at below the cost of production. The petition was submitted to the United States International Trade Commission (USITC) and the Viet Nam Association of Seafood Exporters and Producers (VASEP), which represented 56 Vietnamese seafood processors, was called to be the defendant and submit their arguments for consideration. A USITC delegation travelled to Viet Nam to investigate the situation and finally concluded that Vietnamese pangasius was sold at less than a fair price in the United States market. The case led to the imposition of import tariffs of 37–64 per cent in the United States, which at that time absorbed 75 per cent of all pangasius exports from Viet Nam (Brambilla, Porto and Tarozzi, 2007). Shortly afterwards, Viet Nam pangasius exports to the United States declined by 50 per cent with an estimated loss of about US$24 million. The farm-gate price of pangasius was reduced by half, leading to farmer bankruptcies and great loss of employment (Tung, Thanh and Phillips 2004).
As a result, processing companies and exporters in Viet Nam had to diversify their export markets to Europe, Canada, Aus-tralia and, later, to more than 50 other countries, leading to a substantial growth in the pangasius industry. By late 2003 and in 2004, the price of pangasius had recovered to its level before the case. Farmers reinvested in new cages and ponds and new processors emerged. The pangasius industry in Viet Nam has emerged as a remarkably fast-growing aquaculture sector due to the diversification of its export markets following the 2003 United States anti-dumping case.
Right after this anti-dumping case against pangasius, Viet Nam was faced with a new anti-dumping threat in 2003 against shrimp products. In December 2003, the Ad Hoc Shrimp Trade Action Committee (ASTAC), which is an association of shrimp farmers in eight southern states of the United States, filed an anti-dumping petition against six countries – Brazil, China, Ec-
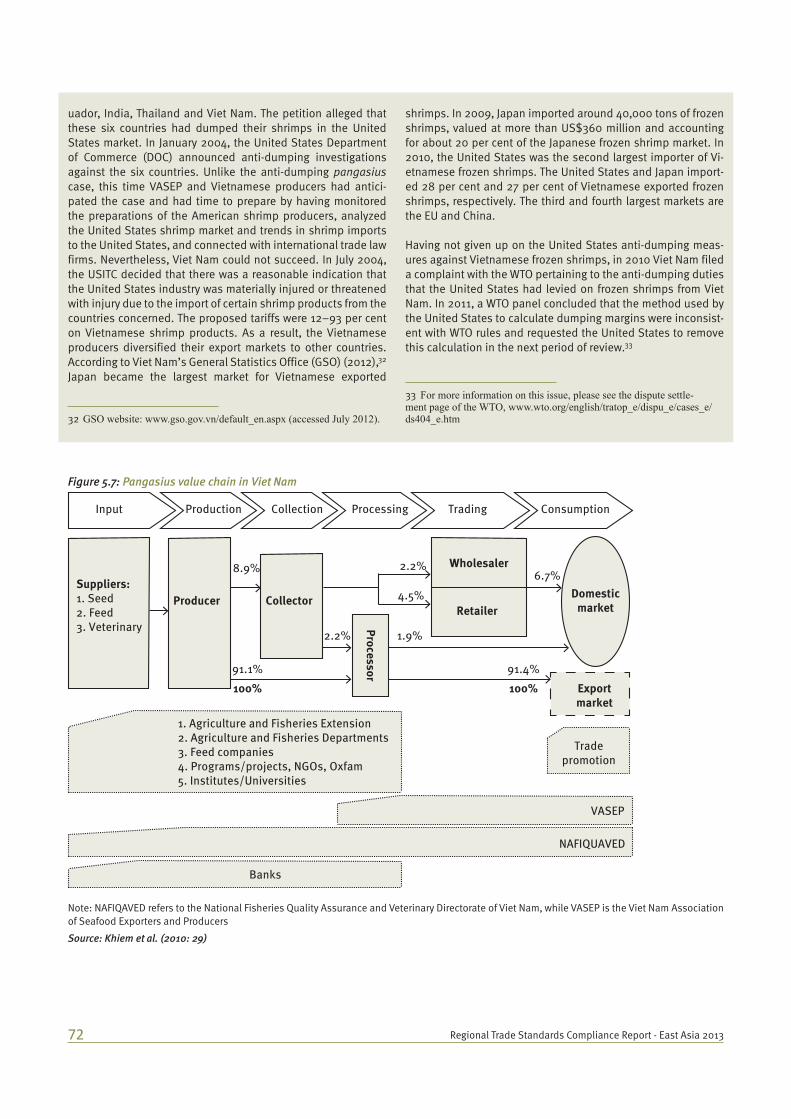
72 Regional Trade Standards Compliance Report - East Asia 2013
uador, India, Thailand and Viet Nam. The petition alleged that these six countries had dumped their shrimps in the United States market. In January 2004, the United States Department of Commerce (DOC) announced anti-dumping investigations against the six countries. Unlike the anti-dumping pangasius case, this time VASEP and Vietnamese producers had antici-pated the case and had time to prepare by having monitored the preparations of the American shrimp producers, analyzed the United States shrimp market and trends in shrimp imports to the United States, and connected with international trade law firms. Nevertheless, Viet Nam could not succeed. In July 2004, the USITC decided that there was a reasonable indication that the United States industry was materially injured or threatened with injury due to the import of certain shrimp products from the countries concerned. The proposed tariffs were 12–93 per cent on Vietnamese shrimp products. As a result, the Vietnamese producers diversified their export markets to other countries. According to Viet Nam’s General Statistics Office (GSO) (2012),32 Japan became the largest market for Vietnamese exported
32 GSO website: www.gso.gov.vn/default_en.aspx (accessed July 2012).
shrimps. In 2009, Japan imported around 40,000 tons of frozen shrimps, valued at more than US$360 million and accounting for about 20 per cent of the Japanese frozen shrimp market. In 2010, the United States was the second largest importer of Vi-etnamese frozen shrimps. The United States and Japan import-ed 28 per cent and 27 per cent of Vietnamese exported frozen shrimps, respectively. The third and fourth largest markets are the EU and China.
Having not given up on the United States anti-dumping meas-ures against Vietnamese frozen shrimps, in 2010 Viet Nam filed a complaint with the WTO pertaining to the anti-dumping duties that the United States had levied on frozen shrimps from Viet Nam. In 2011, a WTO panel concluded that the method used by the United States to calculate dumping margins were inconsist-ent with WTO rules and requested the United States to remove this calculation in the next period of review.33
33 For more information on this issue, please see the dispute settle-ment page of the WTO, www.wto.org/english/tratop_e/dispu_e/cases_e/ds404_e.htm
Figure 5.7: Pangasius value chain in Viet Nam
Input
8.9% 2.2%
4.5%
6.7%
91.4%91.1%100% 100%
1.9%2.2%
Suppliers:1. Seed2. Feed3. Veterinary
RetailerDomestic
market
Exportmarket
Tradepromotion
VASEP
NAFIQUAVED
Banks
1. Agriculture and Fisheries Extension2. Agriculture and Fisheries Departments3. Feed companies4. Programs/projects, NGOs, Oxfam5. Institutes/Universities
Wholesaler
Producer Collector
Processor
Production Collection Processing Trading Consumption
Note: NAFIQAVED refers to the National Fisheries Quality Assurance and Veterinary Directorate of Viet Nam, while VASEP is the Viet Nam Association of Seafood Exporters and Producers
Source: Khiem et al. (2010: 29)

73
5.3 Pangasius value chain and production process
5.3.1 Pangasius value chain
Figure 5.7 describes the pangasius value chain, showing the percentage value of fish sold to corresponding stakeholders. In the chain, there are suppliers of seed, feed, and veterinary drugs. Producers of seed, including larvae and fry (hatcheries), are mainly domestic, both state-owned and private, while sup-pliers of feed and veterinary drugs are both domestic and for-eign producers and traders. The state-owned hatcheries also conduct research on the quality of broodstock and aquaculture techniques. Farmers buy these inputs at the market price direct-ly from the suppliers or through traders.
At the production stage of the chain, various farmers exist to produce fingerlings and fish. While fingerling producers are mainly independent, producers of fish (called “grow-out farm-ers”) can be independent farmers, fishery association members, contracted farmers, or farms owned by processors (i.e., vertical integration). In the past, there were only independent grow-out farmers. However, as quality and safety standards required be-came more stringent, processors found it difficult to control the quality of inputs (fingerlings, feeds) and the use of antibiotics and chemicals by independent farmers, so other types of out-growers emerged. The relationship between the processors and independent farmers is based on informal agreements rather than enforceable contracts. Instead of being independent, farm-ers can belong to a producer organization (fishery association), from which they receive market information, training on quality management, and technical support.
Generally, farmers belonging to producer organizations control fish quality better than independent farmers. Contracted farm-ers are often under close monitoring by the processors, in a kind of vertical coordination between the processors and farmers. The processors provide the farmers with support and services including guidance on how to use drugs and chemicals, and accessibility to laboratory services for fish disease diagnosis. Thus, the quality of fish supplied by contracted farmers is often better than that of fish supplied by independent farmers. Moreo-ver, an increasing number of processors have been establishing their own farms to ensure the quality and traceability of the fish.
The processors apply stringent quality and safety standards to these farms to meet the requirements of the Japanese, United States and EU markets. Recently, due to higher quality and safe-ty standards imposed by importers, the number of contracted farmers and farms owned by processors has been increasing because the processors find it easier to control the production process of contracted farmers and their own plants to ensure fish quality and safety.
For the domestic market, there are local collectors who buy fish from various farmers to sell to wholesalers and retailers in big cities in Viet Nam. To the extent that the processors sometimes sell pangasius products that do not meet export quality stand-ards to the domestic market, the domestic market is a second-ary market to the export market. Fish for export are sent to pro-cessors for further treatment before being sent to the overseas markets. In the past, there were collectors between producers and processors. Due to the increase in the typical size of produc-ers, processors have been increasingly buying fish directly from farmers. As a result, collectors of exported fish have gradually closed their businesses and switched to providing transport, hired by processors or farmers to simply transport the fish.
There are various governmental and non-governmental organi-zations (NGOs) that regulate and support the main stakehold-ers in the pangasius chain. The Ministry of Agriculture and Rural Development (MARD) is the main governmental body responsi-ble for development of the fisheries sector in general and the pangasius industry in particular. Under MARD, there are regional departments that provide stakeholders in the pangasius chain with technical and financial support and extension services. The National Agro-Forestry-Fisheries Quality Assurance Department (NAFIQAD) under MARD is responsible for matters related to the quality of agricultural products, including national programmes on quality assurance and the issue of quality certificates for agricultural products. The Viet Nam Association of Seafood Ex-porters and Producers (VASEP) and the Viet Nam Fisheries So-ciety (VINAFIS) are associations of processors and exporters of pangasius that are active in promoting the development of the
Table 5.11: Characteristics of pangasius farming sites
Field pond Island pond Net-pen enclosure Floating cage
Stocking density (pieces) <20m2 20–40/ m2 30–50m2 100–250m3
Yield 50–80ton/ha 100–300 ton/ha 1000 ton/ha 100–300kg/m3
Crop cycle (months) 6–8 5–6 5–6 5–6
Meat quality (colour of meat)* Large % of yellow/pink 75–80% white >95%white >95%white
Production costs in 2006 (VND per kg) 9,000 10,000 11,000 11,000
Benefit-cost ratio (2006) 1.3 1.3 1.2 1.2
Source: Nguyen (2007)
* Color of meat is an important indicator of the quality and grade of pangasius. The best quality pangasius of grade 1 has white and light pink meat. Pangasius of grade 1 is often sold to the United States or Western European markets, which require high-quality fish. The lower-quality pangasius of grade 2 has light cream yellow meat. The lowest-quality pangasius of grade 3 has yellow meat (Khoi et al., 2008). Pangasius of grade 2 and 3 are often sold to markets that require lower-quality fish such as ASEAN countries or Eastern Europe.

74 Regional Trade Standards Compliance Report - East Asia 2013
pangasius industry. These bodies provide producers, collectors, and processors with extension services, credit, technical advice, audit services for certification and market information, organise collective actions, and provide guidelines for their production activities.
5.3.2 Pangasius production process
According to various statistics, the total production area for pangasius in 2007 was around 5,000–9,000ha (Mantingh and Nguyen, 2008). There are three types of farming sites. In descending order of importance in pangasius production, they are: ponds (field ponds or island ponds); net-pen enclosures; and floating cages in the river. Field ponds are often less than 5,000m2 and about two to three metres deep. Island ponds are on islands in large rivers or on river banks and are often 5,000–10,000m2 and up to five metres deep. Each pond re-quires about two to three workers to take care of feeding the fish and changing 30–50 per cent of the water in the pond daily by pumping water from/to canals/rivers. Ponds are often located near canals/rivers. There is no water discharge treatment so it increases canal/river pollution and disease transmission and outbreaks. After harvest, accumulated waste at the bottom of the pond is removed and released into rivers or used for agricul-ture fertilisation. Nonetheless, the pond aquaculture system is the most productive and environment-friendly (Khoi, 2011). As a result, pangasius production using ponds has become popular. Various characteristics of these farming sites are presented in Table 5.11.
In the past, most pangasius fry were caught from the Mekong River around the border between Cambodia and Viet Nam. In the late 1990s, researchers were able to control the whole life-cycle of pangasius through breeding. Today, the majority of the fry are produced in hatcheries by the private sector in the Me-kong River delta. First, larvae are nursed to fry until they reach 1g per piece. The nursing stage from larvae to fry takes 40 days and is the most risky stage because the fry are very sensitive to
changes in water quality and temperature and have a survival rate of only 8–30 per cent (Belton and Little, 2008; Sinh and Hien, 2010).
From the hatcheries the fry are nursed for around nine weeks to grow to 10–15cm (15g); they are then called fingerlings and are ready to be sold to farmers (Khoi, 2007). The nursing stage from fry to fingerlings takes 80 days with a higher survival rate of 60 per cent. When grow-out farmers purchase fingerlings, their quality is checked by observing their mobility and agility. Healthy fingerlings are a bright colour and have no body defor-mations, injuries, or damaged fins. At this stage, the quality is not checked by government bodies.
The most important determinant of fingerling quality is quality of broodstock, followed by water quality because it is directly connected with diseases. Nowadays, breeders are selected from grow-out farms with no previous knowledge or experi-ence of proper breeding methods. This has led to significant inbreeding. Quality degradation from uncontrolled breeding and shortage of seeds and fingerlings has become one of the major problems currently facing the sector. Before 2003, there was only one spawning season per year, which was from April to July. Since 2003, due to the increase in demand for pangasius, spawning has been done throughout the year. As a result, the hatcheries have to use more chemicals and veterinary drugs and give more feed to the female pangasius to make more fre-quent artificial fertilisation possible. Grow-out farmers may suf-fer because they have no way to test fingerling quality. They buy fingerlings mainly based on trust in the hatcheries.
Types of feed also affect the quality of pangasius. There are two types of feed for pangasius: home-made feed and pallet feed or manufactured feed. Home-made feed is made of rice bran/broken rice, soybeans, and trash fish, and sometimes additives such as vitamin C and lysine are also used (Khoi, 2011). It is cheaper than pallet feed and its quality is not consistent. Home-made feed, therefore, can reduce fish growth and cause high fat
Figure 5.8: Pangasius products
Raw Pangasius
Major Products- Fillets- Dry pangasius - Underdone slice skin - Shredded and dried- Canned fish- Sausage- Stomach- Others
Side product: Fat
Soap
Side product: Bones and head
Livestock feed
Source: Authors

75
deposition in visceral areas of the fish. As a result, farmers have shifted from home-made to pallet feed. Until 2002, 99 per cent of farmers still used home-made feed. However, in recent years, the use of pallet feed has increased, particularly on large farms (Khiem et al., 2010). It takes approximately 4kg of home-made feed or 2.5–2.8kg of pallet feed to produce 1kg of pangasius. The fish are fed five to six times a day. In terms of operating costs for fish producers, feed is the largest cost, which is about 74 per cent if home-made feed is used and 90 per cent if manu-factured feed is used (Khiem et al., 2010), followed by the costs of fingerlings and labour. Therefore, the survival of fish produc-ers depends heavily on the price of feed. In fact, many farmers decide whether to cultivate pangasius or other types of fish on a crop-by-crop basis (Khiem et al., 2008).
In the past, Pangasius bocourti was known for its disease resist-ance. However, because the rapid expansion of its production has resulted in high stocking densities and water pollution, dis-ease occurrence has been increasing. To deal with the problem, farmers are using antibiotics for prophylactic therapeutic treat-ments. Because it would be too costly for farmers if their fish failed to meet buyers’ standards and couldn’t be sold, farmers follow the quality management rules and regulations strictly. They are, however, rarely aware of what medicines are permitted and not permitted. The small-scale farmers simply follow the advice of friends and drug sellers on how to treat disease and use veterinary drugs (Khoi, 2011). Fish quality is first assessed by visual checking of colour and size and later by testing in the laboratory. Consumers in the United States and the EU prefer fish with white and pink meat and of identical size and are will-ing to pay higher prices for it. Fish that have yellow meat and/or not identical sizes can only be sold to Eastern European markets such as Russian Federation and the ASEAN countries. Some farmers rotate pangasius culture and shrimp culture to avoid
diseases.34 The culture of fish is all-year around. It takes about 6–8 months to raise fingerlings to a weight of around 1–1.5 kg before harvest and being sold to processors or collectors.
Three weeks before harvest processors or traders often come to farmers to check fish quality and take a sample of fish they might want to buy to test for antibiotics and chemical residues. If antibiotic and chemical residues exceed the required stand-ards, the harvest will be postponed for some time so that the residues will be reduced down to the appropriate level. Before harvest, the fish are starved for two days. The fish are then har-vested and transported alive to the processors by boats.
The final price for fish depends largely on its quality. To assess fish quality, the collectors/processors will check the colour of the fish and take a sample for further testing in their own labs or independent labs. The final price is not set until the day of harvest. In fact, independent farmers and even the contracted farmers have little power in negotiating prices with the collec-tors and/or processors, partly because they have no labs for testing fish quality. Also, there is often delayed payment from collectors/processors to farmers.
In processing factories, different fish from different farmers are separated into different batches by the processors. The fish are then checked for quality by sampling, cleaned, filleted, and frozen for exports. To obtain certification of compliance with HACCP standards, the products are randomly checked and
34 While it is easy to convert shrimp ponds to rice fields, it is difficult to convert pangasius ponds to rice fields. As a result, pangasius production maintains a high latent capacity, where farmers produce pangasius when the demand is high and stop production temporarily when there is reduc-tion in demand.
Figure 5.9: Pangasius farm sizes in An Giang province
0
0.2
0.4
0.6
0.8
1
0.1
0.3
0.5
0.7
0.9
Prop
ortio
n
> 2 ha
0.21 - 0.3 ha
1 - 2 ha
0.11 - 0.2 ha
0.51 - 1 ha
0.05 - 0.1 ha
0.31 - 0.5 ha
< 0.05 ha
2006
4,696
7.2
21.4
20.9
38.4
2007
7,558
17.7
23.5
24.9
16.8
2008
5,459
17.3
28
17.3
16.7
2004
6,892
5.8
18.1
22.3
46.7
Source: Khiem et al. (2010: 2)
76 Regional Trade Standards Compliance Report - East Asia 2013
analyzed by NAFIQAD. Major products from pangasius include fillets, dry pangasius, underdone sliced skin, shredded and dried fish, canned fish, sausages, stomach, and others. In ad-dition, there are side products; for example, pangasius fat is sold to producers of soap, and pangasius bones and heads are sold to producers of livestock feed (see Figure 5.8). Most of the processors apply quality management systems such as HACCP, ISO 9001:2000, and SQF 2000. Large processors are equipped with advanced equipment and machines and frequently provide their workers with training (Khoi, 2007).
Over time, the pangasius industry has seen an increase in the number of large farms and a decline in the number of relatively small farms as depicted in Figure 5.9. Pangasius production is more capital-intensive than other aquaculture products so smaller farmers cannot compete with larger ones. Processors are shifting from smaller farmers to larger ones because the lat-ter can provide them with fish of higher quality and that better meet standard requirements. However, farmers with less than 0.5ha still accounted for more than 80 per cent of all farmers in 2008. Because of limited land it is more difficult for small pangasius farmers to grow but relatively easier for them to culti-vate other fish species or even downgrade from grow-out farm-ing to nursing or hatching. Farmers without the capital to invest in nursing or hatching were forced to leave the industry.
5.4 Shrimp value chain and production process
5.4.1 Shrimp value chain
Figure 5.10 describes the value chain of shrimp production in Viet Nam. In this chain, input suppliers include three groups of stakeholders: sellers of inputs such as feed and antibiot-ics; fishermen who catch wild shrimp broodstocks; and shrimp hatchery and nursery farmers. The fishermen sell their brood-stocks to the hatchery and nursery farmers directly or through traders. Some broodstocks are brought from central Viet Nam to the Mekong River delta. According to Le (2012), in 2009 there were 1,100 Black Tiger and five Whiteleg hatcheries in the Me-kong River delta that produced more than 9 billion post-larvae Black Tiger prawns and 250 million post-larvae Whiteleg prawns, altogether accounting for 50 per cent of the total demand in the region. More than 70 per cent of the Black Tiger post-larvae are sold directly to the grow-out farmers in the same province, while about 26 per cent are sold through seed traders and the rest are kept for self-nursing. The hatcheries can have five to six cycles a year. The nursery sites can have about 50 cycles a year, each cycle being about three to five days.
Grow-out farmers, including improved extensive and intensive/semi-intensive farmers, can be independent farmers or con-tracted farmers, invested in by the processing companies.35 Ac-cording to Le (2012), compared with the intensive farmers the improved extensive farmers often have a larger average culture area per farm, lower average stocking density, shorter stocking
35 Extensive shrimp production is the traditional method that is often used in the coastal areas and requires minimal investment in labour and management, while intensive shrimp production requires heavy invest-ment in capital and labour.
Figure 5.10: Shrimp production value chain (Black Tiger) in Viet Nam
4.4%
29,6%
4.3%
8.1%
6.6% 53.5% 0.5%
17.0%
83.0%
100.0%100.0%
12.6%
13.3%
1.0%
14.9%
18.0%
11.6%
16.4%
1.8%
18.8%
3.0%
7.8%
Production Processing Retailing Consumption ExportMiddlemen/TradersInputs
Inputs:SeedFood
Drugs
Exten-sive
Farm-ers
Collec-tors
Proces-sors
Do-mestic
con-sumers
Interna-tional
markets
Markets/Restau-
rants/Super-markets
Whole-salers
Tradingcompa-
nies
I/SIFarm-
ers
Source: Le (2012: 71)

77
time, a lower percentage of post-larvae being tested for diseas-es, prawns mainly fed with natural feeds, lower survival rates, and importantly lower yields, which is only one-seventh of that of intensive farmers. Intensive and semi-intensive production is mainly used for growing Penaeus vannamei, while extensive pro-duction is used for growing Black Tiger and Whiteleg shrimps. In the Mekong River delta, about 78 per cent of the area is culti-vated by the improved extensive farmers and the remainder by intensive and semi-intensive farmers. Most of these farmers are independent and small-scale (Tung, Thanh and Phillips, 2004).
Prawn trading activities often take place during the peak harvest period from April to September. The independent farmers sell their products to collectors who sell the shrimps to wholesale buyers. The collectors and wholesale buyers are sometimes owned by the same people who supply inputs. The wholesale buyers then sell the shrimps to the processing companies. The relationship between the wholesale buyers and the processing companies is often characterised by on-the-spot marketing. The contracted farmers often sell the shrimps directly to the pro-cessing companies. They may, however, sell to the collectors and/or wholesale buyers as it is not always possible to enforce the contract between the processing companies and the con-tracted farmers. According to Loc (2006), about 60 per cent of the shrimps are sold to the processing companies through the collectors and/or wholesale buyers.
For export, the shrimps will be processed, packed, and deliv-ered to distributors, which are foreign import companies, some of which are located in Viet Nam, mostly in Ho Chi Minh City. These foreign import companies re-label the final products and sell them to foreign retailers, who then sell the shrimps to end users. For the domestic market, the shrimps can be sold directly by farmers or collectors and processors to local markets, super-markets, and restaurants. In the shrimp value chain, 83 per cent of production is for export, while only 17 per cent are sold to the domestic market.
Apart from the main stakeholders already mentioned, there are minor stakeholders including service providers such as feed, medicine, and ice suppliers, people who process shrimp heads, and local transporters.
Similar to the pangasius value chain, various government organizations and NGOs support the major stakeholders in the shrimp value chain. The MARD and its agencies, of which NAFIQAD is important, VASEP, and national and provincial trade promotion centres manage the shrimp industry and provide the suppliers, farmers, and processors with technical advice, exten-sion services, management training courses, quality control, fi-nancial support, and opportunities to take part in domestic and overseas trade fairs. Particularly, VASEP, as an effective proces-sors’ association, represented them in legal matters including the European anti-dumping legislation and provides its proces-sor members with market information and various trainings.
Comparing the market structures of the two sectors, while large proportions of both pangasius and shrimp go to processors (93 per cent for pangasius and 83.6 per cent for shrimp, based on previous figures) and are exported, the value chain structure before processing is more complicated for shrimps than for
pangasius. Because of rising standards, pangasius production is becoming more consolidated (as will be explained later), and the role of collectors between grow-out farmers and processors is becoming less important. On the other hand, a large propor-tion of shrimps are still being produced by small-scale fish farm-ers. We will examine the differences in these sectors by care-fully analysing the production processes of these two types of aquatic products.
5.4.2 Shrimp production processes
Shrimps can be either caught from the wild or raised in farms. In Viet Nam, when exports of shrimp began in 1975, shrimps were mostly caught from the sea. As exports increased over time, cultured shrimps have become dominant. Black Tiger and Pe-naeus vannamei are the two main types of shrimp cultured in Viet Nam.
As mentioned above, for cultured shrimps there are two ways of organising shrimp production – extensive and intensive/semi-intensive. Extensive shrimp production is the traditional meth-od that is often used in the coastal areas and requires minimal investment in labour and management, while intensive shrimp production requires heavy investment in capital and labour. In-tensive shrimp production is higher-yielding than extensive pro-duction, but it is also prone to the outbreak of diseases due to its high shrimp density. Disease induces the farmers to use an-tibiotics and that could affect shrimp quality. Intensive shrimp production methods are known to have negative effects on the environment because of the frequent use of chemicals. Disease outbreaks have also been experienced by other shrimp-produc-ing countries, such as Taiwan Province of China, Indonesia and Thailand.
Post-larvae are produced in hatcheries until they reach about 2–2.5cm and are sold to farmers. Post-larvae quality is often checked by sight. Shrimp diseases including fungal disease, white spot disease, and Monodon baculovirus (MBV) disease are common. To prevent these diseases farmers have to use a great number of antibiotics and chemical substances.
It takes about four months for the grow-out farmers to grow the shrimps. The main shrimp crop starts in January and ends in May. Shrimps are often harvested several times in one crop so that harvesting can continue for some months beyond May. Be-cause collectors and/or wholesale buyers collect shrimps from different grow-out farmers and mix them together, it is more difficult for the processing companies to trace the shrimps and ensure their quality than if they buy shrimps directly from con-tracted farmers.
Wild shrimps, by contrast, are seldom infected with micro-organisms and bacteria. After being caught, the shrimps are stored on boats offshore for an average of 5–7 days (minimum three days and maximum 15 days). The shrimps will be sold to the collectors and/or wholesale buyers who will then sell them to the processing companies within a day. For various reasons such as inappropriate temperature, transportation hygiene, and time spent in offshore storage and transportation, shrimps can, however, be infected with micro-organisms and bacteria.

78 Regional Trade Standards Compliance Report - East Asia 2013
5.5 Compliance with what standards is required by importing countries?
A great number of different food quality standards and certifi-cations are relevant to this sector and importers’ requirements also vary across countries. Table 5.12 provides some of the rel-evant certifications. These are typically requested and required by the importers. Having these certificates by no means guar-antees that products procured by these processors will pass inspection at the port. However, many importers are requiring these to screen the capabilities of firms.
Although the focus of these certificates varies, the main con-cerns for these certifications can be categorised as (a) hygiene, (b) social, and (c) environmental. While early certifications were concerned with what is physically included in the food products (i.e. (a)), more recent certifications tend to include other fac-tors surrounding the production process of the food products, reflecting consumers awareness of environmental issues and sustainable livelihoods. There are both mandatory and volun-tary, public and private standards (for a thorough review on the types of standards, refer to ITC, 2011).
Apart from these certifications, each country has a set of regu-lations to check the quality of imported goods at its borders. The requirements and testing procedures vary greatly across countries, though most include tests of maximum chemical resi-
due levels. For the EU, while each member country has its own authority conducting border inspections, the European Food Safety Authority and the European Commission’s Directorate-General for Health and Consumers (DG SANCO) are in charge of assuring food safety at Union level. The EU records and shares all the rejection data through its Rapid Alert System for Food and Feed (RASFF). For the United States, the FDA is in charge of regulating imports based on the Federal Food, Drug and Cos-metic (FD&C) Act (UNIDO, 2010). For Japan, the Imported Foods Inspection Services under the Ministry of Health, Labour and Welfare (MHLW) is in charge of imported food quality regulation based on the Food Safety Basic Act (for details, refer to Chapter 2). These border inspections relate to other sets of regulations that the exporting countries need to satisfy, as we have seen in Table 5.3.
Requirements of importers vary greatly across the importing countries, raising compliance costs for the exporters. According to interviews with Vietnamese exporters, we can observe differ-ent patterns of requirements across importing countries. For the EU, the main export products are unprocessed fish fillets and shrimps, and the buyers are more concerned about whether the exporters have the relevant certifications, such as SQF, BRC, and GlobalGAP. Thus, from the exporters’ point of view, it is most
Table 5.12: List of relevant certifications
Certification Main contents Level applied Coverage
SQF2000Food safety assessment programme covering processors, distributors and warehousing
Factory Global
SQF1000 Food safety assessment programme for primary producers Farm, Hatchery Global
HACCPManagement system for the prevention of contamination by physical, chemical, and biological hazards
Factory Global
GlobalGAPInitiated by the members of the Euro-Retailer Produce Association, main focus is on food safety and traceability, and concerns with social and environmental issues
Factory, Farm Global
BRCFood safety and quality criteria required for supplying to UK retailers and designed to standardise food criteria and monitoring procedures
Factory United Kingdom
GMPDeveloped by the US FDA for verifying the safety and purity of drug and food products
Drug and chemical suppliers
United States
ISO22000International food safety management system involving interactive com-munication between chain actors, and a system management approach based on HACCP principles
Factory Global
ISO 9001-2000Quality management system for providing consistent products and services to meet customer expectations, focusing on quantitative meas-urement of performance
Feed suppliers Global
BAPAddress environmental and social responsibility, animal welfare, food safety and traceability in a voluntary certification programme for aqua-culture facilities
Farms Global
OHSAS British standard for occupational health and safety management system Factory United Kingdom
PADPangasius Aquaculture Dialogue, initiated by WWF, is a set of standards based on multi-stakeholder consultation
Farms Global
BMPTargeted to improve farmers’ management practices, delivering in-creased profitability and environmental performance by making more efficient use of resources
Farms Global
Source: Khiem et al. (2010); Mantingh and Nguyen (2008)

79
important to obtain the required certifications. This is similar for the United States, except that certificates such as Best Aq-uaculture Practices (BAP) are more popular there. As of 2012, there is no requirement by these countries for seafood consign-ment sampling and testing before clearance for export (VASEP, 2012a). On the other hand, the Japanese market presents a different case. Japanese buyers’ are not much concerned with whether the exporter is certified, but about the actual levels of antibiotic residues in the products. Although Japanese import-ers do not value certifications, they care about how production is carried out in practice and often visit processing factories with technical experts and offer technical advice for improvement. Importers conduct sampling tests voluntarily, apart from the mandatory inspection by the Vietnamese authority (NAFIQAD), because the sampling rate and testing accuracy are not enough to meet Japanese quarantine standards. Importers fear port re-jections because their names will be revealed on the MHLW’s
website, damaging their reputation. According to exporters, port inspections in Japan are very strict relative to the EU and United States.
Furthermore, these quality standards required by importers are not stable but evolve over time, often with “very short notice” according to Vietnamese exporters interviewed for this study.36 Exporters say, “Importers require the certificate A today and to-morrow they require the certificate B. As an exporter, there is no alternative but to obtain the B certification as well because otherwise we lose business. At the same time, we also need to pay for renewing the certificate A”. According to exporters, lately Japanese ports are intensifying the inspection of Vietnamese products. These cases are detailed in Box 5.2.
36 Note that whether this refers to a sudden change in a policy or reflects the lack of policy surveillance capability by importers is not clear.
Figure 5.11: Quality inspections conducted at each level along the value chain
InputProducer
GrowoutFarmers
TradersCollectorsWholesalers
ProcessorsExporters
Export Market
Visual check by buyers (size, color, health)
Visual check by buyers (size, color, health)
Visual check (size, color, health) by buyers
In-house lab tests (antibiotics, biotics, chemical residue) by buyers
Lab tests by NAFIQAD (5% sample)
Voluntary lab tests by importers
Source: Authors, based on interviews
Box 5.2: Ethoxyquin in Vietnamese shrimp
On 18 May, 2012, a Vietnamese shipment to a Japanese port was found to contain ethoxyquin. Ethoxyquin for shrimp is among those chemicals for which MRLs (maximum residue lev-els) are not established, and because the Japanese government uses the positive list system (refer to Chapter 2), the uniform maximum residue level of 0.01ppm is applied. According to “the Imported Foods Monitoring Plan for FY 2012”, if a violation is detected, the rate of monitoring inspections will be increased by 30 per cent and voluntary self-inspection is advised for the violators, whose names are revealed on the MHLW website. This rate of monitoring will in principle be normalised if no further violations are detected within one year and/or after more than 60 inspections. While this procedure is a routine process for the Japanese quarantine system, Viet Nam exporters raised con-cern because (a) the Japanese MRL for ethoxyquin is too low given that the MRL established by the EU and the United States is 150ppm and Japan also applies 150ppm for fishmeal (but not for shrimp), and (b) the source of ethoxyquin in Vietnam-ese shrimps was imported fishmeal from Latin America, which is also used by other exporting countries such as Thailand or Indonesia. Thus, the Vietnamese government and exporters’ as-sociations argue that it is not fair that only their shrimp will be the target of intensive monitoring.
NAFIQAD’s director visited Japan to request adjustment of the MRLs for ethoxyquin based on the risks to human health. The Vietnamese government made a list of fishmeal containing ethoxyquin with its MRLs and instructed exporters not to use fishmeal containing this chemical (VASEP, 2012c). The export-ers interviewed expressed great concern over this issue and mentioned that many of them are now refraining from exporting to Japan due to the fear of being rejected once again (another violation detection would increase the inspection rate to 50 per cent). They said that ethoxyquin is also included in the feed of pigs, chickens and fish in order to maintain quality. Shrimps can feed on soybeans but that would result in low quality as shrimps need a lot of nutrition until close to harvesting. In order to test for ethoxyquin, exporters need to import some testing kit, add-ing to their costs. One exporter estimated that the inspection fee increased costs as much as 20–30 cents per kg of shrimp after this incident.
In fact, there were similar incidents in the past, such as the case of enrofloxacin (2011) and trifluralin (2010) relating to shrimp exports to Japan. After the detection of violation at Japanese ports, the Vietnamese government decided to include both in a list of prohibited chemicals (Circular 03/2012/TT-BNNPTNT for enrofloxacin and Circular 20/2010/TT-BNNPTNT for trifluralin; VASEP, 2010; 2012b).

80 Regional Trade Standards Compliance Report - East Asia 2013
Overall, because of the rise in standards, testing fees and cer-tification fees are increasing for exporters. Exporters currently incur on average 1.5 to 2 times more expense on testing fees compared to some years back (VASEP, 2012a). Also, because inspection takes longer at Vietnamese ports before shipping abroad, it adds more storage expenses. The increasing number of different certifications and standards also adds costs for the exporters. The application costs for certifications (US$2,000 for the initial cost of GlobalGAP) need to be borne by those who will be certified – stakeholders in Viet Nam. Processors and export-ers incur these costs while for smallholders, government sub-sidy is offered in some cases. There are also cases where the testing fees are borne by importers.
5.5.1 What measures are taken in Viet Nam?
Processors/exporters
Even with this increasing number of certificates, requirements seem mostly to be satisfied by exporters. When you visit these exporters, you quickly notice that they have many framed certifi-cates hanging on their office walls. Although exporters express complaints, particularly because they need to bear all the costs of obtaining these certificates, they still decide to obtain them to continue trading. Most exporters also have in-house labs to check chemical residue levels (see Figure 5.11). They test the levels before purchasing from traders or smallholders and be-fore shipping for export. Some exporters also mentioned the use of outside labs that can detect antibiotics more accurately for shipment to countries like Japan where testing is very strin-gent. These types of private labs are also available in the coun-try. Processors who have a special relationship with importing firms (i.e. subsidiary firms, long-term suppliers, contractors) are in a better position to receive technical advice and informa-tion about the required standards relative to other independent firms. We observed that some processors have Japanese tech-nical experts sent by their buyers who work in their factories, monitor the production processes, and offer advice for improve-ment on a daily basis.
Small-scale farmers
According to the interviews and field surveys conducted in June 2012, the greatest difficulty with compliance seems to lie at the level of small-scale producers as there are a large number of them. First of all, many farmers do not even know what the rele-vant standards are. According to Khiem et al. (2010), 36 per cent of farmers were not aware of these quality and safety standards in 2008. For popular standards, such as SQF and GlobalGAP, the MARD has put a lot of effort into increasing smallholder awareness by offering them training sessions and by offering to shoulder 50 per cent of application costs to obtain certificates. However, according to extension workers, the number of small-holders who have actually obtained these certificates is trivial because (a) the certification costs are high, (b) they have their own farming experience and do not see the necessity of being certified, and (c) they are “conservative”. It is too costly for farm-ers to acquire such standards and they are not rewarded with higher prices for the products that satisfy these standards.
Government
Various government bodies and NGOs regulate and facilitate the development of the aquatic sector in Viet Nam. The Minis-try of Agriculture and Rural Development (MARD) and provincial Departments of Agriculture and Rural Development are the cen-tral and local governmental agencies, respectively, that manage the development of the aquaculture industry. Under MARD, the National Agro-Forestry-Fisheries Quality Assurance Department (NAFIQAD) consisting of six regional centres in Viet Nam is in charge of food safety assurance and quality control in the aqua-culture industry. NAFIQAD succeeded the former National Fish-eries Quality Assurance and Veterinary Directorate (NAFIQAVED) in 2007 for the purpose of “assisting the Minister to carry out the state governing of quality and safety of agricultural, forestry, fishery products, and salt nation-wide”.37
Among their activities and responsibilities, one that is important to the seafood export sector is regular monitoring inspection for harmful substances, which is conducted annually according to “the Residue Monitoring Programme for Certain Harmful Sub-stances in Aquaculture Fish and Products”. The monitoring pro-gramme is considered to follow EU requirements. According to NAFIQAD’s report of activity in 2010, they inspected 154 aquatic areas in 36 provinces and cities for various species, including Black Tiger shrimp, white shrimp, giant prawn, and catfish. In total, 4,075 samples were inspected, of which 3,798 were from production farms, 143 samples were from hatcheries, and 134 samples were from middlemen. The results of inspections re-veal the number of unsatisfactory samples (but not the names of the sites). Notably high violations were found in the use of prohibited antibiotics, particularly trifluralin, which was newly included on the list of prohibited substances for aquaculture in 2010. When violations are found, NAFIQAD takes measures such as (a) requesting suspension of production at these sites, (b) requesting processors not to purchase from these sites, (c) investigating the root cause for the violation, etc.
Apart from the monitoring inspection, NAFIQAD is also respon-sible for issuing export certification to companies based on their inspection. In addition, all the export products need to go through random sampling tests by NAFIQAD before export. Ac-cording to exporters, the rate of testing at the port is about 5 per cent. NAFIQAD is also responsible for disseminating informa-tion about changing import requirements to the stakeholders in the sector.
During the last few years, complicated safety standards related to chemical and drug residues and importer certification sys-tems have been increasingly applied to exported aquaculture products from various countries including Viet Nam. To cope with the new requirements, at the national level, MARD have re-quested local authorities to focus more on improving the quality of fish products even at the expense of quantity reduction. Vari-ous other new legal documents have been released to improve quality and manage hygiene and food safety in the industry. The Vietnamese government announced a Master Plan for the aquaculture and fisheries sector for the period 2005–2010 and directions for 2020. At the local levels, few provincial and mu-
37 From the NAFIQAD website, www.nafiqad.gov.vn/d-monitoring-programme (accessed August 2012).

81
nicipal governments have been active in training farmers and processors on how to conform to such complicated quality and safety standards or providing subsidies for application of these standards.
Industry associations/Non-government organizations
Besides these state administration agencies, the Viet Nam As-sociation of Seafood Exporters and Producers (VASEP) and Viet Nam Fisheries Society (VINAFIS) play an effective role in promot-ing development of the industry. VASEP is an effective local as-sociation of leading seafood exporters and producers founded in 1998. They actively represent their members in local and in-ternational collective actions and provide their members with diverse services such as extension services, trade fairs, and information. VASEP also conveys opinions from the member exporters and producers to the government and to importing countries. Additionally, there are provincial fish associations that support suppliers, farmers, processors and exporters in the industry.
5.5.2 Observed effects of standards on stakeholders along the value chains
Processors/exporters
The direct effects of the increasing importance of standards/certificates on processors and exporters are the added costs of compliance, most of the time without any increase in the sales price. For EU and United States buyers, producers and exporters invest and obtain the required certificates. They need to incur not only the initial costs but also annual renewal fee. For de-tecting maximum residues, they conduct lab tests in-house and sometimes also use outside labs before exporting. At the ports, NAFIQAD conducts another random sampling test. Overall, the current trend has increased the expenditure burden on proces-sors and exporters.
The second effect is changes to the business model of proces-sors to rely more on fish supply from their own farms or their contract farmers rather than sourcing from traders or smallhold-ers via on-the-spot marketing. With increasingly strict standards, the transaction costs of dealing with many smallholders are ris-ing. In terms of assuring traceability, it is easy to centrally control all the processes from fish production to processing rather than having to trace all the smallholders’ production histories. Thus, there is a trend for processors to vertically integrate production. One exporter who owns large shrimp ponds mentioned that, in their production system, each pond is labelled with an identi-fication number. Thus, if some problems with these shrimps were detected, they could stop using all the shrimps from that pond and investigate the cause. The exporters also issue IDs for traders who bring fish/shrimps to their factories. However, be-cause traders purchase from many small ponds and each pond is often too small to fill one container used for transportation, they tend to mix fish/shrimps from various ponds. This makes it more difficult to assure traceability for inputs from traders.
This trend of vertical integration of ponds by processors is more clearly observed for the pangasius sector because pangasius are more cash-intensive and less labour-intensive than shrimps. For shrimps, although some processors have their own shrimp ponds (a few have very large ones in the order of 500ha), it is not as common as in the pangasius sector. The reasons for this difference are: (i) pangasius is a capital-intensive product that emerged only recently so that smallholders do not have much comparative advantage, (ii) shrimps are prone to diseases and thus risky if relying on one large pond, (iii) shrimps are more labour-intensive in production than pangasius, (iv) shrimps need coastal land for brackish water and are land-consuming. According to one exporter, in order to satisfy its factory’s pro-cessing capacity, it needs 4,000ha of shrimp farm. However, if it were pangasius, the company would only need 400ha. Thus, there are few shrimp processing companies that have their own ponds and, even if they do, the shrimps harvested from their own ponds account for only 2–3 per cent of total production.
Small-scale farmers
Because of the change in the business model of processors and exporters, a large number of pangasius smallholders have ex-ited the market. They either diversified into producing other fish targeted for domestic markets or downgraded their business to raising fingerlings or fish seed. On the other hand, shrimp smallholders seem to be more resistant to this change because they do have comparative advantages over the processors in producing shrimps, as mentioned in the previous paragraph (i.e. labour-intensive production, land-ownership, etc.). How-ever, as the traceability requirement becomes even more im-portant, it is likely that these shrimp smallholders are also to be consolidated in future. Among smallholders, those who have contracts with processors are in a better position to maintain their roles as fish or shrimp suppliers. However, these groups of smallholders are special as they own relatively larger ponds (thus reducing the transaction costs for the processors).
Collectors/traders
In the pangasius sector, the role of collectors and traders has declined because the processors tend to source directly from their contract smallholders and rely less on traders. Traders still operate because it requires special boats to transport the fish, but they currently function more as “transporters” than as “trad-ers” in the traditional sense. These collectors transport pan-gasius from smallholders to processors. In the shrimp sector, the traders are still active in buying shrimps from farmers and selling to processors although they have become more tightly controlled by processors through such means as formal regis-tration.

82 Regional Trade Standards Compliance Report - East Asia 2013
5.6 Major issues in import standards compliance
Given these market structures and impacts on stakeholders, what are the major bottlenecks for standards compliance in Viet Nam? Based on the fieldwork observations, we find three major issues.
5.6.1 Inadequate incentive mechanisms to comply with standards/certificates
The first and probably the most important issue is the coun-try’s weak enforcement of these certification/standards. While the stakeholders are aware of the need to comply with certifi-cation schemes/standards, under the current system there are not enough incentives for them to comply. In other words, there is neither reward for compliance nor punishment for non-compliance, particularly at the levels of small-scale grow-out and fingerling farmers. They do not have the incentive to apply for SQF1000 because in practice they can still sell their fish or shrimps without these certificates and because the costly cer-tificates do not yield higher prices. From fingerling farmers to grow-out farmers and from grow-out farmers to collectors, few are certified and no lab tests of maximum residue levels are in-volved in sales decisions. Transactions occur based on visual quality checks. Although importers, especially from the EU and United States, require particular types of certifications for pro-cessors, they do not strictly investigate whether the farmers who supply the processers are also certified.
The main problem with chemical residues is that they are not readily detectable. They need to be tested for in a lab facility. It is essentially a problem of information asymmetry, where one actor in the transaction (a seller, in this case) has more informa-tion than his counterpart (a buyer). In this situation, because the buyer cannot discern the difference between a good product and a bad product, he is not willing to pay a higher price for the former. Thus, the suppliers of good products are discouraged and they decide not to supply. This is the classic “lemon’s prob-lem” in economics, which means that “lemons” (i.e. low-quality products) drive the high-quality products out of the market. If, somehow, quality becomes observable and fetches higher prices, it is expected that two separate markets would develop for each type of product. Thus, if the processors are aiming for markets with stringent standards, they have clear options avail-able to them.
Lab tests are the only way to detect residues and thus quality. This is already done at the level of processors, but not upstream because the equipment is not widely available at the level of farmers. NAFIQAD’s regular monitoring inspection is definitely one effort to enforce high quality in the market by chasing the low-quality away, but the sheer fact of high rejection rates in EU, United States and Japanese markets suggests that it is not enough. It may be that the sample size for testing is inad-equate (i.e. low probability of detection), testing accuracy is not achieved, or that punishments for violations are not effective. Lab tests are not perfect because they rely on a sample. Accord-
ing to one of the exporters, samples of shrimps taken from the upper level of the container and the bottom level of the con-tainer may give different results.
As another example, one Japanese importer interviewed for this study mentioned that the way the test is conducted in Viet Nam is not adequate, at least not by Japanese standards. To test the residue level, it is necessary to crush many shrimp to obtain an extract from them, but he saw only a few crushed when lab tests were done at one of the Vietnamese processors. He said that if the tests are conducted in that way, even if the lab test results proved safety and the necessary documents were also well pre-pared by processors, the importers would still be suspicious. Thus, this importer does voluntary inspections at their own cost before entry into Japan because they know that the Japa-nese port inspections are very stringent. In their words, “It is ultimately up to how sincere and serious the manager is about quality standards. In Thailand, the government control is more strictly done, even from the level of fish feed”. As a reference, the share of this company’s average annual costs for the qual-ity test exceeds 80 per cent of their average annual profit. They spend this much because they fear the effect on their reputation if prohibited residues are detected in their products.
A certificate is a signal of quality. In the world of asymmetric information, because the high-quality producers want to be rec-ognised for their superiority, they invest to obtain objectively approved signals that show that quality. This works as long as the high quality receives higher reward. Between processors/exporters and importers, this is working. Because importers rec-ognise these signals, the processors/exporters have incentives to invest in them. Thus, in fact, most processors have multiple certificates. Although the existence of various and similar cer-tificates confuses processors/exporters and adds to their costs, as a mechanism, signalling is functioning at this level. On the other hand, at the level of farmers, because their buyers – that is, collectors or processors – do not strictly require or value this signalling, farmers have no incentive to invest in the costly cer-tificates. This seems to be the root cause for farmers’ disinterest in applying for certification even after attending training cours-es offered by MARD and being offered subsidies of 50 per cent of the application fee.
Currently, the Vietnamese government is trying to create VIET-GAP, which is in accordance with the GlobalGAP and thus con-tains higher requirements than the SQF1000. Previously, they emphasised SQF1000 and extension workers have offered train-ing to farmers. However, the result is that the farmers are now aware of these certificates, but not interested in getting certi-fied. Observing this situation, it is not clear whether the farm-ers’ responses to VIETGAP will be any different from their cur-rent responses. It is crucially important to consider building the incentive mechanism, that is, either reward or punishment, for the farmers to be interested in these certificates.

83
5.6.2 Weak control of upstream market
A second and related issue is the control of quality in the up-stream market, particularly at the level of shrimp seed or fish seed. As lab tests are not perfect, even if the tests are conduct-ed at the processor level before export, it is still important to control the production processes of the value chain as much as possible. At stages closer to export, the quality control becomes strict, but stages further back are less strictly controlled. Quality control physically becomes more difficult as it involves a large number of small-scale farmers who are also geographically spread apart, unlike the processors.
The most difficult control seems to be at the production input level, such as fish seed, feed and antibiotics. For example, shrimp seed is grown in many parts of the country and the Cen-tral province is known for producing seed. In 2011 and 2012, an epidemic of disease affecting shrimp, particularly Black Ti-ger shrimp, spread throughout the country, affecting 97,000ha of farms (VASEP, 2012a). This has been a serious concern for the sector and the share of Black Tiger is declining because it is prone to disease. Instead, the share of vannamei is increasing as it is more disease-resistant. The main reason for this disease is thought to be the low quality of shrimp seed. While govern-ment-owned hatcheries are SQF- and GlobalGAP-certified, these are few in number. Since these hatcheries do not have enough capacity to supply all the buyers, many grow-out farmers must purchase from private hatcheries, some of which operate with-out licence from competent authorities.
The Directorate of Fisheries in Viet Nam, Department of Animal Health, and other relevant agencies conducted seed inspec-tions in March 2012 in Khanh Hoa province, which is one of the three largest seed-producing provinces. According to VASEP, only half of the inspected hatcheries were approved as passing the standards of veterinary hygiene and given a health certifi-cate. Quoting the same source:
The Provincial Sub-Department of Animal Health highlighted difficulties in seed quarantine because a majority of seed was smuggled and out of control which caused an increase in dis-eased shrimp in localities. Until now, there have not been management measures on shrimp seed such as regulation on shrimp seed quality before releasing from the hatcheries, reg-ulation on monitoring reproductive age of broodstock which can reproduce the best quality seed. Intensifying quarantine (building many quarantine stations, establishing inter-sectoral inspection team), strengthening inspection of seed producers and traders’ operating conditions are not put into practice. Com-pared to shrimp production in Thailand, success rate in shrimp farming in Viet Nam reached 30 per cent, lower than that of Thai-land (70 per cent) because Viet Nam’s supply and quality of seed are poor. (VASEP, 2012a: 17–18)
If seeds are not controlled properly, it is easy for the shrimps to catch diseases. That would induce farmers to use antibiot-ics to treat the disease. However, according to interviews with extension workers, it often happens that these farmers are not very aware of what is contained in these antibiotics. Some input sellers try to approach farmers with bags of mixed antibiotics and sometimes offer free training programmes on usage as a sales campaign. Because farmers do not wish to kill their sick shrimps, they use these antibiotics. If these are not properly managed, then the chemicals remain in some shrimps. Thus, control of inputs is also critically important to ensure the quality of the final export products.
5.6.3 Still room for non-compliance
Lastly, an additional difficulty with standards compliance is the fact that there is no one common standard/certificate on the international market. The standard requirements vary greatly across various importing countries. Thus, even if a product does not satisfy the needs of one country, the processors can shift that product to another country with lower standards. In fact, in the interviews, most of the processors openly admitted that when they have had products rejected or products that do not meet the standards of the EU, United States or Japanese mar-kets, they send those products to other markets, for instance in Asian and Middle Eastern countries. They added that because these products still satisfy the standards set by these markets, it does not mean that they are sending bad products.
These “loose ends” in the international market work both posi-tively and negatively for the processors. The diversity of require-ments is a plus for processors because they can always find somewhere to ship the “low-quality” product even when some problems occur. It also works negatively in terms of standards compliance because this leaves room for them to be less careful in quality control in the production process. If the end product is strictly inspected by a common standard, they would have no option but to follow the strict rule.

84 Regional Trade Standards Compliance Report - East Asia 2013
5.7 Conclusions and policy implications
In this chapter, we examined the situation of standards compli-ance in the particular case of the Vietnamese frozen seafood export sector. We have seen that the rapid expansion of this sector was not only due to market liberalisation policies but also due to efforts to diversify destination markets, particularly when their pangasius and shrimps were at risk through interna-tional trade disputes. This diversification may have made stand-ards compliance more difficult for Viet Nam because different markets require different standards. In addition, because most of the Vietnamese processors and exporters are independent entrepreneurs and not controlled by large multinational com-panies, unlike in Indonesia and the Philippines, it is probably more difficult to apply one common standard to the production processes and management (Taya, 2003).
The increasingly stringent trade standards are adding costs for Vietnamese stakeholders but mostly without increasing prices. The required standards vary across importers and over time, of-ten with short notice, and are creating confusion among stake-holders. We have heard a lot of cries from processers during the interviews conducted for this study. Still, the processors and exporters try to comply, as meeting these standards provides access to export markets. The great difficulty lies in standards compliance at the level of the small-scale farmer. In fact, be-cause it is costly and difficult to deal with numerous small-holders and enforce standards, many processors are no longer relying on smallholders and are moving to vertically integrate production processes, particularly for the pangasius sector.
The chapter concludes with some policy recommendations to help improve trade standards compliance for Viet Nam. Firstly, a stricter enforcement mechanism is needed to ensure standards compliance. While a lot of famers are now aware of the exist-ence of these standards and certifications, they are not willing to obtain certifications because there is no effective incentive mechanism. Secondly, because random sampling tests of maxi-mum residues are never perfect, it is also important to regulate the upstream market as much as possible, particularly at the levels of fish/shrimp seeds. This strict control of seeds will re-duce the risk of disease and thus the use of antibiotics. Thirdly, in addition to intensifying monitoring by local authorities, of-fering access to public labs for farmers may also bring positive results by educating farmers about the condition of their fish. If they can check the status of their fish themselves before sale, that will also give them more incentives to grow safer fish. Here, development agencies seem to have important roles to play.

85
6. Conclusion
This report analyzed trends and patterns in rejections of agri-food exports from East Asian countries to the Japanese and other key international markets. While often overshadowed by the size of manufacturing exports, agri-food exports from East Asian countries are still substantial. In 2010, East Asian coun-tries exported US$149 billion worth of agri-food exports, which is similar to the value of exports from Latin America. However, some of these exports were rejected at the destination because of non-compliance to food safety regulations.
Among the 10 countries with the highest number of such rejec-tions in the Japanese market, five are from East Asia, including China, Viet Nam, Thailand, Republic of Korea, and Indonesia. Among the agri-food products rejected at Japanese borders, “fish and fishery products” and “fruits and vegetables” are re-jected most frequently. Reasons for such rejections vary. The most common root causes of import rejections by Japanese authorities are bacterial contamination, inadequate hygienic condition/controls, and the presence of pesticide residues, my-cotoxins, and additives.
When looking at the rate of rejections per US$ billion of imports (an indicator that is termed unit rejection rate) for Asian export-ing countries, food products originating from Japan, Republic of Korea and the Philippines are among the most frequently reject-ed in the Australian market. In the EU market, China, Thailand and Republic of Korea are among the countries with the highest number of rejections. In the United States market, Hong Kong (China), Republic of Korea, Singapore, Viet Nam and China have rather high rejection rates. So, interestingly, not only lower-in-come countries but also relatively higher-income countries such as Japan and Republic of Korea perform poorly in some markets.
There is also variation in the predominant reasons for rejec-tion across the four markets analyzed here. In Australia and the United States, non-compliance with labelling requirements re-sults in significant numbers of rejections while Japan does not reject for labelling reasons and the EU only makes relatively few rejections on this basis. In contrast, bacterial contamination is the most prominent reason for rejections in Japan. Rejections caused by inadequate hygiene conditions are significant in the United States.
These rejection reasons all point to certain kinds of problems along the supply chain and the report gave special attention to four commodities from two countries: frozen vegetables and eels from China; and pangasius and shrimp exports from Viet Nam. These case studies were chosen because they are signifi-
cant export commodities for these countries and, at the same time, face difficulties in clearing inspections at ports.
One finding that clearly came out from looking at these four commodities and their supply chains is that export activities in these countries are increasingly vertically integrating. This is because to meet the standards set by importing countries (es-pecially those of advanced countries), exporting firms need to put in place some kind of traceability system so that they can identify where the problem occurred and how to deal with such problems when faced with import rejections. Vertical integration facilitates such flow of information.
One implication of this trend to vertically integrate is the com-partmentalization of these industries into export-oriented and domestic-oriented segments either by the necessity of the mar-ket force or by the regulations imposed by the government as in the case of China. Those that are export-oriented are typically led by large firms that can invest in their own quality control and inspection equipment. They also tend to contract with large farmers for their inputs and provide technical assistance if nec-essary. In contrast, domestic-oriented firms do not have such capacity to strictly control the quality of their products to the level required by importing countries. Thus, the industry is bi-furcating: one mainly composed of large firms (and farms) that are producing higher quality food meant for the export market; the other composed of smaller firms (and farms) that are mainly oriented towards the domestic market with varying quality.
While a certain degree of vertical integration may be unavoid-able, more focused attention should be given to smallholder farmers so that these small and medium establishments can more easily and seamlessly integrate into global supply chains. In addition, for certain commodities such as shrimps, the small size of farms is necessary as a risk mitigation measure. Further-more, from a poverty reduction point of view, it is vital to improve the capabilities and productivity of small and medium-sized firms and farms because they provide valuable employment op-portunities in rural areas.
To improve the capacities of small and medium-sized firms and farms, filling the information gap is of highest importance. The case studies in these two countries reveal that throughout the supply chain there are still knowledge gaps among different players with respect to the proper usage of agricultural chemi-cals and medicines and the gap seems to be largest upstream, i.e. among the original producers, especially smallholder farm-ers. For cultured aquatic products, in addition to proficiency in

86 Regional Trade Standards Compliance Report - East Asia 2013
dealing with medicines, sufficient knowledge and proper under-standing of feeds are also required. To improve upon this knowl-edge aspect, two efforts need to be undertaken. The first is to raise awareness among farmers and processors on the proper usages of agricultural chemicals, medicines, and feeds. Such effort needs to be coupled with proper technical assistance so that farmers can readily apply their knowledge in practice. In ad-dition to the awareness raising efforts, the distribution of these chemicals, medicines, and feeds needs to be tightly controlled and recorded more stringently to enable traceability. Further-more, this kind of efforts should not be restricted to certain sec-tors but should be applied to a wider variety of commodities, if applicable, to allow rotation of crops or aquatic products to be cultured and to prevent negative spillovers coming from other farming activities conducted nearby.
Partly motivated by the requirements coming from the export sector and partly to improve the quality of food available do-mestically, both Chinese and Vietnamese governments are put-ting in place stricter domestic standards regarding agricultural and food products. This move is more visible in China where a number of food related scandals occurred lately. In general, as income rises, the demand for safer food will only increase in any country. The key is to put in place action plans and measures to improve the quality of agricultural and food products early on in the development stage, so that even smallholder farmers can adjust their production processes to meet higher standards in both domestic and international markets as the country devel-ops. Without such efforts, small-hold farmers will be further left behind which could potentially lead to an increase in inequality between export- and domestic-oriented sectors, and also be-tween rural and urban areas.
Some markets (notably the EU and the United States) put em-phasis on obtaining internationally recognized certification (e.g. to ISO or HACCP standards) and this is becoming a nec-essary condition to export (although not sufficient to guaran-tee successes in exports). These certificates work as signaling devices at the processing stage. While difficulties in obtaining such certificates differ across Asian export countries, public as-sistance to firms may be necessary.
Smaller firms find it difficult to continuously scan and gather information on the required rules and standards of importing countries, especially when these rules and standards are sub-ject to frequent changes. Industrial associations or similar or-ganizations should have enough capacities to follow the trends in these standards. What is important is that such effort should include not only notifying concerned actors on the changes in the rules and standards ex post facto, but also to let these play-ers know of anticipated changes in these standards so that they have enough lead time to prepare until changes take effect.
Finally, as the case of China illustrates, the presence of foreign direct investment often provides great benefit to the develop-ment of the local industry. Multinational corporations (MNCs) typically have enough experience and capacity to meet the re-quirements set by importing countries. In addition, they tend to provide necessary technical assistance to local producers so that their products can meet prevailing trade standards. Through these kinds of vertical technology transfer, the com-petitiveness of local industries can be greatly enhanced. Thus,
in addition to strengthening the capabilities through domestic efforts, liberalization of foreign direct investment in this sector could be pursued simultaneously.
Future challenges
Similar to manufactured goods, agri-food trade is increasingly organized within global supply chains that involve multiple players from different countries. In order to ensure success in export markets, all players along the supply chain must comply with the required standards and regulations. Awareness of food safety is especially needed at farm level. The quality of initial inputs provided by farmers will influence the quality along the supply chain. No matter how good the supply chain is, it is only as good as its weakest link (Kremer 1993). However, looking at the data used in this report, it is quite apparent that some countries (and regions) were more successful in meeting trade standards than others. Similarly, some commodity chains seem to fare better than others. Comparative studies of supply chains of a certain commodity across different countries and regions could lead to better understanding of why some countries are successful and others not. Further studies on value chains of various commodities are needed to shed light on some of the factors that are associated with better management of the sup-ply chain and better compliance with public regulations.
The rejection data analyzed here represent only the tip of an iceberg of potential non-compliance issues. This is because the import rejection data capture only instances of non-compliance with public regulations at the time of export. More rejections can potentially occur along the supply chain, including in busi-ness-to-business transactions. This brings up the importance of private standards in addition to the public regulations which have been given primary attention in this report.
In fact, the role of private standards in governing and shaping global supply chains has grown rapidly in recent years. Obtain-ing certificates to well-known practices such as HACCP and in-ternationally recognized voluntary public standards (e.g. ISO standards) are merely necessary conditions to operate in this industry. In addition to these, more and more firms are required to obtain other certificates, often related to private standards, to get or maintain access to global supply chains. Such private standards often build upon and go beyond international stand-ards and public regulations and can as well cover other issues including environmental sustainability or social responsibility. The emergence of private standards stems primarily from grow-ing consumer demand for certain product characteristics or production processes, particularly in advanced countries. This is adding a further layer of complexity to enter these export mar-kets, especially when there are numerous similar yet different private standards that are in existence and that all involve dif-ferent auditing, conformity assessment and certification proce-dures. Those firms and farms engaging in export activities need to be aware of these standards and build up enough capacity to comply with some of these private standards to ensure their success in export markets.

87
Agriculture and Livestock Industries Corporation (ALIC) (eds) (2011) Source of Vegetables for Export in China (in Japanese), Tokyo: Nourintoukei Press.
Anriquez, Gustavo and Kostas G. Stamoulis (2007) “Rural Development and Poverty Reduction: Is Agriculture Still Key?”, eJADE: Electronic Journal of Agricultural and Development Economics 4(1).
Baran, Eric, Peter Starr and Yumiko Kura (eds) (2007) Influence of Built Structures on Tonle Sap Fisheries, Phnom Penh, Viet Nam: Cambodia National Mekong Committee and the World Fish Center.
Belton, Ben and David Little (2008) “The Development of Aquaculture in Central Thailand: Domestic Demand Versus Export-Led Production”, Journal of Agrarian Change 8(1): 123–143.
Brambilla, Irene, Guido Porto and Alessandro Tarozzi (2007) “U.S. Anti-Dumping on Vietnamese Catfish: Impacts on Mekong Farm-ers”, presented at the Research Seminar in International Economics, University of Michigan, 13 April.
Bureau of Fisheries, Ministry of Agriculture (China) (various years) China Fisheries Yearbook, Beijing: China Agriculture Press.
Calvin, Linda, Dinghuan Hu, Fred Gale and Bryan Lohmar (2006) “Food Safety Improvements Underway in China”, Amber Waves, http://ideas.repec.org/a/ags/uersaw/125655.html (accessed 6 June 2013)
The Economist (2012) “Demography: China’s Achilles Heel”, The Economist, 21 April.FAO (Food and Agriculture Organization) (2012) The State of World Fisheries and Aquaculture, Rome: Food and Agriculture Organization of the United Nations.
FAO (2011): Private standards and certification in fisheries and aquaculture. Current practice and emerging issues, FAO Fisheries and Aquaculture Technical Paper No. 553, Rome: FAO.
FAO (2011) Yearbook, Fishery and Aquaculture Statistics 2009, Rome: Food and Agriculture Organization of the United Nations.
Gao, Qijie and Chuanhong Zhang (2008) “Agriculture Technology Extension System in China: Current Situation and Reform Direc-tion’, Management Science and Engineering 2(4): 47–58.
Henson, Spencer and Thomas Reardon (2005) “Private Agri-Food Standards: Implications for Food Policy and the Agri-Food System”, Food Policy 30(3): 241–253.
Hu, Ruifa, Yaqing Cai, Kevin Z. Chen and Jikun Huang (2012) “Effects of Inclusive Public Agricultural Extension Service: Results from a Policy Reform Experiment in Western China”, China Economic Review 23(4): 962–974.
Hu, Ruifa, Zhijian Yang, Peter Kelly and Jikun Huang (2009) “Agricultural Extension System Reform and Agent Time Allocation in China”, China Economic Review 20(2): 303–315.
Hu, Wei (1997) “Household Land Tenure Reform in China: Its Impact on Farming Land Use and Agro-Environment”, Land Use Policy 14(3): 175–186.
ISO and UNIDO (2008): Fast forward. National Standards Bodies in Developing Countries, Geneva: ISO.
ISO and UNIDO (2010): Building trust. The Conformity Assessment Toolbox, Geneva: ISO.
ITC (2011) The Impacts of Private Standards on Producers in Developing Countries: Literature Review Series on the Impacts of Private Standards, Geneva: International Trade Center.
7. References

88 Regional Trade Standards Compliance Report - East Asia 2013
Japan Times (2012) “Eel Eateries Dying Breed Because of Overfishing”, The Japan Times, 8 February.
Johnston, Bruce F. and John W. Mellor (1961) “The Role of Agriculture in Economic Development”, The American Economic Review 51(4): 566–593.
Khiem, Nguyen Tri, Simon R. Bush, Nguyen Minh Chau and Vo Thi Thanh Loc (2010) Upgrading Small-Holders in the Vietnamese Pangasius Value Chain (ODI Grant Number RO334), An Giang, Viet Nam: An Giang University, Wageningen University and Can Tho University.
Khiem, Nguyen Tri, Simon R. Bush, Nguyen Thi Tan Loc, Le Xuan Sinh, Nguyen Minh Chau and T.M. Hai (2008) Pro-Poor Pangasius, ODI Grant Number RO334, An Giang, Viet Nam: An Giang University.
Khoi, L.N.D., J. Wijngaard and C. Lutz (2008) Farming System Practices of Seafood Production in Viet Nam: The Case Study of Pangasi-us Small-Scale Farming in the Mekong River Delta, ASEAN Business Case Studies, No. 27, Antwerp, Belgium: University of Antwerp, Centre for International Management and Development.
Khoi, Le Nguyen Doan (2007) Description of the Pangasius Value Chain in Viet Nam, Center for ASEAN Studies Discussion Paper 56, Antwerp, Belgium: University of Antwerp.
— (2011) Quality Management in Pangasius Export Supply Chain in Viet Nam: The Case of a Small-Scale Pangasius Farming in the Mekong River Delta, Groningen, The Netherlands: University of Groningen.
Kien, Tran Nhuan and Yoon Heo (2008) “Doi Moi Policy and Socio-Economic Development in Viet Nam, 1986–2005”, International Area Studies Review 11(1): 205–232.
Kremer, Michael. 1993. “O-Ring Theory of Economic Development.” Quarterly Journal of Economics 108(3):551-575.
Krusekopf, Charles C (2002) “Diversity in Land Tenure Arrangements under the Household Responsibility System in China”, China Economic Review 13(2–3): 297–312.
Le, X.S. (2012) “Value Chain of Black Tiger in the Mekong Delta”, Magazine of the Viet Nam Association of Seafood Exporters and Producers 9(3): 68-73.
Loc, Vo Thi Thanh (2006) Seafood Supply Chain Quality Management: The Shrimp Supply Chain Quality Improvement, Perspective of Seafood Companies in the Mekong Delta, Viet Nam, Groningen, The Netherlands: University of Groningen.
Mantingh, I. and V.H. Nguyen (2008) “Pre-Assessment of Pangasius Sector: Toward Sustainability”, report commissioned by the Dutch Ministry of Agriculture, Nature, and Food Quality.
MHLW (Ministry of Health, Labour and Welfare) (2008) “Guidelines on Hygiene Control of Import Processed Foods”, MHLW (Japan), www.mhlw.go.jp/english/topics/importedfoods/guideline/01.html
— (2012) “Development of Imported Foods Monitoring and Guidance Plan for Fy2012”, MHLW (Japan), www.mhlw.go.jp/topics/yunyu/keikaku/12_en.html
Michida, Etsuyo and Kaoru Nabeshima (2012) Role of Supply Chains in Adopting Product Related Environmental Regulations: Case Studies of Viet Nam, IDE Discussion Paper 343, Chiba, Japan: Institute of Developing Economies.
Ministry of Agriculture (China) (2009. 60 Years Statistics of Agriculture in New China (in Chinese), Beijing: China Agriculture Press.
— (various years) China Agricultural Statistical Report, Beijing: China Agriculture Press.
Mori, Romio (2009) “Chinese Food Safety Policy and Management System and Its Challenges (in Japanese)”, in Ikegami, Akihide and Hoken, Hisatoshi (eds), Chinese Agrarian Reform and Agriculture Industrialization, Chiba, Japan: Institute of Developing Economies.
Mori, Romio, Kaoru Nabeshima and Nanae Yamada (2013) Food Safety Control System of Chinese Eel Export and Its Challenges, IDE Discussion Paper 418, Chiba, Japan: Institute of Developing Economies.
National Statistical Bureau of China (various years) China Statistical Yearbook, Beijing, China: China Statistics Press.
Nguyen, V.H. (2007) “River Catfish Farming Technology Development in the Mekong Delta, Viet Nam”, paper presented at the the Catfish Conference, Ho Chi Minh City, Viet Nam, 13 June.

89
Oshima, Kazutsugu (ed.) (2007)Chinese Vegetables and Japanese Agricultural Market (in Japanese), Tokyo: Ashishobo Press.
Phillips, Michael (2002) Fresh Water Aquaculture in Lower Mekong Basin, MRC Technical Paper 7, Phnom Penh, Viet Nam: Mekong River Commission.
Richter, Kaspar (2006) Thailand’s Growth Path: From Recovery to Prosperity, World Bank Policy Research Working Paper 3912, Wash-ington, DC: World Bank.
Sakazume, Hiroshi, Hong Park and Akihiko Sakashita (eds) (2006) Export Strategy by Chinese Vegetable Enterprises: Impacts of the Residual Pesticide Problems and the Overcoming Process (in Japanese). Tokyo: Tsukuba Press.
Sinh, Le Xuan and Le Le Hien (2010. “Supply and Use of the Seed Pangasius Hypophthalmus in Mekong Delta, Viet Nam”, Aquacul-ture Asia Magazine 15(1): 26–33.
Taya, Katsuo (ed.) (2003) Asia No Ebi Youshoku to Boueki (Shrimp Aquaculture and Trade in Asia) (in Japanese), Tokyo: Seizando Shoten.
Tung, Nguyen Thanh, Nguyen Van Thanh and Michael Phillips (2004) Policy Research – Implications of Liberalization of Fish Trade for Developing Countries – A Case Study of Viet Nam (Project Pr 26109), London: University of Greenwich, Natural Resources Institute.
UNIDO (United Nations Industrial Development Organization) (2010) Meeting Standards, Winning Markets. Trade Standards Compli-ance Report 2010, Vienna: UNIDO.
UNIDO (2010): Making Private Standards Work for You. A guide to private standards in the garments, footwear and furniture sectors, Vienna: UNIDO.
VASEP (Viet Nam Association of Seafood Exporters and Producers) (2009) Statistics of Viet Nam Seafood Export within 10 Years 1998–2008, Ho Chi Minh City, Viet Nam: VASEP.
— (2010) Vasep News No. 5, Ho Chi Minh City, Viet Nam: VASEP.
— (2011) Report on Viet Nam Seafood Export Qiv-2011, Ho Chi Minh City, Viet Nam: VASEP.
— (2012a) Report on Viet Nam Seafood Export Qi-2012, Ho Chi Minh City, Viet Nam: VASEP.
— (2012b) Vasep News No. 7, Ho Chi Minh City: Viet Nam Association of Seafood Exporters and Producers (VASEP).
— (2012c) Vasep News No. 13, Ho Chi Minh City, Viet Nam: VASEP.
Wang, Honglin, Xiaoxia Dong, Scott Rozelle, Jikun Huang and Thomas Reardon (2009) “Producing and Procuring Horticultural Crops with Chinese Characteristics: The Case of Northern China”, World Development 37(11): 1791–1801.
Wang, Hui, Juer Tong, Fubing Su, Guoxue Wei and Ran Tao (2011) “To Reallocate or Not: Reconsidering the Dilemma in China’s Agri-cultural Land Tenure Policy”, Land Use Policy 28(4): 805–814.
World Bank (1997) Old Age Security: Pension Reform in China, Washington, DC: World Bank.
— (2008) World Development Report 2008: Agriculture for Development, Washington, DC: World Bank.
World Bank and DRC (2012) China 2030: Building a Modern, Harmonious, and Creative High-Income Society. Washington, DC: World Bank and the Development Research Center of the State Council, the People’s Republic of China.
WTO (2005): World Trade Report 2005. Exploring the links between trade, standards and the WTO, Geneva: WTO.
Yamada, Nanae and Shuyan Sui (2013) Response of Local Producers to Agro-Food Port Rejection: The Case of Chinese Vegetable Exports, IDE Discussion Paper 390, Chiba, Japan: Institute of Developing Economies,.
Young, J.A. and N.P. Son (2002) Market Study of Cultured Pangasius from the Mekong Delta, Viet Nam, Can Tho, Viet Nam: Stirling University and Can Tho University.

90 Regional Trade Standards Compliance Report - East Asia 2013

91
8. Annexes
Annex AContextualizing trade-related standards
The increasing importance of standards in international trade
The latest wave of globalization has been characterized by a remarkable process of market liberalization. With the comple-tion of numerous rounds of multilateral, regional and bilateral trade negotiations, the world economy has seen a significant overall decline in tariff levels during the past couple of decades. However, despite the overall reduction in tariff levels, many de-veloping countries have not been able to substantially increase their participation in global trade. Potential gains from tariff re-ductions have not been realized and in some cases even eroded due to an increased use of non-tariff barriers to trade. Among such non-tariff barriers one typically finds technical regula-tions and (public) standards. In addition, in recent years private standards have gained in importance and grown in number and are increasingly affecting and shaping international trade flows.
It has to be emphasized that technical standards for products and also for (production) processes are not new; they have been in existence for well over 100 years. Long before globalized trade took off, countries developed technical standards to guarantee consumer safety, increase transparency in markets, facilitate product compatibility, and ensure that products met consumer needs. In many cases, the compliance requirements placed on exporters are, in fact, simply the same as the require-ments placed on domestic producers. However, in the recent past, standards have been applied in international trade with growing intensity. On the one hand, this trend towards stand-ardization and application of standards is driven by legitimate motives including consumers becoming more demanding as regards the safety and quality of products, managerial and tech-nological innovations (e.g. in production processes and product design), as well as increased awareness and concern for social, environmental and resource-sustainability issues among many governments, consumers and civil society organizations (CSOs). On the other hand, however, standards can hamper trade and, indeed, act as disguised protection measures. In a world of low tariff levels and far-reaching multilateral trade disciplines under the WTO, the ability of governments to arbitrarily impose or in-crease tariffs or quantitative restrictions on trade is limited so that they are sometimes tempted to resort to other means to restrict imports, including through the application of standards that have discriminatory consequences for trade partners (WTO 2005).
Trade-related standards and compliance challenges
Throughout this report, reference is made to “trade standards”. Indeed, even the title of this publication makes reference to “trade standards”. It is therefore pertinent to briefly explain what is meant by “trade standards”.
The term “trade standards”, the way it is used here, corre-sponds to a meta-concept that encompasses different sub-cat-egories. Broadly speaking, in the present report the term “trade standards” refers to all technical regulations, requirements and standards (and all measures based on them) related to quality and safety aspects of products which are used and applied in cross-border commercial transactions and which, thus, affect and shape international trade flows. That is, the term “trade standards” when used in this report can refer to technical regu-lations, to voluntary (public) standards and, in some occasions, also to (voluntary) private standards. The first two types are also known to and defined in the WTO Agreements on Technical Barriers to Trade (TBT) and on Sanitary and Phytosanitary (SPS) Measures – with the latter agreement being of relevance here because the focus of the analyses undertaken in this report is on the agri-food sector and on food safety and human health issues.
Let us briefly recall the definitions of these different concepts and terms. According to Annex 1 of the WTO Agreement on Tech-nical Barriers to Trade (TBT), a technical regulation is a “[d]ocu-ment which lays down product characteristics or their related processes and production methods (…) with which compliance is mandatory. It may also include or deal exclusively with termi-nology, symbols, packaging, marking or labelling requirements as they apply to a product, process or production method.” Technical regulations are, hence, based on standards with which compliance is compulsory and legally binding. A stand-ard, by contrast, is defined by the WTO TBT Agreement to be a “[d]ocument approved by a recognized body that provides, for common and repeated use, rules, guidelines or characteristics for products or related processes and production methods, with which compliance is not mandatory” (emphasis added). In other words, the WTO TBT agreement covers both product stand-ards and process standards and distinguishes between stand-ards with which compliance is voluntary and those with which compliance is mandatory (with the latter being called “technical regulations”). To again quote directly from the TBT Agreement:

92 Regional Trade Standards Compliance Report - East Asia 2013
“For the purpose of this Agreement standards are defined as voluntary and technical regulations as mandatory documents.”1
In addition, international trade flows (not least in agri-food products) have also become increasingly affected by private standards. Private standard schemes are voluntary standards developed and applied by non-public entities (primarily private companies and company consortia but also CSOs and NGOs). Typically, private standards are required by global brand pro-ducers and retailers when they source their products from sup-pliers, be they domestic or foreign firms. They are today a key mechanism for lead firms wishing to translate requirements – both product and process specifications – to other parts of the supply chain. They can also serve as mechanisms for safety and quality assurance and facilitate traceability, transparency of production processes, and standardization but also differentia-tion of products. Broadly speaking, the concrete function that a certain standard is to fulfill depends on whether it is part of a business-to-business (B2B) arrangement or a business-to-con-sumer (B2C) model. In any case, providing a concise definition of “private standards” is a complicated task given that there exists a multitude of norms, guidelines, codes and initiatives with different types of communication and verification mecha-nisms that are collectively considered as private standards. In fact, most private standards are not “standards” in the strict-est sense of the term. Still, one can distinguish between several types of private standards and roughly divide them into buyer codes of conduct, certificates, and product labels. Yet, even within these various types of standard, there are wide differenc-es with regard to the application and governance required, their substantive focus, level of stringency, and auditing processes. In recent years, their use has become more important and more widespread and they are covering a growing spectrum of issues, ranging from food safety and environmental sustainability to la-bor conditions and social sustainability. In many cases, such private standards include norms that go beyond national and local laws and even international (public) standards and/or contain further conditions. Often, such private standards are related to certification schemes which serve to signal compli-ance to consumers (see UNIDO 2010, FAO 2011). Given their pri-vate nature, compliance is not assessed by public entities and non-compliance does not entail sanctions by public authorities. Still, non-compliance can impede (or lead to disruptions of) international trade flows if global brand producers or retailers refuse to import and accept supply from producers that are un-able to meet and/or get certified to the private standards they apply. This implies that although by definition private standards are voluntary, in practice they may become de facto mandatory wherever compliance is required for entry into certain markets.
The concept of “trade standards” used here comprises all these different types of standards described above. However, the dif-ferent analyses undertaken in the various chapters of this re-port do not always refer to all the three types to the same ex-tent. The first two chapters of this report, for example, analyze
1 See the full text of the TBT Agreement on www.wto.org/english/docs_e/legal_e/17-tbt_e.htm. For further information on standard-ization and conformity assessment, see also ISO and UNIDO (2008, 2010), for example.
import rejections which are instances where non-compliance with mandatory public standards (i.e. technical regulations) gets sanctioned by public authorities in the importing country through the refusal of market entry for the shipment concerned. The other chapters of this report, on the other hand, make refer-ence to the whole set of standards (from technical regulations and voluntary public standards to private standards) and their relevance for cross-border commercial transactions.
The multilateral trading system and trade-related stand-ards
The recognition that standards shape, and indeed can restrict, international trade flows is reflected in the fact that there are related agreements under the WTO – that is, precisely the agree-ments on TBTs and SPS measures mentioned above (which, however, do not cover private standards). Over the past dec-ades, and particularly under the leadership of the WTO since 1995, the global trading system has increasingly become codified and rule-based. Essentially, the WTO lays down legal ground rules and disciplines for international trade (in both goods and services) and for trade-related aspects of intellec-tual property rights. These rules are contained in multilateral trade agreements which basically constitute contracts that bind governments to operate their trade policies in accordance with what was agreed in the multilateral negotiations.
The WTO Agreements on TBTs and SPS measures have contrib-uted to specify this rule-based global trading system. They pro-vide an overall framework on technical regulations and stand-ards and set disciplines on their application in a trade-related context. The TBT Agreement, for example, lays down how tech-nical regulations, standards, and conformity assessment (e.g. sampling, inspection, testing and certification) procedures should be designed and used so that they do not constitute un-necessary obstacles to trade. It permits technical requirements that are established for legitimate purposes such as consumer or environmental protection but prohibits technical require-ments created with the intention to limit international trade. With reference to the WTO’s “national treatment” rule, the TBT Agreement also aims at banning discriminatory features from countries’ technical regulations. Against this backdrop, WTO member states are recommended to adopt international stand-ards (for example, those developed by ISO) as their technical requirements where they exist and whenever possible. At the same time, the TBT agreement also encourages countries to recognize the results of other countries’ conformity assessment procedures (for example, tests that determine whether or not a certain product is in compliance with a given standard).2
Meanwhile, the WTO Agreement on Sanitary and Phytosanitary Measures (the “SPS Agreement”) focuses more narrowly on the application of regulations and policies relating to food safety as well as animal and plant health (phytosanitation) with respect
2 See www.wto.org/english/docs_e/legal_e/17-tbt_e.htm.

93
to the spread of pests or diseases.3 That is, the SPS Agreement covers all measures whose purpose is to protect (1) human or animal health from food-borne risks (arising, for example, from additives, contaminants, toxins, or disease-causing organisms in foodstuffs), (2) human health from animal- or plant-carried diseases, and (3) animals and plants from pests, diseases or disease-causing organisms. By their very nature, such SPS measures may result in impediments to trade. While the SPS Agreement permits governments to maintain appropriate sani-tary and phytosanitary protection and accepts the fact that some trade restrictions may be necessary to ensure food safety and animal and plant health, it restricts the use of unjustified sanitary and phytosanitary measures for the purpose of trade protection. More precisely, in order to reduce possible arbitrari-ness of decisions, the Agreement requires any SPS measure to be based on scientific principles and assessment, to not unjus-tifiably discriminate among foreign sources of supply, and to be applied only to the extent necessary to protect human, animal or plant life or health and for no other purpose than that of en-suring food safety and animal and plant health. In this context, the SPS Agreement encourages governments to “harmonize” or base their national SPS measures on the international stand-ards, guidelines and recommendations developed by other in-ternational organizations, including the joint FAO/WHO Codex Alimentarius Commission (for food safety), the World Organiza-tion for Animal Health (OIE), and the Secretariat of the Interna-tional Plant Protection Convention (IPPC). In summary, the aim of the SPS Agreement is to maintain the sovereign right of any government to provide the level of health protection it deems appropriate while ensuring that these sovereign rights are not misused for protectionist purposes and do not result in unnec-essary barriers to international trade.4
It is against the background of this increasingly rule-based glob-al trading system that the present report analyzes the role and impact of “trade standards” in East Asian agri-food exports and value chains. While these international trade rules and disci-plines, as enshrined in the WTO agreements, lay the foundation for equitable treatment for all, they require the capacity to both comply with and provide proof of compliance with the resulting trade-related standards. We have been particularly interested in the study of challenges that developing countries in East Asia face in complying with such trade standards, as well as in the analysis of root causes and consequences of non-compliance. This analysis has been based on different methodological ap-proaches and included research on issues such as food safety, traceability and labeling.
3 That is, the TBT and SPS agreements have complementary scopes: The TBT Agreement covers all technical regulations, voluntary stan-dards and conformity assessment procedures except those that are SPS measures and, thus, covered by the SPS Agreement.4 See www.wto.org/english/tratop_e/sps_e/spsund_e.htm.

94 Regional Trade Standards Compliance Report - East Asia 2013
Annex BOverview of Agricultural and Food Exports from East Asia
The value of agricultural and food exports has been increas-ing in Asia over the last decade. China is the largest exporter of both agricultural and food products in Asia. In 2010, the export of agriculture products from China reached US$32 billion and US$20 billion for food products. The second largest agriculture exporters in the region are Indonesia and Malaysia with exports totalling about US$20 billion. On the other hand, the export of food products from these two countries is around one-fourth of that of China.
For East Asian countries, the internal East Asian market (exclud-ing Japan) is the most important exporting market, accounting for 50 per cent or more for some countries. The exceptions are Republic of Korea, the Philippines and Cambodia. Japan is the most important market for Republic of Korea in agricultural and food products, absorbing more than one third of Republic of Ko-rea’s exports in this sector. The major destinations of exports from the Philippines and Cambodia are the EU 27, the United States and EAP. Particularly interesting is the case of Cambo-dia. For agricultural goods, East Asia (excluding Japan) was the major destination in 2000 and little was exported to other coun-tries and regions. By 2005, the export market was diversified and the share of EAP was reduced to about half while that of the United States increased dramatically. In 2010, the EU became the largest export market for Cambodia in agricultural goods, followed by exports to East Asia and South Asia. For food ex-ports, again, Cambodia diversified away from almost complete reliance on East Asia to the EU, United States and East Asian markets by 2010.
For many East Asian countries, Japan is a significant market for both agricultural and food product exports, except for Cambo-dia, Indonesia and Malaysia. However, the significance of the Japanese market has been diminishing over the years and East Asian countries are exporting more to United States and EU markets. In addition, Cambodia, Indonesia and Malaysia export significant amounts to South Asia. Thailand is the only country in East Asia to have significant exporting activities to markets in sub-Saharan African countries.
Singapore, Republic of Korea and Thailand show stronger com-parative advantage in exporting processed food than in agricul-ture products and therefore export more of these products than agricultural products. These countries are successful in creat-ing value added to raw materials. For other countries, there are more agriculture product exports than food product exports.
The exported products vary among exporting countries. While exports of aquatic products such as fish and shrimp are greater in China, Thailand, Republic of Korea and Viet Nam, palm oil and cocoa are the major exported products in Indonesia and Malaysia. Rice is another important export product especially in Thailand, Viet Nam and Cambodia.
From Annex C to Annex L, some basic information on each coun-try in East Asia is listed. Brunei Darussalam is not included be-cause it has very few export activities in agricultural and food commodities. Lao People’s Democratic Republic is not included because of a lack of data.

95
Annex CCambodia
Annex Figure C.1: Trends in agricultural and food exports (Cambodia)
0
10
20
30
40
60
50
2000 2002 2004 2006 2008 2010
mill
ion
US$ Agriculture
Food
Source: UN Comtrade
Annex Table C.1: Destinations for and respective share of agricultural exports (%) from Cambodia
Rank 2000 2005 2010
1 EAP (92.0%) EAP (49.0%) EU27 (54.5%)
2 US (1.6%) US (42.5%) EAP (20.4%)
3 SSA (0.9%) EU27 (4.5%) SAR (11.1%)
4 AUS (0.9%) AUS (0.5%) US (2.4%)
5 JPN (0.8%) SAR (0.2%) AUS (1.9%)
Note: Data for 2010 were the most recent when the table was created. EAP includes ASEAN10 countries, China, Hong Kong (China) and Republic of Korea. EU27 includes all EU member countries. LAC includes Latin American and Caribbean countries. SSA includes sub-Saharan African countries. SAR includes South Asian countries. LAC, SSA, and SAR classifications follow those of the World Bank.
Source: UN Comtrade database
Annex Table C.2: Destinations for and respective share of food exports (%) from Cambodia
Rank 2000 2005 2010
1 EAP (91.4%) EAP (96.9) EU27 (49.2%)
2 US (4.3%) EU27 (2.7%) EAP (25.7%)
3 JPN (2.5%) AUS (0.2%) US (23.9%)
4 EU27 (1.6%) US (0.2%) SAR (0.7%)
5 AUS (0.1%) JPN (0.4%)
Note: EAP includes ASEAN10 countries, China, Hong Kong (China) and Republic of Korea. EU27 includes all EU member countries. LAC includes Latin American and Caribbean countries. SSA includes sub-Saharan African countries. SAR includes South Asian countries. LAC, SSA, and SAR classifica-tions follow those of the World Bank.
Source: UN Comtrade database

96 Regional Trade Standards Compliance Report - East Asia 2013
Annex Table C.3: Top 5 agriculture export products in 2010 (Cambodia)
HS Code Name Value (million US$)
1006 Rice 35
1511 Palm oil and its fractions 9
1005 Maize (corn) 3
1108 Starches and inulin 2
1201 Soya beans 1
Source: UN Comtrade
Annex Table C.4: Top 5 food export products in 2010 (Cambodia)
HS Code Name Value (US$ million)
2207 Ethyl alcohol, undenatured of >=80% alcohol, denatured 9
2309 Preparations of a kind used in animal feed 6
1701 Cane or beet sugar and chemically pure sucrose, solid form 5
2202Waters, including mineral waters and aerated waters, containing added sugar
or other sweetening matter or flavoured, and other non-alcoholic beverages, not including fruit or vegetable juices
4
1703 Molasses resulting from the extraction or refining of sugar 1
Source: UN Comtrade database
Annex Table C.5: Trends in Japanese rejections of food product groups imported from Cambodia, 2006–2010 (no. of rejections)
2006 2007 2008 2009 2010
Herbs and spices 1 0 0 0 0
Source: Calculated by authors using data from the MHLW
Annex Table C.6: Trends in reasons for Japanese import rejections of Cambodian products, 2006–2010 (no. of cases)
2006 2007 2008 2009 2010
Mycotoxins 1 0 0 0 0
Source: Calculated by authors using data from the MHLW

97
Annex DChina (including Hong Kong)
Annex Figure D.1: Trends in agricultural and food exports (China and Hong Kong)
0
5,000
10,000
15,000
20,000
30,000
35,000
25,000
2000 2002 2004 2006 2008 2010
mill
ion
US$ Agriculture
Food
Source: UN Comtrade database
Annex Table D.1: Destinations for and respective share of agricultural exports from China and Hong Kong
Rank 2000 2005 2010
1 EAP (44.0%) EAP (35.3%) EAP (40.4%)
2 JPN (26.1%) JPN (21.1%) EU27 (14.0%)
3 EU27 (9.8%) EU27 (13.1%) JPN (12.4%)
4 US (6.7%) US (10.1%) US (9.7%)
5 SSA (2.2%) LAC (1.6%) LAC (3.0%)
Note: EAP includes ASEAN10 countries, China, Hong Kong (China) and Republic of Korea. EU27 includes all EU member countries. LAC includes Latin American and Caribbean countries. SSA includes sub-Saharan African countries. SAR includes South Asian countries. LAC, SSA, and SAR classifica-tions follow those of the World Bank.
Source: UN Comtrade
Annex Table D.2: Destinations for and respective share of food exports (%) from China and Hong Kong
Rank 2000 2005 2010
1 JPN (39.8%) JPN (37.7%) EAP (27.5%)
2 EAP (30.0%) EAP (25.1%) JPN (25.2%)
3 US (9.6%) US (11.1%) US (14.2%)
4 EU27 (8.9%) EU27 (9.8%) EU27 (9.4%)
5 SAR (1.0%) LAC (1.6%) LAC (2.7%)
Note: EAP includes ASEAN10 countries, China, Hong Kong (China) and Republic of Korea. EU27 includes all EU member countries. LAC includes Latin American and Caribbean countries. SSA includes sub-Saharan African countries. SAR includes South Asian countries. LAC, SSA, and SAR classifica-tions follow those of the World Bank.
Source: UN Comtrade database

98 Regional Trade Standards Compliance Report - East Asia 2013
Annex Table D.4: Top 5 food export products in 2010 (China and Hong Kong)
HS Code Name Value (US$ million)
1605 Crustaceans, molluscs and other aquatic invertebrates, prepared or preserved 2,393
1604 Prepared or preserved fish; caviar and caviar substitutes 2,055
2008Fruit, nuts and other edible parts of plants, otherwise prepared or preserved,
whether or not containing added sugar or other sweetening matter or spirit, not elsewhere specified or included
1,921
1602Prepared or preserved meat, meat offal and blood not elsewhere specified or
included1,423
2309 Preparations of a kind used in animal feeding 1,248
Source: UN Comtrade
Annex Table D.5: Trends in Japanese rejections of food product groups imported from China, 2006–2010 (no. of rejections)
2006 2007 2008 2009 2010
Beverages 20 19 6 8 7
Cereals and bakery products
24 44 12 7 7
Confectionery and sugar 9 0 1 0 0
Dairy products 9 9 3 1 3
Fish and fishery products 170 145 76 73 96
Food additives 4 2 0 1 7
Fruits and vegetables and products
137 131 55 104 63
Herbs and spices 19 15 7 3 7
Meat and meat products 30 20 36 39 33
Non-food products 26 18 34 111 99
Nuts, nuts products and seeds
44 38 23 21 20
Other processed foods 8 7 5 13 4
Other products of animal origin
0 0 1 0 0
Source: Calculated by authors using MHLW data
Annex Table D.3: Top 5 agriculture export products in 2010 (China and Hong Kong)
HS Code Name Value (US$ million)
0304 Fish fillets and other fish, fresh, chilled or frozen 3,701
0703 Onions, shallots, garlic, leeks, etc., fresh or chilled 2,613
0712 Vegetables, dried, whole, cut etc., no added preparation 1,896
0307 Molluscs and aquatic invertebrates not elsewhere specified or included, live etc 1,658
0303 Fish, frozen (no fish fillets or other fish meat) 1,479
Source: UN Comtrade

99
Annex Table D.6: Trends in reasons for Japanese rejections of Chinese products, 2006–2010 (no. of cases)
2006 2007 2008 2009 2010
Food additives 117 50 17 32 32
Adulteration/missing document
1 24 4 1 4
Bacterial contamination 122 100 57 66 92
Heavy metal 0 0 0 2 1
Hygienic condition/controls
3 14 23 7 1
Mycotoxins 45 25 18 14 15
Other contaminants 6 3 17 6 4
Others 35 49 49 122 105
Others microbiological 0 0 0 1 0
Packaging 0 0 2 0 0
Pesticide residues 119 125 24 71 47
Veterinary drugs residues 52 58 48 59 45
Source: Calculated by authors using MHLW data
Annex Table D.7: Trends in Japanese rejections of food product groups imported from Hong Kong, 2006–2010 (no. of rejections)
2006 2007 2008 2009 2010
Beverages 0 2 0 0 0
Confectionery and sugar 0 0 0 0 1
Fish and fishery products 0 1 1 1 2
Fruits and vegetables 1 2 0 1 0
Herbs and spices 0 1 1 0 0
Nuts, nuts products and seeds
1 0 0 0 0
Source: Calculated by authors using MHLW data
Annex Table D.8: Trends in reasons for Japanese import rejections of products from Hong Kong, 2006–2010 (no. of cases)
2006 2007 2008 2009 2010
Food additives 2 4 1 0 0
Bacterial contamination 0 0 0 1 0
Other contaminants 0 0 1 0 3
Others 0 0 0 1 0
Pesticide residues 0 2 0 0 0
Source: Calculated by authors using MHLW data

100 Regional Trade Standards Compliance Report - East Asia 2013
Annex EIndonesia
Annex Figure E.1: Trends in agricultural and food exports (Indonesia)
0
5,000
10,000
15,000
20,000
25,000
2000 2002 2004 2006 2008 2010
mill
ion
US$ Agriculture
Food
Source: UN Comtrade database
Annex Table E.1: Destinations for and respective share of agricultural exports from Indonesia
Rank 2000 2005 2010
1 EAP (22.7%) EAP (25.6%) EAP (32.8%)
2 EU27 (21.0%) SAR (21.9%) SAR (26.2%)
3 JPN (19.1%) EU27 (19.6%) EU27 (16.2%)
4 SAR (14.1%) US (9.4%) US (5.2%)
5 US (12.0%) JPN (8.0%) JPN (3.6%)
Note: EAP includes ASEAN10 countries, China, Hong Kong (China) and Republic of Korea. EU27 includes all EU member countries. LAC includes Latin American and Caribbean countries. SSA includes sub-Saharan African countries. SAR includes South Asian countries. LAC, SSA, and SAR classifica-tions follow those of the World Bank.
Source: UN Comtrade database
Annex Table E.2: Destinations for and respective share of food exports (%) from Indonesia
Rank 2000 2005 2010
1 EAP (31.2%) EAP (35.1%) EAP (43.9%)
2 US (27.1%) US (25.9%) US (18.9%)
3 EU27 (17.9%) EU27 (17.6%) EU27 (12.0%)
4 JPN (8.0%) JPN (5.4%) JPN (4.7%)
5 LAC (3.0%) LAC (2.8%) LAC (3.3%)
Note: EAP includes ASEAN10 countries, China, Hong Kong (China) and Republic of Korea. EU27 includes all EU member countries. LAC includes Latin American and Caribbean countries. SSA includes sub-Saharan African countries. SAR includes South Asian countries. LAC, SSA, and SAR classifica-tions follow those of the World Bank.
Source: UN Comtrade database
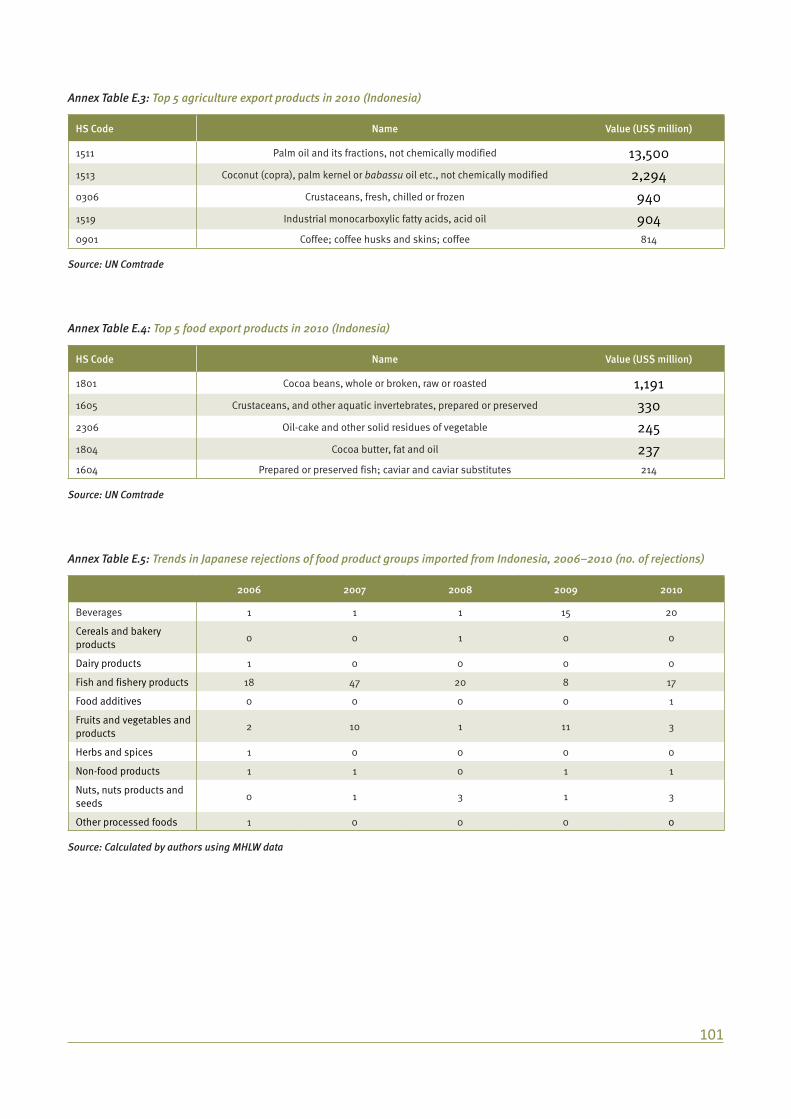
101
Annex Table E.3: Top 5 agriculture export products in 2010 (Indonesia)
HS Code Name Value (US$ million)
1511 Palm oil and its fractions, not chemically modified 13,500 1513 Coconut (copra), palm kernel or babassu oil etc., not chemically modified 2,294 0306 Crustaceans, fresh, chilled or frozen 940 1519 Industrial monocarboxylic fatty acids, acid oil 904 0901 Coffee; coffee husks and skins; coffee 814
Source: UN Comtrade
Annex Table E.4: Top 5 food export products in 2010 (Indonesia)
HS Code Name Value (US$ million)
1801 Cocoa beans, whole or broken, raw or roasted 1,191 1605 Crustaceans, and other aquatic invertebrates, prepared or preserved 330 2306 Oil-cake and other solid residues of vegetable 245 1804 Cocoa butter, fat and oil 237 1604 Prepared or preserved fish; caviar and caviar substitutes 214
Source: UN Comtrade
Annex Table E.5: Trends in Japanese rejections of food product groups imported from Indonesia, 2006–2010 (no. of rejections)
2006 2007 2008 2009 2010
Beverages 1 1 1 15 20
Cereals and bakery products
0 0 1 0 0
Dairy products 1 0 0 0 0
Fish and fishery products 18 47 20 8 17
Food additives 0 0 0 0 1
Fruits and vegetables and products
2 10 1 11 3
Herbs and spices 1 0 0 0 0
Non-food products 1 1 0 1 1
Nuts, nuts products and seeds
0 1 3 1 3
Other processed foods 1 0 0 0 0
Source: Calculated by authors using MHLW data

102 Regional Trade Standards Compliance Report - East Asia 2013
Annex Table E.6: Trends in reasons for Japanese import rejections of products from Indonesia, 2006–2010 (no. of cases)
2006 2007 2008 2009 2010
Food additives 1 3 0 3 0
Bacterial contamination 5 12 9 7 16
Hygienic condition/controls
0 1 0 13 16
Mycotoxins 1 1 3 1 3
Other contaminants 3 4 1 0 1
Others 1 2 0 1 3
Pesticide residues 0 2 1 9 6
Veterinary drugs residues 14 35 12 2 0
Source: Calculated by authors using MHLW data

103
Annex FMalaysia
Annex Figure F.1: Trends in agricultural and food exports (Malaysia)
0
5,000
10,000
15,000
20,000
25,000
2000 2002 2004 2006 2008 2010
mill
ion
US$ Agriculture
Food
Source: UN Comtrade database
Annex Table F.1: Destinations for and respective share of agricultural exports from Malaysia
Rank 2000 2005 2010
1 EAP (32.2%) EAP (34.0%) EAP (31.5%)
2 SAR (21.7%) EU27 (1530%) SAR (16.3%)
3 EU27 (12.7%) SAR (11.8%) EU27 (10.6%)
4 JPN (6.5%) US (8.2%) US (7.4%)
5 US (6.4%) JPN (4.9%) SSA (5.4%)
Note: EAP includes ASEAN10 countries, China, Hong Kong (China) and Republic of Korea. EU27 includes all EU member countries. LAC includes Latin American and Caribbean countries. SSA includes sub-Saharan African countries. SAR includes South Asian countries. LAC, SSA, and SAR classifica-tions follow those of the World Bank.
Source: UN Comtrade database
Annex Table F.2: Destinations for and respective share of food exports (%) from Malaysia
Rank 2000 2005 2010
1 EAP (56.4%) EAP (51.9%) EAP (51.6%)
2 EU27 (14.8%) EU27 (15.2%) US (9.0%)
3 US (7.0%) US (8.5%) EU27 (6.6%)
4 AUS (3.9%) JPN (4.8%) JPN (5.4%)
5 JPN (3.3%) AUS (4.0%) SSA (3.9%)
Note: EAP includes ASEAN10 countries, China, Hong Kong (China) and Republic of Korea. EU27 includes all EU member countries. LAC includes Latin American and Caribbean countries. SSA includes sub-Saharan African countries. SAR includes South Asian countries. LAC, SSA, and SAR classifica-tions follow those of the World Bank.
Source: UN Comtrade database

104 Regional Trade Standards Compliance Report - East Asia 2013
Annex Table F.3: Top 5 agriculture export products in 2010 (Malaysia)
HS Code Name Value (US$ million)
1511 Palm oil and its fractions, not chemically modified 12,400
1516 Animal or vegetable fats and oils and hydrogen etc., not further prepared 2,193
1519 Industrial monocarboxylic fatty acids, acid oil, refined, industrial fat alcohol 1,613
1513 Coconut (copra), palm kernel or babassu oil etc., not chemically modified 974
0306 Crustaceans, fresh, chilled or frozen 427
Source: UN Comtrade
Annex Table F.4: Top 5 food export products in 2010 (Malaysia)
HS Code Name Value (US$ million)
1804 Cocoa butter, fat and oil 615
1901 Malt extract; food preparations of flour, etc. 388
1905Bread, pastry, cakes, biscuits and other bakers’ wares, whether or not containing cocoa; communion wafers, empty sachets of a kind suitable for pharmaceutical
use, sealing wafers, rice paper and similar products350
1805 Cocoa powder, not sweetened 340
2106 Food preparations, not elsewhere specified or included 246
Source: UN Comtrade
Annex Table F.5: Trends in Japanese import rejections of food product groups imported from Malaysia, 2006–2010 (no. of rejections)
2006 2007 2008 2009 2010
Cereals and bakery products
2 0 0 1 2
Confectionery and sugar 1 1 1 1 3
Fish and fishery products 1 1 0 2 0
Fruits and vegetables and products
0 2 0 0 0
Non-food products 0 0 3 2 0
Other processed foods 1 0 1 0 0
Source: Calculated by authors using MHLW data
Annex Table F.6: Trends in reasons for Japanese import rejections of Malaysian products, 2006–2010 (no. of cases)
2006 2007 2008 2009 2010
Food additives 2 0 2 1 4
Bacterial contamination 3 1 0 2 1
Mycotoxins 0 1 0 0 0
Other contaminants 0 2 0 0 0
Veterinary drugs residues 0 0 0 1 0
Source: Calculated by authors using MHLW data

105
Annex GMyanmar
Annex Table G.1: Destinations for and respective share of agricultural exports from Myanmar
Rank Agriculture in 2010 Food in 2010
1 SAR (43.0%) SAR (71.6%)
2 EAP (36.1%) EAP (19.7%)
3 SSA (6.8%) JPN (8.6%)
4 JPN (3.5%)
5 EU27 (1.4%)
Note: EAP includes ASEAN10 countries, China, Hong Kong (China) and Republic of Korea. EU27 includes all EU member countries. LAC includes Latin American and Caribbean countries. SSA includes sub-Saharan African countries. SAR includes South Asian countries. LAC, SSA, and SAR classifica-tions follow those of the World Bank.
Source: UN Comtrade
Annex Table G.2: Top 5 agriculture export products in 2010 (Myanmar)
HS Code Name Value (US$ million)
0713 Dried leguminous vegetables, shelled 890
0302 Fish, fresh or chilled (excl. those of fillets or other meat) 204
1006 Rice 156
0306 Crustaceans, fresh, chilled or frozen and cooked etc. 80
1207 Other oil seeds and oleaginous fruits 69
Source: UN Comtrade database
Annex Table G.3: Top 5 food export products in 2010 (Myanmar)
HS Code Name Value (US$ million)
1701 Cane or beet sugar and chemically pure sucrose, solid form 9
2106 Food preparations not elsewhere specified or included 1
2203 Beer made from malt 0.7
1905Bread, pastry, cakes, biscuits and other bakers’ wares, whether or not containing cocoa; communion wafers, empty sachets of a kind suitable for pharmaceutical
use, sealing wafers, rice paper and similar products0.2
2202Waters, including mineral waters and aerated waters, containing added sugar
or other sweetening matter or flavoured, and other non-alcoholic beverages, not including fruit or vegetable juices
0.005
Source: UN Comtrade database

106 Regional Trade Standards Compliance Report - East Asia 2013
Annex Table G.5: Trends in Japanese import rejections of food product groups imported from Myanmar, 2006–2010 (no. of rejections)
2006 2007 2008 2009 2010
Beverages 0 0 1 0 0
Fish and fishery products 1 0 0 0 0
Fruits and vegetables and products
0 1 2 0 0
Herbs and spices 0 0 1 3 0
Nuts, nuts products and seeds
0 0 0 3 5
Source: Calculated by authors using MHLW data
Annex Table G.6: Trends in reasons for Japanese import rejections of Myanmar products, 2006–2010 (no. of cases)
2006 2007 2008 2009 2010
Mycotoxins 0 1 1 3 0
Other contaminants 1 0 1 0 0
Pesticide residues 0 0 2 3 5
Source: Calculated by authors using MHLW data

107
Annex HPhilippines
Annex Figure H.1: Trends in agricultural and food exports (Philippines)
0
500
1,000
1,500
2,000
3,000
2,500
2000 2002 2004 2006 2008 2010
mill
ion
US$ Agriculture
Food
Source: UN Comtrade database
Annex Table H.1: Destinations for and respective share of agricultural exports from the Philippines
Rank 2000 2005 2010
1 JPN (29.5%) EU27 (24.7%) EU27 (30.5%)
2 US (24.5%) JPN (21.5%) US (22.9%)
3 EAP (20.6%) EAP (21.3%) EAP (19.9%)
4 EU27 (16.3%) US (19.5%) JPN (15.4%)
5 AUS (0.6%) AUS (0.8%) SAR (1.4%)
Note: Data for 2009 were the most recent when the table was created. EAP includes ASEAN10 countries, China, Hong Kong (China) and Republic of Korea. EU27 includes all EU member countries. LAC includes Latin American and Caribbean countries. SSA includes sub-Saharan African countries. SAR includes South Asian countries. LAC, SSA, and SAR classifications follow those of the World Bank.
Source: UN Comtrade database
Annex Table H.2: Destinations for and respective share of food exports (%)from the Philippines
Rank 2000 2005 2010
1 US (40.0%) US (36.3%) US (33.3%)
2 EAP (23.4%) EAP (27.4%) EAP (26.1%)
3 EU27 (11.4%) EU27 (12.0%) EU27 (16.7%)
4 JPN (8.3%) JPN (6.5%) JPN (3.9%)
5 AUS (1.3%) AUS (2.2%) AUS (1.6%)
Note: EAP includes ASEAN10 countries, China, Hong Kong (China) and Republic of Korea. EU27 includes all EU member countries. LAC includes Latin American and Caribbean countries. SSA includes sub-Saharan African countries. SAR includes South Asian countries. LAC, SSA, and SAR classifica-tions follow those of the World Bank.
Source: UN Comtrade database

108 Regional Trade Standards Compliance Report - East Asia 2013
Annex Table H.3: Top 5 agriculture export products in 2010 (Philippines)
HS Code Name Value (US$ million)
1513 Coconut, palm kernel or babassu oil etc., not chemically modified 1,266
0803 Bananas, including plantains, fresh or dried 319
0801 Coconuts, brazil nuts and cashew nuts, fresh or dried 154
0402 Milk and cream, concentrated or sweetened 131
1302Vegetable saps and extracts; pectic substances, pectinates and pectates; agar-agar and other mucilages and thickeners, whether or not modified, derived from
vegetable products116
Source: UN Comtrade
Annex Table H.4: Top 5 food export products in 2010 (Philippines)
HS Code Name Value (US$ million)
1604 Prepared or preserved fish; caviar and caviar substitutes 254
2008Fruit, nuts and other edible parts of plants, otherwise prepared or preserved,
whether or not containing added sugar or other sweetening matter or spirit, not elsewhere specified or included
222
2009 Fruit juices (incl. grape must) and vegetable juice, no spirits 90
2306 Oil cake and other solid residues, of vegetables 78
1704 Sugar confectionery (incl. white chocolate), no cocoa 53
Source: UN Comtrade database
Annex Table H.5: Trends in Japanese import rejections of food product groups imported from the Philippines 2006–2010 (no. of rejections)
2006 2007 2008 2009 2010
Beverages 0 0 0 1 0
Cereals and bakery products
1 0 1 1 0
Confectionery and sugar 0 0 0 0 2
Fats and vegetable and products
0 0 0 1 0
Fish and fishery products 10 9 24 11 4
Food additives 1 0 0 1 1
Fruits and vegetables and products
10 12 27 2 9
Meat and meat products 1 0 0 0 3
Non-food products 0 0 0 1 1
Other processed foods 0 0 0 1 0
Source: Calculated by authors using MHLW data

109
Annex Table H.6: Trends in reasons for Japanese import rejections of Filipino products, 2006–2010 (no. of cases)
2006 2007 2008 2009 2010
Food additives 6 3 4 4 3
Bacterial contamination 11 12 26 11 10
Heavy metal 0 1 0 0 1
Hygienic condition/controls
0 0 7 0 0
Mycotoxins 0 0 0 0 2
Other contaminants 2 0 0 2 1
Others 3 0 0 1 1
Others microbiological 0 0 0 1 0
Pesticide residues 1 5 15 0 2
Source: Calculated by authors using MHLW data

110 Regional Trade Standards Compliance Report - East Asia 2013
Annex IRepublic of Korea
Annex Figure I.1: Trends in agricultural and food exports (Republic of Korea)
0
500
1,000
1,500
2,000
3,000
2,500
2000 2002 2004 2006 2008 2010
mill
ion
US$ Agriculture
Food
Source: UN Comtrade database
Annex Table I.1: Destinations for and respective share of agricultural exports from Republic of Korea
Rank 2000 2005 2010
1 JPN (73.8%) JPN (55.9%) JPN (41.0%)
2 EAP (14.5%) EAP (20.5%) EAP (30.5%)
3 US (3.8%) US (6.6%) US (7.3%)
4 SAR (0.3%) EU27 (3.3%) EU27 (5.9%)
5 LAC (0.3%) SSA (0.4%) LAC (1.7%)
Note: Data for 2009 were the most recent when the table was created. EAP includes ASEAN10 countries, China, Hong Kong (China) and Republic of Korea. EU27 includes all EU member countries. LAC includes Latin American and Caribbean countries. SSA includes sub-Saharan African countries. SAR includes South Asian countries. LAC, SSA, and SAR classifications follow those of the World Bank.
Source: UN Comtrade database
Annex Table I.2: Destinations for and respective share of food exports (%) from Republic of Korea
Rank 2000 2005 2010
1 JPN (47.7%) JPN (38.5%) JPN (32.7%)
2 EAP (16.9%) EAP (21.7%) EAP (33.6%)
3 US (12.0%) US (13.8%) US (10.8%)
4 EU27 (5.7%) EU27 (2.7%) AUS (2.4%)
5 LAC (1.0%) AUS (2.4%) EU27 (2.2%)
Note: EAP includes ASEAN10 countries, China, Hong Kong (China) and Republic of Korea. EU27 includes all EU member countries. LAC includes Latin American and Caribbean countries. SSA includes sub-Saharan African countries. SAR includes South Asian countries. LAC, SSA, and SAR classifica-tions follow those of the World Bank.
Source: UN Comtrade database
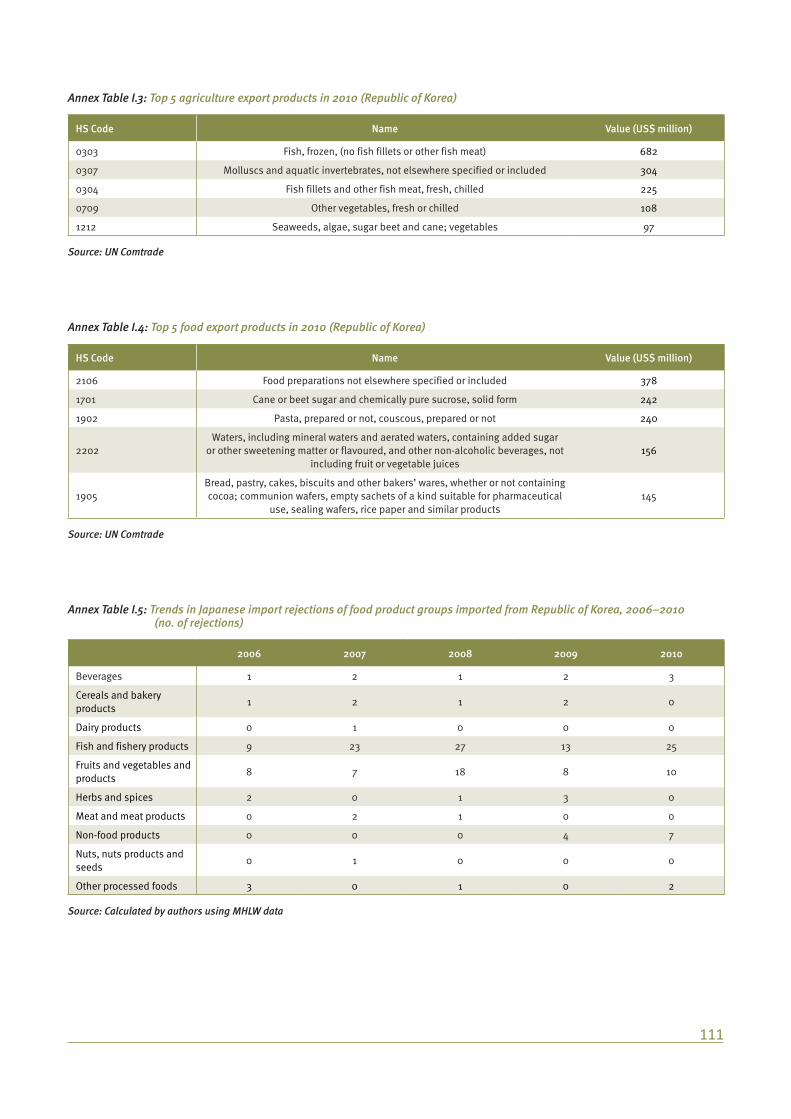
111
Annex Table I.3: Top 5 agriculture export products in 2010 (Republic of Korea)
HS Code Name Value (US$ million)
0303 Fish, frozen, (no fish fillets or other fish meat) 682
0307 Molluscs and aquatic invertebrates, not elsewhere specified or included 304
0304 Fish fillets and other fish meat, fresh, chilled 225
0709 Other vegetables, fresh or chilled 108
1212 Seaweeds, algae, sugar beet and cane; vegetables 97
Source: UN Comtrade
Annex Table I.4: Top 5 food export products in 2010 (Republic of Korea)
HS Code Name Value (US$ million)
2106 Food preparations not elsewhere specified or included 378
1701 Cane or beet sugar and chemically pure sucrose, solid form 242
1902 Pasta, prepared or not, couscous, prepared or not 240
2202Waters, including mineral waters and aerated waters, containing added sugar
or other sweetening matter or flavoured, and other non-alcoholic beverages, not including fruit or vegetable juices
156
1905Bread, pastry, cakes, biscuits and other bakers’ wares, whether or not containing cocoa; communion wafers, empty sachets of a kind suitable for pharmaceutical
use, sealing wafers, rice paper and similar products145
Source: UN Comtrade
Annex Table I.5: Trends in Japanese import rejections of food product groups imported from Republic of Korea, 2006–2010 (no. of rejections)
2006 2007 2008 2009 2010
Beverages 1 2 1 2 3
Cereals and bakery products
1 2 1 2 0
Dairy products 0 1 0 0 0
Fish and fishery products 9 23 27 13 25
Fruits and vegetables and products
8 7 18 8 10
Herbs and spices 2 0 1 3 0
Meat and meat products 0 2 1 0 0
Non-food products 0 0 0 4 7
Nuts, nuts products and seeds
0 1 0 0 0
Other processed foods 3 0 1 0 2
Source: Calculated by authors using MHLW data

112 Regional Trade Standards Compliance Report - East Asia 2013
Annex Table I.6: Trends in reasons for Japanese import rejections of products from Republic of Korea, 2006–2010 (no. of cases)
2006 2007 2008 2009 2010
Food additives 7 4 2 1 9
Adulteration/missing document
0 0 1 1 0
Bacterial contamination 11 15 21 10 20
Hygienic condition/controls
0 0 9 1 0
Mycotoxins 0 1 0 0 0
Others 0 2 2 4 8
Pesticide residues 6 16 14 15 9
Veterinary drugs residues 0 0 1 0 1
Source: Calculated by authors using MHLW data

113
Annex JSingapore
Annex Figure J.1: Trends in agricultural and food exports (Singapore)
0
1,000
2,000
3,000
4,000
5,000
2000 2002 2004 2006 2008 2010
mill
ion
US$ Agriculture
Food
Source: UN Comtrade database
Annex Table J.1: Destinations for and respective share of agricultural exports from Singapore
Rank 2000 2005 2010
1 EAP (33.2%) EAP (41.7%) EAP (43.9%)
2 EU27 (12.2%) JPN (11.4%) JPN (9.3%)
3 JPN (11.6%) EU27 (7.7%) EU27 (7.6%)
4 US (10.1%) US (5.1%) SSA (7.0%)
5 SAR (5.9%) SAR (5.1%) SAR (6.6%)
Note: Data for 2009 were the most recent when the table was created. EAP includes ASEAN10 countries, China, Hong Kong (China) and Republic of Korea. EU27 includes all EU member countries. LAC includes Latin American and Caribbean countries. SSA includes sub-Saharan African countries. SAR includes South Asian countries. LAC, SSA, and SAR classifications follow those of the World Bank.
Source: UN Comtrade database
Annex Table J.2: Destinations for and respective share of food exports (%) from Singapore
Rank 2000 2005 2010
1 EAP (44.5%) EAP (54.0%) EAP (61.5%)
2 JPN (28.3%) JPN (17.1%) JPN (10.9%)
3 EU27 (5.5%) AUS (6.4%) AUS (6.0%)
4 AUS (4.8%) EU27 (6.0%) SAR (5.2%)
5 US (3.7%) US (3.2%) US (2.7%)
Note: EAP includes ASEAN10 countries, China, Hong Kong (China) and Republic of Korea. EU27 includes all EU member countries. LAC includes Latin American and Caribbean countries. SSA includes sub-Saharan African countries. SAR includes South Asian countries. LAC, SSA, and SAR classifica-tions follow those of the World Bank.
Source: UN Comtrade database

114 Regional Trade Standards Compliance Report - East Asia 2013
Annex Table J.3: Top 5 agriculture export products in 2010 (Singapore)
HS Code Name Value (US$ million)
0402 Milk and cream, concentrated or sweetened 218
1511 Palm oil and its fractions 202
0303 Fish, frozen, (no fish fillets or other fish meat) 121
1516 Animal or vegetable fats and oils and fractions 98
0410 Edible products of animal origin, not elsewhere specified or included 80
Source: UN Comtrade database
Annex Table J.4: Top 5 food export products in 2010 (Singapore)
HS Code Name Value (US$ million)
2208 Undenatured ethyl alcohol of an alcoholic, spirit beverage etc. 1,334
1901 Malt extract; food preparations of flour, etc. 898
1806 Chocolate and other food preparations containing cocoa 330
2106 Food preparations, not elsewhere specified or included 327
2204 Wine of fresh grapes, (incl. fortified wines) 271
Source: UN Comtrade database
Annex Table J.5: Trends in Japanese rejections of food product groups imported from Singapore, 2006–2010 (no. of rejections)
2006 2007 2008 2009 2010
Beverages 1 0 0 0 1
Cereals and bakery products
0 0 0 1 1
Confectionery and sugar 0 0 0 0 1
Fruits and vegetables and products
0 0 0 0 1
Nuts, nuts products and seeds
2 0 0 0 0
Other processed foods 0 0 0 1 0
Source: Calculated by authors using MHLW data
Annex Table J.6: Trends in reasons for Japanese import rejections of products from Singapore, 2006–2010 (no. of cases)
2006 2007 2008 2009 2010
Food additives 3 0 0 1 1
Adulteration/missing document
0 0 0 1 0
Bacterial contamination 0 0 0 0 2
Mycotoxins 0 0 0 0 1
Source: Calculated by authors using MHLW data

115
Annex KThailand
Annex Figure K.1: Trends in agricultural and food exports (Thailand)
0
2,000
4,000
6,000
8,000
10,000
12,000
14,000
16,000
2000 2002 2004 2006 2008 2010
mill
ion
US$ Agriculture
Food
Source: UN Comtrade database
Annex Table K.1: Destinations for and respective share of agricultural exports from Thailand
Rank 2000 2005 2010
1 EAP (26.1%) EAP (33.1%) EAP(35.7%)
2 JPN (20.5%) JPN (14.3%) SSA (16.2%)
3 US (17.8%) US (13.7%) US (11.9%)
4 EU27 (11.5%) SSA (12.3%) JPN (10.5%)
5 SSA (7.7%) EU27 (7.7%) EU27 (7.5%)
Note: EAP includes ASEAN10 countries, China, Hong Kong (China) and Republic of Korea. EU27 includes all EU member countries. LAC includes Latin American and Caribbean countries. SSA includes sub-Saharan African countries. SAR includes South Asian countries. LAC, SSA, and SAR classifica-tions follow those of the World Bank.
Source: UN Comtrade database
Annex Table K.2: Destinations for and respective share of food exports (%) from Thailand
Rank 2000 2005 2010
1 US (24.8%) EAP (21.9%) EAP (27.4%)
2 JPN(23.7%) JPN (21.9%) JPN (17.5%)
3 EAP (20.0%) US (20.4%) US (16.6%)
4 EU27 (13.1%) EU27 (16.7%) EU27 (16.3%)
5 AUS (3.2%) AUS (3.6%) AUS (3.5%)
Note: EAP includes ASEAN10 countries, China, Hong Kong (China) and Republic of Korea. EU27 includes all EU member countries. LAC includes Latin American and Caribbean countries. SSA includes sub-Saharan African countries. SAR includes South Asian countries. LAC, SSA, and SAR classifica-tions follow those of the World Bank.
Source: UN Comtrade database

116 Regional Trade Standards Compliance Report - East Asia 2013
Annex Table K.4: Top 5 food export products in 2010 (Thailand)
HS Code Name Value (US$ million)
1604 Prepared or preserved fish; caviar and caviar substitutes 2,411
1701 Cane or beet sugar and chemically pure sucrose 2,152
1602Other prepared or preserved meat, meat offal or blood not elsewhere specified or
included1,832
1605 Crustaceans, molluscs and other aquatic invertebrates, prepared or preserved 1,709
2008Fruit, nuts and other edible parts of plants, otherwise prepared or preserved,
whether or not containing added sugar or other sweetening matter or spirit, not elsewhere specified or included
892
Source: UN Comtrade database
Annex Table K.5: Trends in Japanese rejections of food product groups imported from Thailand 2006–2010 (no. of rejections)
2006 2007 2008 2009 2010
Beverages 0 0 0 0 1
Cereals and bakery products
19 21 24 29 34
Confectionery and sugar 1 0 1 1 0
Dairy products 1 0 1 0 0
Fish and fishery products 49 39 38 47 38
Fruits and vegetables and products
31 27 19 26 17
Herbs and spices 5 5 3 4 5
Meat and meat products 6 8 15 9 15
Non-food products 2 2 2 1 11
Nuts, nuts products and seeds
1 1 0 0 1
Other processed foods 5 0 0 1 0
Source: Calculated by authors using MHLW data
Annex Table K.3: Top 5 agriculture export products in 2010 (Thailand)
HS Code Name Value (US$ million)
1006 Rice 5,341
0306 Crustaceans, fresh, chilled or frozen etc. 1,725
714 Roots and tubers with high starch 817
1108 Starches and inulin 772
0307 Molluscs and aquatic invertebrates, not elsewhere specified or included 420
Source: UN Comtrade database

117
Annex Table K.6: Trends in reasons for Japanese import rejections of products from Thailand, 2006–2010 (no. of cases)
2006 2007 2008 2009 2010
Food additives 11 2 8 7 9
Bacterial contamination 64 55 57 67 52
Hygienic condition/controls
13 13 13 21 32
Mycotoxins 10 11 10 5 4
Other contaminants 2 3 2 1 0
Others 0 2 3 1 11
Pesticide residues 17 13 6 13 13
Veterinary drugs residues 3 4 4 3 1
Source: Calculated by authors using MHLW data

118 Regional Trade Standards Compliance Report - East Asia 2013
Annex LViet Nam
Annex Figure L.1: Trends in agricultural and food exports (Viet Nam)
0
2,000
4,000
6,000
8,000
10,000
12,000
2000 2002 2004 2006 20082001 2003 2005 2007 2009
mill
ion
US$ Agriculture
Food
Source: UN Comtrade database
Annex Table L.1: Destinations for and respective share of agricultural exports from Viet Nam
Rank 2000 2005 2009
1 EAP (35.0%) EAP (26.4%) EAP (31.8%)
2 JPN (15.0%) EU27 (1531%) EU27 (21.1%)
3 US (12.5%) US (14.5%) US (10.3%)
4 EU27 (11.7%) JPN (14.0%) JPN (7.0%)
5 SSA (2.0%) SSA (6.5%) SSA (5.9%)
Note: Data for 2009 were the most recent when the table was created. EAP includes ASEAN10 countries, China, Hong Kong (China) and Republic of Korea. EU27 includes all EU member countries. LAC includes Latin American and Caribbean countries. SSA includes sub-Saharan African countries. SAR includes South Asian countries. LAC, SSA, and SAR classifications follow those of the World Bank.
Source: UN Comtrade database
Annex Table L.2: Destinations for and respective share of food exports (%) from Viet Nam
Rank 2000 2005 2009
1 EAP (33.9%) JPN (26.6%) EAP (30.0%)
2 JPN (16.3%) EAP (20.3%) US (17.5%)
3 EU27 (13.8%) US (17.1%) JPN (17.0%)
4 US (5.9%) EU27 (16.8%) EU27 (14.7%)
5 SAR (0.8%) AUS (1.4%) SSA (0.9%)
Note: EAP includes ASEAN10 countries, China, Hong Kong (China) and Republic of Korea. EU27 includes all EU member countries. LAC includes Latin American and Caribbean countries. SSA includes sub-Saharan African countries. SAR includes South Asian countries. LAC, SSA, and SAR classifica-tions follow those of the World Bank.
Source: UN Comtrade database

119
Annex Table L.3: Top 5 agriculture export products in 2009 (Viet Nam)
HS Code Name Value (US$ million)
1006 Rice 2,666
0901 Coffee; coffee husks and skins; coffee substitutes with coffee 1,731
0304 Fish fillets and other fish meat, fresh, chilled or frozen 1,622
0306 Crustaceans, fresh, chilled or frozen 1,397
0801 Coconuts, brazil nuts and cashew nuts, fresh or dried 884
Source: UN Comtrade database
Annex Table L.4: Top 5 food export products in 2009 (Viet Nam)
HS Code Name Value (US$ million)
1605 Crustaceans, molluscs and other aquatic invertebrates, prepared or preserved 457
1604 Prepared or preserved fish; caviar and caviar substitutes 177
1905Bread, pastry, cakes, biscuits and other bakers’ wares, whether or not containing cocoa; communion wafers, empty sachets of a kind suitable for pharmaceutical
use, sealing wafers, rice paper and similar products103
1902 Pasta, prepared or not, couscous, prepared or not 96
1704 Sugar confectionery (incl. white chocolate), no cocoa 71
Source: UN Comtrade database
Annex Table L.5: Trends in Japanese rejections of food product groups imported from Viet Nam, 2006–2010 (no. of rejections)
2006 2007 2008 2009 2010
Beverages 0 0 2 9 14
Cereals and bakery products
2 8 5 1 2
Confectionery and sugar 0 2 2 1 2
Dairy products 0 1 0 0 0
Fats and vegetable and products
0 0 0 0 2
Fish and fishery products 117 147 60 57 83
Fruits and vegetables and products
5 5 5 8 11
Herbs and spices 2 1 0 0 2
Meat and meat products 0 0 0 1 1
Non-food products 1 0 0 2 1
Nuts, nuts products and seeds
2 1 0 0 0
Other processed foods 2 0 0 0 0
Source: Calculated by authors using MHLW data

120 Regional Trade Standards Compliance Report - East Asia 2013
Annex Table L.6: Trends in reasons for Japanese import rejections of products from Viet Nam, 2006–2010 (no. of cases)
2006 2007 2008 2009 2010
Food additives 7 5 3 8 9
Bacterial contamination 43 30 20 27 25
Hygienic condition/controls
0 0 2 7 14
Mycotoxins 3 2 2 1 0
Other contaminants 0 1 0 0 0
Others 0 6 0 2 1
Packaging 0 0 2 0 0
Pesticide residues 5 4 1 2 38
Veterinary drugs residues 73 117 44 32 31
Source: Calculated by authors using MHLW data

121


Disclaimer:No part of this report may be reprinted by any means without written permission from the institute (IDE-JETRO) or UNIDO. This document has been produced without formal United Nations editing. The designations employed and the presentation of the material in this document do not imply the expression of any opinion whatsoever on the part of the Secretariat of the United Nations Industrial Development Organization (UNIDO) concerning the legal status of any country, territory, city or area or of its authorities, or concerning the delimitation of its frontiers or boundaries, or its economic system or degree of development. Designations such as “developed”, “industrialized” and “developing” are intended for statistical convenience and do not neces sarily express a judgment about the stage reached by a particular country or area in the development process. Mention of firm names or commercial products does not constitute an endorsement by UNIDO. The opinions, statistical data and estimates contained in signed articles are the responsibility of the author(s) and should not necessarily be considered as reflecting the views or bearing the endorsement of UNIDO.Similarly, IDE-JETRO maintains that the views expressed in the book are those of the author(s) and neither the Institute of Developing Economies nor the Japan External Trade Organization bears responsibility for them. Although great care has been taken to maintain the accuracy of infor-mation herein, neither UNIDO nor its Member States assume any responsibility for consequences which may arise from the use of the material.
Cover photo: © Paramat Keereewan / Shutterstock.com

Meeting Standards, Winning Markets
UNITED NATIONS INDUSTRIAL DEVELOPMENT ORGANIZATIONVienna International Centre, P.O. Box 300, 1400 Vienna, AustriaTelephone: (+43-1) 26026-0, Fax: (+43-1) 26926-69E-mail: [email protected], Internet: http://www.unido.org
Printed in Slovakia November 2013 - 700
MEETING STANDARDS, W
INNING MARKETS – EAST ASIA 2013
Regional Trade Standards Compliance Report
East Asia 2013
INSTITUTE OF DEVELOPING ECONOMIES, JAPAN EXTERNAL TRADE ORGANIZATIONWakaba 3-2-2, Mihamaku, Chiba, Chiba Prefecture, 261-8545, JapanTelephone: (+81) 43-299-9535, Fax: (+81) 43-299-9736E-mail: [email protected], Internet: www.ide.go.jp/English/