meeting the intent of ada in sidewalk cross · pdf filemeeting the intent of ada in sidewalk...
TRANSCRIPT

MEETING THE INTENT OF ADA IN SIDEWALK CROSS-SLOPE
DESIGN
Kara Kockelman1,Yong Zhao, Chessie Blanchard-Zimmerman
University of Texas at Austin
Department of Civil Engineering
6.9 E. Cockrell Jr. Hall, Austin, Texas 78712
Phone: (512) 471-0210, FAX: (512) 475-8744
The following paper is a pre-print and the final publication can be found in
Journal of Rehabilitation Research and Development 38 (1):101-110, 2001.
Research Sponsored by the Texas Department of Transportation
ABSTRACT
Recent work has indicated that prior research is insufficient to support the ADA Accessibility
Guidelines’ (ADAAG) two-percent maximum cross-slope requirement for sidewalks. In addition,
the present ADAAG are inflexible in that they do not consider deviations from this maximum for
short sections of sidewalk, such as at driveway crossings, which can be of significant concern for
state and local departments of transportation. Based upon these findings, a study was undertaken
to evaluate the usable range of sidewalk cross-slopes by explicitly considering user perception
and effort. Twenty subjects ranging widely in age and type of mobility aid participated in field
surveys where they traversed different sidewalk sections varying in cross-slope, primary grade,
length, width and other characteristics.
This paper illustrates the use of weighted-least-squares and ordered-probit regression models for
analysis of disabled-user response to sidewalk characteristics. The results of these models permit
estimation of maximum sidewalk cross-slope consistent with the intent and spirit of ADA.
These are estimated to be four percent – where feasible – and ten percent – where unfavorable
construction conditions exist. Such results should prove useful for consideration of the final
requirements of ADA on this topic. However, larger sample sizes and a stronger recognition of
the population of interest are necessary before definitive, legislated maxima can be ascertained.
Keywords: Sidewalk design, accessibility, Americans with Disabilities Act, cross-slope
1
Corresponding Author: Kara Kockelman, Assistant Professor of Civil Engineering, Tel: (512) 471-0210, Fax:
(512) 475-8744, E-mail address: [email protected]

Kockelman, et al 2
1. INTRODUCTION
The ADA Accessibility Guidelines (ADAAG) clearly state that accessible sidewalks require
limited cross sloping (1). Honoring its spirit and intent, state transportation agencies aim to be in
compliance with the ADA when designing and constructing roadway projects that include
pedestrian facilities. Unfortunately, existing infrastructure and terrain conditions, restricted
right-of-way (ROW), and city ordinances often prevent these agencies from achieving the
standard of a two-percent cross-slope at all points along an accessible route. Currently, one
primary area of concern is maintaining the prescribed cross-slope where sidewalks intersect with
driveways.
1.1 BACKGROUND
Until now, virtually no research has been undertaken as to the effect of cross-slope on the
accessibility of sidewalks to persons with disabilities (2). Prior research is insufficient to support
the ADA’s two-percent cross-slope requirement and does not offer a maximum limit for cross-
slope in situations where the two-percent requirement may be relaxed (2). Existing studies have
used fairly homogeneous populations of young males with good upper body strength and stamina
as their test subjects (3, 4). Because of these deficiencies, the validity of existing requirements
for less physically capable users and users with different mobility aids may be questioned. A
reasonable maximum slope standard is urgently needed for design standards and construction
cost estimation.
In the absence of an accepted standard for this type of design and construction, transportation
agencies have often followed a "do the best you can" approach to providing sidewalk
accessibility. However, this approach leaves the entity vulnerable to costly, damaging lawsuits.

Kockelman, et al 3
Accessibility is a civil right, and ADA court history has established a high standard of "undue
burden" when it comes to noncompliance (5). The experimental research detailed in this paper
was conducted in order to develop maximum and desirable limits for sidewalk cross-slope at
driveway crossings. Based upon findings in the previously submitted review of methods, the
research team designed and administered a study to evaluate the usable range of sidewalk cross-
slopes under the current ADA accessibility guidelines with regard to user perception and effort.
This paper details the research undertaken with analyses based on a weighted linear regression
model of heart rate deviation from resting rate and an ordered-response model of perception of
sidewalk-section crossing difficulty. Model results permit estimation of reasonable cross-slope
maxima for different sidewalk users with various disabilities.
2. METHODOLOGY
The research methodology is based on the use of linear and non-linear procedures to estimate
thresholds of sidewalk cross-slope. The linear regression model involves the heart rate changes
of subjects after having traversed distinct sidewalk sections. The non-linear model analyzes
sidewalk assessment from an on-site field survey; and its ordinal assessment is a five-point scale,
with categories ranging from easy-to-cross to impossible-to-cross.
2.1 Linear Regression with Weighted Least Square Estimation
The first method described here involves linear regression models of heart-rate response. The
change in heart rate is an important indicator of energy consumption as a result of crossing a
sidewalk section (3, 6). The variation in heart rate, Yi (the difference between the post test heart
rate and the resting heart rate on test i), is modeled here as a linear function of several important
explanatory variables, iXv
. Notationally,

Kockelman, et al 4
iii XY εβ +′=vv
(1)
where β is a column vector of coefficients to be estimated and εi is an error term representing the
random variation about the average heart rate change expected in the ith test. The distribution of
the error εi is assumed to be normal, with mean zero and constant variance.
OLS estimates are not efficient and their standard errors are biased low in the presence of
dependent error terms. This occurs here because all subjects participated in multiple tests. Thus,
correlation across error terms exists for each individual, and the error terms may be thought of as
containing two parts: individual-specific biases and purely random error. Notationally,
innin
ininin
uwhere
uXY
εεβ
+=+′=
vv
(2)
where Yin is the heart rate change of individual n in i’th experiment, uin is the total error, εn is
the error specific to individual n, and εin is the purely random error.
A weighted least squares (WLS) estimation can accommodate this lack of error-term
independence, where the weights are estimates of the variances associated with each
observation’s error term. This technique is called “feasible generalized least squares” and is
asympototically as efficient as maximum likelihood estimation (when error terms are normal)
(7). If it is assumed that the variance of each individual’s error term and the variance of each
experiment’s error term are constants, i.e. 22 )var(,)var( σεσε == niin and the correlation of error
terms arising when individual n takes two tests, p and q, is the following:
;),( nuucorr pqqnpn ∀= ρ (3)
then a weight matrix “W” can be constructed as following:

Kockelman, et al 5
.
1
1
,
00
00
00
1
1
112
1
1
=Ω
Ω
Ω=
−
IqI
pIp
Iq
avgn
N
whereW
ρρρρρρ
σ OO (4)
The WLS estimate of parameter vector βv
is the following:
( ) WYXWXXWLS ’’ˆ 1−=β , (5)
where X is the matrix of the explanatory information and Y is a column vector of the heart rate
differences.
2.2 Ordered Response Probit Analysis
In the second type of analytical model used here, categorized assessments (ranging from
“easy-to-cross” to “impassable” [see Table 2]) of distinctly sloped sidewalk sections are
modeled using an ordered-response probit structure. The procedure, popularized by McKelvey
and Zavoina (8), also involves parameters representing the unobserved thresholds between
assessment categories.
The ordered-response mechanism is based on the hypothesis that a continuous variable *iY
represents the unobserved or “latent” response for an individual n on a sidewalk section i. The
latent response is assumed to be a linear function of relevant explanatory variables and a
standard normally distributed random error term εin. The variance of εin can be set to 1.0 since
*iY is not observed (and hence its scale is unidentifiable) (9). Given a respondent’s ranking or
assessment, inY , of a sidewalk section i, the latent response (*inY ) and threshold bounds (kµ ) are
as follows:
),1,0(*1
*
KkYifkY
XY
kinkin
inniin
K
vv
=≤<=
+′=
− µµεβ
(6)

Kockelman, et al 6
where iXv
is a column vector of explanatory variables, βv
is a corresponding column vector of
coefficients to be estimated, and the µ’s are threshold bounds (with +∞=−∞= Kµµ ,1 ). The
probability associated with each term is determined by the threshold bounds and the latent
response *iY . In equation form:
( )( ) ( )( )*1
*)( inkinkin YEYEkYP −Φ−−Φ== −µµ (7)
where Φ is the cumulative standard normal distribution function and ( ) βvv ′= inin XYE * .
The estimation maximizes the log likelihood function given by:
∑ ∑ ===in in
inin kYPLL )]([lnlnln (8)
The possible assessments of sidewalks range from “easy to cross” to “appears impassable” –
and their five levels represent the dependent, ordinal-response variable. Since our objective is to
understand the effects of cross-slope and estimate a maximum reasonable cross-slope, the cross-
slope variable plays a critical role among the explanatory variables. Having estimated the
threshold bounds (kµ ), the maximum cross-slope is estimates so that:
( ) 20.03 ≥≤+′ µβ inin uXPvv
(9)
– in other words, no more than 20% of the sidewalk users will feel uncomfortable when they
traverse such a cross-slope (since the third threshold indicates a move to the “will take
significant effort” response, and the fourth indicates a shift into the “appears impassable”
response level). Note that this choice of a 20-percent cut-off is not necessarily optimal; further
research on the population of interest (i.e., persons with disabilities who are likely to want to use
sidewalks) is needed to justify this assumption.

Kockelman, et al 7
Data provided by the 1990 National Health Interview Survey’s (NHIS) Assistive Devices
Supplement indicate that, of the 6.4 million persons using assistive devices “for getting around,”
79% use crutches or canes, 26% use walkers, 21% use manual wheelchairs, 2% use power
wheelchairs, and less than 1% use scooters (10). In addition, the data indicate that “73% of
people who use assistive devices are 55 and older.” (11). Bearing these figures in mind, it may
be reasonable to advocate a cross-slope value that would be traversible by 80% of the assistive
device-using population.
3. EMPIRICAL ANALYSIS
3.1. Survey And Sample Description
Analyzed data were collected using two field surveys: one where participants stated their
perceptions of ease of sidewalk use before and after crossing various sidewalk sections, and
another where their heart-rate changes in response to traversing distinct sidewalk sections were
recorded before and after they traversed distinct sidewalk sections.
3.1.1. Survey Population
The greatest obstacle to the completion of this research was the difficulty in recruiting
participants. In the process of soliciting participants, sixteen different agencies and organizations
were contacted, five public presentations were given (including one televised presentation), and
2,000 pieces of literature were distributed, both through direct mail and through more general
marketing methods. While the targeted community seemed to be supportive of the research
effort, few of its members participated in the survey process. Table 1 gives a brief description of
the types of persons who did participate in one or more of the surveys.

Kockelman, et al 8
Respondents to the field survey ranged in age from 27 to 59, and included 10 women and 9
men; all were Caucasian. The on-site perception surveys were held in two locations, so as to
encourage participation. Some participants volunteered for the heart-rate survey and both
perception surveys, providing a total of 10 heart-rate surveys and 22 perception surveys. Each
survey involved multiple tests (but a few participants did not perform some of these), so the total
number of observations in the perception and heart-rate data sets were 126 and 302.
Table 1: Participant Distribution by Type of DisabilityAnd Mobility Aid1, and by Age
Number of Number ofType of Disability and Mobility Aid Respondents* Age Respondents
Blind, Seeing Eye Dog 2 27 1Cerebral Palsy, Manual Chair 1 28 1Cerebral Palsy, No Aid 1 32 1Congenital Heart Disease, Manual Chair 1 35 1Head Injury, Electric Chair 2 41 1Head Injury, Scooter 1 42 1Muscular Dystrophy, Electric Chair 2 43 2Cerebral Palsy, Electric Chair 1 44 1Neural MD, Cane 1 45 2Paraplegic, Manual Chair 1 46 2Polio, Electric Chair 2 49 3Polio, Manual Chair 1 50 1Single Amputee, Crutches 1 52 1Spinal Cord Injury, Electric Chair 1 59 1Visually Impaired, Cane 1
Note: One respondent participated using both manual and power wheelchairs, bringing this total to twenty.
3.1.2. Field Surveys
Perception surveys were held at locations along bus routes identified as those having high
numbers of riders with disabilities. These surveys required the participants to traverse a series of
delineated sections with varying cross-slopes and attributes. Participants were instructed to
traverse the sidewalk sections at a comfortable pace, pausing as needed and simulating the way

Kockelman, et al 9
they would typically use a sidewalk. Before and after each section, the participants’ subjective
assessments of the sidewalks and heart rates were recorded.
The following variables were observed for each sidewalk section: cross-slope, primary slope,
width, length, set-back distance, participant’s heart-rate change, and participant’s sidewalk
assessment. Each participant’s age, gender, fitness level, type of disability and mobility aid, and
resting heart rates were also recorded, as explanatory variables. Table 2 provides more specific
information on these definitions of these variables.
Table 2: Definitions of Dependent and Explanatory Variables
Variable DefinitionDependent variables:Heart-rate ChangeSidewalk Assessment
Change in heart rate (beats per minute)1 = Easy to cross, 2 = Pretty easy to cross, 3 = Will take someeffort, 4 = Will take significant effort, and 5 = It appearsimpassable for me
Facility-relatedexplanatory variables:Cross-slope The vertical slope to the guideline of a sidewalk (%)Primary slope The main slope along the guideline of a sidewalk (%)Length The length of a sidewalk section (m)Width The width of a sidewalk section (m)Set-back The set-back distance of a sidewalk section (100 m)Transition The transition distance between cross-slopes (m)Traffic volume The average traffic volume of parallel street(veh/hour)Speed The average traffic speed of parallel street (km/hour)Flare 1 if the sidewalk section has a flare, 0 otherwisePersonal explanatoryvariables:Age The age of the survey participantGender 1 if the participant is a male, 0 otherwiseManual wheelchair 1 if the participant uses a manual wheelchair, 0 otherwisePower wheelchair 1 if the participant uses a power wheelchair, 0 otherwiseCane 1 if the participant uses a cane, 0 otherwiseCrutch 1 if the participant uses a crutch, 0 otherwiseWalker 1 if the participant uses a walker, 0 otherwiseScooter 1 if the participant uses a scooter, 0 otherwiseLeg brace 1 if the participant uses a leg brace , 0 otherwiseFoot brace 1 if the participant uses a foot brace, 0 otherwiseArtificial leg 1 if the participant uses a artificial leg, 0 otherwise
Kockelman, et al 10
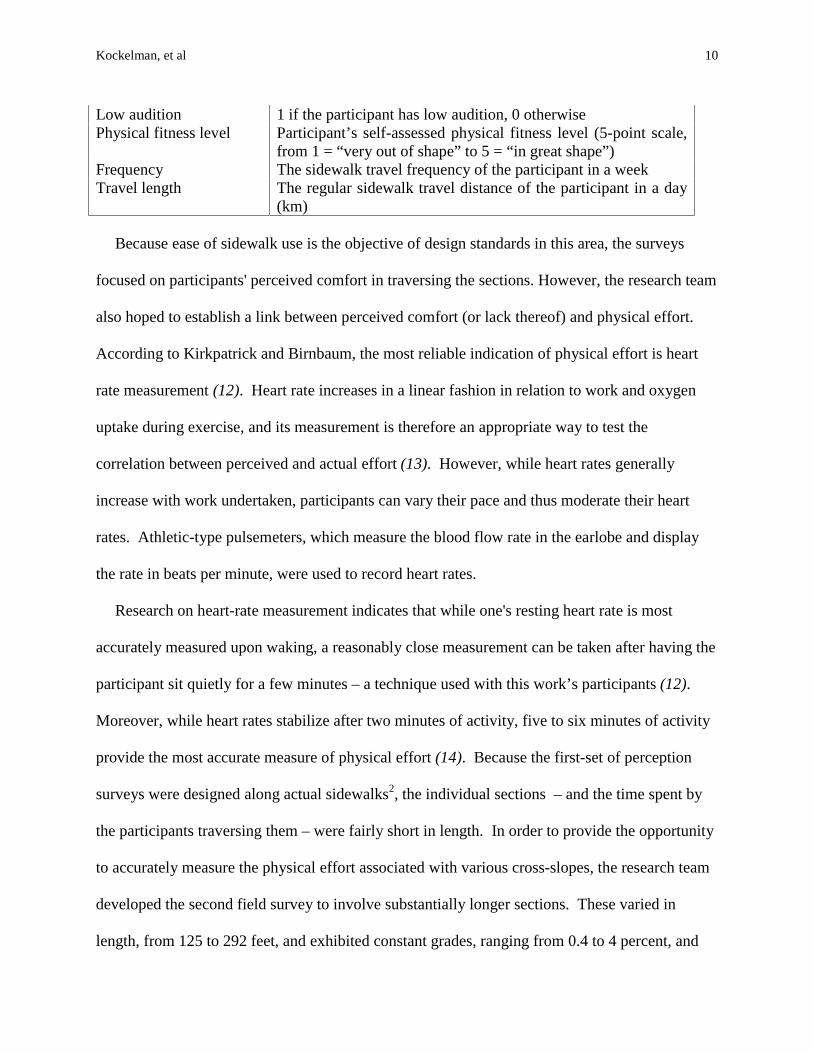
Low audition 1 if the participant has low audition, 0 otherwisePhysical fitness level Participant’s self-assessed physical fitness level (5-point scale,
from 1 = “very out of shape” to 5 = “in great shape”)Frequency The sidewalk travel frequency of the participant in a weekTravel length The regular sidewalk travel distance of the participant in a day
(km)
Because ease of sidewalk use is the objective of design standards in this area, the surveys
focused on participants' perceived comfort in traversing the sections. However, the research team
also hoped to establish a link between perceived comfort (or lack thereof) and physical effort.
According to Kirkpatrick and Birnbaum, the most reliable indication of physical effort is heart
rate measurement (12). Heart rate increases in a linear fashion in relation to work and oxygen
uptake during exercise, and its measurement is therefore an appropriate way to test the
correlation between perceived and actual effort (13). However, while heart rates generally
increase with work undertaken, participants can vary their pace and thus moderate their heart
rates. Athletic-type pulsemeters, which measure the blood flow rate in the earlobe and display
the rate in beats per minute, were used to record heart rates.
Research on heart-rate measurement indicates that while one's resting heart rate is most
accurately measured upon waking, a reasonably close measurement can be taken after having the
participant sit quietly for a few minutes – a technique used with this work’s participants (12).
Moreover, while heart rates stabilize after two minutes of activity, five to six minutes of activity
provide the most accurate measure of physical effort (14). Because the first-set of perception
surveys were designed along actual sidewalks2, the individual sections – and the time spent by
the participants traversing them – were fairly short in length. In order to provide the opportunity
to accurately measure the physical effort associated with various cross-slopes, the research team
developed the second field survey to involve substantially longer sections. These varied in
length, from 125 to 292 feet, and exhibited constant grades, ranging from 0.4 to 4 percent, and

Kockelman, et al 11
constant cross-slopes, ranging from 0.5 to 3.6 percent. Due to the serious difficulty in finding
locations where cross-slopes and grades can be maintained for long distances3, these distances
may be not be as long and the ranges are not as varied as would be ideal.
This second field survey was specifically designed to measure the participant’s change in
physical effort as a response to cross-slope. Necessarily, this survey required participants to
travel for some distance to allow for accurate measurement of the change in heart rate. Another
major obstacle of this project involved selecting an easily accessible survey location with enough
area to accommodate long sections and enough surface change to provide varied cross-slopes.
This proved to be quite difficult, as large, paved lots must be constructed in such a way as to be
accessible to disabled users. Ultimately, the site used for this survey was selected because it was
adjacent to a perception survey site, it provided some variety of grades and cross-slopes, and it
was the site most conveniently located to the group of volunteers. The final heart-rate survey
consisted of 13 separate sections with varying lengths, grades, and cross-slopes.
3.2. Results
The results of the weighted-least-squared and ordered-probit regressions models, for heart-
rate change and sidewalk assessment, respectively, are presented here.
3.2.1 Linear Regression Model with WLS Estimation
Table 3: WLS Regression Model Results
Variable Coefficients Standard Error t-statisticPrimary slope (%) 1.42 6.04 0.23Cross-slope (%) 3.41 7.75 0.44Distance 0.51 0.12 4.17*Age 0.58 1.02 0.57Physical fitness level(1 to 5; 5 = great shape)
-29.34 5.29 -5.54*
Power wheelchair -35.49 24.16 -1.47

Kockelman, et al 12
Cane or crutch 62.12 18.65 3.33*Scooter -23.82 23.58 -1.01N = 126, Weighted & Adjusted R2 =0.780*Statistically significant at 0.05 level.Note: Reference disability is “manual wheelchair” and weighting factor is“resting heart rate” .
As shown in Table 3, the weighted and adjusted R2 value is rather high, indicating that the
explanatory variables in the model explain much of the variation in recorded heart rate changes.
The coefficient of distance suggests that the average heart rate change will increase if the
sidewalk section distance increases. The coefficient of age suggests that older users may
experience greater change in heart rate than will younger users. The effect of physical fitness
level suggests that the higher the level of physical fitness, the less the heart rate increases in
response to cross-slopes. The variable of gender, however, was not statistically significant and
was removed form the regression.
The coefficients of mobility aid types describe the average heart rate change for each kind of
mobility aid without considering the effects of sidewalk characteristics. The related magnitudes
of the parameters imply that people using canes/crutches consume more energy than people
using other aid types do. As anticipated, the effects of cross-slope and primary slope are
positive, suggesting that higher cross-slopes increase heart rates. The relative magnitudes of the
coefficients suggest that the effect of the primary slope on heart rates is smaller than that of the
cross-slope. However, this difference is not statistically significant (as partially evident via the
two variables’ weak t-statistics). And, more importantly, the main grade was traversed in both
directions during this set of experiments (i.e., both uphill and downhill during each observation
recorded); so the opposing grades moderate one another’s effects and render the grade variable
merely an indication of absolute grade.

Kockelman, et al 13
It should be noted that without tests of five or more minutes duration, heart rates of the
participants probably did not stabilize during these experiments. In fact, during short periods of
exertion, heart rates often are biased high and the results are likely to suggest more exertion is
necessary that would be required under a rate-stabilized scenario. If sites can be found for much
longer tests and exertion periods, this weakness of the data could be remedied. Also, because the
site used for the heart rate surveys was less than ideal, participants were required to travel along
some paths that were perpendicular to the main grade of the area, and some paths that were
parallel to the main grade. Additionally, the limited dimensions of this particular site
necessitated that they travel out from and back to a point of origin for each section. In such
situations, the measured main grades and cross-slopes are highly correlated; thus, the model
suffers from multicollinearity. However, because it is believed that the main grade and cross-
slope play important roles in producing change in heart rates, these two explanatory variables
were retained in the final model and their coefficient estimates should not be biased.
3.2.2. Ordered Response Model
For the ordered probit model, the likelihood ration index (LRI) – a goodness-of-fit measure
very similar to an R2 – is 0.10. Thus, the model specification is useful for predicting user
assessment.
Table 4: Ordered Response Probit Model Results
Variable Coefficients Standard Error t-statisticPrimary Slope 0.15 0.03 4.99*Cross-slope 0.11 0.02 5.84*Logarithm of Age 1.91 1.57 2.00*Gender -0.98 0.17 -5.64*Physical Fitness Level(1 to 5; 5 = great shape)
-0.20 0.10 -1.93*
Manual wheelchair 0.19 0.16 1.19µ1 3.71 2.32 1.60

Kockelman, et al 14
µ2 4.32 2.32 1.86*µ3 4.82 2.33 2.07*µ4 5.82 2.34 2.49*N = 302, Likelihood Ratio Index (LRI) =0.10*Statistically significant at 0.05 level.Note: Reference disability is “cane/crutch”.
From Table 4 one finds again, as expected, the effects of primary slope and cross-slope are
positive, suggesting an increase in traversing difficulty as the primary slope and/or cross-slope
increase. The relative magnitudes of the coefficients suggest that the effect of the primary slope
is larger than that of the cross-slope. The variable of distance traversed was statistically
insignificant, suggesting that heart rates may have stabilized before the completion of most – if
not all – of the sections. Due to its insignificance, it was removed from the final regression
model (whose results are shown here).
Among individual-specific variables, the negative coefficient of gender suggests that a male
will feel more comfortable crossing a sidewalk section than will a female. The mobility aid
variable has positive effects, suggesting that traversing sidewalks will be more difficult for
people with manual wheelchairs than for people with this model’s default mobility aid type –
cane/crutch. This implication is different from the result of the WLS model, where cane/crutch
users experienced greater heart-rate increases. All things considered, a user’s honest perception
is probably a more reliable indicator of sidewalk accessibility than heart rate, so one may choose
to conclude that manual wheelchair users are the design population for sidewalk cross-slope
policy. Moreover, an anonymous reviewer of this work noted that cane/crutch users exhibit very
high heart rates during sidewalk ambulation of any kind. Thus, these users’ heart-rate results are
likely to be distinctive, particularly at low levels of cross-slope and grade; and the apparent
differences in heart-rate and perception results suggested here are probably not contradictory but,
rather, expected.

Kockelman, et al 15
4. MODEL APPLICATION
4.1 WLS Model Application
The WLS regression model can be used to estimate average heart rate changes for sidewalk
users with different disabilities as a function of cross-slope. Since heart rate changes are highly
related to energy consumption and therefore indicate the difficulty that people with mobility
impairments will face, a maximum desirable cross-slope may be estimated by assuming some
critical heart rate change. While there is no medically proven method for determining this critical
range, the accepted method of ascertaining the maximum heart rate for able-bodied individuals is
the following (12, 16):
ageRateHeartMaxMale
ageRateHeartMaxFemale
−=−=
220:
226:(10)
The heart rate target zone for physical training is defined as between 60% and 80% of one’s
maximum heart rate (12, 13).4 Based on the test sample (age and resting heart rate) and using
80% of the age-adjusted maximum heart rate as the critical upper level of heart rate change, the
average critical heart rate change – as a response to traversing varying cross-slopes – is about
75%. Similarly, use of 75% of the maximum heart rate as the critical upper level results in an
average critical heart rate change of about 60% for the test-sample subjects.
Table 5 illustrates several different cases that were calculated by inputting these 75% and
60% heart rate changes. As Case 8 illustrates, for a person who uses a cane or a crutch, who is in
the middle category of physical fitness, and who traverses a 15 m (50 ft) sidewalk section with a
5% primary slope, the critical cross-slope is about 5.3%. This percentage is greater than that of
the current ADAAG requirement. If the sidewalk section is as long as 45 m (150 ft), the

Kockelman, et al 16
maximum cross-slope for a manual wheelchair user in the middle fitness category is estimated to
be 8.5%.
Two points bear mention here; these have to do with choice of an acceptable threshold for
heart-rate changes and the heart-rate response of the population of interest. While 75% may be
an acceptable target zone for training or exercise, it may be higher than acceptable for persons
negotiating sidewalks simply for reasons of access to activities and services. Additionally, the
heart-rate responses of persons with mobility impairments may be very different from those of
others. An anonymous reviewer suggests that such persons’ responses tend to be high even at
low levels of cross-slope and grade. Strong evidence for use of a specific threshold is not
available to the authors, so 75% was used here. However, a different threshold can be used.
Given such a number, this work illustrates application of a valuable methodology for assessing
critical design features.
Table 5: Case Study Using the WLS Model Results
Variables Case 1 Case 2 Case 3 Case 4 Case 5 Case 6 Case 7 Case 8Primary slope (%) 0 5 0 5 0 5 0 5Distance 15 m 15 m 30 m 30 m 45 m 45 m 15 m 15 mPhysical fitness level (3 = “average shape”)
3 3 3 3 3 3 3 3
Power wheelchair 0 0 0 0 0 0 0 0Manual wheelchair 1 1 1 1 1 1 0 0Cane or crutch 0 0 0 0 0 0 1 1Scooter 0 0 0 0 0 0 0 0Critical cross-slope (%) 25.7 23.6 18.1 16.0 10.5 8.5 7.4 5.3
When researching sidewalk accessibility issues, it may be most appropriate to consider those
who face the greatest difficulty navigating, who use a specific aid on a consistent, long-term
basis, and who desire to use sidewalks most regularly. Some anecdotal and analytical evidence
suggests that manual wheelchair users may best fit this description.5 However, different

Kockelman, et al 17
disabilities may engender different thresholds and responses to distinct variations in design. For
example, cane and crutch users may be particularly conscious of travel distances while
wheelchair users may be more sensitive to main grades. More information is needed on these
topics.
4.2 ORDERED PROBIT MODEL APPLICATION
The ordered-response model of sidewalk assessments can be used to examine how changes in
sidewalk facility characteristics impact sidewalk users with disabilities. This section
demonstrates the application of the model by estimating the maximum cross-slope that can be
applied to sidewalk construction standards with regard to people with mobility impairments.
Assuming that the critical slope can be calculated as a threshold measurement at which no
more than 20% of sidewalk users with disabilities will feel that the section is difficult to cross,
inputting different personal and facility characteristics yields maximum cross-slope values for
each situation. For example, using both gender variables and sidewalk primary slopes of 0% and
5% – and assuming sample-average values for other variables, eight cases can be calculated.
Table 6: Case Study Using the Ordered Probit Model Results
Variables Case 1 Case 2 Case 3 Case 4 Case 5 Case 6 Case 7 Case 8Primary Slope (%) 0 5 0 5 0 5 0 5Age 30 30 40 40 50 50 60 60Gender Female Female Female Female Female Female Female FemalePhysical Fitness Level (3 = “average shape”)
3 3 3 3 3 3 3 3
Manual wheelchair 1 1 1 1 1 1 1 1Cane & Crutch 0 0 0 0 0 0 0 0Cross-slope (%) 14.3 7.4 12.1 5.3 10.4 3.6 9.0 2.2
These results suggest that the critical cross-slope for 60 year-old manual wheelchair users is
about 2.2% when the primary slope of the sidewalk is about 5%, and 9% when the main grade of
Kockelman, et al 18
the sidewalk is 0%. Considering that the average age of the test sample is 40 years (with
standard deviation about 10), the resulting critical cross-slopes for 0% and 5% main grades are
12.1% and 5.3% respectively. These thresholds are significantly higher than the ADAAG cross-
slope standard of two-percent. Moreover, an assumption of the disability being cane or crutch
would further raise the critical levels of cross-sloping, according to this model.
5. SUMMARY AND CONCLUSIONS
This research illustrates the use of two statistical methods for assessing the accessibility of
different sidewalk designs for persons with disabilities. The findings are preliminary, but they
do suggest that an ADA-based 2% maximum cross-slope may be too conservative for most
disabled users, particularly in relatively short sections where terrain and/or other conditions do
not permit such gradual slopes. In determining whether to adhere to the two-percent maximum
cross-slope requirement under unfavorable site conditions, transportation agencies may face a
trade-off involving risk of costly lawsuits. However, liability should be low when travelways are
designed and constructed according to guidance that is based on solid scientific research.
Supporting research into sidewalk cross-slope accessibility demonstrates a “good faith effort” on
the agencies’ part, and should offer some protection against legal liability (15).
The experimental research detailed in this paper was conducted in order to estimate maximum
and desirable limits for sidewalk cross-slope at driveway crossings. Research was conducted
using weighted least square regression of disabled-user heart-rate data and an ordered-probit
model for response to sidewalk characteristics; and, as illustrated, the results of these models
permit estimation of maximum sidewalk cross-slopes for specific user cases and are consistent
with the intent and spirit of ADA.

Kockelman, et al 19
Persons using different types of mobility aids and having different levels of functional ability
are capable of traversing a range of cross-slopes. While many of those with disabilities who were
sampled here are able to traverse sidewalks having up to a 20% cross-slope, many are not. In
recognition of the trade-off between construction feasibility and user comfort, a ten-percent
maximum cross-slope may be recommended, based on this research. Such a slope is estimated
to preclude the use of those who describe themselves as being in very poor physical shape.
However, anecdotal evidence gathered in this study suggests that persons in this category either
do not rely on sidewalks to meet their daily travel needs or do not normally rely on their own
propulsion when traveling on sidewalks. In order to accommodate the largest number of
possible users, a four-percent maximum cross-slope is recommended6. Where a 4% maximum is
not feasible and the primary slope is less than 5%, a 10% maximum cross-slope appears to be
very reasonable.
In addition to maximum accessible cross-slopes, this research also yields design guidelines.
As illustrated by the ordered-probit model results (Table 4), the most easily accessible sidewalks
are those where cross-slope is minimized, and width is maximized. The demonstrated
relationship between the increase in heart rate and the increase in cross-slope further supports
this recommendation (Table 3). Because of sample-size limitations and other experimental
issues, this work may be viewed as a prototype. Larger sample sizes, longer heart-rate tests, and
a stronger recognition of the population of interest are necessary before definitive, legislated
maxima can be ascertained. However, the models and methods applied should be of significant
use to the rehabilitative research and development community.

Kockelman, et al 20
ACKNOWLEDGEMENTS
This research was sponsored by and performed in cooperation with the Texas Department of
Transportation (TxDOT). The authors thank Fred Woodall, Robert Kovar, members of
TxDOT’s Project Monitoring Committee, Dean Taylor, Austin’s Capital Metro, the comments of
an anonymous reviewer, and the federal Access Board for their contributions to this work.

Kockelman, et al 21
ENDNOTES
1 It should be noted that the geometry of assistive devices can significantly impact a user’s response. For example,the location of rear wheels relative to the user’s center of gravity will affect turn tendency on cross slopes. Thelength and fit of crutches and canes also varies across users, and can impact exertion levels and response. However,none of these details were measured or controlled for in the experiments run here. With larger samples, suchinformation could be accommodated explicitly.2 Fifteen sections of actual, street-adjacent sidewalks were selected to compose just over half of the perceptionsurvey sites. These sections provided grades ranging from zero to seven percent, cross slopes between one andtwelve percent, sidewalk widths between four and 16 feet, lengths between 12 and 120 feet, and setbacks (from thestreet edge) between zero and 50 feet.3 The selected location for almost just under half of the perception survey sites and all of the heart-rate surveys wasa church parking lot. This was chosen for its convenience for participants (adjacency to a perception survey site andproximity to many participants' residences) and its provision of variety in grades and cross slopes. The parkingarea's thirteen constant-condition test sections provided an average grade of three percent, an average cross-slope of3.6 percent, and an average distance of 196 feet.4 These heart-rate equations may not be highly reliable for individuals with physical disabilities or those performingspecial tasks (for example, significant arm exercise in the propulsion of manual wheelchairs). Ideally, peak heartrates for individual participants may be predicted by collecting individuals’ heart-rate data across a series of work-load tests. These values could then be used to more reliably ascertain critical heart-rate levels and changes.5 The crutch user in this survey commented that she would be obtaining a prosthetic device in the near future andwould then no longer use crutches. Another respondent, who would fall into the NHIS crutch and cane category,explained that he uses a cane occasionally, but prefers to go without it. And, as indicated in Table 4, the perceptionsurveys suggest that manual wheelchair users have the most difficulties navigating sidewalks.6 Construction tolerances are important for the placement of sidewalks with specified cross-slopes. For example, ifvariations due to imperfect construction practices indicate that a four-percent design specification can become a six-percent in-place slope, engineers and planners may do well to specify something less than the maximum permittedto better ensure that actual construction delivers accessible sidewalks, even in the presence of practical variations.

Kockelman, et al 1
REFERENCES
1. Access Board. Americans with Disabilities Act (ADA)Accessibility Guidelines for Buildings
and Facilities; State and Local Government Facilities. Interim final rule. U.S. Architectural
and Transportation Barriers Compliance Board, Washington, D.C., 59 FR 31676, June 20,
1994.
2. Taylor, D. , K. Kockelman, L. Heard, B. Taylor, and Y. Zhao. A Review of Methods for
Meeting the American with Disabilities Act Sidewalk Cross-Slope Requirement, Center for
Transportation Research, The University of Texas at Austin, for the Texas Department of
Transportation, 1999.
3. Chesney, D. A. and P. W. Axelson. Preliminary Test Method for the Determination of
Surface Firmness. IEEE Transactions on Rehabilitation Engineering, Vol. 4(3), 1996, pp.
182-187.
4. Cooper, R. A. Racing Wheelchair Crown Compensation. Journal of Rehabilitation Research
and Development, Vol. 26(1), 1989, pp. 25-32.
5. Kinney v. Yerusalim [CA 3 1993], cert. Denied, Hoskins v. Kinney, No. 93-1439 [US SupCt
4/18/94]; Helen L. v. DiDario [CA3 1995]; and L.C. v. Olmstead, No. 1:95-CV-1210-MHS
[DC NGa 3/26/97].
6. Axelson, P., J. Kirschbaum, and K. Wong. Access for Everyone: Meeting the ADA.
Conference Proceedings – Pro Bike Pro Walk 98, Bicycle Federation of America,
Washington, D.C. 1998, pp. 181-185.
7. Oberhofer, W., and J. Kmenta . A General Procedure for Obtaining Maximum Likelihood
Estimates in Generalized Regression Models. Econometrica. Vol. 42, 1974, pp. 579-590.

Kockelman, et al 2
8. McKelvey, R. D. and W. Zavoina. A Statistical Model for the Analysis of Ordinal Level
Dependent Variables. Journal of Mathematical Sociology, Vol. 4, 1975, pp.103-120 (7).
9. Maddala, G. S., Limited-Dependent and Qualitative Variables in Econometrics. 1983, New
York: McGraw-Hill.
10. National Center for Health Statistics. 1990 National Health Interview Survey [CD-Rom
Series 10, No.4]. 1993, Hyattsville, MD: Public Health Service.
11. Jones, M.L. and Sanford, J.A. People with Mobility Impairments in the United States Today
and in 2010. Assistive Technology, 1997, pp. 45-47.
12. Kirkpatrick, Beth and Burton H. Birnbaum. Lessons from the Heart: Individualizing Physical
Education with Heart Rate Monitors. 1997, Champaign, Illinois: Human Kinetics.
13. American College of Sports Medicine. ACSM’s Resource Manual for Guidelines for
Exercise Testing and Prescription, Third Edition. 1998, Baltimore: Williams and Wilkins.
14. Astrand, Per-Olof and Kaare Rodahl. Textbook of Work Physiology. 1970, New York:
McGraw-Hill.
15. Miller v. City of Johnson City, Tenn. [DC ETenn 1996]
16. Chilton, Lee, MD. Personal interview. July 23, 1999.