mejora de olivo para adaptación a diferentes condiciones
TRANSCRIPT
Programa de Doctorado en Ingeniería Agraria, Alimentaria,
Forestal y de Desarrollo Rural Sostenible
TESIS DOCTORAL
Mejora de olivo para adaptación a diferentes condiciones ambientales y sistemas de cultivo.
Olive tree breeding for adaptation to different
environmental conditions and growing systems.
Autor
Jose Francisco Navas López
Director
Dr. Raúl de la Rosa Navarro
Codirector
Dr. Lorenzo León Moreno
Área de Mejora Vegetal
Diciembre de 2019

TITULO: MEJORA DE OLIVO PARA ADAPTACIÓN A DIFERENTESCONDICIONES AMBIENTALES Y SISTEMAS DE CULTIVO
AUTOR: José Francisco Navas López
© Edita: UCOPress. 2020 Campus de RabanalesCtra. Nacional IV, Km. 396 A14071 Córdoba
https://www.uco.es/ucopress/index.php/es/[email protected]


TÍTULO DE LA TESIS: Mejora de Olivo para Adaptación a Diferentes Condiciones Ambientales y Sistemas de Cultivo. DOCTORANDO/A: Jose Francisco Navas López
INFORME RAZONADO DEL/DE LOS DIRECTOR/ES DE LA TESIS (se hará mención a la evolución y desarrollo de la tesis, así como a trabajos y publicaciones derivados de la misma).
La presente Tesis se ha desarrollado en el marco de una serie de ensayos comparativos
de olivo establecidos en distintas condiciones climáticas de Andalucía. La evaluación
agronómica, realizada de manera eficiente por el Tesinando, ha permitido recabar
información sobre la interacción entre genotipo y ambiente para diversos caracteres de
gran interés en olivo. Estos caracteres incluyen la fenología de floración, el patrón de
acumulación de aceite y características de fruto, además del análisis de la mayoría de los
componentes principales del aceite. Para la determinación de los componentes del aceite
se han utilizado técnicas analíticas de evaluación directa de la pulpa de la aceituna, sin
necesidad de extraer el aceite. Estas técnicas han permitido el análisis rápido de un gran
número de muestras.
Dicha información sobre interacción entre genotipo y ambiente, muy escasa en la
literatura previa, será de gran interés para mejorar la eficiencia del programa de mejora
de olivo del IFAPA, en la que se enmarca esta Tesis.
El Tesinando ha mostrado gran capacidad de trabajo en la toma de datos en campo y el
análisis de muestras en laboratorio. También destaca su capacidad para aprender técnicas
estadísticas que le han permitido analizar de una forma muy minuciosa todos los
componentes de la interacción entre genotipo y ambiente.
Publicaciones en revistas ISI elaborados durante el periodo de tesis doctoral y
directamente relacionados con el contenido de la tesis:
Navas-Lopez, J. F., León, L., Rapoport, H. F., Moreno-Alías, I., Lorite, I. J., & de la
Rosa, R. (2019b). Genotype, environment and their interaction effects on olive tree
flowering phenology and flower quality. Euphytica, 215(11), 184.
Navas-Lopez, J. F., León, L., Trentacoste, E. R., & de la Rosa, R. (2019a). Multi-
environment evaluation of oil accumulation pattern parameters in olive. Plant Physiology
and Biochemistry, 139, 485-494.
Navas-Lopez, J. F., Cano, J., de la Rosa, R., Velasco, L., León, L. Genotype by
environment interaction for oil quality components in olive. European Journal of
Agronomy. En revisión.
Aportaciones a congresos nacionales e internacionales
J.F. Navas-López (2016). Pautas de acumulación de aceite en variedades y selecciones
de mejora de olivo en Andalucía. I Congreso Ibérico de Olivicultura (SECH). Badajoz,
Spain. Participación oral.
J.F. Navas-López (2017). Flowering phenology and flower quality of three cultivars
('Arbequina', 'Koroneiki' and 'Picual') in different environment of the Southern Spain.
Palermo, Italy. Participación oral.
J.F. Navas-López (2017). Genetic and Environmental Influence and Interaction on
Flower Quality in Three Olive Tree Cultivars. East Malling, United Kingdom.
Participación Póster.
J.F. Navas-López (2017). Genotype-environment interaction in olive. Workshop
Adaptación varietal y cambio climático en olivo: del reposo invernal a la floración.
Universidad de Baeza, Jaén, España. Participación oral.
J.F. Navas-López (2017). Evaluación de la influencia genética y ambiental en la calidad
de flor de tres variedades comerciales. Expoliva. Jaén, España. Participación póster.
J.F. Navas-López (2018). Evaluación de caracteres de la copa de olivo en ensayos de
mejora mediante imagen de alta resolución y métodos 3D de foto-reconstrucción. Lugo,
España. Participación póster.
J.F. Navas-López (2019). Evaluación de caracteres de la copa de olivo en ensayos de
mejora mediante imagen del alta resolución y métodos 3D de foto-reconstrucción.
Expoliva. Jaén. Participación póster.
Otras aportaciones
Navas-López, J. F., León, L., Rapoport, H. F., Moreno-Alías, I., Medina, M. G., Santos,
C., ... & de la Rosa, R. (2017, June). Flowering phenology and flower quality of cultivars
‘Arbequina’, ‘Koroneiki’ and ‘Picual’ in different environments of southern Spain.
In International Symposium on Flowering, Fruit Set and Alternate Bearing 1229 (pp.
257-262).
Darbyshire, R., Navas-López, J.F., Song, X., Wenden, B., Close, D. Modelling cherry
bloom using ‘space-for-time’ across climatically diverse growing environments.
Agricultural and Forest Meteorology. En revision.

Por todo ello, se autoriza la presentación de la tesis doctoral.
Córdoba, 19 de noviembre de 2019
Firma del/de los director/es
Fdo.: Raúl de la Rosa Navarro Fdo.: Lorenzo León Moreno

Financiación
Esta Tesis Doctoral ha sido realizada gracias a la ayuda otorgada al doctorando por el
subprograma del Instituto Nacional de Investigación y Tecnología Agraria y Alimentaria
(INIA) de Formación de Personal Investigador (FPI-INIA) del Ministerio de Economía y
Competitividad de España. Resolución BOE del 11 de abril de 2014.
Los trabajos experimentales realizados en la Tesis Doctoral han sido financiados por el
proyecto de investigación del INIA “Control del vigor en olivar en seto por mejora
genética” (RTA2012-00018-C02-01). También han sido parcialmente financiados por 3
proyectos de investigación del Instituto de Investigación y Formación Agraria y Pesquera
(IFAPA): AVA201601.2, AVA2019.027 y “Transferencia de Tecnología y Cooperación
en Olivar y Aceite de oliva (TRA201600.2), todos ellos financiados por fondos FEADER
de la Unión Europea.

Agradecimientos El hacer abre cien puertas, y el mal agradecer las cierra, por lo que me gustaría agradecer
este trabajo a:
Mis directores de tesis Raúl de la Rosa y Lorenzo León, que me han mostrado que la
investigación puede ser solapada con la vida social y familiar. Además, me han enseñado
la importancia agronómica del olivo observado desde la investigación, ya que el punto de
vista del agricultor ya la había conocido antes en las Sierras Subbéticas. Agradecerles
también la libertad que me han dado para buscar información, para pelearme con los
análisis estadísticos y para escribir, con diferencia la parte más oscura. Esto me ha hecho
crecer en todas las facetas, al llegar a conseguir ser autosuficiente y autodidacta. La
tranquilidad y el buen hacer de Raúl me ha enseñado a quitarle importancia a las cosas y
a priorizar lo verdaderamente útil. La rigurosidad y la seriedad en la investigación es lo
que destaca de Lorenzo, aunque siempre hace hueco y se apunta a un bombardeo. Ahora
voy a contra una anécdota; muchas veces, entre comidas o cervezas, aparece el tema
directores de tesis y sus quehaceres, y casi siempre me mantenía en silencio para no hacer
más mala sangre a mis semejantes. He tenido mucha, pero que mucha suerte de que
vosotros dos hayáis sido mis directores.
Agradecer también a los que han sido los pilares de este trabajo, que, aunque la elección
de objetivos es importante, más importante es luego poder llevarlos a cabo, y sin ellos,
Rosa, Mamen y Pablo, no lo hubiese conseguido. Rosa en el laboratorio es jefa y sabe,
como una madre en su casa, donde estaba cada objeto, aunque tu lo hubieses cambiado
de sitio, ella al terminar la jornada lo dejaba donde debía de estar. Es trabajadora,
incansable y protocolaría, su organización es digna de estudiar para futura generaciones.
Mamen, por su lado, es entusiasta, tiene garra y le pone nervio al asunto, no es nadie ella!.
Ambas se complementan para llegar a trabajar como un reloj suizo, precisas y
coordinadas para manejarse con lo que le echen. Por último, se encuentra el díscolo de la
relación a tres, Pablo, al que poco o nada le gusta el laboratorio y si entra causa confusión.
Pero en el campo y de viaje a sido mi mejor compañero, siempre dispuesto a todo para
borrarse de trabajos del lab. Entre historias, fabulas y cuentos fantásticos hemos vivido
muchos momentos recogiendo muestras y tomando datos. Gracias a los tres, que, aunque

no os lo creáis, la complementación de vuestro trío ha sido perfecto para conseguir este
trabajo.
Agradecer también a todos los compañeros que han estado durante estos cinco años en
las comidas del jardín, en las cervezas de las terracitas de los bares, en las discotecas,
pubs y en todas las actividades sociales. Como comprenderéis en la ciencia la estabilidad
brilla por su ausencia y he tenido que ver pasar mucha gente, por lo que no podría
nombrarlos a todos. Algunos de ellos si han podido estar conmigo durante la mayor parte
de la tesis, ya que empezaron al mismo tiempo que yo o han sido afortunados de tener un
contrato (no como doctores, eso es como decir que existen los unicornios). Manolillo,
Alvarito, Lola, Largo, David, todos ellos del CSIC-IAS, muchas gracias por cruzaros en
mi camino y hacerme este tiempo mucho mas ameno y feliz. También a Alicia, esta sí es
del IFAPA, compañera de despacho y, de dudas y preguntas. Miles de batallas legales
hemos tenido con la administración, pero si estoy aquí es por que hemos ganado la
mayoría. Gracias por hacerme las horas de despacho mas agradables, creía que la única
compañía en el despacho iba a ser yo mismo.
No todo en la tesis es tomar datos, analizarlos y presentarlos mediante artículo científicos
en revistas por encima de la Q4, sino que también te puede dar tiempo a conocer a tu
futura compañera de vida. Gracias Mari por aparecer y mantenerte a mi lado todo este
tiempo, además de hacerme ver el mundo desde el punto de vista de un ingeniero. Espero
que ahora que empieza lo bueno sigamos investigando juntos en buenos centros de
investigación, eso sí, hay que mentalizarse que tiene que ser en el extranjero.
Finalmente, gracias a la familia por estar ahí siempre, sin esta parte tan importante no
hubiese sido tan fácil hacer esto. También a todos los amigos del pueblo, que me han
demostrado que siempre puedes contar con ellos para cualquier cosa aún no viviendo el
día a día juntos.

i
Tabla de contenidos
Tabla de contenidos............................................................................................................................................. i
Resumen.................................................................................................................................................................. ii
Summary................................................................................................................................................................ iv
Capítulo 1: Introducción General................................................................................................................. 1
1.1. El olivo y su confinamiento geográfico........................................................................................................... 2
1.2. Expansión del olivo y principales problemas................................................................................................. 3
1.3. Interacción genotipo x ambiente, estabilidad y adaptabilidad..................................................................... 5
1.4. Programa de mejora y su etapa final ensayos multi-ambiente..................................................................... 6
1.5. Hipótesis y objetivos.......................................................................................................................................... 9
Capítulo 2: Genotype, Environment and their Interaction Effects on Olive Tree Flowering
Phenology and Flower Quality....................................................................................................................... 10
2.1. Summary............................................................................................................................................................. 11
Capítulo 3: Multi-environment Evaluation of Oil Accumulation Pattern Parameters in olive ...................................................................................................................................................................................... 12
3.1. Summary............................................................................................................................................................. 13
Capítulo 4: Genotype by Environment Interaction for Oil Quality Components in Olive
Tree............................................................................................................................................................................ 14
4.1. Summary............................................................................................................................................................. 15
Keywords................................................................................................................................................................... 15
4.2. Introduction........................................................................................................................................................ 15
4.3. Material and Methods....................................................................................................................................... 17 4.3.1. Experimental Sites and Plant Material................................................................................................ 17 4.3.2. Olive Oil Quantification...................................................................................................................... 18 4.3.3. Olive Oil Components Analysis.......................................................................................................... 18 4.3.4. Data Analysis...................................................................................................................................... 19 4.4. Results................................................................................................................................................................. 20 4.4.1. Factors Affecting Olive Oil Quality Traits.......................................................................................... 20 4.4.1.1. Olive oil content on dry weight basis................................................................................ 20 4.4.1.2. Fatty acids composition.................................................................................................... 20 4.4.1.3. Minor components........................................................................................................... 24 4.4.2. Relationship between Olive Oil Components and Discrimination Between Monovarietal Olive Oil 29
4.5. Discussion........................................................................................................................................................... 32 4.5.1. Variability Factors for Olive Oil Quality............................................................................................. 33 4.5.2. Relationships between Olive Oil Components.................................................................................... 35 4.6. Conclusions........................................................................................................................................................ 35
Acknowledgments.................................................................................................................................................... 36
Capítulo 5: Conclusiones generales............................................................................................................. 37
Bibliografía............................................................................................................................................................ 40

ii
Resumen
1. Introducción
Desde hace décadas, el cultivo del olivo se ha visto expuesto a una expansión
globalizada debido principalmente a la alta rentabilidad conseguida por los nuevos
sistemas de cultivo y a la gran importancia nutricional y saludable descrita para el aceite
de oliva virgen extra. Variedades tradicionales ha sido utilizadas para ser plantadas en
estas nuevas zonas, tanto en países donde el olivo no existía (China o Australia) como en
ambientes de países productores donde el olivo no era un cultivo muy extendido. Algunas
de estas variedades tradicionales, al plantarlas fuera de su zona de origen, han mostrado
serios problemas en alguna de sus etapas productivas. Esto ha hecho que el cultivo tenga
perdidas significativas de rendimiento debido a ausencia de floración (Argentina) o a
defectos en el aceite debido a las condiciones ambientales (Australia). Todo ello se debe,
en parte, a que no existen trabajos sistemáticos para determinar la influencia de distintas
condiciones ambientales en las variedades de olivo más cultivadas. Por ello, la evaluación
de la interacción genotipo x ambiente en dichos caracteres es esencial para responder a
estas incógnitas y ayudará a predecir el comportamiento del cultivo ante los efectos del
cambio climático. Además, esta evaluación es de vital importancia para definir las
mejores estrategias de selección en programas de mejora de olivo.
2. Contenido de la investigación
Las observaciones y toma de datos de los caracteres evaluados en esta tesis
doctoral fueron llevados a cabo durante dos años (2015 y 2016) usando un ensayo multi-
ambiente plantado en el 2006 por el IFAPA. Este ensayo esta plantado en cinco ambientes
(Antequera, Baena, Gibraleón, Tabernas y Úbeda) y, constituido por un grupo de
variedades tradicionales (‘Arbequina’, ‘Arbosana’, ‘Carrasqueño’, ‘Changlot real’,
‘Frantoio’, ‘Koroneiki’, ‘Ocal’ y ‘Picual’) y de selecciones de mejora (‘Selección 1’ y
‘Selección 2’, del programa de mejora en olivo UCO-IFAPA). En cada ambiente, las
variedades estaban distribuidas en un diseño en bloques al azar. El primer carácter
observado fue la floración, donde fenología de floración y calidad de flor fueron
evaluadas. Se concluyó que para la fenología de floración el genotipo y la interacción
muestran poca contribución, siendo el factor determinante el ambiente. La calidad de flor,
por el contrario, si mostró una elevada influencia genética, destacando ‘Arbequina’ como
una variedad con alta calidad de flor independiente de donde sea plantada. El siguiente

iii
carácter evaluado fue el patrón de acumulación de aceite, medido en proporción al peso
seco en del fruto. Se distinguieron tres parámetros: pendiente de acumulación, máximo
aceite acumulado y fecha en la que ese máximo fue alcanzado. La pendiente de
acumulación y el máximo aceite acumulado mostraron una contribución similar de la
varianza del genotipo, el ambiente y de su interacción. Para ambos parámetros, la
‘Selección 2’ mostró alta estabilidad, la cual también alcanzó el mayor valor para el
máximo aceite acumulado. Sin embargo, la fecha en la que el máximo es obtenido fue un
parámetro totalmente influenciado por el ambiente, señalando que la fecha de llegada al
máximo acumulado es similar en todas las variedades para un ambiente dado. Finalmente,
el último carácter observado en esta tesis doctoral fue la calidad del aceite de las diferentes
variedades evaluadas. Todos los parámetros observados (ácidos grasos, tocoferoles,
fitosteroles y esqualeno) mostraron una significativa interacción genotipo x ambiente. Por
tanto, cada variedad tuvo un comportamiento diferencial según el ambiente en el que
estaba plantada. ‘Selección 2’ fue el genotipo que destacó con alta estabilidad en la
mayoría de los componentes observados, siendo ‘Arbequina’ la más inestable con valores
de ácidos grasos cercanos a los límites inferiores marcados por el Consejo Oleico
Internacional en algunos ambientes.
3. Conclusión
Se observó que la mayoría de los caracteres de interés agronómico evaluados en
esta tesis doctoral mostraron una significativa interacción genotipo x ambiente. Ello
indica que el uso de ensayos multi-ambiente para evaluar la interacción genotipo x
ambiente en el olivo es conveniente para seleccionar de manera más precisa las
variedades (tanto tradicionales como generadas por programas de mejora) más adecuadas
para un ambiente dado o estables entre ambientes. Además, este tipo de ensayos dará la
oportunidad de identificar los mejores ambientes para el cultivo del olivo ante las posibles
variaciones producidas por los efectos del cambio climático.

iv
Summary
1. Introduction
In the las decades, el olive growing has been expanded around de world due
principally to the high profitability obtained by the new growing systems and to the
nutritional and healthy characteristics showed by the extra virgin olive oil. Traditional
cultivars have been used to be planted in these new cultivation areas. However, no
previous analysis of the olive behavior on those new climates has been performed. In
fact, some of these cultivars have showed significant anomalies on the productive
behavior. For example, a great yield loss as been observed in Argentina due to lack of
flowering and very low olive oil quality has been obtained in Australia due to the climatic
conditions. All this is partly due to the fact that there is no previous reports on the
influence of different climatic conditions on the behavior of the most popular cultivars.
Therefore, the evaluation of the genotype x environment interaction is essential to
determine the adaptation of the cultivars to different environments and to predict the
olive tree behavior under the climate change effects. Besides this genotype x
environment evaluation is of paramount importance to develop efficient selection
strategies in olive breeding programs.
2. Research content
This PhD was based on a multi-environment trail planted in 2006 by IFAPA and
that was evaluated for several agronomic traits for two years (2015 and 2016). This trial
is planted in five different environments (Antequera, Baena, Gibraleón, Tabernas y
Úbeda), using traditional cultivars (‘Arbequina’, ‘Arbosana’, ‘Carrasqueño’, ‘Changlot
real’, ‘Frantoio’, ‘Koroneiki’, ‘Ocal’ y ‘Picual’) as well as two breeding selections
(‘Selection 1’ and ‘Selection 2’) from the olive breeding program UCO-IFAPA. The first
character considered was flowering, in which flowering phenology and flower quality
were evaluated. Flowering phenology showed little genotype and interaction
contribution, being the environment only factor with significant influence. For flower
quality, genotype and genotype x environment interaction were highly significant,
pointing ‘Arbequina’ out as a cultivar with high flower quality across environments. The
second character evaluated on the above mentioned multi-environment trial was the olive
oil accumulation pattern in fruit dry weight. Three parameters were evaluated: rate of oil

v
accumulation, maximum oil content reached and date of maximum oil reached. Rate of
oil accumulation and maximum oil content reached showed similar genotype,
environment and interaction contribution. High stability for both parameters was showed
for ‘Selection 2’, which also obtained the highest maximum oil accumulated. However,
date of maximum oil reached only showed a significance influence of environment.
Therefore, all genotypes reached their maximum oil content in each environment in
similar dates. Finally, the last character described in this PhD thesis was the olive oil
quality. All components observed (fatty acids, tocopherols, phytosterols and squalene)
showed significant genotype x environment interaction. ‘Selection 2’ was the genotype
with higher stability for the most of olive oil components observed, being ‘Arbequina’
the cultivar having the most unstable olive oil, with fatty acid levels close to the lower
limit set by the International Olive Council in some the environments here evaluated.
3. Conclusion
Most of olive tree characters here evaluated showed significant genotype x
environments interaction. Therefore, it is advisable to use multi-environment trials in
order to evaluate this interaction and, therefore, to accurately select the best genotypes
for a given environment or those stable across environments. Besides, this kind of trials
will also offer the opportunity to identify the best environments considering the possible
variations due to the climatic change effects.


1
Capítulo 1:
Introducción General

- 2 -
Capítulo 1. Introducción General
1.1. El olivo y su confinamiento geográfico
El olivo (Olea europea L.) es un cultivo tradicional de la cuenca del Mediterráneo,
donde fue originado entre 3500 – 4000 a. C. al norte del mar Muerto. Su expansión de
oriente a occidente, recorriendo todo el Mediterráneo, fue principalmente causada por el
tránsito de las civilizaciones y el aprendizaje de la propagación vegetativa. Con esta
técnica se pudo conseguir multiplicar rápidamente un genotipo deseado para fijar un
fenotipo de interés (Kaniewski et al. 2012). Esto conllevó a una rápida aparición de
variedades de olivo por todo el Mediterráneo, seleccionadas dependiendo de las
características de interés para su propagación como tamaño del fruto, rendimiento graso
o adaptación al ambiente que le rodea. Esta última característica junto a la longevidad del
cultivo causó el confinamiento de las variedades a su zona de origen, siendo poco
difundidas y reduciendo la transferencia de sus caracteres de interés a otras zonas
geográficas a lo largo del tiempo.
El cultivo del olivo ocupa en España un total de 2,413,021 ha para aceituna de
almazara y siendo el principal productor de aceite del mundo (Figura 1.1). La mayor
extensión del cultivo se concentra en el sur de la península entre las provincias de Jaén
(24.23%), Córdoba (14.61%), Granada (8.23%) y Sevilla (7.21%) de acuerdo con
MAGRAMA (2018). En nuestro país se ha encontrado una amplia variabilidad genética,
repartida por todo el territorio, constituida por 272 variedades tradicionales catalogadas
hasta la fecha (Rallo et al. 2005). Solamente 24 de ellas se consideran variedades
principales (Barranco 2008). A pesar de esta gran variabilidad genética, pocas variedades
son las que copan la mayoría de la superficie cultivada, como es el caso de Picual y
Hojiblanca (58.6% y 17.8% de Ha cultivadas en Andalucía, respectivamente, según el
Plan Director del Olivar Andaluz). Estas variedades han mostrado un gran rendimiento y
buena adaptación en su zona de origen. Aún así, hay muy poca información sobre su
comportamiento en nuevas zonas de cultivo, ya que ambas también se encuentran hasta
la fecha delimitadas en su zona de origen (Rallo et al. 2005).

Introducción General
- 3 -
Figura 1.1. Evolución de la producción de aceituna de almazara en los principales países productores
desde la campaña 1990/91 hasta 2017. Fuente: Consejo Oleico Internacional (COI).
1.2. Expansión del olivo y principales problemas
A principios del siglo XXI el olivar de almazara sufrió una gran revolución
convirtiéndose en un cultivo altamente rentable. La transformación del cultivo ha
supuesto pasar de un olivar tradicional en secano con 70-80 árboles/ha y rentabilidad muy
baja (Duarte et al. 2008) a plantaciones más intensivas, llegando incluso a los 2000
árboles/ha, en el caso del olivar en seto (Tous et al. 2007). Esta intensificación hizo que
bajara radicalmente el coste obtención de un litro de aceite (Rallo et al. 2013), por lo que
el olivar intensivo podrá ser más competitivo en el mercado, aunque los precios del aceite
caigan. Además, hay que añadirle el gran valor añadido que aporta el aceite de oliva
virgen extra tanto a nivel nutricional como saludable (Estruch et al. 2018; Warleta et al.
2011), el cual ha hecho que aumente su consumo tanto en los países de la cuenca del
Mediterráneo como fuera según el Consejo Oleico Internacional (COI 2018) (Figura 1.2).
Este consumo de aceite en países fuera de la cuenca del Mediterráneo está incrementando
de tal medida que se acercan al consumo de los países tradicionalmente consumidores.
Entre los países que están incluyendo el aceite de oliva a su dieta se encuentran China,
Japón, Australia o Brasil.
Por estas razones, el olivo está sufrido una gran expansión alrededor el mundo.
Durante los años 90 el cultivo del olivo empezó a expandirse en Argentina, USA y
0
0.2
0.4
0.6
0.8
1
1.2
1.4
1.6
1.8
2
1990/91 1993/94 1996/97 1999/00 2002/03 2005/06 2008/09 2011/12 2014/15
Millo
nes
de
tone
ladas
España
Grecia
Italia
Turquía
Túnez
Marruecos

Capítulo 1
- 4 -
México, usando variedades tradicionales de la cuenca del Mediterráneo como
‘Arbequina’, ‘Leccino’, ‘Frantoio’ o ‘Picual’. Más recientemente el cultivo fue llevado a
países como Australia, China, Chile o Arabia Saudí (COI 2018). Todos ellos presentan
climas muy diferentes al Mediterráneo donde el olivo nunca había sido cultivado. Incluso
en España, el olivo está aumentando mucho su cultivo en zonas donde antes no tenía
mucha extensión usando variedades tradicionales con diferente sitio de origen, por
ejemplo, en zonas con influencia costera (Huelva) o desértica (Almería).
Figura 1.2. Evolución del consumo de aceite desde la campaña 1990/91 hasta 2016/17 en lo países dentro
y fuera de la cuenca del Mediterráneo. Fuente: el Consejo Oleico Internacional (COI).
En unas pocas de estas nuevas zonas de cultivo, investigaciones previas se han
llevado a cabo para conocer el comportamiento de dichas variedades tradicionales a estos
nuevos ambientes antes de realizar grandes plantaciones (Mailer et al. 2010; Wang et al.
2018). Pero en la mayoría, el cultivo se ha realizado sin estudios previos, provocando en
algunos casos perdidas de rendimiento a gran escala. Esto es debido a que el
comportamiento mostrado por algunas de las variedades plantadas en estos nuevos
ambientes no fue del todo la esperada, con reducciones totales o parciales del rendimiento
al verse afectada alguna de las etapas de la fase productiva (Torres et al. 2017). Así, se
han observado floraciones anómalas en Argentina, donde algunas variedades como
‘Leccino’ o ‘Frantoio’ mostraron floraciones anormales con reducida calidad en todos los
años observados (Aybar et al. 2015). Otro parámetro de interés muy afectado es la calidad
de aceite. Así, en Australia, se han descrito hay algunos ambientes específicos donde es
0
0.5
1
1.5
2
2.5
1990/91 1994/95 1998/99 2002/03 2006/07 2010/11 2014/15
Consu
mo d
e ac
eite
en
mil
lones
de
tonel
adas
Paises de la
cuenca
Paises fuera de la
cuenca

Introducción General
- 5 -
imposible obtener en Arbequina un aceite de oliva virgen extra, independiente del
momento de su cosecha (Mailer et al. 2010).
Toda esta información sobre perdidas de rendimiento y de calidad en algunas
variedades de olivo plantadas en nuevas zonas geográficas pone de manifiesto la
importancia del ambiente. Por lo tanto, variaciones en el clima tradicional del olivo, el
Mediterráneo, causados por efectos del cambio climático también podría causar perdidas
en un futuro próximo. De hecho, Lionello et al. (2012) y Giorgi and Lionello et al. (2008)
han descrito que el Mediterráneo será una de las más vulnerables regiones a los
principales efectos extremos del cambio climático. Predicciones de un aumento de la
temperatura de hasta 4ºC en los meses cálidos (Giannakopoulos et al. 2009) o más
frecuencia en la aparición de periodos muy secos y olas de calor (Giorgi and Lionello
2008; Tanasijevic et al. 2014) han sido descritas para esta región, con algunos efectos
negativos sobre el olivo ya descritos (Benlloch-Gonzalez et al. 2018; Rapoport 2014).
Pero ¿Qué contribución tendrá el efecto ambiental en los principales parámetros de
rendimiento y calidad en el olivo? ¿Todas las variedades se verán afectadas por igual?
¿Habrá alguna variedad con estabilidad en el comportamiento?
1.3. Interacción genotipo x ambiente, estabilidad y adaptabilidad.
El conocimiento de la interacción genotipo x ambiente (GxA) en la agricultura
moderna es un requisito para predecir el comportamiento que tendrán los caracteres de
interés en cada genotipo ante su globalización y los efectos que podrían causar el cambio
climático. La GxA se muestra cuando un grupo de genotipos responden diferentemente a
diversos ambientes (Figura 1.3) y se considera ineludible cuando el ranking de las
genotipos se ve modificado dependiendo del ambiente (Yan and Kang 2002). Esto es
debido a que presenta un impacto negativo sobre la heredabilidad, causando una gran
dificultad en la mejora vía selección y reduciendo la correlación entre genotipo y fenotipo.
Por lo tanto, el poder de predicción sobre el comportamiento de un carácter, con una alta
GxA, será complicado.
Hay una serie herramientas estadísticas que estructuran y exploran la GxA según
las estrategias que se estén buscando. Los más utilizados actualmente son los análisis

Capítulo 1
- 6 -
multi-variantes usando biplots (Yan et al. 2007; Gauch et al. 2008). Estos métodos, son
rápidos y claros de visualización para obtener conjuntamente resultados de estabilidad y
adaptabilidad. Ambos parámetros son indispensables para la correcta interpretación de la
GxA (Yan et al. 2007). La estabilidad genotípica se describe como el nivel de constancia
de un comportamiento a través de los ambientes evaluados. En caracteres de cultivo con
GxA significativa, la exploración de la estabilidad es útil para poder identificar posibles
genotipos que mantenga un similar y alto comportamiento entre ambientes (Ebrahimi et
al. 2016; Hassani et al. 2018). Por otro lado, la adaptabilidad se describe como el
comportamiento superior de un genotipo a un ambiente especifico. Por lo que un genotipo
con poca estabilidad a través de los ambientes puede ser superior en un ambiente
específico. En este caso, es importante explorarlo tanto para incrementar más el
rendimiento en las zonas favorables de cultivo como para encontrar el genotipo más
adecuado a ambientes muy desfavorables.
Figura 1.3. Representación gráfica de ausencia (A) o presencia (B) de interacción genotipo x ambiente
1.4. Programa de mejora y su etapa final de ensayos multi-ambiente
La incesante globalización del cultivo del olivo pone de manifiesto la necesidad
de disponer de nuevas variedades, tanto genotipos obtenidos por cruzamiento y selección
como variedades tradicionales con potenciales agronómicos. Todo ello para aportar gran
variabilidad genética en cada carácter de interés como sistema de plantación, rendimiento
graso, calidad del aceite o ambientes desfavorables, y reducir las tendencias al
monocultivo.
A B
Fen
oti
po
Ambiente
NO interacción genotipo x
ambiente
Variedad 1
Variedad 2
A B
Fen
oti
po
Ambiente
Interacción genotipo x ambiente
Variedad 1
Variedad 2
A B

Introducción General
- 7 -
El primer programa de mejora en España fue iniciado en Córdoba en el año 1990
fruto de la colaboración de la UCO y el IFAPA (Rallo 1995). Sus objetivos iniciales
propuestos se centraron en acortar la fase juvenil, producción precoz, alto rendimiento
graso y alto contenido en ácido oleico. Posteriormente se incluyeron dos nuevos
objetivos, resistencia a Verticilium dahliae (Kleb.) y reducir el vigor de crecimiento
vegetativo. Para conseguirlos, los primeros cruzamientos fueron realizados usando
solamente tres genitores con características de mucho interés agronómico como son
‘Arbequina’ por su adaptación a super-intensivo, ‘Frantoio’ por alta tolerancia a
Verticilium dahliae (Kleb.), y ‘Picual’ por su alta calidad de aceite. De ello, importantes
éxitos han sido ya logrados como la obtención de una nueva variedad, ‘Sikitita’, adaptada
al novedoso sistema de cultivo super-intensivo por su reducido vigor vegetativo (Rallo et
al. 2008). Además, otras dos nuevas variedades ya han sido registradas (Sikitita 2 y
Sikitita 3) desde el mismo programa de mejora, caracterizadas también por su adaptación
al sistema super-intensivo, con alto rendimiento graso y gran calidad de aceite.
Los programas de mejora está constituidos por una serie de etapas consecutivas
(Figura 1.4), desde el cruzamiento entre progenitores potenciales hasta ensayos multi-
ambiente para observar el comportamiento de los genotipos considerados como
avanzados (León 2014). Durante la progresión de las etapas, el número de genotipos se
va reduciendo y el número de repeticiones va aumentando, siendo alrededor de 20 años
hasta alcanzar la etapa final. Por lo que la búsqueda de métodos para reducir el tiempo en
determinar los caracteres dentro del programa de mejora es esencial ante la rápida
demanda del mercado. Algunos de estos caracteres han conseguido ser determinados y
seleccionados en etapas tempranas del programa como la obtención de un corto periodo
juvenil (de la Rosa et al. 2006), o en etapas intermedias como son algunos caracteres de
productividad, vigor y calidad del aceite (Leon et al. 2015). En algunos casos esta
evaluación precoz de caracteres ha aportado información bastante precisa para descartar
y seleccionar genotipos en estas etapas tan tempranas debido a la gran variabilidad
genética que la progenie obtenida por cruzamiento (Lavee 1990; Leon et al. 2004). Sin
embargo, la mayoría de estos genotipos seleccionados siempre tienen que ser evaluados
en las etapas finales del programa, ya que en etapas tempranas las repeticiones son muy
bajas y su evaluación es poco representativa de la interacción con el ambiente (de la Rosa
et al. 2008). Por ello, la utilización de ensayos comparativos y ensayos multi-ambiente,

Capítulo 1
- 8 -
aun siendo las etapas menos usadas, siguen siendo determinantes para verificar lo
seleccionado en etapas tempranas.
Figura 1.4. Etapas del programa de mejora de olivo (León 2014).
Los ensayos multi-ambiente en los programas de mejora en olivo han sido
enmarcados como la última etapa y solamente son incluyen genotipos muy prometedores,
que ya han sido bien seleccionados (León 2014), debido a su cotoso mantenimiento y a
la laboriosa recogida de datos (Hardner et al. 2016). Aun así, este tipo de ensayos
presentan más potencial que el asignado, ya que con su uso también se podrán elegir
variedades o genotipos con alta estabilidad. Por lo tanto, puede permitir seleccionar
nuevas variedades adaptadas a condiciones ambientales variadas y otras adaptadas
específicamente a un ambiente (Yan et al. 2000). De hecho, este tipo de ensayos permite
explorar la contribución genética, ambiental y de la GxA, aún desconocidos en el olivo.
Sin embargo, a pesar de la importancia de la interacción GxA en los programas de mejora
(Yan et al. 2000), existe muy poco conocimiento sobre la misma en olivo. Por lo tanto, la
incorporación al programa de mejora de olivo de el Centro IFAPA “Alameda del Obispo”
en Córdoba, en la cual gira la presente Tesis Doctoral, el estudio de la contribución GxA,
en los objetivos principales de mejora, ayudará a escoger eficazmente los caracteres
mejorables vía selección e incrementará la capacidad de selección del programa.
La etapa de ensayos multi-ambiente propuesto para este objetivo estuvo
constituida tanto por dos selecciones de mejora (‘Selección 1’ y ‘Selección 2’) siguiendo
el esquema general de mejora como por un grupo de variedades tradicionales
(‘Arbequina’, ‘Arbosana’, ‘Carrasqueño’, ‘Changlot real’, ‘Frantoio’, ‘Koroneiki’,
‘Ocal’ y ‘Picual’) con características de interés agronómico para mejorar la variabilidad
genética del cultivo. Estas ultimas fueron previamente evaluadas en el Banco Mundial de
Año
Germinación y forzado Propagación
1 Rep. y 75 %
seleccionado
16-24 Rep. y ¿%?
Evaluación de progenies
4-8 Rep . y 5 -10 %
seleccionado
Propagación
Ensayo intermedio
Ensayo comparativo
Ensayo multi-ambiente
Propagación
¿%?
Periodo juvenil
Rendimiento graso
Arquitectura
Precocidad
Vigor
Rendimiento graso
Resistencia a Verticilosis
Características del aceite
Productividad
Características del fruto
Aptitud a la recolección
Sistema de cultivo
Calidad de aceite
Sensorial
Interacción genotipo x ambiente
?¿Evaluación
Fase

Introducción General
- 9 -
Germoplasma del Olivo (BMGO), ubicado en el IFAPA “Alámeda del Obispo” de
Córdoba. En el BMGO se conservan actualmente más de 900 variedades de 24 países
(Belaj et al. 2013), por lo cual su principal función es conservar la biodiversidad genética
del cultivo. Aunque también aporta gran cantidad de información que puede ser utilizada
para la realización de nuevos cruces con alto potencial o directamente usar nuevas
variedades tradicionales por su interés agronómico.
1.5. Hipótesis y Objetivos
El desarrollo de la presente Tesis Doctoral está enmarcado en la última etapa del
programa de mejora de olivo, basada en ensayos comparativos en diversos ambientes. En
estos ensayos se pretenden evaluar la importancia de la GxA en diversos caracteres
agronómicos que se concretan en los siguientes objetivos específicos:
• Evaluar la contribución de la influencia genética, ambiental y de su interacción en
la fenología de floración y calidad de flor en el olivo, además, estudiar la
estabilidad genotípica para dichos caracteres (Capítulo 2).
• Evaluación multi-ambiente de los parámetros del patrón de acumulación de aceite
en el olivo para observar la contribución genética, ambiental y de su interacción.
Este último mediante análisis de estabilidad y adaptabilidad genotípica. Además,
modelizar posibles factores ambientales con los parámetros de acumulación de
aceite (Capítulo 3).
• Evaluar y estructurar la interacción genotipo x ambiente para los componentes de
calidad de aceite en el olivo como son los principales ácidos grasos y los
componentes menores y buscar posibles relaciones entre las diferentes rutas
metabólicas (Capítulo 4).

Capítulo 2:
Genotype, Environment and their Interaction Effects on
Olive Tree Flowering Phenology and Flower Quality
Authored by Jose F. Navas-Lópeza, Lorenzo Leóna, Hava F. Rapoportb, Inmaculada
Moreno-Alíasb, Ignacio Loritea and Raúl de la Rosaa.
a IFAPA Centro “Alameda del Obispo”, Avda Menéndez Pidal s/n, 14004 Córdoba, Spain.
b Institute for Sustainable Agriculture, /I.A.S.) -C.S.I.C. Avda Menéndez Pidal s/n, 14004 Córdoba, Spain.
Published in Euphytica (2019). Vol. 215, no 11, p. 184. Doi: 10.1007/s10681-019-2503-5(0123456789( ) .,-volV( ) 012345678 9( ) .,-volV)

Genotype, Environment and their Interaction Effects on
Olive Tree Flowering Phenology and Flower Quality
- 11 -
2.1. Summary
Flowering is one of the most critical processes in the reproductive phenology in fruit trees
including olive. Under Mediterranean climate, olive flowering period normally occurs
from early to late spring. Therefore, flowering time could be affected by environmental
conditions such as water availability and temperature, thus influencing flower quality as
well. Previous works have demonstrated the effect of genotype and environment on olive
flowering, but those factors have never been compared in a single study nor their
interaction evaluated. In the present work, we used a multi-environment trial established
in four different agro-climatic conditions of Andalucía, Southern Spain, to test the genetic
and environmental influences on flowering timing (flowering period, full bloom period,
and full bloom date) and flower quality (flower number, perfect flower number and
perfect flower percentage). Most of the variability found for flowering phenology
parameters was due to environmental influence. On the contrary, for flowering quality
parameters, most of the variability was of a genetic nature. In all cases, the genotype-
environment interaction was significant. In this sense, the genotype by environment
effects biplot model used to analyse the interaction showed that most of the genotypes
evaluated have low stability for most of the parameters evaluated, except ‘Picual’ for
flowering phenology parameters and ‘Koroneiki’ for quality. This emphasize the benefits
of multi-environment trials on olive in order to select the best genotypes adapted to
different environments and as a tool to face the future variability of environmental
conditions caused by the climate-warming scenario. In conclusion, multi-environment
trials allowed to efficiently quantify the effects of genetic and environmental factors and
of their interaction on flowering phenology and on flower quality in olive.

Capítulo 3:
Multi-environment Evaluation of Oil Accumulation Pattern
Parameters in Olive
Authored by Jose F. Navas-Lópeza, Lorenzo Leóna, Eduardo R. Trentacosteb and Raúl
de la Rosaa.
a IFAPA Centro “Alameda del Obispo”, Avda Menéndez Pidal s/n, 14004 Córdoba, Spain.
b Estación Experimental Agropecuaria Junín (Instituto Nacional de Tecnología Agropecuaria), Mendoza,
Argentina.
Published in Plant Physiology and Biochemestry (2019). Vol. 139, p. 485-494.
Doi: 10.1016/j.plaphy.2019.04.016.

Multi-environment Evaluation of Oil Accumulation Pattern Parameters in Olive
- 13 -
3.1. Summary
The pattern of olive oil accumulation is of paramount importance in olive because its
influence in determining final oil yield and optimal harvesting date. In this work, we have
evaluated the genetic and environment influence on the olive oil accumulation pattern.
For that purpose, a set of cultivars and breeding selections planted in a multi-environment
trial was evaluated in two consecutive harvest seasons. Significant effect of the
environment, genotype and their interaction were observed for the maximum oil content
reached and the rate of oil accumulation. On the contrary, the date of maximum oil
content seems to depend only on the environment. The two breeding selections evaluated
showed, in general, high stability and adaptability in oil accumulation parameters. Among
the potential environmental factors that could affect oil accumulation, PLS analysis
suggests that temperature could play a determinant environmental effect in the oil
accumulation parameters tested in this study. These results underline the relevance of
using multi-environment trials for adequate characterization of genotypes showing either
good behaviour in variable environments or only under specific environmental
conditions.

Capítulo 4: Genotype by Environment Interaction
for Oil Quality Components in Olive Tree
Under revision in European Journal of Agronomy.

- 15 -
Capítulo 4. Genotype by Environment Interaction for Oil Quality
Components in Olive Tree
4.1. Summary
Olive oil is highly valued by its nutritious and healthy function mainly due to its chemical
composition. Oil chemical components are highly influenced by the cultivar and the
environment, resulting in some cases in levels out of the limits set by the International
Olive Council. In the present research, we used a multi-environment trial with five
different agro-climatic conditions of Andalusia to evaluate how genetic and
environmental factors and their interactions influence some of the most important olive
quality components. Most of variation for olive components according to ANOVA was
attributed to genetic effect, which was supported using principal component analysis and
linear discriminant analysis. For the fatty acids, ‘Arbequina’ showed oils with the highest
C16:0 and C18:2 values, and the lowest C18:1. Contrarily, an advanced breeding
selection, ‘Selection 2’, and ‘Picual’ showed high C18:1 and low C16:0 and C18:2. The
minor components varied depending of the genotype, underlining very high squalene
values in ‘Carrasqueño’. Even so, the environment and the G x E interactions also resulted
highly significant, with some genotype-environment combination unfavourable for oil
composition as ‘Arbequina’-Gibraleón. The significant interactions were analysed
separately by additive main effects and multiplication interaction to identify the most
stable genotypes and adaptations to specific environments. For instance, ‘Arbequina’
showed low stability for C18:1 and C18:2, but very high stability for total tocopherol
content and squalene content. These results underline the relevance of using multi-
environment trials for adequate characterization of genotypes for oil components.
Keywords: oil olive components, genetic effect, environment effect, genotype by
environment interaction, genotypic stability.
4.2. Introduction
Olive oil consumption is currently increasing around of world due to the
classification of some of its constituents as functional nutrients (Paiva-Martins 2017),

Capítulo 4
- 16 -
with outstanding nutritional and healthy properties. Those included the importance of
olive to fight against cardiovascular diseases (Estruch et al. 2018) or different types of
cancer (Warleta et al. 2011; Escrich et al. 2006). Olive oil composition, characterized by
high monounsaturated fatty acid concentration and active minor components such as
tocopherols, squalene and sterols (Boskou 2009; Covas et al. 2006), is responsible for
those medical properties. However, this olive oil composition and, hence, its healthy
properties, is greatly influenced for both genetic (Uceda et al. 2008; Beltran et al. 2016)
and environmental factors (Aguilera et al. 2005; Mailer et al. 2010). Also, the interaction
genotype by environment could cause significant variation, which is currently unknown
for the olive oil components.
High variability for oil content and composition has been reported in olive, both
in traditional cultivars (Rondanini et al. 2011; Rotondi et al. 2010; Rondanini et al. 2014;
Beltran et al. 2016; Uceda et al. 2008) and breeding selections (Leon et al. 2008; Leon et
al. 2011; Ripa 2008) as well as in wild genotypes (Leon et al. 2018). Besides, a high
heritability has been found for some olive oil quality components (de la Rosa et al. 2016;
Leon et al. 2015), which underline the importance of the genotype. This could open up
the possibility of efficiently perform breeding for improving health-related components
of olive oil (Leon et al. 2018).
The environment has been suggested to have less influence on oil composition
than the genotype (Velasco et al. 2014; Uceda et al. 2008), although significant variability
among geographical locations has been reported (Aguilera et al. 2005; Borges et al. 2017).
Even negative effects of certain climatic conditions on the olive oil quality have been
observed, especially in locations outside the Mediterranean Basin (Mailer et al. 2010;
Rondanini et al. 2011). Those negative effects have caused that some olive oil
components can reach values outside of the regulatory ranges set by the International
Olive Council (IOC) for olive oil.
Although genetic and environmental effects on olive oil quality have been largely
explored, there is limited information on the relative contribution of each factor and their
interactions (GEI) to the total variability. One useful option to efficiently quantify the
contribution of each factor and GEI is the use of multi-environment cultivar trials (S.S.
Miller et al. 2005a; Hardner et al. 2016). This is of great interest in olive, since high

Genotype by Environment Interaction for Oil
Quality Components in Olive Tree
- 17 -
environmental and GEI effects are associated with low heritability (Yan 2002; Hardner
et al. 2016) and, therefore, with low selection efficiency.
Stability and adaptability indexes are usually used to evaluate significant GEI and
to determine genotypes well adapted to specific environments (Hassani et al. 2018;
Ebrahimi et al. 2016). For that, the additive main effects and multiplicative interaction
(AMMI) model is largely used, mainly for annual crops (Ebrahimi et al. 2016; Hassani et
al. 2018), although it has also been used in olive to evaluate GEI for oil accumulation
(Navas-Lopez et al. 2019b). To the best of our knowledge, no similar studies on stability
and adaptability indexes have been conducted on olive oil quality traits. Accordingly, the
objective of this study was to determine the relative contribution of genetic and
environmental effects and GEI to the fatty acid profile of the oil and the total content and
profile of other minor quality components in olives, using multi-environment cultivar
trial. From these results, information about genotypic stability and adaptability was also
extracted with a view to select superior genotypes for these olive oil components.
4.3. Materials and Methods
4.3.1. Experimental Sites and Plant Material
The experiment was carried out in a multi-environment trial (MET) established
during 2008 in five different agro-climatic conditions of Andalusia, Southern Spain
(Figure 4.1). Three orchard trials were located in traditional olive growing areas,
Antequera and Baena under rainfed conditions, and Úbeda with drip irrigation. The other
two orchards were stablished in new growing areas, where olive growing is currently
expanding, Gibraleón with mild winter temperatures and Tabernas with desert climate,
both with drip irrigation. All the trials included seven traditional cultivars, namely
‘Arbequina’, ‘Arbosana’, ‘Carrasqueño’, ‘Frantoio’, ‘Koroneiki’, ‘Ocal’ and ‘Picual’,
and two advanced breeding selections from the cooperative olive breeding program of
Córdoba (University of Córdoba and Andalusian Institute of Agricultural Research and
Training - IFAPA), which were selected on the basis of their earliness bearing, high oil
content and high oil quality (Leon et al. 2008; De la Rosa et al. 2006; Leon et al. 2011).
The genotypes were arranged in each orchard trial in a randomized design with four
blocks and four trees per elementary plot. Fruit samples of around 300 g were randomly

Capítulo 4
- 18 -
collected for each elementary plot-genotype-trial during 2015 and 2016 seasons on mid-
October. Only trees with similar crop load were considered for sampling.
Figure 4.1. Geographical situation of the five locations used in this study situated in Andalusia, Southern
Spain.
4.3.2. Olive oil quantification
For each fruit sample, three subsamples of 25 g were randomly selected to
measure oil content as a percentage on dry weight basis. For that purpose, each sub-
sample was dried in a forced-air oven at 105ºC for 42 h (del Río and Romero 1999), then
oil content was measured using an NMR fat analyser (Minispec MQone, Bruker Optik
GmbH, Ettlingen, Germany).
4.3.3. Olive Oil Components Analysis
For oil quality analyses, a subsample of 20 randomly chosen fruits was stored
shortly after harvest at -80 ºC. After freeze drying, the stones were removed and the flesh
milled in a laboratory ball mill. All the analyses were performed in duplicate following
the methods reported by Velasco et al. (2014). In short, the he fatty acid profile was

Genotype by Environment Interaction for Oil
Quality Components in Olive Tree
- 19 -
analysed after simultaneous oil extraction and fatty acid methylation on a Perkin Elmer
Clarus 600 Gas Chromatograph (Perkin Elmer, Inc., Waltham, MA) equipped with a
BPX70 30 m x 0.25 mm internal diameter x 0.25 m film thickness capillary column
(SGE Analytical Science Pty Ltd., Ringwood, Australia). Individual fatty acid content
was expressed as percentage of the total fatty acids. Tocopherols were extracted for 16 h
with isooctane and analysed by high-performance liquid chromatography (HPLC) using
iso-octane/tert-butylmethylether (94:6) as eluent at an isocratic flow rate of 0.8 ml/min,
a LiChrospher 100 diol column (250 mm 9 2 mm I.D.) connected to a silica guard column
(LiChrospher Si 60, 5 mm 9 4 mm I.D.) and a fluorescence detector (Waters 474) at 295-
nm excitation and 330-nm emission. Rac-5,7-dimethyltocol (Matreya LLC, Pleasant Gap,
PA, USA) was used as internal standard for tocopherol quantification. Total tocopherol
content was expressed as mg kg-1 dry fruit flesh. Individual tocopherols were expressed
as percentage of total tocopherols. Phytosterols and squalene were analysed after
unsaponifiable fraction extraction and silylation on a Perkin Elmer Clarus 600 Gas
Chromatograph equipped with a equipped with a ZB-5 30 m x 0.25 mm internal diameter
x 0.10 m film thickness capillary column (Phenomenex, Torrance, CA, USA). 5α-
cholestan-3β-ol (Reference D6128, Sigma-Aldrich, St. Louis, MO, USA) and squalene
(reference 442784, Supelco, Bellefonte, PA, USA,) were used as internal standards for
phytosterol and squalene quantification, respectively. Total phytosterol and squalene
contents were expressed as mg kg-1 dry fruit flesh. Individual phytosterols were expressed
as percentage of total phytosterols.
4.3.4. Data Analysis
In the present study, the factor environment was formed by a combination of
location (Antequera, Baena, Gibraleón, Tabernas and Úbeda) and year (2015 and 2016).
One of the combinations, Baena 2015, was excluded of the analysis because of
insufficient production. Thus, nine environments were considered for the study. Variance
analysis (ANOVA) to quantify the contribution of genotype, environment and their
interaction (GEI) and mean separation using Honestly-significant-difference (HSD) were
performed. HSD test was only performed for principals oil components (C16:0, C18:1,
C18:2, total tocopherols, total phytosterols and squalene), and those with significant GEI
were evaluated using stability and adaptability analysis through additive main effects and
multiplication interaction (AMMI) model (Gauch and Zobel 1997).

Capítulo 4
- 20 -
Pearson correlation and principal component analysis (PCA) were performed to
evaluate relationships between the olive oil components. PCA was also used to observe
the relationships among oil components and the genotype-environment combinations
performance. Then, discriminating among samples according to olive oil components was
performed with linear discrimination analysis (LDA). The LDA model accuracy was
tested using the predictive performances of repeated K-fold cross-validation (repeated K-
fold-CV) technique. Repeated K-fold-CV parameterization used in this study followed
(Rodrigues et al. 2018), with the formation of 4 K-folds with internal validation subsets
of 25% initial data and 10 repetitions to stress the model.
Statistical analysis was performed using R software (R development Core Team,
2016) using ANOVA type III under Car package, AMMI model and HSD test from
Agricolae package, PCA from Factoextra package and LDA from both Caret and MASS
packages.
4.4. Results
4.4.1. Factors Affecting Olive Oil Quality Traits
4.4.1.1. Olive oil content on dry weight basis
Environment was the most important factor for oil content on dry weight (Table
4.1), retaining almost half of the variance contribution. Genotype and genotype by
environment interaction (GEI) showed similar contribution for this oil trait, both
significant.
4.4.1.2. Fatty acids composition
Anova analysis indicated that the genotype was the main contributor to the total
variance for all fatty acids except for C18:0 (Table 4.1). The environment and the GEI
effects were also highly significant.

Genotype by Environment Interaction for Oil
Quality Components in Olive Tree
- 21 -
Table 4.1. Percentage of variance components and significance in the ANOVA for the olive oil
compounds evaluated on mid-October. ***P < 0.001, ** P < 0.01.
C16:0 – palmitic acid; C16:1 – palmitoleic acid; C18:0 – stearic acid; C18:1 – oleic acid; C18:2 – linoleic acid; C18:3 – linolenic acid.
Wide differences among genotypes were observed for C16:0 (Table 4.2), C18:1
(Table 4.3) and C18:2 (Table 4.4). ‘Selection 2’ showed the highest values for C18:1 and
the lowest values for C16:0 and C18:2, with ‘Arbequina’ showing an opposite behaviour.
Three groups of genotypes could be formed based on these three main fatty acids,
characterized by i) high C16:0 and 18:2 and low C18:1 (‘Arbequina’, ‘Arbosana’ and
‘Frantoio’); ii) low C16:0 and 18:2 and high C18:1 (‘Selection 2’ and ‘Picual’); and iii)
intermediate values of the three fatty acids: (‘Carrasqueño’, ‘Koroneiki’, ‘Ocal’ and
‘Selection 1’). Differences among environments were less evident, although with a trend
to higher values for C16:1 and C18:2 and lower values for C18:1 for BA-16, GI-15 and
GI-16 environments.
Fatty acids
C16:0 (%) C16:1 (%) C18:0 (%) C18:1 (%) C18:2 (%) C18:3 (%) Oil content
Genotype 64.3 *** 39.1 *** 25.1 *** 71.9 *** 71.9 *** 30.4 *** 19.1 ***
Environment 16.1 *** 24.7 *** 38.2 *** 10.6 *** 10.6 *** 24.3 *** 43.6 ***
GEI 8.2 *** 17.1 *** 17.1 *** 7.5 *** 7.5 *** 26.1 *** 17.6 ***
Residuals 10.5 19.2 19.7 9.7 9.7 18.9 19.54
Minor components
Total tocopherols (mg Kg-1)
-tocopherol (%)
Total phytosterols (mg Kg-1)
-sitosterol (%)
5-avenasterol (%)
Squalene (mg Kg-1)
Genotype 40.6 *** 64.8 *** 55.2 *** 34.6 *** 35.2 *** 75.9 ***
Environment 25.9 *** 6.2 *** 14.2 *** 11.2 *** 7.5 *** 6.8 ***
GEI 21.5 *** 17.5 *** 12.4 *** 11.4 *** 7.4 *** 5.8 ***
Residuals 11.8 11.3 18.1 42.6 49.7 11.4

Capítulo 4
- 22 -
Table 4.2. Comparison of means among the nine genotypes tested at the nine environments (ENV) for olive oil
C16:0 (%) (Palmitic acid) on mid-October. Coefficient of variation (CV) are also indicated. Different letters for
genotype (Mean1), environment (Mean2) and genotype-environment interaction (3) represent significant
difference at p < 0.05 level based on Honestly-significant-difference (HSD).
C16:0 (%)
ENV Mean 1 CV(%)
Genotype AN-15 AN-16 BA-16 GI-15 GI-16 TA-15 TA-16 UB-15 UB-16
Arbequina 15.3 cdefgh 3 17.1 adcd 17.6 a 18.1 a 18.3 a 16.8 abcd 16.9 abcd 14.9 defghij 16.6 abcde 16.9 a 6.7
Arbosana 14.1 ghijkl 14.5 defghijk 17.5 ab 14.5 efghijk 14.9 defghijk 14.8 defghijk 16.4 abcdef 15.4 b 7.5
Carrasqueño 13.5 ghijkl 13.2 hijklm 15.1 defghi 14.6 defghijk 14.3 fghijk 13.6 ghijkl 13.2 ghijklmn 13.9 ghijkl 13.9 c 4.9
Frantoio 13.9 ghijkl 14.9 defghijk 14.8 defghijk 15.5 bcdefg 13.6 ghijkl 14.5 c 5.3
Koroneiki 12.4 klmn 12.4 klmn 13.6 ghijkl 13.1 ijklm 14.1 ghijk 13.6 ghijkl 13.1 ijklm 12.3 klmn 12.8 jklmn 13.1 d 4.8
Ocal 11.9 lmn 12.6 klmn 11.9 lmn 13.1 hijklm 12.3 klmn 12.3 e 4.1
Picual 10.6 n 12.3 klmn 13.9 ghijkl 14.5 efghijk 13.9 ghijkl 14.1 ghijk 12.3 klmn 13.1 d 10.6
Selection1 11.9 lmn 12.1 klmn 14.8 defghijk 13.4 ghijklm 13.8 ghijkl 11.9 lmn 11.3 mn 14.7 defghijk 13.1 d 10.4
Selection2 11.3 mn 12.5 klmn 13.1 hijklm 12.2 klmn 12.9 jklm 12.4 klmn 11.7 lmn 12.6 klmn 12.3 e 4.8
Mean 2 12.7 f 13.3 de 14.8 a 14.1 bc 14.9 a 13.8 cd 14.5 abc 12.9 ef 14.6 ab
CV(%) 11.9 12.5 10.8 13.8 12.8 14.1 10.2 9.9 11.8
Nine environments: AN-15: Antequera-2015; AN-16: Antequera-2016; BA-16: Baena-2016; GI-15: Gibraleón-2015; GI-16: Gibraleón-
2016; TA-15: Tabernas-2015; TA-16: Tabernas-2016; UB-15: Úbeda-2015; UB-16: Úbeda-2016.
Considering GEI, average values of genotypes in individual environments ranged
from 10.6% to 18.3% for C16:0 (Table 4.2) and from 1.8% to 15.7% for C18:2 (Table
4.4). The highest values for both fatty acids were found for ‘Arbequina’ in GI-16. There
was also a wide range between the minimum and maximum values for C18:1 (Table 4.3),
observed for ‘Arbequina’ in GI-15 (61.4%) and ‘Selection 2’ in UB-15 (82.9%).
The stability of the genotypes, determined by their contribution to total GEI, was
analysed using additive main effects and multiplication interaction (AMMI) model
(Figure 4.2). High stability for C16:0 was identified for ‘Carrasqueño’ and ‘Frantoio’,
whereas stability was low for ‘Arbequina’, ‘Picual’ and ‘Selection 1’. In the case of
C18:1, three groups of genotypes were identified having high (‘Frantoio’, ‘Picual’ and
‘Selection 1’), intermediate (‘Carrasqueño’, ‘Selection 2’ and ‘Ocal’) and low
(‘Arbequina’, ‘Koroneiki’ and ‘Arbosana’) stability. Again, ‘Arbequina’ and ‘Arbosana’
showed very low stability for C18:2. AMMI could also be used to identify a specific
adaptability of a given genotype to a given environment such as for instance particularly
high values of C18:2 in ‘Arbequina’ under the conditions of GI-15.

Genotype by Environment Interaction for Oil
Quality Components in Olive Tree
- 23 -
Table 4.3. Comparison of means among the nine genotypes tested at the nine environments (ENV) for olive oil C18:1
(%) (Oleic acid) on mid-October. Coefficient of variation (CV) are also indicated. Different letters for genotype (Mean1),
environment (Mean2) and genotype-environment interaction (3) represent significant difference at p < 0.05 level based
on Honestly-significant-difference (HSD).
C18:1 (%)
ENV Mean 1 CV(%)
Genotype AN-15 AN-16 BA-16 GI-15 GI-16 TA-15 TA-16 UB-15 UB-16
Arbequina 71.2 klm 3 69.4 lm 66.1 mn 61.4 n 66.1 mn 70.1 lm 68.5 lm 72.4 jkl 69.1 lm 68.2 e 4.8
Arbosana 77.7 abcdefghij 77.1 cdefghijk 68.8 lm 76.9 defghijk 75.3 ghijkl 75.4 ghijk 72.2 jkl 74.4 d 4.3
Carrasqueño 77.8 abcdefghi 78.7 abcdefghi 76.1 fghijk 74.2 ijkl 77.8 abcdefghi 78.8 abcdefghi 81.2 abcdefg 78.7 abcdefghi 77.8 c 2.6
Frantoio 74.2 ijkl 73.6 ijkl 71.5 jklm 69.1 lm 76.1 ghijk 72.9 d 3.6
Koroneiki 77.8 abcdefghi 78.5 abcdefghi 77.2 cdefghij 78.4 abcdefghi 77.7 abcdefghij 77.8 abcdefghi 79.1 abcdefghi 80.2 abcdefgh 79.5 abcdefghi 78.4 c 1.2
Ocal 78.3 abcdefghi 77.5 bcdefghij 78.1 abcdefghi 76.1 efghijk 79.1 abcdefghi 77.9 c 1.4
Picual 82.5 ab 81.3 abcdef 79.1 abcdefghi 76.1 efghijk 79.4 abcdefghi 79.7 abcdefgh 81.6 abcde 80.1 ab 2.6
Selection 1 81.1 abcdefg 80.6 abcdefg 74.8 hijkl 76.8 efghijk 77.7 abcdefghij 81.1 abcdefg 82.1 abcd 76.1 fghijk 78.6 bc 3.5
Selection 2 82.3 abc 80.9 abcdefg 80.6 abcdefgh 81.4 abcde 79.9 abcdefgh 82.1 abcd 82.9 a 81.2 abcdefg 81.5 a 1.1
Mean 2 78.1 ab 77.8 ab 75.3 de 74.8 de 74.6 e 77.6 abc 76.5 bcd 78.9 a 75.9 cde
CV(%) 4.7 4.9 6.7 8.2 7.1 6.1 6.1 4.5 6.1
Nine environments: AN-15: Antequera-2015; AN-16: Antequera-2016; BA-16: Baena-2016; GI-15: Gibraleón-2015; GI-16: Gibraleón-2016; TA-
15: Tabernas-2015; TA-16: Tabernas-2016; UB-15: Úbeda-2015; UB-16: Úbeda-2016.
Table 4.4. Comparison of means among the nine genotypes tested at the nine environments (ENV) for olive oil
C18:2 (%) (Linoleic acid) on mid-October. Coefficient of variation (CV) are also indicated. Different letters for
genotype (Mean1), environment (Mean2) and genotype-environment interaction (3) represent significant
difference at p < 0.05 level based on Honestly-significant-difference (HSD).
C18:2 (%)
ENV Mean 1 CV(%)
Genotype AN-15 AN-16 BA-16 GI-15 GI-16 TA-15 TA-16 UB-15 UB-16
Arbequina 9.7 bcd 3 9.6 bcde 11.7 b 15.7 a 11.1 b 8.9 bcdef 9.9 bcd 8.8 bcdef 10.3 bc 10.7 a 19.8
Arbosana 4.1 jklm 4.1 jklm 8.6 bcdefg 4.5 ijklm 5.5 fghijklm 5.4 ghijklm 6.5 defghij 5.7 c 28.2
Carrasqueño 3.3 jklm 3.1 klm 3.9 jklm 5.7 fghijkl 3.2 jklm 3.1 klm 2.1 m 2.8 klm 3.4 de 31.1
Frantoio 7.7 cdefgh 7.4 cdefghi 9.9 bcd 11.1 b 6.5 defghij 8.4 b 22.7
Koroneiki 5.1 hijklm 4.6 hijklm 4.8 hijklm 4.1 jklm 3.4 jklm 4.3 ijklm 4.1 jklm 3.1 klm 4.1 jklm 4.1 d 15.4
Ocal 4.7 hijklm 5.1 hijklm 6.3 efghij 6.7 defghij 4.5 hijklm 5.4 c 18.2
Picual 2.2 m 2.2 m 2.8 klm 4.7 hijklm 2.4 m 2.3 m 1.9 m 2.5 ef 37.8
Selection 1 2.9 klm 3.1 klm 5.9 fghijk 4.6 hijklm 4.1 jklm 2.6 lm 2.3 m 4.2 ijklm 3.7 d 34.9
Selection 2 1.8 m 2.1 m 2.1 m 2.2 m 3.1 klm 1.7 m 1.4 m 1.8 m 2.1 f 24.1
Mean 2 4.7 cde 4.4 de 5.4 bc 6.6 a 5.9 ab 4.4 cde 4.8 cde 4.1 e 5.1 bcd
CV(%) 55.4 51.2 64.1 64.7 62.4 63.1 62.4 60.9 60.1
Nine environments: AN-15: Antequera-2015; AN-16: Antequera-2016; BA-16: Baena-2016; GI-15: Gibraleón-2015; GI-16: Gibraleón-
2016; TA-15: Tabernas-2015; TA-16: Tabernas-2016; UB-15: Úbeda-2015; UB-16: Úbeda-2016.
Capítulo 4
- 24 -
Table 4.5. Comparison of means among the nine genotypes tested at the nine environments (ENV) for olive oil total
tocopherols (mg Kg-1) on mid-October. Coefficient of variation (CV) are also indicated. Different letters for genotype
(Mean1). environment (Mean2) and genotype-environment interaction (3) represent significant difference at p < 0.05 level
based on Honestly-significant-difference (HSD).
Total tocopherols (mg Kg-1)
ENV Mean 1 CV(%)
Genotype AN-15 AN-16 BA-16 GI-15 GI-16 TA-15 TA-16 UB-15 UB-16
Arbequina 141.4 fghijklm 3 145.1 fghijklm 161.1 defghijk 122.5 jklm 175.8 abcdefgh 128.3 hijklm 91.3 mn 173.2 bcdefghi 187.1 abcdef 147.4 bc 20.6
Arbosana 207.1 abcd 169.9 bcdefghij 223.1 a 168.5 cdefghij 156.5 defghijklm 205.8 abcd 220.5 ab 197.9 a 13.8
Carrasqueño 147.3 fghijklm 117.1 jklmn 143.8 fghijklm 119.3 jklmn 122.2 jklm 90.8 mn 156.1 defghijklm 126.3 ijklm 126.6 d 16.4
Frantoio 155.7 defghijklm 115.3 jklmn 112.1 klmn 125.2 ijklm 182.3 abcdefg 140.1 cd 21.4
Koroneiki 180.4 abcdefg 150.7 efghijklm 141.7 fghijklm 197.1 abcde 125.2 ijklm 112.7 klmn 187.2 abcdef 105.3 lmn 153.3 bc 21.5
Ocal 72.1 n 91.7 mn 91.7 mn 89.9 mn 145.9 fghijklm 112.1 e 24.8
Picual 135.6 ghijklm 87.9 mn 109.9 lmn 106.7 lmn 102.9 mn 72.6 n 167.7 cdefghijk 99.6 e 31.5
Selection 1 158.7 defghijkl 130.1 hijklm 184.4 abcdefg 119.6 jklmn 147.6 efghijklm 154.6 defghijklm 162.3 defghij 190.9 abcdef 155.9 b 15.5
Selection 2 128.7 hijklm 128.9 hijklm 218.9 abc 112.7 klmn 118.9 jklmn 110.8 lmn 127.8 hijklm 155.1 defghijklm 134.2 d 26.5
Mean 2 144.6 c 123.8 de 160.4 ab 116.85 e 146.8 bc 137.5 cd 96.8 f 168.1 a 167.7 a
CV(%) 25.7 21.2 22.9 12.2 32.7 17.1 33.2 14.2 25.8
Nine environments: AN-15: Antequera-2015; AN-16: Antequera-2016; BA-16: Baena-2016; GI-15: Gibraleón-2015; GI-16: Gibraleón-2016; TA-15:
Tabernas-2015; TA-16: Tabernas-2016; UB-15: Úbeda-2015; UB-16: Úbeda-2016.
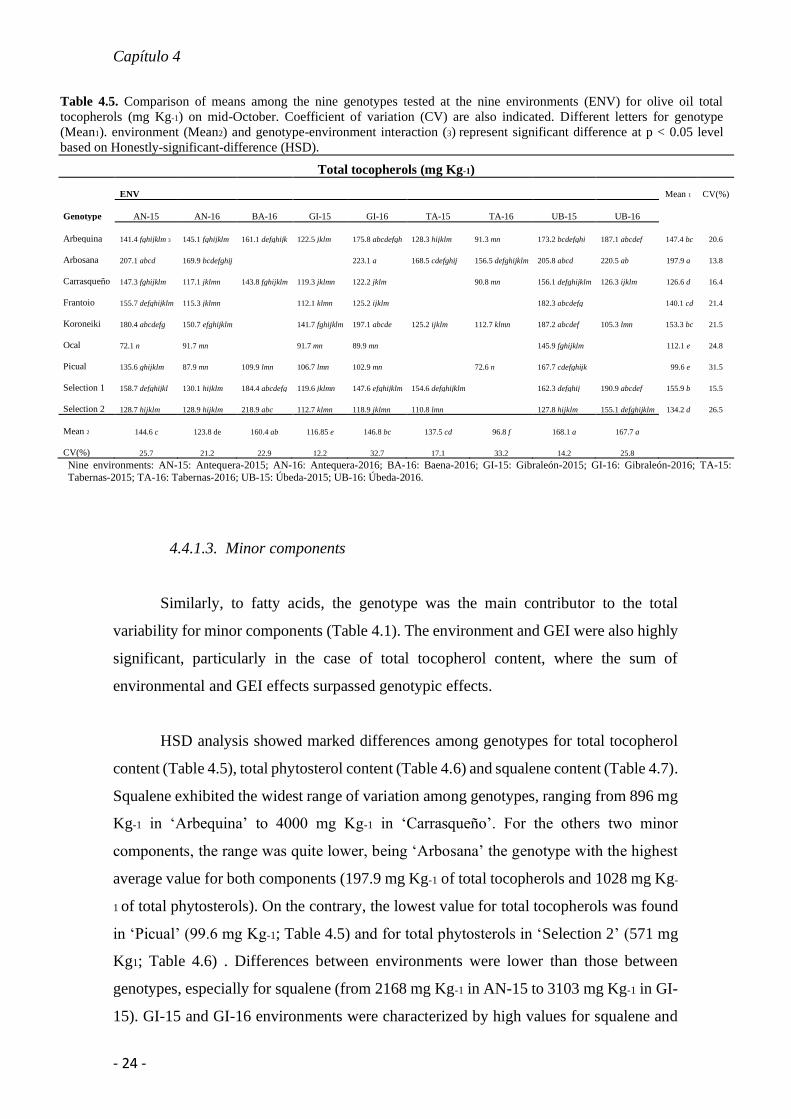
4.4.1.3. Minor components
Similarly, to fatty acids, the genotype was the main contributor to the total
variability for minor components (Table 4.1). The environment and GEI were also highly
significant, particularly in the case of total tocopherol content, where the sum of
environmental and GEI effects surpassed genotypic effects.
HSD analysis showed marked differences among genotypes for total tocopherol
content (Table 4.5), total phytosterol content (Table 4.6) and squalene content (Table 4.7).
Squalene exhibited the widest range of variation among genotypes, ranging from 896 mg
Kg-1 in ‘Arbequina’ to 4000 mg Kg-1 in ‘Carrasqueño’. For the others two minor
components, the range was quite lower, being ‘Arbosana’ the genotype with the highest
average value for both components (197.9 mg Kg-1 of total tocopherols and 1028 mg Kg-
1 of total phytosterols). On the contrary, the lowest value for total tocopherols was found
in ‘Picual’ (99.6 mg Kg-1; Table 4.5) and for total phytosterols in ‘Selection 2’ (571 mg
Kg1; Table 4.6) . Differences between environments were lower than those between
genotypes, especially for squalene (from 2168 mg Kg-1 in AN-15 to 3103 mg Kg-1 in GI-
15). GI-15 and GI-16 environments were characterized by high values for squalene and

Genotype by Environment Interaction for Oil
Quality Components in Olive Tree
- 25 -
total phytosterol contents, whereas and UB-15 and UB-16 environments resulted in high
total tocopherol content.
GEI combinations showed high ranges of variability for minor components. Total
tocopherol (Table 4.5) and phytosterol contents (Table 4.6) showed higher values in
‘Arbosana’ (223 mg Kg-1 in GI-16 and 1200 mg Kg-1 in UB-15, respectively). On the
contrary, the lowest values for both components were found in ‘Ocal’ and ‘Selection 2’,
both in AN-15 environment (71.1 mg Kg-1 and 303 mg Kg-1, respectively). The
maximum amplitude from GEI was showed for squalene (Table 4.7), where the values
ranged from 601 mg Kg-1 for ‘Arbequina’ in AN-16 to 5093 mg Kg-1 for ‘Carrasqueño’
in GI-15.
Table 4.6. Comparison of means among the nine genotypes tested at the nine environments (ENV) for olive oil total
phytosterols (mg Kg-1) on mid-October. Coefficient of variation (CV) are also indicated. Different letters for genotype
(Mean1). environment (Mean2) and genotype-environment interaction (3) represent significant difference at p < 0.05
level based on Honestly-significant-difference (HSD).
Total phytosterols (mg Kg-1)
ENV Mean 1 CV(%)
Genotype AN-15 AN-16 BA-16 GI-15 GI-16 TA-15 TA-16 UB-15 UB-16
Arbequina 781 cdefghijkl 3 885 bcdefgh 850 cdefgh 1186 ab 1036 abcd 773 cdefghijkl 923 abcdef 1031 abcd 1053 abc 949 ab 14.6
Arbosana 828 cdefghij 889 bcdefgh 1121 abc 893 bcdefg 1177 abc 1200 a 1028 abcd 1020 a 14.8
Carrasqueño 714 efghijkl 894 bcdefg 937 abcdef 1190 ab 847 cdegh 856 cdefgh 825 cdefghijk 861 cdefgh 893 bc 15.3
Frantoio 994 abcde 951 abcdef 823 cdefghijk 1081 abc 1040 abcd 989 a 10.1
Koroneiki 608 ghijklm 545 ijklm 585 hijklm 716 efghijkl 659 fghijklm 491 klm 656 fghijklm 699 efghijkl 544 ijklm 614 e 12.4
Ocal 777 cdefghijkl 874 cdefgh 996 abcde 652 fghijklm 868 cdefgh 946 cd 13.5
Picual 610 ghijklm 750 defghijkl 841 cdefghi 1021 abcde 828 cdefghij 776 cdefghijkl 853 cdefgh 801 d 15.5
Selection 1 620 fghijklm 827 cdefghij 992 abcde 1006 abcde 806 cdefghijk 781 cdefghijkl 793 cdefghijk 849 cdefgh 843 cd 14.5
Selection 2 393 m 580 hijklm 644 fghijklm 663 fghijklm 711 efghijkl 485 lm 531 jklm 586 hijklm 571 e 18.1
Mean 2 701 d 792 c 818 bc 953 a 868 bc 685 d 831 bc 873 b 836 bc
CV(%) 24.3 34.4 19.7 20.8 20.6 27.1 23.4 22.7 43.8
Nine environments: AN-15: Antequera-2015; AN-16: Antequera-2016; BA-16: Baena-2016; GI-15: Gibraleón-2015; GI-16: Gibraleón-2016; TA-
15: Tabernas-2015; TA-16: Tabernas-2016; UB-15: Úbeda-2015; UB-16: Úbeda-2016.

Capítulo 4
- 26 -
Table 4.7. Comparison of means among the nine genotypes tested at the nine environments (ENV) for olive oil squalene
(mg Kg-1) on mid-October. Coefficient of variation (CV) are also indicated. Different letters for genotype (Mean1).
environment (Mean2) and genotype-environment interaction (3) represent significant difference at p < 0.05 level based on
Honestly-significant-difference (HSD).
Squalene (mg Kg-1)
ENV Mean 1 CV(%)
Genotype AN-15 AN-16 BA-16 GI-15 GI-16 TA-15 TA-16 UB-15 UB-16
Arbequina 683 no 3 601 no 549 o 982 mno 993 mno 1139 lmno 1124 lmno 945 mno 950 mno 896 d 24.4
Arbosana 1485 jklmno 1540 ijklmno 1190 lmno 1600 ijklmno 1376 jklmno 1011 mno 1101 lmno 1302 d 17.6
Carrasqueño 3489 abcdefg 2388 efghijklmn 3538 abcdefg 5093 a 5055 ab 4416 abc 4174 abcde 3904 abcdef 4000 a 22.3
Frantoio 1246 lmno 1100 lmno 1330 jklmno 1103 lmno 1322 klmno 1212 d 9.3
Koroneiki 1535 jklmno 1745 hijklmno 1481 jklmno 2634 defghijkl 2474 efghijklmn 2878 cdefghijk 2192 ghijklmn 2322 fghijklmn 2389 efghijklmn 2175 c 22.6
Ocal 2332 fghijklmn 3334 cdefgh 3883 abcdef 4629 abc 3445 bcdefg 3446 b 24.3
Picual 2532 efghijklm 3880 abcdef 3086 cdefghij 3613 abcdefg 4418 abc 3657 abcdefg 3682 abcdefg 3550 ab 16.8
Selection 1 3833 abcdefg 3075 cdefghij 2368 efghijklmn 3340 cdefgh 2980 cdefghij 4327 abc 3033 cdefghij 3220 cdefghi 3248 b 18.1
Selection 2 2704 defghijkl 3396 cdefg 2477 efghijklmn 3525 abcdefg 3988 abcde 4186 abcd 3609 abcdefg 3468 bcdefg 3460 b 16.7
Mean 2 2168 e 2441 cde 2237 de 3103 a 2918 ab 2826 abc 2734 abcd 2556 bcde 2512 bcde
CV(%) 48.5 55.1 48.6 43.7 55.4 51.5 52.5 48.9 49.7
Nine environments: AN-15: Antequera-2015; AN-16: Antequera-2016; BA-16: Baena-2016; GI-15: Gibraleón-2015; GI-16: Gibraleón-2016; TA-15:
Tabernas-2015; TA-16: Tabernas-2016; UB-15: Úbeda-2015; UB-16: Úbeda-2016.
The stability of the cultivars and breeding selections was very different for each
minor component evaluated using AMMI models (Figure 4.3). For instance, ‘Arbequina’
was the most stable genotype for total tocopherol and squalene contents, while ‘Selection
2’ was the most stable for total phytosterol content. The lowest stability was observed for
‘Koroneiki’ (tocopherol content), ‘Arbosana’ (squalene content) and ‘Carrasqueño’
(phytosterol content). Again, some genotypes were specifically adapted to some
environments according to the AMMI model, such as for instance ‘Selection 2’ showing
high values for tocopherol content under BA-16 conditions.

Genotype by Environment Interaction for Oil
Quality Components in Olive Tree
- 27 -
Figure 4.2. AMMI model biplot for IPC1 vs
IPC2 of main three olive oil fatty acids (C16:0,
C18:1 and C18:2) for nine olive genotypes
evaluated in nine environments (AN-15:
Antequera-2015; AN-16: Antequera-2016;
BA-16: Baena-2016; GI-15: Gibraleón-2015;
GI-16: Gibraleón-2016; UB-15: Úbeda-2015;
UB-16: Úbeda-2016; TA-15: Tabernas-2015;
TA-16: Tabernas-2016) on mid-October.

Capítulo 4
- 28 -
Figure 4.3. AMMI model biplot for IPC1 vs
IPC2 of total tocopherols, total phytosterols and
squalene in olive oil for nine olive genotypes
evaluated in nine environments (AN-15:
Antequera-2015; AN-16: Antequera-2016; BA-
16: Baena-2016; GI-15: Gibraleón-2015; GI-
16: Gibraleón-2016; UB-15: Úbeda-2015; UB-
16: Úbeda-2016; TA-15: Tabernas-2015; TA-
16: Tabernas-2016) on mid-October.

Genotype by Environment Interaction for Oil
Quality Components in Olive Tree
- 29 -
4.4.2 Relationship between Olive Oil Components and Discrimination between
Monovarietal Olive Oil.
Pearson correlation coefficients were calculated between all the olive oil
components under study (Table 4.8), including oil content, the percentage of individual
fatty acids in the oil (C16:0, C16:1, C18:0, C18:1, C18:2 and C18:3), minor components
(total tocopherol content, percentage of -tocopherol, total phytosterol content,
percentages of -sitosterol and 5-avenasterol, and squalene content). Highly significant
correlations were found among olive oil components both of the same and different
chemical family. Among components of the same chemical family, negative correlations
of C18:1 with C16:0 and with C18:2 fatty acids were found, as well as the positive one
between C16:0 and C18:2. Also, a negative correlation between C16:1 with 18:1 was
showed. For tocopherols, a positive significant correlation between total tocopherol
content and -tocopherol was observed. Among phytosterols, the only high correlation
was found between -sitosterol and -avenasterol being negative. When components of
different chemical families were considered, the highest correlation coefficients were
observed between C18:1 and both squalene (positive) and total phytosterol content
(negative). Both C16:0 and C18:2 were negatively correlated with squalene and
positively correlated with phytosterol content. A negative correlation between -
tocopherol and squalene, a negative correlation between oil content and both total
tocopherol content and proportion of -tocopherol, and a positive correlation between oil
and squalene contents were also observed.

Capítulo 4
- 30 -
Table 4.8. Correlations among main olive oil components evaluated for genotype/environment on mid-October.
Pearson correlation coefficients and signification levels are indicated above and below the diagonal, respectively.
C16:0 C16:1 C18:0 C18:1 C18:2 C18:3 Total
tocopherols -tocopherol Total
phytosterols -sitosterol 5-avenasterol Squalene Oil content
C16:0 X 0.62 -0.38 -0.93 0.81 -0.02 0.24 0.44 0.61 -0.16 0.31 -0.59 -0.05
C16:1 <0.0001 X -0.48 -0.52 0.38 -0.17 0.11 0.22 0.41 -0.03 0.14 -0.06 0.22
C18:0 0.0003 <0.0001 X 0.29 -0.32 0.21 -0.12 -0.21 -0.24 0.01 -0.08 0.15 -0.11
C18:1 <0.0001 <0.0001 0.0051 X -0.97 -0.04 -0.21 -0.35 -0.62 0.16 -0.31 0.67 0.01
C18:2 <0.0001 0.0035 0.0045 <0.0001 X 0.05 0.13 0.28 0.56 -0.17 0.28 -0.69 0.02
C18:3 0.7973 0.1757 0.1237 0.7305 0.6126 X 0.42 0.15 0.01 -0.09 0.08 -0.16 -0.36
Total tocopherols 0.0504 0.3861 0.3429 0.1821 0.4437 0.0008 X 0.57 0.19 -0.22 0.23 -0.42 -0.51
-tocopherol 0.0002 0.0362 0.0982 0.0037 0.0215 0.2365 <0.0001 X 0.14 -0.38 0.36 -0.51 -0.43
Total phytosterol <0.0001 0.0002 0.0301 <0.0001 <0.0001 0.9869 0.1333 0.2265 X 0.04 0,20 0.0142 0.17
-sitosterol 0.0636 0.6441 0.9366 0.1044 0.1635 0.1621 0.0069 0.0001 0.5056 X -0.91 <0.0001 0,14
5-avenasterol 0.0007 0.2704 0.5159 0.0019 0.0069 0.2244 0.0068 0.0002 0.1037 <0.0001 X <0.0001 -0,05
Squalene <0.0001 0.7327 0.0829 <0.0001 <0.0001 0.1660 0.0003 0.0003 -0.27 0.36 -0.42 X 0.47
Oil content 0.7135 0.0822 0.3963 0.9861 0.8667 0.0561 <0.0001 <0.0001 0.0587 0.0452 0.2381 <0.0001 X

Genotype by Environment Interaction for Oil
Quality Components in Olive Tree
- 31 -
The two first PCA components accounted for 60.4 % of total variability (Figure
4.4). The negative relationship of C16:0, C18:2 and total phytosterols with C18:1 was
evident, as they were located in opposite quadrants. The loadings of the remaining oil
components evaluated were located in the other quadrants of the plot defined by the first
two PCA components: oil content, squalene and -sitosterol in the first quadrant while
total tocopherols, -tocopherol and C18:3 were in the third quadrant. PCA plot also
showed some grouping of the samples according to the different genotypes, although no
clear separation by genotype at 0.95 significance was observed.
Figure 4.4. Principal components analysis (PCA) for fifteen olive oil components on nine genotypes
evaluated in nine environments on mid-October. Confidence ellipses were performed around midpoint of
each genotype.
Finally, linear discriminant analysis (LDA) was used to provide a clearer
separation by genotype (Figure 4.5). The model showed a correct genotypic classification
of 87.2 % the original grouped data and 85.6% for the repeated K-fold-CV (4 folds x 10
repeats leadings forming 40 randomly runs, with sensitives ranging from 86% to 100%).
The data of each genotype recorded on the different environments was clearly located in
a specific region of the space described by the three linear discriminant functions using

Capítulo 4
- 32 -
these olive oil components. ‘Arbosana’, ‘Carrasqueño’, ‘Koroneiki’, ‘Picual’, ‘Selection
1’ and ‘Selection 2’ showed some data points mixed as having a similar oil composition.
Contrarily, the data of ‘Ocal’, ‘Arbequina’ and ‘Frantoio’ coming from the different
environments were closely plotted by cultivar and far from rest of genotypes.
Figure 4.5. Linear discriminant analysis (LDA) using 3 linear discriminant functions (87.2 % of the
variability explained) for the olive oil discrimination of nine genotypes, based on 13 olive oil components
in nine environments on mid-October.
4.5. Discussion
Many works have described the healthy and nutritional properties of the extra
virgin olive oil (EVOO), suggesting that it is one the main Mediterranean diet components
contributing to increase life expectancy (Guo et al. 2018). These benefits are highly
related to its particular oil composition (Perez-Jimenez et al. 2007; Estruch et al. 2018),
mainly formed by monounsaturated fatty acid and a significant proportion of phenols,
sterols, tocopherols and squalene. However, low-quality olive oil composition have been

Genotype by Environment Interaction for Oil
Quality Components in Olive Tree
- 33 -
reported for some specific cultivar-environment combinations, some of them even being
out of the limits set by International Olive Oil Council regulation for extra virgin olive
oil (Mailer et al. 2010; Rondanini et al. 2011). In this sense, multi-environment cultivar
trials, as the one here reported, offer the opportunity to test the relative influence of
genotype, environment and their interaction on olive oil components, scarcely studied
until now in olive. They can be also used to determine the stability and adaptability for
specific genotype.
4.5.1. Variability Factors for Olive Oil Quality
Considering a multi-environment genotype data set, the genetic effect was the
main source of variation for all the oil components considered in this study. This result
revealed a consistent and strong genotype influence on oil components, which is in
agreement with previous studies based on single-location trials (Salazar-García et al.
2018; Leon et al. 2008; Uceda et al. 2008; Rotondi et al. 2010; Beltran et al. 2016). In
particular, the three main olive fatty acids (C18:1, C18:2 and C16:0), the percentage of
-tocopherol and the squalene content showed very high genetic variance. The evaluation
here performed confirmed, independently of the cultivated environment, the high
percentage of C18:1 and squalene content and low percentage of C16:0 and 18:2 of
‘Picual’ and the opposite behaviour of ‘Arbequina’, well known from previous studies
(Leon et al. 2011; Fernandez-Cuesta et al. 2013). Interestingly, the two breeding
selections tested showed quite similar fatty acid composition than ‘Picual’, that is very
convenient for the oil stability and healthy properties (Aparicio et al. 1999). In particular,
‘Selection 1’ also showed high content in squalene and total tocopherols, being a breeding
selection with high nutritional values. For total phytosterols, ‘Arbosana’, ‘Frantoio’ and
‘Arbequina’ were the cultivars with higher values. Contrarily to these oil components, oil
content on dry weight showed its main variance source in the environment, indicating
that the oil accumulation depends mostly of its surrounding. Similar result was showed
by Navas et al. (2019) on the date of maximum oil content reached, where was suggested
that the cultivars cultivated in a given environment could be harvested at same optimal
time.

Capítulo 4
- 34 -
The significant genetic influence on oil components was also consistently
supported using principal components analysis (PCA) and linear discriminant analysis
(LDA). Both analyses have already been used in single-location trials to discriminate
commercial cultivars (Salazar-García et al. 2018; Wang et al. 2018) and advanced
breeding genotypes (Leon et al. 2011) from oil components obtaining a significant
separation between them. In our case, some overlapping among genotypes was observed
from these analyses, due to the variability caused by the different environments tested.
Only ‘Arbequina’ and ‘Frantoio’ were largely distinguished from LDA, probably due to
their high C16:0, C18:2 and total phytosterols values, and low C18:1. Both monovarietal
oils were already grouped together by presenting similar oil composition (Leon et al.
2011), with low C18:1 and high C18:2.
Even so, the environment and genotype by environment interaction (GEI) also
were highly significant in all components evaluated. Environmental influence of olive oil
components has been reported for single cultivars grown in different locations as the case
of ‘Arbequina’ (Mailer et al. 2010; Borges et al. 2017) and ‘Arauco’ (Garcia-Inza et al.
2014). This influence has been also found at gene expression level (Hernandez et al.
2019). In this sense, the predicted climate warming, that could specially affect the
Mediterranean climate (Lionello 2012), could greatly affect the olive oil composition and,
therefore, its quality.
The significant GEI identified in this research for olive oil quality traits suggested
a differential performance of cultivars under different environments, as previously
reported for flowering and fruit traits (Navas-Lopez et al. 2019b; Navas-Lopez et al.
2019a). This emphasizes the necessity of local evaluation of olive cultivars to determine
those better adapted to a given environmental conditions. Moreover, extrapolation of
results from a set of cultivars in a given environment to a different one should be avoided.
In fact, for some genotype-environment combinations here reported, the content of some
oil components are close to the limits established by market regulations: for instance, low
values of C18:1 for ‘Arbequina’ under GI-15 environmental conditions (61 %) are close
to the minimum values (55 %) imposed by International Olive Council for Olive Oil.
Into this significant GEI, some cultivars showed higher stability across
environments than others. Environmental stability could be evaluated by AMMI models,

Genotype by Environment Interaction for Oil
Quality Components in Olive Tree
- 35 -
previously used for olive studies (Hassani et al. 2018; Ebrahimi et al. 2016). In our case,
AMMI model showed that ‘Arbequina’ has low stability for most of the oil components
except for tocopherols and squalene. On the contrary, ‘Selection 2’ showed intermediate-
high stability for all the oil components except for total tocopherols. This is very
interesting since, in breeding programs, high stability among environments of the
characters under selection is crucial for the new selections to be considered as new
cultivars (Janick and Moore. 1996)
4.5.2. Relationships between Olive Oil Components
As expected, significant negative correlation between components from the same
chemical family were showed for C16:0 and C18:1, C18:1 and C18:2 or -sitosterol and
5-avenasterol. Such correlations were already reported for olive (de la Rosa et al. 2016;
Fernandez-Cuesta et al. 2012) remarking the existing interrelationships between these
components of the same biosynthetic pathway. Besides, significant correlations were
found among some fatty acids with squalene and total phytosterols. Correlation between
different chemical families could suggest a genetic link between biosynthetic pathways
for olive oil as it was already proposed in some specific vegetable oils (KamalEldin and
Andersson 1997). Also, oil content was found to be correlated with some minor oil
constituents such as squalene and total tocopherols. This last correlation, between oil
content and total tocopherols, was previously observed in sunflower (Nolasco et al. 2004)
with reduction of total tocopherols and increase of oil content. However, those
correlations between different chemical family components on olive oil have not been
found in previous reports using single locations (de la Rosa et al. 2016; Leon et al. 2011).
4.6. Conclusions
Genetic effect was the main variance contributor both the main fatty acids (C16:0,
C18:1 and C18:2) and the principal minor components (total tocopherols, total
phytosterols and squalene). Even so, the significant contribution found for environment
and genotype by environment interaction indicates that the use of multi-environment
cultivar trials is very convenient to select the optimal cultivars for a given environment
and even better, cultivars with stable behaviour across environments.

Capítulo 4
- 36 -
Acknowledgements
JFNL sincerely acknowledge National Institute of Agricultural Research for
financial support. This work was supported by projects of Andalusian Institute of
Agricultural Research and Training (AVA201601.2, AVA2019.027, TRA201600.2,
TRA2019.010) and National Institute of Agricultural Research (RTA2012-00018); partly
funded by European Regional Development Fund (ERDF). Field and lab staff assistance
is highly acknowledged.

Capítulo 5: Conclusiones Generales

- 38 -
1. El uso de ensayos multi-ambiente y multi-genotipo han mostrado una gran utilidad
para cuantificar eficazmente la contribución genética, ambiental y su interacción en los
principales caracteres de interés del cultivo del olivo (Capítulo 2 al capítulo 4).
2. La fenología de floración ha estado influenciada principalmente por el ambiente,
que mostró un adelanto considerable de la floración en ambientes con inviernos suaves.
La limitada variabilidad entre genotipos indica una gran dificultad para obtener nuevas
variedades con floración precoz desde los programas de mejora (Capítulo 2).
3. Todos los parámetros de calidad de flor, excepto número de flores por
inflorescencia, mostraron una alta contribución del genotipo. Entre los genotipos
evaluados, ‘Arbequina’ fue la variedad que obtuvo mejores caracteres de calidad de flor
en todos los ambientes (Capítulo 2).
4. Los tres factores analizados (genotipo, ambiente y su interacción) contribuyeron
de manera similar en la varianza para contenido máximo de aceite en peso seco. Esto
indica un riesgo potencial de reducción para este carácter asociado tanto a las plantaciones
en nuevas áreas de cultivo como a los efectos ambientales potenciales que pueda
ocasionar el cambio climático en las áreas tradicionales de cultivo (Capítulo 3).
5. El ambiente mostró la mayor contribución sobre la pendiente de acumulación de
aceite y fue el único factor significativo para la fecha de obtención del máximo aceite
acumulado en peso seco del fruto. Por tanto, considerando el momento de máxima
acumulación de aceite, el grupo de variedades y genotipos aquí evaluados podrían
cosecharse en épocas similares, variables en función del ambiente cultivado (Capítulo 3).
6. Se observó una alta correlación negativa del máximo aceite acumulado con la
temperatura del aire durante los meses verano, inicio de la lipogénesis. Sin embargo, esta
influencia no ocurre por igual en todos los genotipos, siendo, por ejemplo, más fuerte en
‘Koroneiki’ que en ‘Arbequina’ (Capítulo 3).
7. El genotipo fue la principal fuente de variación tanto en los principales ácidos
grasos como en los componentes menores del aceite. No obstante, la interacción genotipo
x ambiente también fue significativa, por lo que parte de la variabilidad explicada

- 39 -
dependerá de donde esté plantada una variedad. Ello debe ser considerado a la hora de la
elección varietal ya que podría tener incluso importantes connotaciones comerciales
(Capítulo 4).
8. Se han observado las correlaciones esperadas entre componentes de la misma ruta
bioquímica como ácido oleico y ácido linoleico o ácido palmítico y ácido linoleico, con
una relación negativa y positiva, respectivamente. Además, también se han encontrado
otras correlaciones significativas entre componentes de diferentes rutas bioquímicas
como fue el caso del ácido oleico con la cantidad de escualeno y fitosteroles totales en el
aceite. Estas relaciones encontradas podrían facilitar los criterios de selección de
variedades con una composición específica en el aceite, uno de los factores principales a
tener en cuenta en el mercado mundial del aceite de oliva virgen extra (Capítulo 4).
9. La influencia de la interacción genotipo x ambiente mostrada en los principales
caracteres agronómicos del olivo debe ser considerada en el diseño del protocolo de
actuación en las etapas intermedias y finales de los programas de mejora. Es decir, además
de seleccionar los genotipos por presentar caracteres óptimos, habrá también que
considerar su estabilidad entre ambientes. El empleo de ensayos multi-ambiente en etapas
intermedias del programa de mejora se debe evaluar en futuros estudios (Capítulo 2 al
capítulo 4).
10. Los resultados que derivan de esta Tesis Doctoral ponen de manifiesto la
importancia de la investigación a nivel regional y local del comportamiento agronómico
para cada variedad, ya que se verán afectadas de manera diferencial dependiendo del
ambiente. Por lo tanto, la continuación de futuros trabajos utilizando ensayos multi-
ambiente con un grupo más amplio de variedades continúa siendo de vital importancia
para una correcta recomendación varietal, en particular considerando los nuevos sistemas
de cultivo que se están desarrollando (Capítulo 2 al capítulo 4).

Bibliografía

Bibliografía
- 41 -
Aguilera, MP., Beltran G., Ortega D., Fernandez A., Jimenez A., Uceda, M., 2005. Characterisation of
virgin olive oil of Italian olive cultivars: 'Frantoio' and 'Leccino', grown in Andalusia. Food
Chemistry 89 (3):387-391. doi:10.1016/j.foodchem.2004.02.046
Alcala, A.R., Barranco, D., 1992. Prediction of flowering time in olive for the Cordoba olive collection.
Hortscience 27, 1205-1207.
Allalout, A., Krichene, D., Methenni, K., Taamalli, A., Daoud, D., et al., 2011. Behavior of super-intensive
spanish and greek olive cultivars grown in northern Tunisia. J. Food Biochem. 35, 27-43.
doi:10.1111/j.1745-4514.2010.00364.x.
Alonso, J.M., Anson, J.M., Espiau, M.T., Socias i Company, R., 2011. Stability of the Almond Blooming
Date in a Changing Climate. V International Symposium on Pistachios and Almonds 912, 337-
342. https://doi.org/10.17660/ActaHortic.2011.912.49.
Aparicio, R., Roda, L., Albi MA., Gutierrez, F., 1999. Effect of various compounds on virgin olive oil
stability measured by rancimat. Journal of Agricultural and Food Chemistry 47 (10):4150-4155.
doi:10.1021/jf9812230
Arias-Calderon, R., Rouiss, H., Rodriguez-Jurado, D., de la Rosa, R., Leon, L., 2014. Variability and
heritability of fruit characters in olive progenies from open-pollination. Scientia Horticulturae 169,
94-98. https://doi.org/10.1016/j.scienta.2014.02.011
Aybar, V.E., Paulo De Melo-Abreu, J., Searles, P.S., Matias, A.C., Del Rio, C., et al., 2015. Evaluation of
olive flowering at low latitude sites in Argentina using a chilling requirement model. Spanish
Journal of Agricultural Research 13. http://dx.doi.org/10.5424/sjar/2015131-6375
Badenes, M.L., & Byrne, D. H., 2012. Fruit breeding. Springer Science & Business Media. 8.
Badenes, M.L., Martinez-Calvo, J., Llacer, G., 1998. Analysis of apricot germplasm from the European
ecogeographical group. Euphytica 102, 93-99. https://doi.org/10.1023/A:1018332312570
Barranco D., 2008. Variedades Y Patrones. En: D. Barranco, R., Fernández-Escobar, R., Rallo. L., (Eds)
El cultivo del olivo. Mundi-Prensa y Junta de Andalucía Madrid:37-62.
Belaj, A., Hidalgo, J., Beltran, G., Cano, J., Jiménez, A., Padilla, I., Barceló, A., León, L., de la Rosa, R.,
2013. La colección mundial de variedaes de olivo de Córdoba y su utilidad para el cultivar andaluz.
Vida Rural, 358, 54-58 ISSN 1133-8938
Beltran, G., Bucheli, ME., Aguilera, MP., Belaj, A., Jimenez, A., 2016. Squalene in virgin olive oil:
Screening of variability in olive cultivars. European Journal of Lipid Science and Technology 118
(8):1250-1253. doi:10.1002/ejlt.201500295
Beltran, G., del Rio, C., Sanchez, S., Martinez, L., 2004. Seasonal changes in olive fruit characteristics and
oil accumulation during ripening process. J. Sci. Food Agric. 84, 1783-1790. doi:
10.1002/jsfa.1887
Benlloch-Gonzalez, M., Sanchez-Lucas, R., Benlloch, M., Fernandez-Escobar R., 2018. An approach to
global warming effects on flowering and fruit set of olive trees growing under field conditions.
Scientia Horticulturae 240:405-410. doi:10.1016/j.scienta.2018.06.054
Borges, TH., Pereira, JA., Cabrera-Vique, C., Lara, L., Oliveira, AF., Seiquer, I., 2017. Characterization of
Arbequina virgin olive oils produced in different regions of Brazil and Spain: Physicochemical
properties, oxidative stability and fatty acid profile. Food Chemistry 215:454-462.
doi:10.1016/j.foodchem.2016.07.162
Boskou D., 2009. Other importantminor constituents. Boca Raton, FL: CRC Press (Ed.), Olive oil. Minor
constituents and health .45-55. doi:DOI: 10.1201/9781420059946.ch4
Camposeo, S., Vivaldi, G.A., Gattullo, C.E., 2013. Ripening indices and harvesting times of different olive
cultivars for continuous harvest. Scientia Horticulturae 151, 1-10. doi:
10.1016/j.scienta.2012.12.019.
Coutino-Estrada, B., Vidal-Martinez, V.A., 2003. Grain yield stability of corn hybrids using best linear
unbiased predictors. Agrociencia 37, 605-616.
Covas, MI., Ruiz-Gutierrez, V., de la Torre, R., Kafatos, A., Lamuela-Raventos, RM., Osada, J., Owen,
RW., Visioli, F., (2006) Minor components of olive oil: Evidence to date of health benefits in
humans. Nutrition Reviews 64 (10):S20-S30. doi:10.1301/nr.2006.oct.S20-S30
de la Rosa, R., Kiran, AI., Barranco, D., Leon, L., 2006. Seedling vigour as a preselection criterion for short
juvenile period in olive breeding. Australian Journal of Agricultural Research 57 (4):477-481.
doi:10.1071/ar05219
de la Rosa, R., Leon, L., Moreno, I., Barranco, D., Rallo, L., 2008. Ripening time and fruit characteristics
of advanced olive selections for oil production. Australian Journal of Agricultural Research 59
(1):46-51. doi:10.1071/ar07142
de la Rosa, R., Arias-Calderon, R., Velasco, L., Leon, L., 2016. Early selection for oil quality components
in olive breeding progenies. European Journal of Lipid Science and Technology 118, 1160-1167.
https://doi.org/10.1002/ejlt.201500425

Bibliografía
- 42 -
del Río, C., Romero, A.M., 1999. Whole, unmilled olives can be used to determine their oil content by
nuclear magnetic resonance. HortTechnology 9, 675-680.
DeLacy, I.H., Basford, K.E., Cooper, M., K., B.J., McLaren, C.G., 1996. Analysis of multi-environment
trials–an historical perspective. . In: M.Cooper and G.L. Hammer (Eds.), Plant adaptation and crop
improvement, CAB International, Wallingford, U.K., p. 39–124.
Diaz, A., Martin, A., Rallo, P., Barranco, D., De la Rosa, R., 2006. Self-incompatibility of 'Arbequina' and
'Picual' olive assessed by SSR markers. Journal of the American Society for Horticultural Science
131, 250-255. https://doi.org/10.21273/JASHS.131.2.250
Duarte, F., Jones, N., Fleskens, L., 2008. Traditional olive orchards on sloping land: Sustainability or
abandonment? J Environ Manage 89 (2):86-98. doi:10.1016/j.jenvman.2007.05.024
Duchene, E., Dumas, V., Jaegli, N., Merdinoglu, D., 2012. Deciphering the ability of different grapevine
genotypes to accumulate sugar in berries. Aust. J. Grape Wine Res. 18, 319-328. doi:
10.1111/j.1755-0238.2012.00194.x.
Eberhart, S.A., Russell, W.A., 1966. Stability parameters for comparing varieties. Crop Sci. 6, 36-&.
Ebrahimi, F., Majidi, M.M., Arzani, A., Mohammadi-Nejad, G., 2016. Oil and seed yield stability in a
worldwide collection of safflower under arid environments of Iran. Euphytica 212, 131-144. doi:
10.1007/s10681-016-1779-y.
El Yaacoubi, A., Malagi, G., Oukabli, A., Hafidi, M., Legave, J.-M., 2014. Global warming impact on
floral phenology of fruit trees species in Mediterranean region. Scientia Horticulturae 180, 243-
253. https://doi.org/10.1016/j.scienta.2014.10.041
Escrich, E., Ramirez-Tortosa, MC., Sanchez-Rovira, P., Colomer, R., Solanas, M., Gaforio, J., 2006. Olive
oil in cancer prevention and progression. Nutrition Reviews 64 (10):S40-S52.
doi:10.1301/nr.2006.oct.S40-S52
Estruch, R., Ros, E., Salas-Salvado, J., Covas, M-I., Corella, D., Aros, F., 2018. Primary Prevention of
Cardiovascular Disease with a Mediterranean Diet Supplemented with Extra-Virgin Olive Oil or
Nuts. The New England journal of medicine. doi:10.1056/NEJMoa1800389
Fernandez-Cuesta, A., Kodad, O., Company, RSI., Velasco, L., 2012. Phytosterol Variability in Almond
Germplasm. Journal of the American Society for Horticultural Science 137 (5):343-348
Fernandez-Cuesta, A., Leon, L., Velasco, L., de la Rosa, R., 2013. Changes in squalene and sterols
associated with olive maturation. Food Research International 54 (2):1885-1889.
doi:10.1016/j.foodres.2013.07.049
Finlay, K.W., Wilkinson, G.N., 1963. Analysis of adaptation in a plant-breeding programme. . Australian
Journal of Agricultural Research 14, 742-&.
Finn, C.E., Hancock, J.F., Mackey, T., Serce, S., 2003. Genotype X environment interactions in highbush
blueberry (Vaccinium sp. L.) families grown in Michigan and Oregon. Journal of the American
Society for Horticultural Science 128, 196-200.
Fornaciari, M., Pieroni, L., Ciuchi, P., Romano, B., 1998. A regression model for the start of the pollen
season in Olea europaea. Grana 37, 110-113. https://doi.org/10.1080/00173139809362652
Frías, L., García-Ortiz, A., Hermoso, M., Jiménez, A., Llavero Del Pozo, MP., et al., 1991. Analistas de
laboratorio de almanzara. Junta de Andalucía: Sevilla.
Gabaldon-Leal, C., Ruiz-Ramos, M., de la Rosa, R., Leon, L., Belaj, A., et al., 2017. Impact of changes in
mean and extreme temperatures caused by climate change on olive flowering in southern Spain.
International Journal of Climatology 37, 940-957. doi: 10.1002/joc.5048.
Galan, C., Garcia-Mozo, H., Vazquez, L., Ruiz, L., de la Guardia, C.D., et al., 2005. Heat requirement for
the onset of the Olea europaea L. pollen season in several sites in Andalusia and the effect of the
expected future climate change. International Journal of Biometeorology 49, 184-188.
https://doi.org/10.1007/s00484-004-0223-5
Garcia-Inza, G.P., Castro, D.N., Hall, A.J., Rousseaux, M.C., 2014. Responses to temperature of fruit dry
weight, oil concentration, and oil fatty acid composition in olive (Olea europaea L. var. 'Arauco').
Eur. J. Agron. 54, 107-115. doi: 10.1016/j.eja.2013.12.005.
Garcia-Mozo, H., Oteros, J., Galan, C., 2015. Phenological changes in olive (Ola europaea L.) reproductive
cycle in southern Spain due to climate change. Annals of Agricultural and Environmental
Medicine 22, 421-428. https://doi.org/10.5604/12321966.1167706
Garcia, J.M., Mancha, M., 1992. Evolution of the lipids biosynthesis during the maturation of the olive
varieties Picual and Gordal. Grasas Y Aceites 43, 277-280.
Gauch, HG., Piepho, HP., Annicchiarico, P., 2008. Statistical analysis of yield trials by AMMI and GGE:
Further considerations. Crop Sci 48 (3):866-889. doi:10.2135/cropsci2007.09.0513
Gauch, H.G., Zobel, R.W., 1997. Identifying mega-environments and targeting genotypes. Crop Sci. 37,
311-326. doi: 10.2135/cropsci1997.0011183X003700020002x.

Bibliografía
- 43 -
Giannakopoulos, C., Le Sager, P., Bindi, M., Moriondo, M,, Kostopoulou, E., Goodess, CM., 2009.
Climatic changes and associated impacts in the Mediterranean resulting from a 2 degrees C global
warming. Glob Planet Change 68 (3):209-224. doi:10.1016/j.gloplacha.2009.06.001
Giorgi, F., Lionello, P., 2008. Climate change projections for the Mediterranean region. Glob. Planet.
Change 63, 90-104. https://doi.org/10.1016/j.gloplacha.2007.09.005
Gonzalez-Barrios, P., Castro, M., Perez, O., Vilaro, D., Gutierrez, L., 2017. Genotype by environment
interaction in sunflower (Helianthus annus L.) to optimize trial network efficiency. Spanish
Journal of Agricultural Research 15. doi: 10.5424/sjar/2017154-11016.
Guilly, S., Dumont, T., Thong-Chane, A., Barau, L., Hoarau, J.-Y., 2017. Analysis of multienvironment
trials (MET) in the sugarcane breeding program of Reunion Island. Euphytica 213.
https://doi.org/10.1007/s10681-017-1994-1
Guo, ZB., Jia, XZ., Zheng, ZC., Lu, X., Zheng, YF., Zheng, BD., Xiao, JB., 2018. Chemical composition
and nutritional function of olive (Olea europaea L.): a review. Phytochem Rev 17 (5):1091-1110.
doi:10.1007/s11101-017-9526-0
Hardner, C.M., Evans, K., Brien, C., Bliss, F., Peace, C., 2016. Genetic architecture of apple fruit quality
traits following storage and implications for genetic improvement. Tree Genetics & Genomes 12.
doi: 10.1007/s11295-016-0977-z.
Hassani, M., Heidari, B., Dadkhodaie, A., Stevanato, P., 2018. Genotype by environment interaction
components underlying variations in root, sugar and white sugar yield in sugar beet (Beta vulgaris
L.). Euphytica 214, 21. doi: 10.1007/s10681-018-2160-0.
Hernandez, ML., Sicardo, MD., Alfonso, M., Martinez-Rivas, JM., 2019. Transcriptional Regulation of
Stearoyl-Acyl Carrier Protein Desaturase Genes in Response to Abiotic Stresses Leads to Changes
in the Unsaturated Fatty Acids Composition of Olive Mesocarp. Frontiers in Plant Science 10:12.
doi:10.3389/fpls.2019.00251
IPCC, 2018. Global warming of 1.5°C. An IPCC Special Report on the impacts of global warming of 1.5°C
above pre-industrial levels and related global greenhouse gas emission pathways, in the context of
strengthening the global response to the threat of climate change, sustainable development, and
efforts to eradicate poverty [V. Masson-Delmotte, P. Zhai, H. O. Pörtner, D. Roberts, J. Skea, P.R.
Shukla, A. Pirani, W. Moufouma-Okia, C. Péan, R. Pidcock, S. Connors, J. B. R. Matthews, Y.
Chen, X. Zhou, M. I. Gomis, E. Lonnoy, T. Maycock, M. Tignor, T. Waterfield (eds.)]. In Press.
Janick,. J, Moore, JN., 1996. Fruit Breeding. John Wiley, New York
KamalEldin, A., Andersson, R., 1997. A multivariate study of the correlation between tocopherol content
and fatty acid composition in vegetable oils. Journal of the American Oil Chemists Society 74
(4):375-380. doi:10.1007/s11746-997-0093-1
Kaniewski, D., Van Campo, E., Boiy, T., Terral, J-F., Khadari, B., Besnard, G., 2012. Primary
domestication and early uses of the emblematic olive tree: palaeobotanical, historical and
molecular evidence from the Middle East. Biological Reviews 87 (4):885-899.
doi:10.1111/j.1469-185X.2012.00229.x
Koubouris, G.C., Metzidakis, I.T., Vasilakakis, M.D., 2010. Phenological, morphological and functional
indicators of genetic variability and their implication in the sexual reproductive system of Olea
europaea L. (Oleaceae). Scientia Horticulturae 123, 547-550.
https://doi.org/10.1016/j.scienta.2009.11.012
Lavee, S., 1990. Aims, methods and advances in breeding of new olive (Olea-europaea, L.) cultivars.
Proceedings of the I International Symposium on Olive Growing 286:23-36
Lavee, S., Wodner, M., 1991. Factors affecting the nature of oil accumulation in fruit of olive (Olea-
europaea L) cultivars. Journal of Horticultural Science 66, 583-591. doi:
10.1080/00221589.1991.11516187.
Lavee, S., Rallo, L., Rapoport, H.F., Troncoso, A., 1996. The floral biology of the olive: Effect of flower
number, type and distribution on fruitset. Scientia Horticulturae 66, 149-158.
https://doi.org/10.1016/S0304-4238(96)00941-7
Lavee, S., Avidan, B., & Meni, Y. , 2003. " Askal", una nueva variedad de almazara sobresaliente por su
comportamiento agronómico para olivares intensivos y superintensivos. Olivae: revista oficial del
Consejo Oleícola Internacional 97, 53-59.
Legave, J.M., Fournier, D., Costes, E., 2006. Genotype x location interactions on architectural and floral
traits in apricot tree. Proceedings of the Xiiith International Symposium on Apricot Breeding and
Culture, 33-+. https://doi.org/10.17660/ActaHortic.2006.717.2
Leon, L., Rallo, L., Del Rio, C., Martin, L.M., 2004. Variability and early selection on the seedling stage
for agronomic traits in progenies from olive crosses. Plant Breeding 123, 73-78. doi:
10.1046/j.0179-9541.2003.00920.x.

Bibliografía
- 44 -
Leon, L., de la Rosa, R., Gracia, A., Barranco, D., Rallo, L., 2008. Fatty acid composition of advanced
olive selections obtained by crossbreeding. J Sci Food Agric 88 (11):1921-1926.
doi:10.1002/jsfa.3296
Leon, L., Beltran, G., Aguilera, MP., Rallo, L., Barranco, D., de la Rosa, R., 2011. Oil composition of
advanced selections from an olive breeding program. European Journal of Lipid Science and
Technology 113 (7):870-875. doi:10.1002/ejlt.201000535
León, L., 2014. Material vegetal y mejora. IV Jornadas del Grupo de Olivicultura de la Sociedad Española
de Ciencias Hortícolas
Leon, L., Velasco, L., de la Rosa, R., 2015. Initial selection steps in olive breeding programs. Euphytica
201, 453-462. doi: 10.1007/s10681-014-1232-z.
Leon, L., de la Rosa, R., Velasco, L., Belaj, A., 2018. Using Wild Olives in Breeding Programs:
Implications on Oil Quality Composition. Frontiers in Plant Science 9.
doi:10.3389/fpls.2018.00232
Lionello, P. (Ed.). (2012). The climate of the Mediterranean region: From the past to the future. Elsevier.
Luedeling, E., Gassner, A., 2012. Partial Least Squares Regression for analyzing walnut phenology in
California. Agricultural and Forest Meteorology 158, 43-52. doi:
10.1016/j.agrformet.2011.10.020.
Luedeling, E., Kunz, A., Blanke, M.M., 2013. Identification of chilling and heat requirements of cherry
trees-a statistical approach. International Journal of Biometeorology 57, 679-689. doi:
10.1007/s00484-012-0594-y.
Mailer, R.J., Ayton, J., Graham, K., 2010. The Influence of Growing Region, Cultivar and Harvest Timing
on the Diversity of Australian Olive Oil. Journal of the American Oil Chemists Society 87 (8):877-
884. doi:10.1007/s11746-010-1608-8
Mailer, R.J., Ayton, J., Conlan, D., 2007. Influence of harvest timing on olive (Olea europaea) oil
accumulation and fruit characteristics under Australian conditions. Journal of Food Agriculture &
Environment 5, 58-63.
Mancuso, S., Pasquali, G., Fiorino, P., 2002. Phenology modelling and forecasting in olive (Olea europaea
L.) using artificial neural networks. Advances in horticultural science Vol. 16, 155-164.
Mickelbart, M.V., James, D., 2003. Development of a dry matter maturity index for olive (Olea europaea).
New Zealand Journal of Crop and Horticultural Science 31, 269-276. doi:
10.1080/01140671.2003.9514261.
Monselise, S.P., Goldschmidt, E.E., 1982. Alternate bearing in fruit trees. Horticultural Reviews 4, 128-
173.
Moreno-Alias, I., de la Rosa, R., Rapoport, H.F., 2013. Floral quality components of a new olive cultivar
and its parents. Scientia Horticulturae 154, 17-19. https://doi.org/10.1016/j.scienta.2013.02.014
Moreno-Alias, I., Rapoport, H.F., Martins, P.C., 2012. Morphological Limitations in Floral Development
among Olive Tree Cultivars. Xxviii International Horticultural Congress on Science and
Horticulture for People (Ihc2010): International Symposium on Plant Physiology from Cell to
Fruit Production System 932, 23-27. https://doi.org/ 10.17660/ActaHortic.2012.932.2
Navas-Lopez, J., León, L., Rapoport., H.F., M-A, I., Lorite, I., , de la Rosa, R., 2019a. Genotype,
environment and their interaction effects on olive tree flowering phenology and flower quality.
Euphytica 215(11):1-13. doi:10.1007/s10681-019-2503-5
Navas-Lopez, J., Leon, L., Trentacoste, E.R., de la Rosa, R. 2019b. Multi-environment evaluation of oil
accumulation pattern parameters in olive. Plant physiology and biochemistry : PPB 139:485-494.
doi:10.1016/j.plaphy.2019.04.016
Navas-López, J.F., León, L., Rapoport, H.F., Moreno-Alías, I., Medina, M.G., et al., 2018. Flowering
phenology and flower quality of cultivars ‘Arbequina’, ‘Koroneiki’ and ‘Picual’ in different
environments of southern Spain. Acta Horticulturae In International Symposium on Flowering,
Fruit Set and Alternate Bearing 1229, (2017, June). (pp. 257-262). https://doi.org/
10.17660/ActaHortic.2018.1229.39
Nolasco, S.M., Aguirrezabal, L.A.N., Crapiste, G.H., 2004. Tocopherol oil concentration in field-grown
sunflower is accounted for by oil weight per seed. Journal of the American Oil Chemists Society
81 (11):1045-1051. doi:10.1007/s11746-004-1020-6
Orlandi, F., Sgromo, C., Bonofiglio, T., Ruga, L., Romano, B., et al., 2009. A comparison among olive
flowering trends in different Mediterranean areas (south-central Italy) in relation to meteorological
variations. Theoretical and Applied Climatology 97, 339-347. https://doi.org/10.1007/s00704-
008-0079-4
Osborne, C.P., Chuine, I., Viner, D., Woodward, F.I., 2000. Olive phenology as a sensitive indicator of
future climatic warming in the Mediterranean. Plant Cell and Environment 23, 701-710.
https://doi.org/10.1046/j.1365-3040.2000.00584.x

Bibliografía
- 45 -
Oteros, J., Garcia-Mozo, H., Vazquez, L., Mestre, A., Dominguez-Vilches, E., et al., 2013. Modelling olive
phenological response to weather and topography. Agriculture Ecosystems & Environment 179,
62-68. doi: 10.1016/j.agee.2013.07.008.
Paiva-Martins, F., & Kiritsakis, A., 2017. Olive fruit and olive oil composition and their functional
compounds. Olives and Olive Oil as Functional Foods: Bioactivity, Chemistry and Processing:15,
35
Perez-Jimenez, F., Ruano, J., Perez-Martinez, P., Lopez-Segura, F., Lopez-Miranda, J., 2007. The influence
of olive oil on human health: Not a question of fat alone. Molecular Nutrition & Food Research
51 (10):1199-1208. doi:10.1002/mnfr.200600273
Rakshit, S., Ganapathy, K.N., Gomashe, S.S., Rathore, A., Ghorade, R.B., et al., 2012. GGE biplot analysis
to evaluate genotype, environment and their interactions in sorghum multi-location data.
Euphytica 185, 465-479. https://doi.org/10.1007/s10681-012-0648-6
Rallo, L., 1995. Selección y mejora genética del olivo en España. Olivae 59:46-53
Rallo, L., Barranco, D., Caballero, J.M,, Del Rio, C., Martín, A., Tous, J., Trujillo, I., 2005. Variedades de
olivo en España.
Rallo, L., Barranco, D., Castro-Garcia, S., Connor, D.J., del Campo, M.G., Rallo, P., 2013. High-Density
Olive Plantations. In: Janick J (ed) Horticultural Reviews, Vol 41, vol 41. Horticultural Reviews.
John Wiley & Sons, Chichester, pp 303-383
Rallo, L., Barranco, D., de la Rosa, R., Leon, L., 2008. 'Chiquitita' olive. Hortscience 43, 529-531.
Rapoport, H.F., 2014. The Reproductive Biology of the Olive Tree and Its Relationship to Extreme
Environmental Conditions. Vii International Symposium on Olive Growing 1057, 41-50.
https://doi.org/10.17660/ActaHortic.2014.1057.2
Rapoport, H.F., Hammami, S.B.M., Martins, P., Perez-Priego, O., Orgaz, F., 2012. Influence of water
deficits at different times during olive tree inflorescence and flower development. Environmental
and Experimental Botany 77, 227-233. https://doi.org/10.1016/j.envexpbot.2011.11.021
Reale, L., Sgromo, C., Bonofiglio, T., Orlandi, F., Fornaciari, M., et al., 2006. Reproductive biology of
olive (Olea europaea L.) DOP umbria cultivars. Sexual Plant Reproduction 19, 151-161.
https://doi.org/10.1007/s00497-006-0032-6
Ripa, V., De Rose, F., Caravita, M. A., Parise, M. R., Perri, E., Rosati, A., ... & Giordani, E., 2008.
Qualitative evaluation of olive oils from new olive selections and effects of genotype and
environment on oil quality. Advances in horticultural science [rivista dell'ortofloroftutticoltura
italiana] 22 (2):1000-1009
Rodrigues, N., Casal, S., Peres, A.M., Baptista, P., Bento, A., Martin, H., Asensio-S-Manzanera, M.C.,
Pereira, J.A., 2018. Effect of olive trees density on the quality and composition of olive oil from
cv. Arbequina. Scientia Horticulturae 238:222-233. doi:10.1016/j.scienta.2018.04.059
Rojo, J., Perez-Badia, R., 2015. Models for forecasting the flowering of Cornicabra olive groves.
International Journal of Biometeorology 59, 1547-1556. https://doi.org/10.1007/s00484-015-
0961-6
Rondanini, D.P., Castro, D.N., Searles, P.S., Rousseaux, M.C., 2011. Fatty acid profiles of varietal virgin
olive oils (Olea europaea L.) from mature orchards in warm arid valleys of Northwestern
Argentina (La Rioja). Grasas Y Aceites 62 (4):399-409. doi:10.3989/gya.125110
Rondanini, D.P., Castro, D.N., Searles, P.S., Cecilia Rousseaux, M., 2014. Contrasting patterns of fatty
acid composition and oil accumulation during fruit growth in several olive varieties and locations
in a non-Mediterranean region. European Journal of Agronomy 52, 237-246. doi:
10.1016/j.eja.2013.09.002.
Rosati, A., Caporali, S., Paoletti, A., Famiani, F., 2011. Pistil abortion is related to ovary mass in olive
(Olea europaea L.). Scientia Horticulturae 127 (4):515-519.
https://doi.org/10.1016/j.scienta.2010.12.002
Rotondi, A., Alfei, B., Magli, M., Pannelli, G., 2010. Influence of genetic matrix and crop year on chemical
and sensory profiles of Italian monovarietal extra-virgin olive oils. J Sci Food Agric 90 (15):2641-
2648. doi:10.1002/jsfa.4133
Rotundo, J.L., Westgate, M.E., 2009. Meta-analysis of environmental effects on soybean seed composition.
Field Crop. Res. 110, 147-156. doi: 10.1016/j.fcr.2008.07.012.
S.S. Miller, R.W. McNew, B.H. Barritt, L. Berkertt, S.K. Brown JA, Cline JMC, W.P. Cowgill, R.M.
Crassweller, M.E. Carcia, D.W. Greene, G.M. Greene, C.R. Hampson, I. Merwin, D.D. Miller,
R.E. Moran, C.R. Rom, T.R. Roper, J.R. Shupp, Stover, E., 2005a. Effect of cultivar and site on
fruit quality as demostrated by NE-183 regional project on apple cultivars. HortTechnology 15
(4):886-895

Bibliografía
- 46 -
Salazar-García, D. C. M, R. P, J. A.,, Lopéz-Cortés I., 2018. Unexplored olive cultivars from the Valencian
Community (Spain): some chemical characteristics as a valorization strategy. European Food
Research and Technology 1-10. doi:10.1007/s00217-018-3164-7
Sanchez-Estrada, A., Cuevas, J., 2018. 'Arbequina' olive is self-incompatible. Scientia Horticulturae 230,
50-55. https://doi.org/10.1016/j.scienta.2017.11.018
Sanz-Cortes, F., Martinez-Calvo, J., Badenes, M.L., Bleiholder, H., Hack, H., et al., 2002. Phenological
growth stages of olive trees (Olea europaea). Annals of Applied Biology 140, 151-157.
https://doi.org/10.1111/j.1744-7348.2002.tb00167.x
Tanasijevic, L., Todorovic, M., Pereira, L.S., Pizzigalli, C., Lionello, P., 2014. Impacts of climate change
on olive crop evapotranspiration and irrigation requirements in the Mediterranean region. Agric
Water Manage 144:54-68. doi:10.1016/j.agwat.2014.05.019
Torres, M., Pierantozzi, P., Searles, P., Rousseaux, M.C., Garcia-Inza, G., et al., 2017. Olive Cultivation in
the Southern Hemisphere: Flowering, Water Requirements and Oil Quality Responses to New
Crop Environments. Frontiers in Plant Science 8. https://doi.org/10.3389/fpls.2017.01830
Tous, J., Romero, A., Plana, J., Hermoso, J.F., 2007. Olive oil cultivars suitable for very-high density
planting conditions. Proceedings of the Fifth International Symposium on Olive Growing, Vols 1
and 2 (791):403-408. doi:10.17660/ActaHortic.2008.791.59
Trentacoste, E.R., Puertas, C.M., Sadras, V.O., 2010. Effect of fruit load on oil yield components and
dynamics of fruit growth and oil accumulation in olive (Olea europaea L.). European Journal of
Agronomy 32, 249-254. doi: 10.1016/j.eja.2010.01.002.
Trentacoste, E.R., Puertas, C.M., Sadras, V.O., 2012. Modelling the intraspecific variation in the dynamics
of fruit growth, oil and water concentration in olive (Olea europaea L.). European Journal of
Agronomy 38, 83-93. doi: 10.1016/j.eja.2012.01.001.
Triboi, E., Triboi-Blondel, A.M., 2002. Productivity and grain or seed composition: a new approach to an
old problem - invited paper. European Journal of Agronomy 16, 163-186. doi: 10.1016/S1161-
0301(01)00146-0.
Uceda, M., Hermoso, M., Aguilera, M., 2008. La calidad del aceite de oliva; en Barranco, D, Fernández-
Escobar, R y Rallo, L (Eds.) “El cultivo del olivo”. Madrid: Junta de Andalucía y Eds. Mundi-
Prensa: 699-727.
Velasco, L., Fernandez-Cuesta, A., de la Rosa, R., Ruiz-Mendez M.V., Leon, L., 2014. Selection for Some
Olive Oil Quality Components Through the Analysis of Fruit Flesh. Journal of the American Oil
Chemists Society 91 (10):1731-1736. doi:10.1007/s11746-014-2523-1
Verissimo, V., Gardin, J.P., Trevisan, R., da Silva, J.B., Herter, F.G., 2002. Morphological and physical
parameters of flower buds of trees of two Japanese pear cultivars grown at three different areas of
Southern Brazil, and their relationship with flower bud abortion intensity. Proceedings of the
International Symposium on Asian Pears Commemorating the 100th Anniversary of Nijisseiki
Pear, Vols I and Ii, 381-387. https://doi.org/10.17660/ActaHortic.2002.587.51
Wang, J.W., Ma, L.Y., Gomez-del-Campo, M., Zhang, D.S., Deng, Y., Jia, Z.K., 2018. Youth tree behavior
of olive (Olea europaea L.) cultivars in Wudu, China: Cold and drought resistance, growth, fruit
production, and oil quality. Scientia Horticulturae 236:106-122.
doi:10.1016/j.scienta.2018.03.033
Warleta, F., Quesada, C.S., Campos, M., Allouche, Y., Beltran, G., Gaforio, J.J., 201. Hydroxytyrosol
Protects against Oxidative DNA Damage in Human Breast Cells. Nutrients 3 (10):839-857.
doi:10.3390/nu3100839
Williams, R.R., 1965. Effect of summer nitrogen applications on quality of apple blossom. Journal of
Horticultural Science & Biotechnology 40, 31-&.
https://doi.org/10.1080/00221589.1965.11514118
Yan, W.K., Hunt, L.A., Sheng, Q.L., Szlavnics, Z., 2000. Cultivar evaluation and mega-environment
investigation based on the GGE biplot. Crop Sci. 40, 597-605.
https://doi.org/10.2135/cropsci2000.403597x
Yan, W., Kang, M.S., 2002. GGE biplot analysis: A graphical tool for breeders, geneticists, and
agronomists. CRC press. CRC press.
Yan, W., Kang, M.S., Ma, B., Woods, S., Cornelius, P.L., 2007. GGE biplot vs. AMMI analysis of
genotype-by-environment data. Crop Sci 47 (2):643-655. doi:10.2135/cropsci2006.06.0374
Zapata, D., Salazar, M., Chaves, B., Keller, M., Hoogenboom, G., 2015. Estimation of the base temperature
and growth phase duration in terms of thermal time for four grapevine cultivars. International
Journal of Biometeorology 59, 1771-1781. doi: 10.1007/s00484-015-0985-y.