memorandum to: council members from: mike starrett …presenter: mike starrett : summary: a...
TRANSCRIPT

851 S.W. Sixth Avenue, Suite 1100 Steve Crow 503-222-5161 Portland, Oregon 97204-1348 Executive Director 800-452-5161 www.nwcouncil.org Fax: 503-820-2370
Jennifer Anders Chair
Montana
Richard Devlin Vice Chair
Oregon
Bo Downen Montana
Guy Norman Washington
Patrick Oshie Washington
Ted Ferrioli
Oregon
Jim Yost Idaho
Jeffery C. Allen
Idaho
November 5, 2019
MEMORANDUM TO: Council Members FROM: Mike Starrett SUBJECT: Onshore Wind Generation Reference Plant BACKGROUND: Presenter: Mike Starrett Summary: A reference plant defines the size, cost, operating characteristics, and
maximum build out of a given generating resource type and configuration. A single technology type could have multiple reference plants to differentiate, for example, a Montana-based wind resource from a wind resource located in the Columbia Gorge.
Reference plants serve as a key input for the Council’s portfolio expansion modeling tools and are also used by other entities throughout the region.
Draft reference plants are developed in coordination with the Generating Resources Advisory Committee and are then brought to the Council before being incorporated into the tools used in the development of the Plan.
This presentation will introduce the draft reference plants for Onshore
Wind. Workplan: Prepare for 2021 Power Plan More Info: Reference plants for the 7th Power Plan are described in Appendix H

11/5/2019
1
Wind Reference Plant for the 2021 Power PlanMike Starrett, Ph.D.
Defining a Reference Plant
• A reference plant describes how a particular technology is represented in the Council’s planning models
• Captures characteristics such as• Overnight capital cost ($/kW)• Generation shape/profile
(renewables)• Efficiency/heat rate• Learning curves• Etc.
2
Example: 7th Power Plan – CC Gas
11/5/2019
2
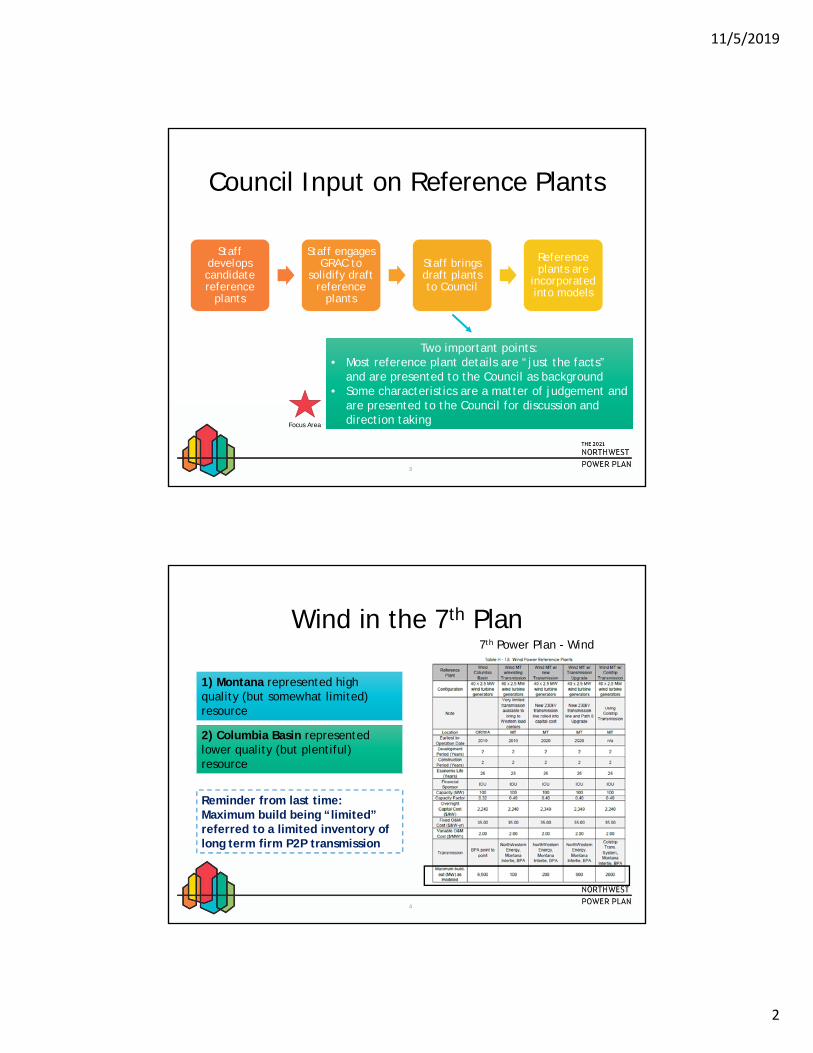
Council Input on Reference Plants
3
Staff develops candidate reference
plants
Staff engages GRAC to
solidify draft reference
plants
Staff brings draft plants to Council
Reference plants are
incorporated into models
Two important points:• Most reference plant details are “just the facts”
and are presented to the Council as background• Some characteristics are a matter of judgement and
are presented to the Council for discussion and direction taking
Two important points:• Most reference plant details are “just the facts”
and are presented to the Council as background• Some characteristics are a matter of judgement and
are presented to the Council for discussion and direction takingFocus Area
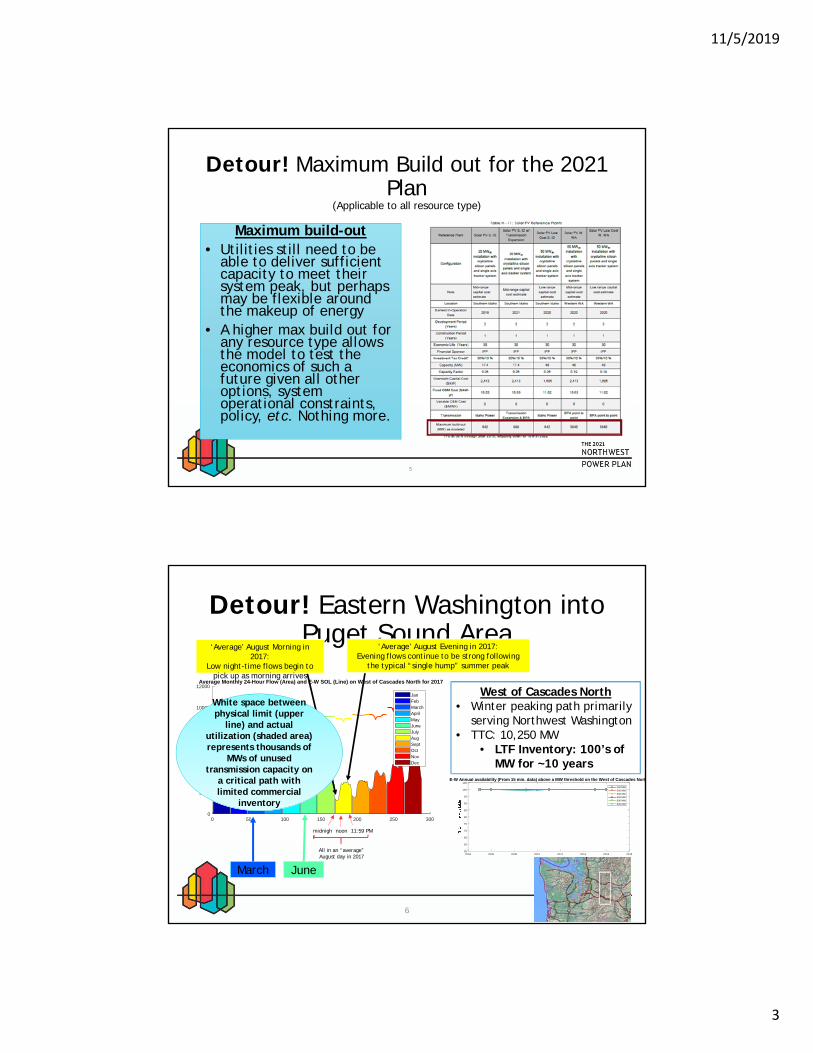
Wind in the 7th Plan
4
Reminder from last time: Maximum build being “limited” referred to a limited inventory of long term firm P2P transmission
1) Montana represented high quality (but somewhat limited) resource
2) Columbia Basin represented lower quality (but plentiful) resource
7th Power Plan - Wind
11/5/2019
3
Detour! Maximum Build out for the 2021 Plan
(Applicable to all resource type)
Maximum build-out • Utilities still need to be
able to deliver sufficient capacity to meet their system peak, but perhaps may be flexible around the makeup of energy
• A higher max build out for any resource type allows the model to test the economics of such a future given all other options, system operational constraints, policy, etc. Nothing more.
5
0 50 100 150 200 250 3000
2000
4000
6000
8000
10000
12000Average Monthly 24-Hour Flow (Area) and E-W SOL (Line) on West of Cascades North for 2017
JanFebMarchAprilMayJuneJulyAugSeptOctNovDec
Detour! Eastern Washington into Puget Sound Area
6
JuneMarch
‘Average’ August Morning in 2017:
Low night-time flows begin to pick up as morning arrives
‘Average’ August Evening in 2017: Evening flows continue to be strong following
the typical “single hump” summer peak
West of Cascades North• Winter peaking path primarily
serving Northwest Washington• TTC: 10,250 MW
• LTF Inventory: 100’s of MW for ~10 years
midnight
11:59 PMnoon
All in an “average” August day in 2017
2004 2006 2008 2010 2012 2014 2016 201855
60
65
70
75
80
85
90
95
100
105E-W Annual availability (From 15 min. data) above a MW threshold on the West of Cascades North
100 MW200 MW300 MW400 MW500 MW600 MW
White space between physical limit (upper
line) and actual utilization (shaded area) represents thousands of
MWs of unused transmission capacity on
a critical path with limited commercial
inventory

11/5/2019
4
Back to Wind: Wind is the largest source of renewable energy in the U.S.
7
https://www.eia.gov/todayinenergy/detail.php?id=34652
Wind surpasses hydro on MWh basis in 2018(But is still less than 10% of US energy supply) Wind development is primarily in the U.S. Interior
National Trend: The interior US is a world class wind resource
8
Montana
Nebraska North Dakota
Colstrip
11/5/2019
5
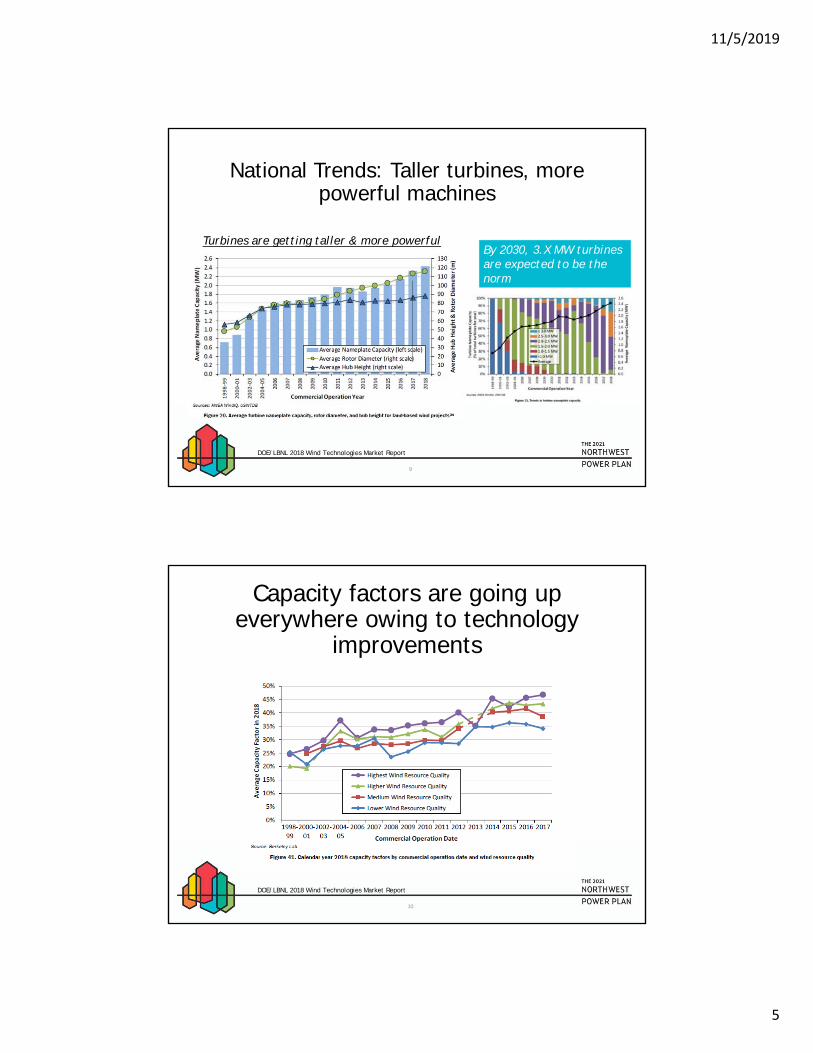
National Trends: Taller turbines, more powerful machines
9
DOE/LBNL 2018 Wind Technologies Market Report
Turbines are getting taller & more powerfulBy 2030, 3.X MW turbines are expected to be the norm
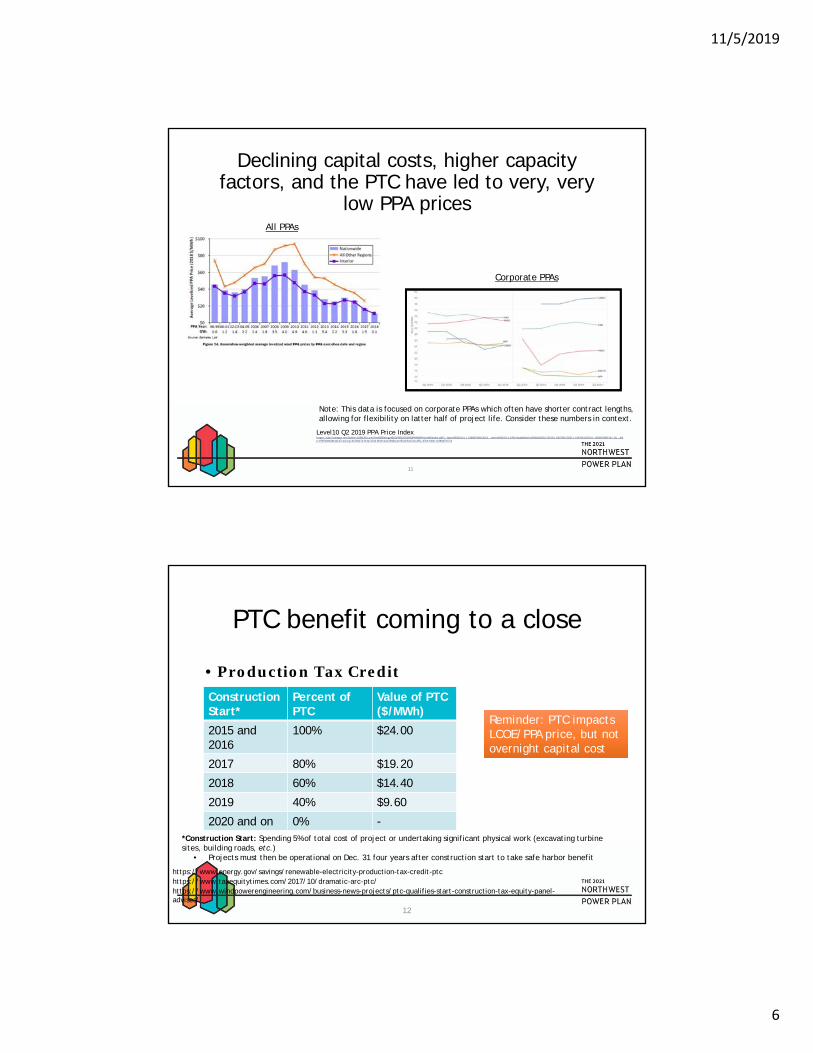
Capacity factors are going up everywhere owing to technology
improvements
10
DOE/LBNL 2018 Wind Technologies Market Report
11/5/2019
6
Declining capital costs, higher capacity factors, and the PTC have led to very, very
low PPA prices
11
Level10 Q2 2019 PPA Price Indexhttps://cdn2.hubspot.net/hubfs/4108426/LevelTen%20Energy%20Q2%202019%20PPA%20Price%20Index.pdf?__hssc=83931014.1.1568923991351&__hstc=83931014.4281e5aab9bdc5c0f8bd3002b212f42d.1567961420011.1567961420011.1568923991351.2&__hsfp=979762834&hsCtaTracking=347b5e74-bf34-47d2-8fb8-4c2cf942ecac%7C4c5ce72d-25f1-47b6-910e-fcd8d47bf7c3
Note: This data is focused on corporate PPAs which often have shorter contract lengths, allowing for flexibility on latter half of project life. Consider these numbers in context.
All PPAs
Corporate PPAs
PTC benefit coming to a close
• Production Tax Credit
12
https://www.energy.gov/savings/renewable-electricity-production-tax-credit-ptc
Construction Start*
Percent of PTC
Value of PTC ($/MWh)
2015 and 2016
100% $24.00
2017 80% $19.20
2018 60% $14.40
2019 40% $9.60
2020 and on 0% -*Construction Start: Spending 5% of total cost of project or undertaking significant physical work (excavating turbine sites, building roads, etc.)
• Projects must then be operational on Dec. 31 four years after construction start to take safe harbor benefit
https://www.taxequitytimes.com/2017/10/dramatic-arc-ptc/https://www.windpowerengineering.com/business-news-projects/ptc-qualifies-start-construction-tax-equity-panel-advises/
Reminder: PTC impacts LCOE/PPA price, but not overnight capital cost
Reminder: PTC impacts LCOE/PPA price, but not overnight capital cost

11/5/2019
7
Summary of discussion so far
1. Wind capacity has grown substantially
2. Turbines are getting taller
3. Capacity factors are going up
4. Capital costs have been going down
5. The PTC has been important in achieving very low PPA prices and driving “last minute” development1. FYI, the utility solar ITC begins declining in 2020 but
remains at 10% from 2022 and on
13
Back to the Region: Capital Costs in the 7th Plan Development
14
1000
1200
1400
1600
1800
2000
2200
2400
2600
2800
3000
3200
3400
3600
3800
4000
2004 2005 2006 2007 2008 2009 2010 2011 2012 2013 2014 2015 2016
OVER
NIGHT CAPITAL COST (2012 $/kW)
VINTAGE OF ESTIMATE
Generic StudiesDOE Wind Tech ReportPreconstruction EstimatesAs-built or Committed Costs6th Plan Final7th Plan Draft
Draft CEC Report
Lazard 2014
DOE 2013
E3 for WECC
EIA
Lazard 2013
Tucannon (WA)
Palouse (WA)Lower Snake River I (WA)
Dunlap I (WY)Shepard's Flat (OR)Spion Kop (MT)
Kittitas (WA)
Goshen North II (ID)Lime Wind (OR)Biglow Canyon (OR)

11/5/2019
8
Back to the Region: Capital Costs in the 7th Plan Mid-Term
15
Back to the Region: A look at Capital Costs Today for the 2021 Plan
16
1000
1100
1200
1300
1400
1500
1600
1700
1800
2014 2015 2016 2017 2018 2019 2020 2021 2022 2023
Capital Cost ($2016/kW)
Tech Vintage
Overnight Cost of Onshore Wind ‐ $2016/kW
NREL '19 ATB ‐ Low NREL '19 ATB ‐ Mid
LBNL '18 Lazard ‐ Low
Lazard ‐ High PGE 2016 IRP ($2016/kW)
PGE 2016 IRP Update ($2016/kW) PGE 2019 IRP‐OR ($2016/kW)
PSE 2017 IRP ($2016/kW) PSE 2019 pre‐IRP HDR‐MT ($2016/kW)
Avista 2017 IRP ($2016/kw) Avista 2019 IRP‐WA ($2016/kW)
Idaho Power 2017 IRP ($2016/kW) Pacificorp 2017 IRP Energy Vision 2020 Update (PAC) ($2016/kW)
Pacicorp 2019 pre‐IRP BMcD ($2016/kW) NWPCC Mid‐Term ‐ Low ($2016/kW)
NWPCC Mid‐Term ‐ High ($2016/kW)
Tech Vintage
Average Price from Source Data ($2016/kW)
2017 $1524
2018 $1525
2020 $1398
2021 $1378
2022 $1533

11/5/2019
9
Resource Locations
17
SE WAMT
Gorge
https://www.nwcouncil.org/energy/energy-topics/power-supply/map-of-power-generation-in-the-northwest
A look at capacity factors for reference plats in IRPs
18
Oregon Capacity Factors
PGE '16: Ione, OR, 2.0 MW 34.0%
PGE '16: Ione, OR, 2.0 MW 35.0%
PGE '19: Ione, OR, 3.6 MW 32.7%
PAC '19: OR, 3.5 MW 37.1%
Gorge Capacity FactorsPGE '19: Gorge, 3.6 MW(Similar shape to Ione, OR)
40.8%
NWPCC 2021P Draft Gorge, 3.6 MW 39.8%
Washington Capacity Factors
PGE '19: SE WA, 3.6 MW 42.9%
PSE '19: SE WA, ?? MW 31.9%
Avista '19: Off System, WA, 2.2 MW 37.0%
PAC '19: WA, 3.5 MW 37.1%
NWPCC 2021P Draft SE WA, 3.6 MW 41.2%
Montana Capacity Factors
PGE '19: Loco Mtn MT, 3.6 MW 42.9%
PSE '19: Near CTS MT, ?? MW 35.5%
PSE '19: Great Falls MT, ?? MW42.4%
Avista '19: MT, 2.2 MW 48.0%
NWPCC 2021P Draft MT, 3.6 MW 45.5%
Other Capacity Factors
PAC '19: WY, 3.5 MW 43.6%
PAC '19: ID, 3.5 MW 37.1%

11/5/2019
10
Back to the Region: A look at shape
19
0.00%
10.00%
20.00%
30.00%
40.00%
50.00%
60.00%
70.00%
80.00%
1 3 5 7 9 11
Monthly Capacity Factor
Month
Average Monthly Capacity Factor: '08 ‐ '12 Simulated as 3.6 MW Turbine, 100m hub height wind data, array of 60 turbines total
SE WA Great Falls MT Casper WY Columbia Gorge 0.00% 10.00% 20.00% 30.00% 40.00% 50.00%
Wind ‐ SE WA
Wind ‐ Great Falls MT
Wind ‐ Casper WY
Wind ‐ Columbia Gorge
Solar ‐ Boise, ID
Annual Average Capacity Factor: '08 ‐ '12 Simulated as 3.6 MW Turbine, 100m hub height wind data, array of 60 turbines total
0.00%
10.00%
20.00%
30.00%
40.00%
50.00%
1 3 5 7 9 11
Mon
thly
Cap
acit
y Fa
ctor
Month
Average Monthly Capacity Factor - Solar in Boise, ID
Solar - Boise, ID
FYI
Jan Dec
2021 Plan Reference Plant: Wind
20
Onshore Wind – Columbia Gorge
Onshore Wind –SE Washington
Onshore Wind -Montana
Configuration 60 x 3.6 MW, 105 meter hub height
60 x 3.6 MW, 105 meter hub height
60 x 3.6 MW, 105 meter hub height
Location OR/WA WA MT
Technology Vintage 2019 2019 2019
Development Period (Years) 2 2 2
Construction Period (Years) 1 1 1
Capacity (MW) 216 216 216
Capacity Factor (%) 39.8% 41.2% 45.5%
Overnight Capital Cost ($/kW) 1,450 1,450 1,450
Fixed O&M Cost ($/kW-yr) 30 30 30
Variable O&M ($/MWh) 0 0 0
Economic Life (years) 25 25 25
Financial Sponsor IPP IPP IPP
Transmission BPA P2P BPA P2P PSE CTS + MT Int + BPA P2P
Max Build Out TBD, substantial TBD, substantial TBD, substantial
11/5/2019
11
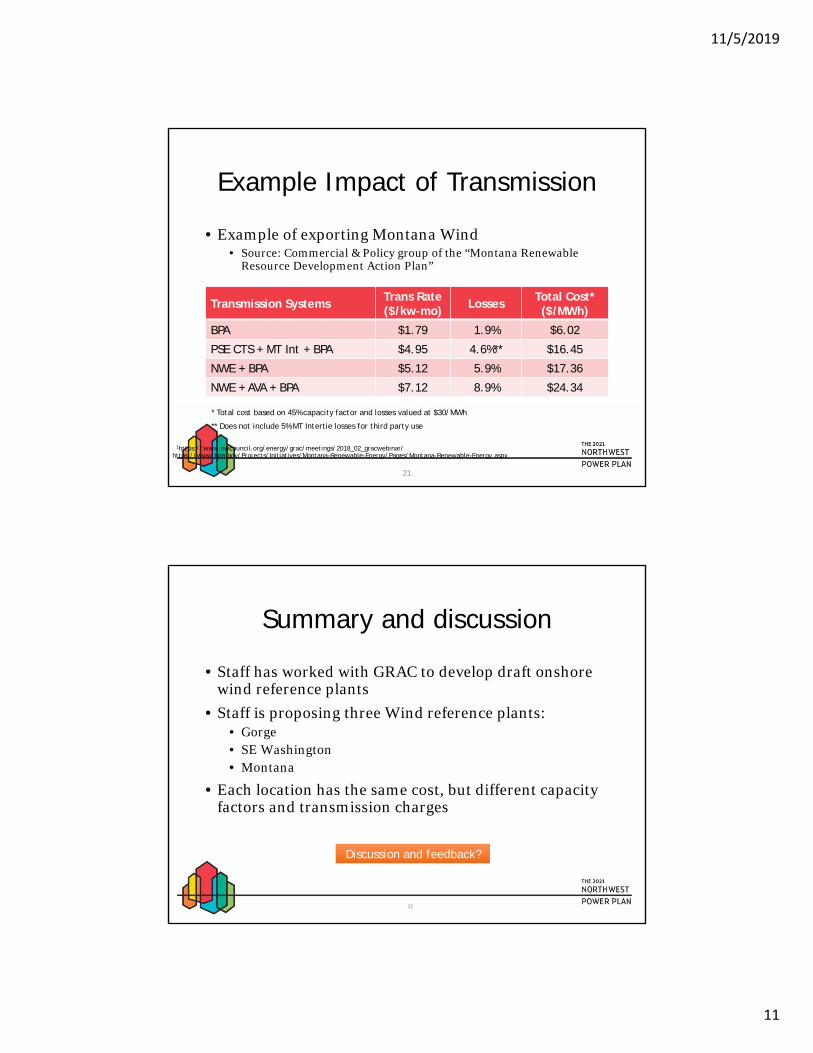
Example Impact of Transmission
• Example of exporting Montana Wind • Source: Commercial & Policy group of the “Montana Renewable
Resource Development Action Plan”
21
Transmission SystemsTrans Rate ($/kw-mo)
LossesTotal Cost* ($/MWh)
BPA $1.79 1.9% $6.02
PSE CTS + MT Int + BPA $4.95 4.6%** $16.45
NWE + BPA $5.12 5.9% $17.36
NWE + AVA + BPA $7.12 8.9% $24.34
https://www.bpa.gov/Projects/Initiatives/Montana-Renewable-Energy/Pages/Montana-Renewable-Energy.aspx1https://www.nwcouncil.org/energy/grac/meetings/2018_02_gracwebinar/
* Total cost based on 45% capacity factor and losses valued at $30/MWh
** Does not include 5% MT Intertie losses for third party use
Summary and discussion
• Staff has worked with GRAC to develop draft onshore wind reference plants
• Staff is proposing three Wind reference plants:• Gorge• SE Washington• Montana
• Each location has the same cost, but different capacity factors and transmission charges
22
Discussion and feedback?
11/5/2019
12
23
Additional Background Information and Backup Slides
24

11/5/2019
13
A detailed look at Capital Costs for the 2021 Plan
25
Source Tech Vintage
$2016/kW
Lazard - High 2017 1671
LBNL '18 2017 1594
IPC '17 IRP 2017 1565
NREL '19 ATB 2017 1610
Lazard - Low 2017 1180
Source Tech Vintage
$2016/kW
Avista '17 IRP 2018 1737
NWPCC Mid-Term - High 2018 1700
PGE '16 IRP 2018 1667
NREL '19 ATB - Mid 2018 1583
NREL '19 ATB - Low 2018 1573
Lazard - High 2018 1550
NWPCC Mid-Term - Low 2018 1500
PGE '19 IRP 2018 1457
PGE '16 IRP Update 2018 1425
LBNL '18 2018 1468
Lazard - Low 2018 1111
Source Tech Vintage
$2016/kW
NREL '19 ATB - Mid 2020 1502
NREL '19 ATB - Low 2020 1473PAC '17 IRP Update Vision 2020
20201310
PAC '19 IRP 2020 1308
Source Tech Vintage
$2016/kW
PSE '19 IRP-MT 2022 1754
NREL '19 ATB - Mid 2022 1448
NREL '19 ATB - Low 2022 1399
Source Tech Vintage
$2016/kW
Avista ‘19 IRP 2021 1378
Impacts of PTC
• Impact of Production Tax Credit: Drives current capital structure
26
Tax Equity – ~50% of total capital structure at 7-10% cost
Debt
Sponsor Equity
http://www.nortonrosefulbright.com/knowledge/publications/150031/new-trends-in-financing-wind-farmsNote: Lazard’s LCOE v. 11 assumed 15% debt at 8.0% interest, 70% tax equity at 10.0% cost, 15% common equity at 12.0% cost
https://www.nrel.gov/docs/fy17osti/68227.pdf & summary at https://www.taxequitytimes.com/2017/09/nrels-wind-finance-report-highlights/
Access to PTC + Depreciation (MACRS + Bonus)
7th Plan used 50/50 debt-to-equity (IOU) and 60/40 (IPP) based on the assumption that Wind projects in region would begin construction post-PTC

11/5/2019
14
Impacts of PTC
27
10 year tax benefit (Prior to 2017 Tax Reform)
https://www.nrel.gov/docs/fy17osti/68227.pdf
PTC benefit was substantial, but opportunities for lower cost financing may offset the impact somewhat in PPA
pricing
28
11/5/2019
15
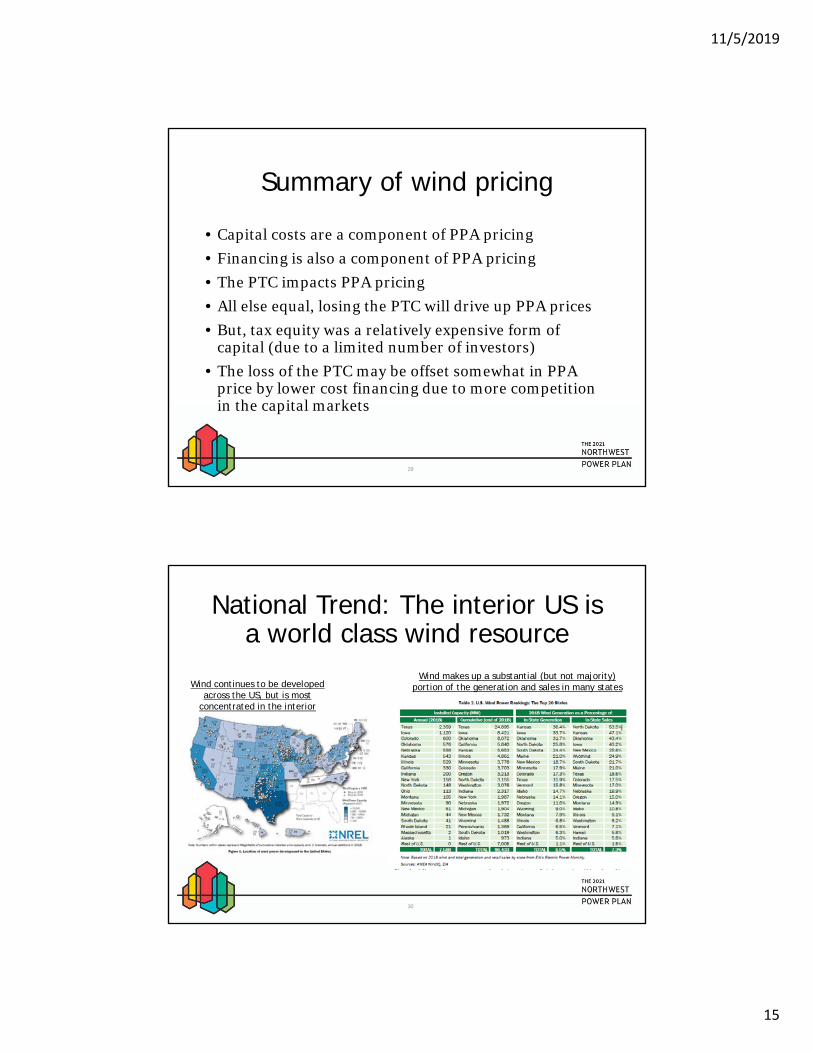
Summary of wind pricing
• Capital costs are a component of PPA pricing
• Financing is also a component of PPA pricing
• The PTC impacts PPA pricing
• All else equal, losing the PTC will drive up PPA prices
• But, tax equity was a relatively expensive form of capital (due to a limited number of investors)
• The loss of the PTC may be offset somewhat in PPA price by lower cost financing due to more competition in the capital markets
29
National Trend: The interior US is a world class wind resource
30
Wind continues to be developed across the US, but is most
concentrated in the interior
Wind makes up a substantial (but not majority) portion of the generation and sales in many states
11/5/2019
16
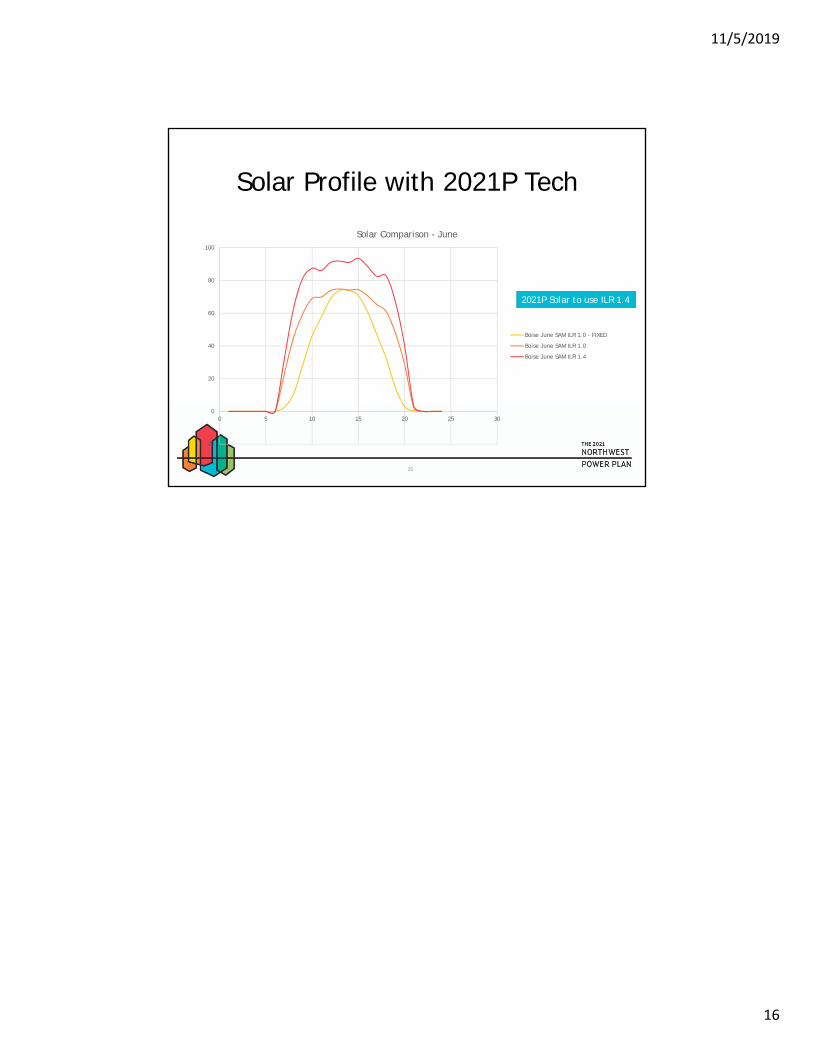
Solar Profile with 2021P Tech
31
-20
0
20
40
60
80
100
0 5 10 15 20 25 30
Solar Comparison - June
Boise June SAM ILR 1.0 - FIXED
Boise June SAM ILR 1.0
Boise June SAM ILR 1.4
2021P Solar to use ILR 1.4