memphis aquifer - usgs · the memphis aquifer is a fine- to coarse-grained sand interbedded with...
TRANSCRIPT
and Hines (1967), Broom and Lyford (1981), and Luckey (1985). Transmissivity ranges from 8,500 to 50,000 ft2/d, and storage coefficient for the deeper, more confined part of the aquifer ranges from 1 x 10⁻⁴ to 4 x 10⁻² (table 2). No values of aquifer hydraulic characteristics of alluvium at other locations in the Memphis area have been reported.
Water from the alluvium is hard and has rela-tively high concentrations of iron, dissolved solids, and barium (Brahana and others, 1987, tables 2 and 3). Lenses of clay rich in organic matter and associated geomicrobial activity are thought to be the source of high concentrations of hydrogen sulfide, carbon diox-ide, and iron in this formation (Wells, 1933).
Fluvial Deposits
Fluvial deposits occur at land surface in the uplands east of the bluffs (fig. 4). Although at one time the fluvial deposits were an important source of domestic water, present pumpage from this formation is negligible. Since about 1950, when the city of Mem-phis expanded its municipal supplies to serve outlying areas, few wells have been drilled into the fluvial deposits. Many of the wells that existed in 1950 have not remained operational and have been abandoned, plugged, or destroyed. Wells in the fluvial deposits are capable of large yields, greater than 100 gal/min, sig-nifying a potentially large source of water in the study area.
Fluvial deposits range in thickness from 0 to 100 feet (table 1). Thickness is highly variable, because of surfaces at both top and base (Graham and Parks, 1986). Locally, the fluvial deposits may be absent. The lithology of fluvial deposits is primarily sand and gravel, with minor layers of ferruginous sandstone.
Fluvial deposits are separated from the Mem-phis aquifer by sediments of the Jackson Formation and the upper part of the Claiborne Group (fig. 5). As with the alluvium, if the underlying confining unit is thin or sandy, leakage between water-table aquifers and the Memphis aquifer may be substantial.
Wells (1933), Graham (1982), and Graham and Parks (1986, fig. 8) reported seasonal water-level fluc-tuations in the fluvial deposits in the range of from 2 to 10 feet. Long-term declines of water levels within the fluvial deposits have not been documented, except in one location in the southern part of Sheahan well field (fig. 4). During the period 1943 to 1955, pumpage from the Memphis aquifer in the south Sheahan area dewa-
tered the fluvial deposits around the southern part of the well field (Graham and Parks, 1986, figs. 7 and 8). Before pumping began in 1933 from the Sheahan well field, the fluvial deposits in the southern part of the well field supplied small domestic wells, but these wells were reported to be dry in 1985 (W.S. Parks, U.S. Geological Survey, written commun., 1985).
No measurements of aquifer hydraulic charac-teristics have been reported for the fluvial deposits in the Memphis area. Based on lithology, saturated thick-ness, and mode of occurrence, transmissivity probably is within the range of 5,000 to 10,000 ft2/d, and stor-age coefficient probably is in the range of 0.1 to 0.2 (Freeze and Cherry, 1979).
Water quality in the fluvial deposits is highly variable. The distribution of dissolved-solids concen-trations, which ranges from 76 mg/L iron to 440 mg/L, shows more variation in these deposits than in any other aquifer in the area (Brahana and others, 1987, tables 2 and 3). Some of the variation may be related to the thickness of overlying loess, which may contrib-ute much of the dissolved solids in the aquifer (Wells, 1933). Dissolved-solids concentrations are lowest in the east-central part of the Memphis area, between the Loosahatchie and Wolf Rivers (Brahana and others, 1987, fig. 5).
Memphis Aquifer
The Memphis aquifer is the most productive aquifer in the study area, providing approximately 98 percent of total pumpage (188 Mgal/d) to the city of Memphis in 1980 (Graham, 1982). Total pumpage since 1886 is calculated to be more than 3.2 trillion gallons, using published pumping values (Criner and Parks, 1976, fig. 2; Graham, 1982, table 2).
The Memphis aquifer is a fine- to coarse-grained sand interbedded with layers of clay and minor amounts of lignite. The formation occurs at depths ranging from 0 to 600 feet (table 2) and varies in thickness from 500 to 890 feet (table 1) based on interpretations of geophysical logs. Generalized thick-ness of the Memphis aquifer in the Memphis area, based on work by Parks and Carmichael (1989a), has been extrapolated to a slightly wider range from less than 500 to more than 900 feet (fig. 6).
The Memphis aquifer is separated from the underlying Fort Pillow aquifer by 140 to 310 feet of clay of the Flour Island Formation, and from the over-lying alluvium and terrace deposits by 0 to 370 feet of clay and sandy clay of the Jackson Formation and
Hydrologic Setting 13

14 Hydrogeology and Ground-Water Flow in the Memphis andFort Pillow Aquifers in the Memphis Area, Tennessee

upper part of the Claiborne Group. The effectiveness of the Jackson Formation and upper part of the Clai-borne Group as a confining unit appears to vary because of areal differences in sand content and layer thickness (Graham and Parks, 1986). Due to this vari-ability, rates of leakage from surficial aquifers are spa-tially heterogeneous.
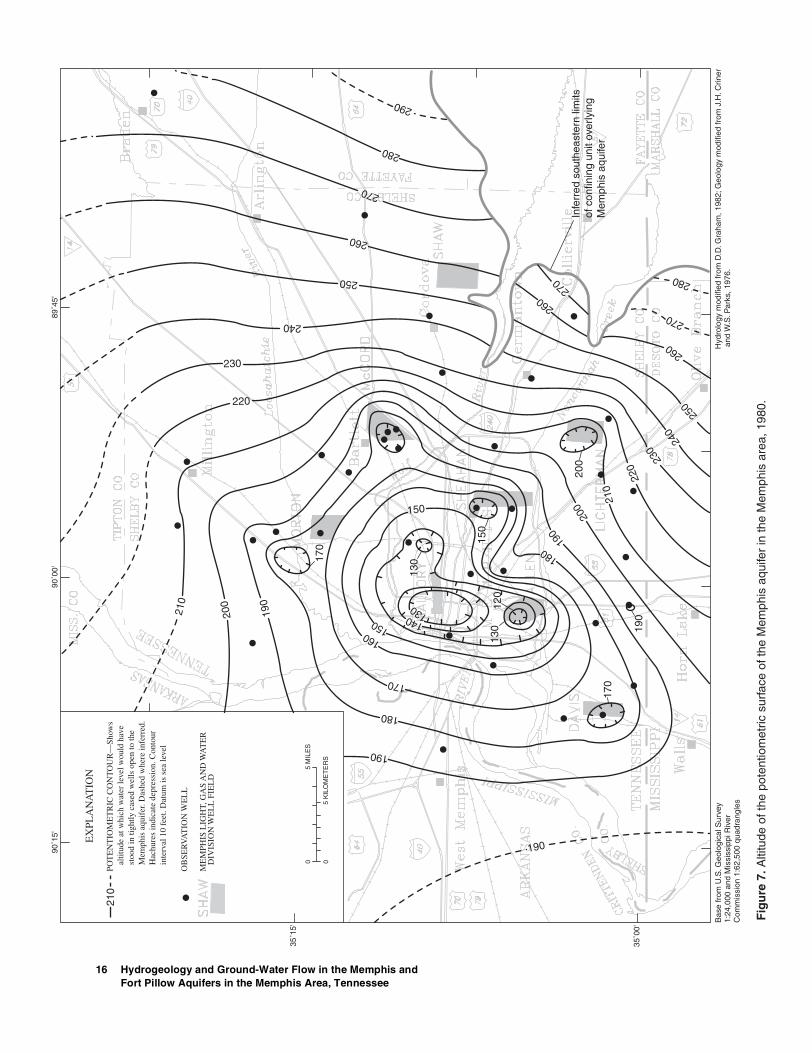
Water levels in the Memphis aquifer are strongly influenced by pumping (fig. 7). Water levels within the outcrop area, which occurs in the southeast-ern part of the Memphis area, range from about 280 to 290 feet above sea level (Graham, 1982, plate 1; Parks and Carmichael, 1989a, fig. 7). Recharge to the Mem-phis aquifer occurs primarily in the outcrop area (fig. 7). The deepest pumping cone of depression in the Memphis aquifer is less than 100 feet above sea level; the water levels at most other pumping centers are in the range of 120 to 170 feet above sea level (Graham, 1982, plate 1; Parks and Carmichael, 1989a, fig. 7). The widespread and irregular distribution of pumping centers in the Memphis aquifer in the Mem-phis area causes a complex flow pattern as ground water flows inward from all directions to several pumping centers (fig. 7).
Long-term water-level declines in the Memphis aquifer are greater than 120 feet in the area of maxi-mum drawdown near the Mallory well field. East of the pumping centers near the areas of outcrop, long-term declines have not been detected (Parks and Car-michael, 1989a, fig. 10). Seasonal variations in water levels are commonly less than 2 feet in areas unaf-fected by pumping.
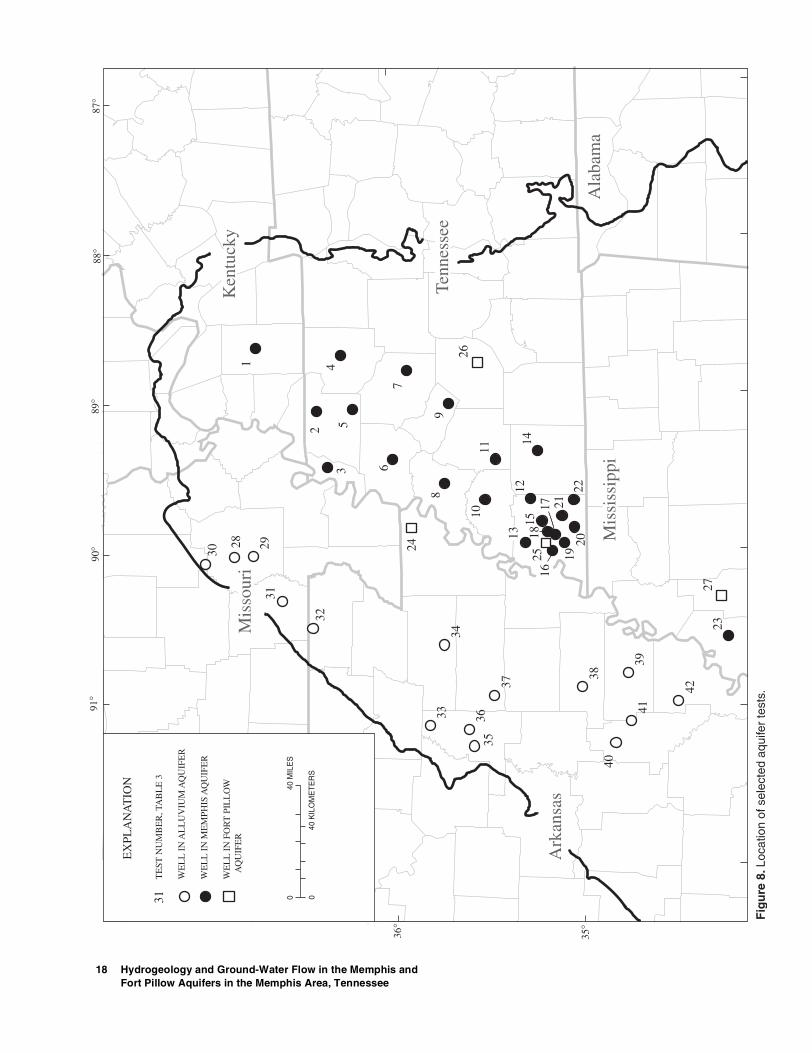
Data from 23 representative aquifer tests in the Memphis aquifer (table 3; fig. 8) from throughout the northern Mississippi embayment show transmissivity ranges from 2,700 to 45,000 ft2/d, and storage coeffi-cients range from 1 x 10⁻⁴ to 6 x 10⁻⁴. Confined condi-tions are typical for the Memphis aquifer, except in areas of outcrop.
The Memphis aquifer in the Memphis area (table 2) is reported to have a range of transmissivity from 6,700 to 54,000 ft2/d, and a range of storage coefficients from 1 x 10⁻⁴ to 2 x 10⁻¹ (Criner and oth-ers, 1964; Moore, 1965; Hosman and others, 1968; Brahana, 1982a; Arthur and Taylor, 1990; Parks and Carmichael, 1989a, p. 27).
Ground water in the Memphis aquifer is a cal-cium-magnesium-sodium bicarbonate type (Hosman and others, 1968; Brahana and others, 1987, table 2). In the study area, water in the Memphis aquifer is
characterized by a pH generally less than 7, and except for a limited area in the northwestern part of the study area, the dissolved-solids concentration is generally less than 100 mg/L.
Fort Pillow Aquifer
The Fort Pillow aquifer is a major regional aqui-fer throughout much of the northern Mississippi embayment (Hosman and others, 1968; Arthur and Taylor, 1990; Parks and Carmichael, 1989b). In the Memphis study area, the Fort Pillow aquifer currently (1989) provides water to supplement supplies at Mill-ington, Tenn., the U.S. Naval Air Station near Milling-ton, one industrial user in Memphis, and the Shaw well field east of Memphis (fig. 9). The Fort Pillow aquifer is the sole source of water for West Memphis, Marion, and other small towns in eastern Arkansas, and for the town of Walls in Mississippi (fig. 9). In 1984, pumpage from the Fort Pillow aquifer averaged about 10 Mgal/d (Graham and Parks, 1986). Although the Fort Pillow aquifer is much deeper in the subsur-face than the Memphis aquifer, the Fort Pillow is the preferred aquifer in eastern Arkansas for municipal and domestic supplies because it provides water that requires less treatment than water from the Memphis aquifer.
The Fort Pillow aquifer is characteristically a fine- to medium-grained sand containing clay lenses and minor amounts of lignite. Thickness of the aquifer is commonly about 250 feet and ranges from about 125 to 305 feet (table 1). The generalized thickness of the Fort Pillow aquifer in the Memphis area, based on work of Parks and Carmichael (1989b), is shown in figure 10.
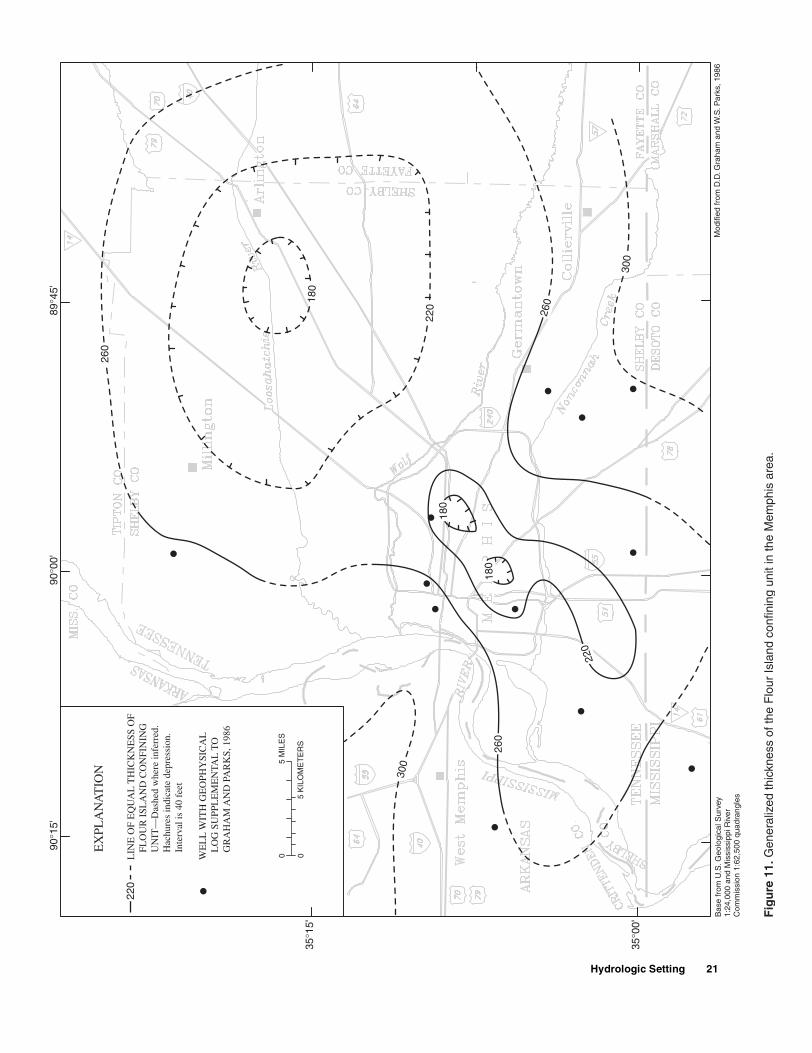
The Fort Pillow aquifer is confined above by 140 to 310 feet of clay of the Flour Island Formation, as defined by interpretation of geophysical logs (table 1). The Flour Island Formation is thought to be a leaky confining unit. Generalized thickness of the Flour Island confining unit in the Memphis area is based on the work of Graham and Parks (1986, fig. 5) and E. Mahoney, Vanderbilt University (written com-mun., 1989) (fig. 11). Head differences between the Memphis aquifer and Fort Pillow aquifer (Graham and Parks, 1986) occur as a result of pumping and are affected by the vertical hydraulic characteristics and thickness of the Flour Island Formation.
Water levels in the Fort Pillow aquifer (fig. 9) in 1980 were from slightly less than 160 to more than 240 feet above sea level. Water levels are highest in
Hydrologic Setting 15
16 Hydrogeology and Ground-Water Flow in the Memphis andFort Pillow Aquifers in the Memphis Area, Tennessee

Hydrologic Setting 17
Table 3. Results of selected aquifer tests
[Data source: 1, Davis and others (1973); 2, Moore (1965); 3, Newcome (1971); 4, Hosman and others (1968); 5, Luckey (1985); 6, Broom and Lyford (1981); 7, Albin and Hines (1967); 8, Halberg and Reed (1964); --, not reported; ft2/d, square feet per day; ft/d, feet per day]
Test no. Location Transmissivities (T) Hydraulic Storage Water-bearing Data(keyed to (ft2/d) conductivity coefficient formation source
fig. 8) (K) (ft/d) (S)
1 Mayfleld, Ky. 37,000-41,000 -- 0.0001-0.0004 Memphis Sand 12 Union City, Tenn. 8,300 -- .0003 Memphis Sand 13 Tiptonville, Tenn. 18,000 -- .0003 Memphis Sand 24 Dresden, Tenn. 7,200 -- .0006 Memphis Sand 25 Kenton, Tenn. 15,000 -- -- Memphis Sand 26 Dyersburg, Tenn. 19,000 -- .0004 Memphis Sand 27 Milan, Tenn. 16,000 -- -- Memphis Sand 28 Ripley, Tenn. 22,000 -- -- Memphis Sand 29 Bells, Tenn. 5,600 -- .0005 Memphis Sand 2
10 Covington, Tenn. 29,000 -- -- Memphis Sand 211 Stanton, Tenn. 27,000 -- .0001 Memphis Sand 212 Arlington, Tenn. 21,000 -- Memphis Sand 213 Memphis, Tenn. 41,000 -- .0014 Memphis Sand 214 Somerville, Tenn. 2,700 -- -- Memphis Sand 215 Memphis (McCord), Tenn. 43,000 -- .0002 Memphis Sand 216 Memphis (Mallory), Tenn. 26,000 -- Memphis Sand 217 Memphis, Tenn. 45,000 -- Memphis Sand 218 Memphis (Sheahan), Tenn. 35,000 -- Memphis Sand 219 Memphis (Allen), Tenn. 31,000 -- Memphis Sand 220 Memphis (Lichterman), Tenn. 27,000 -- Memphis Sand 221 Germantown, Tenn. 23,000 -- Memphis Sand 222 Collierville, Tenn. 23,000 -- Memphis Sand 223 Clarksdale, Miss. 6,600 100 .0006 Memphis Sand 324 Blytheville, Ark. 21,000 -- .002 Fort Pillow Sand 425 Memphis (Mallory), Tenn. 17,000-19,000 -- .0002-.0006 Fort Pillow Sand 426 Madison Co., Tenn. 10,000 -- .0015 Fort Pillow Sand 427 Marks, Miss. 2,700 29 -- Fort Pillow Sand 328 Stoddard Co., Mo. 15,000 -- .002 Alluvium 529 Stoddard Co., Mo. 20,000 -- .001 Alluvium 530 Wayne Co., Mo. 47,000 -- .0009 Alluvium 531 Butler Co., Mo. 50,000 -- .001 Alluvium 532 Clay Co., Ark. 30,000 360 .0011 Alluvium 633 Jackson Co., Ark. 39,000 320 .022 Alluvium 734 Craighead Co., Ark. 37,000 380 .022 Alluvium 635 Jackson Co., Ark. 8,500 -- -- Alluvium 636 Jackson Co., Ark. 10,000 100 .007 Alluvium 637 Poinsett Co., Ark. 48,000 390 .001 Alluvium 638 St. Francis Co., Ark. 43,000 330 .04 Alluvium 839 Lee Co., Ark. 13,000-19,000 130 .00073 Alluvium 640 Monroe Co., Ark. 24,000 -- -- Alluvium 641 Monroe Co., Ark. 32,000 290 .0004 Alluvium 642 Phillips Co., Ark. 34,000 247 .0001 Alluvium 6
18 Hydrogeology and Ground-Water Flow in the Memphis andFort Pillow Aquifers in the Memphis Area, Tennessee

Hydrologic Setting 19

20 Hydrogeology and Ground-Water Flow in the Memphis andFort Pillow Aquifers in the Memphis Area, Tennessee
Hydrologic Setting 21
the eastern part of the area, nearest the outcrop, and lowest in the west near the centers of pumping. The regional movement of ground water in the Fort Pillow aquifer is toward the axis of the Mississippi embay-ment (Hosman and others, 1968).
The hydrograph for well Fa:R-1 (location on fig. 9), which taps the Fort Pillow aquifer about 27 miles east of the center of pumping at Memphis, shows a long-term decline of about 0.4 foot per year (ft/yr) (Graham, 1982). Regionally, declines of about 1 ft/yr are not uncommon (Hosman and others, 1968; Brahana and Mesko, 1988, fig. 13). Graham (1982) noted that the hydrograph of well Sh:O-170 (location on fig. 9) near the center of historic pumping in Mem-phis showed approximately 20 feet of recovery when all municipal (MLGW) pumpage from the Fort Pillow aquifer ceased in the early 1970's. Seasonal variations of nonstressed water levels are commonly less than 2 feet (Graham, 1982, fig. 4).
Hydraulic conductivity of the Fort Pillow aqui-fer throughout its area of occurrence in the northern Mississippi embayment is reported to range from 25 to 470 ft/d. This corresponds to a range of transmissivity from about 670 to 85,000 ft2/d. Storage coefficient is reported to range from 2 x 10⁻⁴ to 1.5 x 10⁻² (Hosman and others, 1968; Boswell, 1976; Parks and Car-michael, 1989b). Data from aquifer tests of the Fort Pillow aquifer (table 3, fig. 8) indicate that transmis-sivity ranges from 2,700 to 21,000 ft2/d, and storage coefficients range from 2 x 10⁻⁴ to 2.0 x 10⁻³.
Within the Memphis area, hydraulic characteris-tics have a narrower range (table 2) than described previously for the entire embayment. In the Memphis area, transmissivity of the Fort Pillow aquifer is reported to range from 12,000 to 19,000 ft2/d, and storage coefficient is reported to range from 1.2 x 10⁻⁴ to 6.1 x 10⁻⁴ (Criner and others, 1964).
Water from the Fort Pillow aquifer is a soft, sodium bicarbonate type with a median dissolved-solids concentration of 116 mg/L (Brahana and others, 1987). Iron concentrations range from 170 to 1,900 micrograms per liter, and pH typically is about 7.4.
McNairy-Nacatoch Aquifer
The McNairy-Nacatoch aquifer, which encom-passes sands of the Ripley Formation, McNairy Sand (table 1), and equivalent Upper Cretaceous Nacatoch Sand in Arkansas, is the basal freshwater aquifer in the study area. The McNairy-Nacatoch aquifer has not
been used as a source of water supply in Memphis, but it has the potential for such use; north and east of the study area, it is a major regional aquifer (Brahana and Mesko, 1988).
The McNairy-Nacatoch aquifer ranges in thick-ness from 360 to 570 feet and is fine- to coarse-grained, glauconitic sand. The McNairy-Nacatoch aquifer occurs deeper than 2,500 feet below land sur-face at Memphis, and is confined and hydraulically separated from the overlying Fort Pillow Sand by about 750 feet of clays of the Midway and lower Wil-cox Groups (table 1). These confining clays, herein called the Midway confining unit, are a major hydro-logic boundary in the northern Mississippi embay-ment. Arthur and Taylor (1990) simulated the Midway confining unit as a lower no-flow boundary. Brahana and Mesko (1988) used flow modeling to evaluate leakage across the Midway confining unit; they found less than 0.5 ft3/s moved across this confining unit in the study area.
Hydrogeologic evaluation of the McNairy-Nacatoch aquifer in the Memphis area is based on unpublished data from a single observation well in the Mallory well field and on extrapolation of regional data (Boswell and others, 1965; Davis and others, 1973; Luckey and Fuller, 1980; Edds, 1983; Brahana and Mesko, 1988). The static water level in this well is approximately 350 feet above sea level, which is about 100 feet above land surface (W.S. Parks, U.S. Geolog-ical Survey, written commun., 1985). Seasonal varia-tion in water level is about 2 feet, and no long-term decline is evident. Head values in the McMairy-Nacatoch aquifer are approximately 180 feet higher than heads measured in the overlying Fort Pillow aqui-fer (Brahana and Mesko, 1988, figs. 10 and 11). Water-level declines in the McNairy-Nacatoch aquifer due to pumping in the overlying Fort Pillow aquifer have not been observed.
In addition to head differences, significant dif-ferences in water quality exist between the McNairy-Nacatoch aquifer and the Fort Pillow aquifer. Concen-trations of dissolved solids, for example, are 10 times greater in the McNairy-Nacatoch aquifer than in the Fort Pillow aquifer.
Although the data from the McNairy-Nacatoch aquifer are sparse, they are consistent on both a local and regional scale. These differences in hydrology and water chemistry strongly support the contention that clays in the Midway confining unit (Porters Creek Clay, Clayton Formation, and Owl Creek Formation,
22 Hydrogeology and Ground-Water Flow in the Memphis andFort Pillow Aquifers in the Memphis Area, Tennessee
table 2) act as an effective confining unit (figs. 2 and 3), and isolate the Fort Pillow aquifer from deeper aquifers.
CONCEPTUALIZATION OF THE GROUND-WATER FLOW SYSTEM
The hydrogeologic information presented in the previous section forms the basis for a conceptual model of ground-water flow in the Memphis area. This conceptualization accounts for the ability of each major unit to store and transmit water, as indicated by its lithology and stratigraphy, and by hydrologic data. Water-quality data are also used to lend credence to hypotheses regarding the hydrologic isolation or com-munication between aquifers. The conceptual model represents a simplification of reality but preserves and emphasizes the major elements controlling ground-water flow in the study area. This conceptual model can be tested quantitatively by depicting each of its elements mathematically in a digital model of ground-water flow. The relation between the hydrogeologic framework, the conceptual model, and the digital ground-water flow model is shown in figure 12.
The alluvium and fluvial deposits form the uppermost water-table aquifers in the conceptual model. Water levels respond seasonally to recharge, evapotranspiration, and minor pumping, but on the time scale of interest to this investigation, the water-table aquifers are at steady state. The one documented exception to steady state occurred about 1943 in the southern area of the Sheahan well field. Conceptually, the water-table aquifers serve the important function of providing a potentially large reservoir of vertical leakage to the underlying confined aquifers. Horizon-tal flow in the water-table aquifers are defined by the water-level map (fig. 4), but are of incidental interest in this investigation. Recharge to the aquifer is prima-rily from the infiltration of rainfall on the outcrop. Dis-charge from these aquifers is primarily to streams, as baseflow, and vertically to deeper aquifers as down-ward leakage.
The Jackson-upper Claiborne confining unit is conceptualized as a leaky confining unit with variable thickness (fig. 5) and lithology. Leakance values for this confining unit were poorly defined by aquifer test data (table 2), and much quantitative testing of alterna-tive leakance parameters and distributions were under-taken. In general, pumping from the Memphis aquifer has induced flow from the shallow water-table aqui-
fers downward to the Memphis aquifer through the Jackson-upper Claiborne confining unit. Leakage has increased with time as the head difference between the water-table aquifers and the Memphis aquifer has increased.
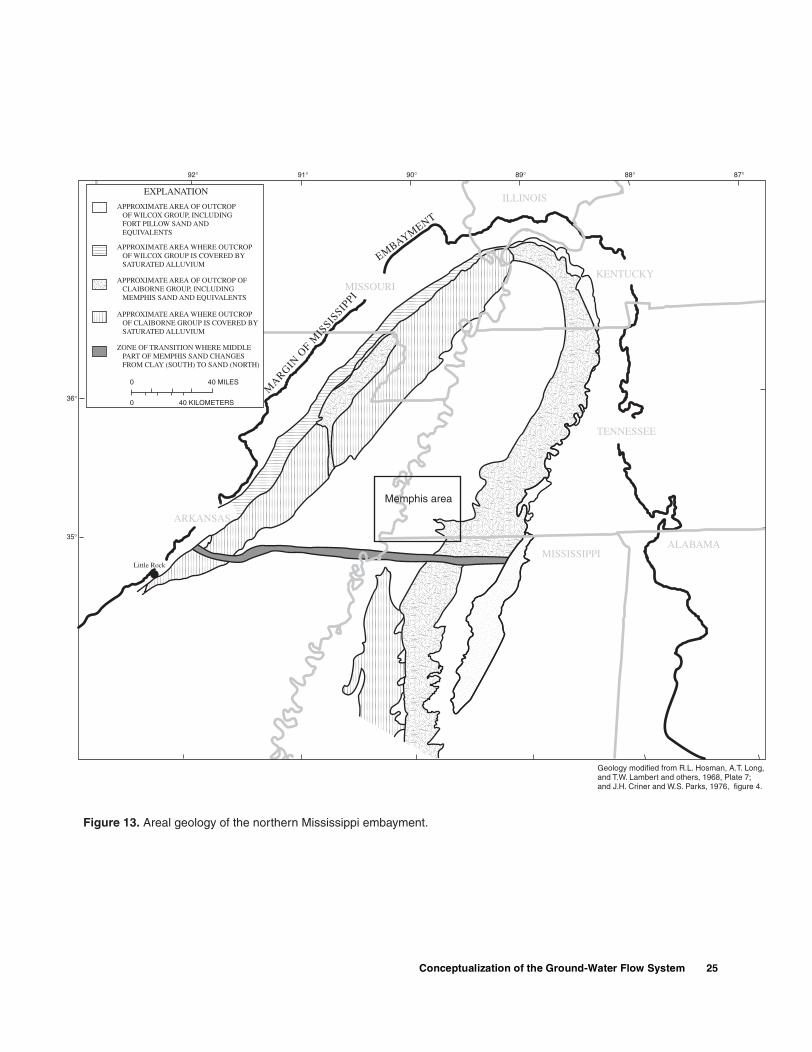
Flow in the Memphis aquifer has been transient since the onset of pumping in 1886. Recharge occurs in the outcrop area in the southeastern and eastern parts of the study area (fig. 13), and flow is predomi-nantly into the centers of pumping from all directions (fig. 7). An increasing component of recharge is derived from leakage through time from the super and subjacent aquifers across nonhomogeneous confining units. Pumping represents the major source of dis-charge from the system, and the areal and temporal variation of pumping through time is the major reason this aquifer is not at steady state. Prior to pumping, discharge was westward to the subcrop of the Mem-phis aquifer beneath the alluvium, and upward beneath the Mississippi River alluvial plain. Up dip pinch out of the Memphis Sand defines the limit of occurrence of the Memphis aquifer, and no-flow boundaries around the eastern, northern, and western boundaries conceptually represent ground-water conditions where the pinch out occurs. A major effort of quantitative testing was focused on the Memphis aquifer and its related hydrogeology, including its transmissivity, storage, boundary configuration, and pumping.
The Flour Island confining unit is conceptual-ized as a confining unit that is less variable in thick-ness (fig. 11) and less leaky than the Jackson-upper Claiborne confining unit. Flow directions across the Flour Island confining unit are in response to dynami-cally changing heads in the overlying Memphis aqui-fer and underlying Fort Pillow aquifer. Quantitative testing of the vertical hydraulic conductivity of this unit was a specific focus of this investigation.
Flow in the Fort Pillow aquifer has been tran-sient since about 1924, not only in response to pump-ing from this aquifer in the study area, but to major regional pumping in Arkansas. Recharge to the Fort Pillow aquifer occurs primarily in the outcrop areas east and north of the study area. Vertical leakage pro-vides some recharge at locations where heads in the overlying Memphis aquifer are higher than heads in the Fort Pillow aquifer. Discharge from the system is primarily to a temporally and areally varying pumping distribution particularly in Arkansas (Arthur and Taylor, 1990). Some discharge from the Fort Pillow aquifer occurs as horizontal flow southward, and some
Conceptualization of the Ground-Water Flow System 23

24 Hydrogeology and Ground-Water Flow in the Memphis andFort Pillow Aquifers in the Memphis Area, Tennessee
Conceptualization of the Ground-Water Flow System 25