mems-based endomicroscopes for high resolution in vivo imaging
TRANSCRIPT

MEMS-Based Endomicroscopes for
High Resolution in vivo Imaging
by
Xiyu Duan
A dissertation submitted in partial fulfillment
of the requirements for the degree of
Doctor of Philosophy
(Biomedical Engineering)
in the University of Michigan
2017
Doctoral Committee:
Professor Thomas D. Wang, Chair
Professor Eric R. Fearon
Associate Professor Kenn R. Oldham
Associate Professor Zhen Xu

ii
DEDICATION
This dissertation is dedicated to my family, for their unconditional love and support.
iii
ACKNOWLEDGEMENT
Primarily, I would like to thank to Professor Thomas D. Wang for his guidance,
patience, and kindness. He introduced me to the field of biomedical optics and provided
support and resources throughout the course of my research. He created a wonderful
multidisciplinary research environment, which allowed me to develop my skills and
experience across multiple fields. The research and dissertation would not have been
possible without his support. I would also like to express thanks to the guidance and help
from other committee members Professor Kenn Oldham, Professor Eric Fearon and
Professor Zhen Xu.
I would like to thank my great lab-mates and collaborators. Especially Dr. Haijun
Li, who developed all kinds of amazing MEMS devices, and Dr. Gaoming Li, who
provided insights and knowledge in optics. I would also like to thank Chi Qiu, Lu Wang
and Prashanth K J who helped me with mechanical fabrication. Additionally, I would like
to thank Dr. Asha Pant, Quan Zhou, Dr. Supang Khondee and Dr. Xue Li who helped me
with the animal experiments. I would like to thank Zhen Qiu, Jongsoo Choi, Miki Lee,
Arlene Smith , Coco Tseng and other group members for their efforts in helping me with
my projects and research studies.

iv
A lot of my work involves mechanical design and fabrication. I would like to thank
Steve Sdona from LSA machine shop for sharing his knowledge in traditional machining..
I would like to thank our collaborators at University of Washington, Dr. Eric Seibel
and Richard S. Johnston for giving the opportunity to learn the scanning fiber endoscope
system so I could use the knowledge in my project.
Finally, I would like to thank my wife, Zijing Wu, for her love, patience, and
encouragement. I am so thankful for my parents for their unconditional love and support.

v
TABLE OF CONTENTS
DEDICATION .................................................................................................................... ii
ACKNOWLEDGEMENT ................................................................................................. iii
LIST OF TABLES ........................................................................................................... xiv
LIST OF FIGURES .......................................................................................................... xv
ABSTRACT ...................................................................................................................... xx
Chapter 1 Introduction ................................................................................................... 1
1.1 Colorectal Cancer ...................................................................................... 1
1.2 Intra-Vital Imaging of Tissue Epithelium ................................................. 2
1.3 Confocal and multiphoton microscopy ..................................................... 3
1.4 Actuators for endomicroscopes ................................................................. 6
1.4.1 Distal scanning mechanisms ............................................................... 7
1.4.2 Micro-actuator based endomicroscopes ............................................ 11
1.5 Peptides as cancer targeting molecular probes ........................................ 12

vi
1.6 Small animal imaging.............................................................................. 13
1.7 Specific aims ........................................................................................... 14
1.8 Dissertation overview .............................................................................. 14
Chapter 2 Materials and Methods ................................................................................ 16
2.1 Light source ............................................................................................. 17
2.2 Optical fibers for light delivery ............................................................... 20
2.2.1 Optical fibers for confocal endomicroscope ..................................... 20
2.2.2 Optical fibers for multiphoton endomicroscope................................ 21
2.3 MEMS based 2D scanner ........................................................................ 27
2.3.1 MEMS scanner characterization ....................................................... 29
2.3.2 2D scan pattern generation ................................................................ 30
2.3.3 Image reconstruction ......................................................................... 33
2.4 Optical system design.............................................................................. 35
2.4.1 Numerical aperture ............................................................................ 35
2.4.2 Beam scanning configurations .......................................................... 36
2.4.3 Scanner parameters and optical performance .................................... 37

vii
2.5 Data acquisition and image reconstruction ............................................. 38
2.6 Design flow of an endomicroscope probe ............................................... 39
Chapter 3 Multiphoton endomicroscope ..................................................................... 40
3.1 Introduction ............................................................................................. 40
3.2 Background ............................................................................................. 41
3.2.1 Two-photon microscopy ................................................................... 41
3.3 Methods ................................................................................................... 42
3.3.1 2D MEMS scanner ............................................................................ 42
3.3.2 Optical design .................................................................................... 45
3.3.3 System architecture ........................................................................... 47
3.3.4 Mechanical design and packaging..................................................... 49
3.3.5 System resolution .............................................................................. 50
3.3.6 Imaging of mouse colon .................................................................... 51
3.4 Results ..................................................................................................... 52
3.4.1 System resolution .............................................................................. 52
3.4.2 Imaging of mouse colon .................................................................... 53
viii
3.5 Discussion ............................................................................................... 54
3.6 Summary ................................................................................................. 56
Chapter 4 Side-view multiphoton endomicroscope..................................................... 57
4.1 Introduction ............................................................................................. 57
4.2 Methods ................................................................................................... 57
4.2.1 Side-view objective design................................................................ 57
4.2.2 Optical design of the distal probe ...................................................... 61
4.2.3 Mechanical design and packaging of side-view probe ...................... 62
4.2.4 Mechanical design and packaging of the handheld instrument......... 63
4.2.5 Ex vivo imaging of mouse colon tissue ............................................ 64
4.2.6 In vivo imaging ................................................................................. 65
4.3 Results ..................................................................................................... 65
4.3.1 System resolution .............................................................................. 65
4.3.2 Lens paper imaging ........................................................................... 66
4.3.3 Ex vivo imaging of mouse colon tissue ............................................ 66
4.3.4 In vivo imaging of mouse colon ........................................................ 67

ix
4.4 Discussion ............................................................................................... 68
4.5 Summary ................................................................................................. 69
Chapter 5 Side-view confocal endomicroscope .......................................................... 70
5.1 Introduction ............................................................................................. 70
5.2 Methods ................................................................................................... 72
5.2.1 System architecture ........................................................................... 72
5.2.2 Optical design .................................................................................... 73
5.2.3 MEMS scanner .................................................................................. 74
5.2.4 Mechanical design and packaging..................................................... 76
5.2.5 Imaging performance characterization .............................................. 78
5.2.6 Peptide ............................................................................................... 78
5.2.7 In vivo imaging ................................................................................. 78
5.3 Results ..................................................................................................... 80
5.3.1 Imaging performance ........................................................................ 80
5.3.2 In vivo imaging ................................................................................. 82
5.3.3 Ex vivo validation ............................................................................. 83

x
5.3.4 Mosaic image .................................................................................... 84
5.4 Discussion ............................................................................................... 86
5.5 Summary ................................................................................................. 88
Chapter 6 Side-Viewing Confocal Endomicroscope for XY/XZ Imaging.................. 90
6.1 Introduction ............................................................................................. 90
6.2 Methods ................................................................................................... 92
6.2.1 System architecture ........................................................................... 92
6.2.2 Optical design .................................................................................... 92
6.2.3 Geometry of the MEMS chip ............................................................ 94
6.2.4 3D MEMS scanner ............................................................................ 95
6.2.5 Scanner characterization ................................................................... 96
6.2.6 Switchable horizontal/vertical imaging ............................................. 97
6.2.7 Packaging and alignment .................................................................. 98
6.2.8 Resolution and FOV .......................................................................... 99
6.2.9 Mouse model of colorectal cancer with tdTomato optical reporter .. 99
6.3 Characterization .................................................................................... 100

xi
6.3.1 Resolution and FOV ........................................................................ 100
6.3.2 Imaging of 3D fluorescent phantom................................................ 101
6.4 Applications .......................................................................................... 102
6.4.1 Imaging of colonic dysplasia with peptide ...................................... 102
6.4.2 Imaging of tdTomato optical reporter mouse .................................. 103
6.4.3 Inflammation monitoring in the mouse colon ................................. 106
6.5 Summary ............................................................................................... 107
Chapter 7 MEMS-based multiphoton microscopy for vertical sectioning ................ 108
7.1 Introduction ........................................................................................... 108
7.2 Methods ................................................................................................. 110
7.2.1 System architecture ......................................................................... 110
7.2.2 Optical simulation for axial scan ..................................................... 112
7.2.3 Lateral MEMS scanner.................................................................... 113
7.2.4 Axial MEMS scanner ...................................................................... 114
7.2.5 Switchable horizontal/vertical imaging ........................................... 116
7.2.6 Optical properties characterization.................................................. 117

xii
7.2.7 Imaging performance demonstration .............................................. 118
7.2.8 Tissue preparation ........................................................................... 118
7.3 Results ................................................................................................... 119
7.3.1 PSF simulation ................................................................................ 119
7.3.2 Optical properties characterization.................................................. 120
7.3.3 Axial scan performance demonstration ........................................... 121
7.3.4 Tissue imaging ................................................................................ 122
7.4 Discussion ............................................................................................. 123
Chapter 8 Future Works ............................................................................................ 127
8.1 Side-view multiphoton endomicroscope with distal MEMS scanning . 127
8.2 Side-view multiphoton endomicroscope with remote axial scanning ... 129
8.3 Side-view dual axes confocal endomicroscope ..................................... 130
8.4 Widefield endoscope ............................................................................. 131
Chapter 9 Conclusion ................................................................................................ 133
9.1 Summary ............................................................................................... 133
Appendix ......................................................................................................................... 134

xiii
References ....................................................................................................................... 137

xiv
LIST OF TABLES
Table 1.1. Comparison of MEMS scanners with different working principles. ............... 10
Table 1.2. Summary of recently published endomicroscopes using miniature actuators. 11
Table 2.1. Fluorophores used for peptide labelling .......................................................... 18
Table 2.2. Fluorescent proteins ......................................................................................... 18
Table 4.1. Performance comparison of two optical designs ............................................. 60

xv
LIST OF FIGURES
Fig. 1.1. Carcinoma of the colon arises from a transformation of normal epithelium to
dysplasia. ................................................................................................................. 3
Fig. 1.2. Comparison of resolution and penetration depth for different imaging modalities.
................................................................................................................................. 4
Fig. 1.3. Distal scanning mechanisms. ................................................................................ 7
Fig. 1.4. Fiber scanning mechanisms used in endomicroscopes......................................... 8
Fig. 2.1. Schematic diagram of a typical laser scanning endomicroscope system. .......... 16
Fig. 2.2. Lasers sources for endomicroscope systems. ..................................................... 19
Fig. 2.3. Double clad photonic crystal fiber. ..................................................................... 23
Fig. 2.4. Pulse stretching by the DCPCF. ......................................................................... 25
Fig. 2.5. Grating pair pulse compression. ......................................................................... 26
Fig. 2.6. Hollow core photonic bandgap fiber. ................................................................. 27
Fig. 2.7. First generation electrostatic MEMS scanner developed by our group. ............. 28

xvi
Fig. 2.8. Laser based MEMS testing platform. ................................................................. 30
Fig. 2.9. Three commonly used scan patterns. .................................................................. 32
Fig. 2.10. Schematic of beam scanning with a 2D scanner. ............................................. 33
Fig. 2.11. Distortion profile of a 2D beam scanner. ......................................................... 35
Fig. 2.12. Beam scanning configurations.......................................................................... 36
Fig. 2.13. LabVIEW program flow. .................................................................................. 38
Fig. 2.14. LabVIEW program interface. ........................................................................... 38
Fig. 2.15. Design flow of a MEMS based endomicroscope. ............................................ 39
Fig. 3.1. 2D MEMS scanner. ............................................................................................ 43
Fig. 3.2. MEMS scanner characterization. ........................................................................ 44
Fig. 3.3. Zemax Simulation............................................................................................... 47
Fig. 3.4. Schematic............................................................................................................ 48
Fig. 3.5. Endomicroscope packaging. ............................................................................... 50
Fig. 3.6. Image resolution. ................................................................................................ 52
Fig. 3.7. Imaging results. .................................................................................................. 53
Fig. 4.1. Side-view optical configurations. ....................................................................... 58
xvii
Fig. 4.2. Zemax simulation of two side-view objective designs. ...................................... 59
Fig. 4.3. PSFs of the two-lens objective. .......................................................................... 61
Fig. 4.4. Optical design and lens selection for the distal probe. ....................................... 62
Fig. 4.5. Distal probe design and packaging. .................................................................... 63
Fig. 4.6. Handheld probe mechanical design and packaging. ........................................... 64
Fig. 4.7. Image resolution. ................................................................................................ 66
Fig. 4.8.Lens paper imaging. ............................................................................................ 66
Fig. 4.9. Ex vivo imaging of mouse colon tissue. ............................................................. 66
Fig. 4.10. In vivo and ex vivo imaging of mouse colon. .................................................. 67
Fig. 5.1. Optical system schematic. .................................................................................. 72
Fig. 5.2. Optical design. .................................................................................................... 74
Fig. 5.3. MEMS Scanner................................................................................................... 75
Fig. 5.4. Packaging and alignment. ................................................................................... 77
Fig. 5.5. Image resolution. ................................................................................................ 81
Fig. 5.6. Imaging of mouse colonic dysplasia. ................................................................. 82
Fig. 5.7. Ex vivo validation. .............................................................................................. 83

xviii
Fig. 5.8. Mosaic image of mouse colon in vivo. ............................................................... 85
Fig. 5.9. In vivo imaging of colonic dysplasia with QRH peptide. .................................. 85
Fig. 6.1. Schematic............................................................................................................ 92
Fig. 6.2. Optical design and Zemax simulation. ............................................................... 93
Fig. 6.3. Geometry of the MEMS chip and the reflective mirror. .................................... 94
Fig. 6.4. 3D MEMS scanner. ............................................................................................ 95
Fig. 6.5. Characterization of the MEMS scanner. ............................................................. 97
Fig. 6.6. Packaging and alignment. ................................................................................... 98
Fig. 6.7. Performance characterization. .......................................................................... 100
Fig. 6.8. 3D reconstruction of fluorescent beads phantom. ............................................ 101
Fig. 6.9. Ex vivo images of mouse colon tissue with EGFP peptide binding. ................ 102
Fig. 6.10. Ex vivo images of tdTomato mouse colon tissue. .......................................... 103
Fig. 6.11. Ex vivo images of different organs of tdTomato mouse. ............................... 104
Fig. 6.12. In vivo images of tdTomato mouse colon tissue. ........................................... 105
Fig. 6.13. In vivo and ex vivo images of mouse colon with IBD. .................................. 106
Fig. 7.1. Schematic diagram of the 3D multiphoton microscope. .................................. 110
xix
Fig. 7.2. Lateral MEMS scanner. .................................................................................... 113
Fig. 7.3. Axial MEMS scanner. ...................................................................................... 115
Fig. 7.4. Effect of tilt on PSF. ......................................................................................... 119
Fig. 7.5. Axial scan performance characterization. ........................................................ 120
Fig. 7.6. Multiphoton excited fluorescence images of pollen grains. ............................. 121
Fig. 7.7. Multiphoton excited fluorescence images of mouse colonic epithelium ex vivo.
............................................................................................................................. 122
Fig. 8.1. Side-view multiphoton endomicroscope with post-objective MEMS scanning.
............................................................................................................................. 128
Fig. 8.2. Side-view multiphoton endomicroscope with remote axial scanning for 3D
imaging. .............................................................................................................. 129
Fig. 8.3. Side-view dual axes confocal endomicroscope. ............................................... 131
Fig. 8.4. Wide-field endoscope. ...................................................................................... 132

xx
ABSTRACT
Intravital microscopy is an emerging methodology for performing real time
imaging in live animals. This technology is playing a greater role in the study of cellular
and molecular biology because in vitro systems cannot adequately recapitulate the
microenvironment of living tissues and systems. Conventional intravital microscopes use
large, bulky objectives that require wide surgical exposure to image internal organs and
result in terminal experiments. If these instruments can be reduced sufficiently in size,
biological phenomena can be observed in a longitudinal fashion without animal sacrifice.
The epithelium is a thin layer of tissue in hollow organs, and is the origin of many types of
human diseases. In vivo assessment of biomarkers expressed in the epithelium in animal
models can provide valuable information of disease development and drug efficacy. The
overall goal of this work is to develop miniature imaging instruments capable of visualizing
the epithelium in live animals with subcellular resolution.
The dissertation is divided into four projects, where each contains an imaging
system developed for small animal imaging. These systems are all designed using laser
beam scanning technology with tiny mirrors developed with microelectromechanical
systems (MEMS) technology. By using these miniature scanners, we are able to develop
endomicroscopes small enough for hollow organs in small animals. The performance of

xxi
these systems has been demonstrated by imaging either excised tissue or colon of live mice.
The final version of the instrument can collect horizontal/oblique plane images in the
mouse colon in real time (>10 frames/sec) with sub-micron resolution (<1 um), deep tissue
penetration (~200 um) and large field of view (700 x 500 um). A novel side-viewing
architecture with distal MEMS scanning was developed to create clear and stable image in
the mouse colon. With the use of the instrument, it is convenient to pinpoint location of
interest and create a map of the colon using image mosaicking. Multispectral fluorescence
images can by collected at excitation wavelength ranging from 445 nm to 780 nm. The
instruments have been used to 1) validate specific binding of a cancer targeting agent in
the mouse colon and 2) study the tumor development in a mouse model with endogenous
fluorescence protein expression. We use these studies to show that we have developed an
enabling technology which will allow biologist to perform longitudinal imaging in animal
models with subcellular resolution.
1
Chapter 1 Introduction
1.1 Colorectal Cancer
Approximately 149,000 new cases of colorectal cancer occur annually in the U.S.
where the rate of incidence is among the highest in the world (41 cases/100,000 population
in 2009-2013) [2]. The average lifetime risk for developing this disease is about 1 in 20 in
the industrialized world [3]. Despite the widespread availability of colonoscopy, colorectal
carcinoma remains the second most common cause of cancer, and the mortality and
morbidity associated with this disease is far more common than expected. The miss rate
for colonic adenomas, as determined by tandem colonoscopy, has been found to be as high
as 22%, and a significant number of cases of colorectal cancers (2.4 cancer/1000 person-
years) have been diagnosed within a year following screening colonoscopy [4]. Moreover,
there is evidence that up to 25% of spontaneously occurring adenomas arise from
sporadically occurring flat or depressed lesions that may be difficult to visualize by
conventional white light endoscopy [5] [6]. These lesions frequently contain high grade
dysplasia and progress more rapidly through the adenoma-carcinoma sequence than
polypoid adenomas [7]. A greater understanding of molecular target expression patterns
over time is needed to develop better strategies for risk stratification and early detection.

2
1.2 Intra-Vital Imaging of Tissue Epithelium
Transformed cells that develop into cancer of the colon originate within the
epithelium of the mucosa, as shown in Fig. 1. Intra-vital microscopy is a powerful tool for
studying the molecular mechanisms of epithelial cancer biology in vivo because this
technique can directly access this thin, superficial layer of tissue to provide the highest
resolution possible in live animals [8] [9] [10] [11]. A miniature fiber optic instrument can
be placed in contact with the tissue surface to collect real time images with sub-cellular
resolution. These instruments can be either inserted into hollow organs or hand held against
the outer body in small animal models [12] [13]. Intra-vital imaging allows for
longitudinal (non-terminal) studies to be performed where each animal is used as its own
control. This approach can significantly reduce the number of animals needed and can
provide a more robust study design. Also, this technique can be adapted for multi-spectral
imaging where ligand-receptor interactions and cell tracking behavior can be studied in
vivo. These processes are difficult to observe with any other imaging modality.
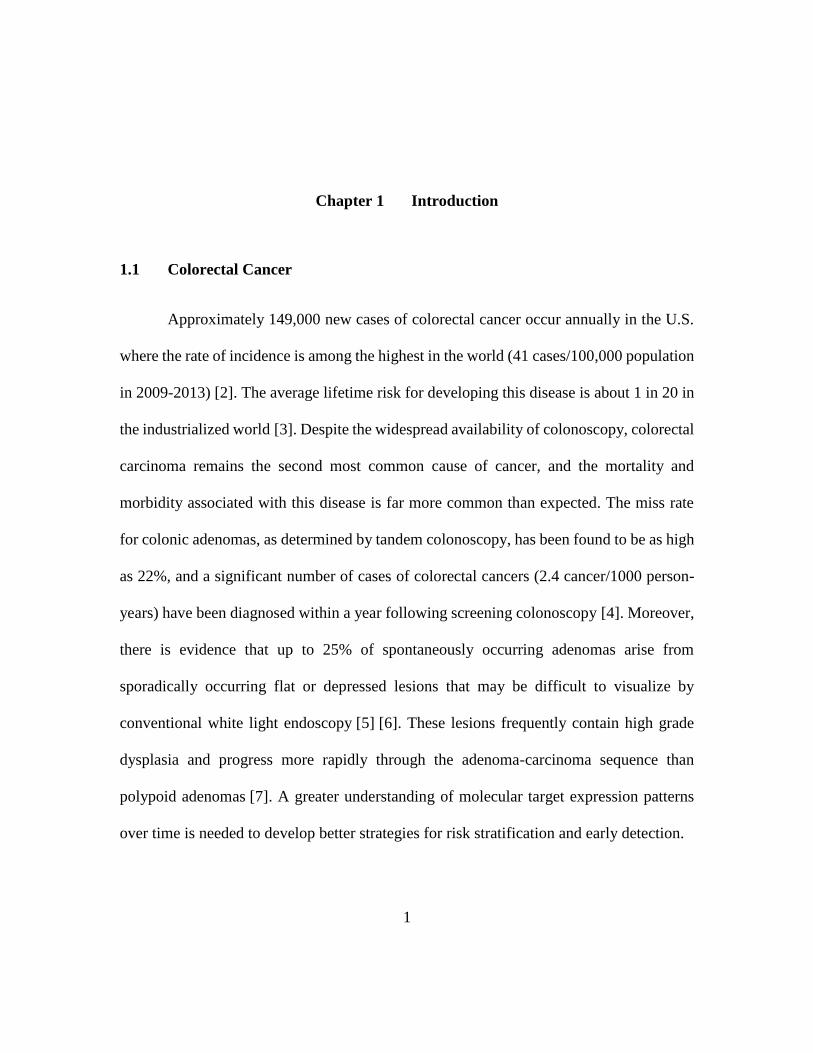
As shown in Fig. 1.1, normal colonic epithelium transforms to a pre-malignant
condition (dysplasia) prior to evolving into carcinoma [14]. Molecular changes develop
well in advance of morphological changes. Imaging in the vertical cross-section (dashed
black box) which is the plane perpendicular to the tissue surface provides a comprehensive
view of the epithelium which normally differentiates in the basilar to luminal direction.
This orientation also can accurately register the location of biological behavior of interest
relative to the tissue surface. Imaging in the horizontal cross-section which is the plane
3
parallel to the tissue surface reveals a local view of the epithelium along a surface that tends
to have a similar degree of differentiation. This imaging orientation is not adequate to
provide information about biological behavior either above or below this plane, and can be
difficult to register the location relative to the tissue surface.
Fig. 1.1. Carcinoma of the colon arises from a transformation of normal epithelium
to dysplasia. Subtle molecular changes develop first in the crypts prior to morphological
changes in the tissue. Imaging in the vertical cross-section (plane perpendicular to tissue
surface) can better detect subtle differences in tissue differentiation patterns and for
identifying the early presence of invasion, compared to the horizontal cross-
section.Confocal and multiphoton microscopy
Standard medical imaging modalities, including ultrasound, CT and MRI, have great
penetration depth, but the resolution is not good enough to detect early lesions in the
epithelial layer, Fig. 1.2. In comparison, optical imaging techniques can provide the
resolution and speed needed to detect changes in the cellular and molecular level in real
time. OCT has been brought into clinical use recently due to its high spatial resolution.
Endoscopic and catheter-based OCT probes have been developed to image esophagus and
cardio-vasculatures in vivo [15] [16]. Although OCT can detect morphology changes in
the tissue with several millimeters’ penetration, it is not sensitive to fluorescence and thus
lacks molecular specificity. Confocal and multiphoton microscopy (MPM) can achieve

4
submicron resolution in real time, a level of performance that cannot be matched by any
other imaging modality. They can also be used to visualize multiple fluorophores at the
same time. However, light is highly scattered in tissue, and sophisticated methods are
needed to produce clear images.
Fig. 1.2. Comparison of resolution and penetration depth for different imaging
modalities.
Confocal microscopy uses a pinhole which is placed before the detector such that
only the light that originates from within the focal volume to be collected, and the out of
focus light will be rejected [17] [18]. To form an image, a pair of galvo scan mirrors are
used to divert the laser beam in orthogonal orientations such that the specimen is
illuminated point by point in a raster pattern. Light signal is collected at each point and the
image is reconstructed serially. This technique is known as optical sectioning and can
produce a high resolution image at a fixed depth below the tissue surface. Optical
sectioning, or depth discrimination capability is the key difference between a conventional

5
microscope and a confocal microscope. The imaging depth of confocal microscopy is
typically around 100 μm [19].
Multiphoton microscopy, also known as nonlinear or two-photon microscopy, is an
alternative to confocal microscopy with advantages specifically in deep tissue imaging. In
lightly scattered tissue, about 1 mm penetration depth has been demonstrated using two-
photon microscopy [20] [21] [22]. The two-photon effect occurs when two lower energy
(longer wavelength) photons arrive at a biomolecule simultaneously to excite fluorescence
and generate a higher energy (shorter wavelength) photon [23]. Two photon absorption is a
rare event, and the probability of this event is dependent on the square of the illumination
intensity, therefore a high numerical aperture objective in the single axis configuration is used
to maximize the intensity at the focus and increase the collection efficiency. Because of this
nonlinear relationship, two photon absorption only occurs in the focal volume, so it is less
sensitive to tissue scattering and there is less photobleaching in comparison to that for single
photon fluorescence [24] [25]. Moreover, because of the use of longer excitation wavelengths,
deeper tissue penetration could be achieved. However, most two-photon instruments use a
bulk microscope objective that requires a large region of exposure to image the target organs,
resulting in terminal experiments [1].
For both confocal and multiphoton microscopy, optical sectioning images can be
collected at sufficiently fast frame rates to observe biological behavior in small animal
models with minimal disturbance from motion artifacts caused by breathing displacements
and heart beating.

6
1.4 Actuators for endomicroscopes
Both confocal and multiphoton microscopy rely on galvanometers, or commonly
called as galvos, to perform high speed laser scanning. A galvo scanner typically consists
of a motor and a mounted mirror with position sensors for precise control. The size of a
galvo scanner is in the range of centimeters, which is too big to be integrated into an
endomicroscope form factor.
For endomicroscopy applications, the location of the beam scanner is either
proximal or distal with respect to the light source [12]. Proximal scanners are located
between the light source to the flexible fiber, and are often used with a fiber
bundle [26] [27] [28] [29] [30] [31]. Most of these fiber bundles consist of more than
100,000 individual step-index fibers with total diameter from hundreds of microns to a few
millimeters and core-to-core spacing of around 5 microns [32]. The spatial arrangements
of the fiber cores are identical at both ends to maintain the same intensity profile through
transmission. Each core of the fiber bundle serves as a pinhole to reject out of focus light.
The advantage of using a proximal scanner is that a conventional galvo scanner can be used
since the scanning is occurring before entering the miniature probe. Real time imaging can
be achieved using high speed galvo scanners, and the imaging rate can be further improved
using line/multipoint scanning instead of single point scanning [33] [34] [35]. The use of
fiber bundles also has a few drawbacks, however, including high manufacturing cost,
limited spatial resolution by the number of fiber cores and low depth penetration. The major
disadvantage is the pixelation effect due to the empty spaces between fiber cores, resulting

7
in limited lateral resolution. Light transmission in the cladding could also result in reduced
imaging contrast. Various image processing techniques have been developed to smoothen
the imaging pixelation effect [36]. Another method has been demonstrated by Choi’s group
that, instead of using a fiber bundle, a single multimode fiber can be used with proximal
scanning for an ultra-compact endomicroscope [37]. Direct image transmission through a
multimode fiber is possible due to the existence of multiple spatial modes inside the fiber.
A clean image can be recovered using the speckle pattern from the multiple reflections of
light. The limitation of this approach is that bending of the fiber will change its transmission
matrix, therefore it’s applicable only for rigid type endoscopes.
1.4.1 Distal scanning mechanisms
Fig. 1.3. Distal scanning mechanisms. a) Fiber scanning. b) Beams scanning with micro-
mirrors. c) Lens scanning. Figure adapted from [12].
To achieve better image quality, distal scanning mechanisms are needed. However,
there are challenges to develop small actuators which are small enough to fit inside the
endomicroscope probe. With limited space, it is also difficult to achieve high scanning
speed. The probe may also be sensitive to shocks, vibrations, pressure and temperature.
The following discussion focuses on three types of scanning mechanisms: fiber scanning,
beam scanning and lens scanning, as shown in Fig. 1.3.

8
1.4.1.1 Fiber scanning
Fig. 1.4. Fiber scanning mechanisms used in endomicroscopes. a) Electromagnetic fiber
scanner used in a medical endoscope with confocal imaging modality, developed by
Optiscan and Pentax. b) Piezoelectric tube for fiber scanning in a spiral pattern, used in a
b) wide field scanning fiber endoscope and c) two-photon endomicroscope. d) A two-
photon endomicroscope using two piezoelectric bending cantilevers for raster scanning.
Single-mode optical fibers are used for light delivery in endomicroscopes, therefore
it is natural to scan the fiber directly and use optics to relay the image formed by the fiber
tip onto the sample plane. Fiber scanning technology has many advantages, including ultra-
compact size, robustness and high scanning speed. The first clinical confocal
endomicroscope system was developed by Optiscan Pty. Ltd. (Victoria, Australia) and
integrated into a medical endoscope (Pentax Precision Instruments EC-3870K, Tokyo,
Japan) [38]. A single-mode optical fiber is attached to a miniature magnet and 2D scanning
was performed two pair of coils, as shown in Fig. 1.4a. The images are collected in
horizontal sections at a frame rate of 0.8 Hz with 1024×1024 pixels. Axial scanning is

9
performed with a shape memory alloy (SMA) actuator that translates the focal volume over
a range of 250 µm.
Seibel’s group developed scanning fiber endoscopes with outer diameter as small
as 1 mm, Fig. 1.4b, using piezoelectric tube actuators [39] [40]. The fiber operates in
resonance with >10 kHz frequency in both axes and it is scanned in a spiral pattern. Images
were acquired at a 30 Hz frame rate with 500x500 pixels. The instrument was later adapted
to a two-photon endomicroscope by changing the fiber to a hollow-core photonic crystal
fiber and adding a second fiber for fluorescence collection [41]. Shown in Fig. 1.4c, Li’s
group also used piezoelectric tube actuators to develop a multiphoton endomicroscope
probe, with a double clad fiber for light delivery and fluorescence collection [42]. Also
using a spiral scan pattern, Imaging rate of 2.6 Hz was reported with 512x521 pixels [43].
Xu’s group developed another multiphoton probe using two piezoelectric strips, Fig. 1.4d,
to perform 2D scanning in a raster scan pattern. The fast axis operates in resonant with 1.05
kHz, results in a frame rate of 4.1 Hz with 512x512 pixels [44].
The vibratory motion of a fiber scanner can be modeled as a cylindrical cantilever
with base excitation and fixed-free boundary conditions [39]. The resonant frequencies of
different bending modes of the fiber scanner are a function of its length, shape and material
properties [45]. One limitation of this technology is that the choice of the fiber will affect
the scanning performance. Special care is needed during the assembly process since the
free length of the fiber will also impact the scanning frequency, making mass fabrication

10
difficult. Furthermore, since the fiber tip has an un-planar motion in resonance,
complicated optical design is needed to compensate the change of fiber tip position [46].
1.4.1.2 Beam scanning
Table 1.1. Comparison of MEMS scanners with different working principles.
Actuation
Mechanism
Electrostatic Electromagnetic Electrothermal Piezoelectric
Scanner [48]
[49]
[50]
[51]
Fabrication Simple Simple Moderate Complex
Integration
complexity
Simple Complex, require
coil/magnet
Simple Simple
Voltage (V) High (>30 V) Low (< 20V) Low (< 10 V) Low (< 20 V)
Operation
mode
Resonant DC/Resonant DC/Resonant DC/Resonant
Mechanical
tilt (°)
+/- 10 +/- 20 +/- 20 +/- 10
Power
consumption
Low ~200 mW ~100 mW Low
Table-top confocal and microscopes rely on galvo scanners, or galvanometers,
which are mirrors mounted on dc motors with internal position feedback. These scanners
are in the scale of centimeters, which are too big for endomicroscopy applications. With
recent development of micro electromechanical systems (MEMS) technology, miniature
scanning mirrors have been developed and integrated into endomicroscopes. MEMS

11
scanning technology has the advantages of high speed, small in size (5 mm or smaller), and
ease of batch fabrication [47]. These MEMS scanners are designed mainly based on the
actuation principles of electrostatic, electromagnetic, electrothermal and piezoelectric.
Comparison between these actuation principles is summarized in Table 1.1.
1.4.2 Micro-actuator based endomicroscopes
Table 1.2. Summary of recently published endomicroscopes using miniature
actuators.
Modality Reference,
Year
Actuation
mechanism
OD
(mm)
Resolution
Δx × Δz,
(µm)
FOV
(µm2)
Depth
(µm)
Frame
Rate
(Hz)
Confocal [38], 2004 EM fiber
scanner
5 0.7 x 7 500 x 500 200 0.8/1.6
[56], 2005 MEMS 3.3 0.5 x 2.9 100 x 100 N.R. 20
[57], 2012 MEMS 5.5 5 x 6.5 362 x 212 140 5
[58], 2013 MEMS x 2 7 1 x 7 180 x 180 380 0.75
[59], 2014 Piezo tube 2.5 1.7 x 19 200 x 200 200 N.R.
[60], 2016 MEMS 4.2 0.87 x
13.2
300 x 400 100 5 - 10
Multi-
photon
[61], 2010 Piezo tube 2.8 1.5 x 9.2 150 x 150 N.R. 1.1
[44], 2011 Piezo
strips
3 0.8 x 10 110 x 110 70 4.1
[62], 2011 MEMS 9.6 1.27 x
13.5
130 x 100 N.R. 7
[63], 2012 Piezo tube 2 0.69 x
6.15
110 x 110 15 2.7
[64], 2013 MEMS 3 1 x 24 70 x 70 N.R. N.R.
[65], 2013 MEMS N.R. 0.6/2 x
N.R.
59 x 93 /
178 x 280
N.R. 34
[66], 2014 Piezo tube 3.5 0.67 x 3.1 100 x 100 N.R. N.R.
[67], 2015 MEMS 3.4 2 x 9 300 x 300 60 5 - 10
[68], 2015 Piezo tube 2.2 0.8 x 12 450 x 450 300 8
[69], 2016 MEMS 40 1.3 x N.R. 151 x 236 N.R. 0.4
[70], 2016 Piezo
strips
3.5 2.2 x 9.1 200 x 200 N.R. 1.25

12
Recent advancements in miniature optics, availability of fiber-optics, and
emergence of micro-actuators have allowed for the technique of confocal microscopy to
be performed in vivo through medical endoscopes to perform rapid, real-time optical
assessment of tissue pathology [52] [10] [53]. Recently, fiber-optic two-photon instruments
have also been developed that use photonic crystal fibers for femtosecond pulse delivery and
micro-actuators for beam scanning [54] [55]. The use of these endomicroscopes enables
sub-cellular resolution optical sectioning in small animals and in human subjects. Table
1.2 summarizes recently developed endomicroscopes using micro-actuators.
1.5 Peptides as cancer targeting molecular probes
Peptides have demonstrated great promise for clinical use to detect overexpressed
cell surface targets from dysplastic tissue during endoscopy [71] [72]. Peptides have a
number of pharmacokinetic advantages because of their small size and low molecular
weight (<1 kilodalton). Compared with antibodies and other much larger molecular probes,
peptides have better vascular permeability, improved tissue penetration, and faster
circulatory clearance. The specificity of peptides can be very high because of the large
diversity of sequences possible [73]. Also, because of their flexibility for fluorophore
labeling [74], it is feasible to simultaneously image multiple targets to address tumor
heterogeneity.
Researchers from our lab have previously developed peptides which bind
specifically to cell surface targets, which are overexpressed in colonic adenomas. These
targets include including EGFR [75], Claudin-1 [76] and HER2 [77]. After labelling with

13
Cy5.5, peptide binding to specific targets was validated in vivo in a mouse model of
spontaneous colorectal cancer. All the in vivo validation studies were performed using an
NIR wide-field fluorescence endoscope. In order to perform further validation in the
cellular level in a live animal, we need to develop a new imaging technology specifically
for this purpose.
1.6 Small animal imaging
In vivo imaging of small animals, such as mice, is an essential component for
preclinical biomedical research and the demand is increasing [78] [79] [80] [81]. Mice are
mostly commonly used among all kinds of small animals due to the fact that they are small
in size, easy to breed, short lifespan and genetical and physiological similarities to human.
Mice can develop conditions that are representative of human disease, including cancer.
For in vivo peptide validation, our lab used a CPC;Apc mouse model of colon cancer. In
this mouse model, the APC gene is deleted in colonic epithelium [82], resulting in
spontaneous formation of colonic adenomas. This model is closely related to human
disease because APC mutations are found in more than 80% of colorectal cancers [83]. We
used a rigid small animal endoscope (Karl Storz Veterinary Endoscopy-America, Goleta,
CA) to image the distal portion of the colon. There is a need to develop high resolution
imaging tools to study small animals.

14
1.7 Specific aims
The overall goal of the research plan is to develop a miniature endomicroscope to
study small animals with high spatial and temporal resolution. The instrument will be able
to collect horizontal/vertical images in the mouse colon in real time (>10 frames/sec) with
sub-cellular resolution (<5 µm), deep tissue penetration (>200 µm) and large field of view
(>300 µm). Imaging performance will be demonstrated using fluorescence-labeled
peptides that specifically bind to over expressed cell surface targets.
Specific Aim 1: Design, assemble, and package a MEMS based confocal or
multiphoton endomicroscope for in vivo imaging in the mouse colon with
subcellular resolution.
Specific Aim 2: Develop algorithms and software to control the 2D MEMS scanner
and reconstruct images in real time.
Specific Aim 3: Characterize instrument performance using imaging phantom and
mouse tissue.
Specific Aim 4: Demonstrate the usefulness of the instrument by imaging specific
peptide in vivo in the mouse colon.
1.8 Dissertation overview
Chapter 1: Introduction and background information.
Chapter 2: Materials and methods used for the development of the following
endomicroscopes.
15
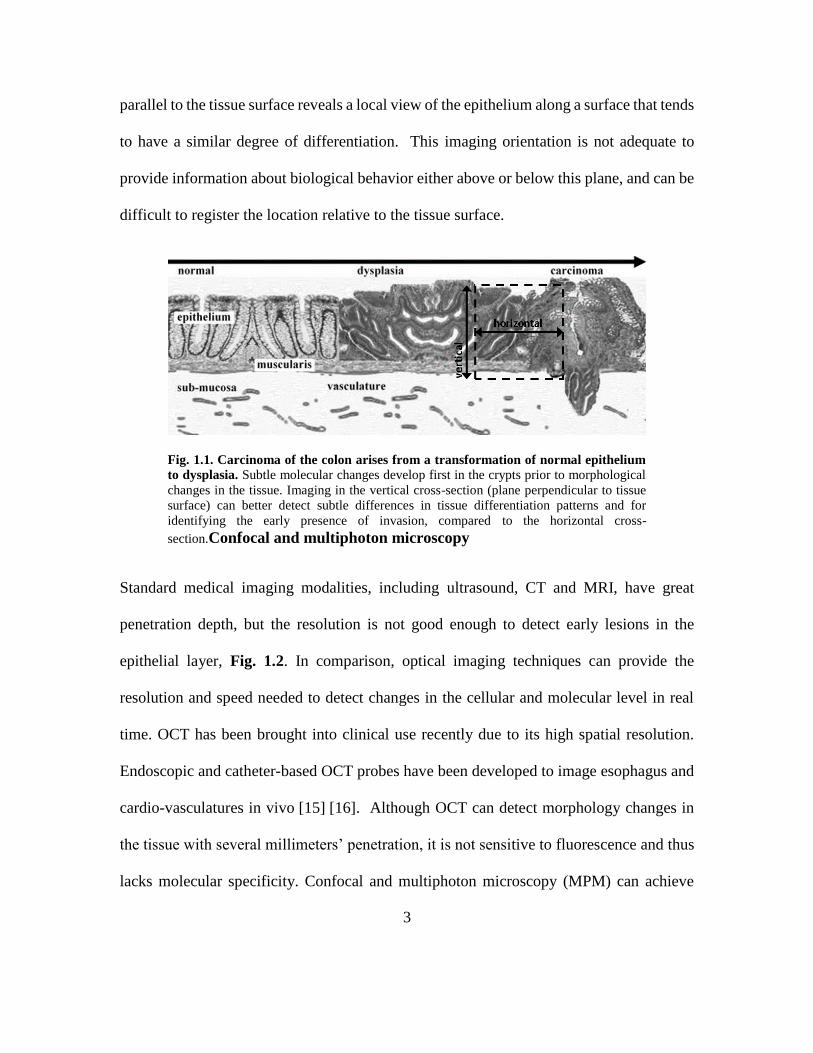
Chapter 2: Handheld, front view multiphoton endomicroscope.
Chapter 3: Handheld, side-view multiphoton endomicroscope
Chapter 4: Side-view confocal endomicroscope for in vivo imaging.
Chapter 5: Side-view confocal endomicroscope with switchable horizontal and oblique
plane imaging.
Chapter 6: Agitation free all MEMS based multiphoton microscope for 3D imaging.
Chapter 7: Future Works.
Chapter 8: Conclusion.

16
Chapter 2 Materials and Methods
A laser scanning endomicroscope system consists of two subsystems: the
endomicroscope probe and the imaging station, as shown Fig. 2.1. All the different type of
endomicroscope systems will be based on this schematic.
Fig. 2.1. Schematic diagram of a typical laser scanning endomicroscope system.
The probe is usually designed to be inserted into the hollow organs of small animals
or passed through an instrument channel of a wide-field endoscope for clinical use. The
probe is connected to the imaging station using a flexible catheter which houses optical
fibers and electrical wires for information transmission. The challenges of designing an
endomicroscope probe are mainly in the development of a micro actuator for beam
scanning and the miniature optics around it. The design criteria for the probe mainly
includes the mechanical dimension, lateral and axial resolutions, field of view (FOV),

17
frame rate and sensitivity. The challenges of designing the imaging station include
precision actuator control, high speed data acquisition, weak signal detection and real-time
image reconstruction. For the whole system to function properly, it is critical to ensure
every single component in the system is selected or designed correctly.
This chapter is focused on the overall design flow of the system, as well as the
specific design and material choice of each component. A detailed discussion of the theory
behind laser scanning microscopy is also included. The design of the instruments covered
in later chapters will be based on the methods and principles established in this chapter.
2.1 Light source
Both non-coherent light sources, such as arc lamps, halogen lamps and light-
emitting diodes, and coherent light sources, such as laser, have been used in confocal
microscopy [84] [85]. Lasers are ideal light sources for confocal microscopy due to
because of the properties including high brightness, narrow bandwidth, low noise and can
be focused to a tiny spot [86]. Since variation in the light source may be interpreted as
change of reflectance or fluorescence from the specimen, the intensity stabilities of lasers
are also important. Biologists use a wide range of fluorophores, with excitation
wavelengths ranging from 400 nm to 800 nm. In modern laser scanning confocal
microscopy (LSCM), multiple lasers can be used simultaneously to image multiple
fluorescent probes at the same time. When choosing a light source for the instrument, first
we should know what is the biological application and what fluorophores will be used. Our
lab has previously developed peptide labeled with several different fluorophores,

18
summarized in Table 2.1. We also plan to use the instrument to visualize genetically
engineered mouse models with fluorescent protein expression, summarized in Table 2.2.
Table 2.1. Fluorophores used for peptide labelling
Dye Ex (nm) EM (nm)
DEAC [40] 432 472
FITC [72] 495 518
TAMRA [40] 541 561
Cy 5 650 670
Cy5.5 [87] [88] [75] [77] [76] [89] 675 694
IRDye 800CW [90] 774 789
Table 2.2. Fluorescent proteins
Fluorescent protein Ex (nm) EM (nm)
mCFP [91] [92] 434 477
EGFP [91] [92] 488 511
EYFP [91] [92] 514 527
tdTomato [93] 554 581
RFP [91] [92] 563 582
Two-photon microscopy also relies on lasers as the light source, but a different type
of laser is used. As two-photon absorption happens when two photons with the same
wavelength are absorbed by the same molecular at the same time, the probability for this
to happen is very low [23]. To increase the probability of two-photon absorption, a high
intensity light source is needed. Compared to continuous wave (CW) lasers, which are
commonly used in confocal microscopy, pulsed lasers are preferred because they can
achieve high peak intensity with the same average intensity. It has been shown that two-

19
photon absorption of a fluorophore will be about the same, using a 10 W continuous-wave
laser or a 30 mW from a typical femtosecond pulsed laser [94].
Fig. 2.2. Lasers sources for endomicroscope systems. a) Multi laser engine with four
laser lines: 445, 488, 515 and 561 nm. Single wavelength diode lasers with b) 660 nm and
c) 785 nm. d) Femtosecond pulsed laser for two-photon imaging, with tunable laser
wavelength from 690 to 1040 nm and pulse width of 100 fs. Images retrieved from
http://www.toptica.com/ and https://www.newport.com.
We chose multiple laser sources to be integrated into our imaging system, as shown
in Fig. 2.2. For confocal endomicroscopy, we chose a multi laser engine (iChrome MLE,
Toptica, Fig. 2.2a) and two single wavelength diode lasers (iBeam Smart 660-s and 785-s,
Toptica, Fig. 2.2b,c), with wavelength of 445, 488, 515, 561, 660 and 785 nm. This
wavelength range covers most of the fluorescent dyes and proteins used in our lab. For
multiphoton endomicroscopy, we have an ultrafast Ti-Sapphire laser (Mai Tai Deepsee HP

20
DS, Spectra Physics) with 100 fs pulse widh, 80MHz repetition rate and a tunable output
wavelength from 690 to 1040nm.
2.2 Optical fibers for light delivery
To direct a laser beam into a small imaging probe while maintaining flexibility,
optical fiber is a key element for an endomicroscope system. With the use of optical fibers,
laser beam property, including spatial profile, intensity and polarization, could be
preserved even when the distal probe is moving along curved lumen of animal or human
organ [32]. Here we limit our discussion to optical fibers for confocal and multiphoton
endomicroscopy.
2.2.1 Optical fibers for confocal endomicroscope
Single-mode fiber has a very small inner core surrounded by an outer cladding such
that the light is constrained only in the core by total internal reflection. Since the small core
size only allows for a single spatial mode to be transmitted, the output beam can be
collimated and focused to a diffraction-limited spot for high resolution imaging [32]. The
small core (< 10µm) can also be used as a confocal pinhole to reject out-of-focus
reflectance or fluorescence emission [95]. These properties make single-mode fiber ideal
for light delivery for a confocal endomicroscope.
One of the issues arises when using a single-mode fiber for confocal imaging is that
background noise can be generated from the back reflection of the illumination light from
both ends of the fiber. A strong reflection of the excitation laser beam can partially pass

21
through the fluorescence detection filter. This is even more problematic when imaging in
the reflective mode since the reflected signal from biological tissue is much weaker than
the back reflection from the fiber tip. There are three ways to suppress the back reflection:
angle polishing of fiber ends, index matching of the fiber core, or a layer of anti-reflection
(AR) coating. We chose to use angle polishing such that the reflected beam is directed out
of the detection beam path.
2.2.2 Optical fibers for multiphoton endomicroscope
Ultrafast laser pulses with ~100 fs pulse width and nanojoule (nJ) pulse energy are
commonly used in multiphoton imaging [12]. Maintaining the pulse width after fiber-optic
light delivery is critical for constructing a fiber based multiphoton endomicroscope.
However, light transmission through an optical fiber is usually accompanied by group
velocity dispersion and self-phase modulation, both of which will broaden the laser pulse.
The group velocity is defined by velocity of the envelope of a pulse propagates
through a medium. Group velocity dispersion, or GVD, of light occurs when different
optical frequency components have different group velocities in a wave guide or an optical
fiber. GVD can be quantified by the derivative of the inverse group velocity with respect
to the angular frequency:
( 2.1 )

22
In most cases, group velocity decreases for increasing optical frequency or
decreasing wavelength, and this is called normal dispersion. Normal dispersion generates
positive GVD while anomalous dispersion generates negative GVD. Optical fiber
manufacturers report GVD as a derivative with respect to wavelength, with units of
ps/(nm km). The quantity is called dispersion parameter:
( 2.2)
For an optical fiber with length L, the frequency dependent delay of the different
spectral components of the pulse is quantified using group dispersion delay (GDD):
( 2.3)
To compensate GDD introduced by optical fibers, a sequence of prisms or gratings
with angular dispersion could be used to produces negative GDD [96] [97]. Negatively pre-
chirped pulses could exit the fiber with zero dispersion by properly adjusting the pulse
compressors. However, self-phase modulation (SPM), which distorts the pulse in a
nonlinear manner, is difficult to compensate. Due to the optical Kerr effect, intense ultra-
short pulses could induce a varying refractive index when interacting with the fiber silica
core [98]. This leads a phase shift and spectral distortion which depends on the pulses’
temporal profile and intensity. Because of this nonlinear effect, SPM is very difficult to
compensate and should be avoided for ultra-short pulse delivery.

23
Recently, photonics crystal fibers (PCFs) have been developed which can help
reduce the effect of SPM [99]. Conventional fibers rely on total internal reflection principle
to confine the light in the guiding material. In contrast, by controlling the hole size and
distribution in PCFs, exact effective refractive index of the cladding can be achieved and
results in the development of PCFs with larger mode area [100]. Since the efficiency of
SPM in fibers strongly depends on the peak power, it is reduced greatly by distributing
laser power to a larger effective area in the fiber [101].
We mainly considered two fibers which have been adopted in several studies: a
double clad photonic crystal fiber (DC-165-16-Passive, NKT Photonics) and a hollow core
photonic bandgap fiber (HC-800-02, NKT Photonics).
2.2.2.1 Double clad photonic crystal fiber (DCPCF)
Fig. 2.3. Double clad photonic crystal fiber. a) End face of the fiber, showing the core,
the large area inner cladding and the outer cladding. Figure adapted form NKT Photonics
website. b) Light mainly coupled in the inner cladding. c) Light in both inner cladding
and the core. d) Light mainly in the core.
This fiber was first demonstrated for multiphoton microscopy in [102] [103]. It can
use the core to deliver the excitation beam and use the inner cladding to collection
fluorescence signal. As shown in Fig. 2.3a, the fiber has a large core with 16 um in diameter

24
and an inner clad diameter of 163 um. It provides single mode operation in the core for
wavelength longer than 700 nm. Compared to traditional small core single mode fiber, its
large core diameter helps reduces the nonlinear effect. The inner cladding has a high NA
of about 0.6 for high collection efficiency of the back scattered light. The detection
efficiency of the fiber used in a microscope setup is shown to be 40 times more than that
of the normal single-mode fiber [104]. A one meter long fiber was used in our experiment
setup and the wavelength is 750 nm throughout the following experiments.
To match the NA and core size of the fiber, we used an objective with f = 18 mm
(RMS 10X, Thorlabs) for coupling. Special care needs to be taken during the coupling of
the DCPCF. For traditional single mode fiber coupling, coupling efficiency is measured at
the fiber output using a power meter. However, this is not sufficient for the DCPCF, since
coupling in the inner cladding could also give high coupling efficiency. Therefore, a
telescope is constructed to magnify the output fiber tip and project onto a screen, as shown
in Fig. 2.3b-d. Although the coupling efficiencies are very similar, the light is coupled into
different regions of the fiber. For Fig. 2.3b, the light is only coupled in the inner cladding.
For Fig. 2.3c, the light is coupled in both the inner cladding and the core. While in Fig.
2.3d, the light is mainly in the core, which is the desired coupling mode.
At a wavelength around 750 nm, longer wavelength parts propagate with higher
speed in the material, generating a positive dispersion. Dispersion of the laser pulse is
observed after transmission through 1 meter of the DCPCF. The laser has a minimum of
100 fs pulse width, and it is measured to be 150 fs at the laser output, due to a built-in

25
prechirp unit in the laser, Fig. 2.4a. At the fiber output, the pulse width is stretched and it
is measured to be around 1080 fs, Fig. 2.4b.
Fig. 2.4. Pulse stretching by the DCPCF. Autocorrelation traces of the laser pulse
measured at a) the laser output and b) the fiber output, showing the pulse width is stretch
from 150 fs to 1080 fs.
Since the built in prechirp unit in the laser unit is designed only to compensate the
dispersion in the beam path of a microscope, it doesn’t have sufficient range to compensate
the positive chirp introduced by the fiber. An additional prechirp unit using a pair of
gratings is inserted between the laser output and the fiber. The light reflected off the
gratings has a wavelength dependent diffractive angle, resulting in difference path length
between the two gratings. Long wavelength components travel a longer distance compared
to shorter wavelength components, generating a negative chirp in the laser pulse, as shown
in Fig. 2.5a [97]. The amount of chirp depends on parameters of the gratings, distance
between the two gratings and spectral distribution of the incoming laser pulse.

26
Fig. 2.5. Grating pair pulse compression. a) Working principle of a grating pair pulse
compressor. Figure adapted from [97]. b) Grating pair inserted before the fiber for prechirp.
Autocorrelation traces for the laser pulse c) at the laser output d) after the prechirp unit and
e) at the fiber output, with pulse width of 150 fs, 1040 fs and 105 fs, respectively.
We used a pair of gratings with 600 groves/mm, a blaze angle of 13o and blaze
wavelength of 750 nm. To compress a 1 ps laser pulse back to its minimum pulse width,
we used the following parameters in our setup: d-1 = 600 lines/mm, λ = 750 nm, γ = 45
degrees, θ = 60 degrees, δλ = 10 nm. For b = 10 cm, 1 ps pulse can be compressed to its
minimal pulse width. The pulse width measurement for the laser beam before gratings,
after gratings and after fiber output is shown below. We can see that by using the prechirp
unit, the pulse width is compressed back to about 100 fs at the fiber output.

27
2.2.2.2 Hollow core photonic bandgap fiber
Fig. 2.6. Hollow core photonic bandgap fiber. a) Schematic of the cross-section, showing
the air core surrounded by a microstructured cladding. b) Attenuation and dispersion
parameter of this fiber. Figure adapted from NKT Photonics website.
A grating pair is still needed to pre-compensate the dispersion from the photonic
crystal fiber, which reduces the laser throughput by about 50%. Furthermore, self-phase
modulation was observed at increase laser power [105]. From our experiment we also
observed broadened pulse width when increasing laser power. To address these issues, a
hollow core photonic bandgap fiber has been developed earlier with a core surrounded by
a microstructured cladding [106]. Using this fiber, light can be considered to be traveling
in air, thus material dispersion is zero and the chromatic dispersion is dominated by
waveguide dispersion. For our study, we chose a fiber (HC-800-02, NKT Photonics) with
zero-dispersion wavelength at around 780 nm. The schematic of the fiber cross-section is
shown in Fig. 2.6a and the dispersion parameter is shown in Fig. 2.6b.
2.3 MEMS based 2D scanner
Both confocal and multiphoton endomicroscopy rely on miniature actuators for
high speed laser scanning. Our group has been working on 2D MEMS scanner based on

28
electrostatic actuation and the principle of parametric resonance, where large mechanical
scan angles when operating in resonance [107] [108]. All the MEMS scanners used in this
thesis are designed and fabricated by a MEMS expert in our group, Dr. Haijun Li. All the
fabrication was done in the Lurie Nanofabrication Facility (LNF) of the University of
Michigan. The first generation of the 2D MEMS mirror that we plan to integrate into the
endomicroscope is shown in Fig. 2.7a. The mirror was designed with a 1.8 mm diameter
circular reflector with overall chip size of 3x3 mm2. A gimbal frame is used to minimize
cross-talk between the X (inner) and Y (outer) axes. The mirror rotates in the XY plane
using two orthogonal sets of electrostatic comb-drive actuators.
Fig. 2.7. First generation electrostatic MEMS scanner developed by our group. a)
Schematic shows dimensions of the 2D MEMS scanner. Image courtesy of Dr. Haijun Li.
b) Side comparison of a MEMS chip and a pencil tip. c) When both axes are actuated to
scan a laser beam, a very dense 2D scan pattern can be visualized.

29
The scanner was fabricated using a 3 step deep reactive-ion etch (DRIE) process
with 3 masks. Aluminum was sputtered on the front-side silicon surface to improve
reflectivity. Both inner and outer axes operate in resonance with resonant frequencies of
around 3 kHz and 1 kHz. To demonstrate the small size of the MEMS scanner, a device
was put on the tip of a finger, as shown in Fig. 2.7b. To show that the MEMS scanner can
be used form a dense 2D scan pattern for imaging, we shot a laser beam onto the mirror
and actuated both axes at the corresponding driving frequencies. A very dense scan pattern
can be visualized, Fig. 2.7c. The scan pattern can cover 400x400 pixels with 5 Hz repetition
rate.
2.3.1 MEMS scanner characterization
In Fig. 2.8, an automatic MEMS testing platform was constructed to accurately
measure the frequency response of MEMS scan mirrors. To measure the performance of a
MEMS scanner with tilt motion, Fig. 2.8a, a laser beam with 1 mm beam diameter was
directed to a beam splitter (BS004, Thorlabs). 50% of the light is reflected and travels to
the MEMS mirror at a 90° incidence angle. The beam reflected by the MEMS mirror goes
through the same beam splitter and hit the center of a position sensing detector (PSD) (PSM
2-10, On-Trak Photonics). When the MEMS mirror is actuated, the deflected beam will hit
different positions on the PSD. We can calculate the optical scan angle from the beam
location on the PSD and the distance from the MEMS scanner to the PSD. In this setup,
the mechanical scan angle of the MEMS scanner will be half of the optical scan angle. For
a MEMS mirror with out of plane axial motion, Fig. 2.8b, a high speed laser based

30
displacement sensor was used. As shown in Fig. 2.8c, a LabVIEW program is developed
which sends out a frequency sweep to drive the MEMS scanner while reads the PSD or
displacement sensor output at the same time, using a high-speed data acquisition board
(DAQ) (PCI 6115, National Instruments). For each frequency, the scan angle is calculated
and plotted against different frequencies.
Fig. 2.8. Laser based MEMS testing platform. Optical setup for a) tilting angle and b)
axial displacement measurement. c) LabVIEW program interface for automatic frequency
response measurement.
2.3.2 2D scan pattern generation
For high speed 2D beam scanning, there are three types of commonly used scan
patterns: raster scan, spiral scan and Lissajous scan. In raster scan, as shown in Fig. 2.9a,
the rectangular FOV is divided into a sequence of scan lines and the beam sweeps

31
horizontally from left to right at a constant speed for each line. Then the beam rapidly
moves back to the left and starts to scan the next line. The vertical position is also increasing
at the same time at a much lower rate. A 2D scanner with one fast axis and one slow axis
is needed, while the frame rate equals to the scanning frequency of the slow axis and the
line scan rate equals to the frequency of the fast axis. For the case of spiral scan, Fig. 2.9b,
beam is rotated out from the center and in a circular motion and covers a round FOV.
Lissajous scan pattern is the most complex among the three, Fig. 2.9c. The shape and
coverage of the pattern are determined by the ratio of frequencies of the two axes. Example
scan patterns with maximum scan frequency of 20 Hz and 1 Hz repetition rate are shown
in Fig. 2.9a-c.

32
Fig. 2.9. Three commonly used scan patterns. a) Raster. b) Spiral. c) Lissajous.

33
2.3.3 Image reconstruction
Path distortions of the laser beam occur in any beam scanning system, whether it is
a two-mirror configuration or a single mirror with two rotational degrees of freedom
(DOF) [109]. In order to correctly reconstruct the image, it is important to characterize the
distortion profile of the 2D MEMS scanner used in our system. The reflected beam path
can be analytically calculated using reflection and rotation matrix transformations.
Fig. 2.10. Schematic of beam scanning with a 2D scanner.
As shown in Fig. 2.10, the incoming laser beam is denoted by v1 and the reflected
beam is denoted by v2. The world reference frame is given by F = (x, y, z). After the mirror
rotates about its two axes xm and ym, the reference frame is given by F’ = (x’, y’, z’). The
incoming beam v1 is represented as v1’ in reference frame F’, where v1’ is given by:
𝒗𝟏
′ = (𝑅𝑥𝑚(𝜃𝑥)𝑅𝑦𝑚
(𝜃𝑦))−1𝒗𝟏 ( 2.4)
Ru(θ) is the rotation matrix when a vector or a reference frame is rotated about an
axis u by angle θ, where u = [ux, uy, uz]. The rotation matrix is given by:

34
𝑅𝒖(𝜃) = [
𝑐𝑜𝑠𝜃 + 𝑢𝑥2(1 − 𝑐𝑜𝑠𝜃) 𝑢𝑥𝑢𝑦(1 − 𝑐𝑜𝑠𝜃) − 𝑢𝑧𝑠𝑖𝑛𝜃 𝑢𝑥𝑢𝑧(1 − 𝑐𝑜𝑠𝜃) + 𝑢𝑦𝑠𝑖𝑛𝜃
𝑢𝑦𝑢𝑥(1 − 𝑐𝑜𝑠𝜃) + 𝑢𝑧𝑠𝑖𝑛𝜃 𝑐𝑜𝑠𝜃 + 𝑢𝑦2(1 − 𝑐𝑜𝑠𝜃) 𝑢𝑦𝑢𝑧(1 − 𝑐𝑜𝑠𝜃) − 𝑢𝑥𝑠𝑖𝑛𝜃
𝑢𝑧𝑢𝑥(1 − 𝑐𝑜𝑠𝜃) − 𝑢𝑦𝑠𝑖𝑛𝜃 𝑢𝑧𝑢𝑦(1 − 𝑐𝑜𝑠𝜃) + 𝑢𝑥𝑠𝑖𝑛𝜃 𝑐𝑜𝑠𝜃 + 𝑢𝑧2(1 − 𝑐𝑜𝑠𝜃)
] ( 2.5)
To reflect a vector v1’ through a plane defined by ax + by + cz = 0, the reflection
matrix is given by
𝐴𝑵 = 𝐼 − 2𝑁𝑁𝑇 = [
1 − 2𝑎2 −2𝑎𝑏 −2𝑎𝑐−2𝑎𝑏 1 − 2𝑏2 −2𝑏𝑐−2𝑎𝑐 −2𝑏𝑐 1 − 2𝑐2
] ( 2.6)
Where N = [a, b, c] is a unit vector normal to the plane. If the incidence angle of
the beam onto the MEMS mirror is α, N = [-cos α, 0, sin α]. The reflected beam v2 can be
calculated as follows:
𝒗𝟐 = (𝑅𝑥𝑚(𝜃𝑥)𝑅𝑦𝑚
(𝜃𝑦)) 𝒗𝟐′
= (𝑅𝑥𝑚(𝜃𝑥)𝑅𝑦𝑚
(𝜃𝑦)) (𝐴𝑵𝒗𝟏′ )
= (𝑅𝑥𝑚(𝜃𝑥)𝑅𝑦𝑚
(𝜃𝑦)) 𝐴𝑵 (𝑅𝑥𝑚(𝜃𝑥)𝑅𝑦𝑚
(𝜃𝑦))−1
𝒗𝟏
( 2.7)
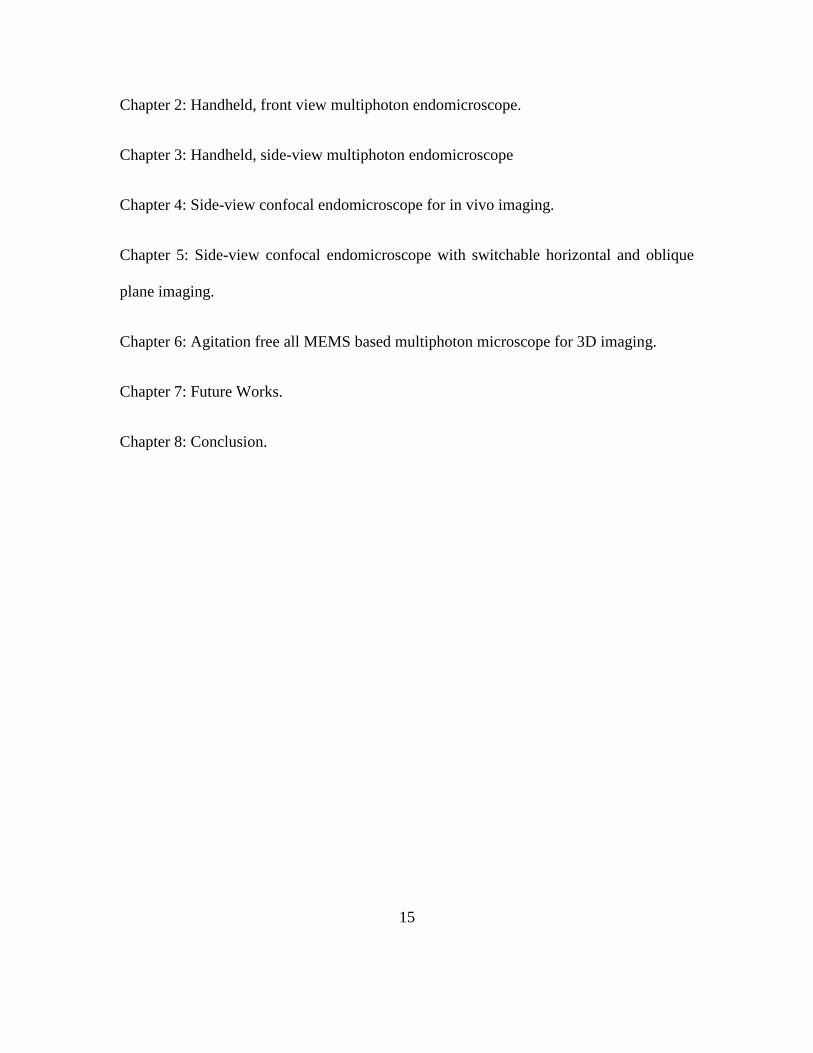
To calculate scan pattern on the screen after the 2D scanner, a Matlab program is
written which is included in the appendix. Here we show the distortion profiles from two
different optical configurations: 45° and 90° incidence angles, as shown in Fig. 2.11a and
Fig. 2.11b. The calculated distortion profiles are shown in Fig. 2.11c and Fig. 2.11d, when
the MEMS mirror tilts ±10° in both axes. A severe distortion can be observed in Fig. 2.11c
compared to Fig. 2.11d.
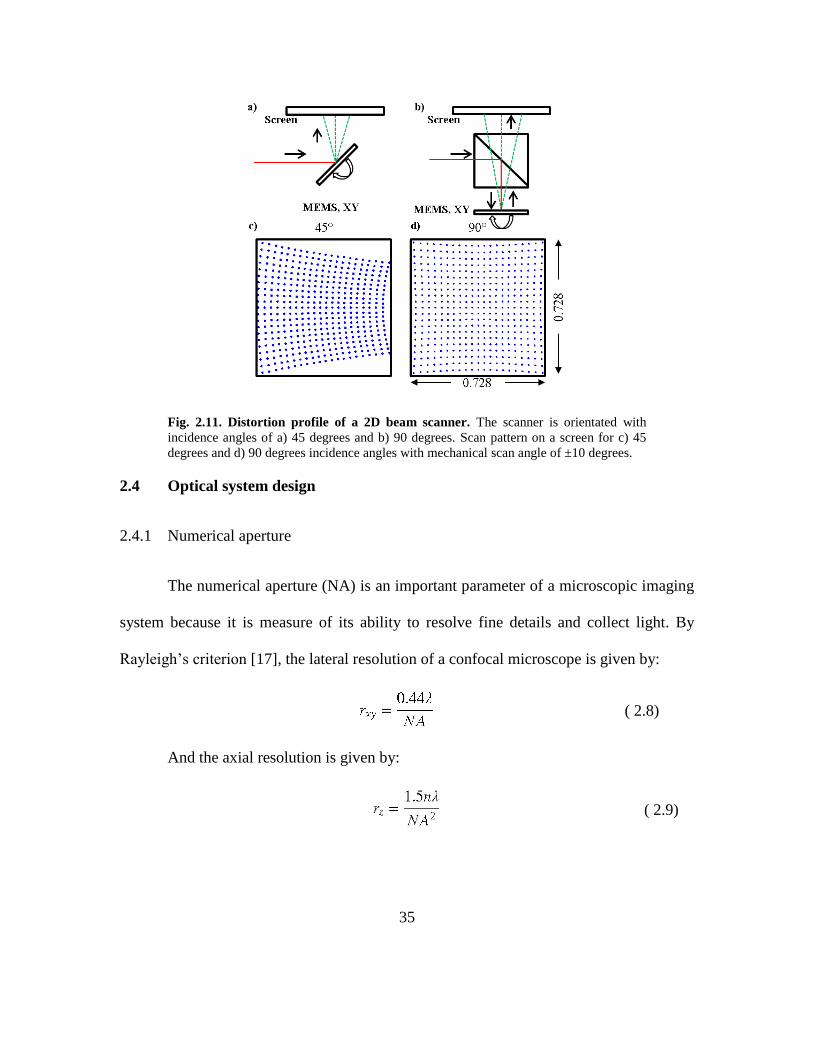
35
Fig. 2.11. Distortion profile of a 2D beam scanner. The scanner is orientated with
incidence angles of a) 45 degrees and b) 90 degrees. Scan pattern on a screen for c) 45
degrees and d) 90 degrees incidence angles with mechanical scan angle of ±10 degrees.
2.4 Optical system design
2.4.1 Numerical aperture
The numerical aperture (NA) is an important parameter of a microscopic imaging
system because it is measure of its ability to resolve fine details and collect light. By
Rayleigh’s criterion [17], the lateral resolution of a confocal microscope is given by:
( 2.8)
And the axial resolution is given by:
( 2.9)

36
For multiphoton microscopy, NA also affects the efficiency of two photon
absorption. When a fluorophore is illuminated by laser pulsed through a focusing lens, the
probability that a fluorophore will undergo two-photon excitation is given by the following
equation [110]:
( 2.10 )
2.4.2 Beam scanning configurations
Fig. 2.12. Beam scanning configurations. a) Pre-objective scan. b) Post-objective scan.
Figure adapted from [86].
For a pre-objective scan configuration, as shown in Fig. 2.12a, the scan mirror is
placed before the objective lens. This is the most commonly used method, especially in
commercial table-top microscopes. A high NA and a flat image field can be achieved. Fig.
2.12b shows a post-objective scan configuration, where the scanner is located between the
objective and the imaging sample. A long working distance objective is needed and the

37
system will have lower NA. The imaging field is curved due to the scanning. The advantage
of this approach is that the beam is always on axis with respect to the objective.
2.4.3 Scanner parameters and optical performance
Two important indicators of optical performance are the field of view (FOV) and
the lateral resolution, rxy. These two parameters can be combined into one performance
metric: the maximum number of resolvable spots [111], N. This metric indicates how
much information is contained inside the image. N is given by:
( 2.11)
θobj is the scan angle entering the objective, and θmirror is the scan angle of the MEMS mirror.
M is the magnification between the MEMS aperture and the objective aperture. Dmirror and
Dobj are diameters of the mirror aperture and the objective. The FOV is given by:
( 2.12)
We also have the following:
( 2.13)
And from equation 2.4, we have:
( 2.14)
We show that the maximum number of resolvable spots only depends on the mirror
diameter and the maximum tilting angle.

38
2.5 Data acquisition and image reconstruction
Fig. 2.13. LabVIEW program flow.
Fig. 2.14. LabVIEW program interface.
A LabVIEW program is developed to interface with the DAQ board for
synchronized Lissajous scan pattern generation, data acquisition and real-time image

39
reconstruction. The program flow is shown in Fig. 2.13. The program interface is shown
in Fig. 2.14. There are mainly four panels: main control, data acquisition (DAQ) control,
image reconstruction and laser control. Details of the program is included in the appendix.
2.6 Design flow of an endomicroscope probe
Fig. 2.15 shows a typical design flow of a laser scanning endomicroscope probe
based on a MEMS scanner. The contribution of the thesis is marked in red.
Fig. 2.15. Design flow of a MEMS based endomicroscope.

40
Chapter 3 Multiphoton endomicroscope
Part of this work has been published in [67].
3.1 Introduction
Improved imaging methods are needed to visualize the epithelium in genetically-
engineered mouse models of human disease. This thin layer of tissue lines hollow organs,
such as colon, and is the origin of a number of human cancers. Multiphoton microscopy
is a powerful imaging tool for visualizing biological tissues with sub-cellular resolution
and provides excellent depth, minimal photodamage, and reduced scattering [110].
Intravital microscopy is an emerging methodology for performing real time imaging in live
animals. This technology is playing a greater role in the study of cellular and molecular
biology because in vitro systems cannot adequately recapitulate the microenvironment of
living tissues and systems. Conventional intravital microscopes use large, bulky objectives
that require wide surgical exposure to image internal organs and result in terminal
experiments [1]. If these instruments can be reduced sufficiently in size, biological
phenomena can be observed in a longitudinal fashion without animal sacrifice.
A fast, compact scanner is needed to perform real time imaging with high
performance in a miniature instrument. Previously, multiphoton endomicroscopes based

41
on fiber scanning have been demonstrated [43] [41] [42] [44]. This approach can
introduce extra off-axis aberrations, and scanning performance is fiber dependent.
Alternatively, beam scanning can be performed using tiny mirrors developed with
microelectromechanical systems (MEMS) technology. MEMS scanners have been
developed previously [112] [62] [113], but the overall size of the endomicroscope was not
adequately small to perform repetitively imaging in mice. We aim to demonstrate a
handheld multiphoton endomicroscope with a small distal diameter using a compact high
speed MEMS scanner to perform repetitive imaging in the colon of a live mouse with
“histology-like” performance.
3.2 Background
3.2.1 Two-photon microscopy
Two-photon microscopy is a powerful imaging tool for visualizing biological
tissues with sub-cellular resolution and provides excellent depth, minimal photodamage,
and reduced scattering [110].
Unlike traditional fluorescence microcopy which uses shorter wavelength for
longer emission wavelength, two-photon microscopy uses longer wavelength for excitation.
During the process of two-photon absorption, two photons with longer wavelength are
absorbed simultaneously by the same molecule, resulting in the emission of a photon with
shorter wavelength. In two-photon microcopy, near-infrared light can be used to excite

42
commonly available dyes with visible range emission, improving the penetration depth due
to less scattering.
Two-photon microscopy has a similar optical architecture compare to confocal
microscopy. Both techniques use galvo scanner for laser beam scanning, an objective for a
tight focus and have capability of optical sectioning. Two-photon microscopy relies on the
fact that two-absorption only occurs at the focal spot, while confocal microscopy uses a
pinhole to reject out of focus fluorescence. In this sense, two-photon microscopy has less
photo-toxicity for regions not at the focal spot. It’s also easier to separate the excitation
light from the emission since two-photon microscopy uses much longer wavelength, while
confocal microscopy uses excitation wavelength close to emission wavelength.
3.3 Methods
3.3.1 2D MEMS scanner
3.3.1.1 Scanner design and fabrication
Our group has previously developed a 2D MEMS scanner based on the principle of
parametric resonance, where large mechanical scan angles can be achieved by driving the
structure at 2ω0/n, where ω0 is the natural frequency of the scanner structure and n is an
integer ≥1 [107] [114] [108]. The mirror was designed with a 1.8 mm diameter circular
reflector to accommodate the 1.2 mm width of the excitation beam at 45o incidence, Fig.
3.1. When scanning at large mechanical angles up to ±4.5o, this mirror reflects >95% of
the beam. A gimbal frame is used to minimize cross-talk between the X (inner) and Y

43
(outer) axes. Orthogonally oriented inner and outer electrostatic comb-drives actuators are
coupled to torsional springs to rotate the mirror about either axis. In this design, the
resonant frequencies of the inner and the outer axes were chosen to be ~1 and ~3 kHz,
respectively, to image in vivo at ≥5 frame/sec using Lissajous scanning. Custom software
was developed in LabView to drive the MEMS scanner and to reconstruct the image by
remapping the time series signal to a 2D image using calibrated motion profiles from the
scanner to generate a lookup table. The scanner was fabricated using a 3 step deep reactive-
ion etch (DRIE) process with 3 masks [108]. Aluminum was sputtered on the front-side
silicon surface to improve reflectivity. The mirror curvature and surface roughness were
measured using an optical surface profiler (NewView 5000, Zygo).
Fig. 3.1. 2D MEMS scanner. a) Schematic shows dimensions of the 2D MEMS scanner.
b) SEM of fabricated scanner. c) MEMS scanner mounted onto a custom design fixture.
Fig. 3.1a shows a schematic of the 2D MEMS scanner. A 1.8 mm diameter
reflector is supported by a gimbal frame on a chip with overall size of 3×3 mm2. The mirror
rotates in the XY plane using two orthogonal sets of electrostatic comb-drive actuators.
The mirror is coated with a ~50 nm layer of Al to achieve high reflectivity from 450-780

44
nm. We measured a reflectivity > 80% using a 488 and 780 nm laser. We did not increase
the thickness of the coating because increased stress can deform the reflective surface and
change the curvature of the MEMS mirror. We haven’t observed any damage to the mirror
from the laser after using this single MEMS mirror for our animal imaging experiments.
We found the mirror surface to have a radius of curvature of ~1.7 meter and a root mean
square (RMS) roughness of ~2 nm. Fig. 3.1b shows a scanning electron micrograph (SEM)
of the fabricated scanner. In Fig. 3.1c, a custom designed fixture was fabricated using
Delrin, a non-conductive material with high strength and stiffness. Copper pins were used
as contacts for wire bonding the electrical connections.
3.3.1.2 MEMS scanner performance
Fig. 3.2. MEMS scanner characterization. Frequency response shows mechanical scan
angles of the c) inner and d) outer axes with drive voltage of 40 Vpp with either an upsweep
(low-to-high) or downsweep (high-to-low) in frequency.
Fig. 3.2a and Fig. 3.2b shows the frequency response of the scanner to a sine-wave
input at 40 Vpp for the X and Y axes, respectively. When sweeping from high-to-low
frequency in a downsweep (green), we found a larger scan angle compared to sweeping

45
from low-to-high frequency in an upsweep (blue). This phenomenon has been previously
demonstrated with parametric resonance scanners [114] [108]. This device can achieve
±4.5° mechanical scan angle at 40 Vpp with a drive frequency close to 2ω0 of 5.82 and 1.61
kHz for the X and Y axes, respectively, to produce images at 5 frames/sec with 400x400
pixels.
Applying these drive frequencies to our parametric resonance scanner, we achieved
actual tilting frequencies of 2910 Hz and 805 Hz in the X and Y axes, respectively. This
forms a dense Lissajous scan pattern which repeats itself at 5 Hz to encompass images with
dimensions of 400x400 pixels with 100% coverage. Since there is a phase difference
between the driving waveform and the actual mirror location, we need to find this phase
information for image reconstruction. This process is done by imaging a standard target
and manually iterating through different phases for both channels. The optimal phases are
chosen when we can get a sharp image. The phase is adjusted manually during imaging
with step size of 0.01 degrees. We identified these parameters using a custom Matlab
program.
3.3.2 Optical design
We performed ray-trace simulations (ZEMAX, ver. 13) to identify commercially-
available optics to achieve diffraction-limited resolution on axis, Fig. 3.3. We used
achromats for L3 and L4 in a telescope configuration to expand the excitation beam to a
width of 1.8 mm to fill the back aperture of the focusing optics L5 and L6 to maximize the
effective numerical aperture (NA) and hence photon flux to generate the fluorescence

46
signal. Fig. 3.3a shows the ray tracing simulation of the optical design using Zemax. We
identified commercially-available achromats with OD 3 mm for L3 with f = 6 mm (45-089,
Edmund Optics) and L4 with f = 9 mm (45-090, Edmund Optics) to produce a telescope
configuration. For focusing, we identified an aspheric lens L5 with OD 3 mm and f = 2
mm (352150-B, Thorlabs) and a plano-convex lens L6 with OD 2 mm and f = 2 mm (65-
265, Edmund Optics). We measured a distance of 0.34 mm between L5 and L6 by using a
reflectance image to bring a standard USAF target (R3L1S4N, Thorlabs) into focus. This
optical configuration has an effective NA = 0.63 and a working distance of Z = 60 μm. At
this depth, the nuclei in the epithelium of mouse colon can be visualized. We obtained a
field-of-view (FOV) of 300×300 μm2 with a lateral mechanical scan angle of ±4.5o. Zemax
simulation results for spot sizes are shown in Fig. 3.3b-d. A diffraction-limited spot size
with radius R = 0.33 μm was found on the optical axis at X=0 μm that increased to R =
2.17 μm at X=150 μm, the lateral extent of the image FOV. With these optics, the frontal
focus shifts <30 μm over the wavelength range 450-780 nm used to excite and collect
fluorescence. The difference in focus between the excitation and fluorescence wavelengths
has little effect on the coupling efficiency of our system because we use a separate, large
multi-modal fiber for collection.

47
Fig. 3.3. Zemax Simulation. a) Ray-trace simulation for design of the distal optics (L3-
L6). A field-of-view (FOV) of 300×300 μm2 can be achieved with a lateral mechanical
scan angle of ±4.5o. b), c), d) Spot size (RMS radius) of 0.33, 1.265 and 2.168 μm can be
achieved at a distance of 0, 70 and 150 μm away from the center of the FOV.
3.3.3 System architecture
We used a Ti-Sapphire laser (Mai Tai DeepSee HP DS, Spectra-Physics) with a
tunable spectral range of 700-1040 nm to deliver excitation (red arrows) with ~100 fs pulse
width at 80 MHz, Fig. 3.4. The pulse duration was minimized using a dispersion pre-
compensation unit located inside the laser housing. A half wave plate (HWP) and linear
polarizer (LP) were used in combination to adjust the power. The beam is focused into a
1 meter long hollow core photonic bandgap fiber (PBF) with NA = 0.2 (HC-800-02, NKT
Photonics) using a 10X objective lens L1 with f = 18 mm (RMS 10X, Thorlabs). The PBF
fiber transmits light at 780 nm with zero dispersion, thus prechirp was not performed. This
fiber can achieve a bend diameter of <1 cm without loss of optical transmission. An
aspheric lens L2 with f = 3 mm (355660-B, Thorlabs) collimates the beam coming out of
the fiber to a diameter of 1.2 mm. The beam is reflected by an aluminum (Al) coated mirror
M1 (48-405, Edmund Optics), and passes through a dichroic mirror M2 (62-634, Edmund
Optics) with transmission efficiency >95% at 780 nm onto a custom 2D MEMS scanner
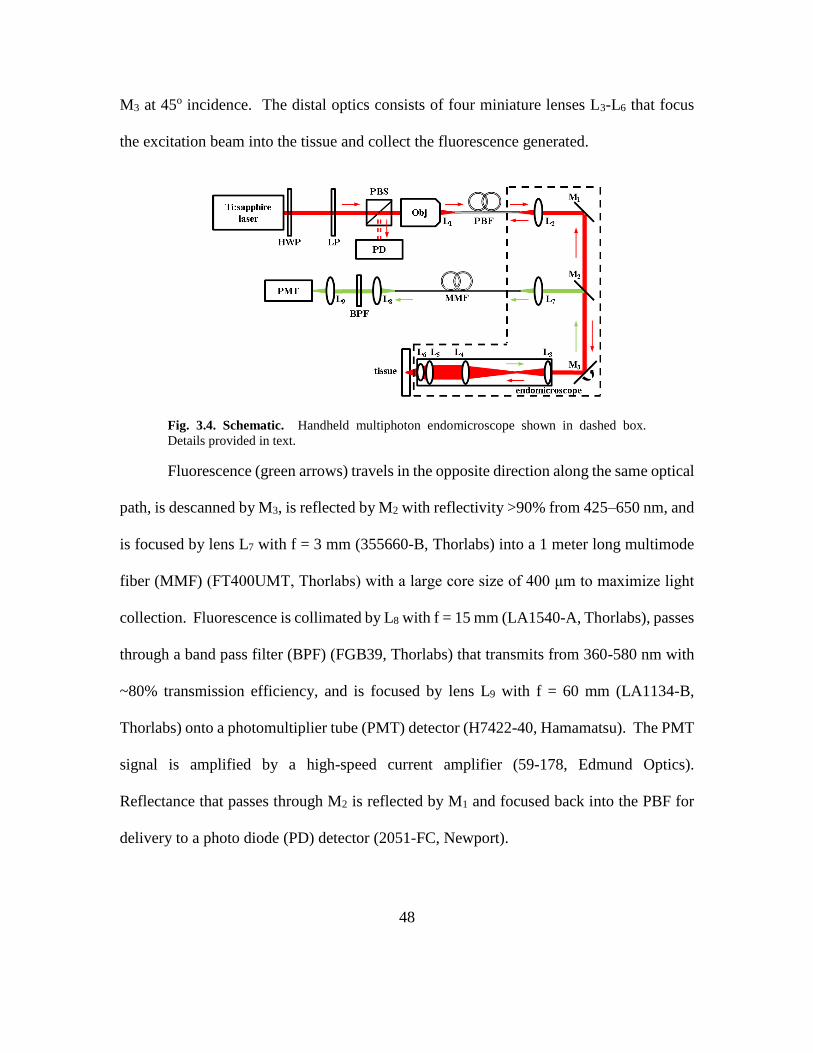
48
M3 at 45o incidence. The distal optics consists of four miniature lenses L3-L6 that focus
the excitation beam into the tissue and collect the fluorescence generated.
Fig. 3.4. Schematic. Handheld multiphoton endomicroscope shown in dashed box.
Details provided in text.
Fluorescence (green arrows) travels in the opposite direction along the same optical
path, is descanned by M3, is reflected by M2 with reflectivity >90% from 425–650 nm, and
is focused by lens L7 with f = 3 mm (355660-B, Thorlabs) into a 1 meter long multimode
fiber (MMF) (FT400UMT, Thorlabs) with a large core size of 400 μm to maximize light
collection. Fluorescence is collimated by L8 with f = 15 mm (LA1540-A, Thorlabs), passes
through a band pass filter (BPF) (FGB39, Thorlabs) that transmits from 360-580 nm with
~80% transmission efficiency, and is focused by lens L9 with f = 60 mm (LA1134-B,
Thorlabs) onto a photomultiplier tube (PMT) detector (H7422-40, Hamamatsu). The PMT
signal is amplified by a high-speed current amplifier (59-178, Edmund Optics).
Reflectance that passes through M2 is reflected by M1 and focused back into the PBF for
delivery to a photo diode (PD) detector (2051-FC, Newport).

49
For laser excitation, the transmission efficiency from the input of the PBF to the
output of the endomicroscope at L6 is ~20%. The PBF has ~50% transmission through the
1 meter length, and the MEMS mirror provides ~70% reflection, which includes a slight
overfilling of the mirror and insertion losses from the optics. For fluorescence collection,
the transmission efficiency from distal end of the endomicroscope at L6 back to the PMT
is ~50%, resulting from ~70% reflection at the MEMS mirror, ~95% transmission through
the multimode fiber (MMF), and ~80% transmission efficiency of the bandpass filter (BPF)
before the PMT.
We used a high-speed multi-function data acquisition board (National Instruments,
PCI-6115) to digitize the fluorescence signal from the PMT and the reflectance signal from
the photodiode. The same board was used to generate control signals to drive the 2D
MEMS scanner. The data acquisition board was controlled by a pc running custom
developed Labview programs.
3.3.4 Mechanical design and packaging
We used CAD software (Solidworks, ver 2013) to design the housing to package
the optics and scanner, Fig. 3.5a. We used an uncoated stainless steel tube with an outer
diameter (OD) of 3.4 mm and an inner diameter (ID) of 3 mm to center and align the distal
focusing optics. The MEMS scanner was then mounted onto a 3-axis linear stage to align
the optics, which was then fixed in place with epoxy (G14250, Thorlabs). Fig. 4a shows a
CAD drawing of the mechanical package used for the handheld multiphoton
endomicroscope. Fig. 3.5a shows the stainless steel tube with 3.4 mm diameter and 26

50
mm length used to align the distal focusing optics. Fig. 3.5c shows the instrument held by
hand for in vivo imaging.
Fig. 3.5. Endomicroscope packaging. a) CAD drawing. b) Distal focusing optics. c)
Handheld instrument can be used to perform repetitive imaging in small animal models of
human disease. d) MEMS scanner.
3.3.5 System resolution
We used 100 nm diameter latex beads (F-8803, Life Technologies) to generate
fluorescence for measuring the lateral and axial resolution of the imaging system. These
dye-coated microspheres produce peak fluorescence emission at em = 515 nm. The lateral
resolution was measured from the horizontal fluorescence intensity profile across a single
bead in the image, Fig. 5. The axial resolution was determined by scanning the beads in
the axial direction using a translational stage. We aimed to achieve an image with a FOV
of 300×300 μm2 by sampling with 400×400 pixels. To satisfy the Nyquist theorem, we
need at least 300×300 pixels to sample the FOV with lateral resolution of 2 μm.
51
3.3.6 Imaging of mouse colon
The study was approved by the Michigan University Committee on the Use and
Care of Animals (UCUCA). We evaluated n = 5 CPC;Apc and n = 5 Cdx Cre mice. The
CPC;Apc mice spontaneously develop colonic polyps in the distal colon that are accessible
to the endomicroscope. These mice are genetically engineered to sporadically delete the
APC gene, which is mutated in human disease [82]. The Cdx Cre mice do not develop
polyps, and were used for imaging normal colonic mucosa. During imaging, the mice were
anesthetized with inhaled isoflurane. We first used a small animal wide-field endoscope
(27030BA, Karl Storz Veterinary Endoscopy) with white light illumination to exam the
colon for presence of polyps. For use as landmarks, we measured 1) the distance between
the endoscope tip and the anus and 2) the clockwise location of the polyp. Water was
delivered through the instrument channel of the endoscope to remove stool, debris, and
mucous. Hoechst 33342 (H1399, Life Technologies) at a dose of 10 mg/kg diluted in 200
μL of PBS was delivered intravenously via a tail vein injection to stain the cell nuclei.
After 30 min, the distal tip of the endomicroscope was placed in contact with the polyp.
Images were collected at 5 frames/sec with a laser power of 50 mW exiting the probe.
After completion of imaging, the mice were euthanized. The endomicroscope was oriented
perpendicular to the specimen to optimize contact. Images were collected with the same
power as that used in vivo. We used the previously identified landmarks to confirm the
location of the polyp. The tissues were fixed in 10% buffered formalin and processed for

52
routine histology (H&E). We identified individual frames from the video streams with
minimal motion artifacts.
3.4 Results
3.4.1 System resolution
Fig. 3.6a shows a reflectance image of a standard resolution target (USAF 1951)
collected with the handheld multiphoton endomicroscope used to adjust the distance
between L5 and L6. The smallest set of bars (group 7, element 6) can be distinguished
(dashed red oval), which represents a dimension of ~2 µm. Fig. 3.6b shows a
representative fluorescence intensity profile from a 100 nm diameter bead (inset) plotted
in the lateral dimension (blue line). The FWHM (full-width at half-maximum) of X =
2.03 µm confirms the lateral resolution result. Fig. 3.6c shows a representative
fluorescence intensity profile of a bead plotted in the axial dimension with FWHM of Z
= 9.02 µm.
Fig. 3.6. Image resolution. a) Reflectance image of standard target (USAF 1951).
Fluorescence intensity profiles of 100 nm beads show full-width at half maximum
(FWHM) of b) 2.03 μm in lateral and c) 9.02 μm in axial directions.

53
3.4.2 Imaging of mouse colon
Fig. 3.7. Imaging results. a) Single frame from multiphoton excited fluorescence video
(Media 1) of normal colonic mucosa collected in vivo at 5 frames/sec. b) Ex vivo image
from normal averaged over 5 frames. c) Corresponding histology (H&E) of normal colon.
Single frame from video of dysplastic crypts from colon of CPC;Apc mouse collected d)
in vivo (Media 2) at 5 frames/sec and e) ex vivo (averaged over 5 frames). f)
Corresponding histology (H&E) of dysplasia
We repetitively imaged the colon in live mice three days apart up to five times
without any physical signs of trauma, including rectal bleeding, change in activity, and
altered behavior. We could identify individual cell nuclei in crypt structures and in the
lamina propria. Fig. 3.7a shows a representative image of normal mouse colon collected
in vivo at 5 frames/sec. The nuclei (arrow) are circular in shape, and the crypts have an
oval appearance with similar dimensions and a central lumen (arrow). Fig. 3.7b shows
these features more clearly on an ex vivo image of normal averaged over 5 frames.
Representative histology (H&E) is shown for normal, Fig. 3.7c. Fig. 3.7d shows a

54
representative image of dysplasia from a CPC;Apc mouse collected in vivo. The dysplastic
nuclei (arrow) appear enlarged and elongated, and the dysplastic crypts are larger in size
and distorted in shape. Fig. 3.7e shows these features more clearly on an ex vivo image of
dysplasia averaged over 5 frames. Histology (H&E) is shown for dysplasia, Fig. 3.7f.
3.5 Discussion
Here, we present a handheld multiphoton endomicroscope with a 3.4 mm distal
diameter that can be used to perform repetitive imaging in the colon of genetically-
engineered mice. We used a high speed Al-coated MEMS scanner with large mirror
surface to maximize the effective NA and photon flux to generate the fluorescence signal.
We achieved a mechanical scan angle of ±4.5 degrees at high frequencies with low drive
voltages (<40 Vpp) to produce a large FOV of 300×300 µm2 at 5 frames/sec. Decoupling
of the tilt motions between the inner and outer axes of the MEMS scanner allows for use
of Lissajous scanning at high frame rates. The small distal diameter provides flexibility
for use in intravital imaging compared with conventional microscopes that use bulk optics.
We found this instrument to have stable operation with minimal interference from
mechanical vibrations during in vivo imaging.
Imaging the epithelium of mouse colon with conventional optics and scanners
increases experimental complexity and study invasiveness [115]. Surgery is often
performed to improve exposure and immobilize organs using custom holders and stages,
which can cause bleeding and tissue damage. Coverslips used to flatten and immobilize
tissues can cause spherical aberrations. By reducing the distal diameter to 3.4 mm, we

55
achieved “histology-like” images in vivo that could distinguish between pre-malignant and
normal colonic mucosa in a mouse model of colorectal cancer. This instrument can be
broadly applied to a large number of sophisticated genetically-engineered mouse models
of epithelial cancers. A miniature instrument can minimize the number of animals needed,
better time the onset of disease, use each animal as its own control, and improve statistical
rigor.
Previous multiphoton endomicroscopes have been demonstrated that using
miniature scanning technologies. Fu et al reported a 5 mm diameter instrument with 10 µm
axial resolution using a 2D mirror based on electrothermal actuation [62]. Fluorescence
images were collected ex vivo from rat colon using raster scanning with individual frames
collected at 7 lines per sec, a speed that is too slow for in vivo imaging. Hoy et al
demonstrated a 10 × 15 × 40 mm3 handheld instrument with 16.4 µm axial resolution using
a 2D MEMS scanner based on electrostatic actuation [112]. Given the large size of this
instrument, fluorescence images with a FOV of 310 µm were collected ex vivo from cells
embedded in a collagen matrix using Lissajous scanning with individual frames averaged
over 5 sec. By comparison, our MEMS scanner has a larger diameter (1.8 mm versus 500
μm) with comparable scan angle, resulting in a >3-fold larger number of resolvable focal
spots [62]. Other multi-photon endomicroscopes have used GRIN lenses for
focusing [116] [117]. These objectives are limited by chromatic aberration for fluorescence
imaging. We used a compound lens because our MEMS mirror can achieve high
reflectivity over a broad spectral range from 450 to 780 nm.

56
We used commercially-available lens to demonstrate this approach. Imaging
performance can be improved in the future with custom optics. Chromatic aberrations can
be reduced to increase fluorescence excitation and collection efficiency. A side rather than
front viewing configuration can improve contact with the mucosal surface in hollow organs,
such as colon. The MEMS scanner can be designed to perform raster scanning to improve
the frame rate and reduce motion artifacts. As a future direction, we are incorporating the
MEMS scanner into the distal end of the instrument to increase the length and to adjust the
axial imaging depth using a remote fast scanning actuator [118].
3.6 Summary
We have developed a novel multiphoton endomicroscope that uses a fast MEMS
scanner with 3.4 mm distal optics to perform repetitive in vivo imaging in mouse colon to
distinguish between normal and dysplastic crypts. This instrument can be further
developed for broad use as a general purpose intravital imaging instrument to perform
longitudinal studies in genetically-engineered mouse models of human disease.

57
Chapter 4 Side-view multiphoton endomicroscope
4.1 Introduction
A front-viewing endomicroscope was demonstrated in the last chapter for in vivo
imaging in the mouse colon. The instrument should be oriented perpendicular to the
mucosal surface to achieve contact. However, there is very limited room for maneuver in
hollow organs of small animals. From our previous experience of using the front-viewing
probe for mouse colon imaging, we found that it is extremely challenging to maintain
contact and acquire stable images. For hollow organ imaging, a side-viewing design is
preferred over the previously developed front-viewing instrument. Therefore, in this
chapter we explore the feasibility of developing a side-viewing probe based on the
previously developed front-viewing instrument.
4.2 Methods
4.2.1 Side-view objective design
The most straightforward way to achieve a side-viewing imaging orientation is to
add a reflective mirror at the end of the objective with 45° angle of incidence, such that the
beam is reflected to the side, as shown in Fig. 4.1a. However, the required working distance
of the objective lens L3 will be very long such that the focused beam can reach out of the

58
probe even after the reflection. This approach has been demonstrated by Yun’s group that
a tabletop system was developed with a long GRIN lens and a reflective prism [119].
However, because of the size limitation of the probe, the long working distance objective
will have a low NA (≤0.4), which will affect the efficiency of two photon excitation.
Another optical configuration is shown in Fig. 4.1b, in which the collimated beam is
reflected by the 45° mirror first and then focused by the objective lens L3. This approach
will significantly increase the diameter of the probe. Chen’s group used this approach to
develop a probe with outer diameter of 10 mm [120]. Here we propose a new configuration,
as shown in Fig. 4.1c. The beam is focused by a long working distance objective L3,
reflected by the mirror and focused by another lens L4. Therefore, a higher NA can be
achieved at the sample plane. When designing this side-view lens and mirror combination,
Fig. 4.1d, it can be reduced to a two-lens configuration in Fig. 4.1e. The working distance
of L3 will need to be larger than 2.7 mm.
Fig. 4.1. Side-view optical configurations. a-c) Three different optical designs for side-
view configuration. d-e) Side-view objective design.

59
We performed Zemax simulations to identify two potential designs to realize the
side-view optical configuration. The design criteria are as follows: imaging NA ≥ 0.5,
working distance ≥ 80 µm and FOV ≥ 200 x 200 µm2.
Fig. 4.2. Zemax simulation of two side-view objective designs. a, b) Ray-trace
simulation for design 1 and design 2 of the side-view focusing optics (L3 and L4). c)
RMS spot size of design 1 at 0, 50 and 100 µm away from the center of the FOV are
3.18, 2.54 and 2.61 µm. d) RMS spot size of design 2 at 0, 75 and 150 µm away from the
center of the FOV are 0.82, 0.97 and 1.9 µm.
Design 1 is shown in Fig. 4.2a, where L3 is an achromatic doublet with a working
distance of 3 mm (f = 4.5 mm, NA = 0.33, OD = 3mm, #47-721, Edmund Optics) and L4
is a half ball lens (f = 0.6 mm, NA = 0.9, OD = 1mm, #49-568, Edmund Optics). An FOV
of 200 x 200 µm2 can be achieved with a field angle 2.2° before L3. RMS spot sizes at 0,
50 and 100 µm away from the center of the FOV are 3.18, 2.54 and 2.61 µm, Fig. 4.2c.

60
Design 2 is shown in Fig. 4.2b, where L3 is also an achromatic doublet with a working
distance of 4.33 mm (f = 6 mm, NA = 0.25, OD = 3mm, #45-089, Edmund Optics) and L4
is a plano-convex lens (f = 1 mm, NA = 0.75, OD = 1.5 mm, #65-261, Edmund Optics).
An FOV of 300 x 300 µm2 can be achieved with a field angle 2.8° entering L3. RMS spot
sizes at 0, 50 and 100 µm away from the center of the FOV are 0.82, 0.97 and 1.9 µm, Fig.
4.2c.
A comparison of the two designs is given in Table 4.1. Design 2 has slightly lower
NA than design 1, but there is a larger FOV and much less aberration. The following
discussion will be focused on the second design. The point spread function (PSF) at each
field angle is shown in Fig. 4.3.
Table 4.1. Performance comparison of two optical designs
Design 1 Design 2
NA 0.55 0.5
FOV (µm2) 200 x 200 300 x 300
Working distance
(µm)
100 100
Spot sizes (µm) 3.18 @0 µm 0.82 @0 µm
2.54 @50 µm 0.97 @75 µm
2.61 @100 µm 1.9 @150 µm
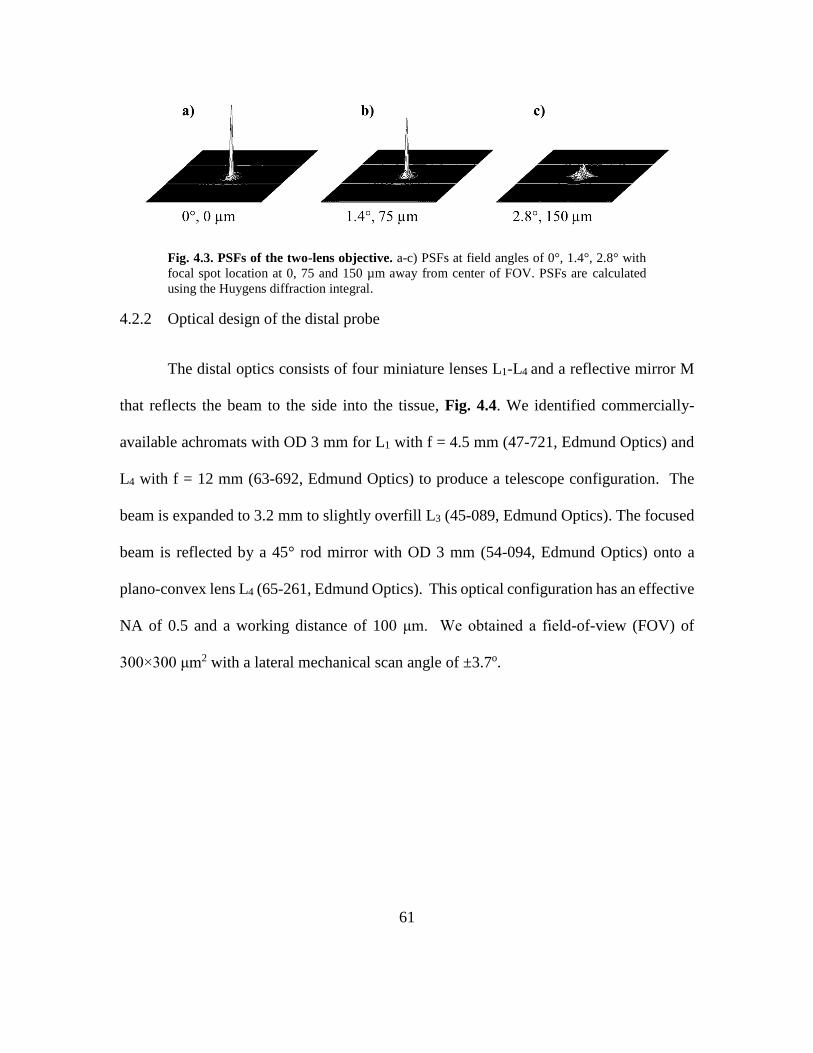
61
Fig. 4.3. PSFs of the two-lens objective. a-c) PSFs at field angles of 0°, 1.4°, 2.8° with
focal spot location at 0, 75 and 150 µm away from center of FOV. PSFs are calculated
using the Huygens diffraction integral.
4.2.2 Optical design of the distal probe
The distal optics consists of four miniature lenses L1-L4 and a reflective mirror M
that reflects the beam to the side into the tissue, Fig. 4.4. We identified commercially-
available achromats with OD 3 mm for L1 with f = 4.5 mm (47-721, Edmund Optics) and
L4 with f = 12 mm (63-692, Edmund Optics) to produce a telescope configuration. The
beam is expanded to 3.2 mm to slightly overfill L3 (45-089, Edmund Optics). The focused
beam is reflected by a 45° rod mirror with OD 3 mm (54-094, Edmund Optics) onto a
plano-convex lens L4 (65-261, Edmund Optics). This optical configuration has an effective
NA of 0.5 and a working distance of 100 μm. We obtained a field-of-view (FOV) of
300×300 μm2 with a lateral mechanical scan angle of ±3.7o.

62
Fig. 4.4. Optical design and lens selection for the distal probe.
4.2.3 Mechanical design and packaging of side-view probe
We used CAD software (Solidworks, ver 2013) to design the housing to package
the optics, Fig. 4.5a,b. There are mainly three mechanical parts housing the optics: relay
and focusing lens (L1-3) holder, distal lens (L4) holder and rod mirror (M1) holder. Using
this design, the distance between L3 and L4 can be controlled to adjust the working distance
out of L4. Also, the M1 can be rotated and translated to control the direction of the reflected
beam. We used a stainless-steel tube with an outer diameter (OD) of 3.4 mm and an inner
diameter (ID) of 3 mm to fabricate the holders for L1-3 and M1, Fig. 4.5c,e. L1 and L2 were
installed into the tube first and the spacing was adjusted to create a collimate beam after
the telescope. Then L3 was installed at the end. Optics were fixed in position using a UV
epoxy (NOA61, Norland Products). A stainless-steel tube with an outer diameter (OD) of
3.8 mm and an inner diameter (ID) of 3.4 mm was used to fabricate the distal lens holder
which also connects the other two tubes, Fig. 4.5d. The alignment fixture can be screwed
onto the mirror holder, and the other end can be fixed on a 5-DOF precision stage for

63
alignment. The location of the rod mirror has to be adjusted such that the reflected beam is
aligned with the optical axis of L4, Fig. 4.5f. After alignment, a circular diverging beam
at the exit of L4 is shown in Fig. 4.5g.
Fig. 4.5. Distal probe design and packaging. a) CAD drawing of the probe assembly and
b) the exploded view. c) Fabricated stainless tube for relay lens pair and focusing lens. d)
Distal lens holder. e) Rod mirror holder and alignment fixture. f) Alignment of the rod
mirror using a 2DOF rotational stage and a 3DOF translational stage. g) Beam profile after
alignment.
4.2.4 Mechanical design and packaging of the handheld instrument
The complete CAD design of the handheld side-view probe is shown in Fig. 4.6a.
The distal probe is mounted onto the same handheld part presented in chapter 3. Assembled

64
instrument is shown in Fig. 4.6b. In order to control the imaging location in vivo in the
mouse colon, the probe is mounted onto a rotational (488, Newport) and translational stage
(562F-XYZ, Newport) such that it can navigate easily in the mouse colon, Fig. 4.6c. The
optical axis of the distal probe is aligned with the axis of rotation for the rotational stage.
Fig. 4.6. Handheld probe mechanical design and packaging. a) Solidworks design of
the probe. b) Assembled probe. c) Probe mounted onto a rotational and translational stage
such that it can navigate in the mouse colon.
4.2.5 Ex vivo imaging of mouse colon tissue
The CPC;Apc mice spontaneously develop colonic polyps in the distal colon that
are accessible to the endomicroscope. For ex vivo tissue imaging, the mouse was
65
euthanized and the colon tissue was harvested. The tissue was stained with Hoechst 33342
(H1399, Life Technologies) for 5 min and washed by PBS. Then the side of the distal probe
was placed in contact with the tissue. Images were collected at 5 frames/sec with a laser
power of 30 mW on the mucosa. During imaging, we used the translational stage to move
the probe along the colon tissue such that a mosaic image can be acquired.
4.2.6 In vivo imaging
The study was approved by the Michigan University Committee on the Use and
Care of Animals (UCUCA). During imaging, the mouse was anesthetized with inhaled
isoflurane. We first used a small animal wide-field endoscope (27030BA, Karl Storz
Veterinary Endoscopy) with white light illumination to exam the colon for presence of
polyps. Hoechst 33342 (H1399, Life Technologies) at a dose of 10 mg/kg diluted in 200
μL of PBS was delivered intravenously via a tail vein injection to stain the cell nuclei.
After 30 min, the endomicroscope probe was placed inside the distal colon and L4 can be
in direct contact with the side walls. Images were collected at 5 frames/sec with a laser
power of 50 mW on the mucosa.
4.3 Results
4.3.1 System resolution
Fig. 4.7 shows a reflectance image of a standard resolution target (USAF 1951)
collected with the side-view multiphoton endomicroscope. The smallest set of bars (group

66
7, element 6) can be distinguished (dashed red oval), which represents a dimension of ~2
µm.
Fig. 4.7. Image resolution. Reflectance image of standard target (USAF 1951).
4.3.2 Lens paper imaging
Lens paper stained with DEAC and added green fluorescent beads, Fig. 4.8..
Fig. 4.8.Lens paper imaging. Mosaiced image created by moving the probe along the dye
stained lens paper
4.3.3 Ex vivo imaging of mouse colon tissue
Fig. 4.9. Ex vivo imaging of mouse colon tissue. Mosaiced image created by moving the
probe along the mouse colon sample

67
4.3.4 In vivo imaging of mouse colon
Fig. 4.10. In vivo and ex vivo imaging of mouse colon. a) In vivo image collected inside
the mouse colon with 5 Hz frame rate. b) Ex vivo image collected from excised colon tissue
with 5 Hz frame rate. c) 5-frame average of ex vivo images. d) Image of the same tissue
collected using a commercial confocal microscope.
We could identify individual cell nuclei in crypt structures and in the lamina propria.
Fig. 4.10a shows a representative image of normal mouse colon collected in vivo at 5
frames/sec. The nuclei (arrow) are circular in shape, and the crypts have an oval

68
appearance with similar dimensions and a central lumen (circle). Fig. 4.10b shows a
representative image mouse tissue collected ex vivo with 5 Hz frames/sec. Fig. 4.10c
shows a 5-frame average of the ex vivo images. The same tissue was imaged under a
commercial confocal microscope, as shown in Fig. 4.10d. These images show that our
instrument can be used to collect in vivo and ex vivo images with similar performance of
a commercial confocal microscope.
4.4 Discussion
Here, based on the instrument presented in chapter 3, we developed a side-view
multiphoton endomicroscope with a 3.8 mm distal diameter that can be used to image the
hollow organs of small animals. We used a mechanical scan angle of ±4 degrees at high
frequencies with low drive voltages (<40 Vpp) to produce a large FOV of 300×300 µm2 at
5 frames/sec. Compared to the front-viewing probe previously developed, this side-
viewing architecture made it much easier to create stable imaging in the mouse colon
because the distal lens is in direct contact with the side walls. We also found that it is much
easier to pinpoint to different locations in the colon with the use of the rotational and
translational mechanisms.
Previous side-view multiphoton endomicroscopes have been demonstrated in a
tabletop setup where a long GRIN lens was used [121]. Here we used a MEMS scanner
and miniature lenses to demonstrate a handheld endomicroscope with better optical
performance. However, due to the use of commercially available optics, aberration is not
corrected when the MEMS scans in large angles. Also, the numerical aperture is limited by

69
the choice of optical components, which affects two photon excitation efficiency. Imaging
performance can be improved in the future with custom optics.
4.5 Summary
We have developed a novel side-view multiphoton endomicroscope that uses a 3.8
mm distal probe to perform repetitive in vivo imaging in mouse colon.
70
Chapter 5 Side-view confocal endomicroscope
5.1 Introduction
In last chapter we reported a side-view multiphoton probe for in vivo imaging in
the mouse colon. The beam was scanned by a 2D MEMS actuator, expanded a telescope,
and focused by the side-viewing optics. This is called pre-objective scan in which the beam
scanner is placed before the imaging objective. This architecture is used in most laser
scanning microscopes. Another type of scanning architecture is called post-objective scan
where the scanner is placed after the objective. This allows for much larger scan angle and
places lower requirement for the objective since incoming beam is always on-axis. But the
imaging field will be curved and a longer working distance objective is needed. Based on
our previous design, we can change the rod mirror to a MEMS scanner and then we are
performing post-objective scan. The advantage of this design is that we can develop an
ultra-compact endomicroscope probe, without handheld part. This allows for the use of the
probe not only in small animals but also in human. Also, we will expect to have improved
resolution and field of view. However, there will be a lot of technical challenges in
integrating the scanner into the distal tip of the probe. In this chapter, we demonstrate the
development process and imaging performance of a side-view confocal endomicroscope.
71
Confocal endomicroscopy is an emerging technology that can be used to collect
high resolution images in vivo. [52] Front-viewing instruments are currently being used
in the clinic to provide instantaneous “optical biopsies” with histology-like
quality. [52] [27] They are oriented perpendicular to the mucosal surface to achieve
contact. However, some clinical applications, such as imaging in the biliary and pancreatic
duct, and hollow organs of small animals, have limited room for maneuver. From our
previous experience of using a front-viewing multiphoton probe for mouse colon imaging,
we found that it is challenging to maintain contact and pinpoint different locations.
Therefore, a side-viewing design will be useful for these applications.
For real time imaging with high performance, a fast, compact scanner that can be
packaged into a miniature instrument is needed. We have previously developed a 2D
MEMS scanner to performs resonant scanning in orthogonal axes in a front-view
endomicroscope. [67] We have now modified the mirror geometry to achieve a reduced
chip dimensions to accommodate the limited space in a side viewing optical design and a
higher resonant frequency for faster imaging speed.
Contrast agents that are specific for overexpressed molecular targets can help define
biological activity in cancer. Peptides are promising for systemic use because they are
small in size and low in molecular weight, thus have improved pharmacokinetic properties
for imaging compared with bulky monoclonal antibodies. [122] Advantages include
greater extravasation from leaky tumor vasculature, enhanced tissue diffusion, and deeper
tumor penetration. [123] Peptides clear more rapidly from non-target tissues for reduced

72
background. [124] We have previously demonstrated a peptide specific for EGFR that was
used to collect wide field fluorescence images of pre-malignant mucosa in mouse
colon. [75] To demonstrate one of the use cases of the side-view probe, we aim to use it to
validate specific peptide binding in vivo at the cellular level.
5.2 Methods
5.2.1 System architecture
Fig. 5.1. Optical system schematic. Optical configuration of side-viewing
endomicroscope. Details provided in text. Key: PMT – photomultiplier tube, MMF –
multi-mode fiber, SMF – single mode fiber, L – lens, F – filter, M – mirror.
A schematic for the system design of the side-view endomicroscope is shown, Fig.
5.1. We used a solid-state diode laser (660-S, Toptica Photonics) to deliver excitation at
ex=660 nm. The beam is reflected by a dichroic mirror M1 (FF685-Di02-25x36, Semrock)
and focused by lens L1 (C220TMD-B, Thorlabs) into a 2-meter long single mode optical
fiber (SMF, SM600, Thorlabs). The light coming out of the fiber is collimated by lens L2
with f = 12 mm (45-262, Edmund Optics) to a beam diameter of 3 mm and focused by lens

73
L3 with f = 6 mm (45-089, Edmund Optics). L2 and L3 have a common diameter of 3 mm.
The focused beam is reflected 90 degrees by a 2D resonant MEMS mirror M2 into a solid
immersion lens L4 with f = 1 mm and OD 1.5 mm (65-261, Edmund Optics). Fluorescence
(dashed red arrows) travels in the opposite direction along the same optical path, is
descanned by M2, and focused into the same single mode fiber (SMF). After exiting the
fiber, fluorescence is collimated by L1, passes through the dichroic M1, reflected by M3,
and passes through a band pass filter F1 (FF01-716/40-25, Semrock) that transmits from
696 – 736 nm with >93% transmission efficiency, and is focused by lens L5 (C110TMD-
B, Thorlabs) with f = 6.24 mm into a 1-meter long multimode fiber (MMF, FT400UMT,
Thorlabs). The multimode fiber transmits fluorescence to a photomultiplier tube (PMT)
detector (H7422-40, Hamamatsu). The PMT signal is amplified by a high-speed current
amplifier (59-178, Edmund Optics). We used a high-speed multi-function data acquisition
board (National Instruments, PCI-6115) to digitize the amplified PMT signal. The same
board was used to generate control signals to drive the 2D MEMS scanner. The data
acquisition board was controlled by a PC running custom LabVIEW software.
5.2.2 Optical design
We performed ray-trace simulations (ZEMAX, ver 13) to design the optics, Fig.
5.2a. Our design criteria included diffraction-limited resolution in the center 100 x 100
m2 of the image with a field-of-view (FOV) of ~400×400 m2, working distance of 100
m, and NA > 0.5. Only lenses with outer diameter <3 mm were considered so that the

74
instrument will be small enough for in vivo imaging. Commercially available lenses were
chosen to demonstrate proof-of-concept. Fig. 5.2b-d show that spot size (RMS radius) of
0.632, 0.794 and 1.944 μm can be achieved at 0, 75 and 150 μm away from the center of
the FOV.
Fig. 5.2. Optical design. a) Ray-trace simulation for design of the distal optics (L2-L4).
A field-of-view (FOV) of 400 × 400 μm2 can be achieved. b-d) Spot size (RMS radius) of
0.632, 0.794 and 1.944 μm can be achieved at 0, 75 and 150 μm away from the center of
the FOV.
5.2.3 MEMS scanner
Our group have previously developed a compact 2D MEMS scanner with a chip
size of 3×3 mm2 and a 1.8 mm diameter circular reflector. [67] The geometry of the MEMS
mirror has been modified to fit the small probe diameter, Fig. 5.3a. In order to achieve
two-dimensional scanning, orthogonally oriented inner and outer electrostatic comb-drives
actuators are coupled to torsional springs to rotate the mirror about either axis. A gimbal
frame is used to minimize interference between the two axes. The scanner was fabricated
using a 3 step deep reactive-ion etch (DRIE) process with 3 masks. Aluminum was
sputtered on the front-side silicon surface to improve reflectivity. For this instrument, the
resonant frequencies of the inner and the outer axes were designed to be ~1 and ~4 kHz,

75
respectively, to create a Lissajous scanning pattern that covers 400 x 400 pixels with a
frame rate of 5 Hz or 600 x 800 pixels with a 1 Hz frame rate. A MEMS holder with OD
3.8 mm was 3D printed and 3 copper pins were inserted for wire bonding, Fig. 5.3b.
We measured the angular deflection of the MEMS scanner in either axis to
characterize the frequency response. Fig. 5.3c, d show the frequency response of the
scanner to a sine-wave input at 60 Vpp for the X and Y axes, respectively. This device can
achieve >5.5° mechanical scan angle at 60 Vpp with a drive frequency close to 8.2 kHz and
2 kHz for the X and Y axes, respectively.
Fig. 5.3. MEMS Scanner. a) Photo shows dimensions of 2D MEMS scanner with
locations of inner and outer springs and actuators. b) Mirror is secured in custom holder
with copper pins used as contacts for wire bonding electrical connections. Frequency
response shows mechanical scan angles of the c) inner and d) outer axes with drive voltage
of 60 Vpp with either an upsweep (low-to-high) or downsweep (high-to-low) in frequency.

76
To achieve a FOV of 300 x 300 µm2, the inner and outer axes were driven at 8210 Hz and
1960 Hz for a mechanical deflection of 5.5 and 3.5 degrees.
At the center of the FOV of the endomicroscope, we measured a lateral resolution
of 0.90 µm. To satisfy the Nyquist sampling criteria, we must sample with spacing <0.45
µm between pixels. For in vivo and ex vivo imaging, we used different scanning parameters
to our parametric resonance scanner to achieve different frame rates and FOVs. For in
vivo imaging, we used drive frequencies of 8210 Hz and 1960 Hz, resulting in actuating
frequencies of 4105 Hz and 980 Hz in the X and Y axes. This forms a dense Lissajous
scan pattern which repeats itself at 5 Hz to encompass images with dimensions of 400x400
pixels with 100% coverage for a FOV of 300 x 300 μm2. The pixel spacing is 0.75 µm,
and we are under sampling a little bit to maintain a higher frame rate to incur less motion
artifact. For ex vivo imaging and optical performance characterization, we used 8210 Hz
and 1952 Hz for a frame rate of 1 Hz, a FOV of 300 x 400 μm2 and 600 x 800 pixels. The
pixel spacing is ≤0.4 µm, and meets the Nyquist sampling criteria.
5.2.4 Mechanical design and packaging
We used CAD software (Solidworks, ver 2015) to design the housing to package
the optics and scanner, Fig. 5.4a. A stainless-steel pin with a diameter of 3 mm was used
to fabricate a 1.25 mm fiber ferrule holder, Fig. 5.4b. We used a stainless-steel tube with
an OD of 3.8 mm and an inner diameter ID of 3 mm to center and align the lenses L2 and
L3, Fig. 5.4f, and a second stainless steel tube with OD 4.2 mm and ID 3.8 mm to enclose
the MEMS scanner and lens L4, Fig. 5.4e. The MEMS mirror assembled on the 3D printed
holder is shown in Fig. 5.4d. The distance between L3 and the MEMS mirror was adjusted

77
to achieve a working distance of 100 m. The position of the MEMS mirror was adjusted
using a 6-axis precision manipulator to ensure that the reflected beam was at normal
incidence to L4. Fig. 5.4g illustrates the assembly and alignment process where the
focusing lens holder and the MEMS holder are mounted on high precision stages. After
assembly, the probe was sealed using epoxy (G14250, Thorlabs). Before imaging, the
endomicroscope was soaked in water overnight to ensure adequate seal. For in vivo
imaging, the endomicroscope was mounted onto a motorized rotational and translational
platform to precisely control positioning in mouse colon.
Fig. 5.4. Packaging and alignment. a) CAD drawing shows how instrument is packaged.
b) Assembled endomicroscope c) Fabricated fiber ferrule holder. d) MEMS chip mounted
on a 3D printed holder. e) Fabricated side-view lens holder. f) Fabricated focusing lens
holder. g) Assembly and alignment process.

78
5.2.5 Imaging performance characterization
We collected reflectance images from a standard USAF resolution target, and
plotted the intensity profile in the transverse direction across an edge. The lateral resolution
was defined by measuring the width of transition from 10% - 90% of maximum value. The
axial resolution was determined by measuring the full width at half-maximum (FWHM) of
the signal reflected from the surface of a chrome coated mirror surface. The field of view
and distortion were characterized by imaging a grid target (R1L3S3P, Thorlabs) with 100
um spacing.
5.2.6 Peptide
Our lab has previously developed a peptide that is specific for domain 2 of
EGFR. [75] QRH*-Cy5.5 was synthesized by coupling QRH* with water soluble sulfo-
Cy5.5- N-hydroxysuccinimide ester (Lumiprobe LLC) respectively overnight with N,N-
diisopropylethylamine, followed by HPLC purification. The final purity was confirmed
by analytical C18-column. Further characterization was performed with exact mass
measurement by Q-TOF (Agilent Technologies) mass spec with ESI (Waters Inc) detection.
After lyophilization, the peptides were stored at -80oC and redissolved in water at a
concentration of 300 M before injection.
5.2.7 In vivo imaging
We used a CPC;Apc mouse that spontaneously develops pre-malignant (dysplasia)
lesions in the distal colon where they are accessible by the side-view endomicroscope.

79
These mice are genetically engineered to sporadically delete the APC gene, which is
mutated in >80 of human colorectal carcinomas. [82] During imaging, 12-week-old
CPC;Apc mice were anesthetized with 2% isoflurane (Fluriso; MWI Veterinary Supply
Co.). We first used a wide-field small animal endoscope (27030BA, Karl Storz Veterinary
Endoscopy) with white light illumination to examine the colon for presence of grossly
visible adenomas. For use as landmarks, we measured the distance between the endoscope
tip and the anus and the clockwise location of the adenoma.
We waited 90 min after intraperitoneal injection of 300 of QRH*-Cy5.5
solution in a volume of 600 L to allow the peptide to bind to the target. The distal tip of
the endomicroscope was placed into the colon of anesthetized mice. The insertion depth
and angle were controlled using the translational stage and the rotational fixture in order to
image normal colonic mucosa and adenomas at the same locations as first detected on the
wide-field endoscope. Live video streams were collected ~100 m below the mucosa
surface at 5 frames/sec with a laser power of 1.5 mW. Individual frames with minimal
motion artifacts were identified subsequently. After completion of imaging, the mice were
euthanized, and the colon was harvested for ex vivo imaging. The optical window of probe
was positioned directly en face over the exposed lumen of resected colon to optimize
contact. Images were collected with the same laser power as that used in vivo. Previously
identified landmarks were used to confirm the locations of the adenomas. The colon was
fixed in 10% buffered formalin and paraffin embedded for routine histology (H&E).
Images and tissues were collected and analyzed in a total of n = 6 mice. One representative
80
image was selected from either dysplasia or normal for each mouse. We quantified each
image by measuring the average fluorescence intensity from n = 5 regions of interest with
dimensions of 20×20 pixels picked at random.
5.3 Results
5.3.1 Imaging performance
We collected reflectance images from a standard USAF resolution target with the
side-view confocal endomicroscope, Fig. 5.5a. The smallest set of bars (group 7, element
6) can clearly be distinguished, suggesting a qualitatively lateral resolution <2.2 m, Fig.
4A (inset). A reflectance image of a grid target (100×100 m2 square grids) shows a
maximum field-of-view of 300×400 m2, Fig. 5.5b. Fine details can be seen from
fluorescence images of Cy 5.5 stained lens paper, Fig. 5.5c, d. For quantitative
measurement, we plotted the intensity profile across an edge, and measured a lateral
resolution of 0.87 m, defined by the width of transition from 10% - 90% of maximum
value, Fig. 5.5e. We measured a full-width-at-half-maximum (FWHM) of 13.2 m by
translating a reflective surface in the axial direction, Fig. 5.5f.

81
Fig. 5.5. Image resolution. a) Reflectance image of standard target (USAF 1951) can
distinguish group 7, element 6 (red box) to support qualitative lateral resolution <2.2 μm.
b) Reflectance image of grid with 100×100 μm2 squares shows a field-of-view of 300×400
μm2. c), d) Fluorescence images of a dye stained lens paper. e) Intensity profile across an
edge shows quantitative measurement of lateral resolution of 0.87 µm, defined by the width
of transition from 10% - 90% of maximum value. f) We measured full-width-at-half-
maximum (FWHM) of 13.2 µm.

82
5.3.2 In vivo imaging
Fig. 5.6. Imaging of mouse colonic dysplasia. a) White light image of CPC;Apc mouse
colon collected in vivo with wide-field endoscope shows location of spontaneous adenoma
(arrow). b) Maximum uptake of the NIR-labeled EGFR peptide QRH*-Cy5.5 is seen from
the adenoma 90 minutes after systemic administration. From the in vivo confocal
images, c) increased fluorescence intensity is seen from cell surface of dysplastic
colonocytes (arrow) while d) minimal staining is seen in normal crypts. e) A significantly
greater mean fluorescence intensity was measured from dysplasia compared with that of
adjacent normal, 107±19 versus 62±8 AU, from a group of n = 6 mice, P=3.5×10⁻⁴ by
paired two-way t-test.
After injecting QRH*-Cy5.5, we collected in vivo fluorescence images from the
distal colon in n = 6 CPC;Apc mice that spontaneously develop colonic adenomas. Fig.
5.6a shows a wide field endoscopic image of the distal colon used to guide placement of

83
the side view endomicroscope to collect the in vivo images. Fig. 5.6b shows a wide field
fluorescence image at the same location. Representative in vivo images of dysplasia and
normal sections using the side-view endomicroscope are shown, Fig. 5.6c, d, respectively.
We observed strong cell surface binding within dysplastic crypts (arrow) compared with
normal. The mean fluorescence intensities from dysplastic and normal crypts in n = 6 mice
were quantified, Fig. 5.6e. We found a significantly greater result for dysplasia compared
to normal, P = 3.5×10⁻⁴, by paired, two way t-test.
5.3.3 Ex vivo validation
Fig. 5.7. Ex vivo validation. Strong fluorescence intensity is seen from staining of the
EGFR peptide QRH*-Cy5.5 to dysplasia in a) the side-view probe and b) a commercial
confocal microscope. Minimal uptake of QRH*-Cy5.5 is seen in normal colonic mucosa
in d) and e). Representative histology (H&E) of c) dysplasia and f) normal colonic mucosa.
84
Whole mount tissues were imaged with the side-viewing endomicroscope first, and
then stained by DAPI and imaged with confocal microscope (Leica SP5 Upright, Germany)
with Cy5.5 and DAPI filters. The colon was then fixed in 10% buffered formalin and
paraffin embedded for routine histology (H&E). Sections were cut in the plane parallel to
the mucosal surface. Increased intensity (arrow) is seen at the cell surface of dysplastic
colonocytes, Fig. 8a,b. We observed greatly reduced staining of both the EGFR peptide to
normal colon, Fig. 8d,e. Representative histology (H&E) is shown for dysplasia and
normal, Fig. 8c,f.
5.3.4 Mosaic image
The instrument also has the capability to create a mosaic image in the mouse colon.
We built a translational and rotational platform using a motorized linear stage (CONEX-
LTA-CC, Newport) and a stepper motor (324, Adafruit) to precisely control the position
of the probe, Fig. 5.8a. Cy5.5 dye was injected into a normal mouse 1 hour before imaging.
We first injected Cy5.5, and waited approximately 1 hour for the dye to circulate. We
collected images in a video stream of normal colonic mucosa in vivo while translating the
endomicroscope a distance of 1 mm and rotating the instrument by 90o. We stitched
together individual images to form a mosaic, Fig. 5.8b, and warped the composite image
to simulated the in vivo anatomy of colon, Fig. 5.8c, using custom software (Matlab,
Mathworks Inc).
We also created a mosaic image from in vivo images in the colonic dysplasia area
after QRH*-Cy5.5 peptide injections, as shown in Fig. 5.9. The left side is the normal area,

85
with low signal intensity. We can clearly see the signal strength increases on the right side,
which is the dysplasia area. The morphological change from normal to dysplasia can also
be visualized.
Fig. 5.8. Mosaic image of mouse colon in vivo. a) After systemically injecting Cy5.5
into a normal mouse, imaging was performed 1 hour later. The endomicroscope was
axially translated a distance of 1 mm and rotated 90°. b) Mosaicked image. c) Image
warped to mimic the geometry of a mouse colon. Mosaic image.
Fig. 5.9. In vivo imaging of colonic dysplasia with QRH peptide.

86
5.4 Discussion
Here, we present a side-viewing confocal endomicroscope that uses a compact
MEMS scanner to collect real time optical sections in mouse colon with high resolution in
vivo. This instrument exhibited stable operation at 5 frames per second with minimal
interference from mechanical vibrations throughout the imaging procedure. We used this
endomicroscope to demonstrate in vivo binding of a Cy5.5-labeled peptide specific for
EGFR expressed in dysplastic crypts that develop spontaneously. Our results illustrate
potential for repetitive use of this novel instrument in animals for longitudinal study of
molecular patterns expressed during disease development. Also, the small size of this
instrument allows for passage through the biopsy channel of a medical endoscope for future
clinical translation. Side-viewing is useful for several important clinical applications, such
as visualization of molecular expression in the biliary tract and pancreatic ducts to stage
early cancer, guide choice for therapy, and monitor therapeutic response.
Confocal endomicroscopy is an emerging imaging technique that can be used to
collect histology-like images. In most endoscopic procedures, tissue biopsies are taken at
random that result in cumulative pathology charges. The diagnosis is usually unknown
until pathology evaluation is completed several days later when the patient has left the
clinic and is no longer available to collect any additional biopsies needed. We have
developed a novel endomicroscope that provides an instantaneous “optical biopsy”.
Physicians can use this instrument to rapidly sample multiple sites, and take physical
biopsies only from regions of concern. Furthermore, this technology can be used to stage
early epithelial cancers by visualizing below the tissue surface with sub-cellular resolution.

87
Knowledge of the depth of cancer invasion is needed to determine if local resection is
appropriate, and can reduce procedure time and risk for bleeding. Also, we demonstrated
images that showed overexpression of EGFR that can be used to guide choice of biologic
therapy, such as Cetuximab and erlotinib, FDA approved antibody and small molecule
agents, respectively. Physicians can use this enabling technology to determine the best
choice of therapy for their patients and to monitor effectiveness.
We have previously demonstrated confocal imaging of a FITC-labeled peptide that
binds to human colonic adenomas using a commercial confocal endomicroscope. [71] This
instrument uses a coherent optical bundle consisting of ~30,000 individual, multi-mode
fibers to collect fluorescence images over a 240×240 m2 field-of-view. The working
distance was 50 m, and the resolution in the lateral and axial dimensions were 1.4 and
7m, respectively. The beam was scanned at the proximal end of the fiber bundle by a 4-
kHz oscillator for horizontal scanning (lines) and a 12-Hz galvo mirror for vertical
scanning (frames). In our current design, we can achieve greater signal and depth with use
of bright NIR fluorophores. Also, a Cy5-labeled peptide specific for c-Met has been used
to detect colonic adenomas in vivo with fluorescence colonoscopy using intravenous
administration. In this clinical study, a clear increase in intensity was observed from
adenomas with either polypoid or flat morphology. Our instrument can be complementary
by providing optical sections from these localized regions of disease after they have been
localized first with wide-field imaging.
Efforts have been made recently to develop side-view endomicroscopes to image
hollow organs in small animals. A long graded-index (GRIN) lens based endomicroscopic
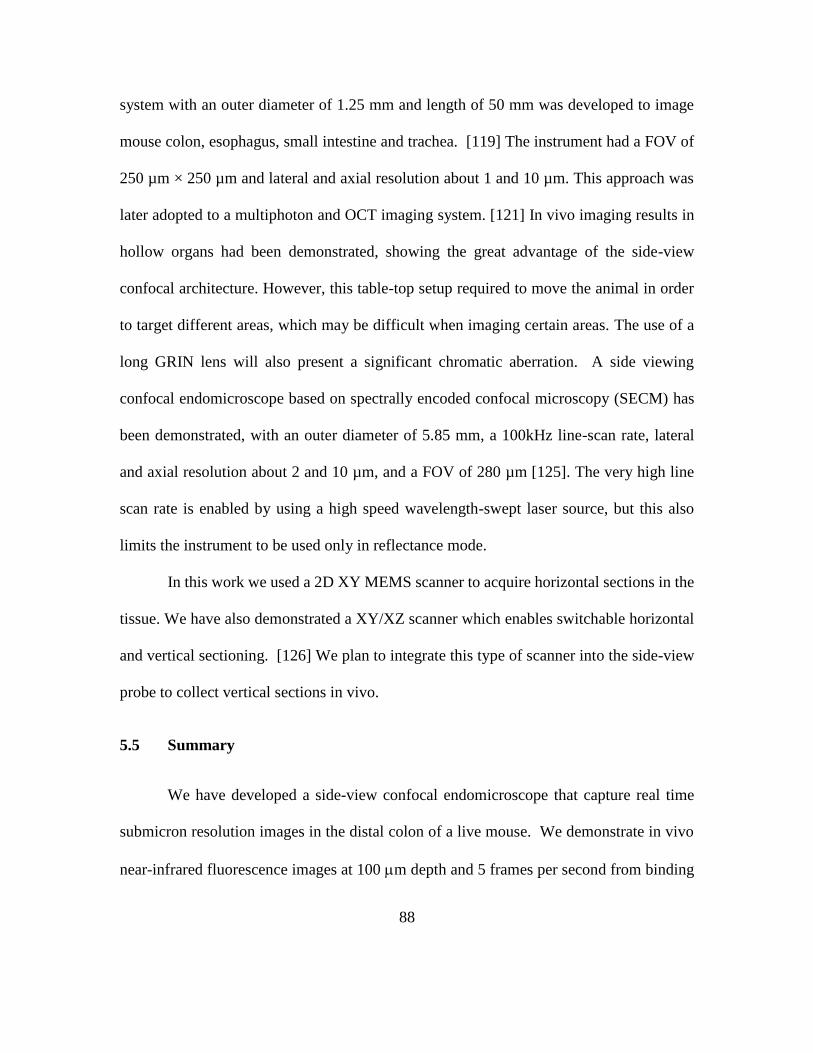
88
system with an outer diameter of 1.25 mm and length of 50 mm was developed to image
mouse colon, esophagus, small intestine and trachea. [119] The instrument had a FOV of
250 µm × 250 µm and lateral and axial resolution about 1 and 10 µm. This approach was
later adopted to a multiphoton and OCT imaging system. [121] In vivo imaging results in
hollow organs had been demonstrated, showing the great advantage of the side-view
confocal architecture. However, this table-top setup required to move the animal in order
to target different areas, which may be difficult when imaging certain areas. The use of a
long GRIN lens will also present a significant chromatic aberration. A side viewing
confocal endomicroscope based on spectrally encoded confocal microscopy (SECM) has
been demonstrated, with an outer diameter of 5.85 mm, a 100kHz line-scan rate, lateral
and axial resolution about 2 and 10 µm, and a FOV of 280 µm [125]. The very high line
scan rate is enabled by using a high speed wavelength-swept laser source, but this also
limits the instrument to be used only in reflectance mode.
In this work we used a 2D XY MEMS scanner to acquire horizontal sections in the
tissue. We have also demonstrated a XY/XZ scanner which enables switchable horizontal
and vertical sectioning. [126] We plan to integrate this type of scanner into the side-view
probe to collect vertical sections in vivo.
5.5 Summary
We have developed a side-view confocal endomicroscope that capture real time
submicron resolution images in the distal colon of a live mouse. We demonstrate in vivo
near-infrared fluorescence images at 100 m depth and 5 frames per second from binding

89
of a peptide specific for EGFR to dysplastic crypts. This instrument can visualize
overexpressed molecular targets, and may be useful for clinical translation to detect disease,
guide choice for therapy, and monitor therapeutic response.

90
Chapter 6 Side-Viewing Confocal Endomicroscope for XY/XZ Imaging
6.1 Introduction
Tremendous advances have been made in technological development of whole
body molecular imaging, including PET, SPECT, MRI, bioluminescence, and ultrasound.
However, a great unmet need still exists for high resolution imaging of biological processes
that occur in the epithelium, the thin layer of tissue where many important cancers originate.
Confocal endomicroscopes designed with a fiber bundle are used in the clinic, but they can
only create images in the horizontal plane [10]. Imaging in the plane perpendicular to the
tissue surface is also important because epithelial cells differentiate in the vertical
direction [127]. Subtle changes in normal tissue differentiation patterns can reveal the early
expression of cancer biomarkers. We have previously developed a MEMS based
endomicroscope for repetitive in vivo imaging in mice, which can be used to collect
horizontal images in real time [67]. In this work, we present a side-viewing confocal
endomicroscope that can collect images in either horizontal or vertical plane using an
integrated monolithic electrostatic 3D MEMS scanner.
Recently several groups have demonstrated endomicroscopes with miniature axial
scanning mechanisms. Optiscan Pty Ltd and Pentax Corp developed the first clinical
91
confocal laser endoscope integrated into a conventional video endoscope. Depth of
imaging plane can be adjusted from the surface to 250 μm below the tissue, using an
electrically actuated shape memory alloy (SMA) [128]. Piyawattanametha et al developed
a dual axes confocal endomicroscope using a 2D MEMS scanner for lateral scanning and
a micro motor for axial scanning [57]. Both of the systems used slow and bulky actuators
to change the focal plane for horizontal imaging, which are not practical to be used for real
time vertical sectioning. Recently several groups have demonstrated MEMS actuators with
axial scanning capability. A 3D confocal microscope using two separate electrostatic
MEMS mirrors for lateral scan and depth scan was reported by Jeong et al. [129], but it
had a very small axial displacement of 10 μm at 200 V and ±27.5 μm at resonance. Liu et
al also developed a 3D confocal endomicroscope using two electrothermal MEMS devices,
one for 2D lateral scanning and one for axial scanning of a micro objective [58]. A depth
scan range of 400 μm was demonstrated at only 2 V driving voltage. However, the frame
rate is too low for in vivo imaging due to the slow response time of electrothermal actuators.
Previously we have demonstrated a monolithic 3D MEMS scanner in a dual-axis
confocal endomicroscope for switchable horizontal/vertical cross-sectional imaging. Here,
we integrate a similar 3D scanner into our previously developed side-viewing confocal
endomicroscope to collect either horizontal or oblique plane images in vivo.

92
6.2 Methods
6.2.1 System architecture
The system schematic, as shown in Fig. 6.1, is modified from the one presented in
the previous chapter. We added a second laser (iChrome MLE LFG, Toptica Photonics),
which is a multi-laser engine, with 445, 488, 515 and 561 nm excitation wavelength, in
addition to the 660 nm laser. A flip mirror (FM) is used to switch between these two lasers.
We used a dichromic mirror (Di01-R442/514/561, Semrock) and a band pass filter (FF01-
485/537/627), for fluorescence signal separation and filtering. This upgraded illumination
and collection system would the allow use of fluorophores with excitation peaks at 445,
515, 561 and 660 nm.
Fig. 6.1. Schematic. Optical configuration of side-viewing endomicroscope. Details
provided in text. Key: PMT – photomultiplier tube, MMF – multi-mode fiber, SMF –
single mode fiber, L – lens, F – filter, M – mirror.
6.2.2 Optical design
The optical design and ray-trace simulations (ZEMAX, ver 13) are shown in Fig.
6.2a. The light coming out of the fiber is collimated by lens L1 with f = 12 mm (45-262,

93
Edmund Optics) to a beam diameter of 3 mm and focused by lens L2 with f = 6 mm (45-
089, Edmund Optics). L1 and L2 have a common diameter of 3 mm. The focused beam is
reflected 90 degrees by a 2D resonant MEMS mirror into a distal imaging lens L3 with f =
2 mm and OD 1.5 mm (65-263, Edmund Optics). When the outer axis of the scanner
operates in rotational mode around the Y axis with ±8°, as shown in Fig. 6.2b, the focal
spot moves laterally over a FOV of 760 µm. When it operates in out-of-plane translational
mode, as shown in Fig. 6.2c, the focal depths change as well as the lateral spot location,
generation an oblique scan line. Fig. 6.2d-f show the focus location when the MEMS
scanner is at +105, 0 and -105 µm with respect to the neutral position. The corresponding
focal depths are +90, 0 and -110 µm with lateral shift of -101, 0 and 112 µm. With an axial
displacement of 210 µm, we can achieve depth scanning over a range of 200 µm.
Fig. 6.2. Optical design and Zemax simulation. a) Ray-trace simulation for design of the
distal optics. b) Horizontal plane imaging mode. c) Oblique plane imaging mode. d-f) Spot
size and focal depth when the MEMS mirror is at +105, 0 and -105 µm with respect to the
neutral position.

94
6.2.3 Geometry of the MEMS chip
Fig. 6.3. Geometry of the MEMS chip and the reflective mirror. a) Solidworks model
of the MEMS chip inside the housing. b) Optimal MEMS chip geometry. c) Zemax model
of the beam spots on the reflective mirror.
To make sure the MEMS chip can fit inside the tubing with an ID of 3.8 mm, the
optimal geometry was determined in the Solidworks model, as shown in Fig. 6.3a. Since
the MEMS chip has a thickness of 550 µm, both the upper edge and the lower edge (marked
by arrows) should be considered. A clearance of 100 µm was incorporated in the design to
allow for misalignment during MEMS assembly. The resulting MEMS geometry is shown
in Fig. 6.3b. To determine the required reflective mirror size to cover the beams spot, a
Zemax model was constructed, as shown in Fig. 6.3c. The beam spot on the mirror was
measured when the mirror is at +105, 0 and -105 µm with respect to the neutral position.
An oval shaped reflective mirror with 1800 µm x 1200 µm is needed to cover the beams
spots.

95
6.2.4 3D MEMS scanner
Fig. 6.4. 3D MEMS scanner. a) Schematic of the 3D MEMS scanner, with U-shaped
levers for switchable Y/Z actuation. b) X tilting mode. c) Z piston mode. d) Y tilting mode.
e) MEMS chip assembled on a custom designed holder with copper pins for electric
conduction.
We have previously developed a compact, monolithic electrostatic, 3D micro-
electro-mechanical systems (MEMS) scanner for a dual axes confocal
endomicroscope [126], based on the principle of parametric resonance. [107] Using a
similar design, we developed a MEMS scanner with switchable XY/XZ scanning for a
side-view confocal architecture, Fig. 6.4a. The mirror is mounted on a gimbal frame to
minimize crosstalk between the inner and outer axes. The reflective mirror is linked to the
gimbal frame through a pair of multi-beam torsion springs and can rotate around the torsion
springs defined as the X-axis, shown in Fig. 6.4b. The gimbal is attached to U-shaped
suspensions, and it can perform either Z-axis piston motion or Y-axis rotational motion,
respectively shown in Fig. 6.4c and Fig. 6.4d, when driven at different frequencies. This
device was fabricated with a deep cavity on the back side of the substrate to allow for large
axial displacements using a 3 step deep reactive-ion etch (DRIE) process. A cutting-free
SOI micromachining process was employed to fabricate this scanner with irregular shape.

96
We etched air releasing holes around the large reflective mirror to minimize air damping
effects after packaging. The surface is coated with a 70 nm layer of aluminum (Al) for high
reflectivity >80% between 400 and 800 nm.
6.2.5 Scanner characterization
The scanner was actuated into resonance by sweeping the driving frequency near
twice of the eigenfrequency. The tilt angles for X and Y-axes at different frequencies were
measured using a laser beam and a position sensing detector (PSD), as shown in Fig. 6.5a,
b. Both axes were driven by 60Vpp sine waves. Mechanical angles of ±10° can be achieved
in both axes. To characterize axial scanning performance in Z-axis, we used a laser
displacement sensor to measuring the out-of-plane displacement driven by a 60Vpp square
wave with 35% duty cycle, shown in Fig. 6.5c. A maximum scan range of 300 μm can be
achieved. Operating frequencies for X, Y and Z-axes were chosen at 9090 Hz, 1480 Hz
and 1100 Hz, with scan range of ±10°, ±8.5° and ±105 μm. When the scanner operates in
XZ mode, an oblique imaging plane was obtained, as shown in Fig. 6.5d. An imaging depth
of 200 μm and lateral range of 213 μm is achieved at the operating frequency of the Z-axis,
generating a scan range of 292 μm in the oblique plane.
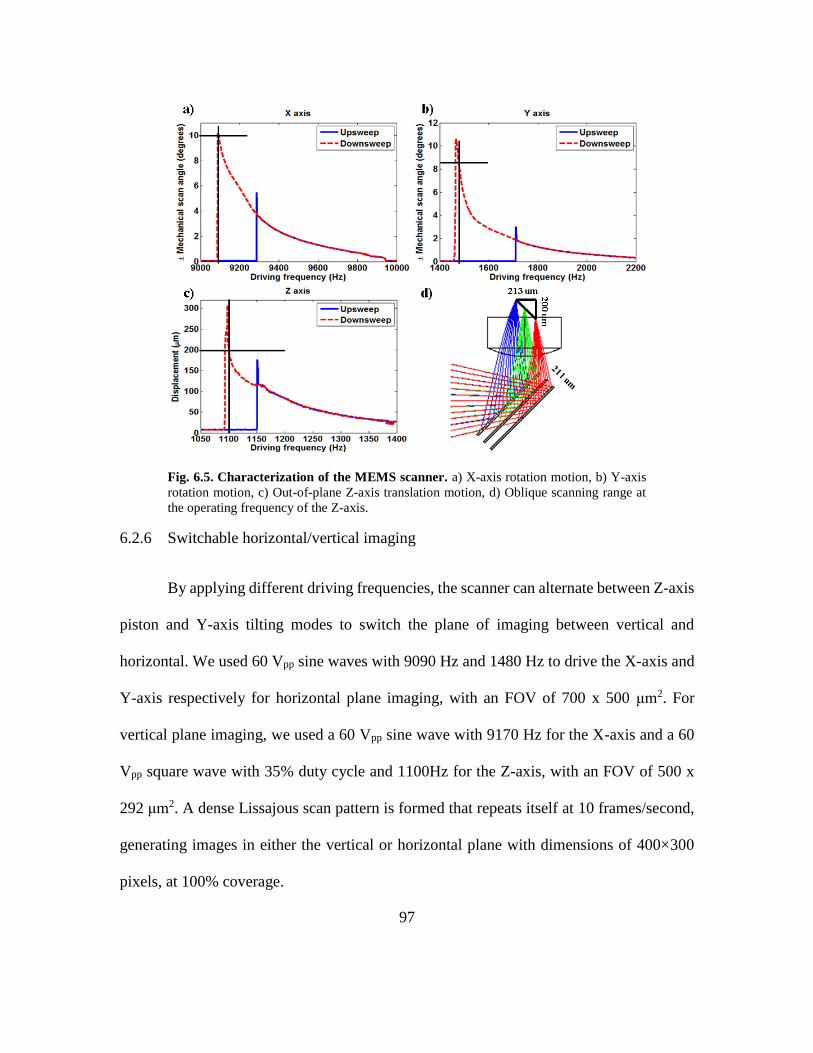
97
Fig. 6.5. Characterization of the MEMS scanner. a) X-axis rotation motion, b) Y-axis
rotation motion, c) Out-of-plane Z-axis translation motion, d) Oblique scanning range at
the operating frequency of the Z-axis.
6.2.6 Switchable horizontal/vertical imaging
By applying different driving frequencies, the scanner can alternate between Z-axis
piston and Y-axis tilting modes to switch the plane of imaging between vertical and
horizontal. We used 60 Vpp sine waves with 9090 Hz and 1480 Hz to drive the X-axis and
Y-axis respectively for horizontal plane imaging, with an FOV of 700 x 500 μm2. For
vertical plane imaging, we used a 60 Vpp sine wave with 9170 Hz for the X-axis and a 60
Vpp square wave with 35% duty cycle and 1100Hz for the Z-axis, with an FOV of 500 x
292 μm2. A dense Lissajous scan pattern is formed that repeats itself at 10 frames/second,
generating images in either the vertical or horizontal plane with dimensions of 400×300
pixels, at 100% coverage.

98
6.2.7 Packaging and alignment
Fig. 6.6. Packaging and alignment. a) Solidworks design. b) Packaged instrument. c)
CAD drawing of alignment fixtures. d) Alignment procedure, using the location of 2D scan
patterns exiting L3. Different scan patterns can be seen when the MEMS operates in e) XY
or f) XZ mode.
We used a stainless-steel tube with an outer diameter (OD) of 4.2 mm and an inner
diameter (ID) of 3.8 mm to house L3 and the MEMS mirror holder, and another tube with
OD of 3.8 mm and ID of 3 mm to house L1 and L2. The end tube is fabricated using a
stainless steel pin with OD of 3mm to fix the fiber ferrule in place. We designed the MEMS
holder such that no wire bonding is need for electric conduction. The MEMS chip holder
99
was fabricated from M3 Crystal, an acrylic based resin with high strength and stiffness,
using a high precision 3D printer (ProJet 3500HD MAX, 3DSystems) with 16 m
resolution. We inserted 3 copper pins at for use as electrical contacts to deliver power. The
pins were glued to the contact pins of the MEMS chip instead of wire bonding. The
Solidworks design of the probe is shown in Fig. 6.6a and the actual fabricated probe is
shown in Fig. 6.6b. Alignment fixtures were designed, as shown in Fig. 6.6c, such that the
distance between the fiber tip to L1, L2 to MEMS mirror and MEMS mirror orientation can
be precisely adjusted. During alignment, the MEMS scanner was actuated to create a laser
scan pattern at L3, as shown in Fig. 6.6d-f. This can be used to actively adjust the MEMS
scanner location such that the scan pattern is centered with respect to L3.
6.2.8 Resolution and FOV
We measured the lateral resolution using a standard (USAF 1951) resolution target.
The field of view and distortion in the horizontal imaging plane were characterized by
imaging a grid target (R1L3S3P, Thorlabs) with 100 um spacing. The imaging depth of the
probe was measured using two reflective targets with structures in the Z-axis.
6.2.9 Mouse model of colorectal cancer with tdTomato optical reporter
All animal studies were performed in compliance with University of Michigan
regulations and with approval by the University Committee on the Use and Care of
Animals (UCUCA). We used a mouse genetically engineered to expresses tdTomato with
peak single photon excitation at ~560 nm. [130] In the wild-type mouse, a loxP-flanked

100
STOP cassette prevents transcription of the downstream optical reporter gene. When bred
with mice that express Cre recombinase under control of the human CDX2
promoter/enhancer sequence (CPC), the STOP cassette is deleted, and tdTomato is
expressed constitutively in the epithelium of adult mouse colon. [93] [131] For both in
vivo and ex vivo imaging, we used an excitation wavelength of 561 nm and 1 mW laser
power at the sample plane.
6.3 Characterization
6.3.1 Resolution and FOV
Fig. 6.7. Performance characterization. a) Reflectance image of a USAF target. b) Grid
target image showing the FOV. d) XZ image of c) a 3D phantom with micro trenches,
showing the imaging depth of ~ 200 µm.

101
The imaging resolution is demonstrated using a standard USAF targeted, from
which the smallest element in group 7 can be clearly visualized, Fig. 6.7a. Image of a grid
target with 100 µm spacing shows a lateral FOV of 700 x 500 µm2, Fig. 6.7b. We used a
3D phantom with micro trenches to characterize the imaging depth, as shown in Fig. 6.7c.
The trenches have a depth of around 200 µm. In XZ imaging mode, Fig. 6.7d, the trench
can by visualized from top to bottom, showing an imaging depth of 200 µm. All the
measurements were performed at 660 nm wavelength.
6.3.2 Imaging of 3D fluorescent phantom
Fig. 6.8. 3D reconstruction of fluorescent beads phantom. a) 3D reconstructed image.
b), c), oblique plane images used for reconstruction.
To show the 3D imaging capability of the probe, a fluorescent beads phantom was
constructed by mixing 15 µm beads (excitation peak at around 670 nm) with UV curing
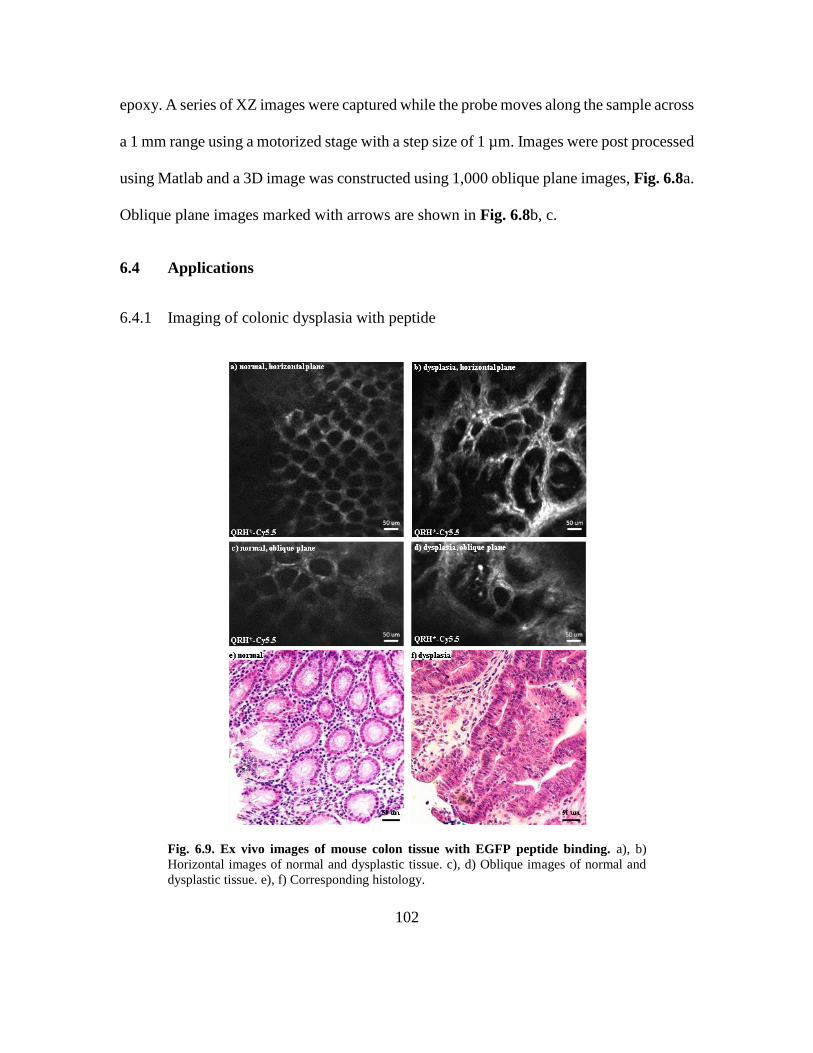
102
epoxy. A series of XZ images were captured while the probe moves along the sample across
a 1 mm range using a motorized stage with a step size of 1 µm. Images were post processed
using Matlab and a 3D image was constructed using 1,000 oblique plane images, Fig. 6.8a.
Oblique plane images marked with arrows are shown in Fig. 6.8b, c.
6.4 Applications
6.4.1 Imaging of colonic dysplasia with peptide
Fig. 6.9. Ex vivo images of mouse colon tissue with EGFP peptide binding. a), b)
Horizontal images of normal and dysplastic tissue. c), d) Oblique images of normal and
dysplastic tissue. e), f) Corresponding histology.

103
The probe was placed in direct contact with the surface of resected colon to assess
EGFR expression in pre-cancerous crypts. NIR fluorescence images of adenoma and
normal colonic mucosa were collected in horizontal and oblique planes, with laser
wavelength of 660 nm. “Switching” of the imaging plane was accomplished by tuning the
parameters of the drive signals to the scanner. Normal mucosa shows minimal staining of
circularly-shaped crypts with relatively uniform dimensions, Fig. 6.9a. A horizontal view
of dysplasia shows irregular crypt architecture with variable dimensions and a complex
branching pattern, Fig. 6.9b. We observed the EGFR peptide to intensely stain the entire
length of dysplastic crypts in the oblique view, Fig. 6.9d, while only faint signal was seen
for normal mucosa, Fig. 6.9c. Corresponding histology of normal and dysplastic tissue are
is shown in Fig. 6.9e, f.
6.4.2 Imaging of tdTomato optical reporter mouse
Fig. 6.10. Ex vivo images of tdTomato mouse colon tissue. Horizontal images at a) 20
µm and b) 60 µm. c) Oblique plane image.

104
Organs of a euthanized tdTomato mouse were imaged using the probe in XY/XZ
modes, with laser wavelength of 561 nm. Horizontal plane images of colon tissue at depth
of 20 µm and 60 µm are shown Fig. 6.10a, b. By changing the driving voltage of the MEMS
scanner, electrical zoom is achieved by reducing to a much smaller FOV, as shown in the
dashed rectangles in Fig. 6.10a, b. Individual goblet cells inside each crypt can by clearly
visualized. At the same location, an oblique plane image is shown in Fig. 6.10c. Horizontal
plane images of ileum. heart, kidney, liver, small instine and proximal colon are shown Fig.
6.11a-f.
Fig. 6.11. Ex vivo images of different organs of tdTomato mouse. Images of a) Ileum.
b) Heart. c) Kidney. d) Liver. e) Small instine. f) Proximal colon.

105
In vivo imaging of optical reporter mouse with colonic dysplasia. A wide-field
small animal endoscope (27030BA, Karl Storz Veterinary Endoscopy) with white light
illumination was first used to examine the colon for presence of grossly visible adenomas.
Then the distal tip of the endomicroscope was placed into the colon of anesthetized mice.
The insertion depth and angle were controlled using the translational stage and the
rotational fixture in order to image normal colonic mucosa and adenomas at the same
locations as first detected on the wide-field endoscope. Images were acquired with 5 Hz
frame rate using a laser power of 1 mW on the sample plane. Different structures were
observed between normal and dysplastic tissue, in both the horizontal and oblique plane
images, as shown in Fig. 6.12.
Fig. 6.12. In vivo images of tdTomato mouse colon tissue. Horizontal images of a)
normal b) dysplastic tissue. Oblique plane images of c) normal d) dysplastic tissue.
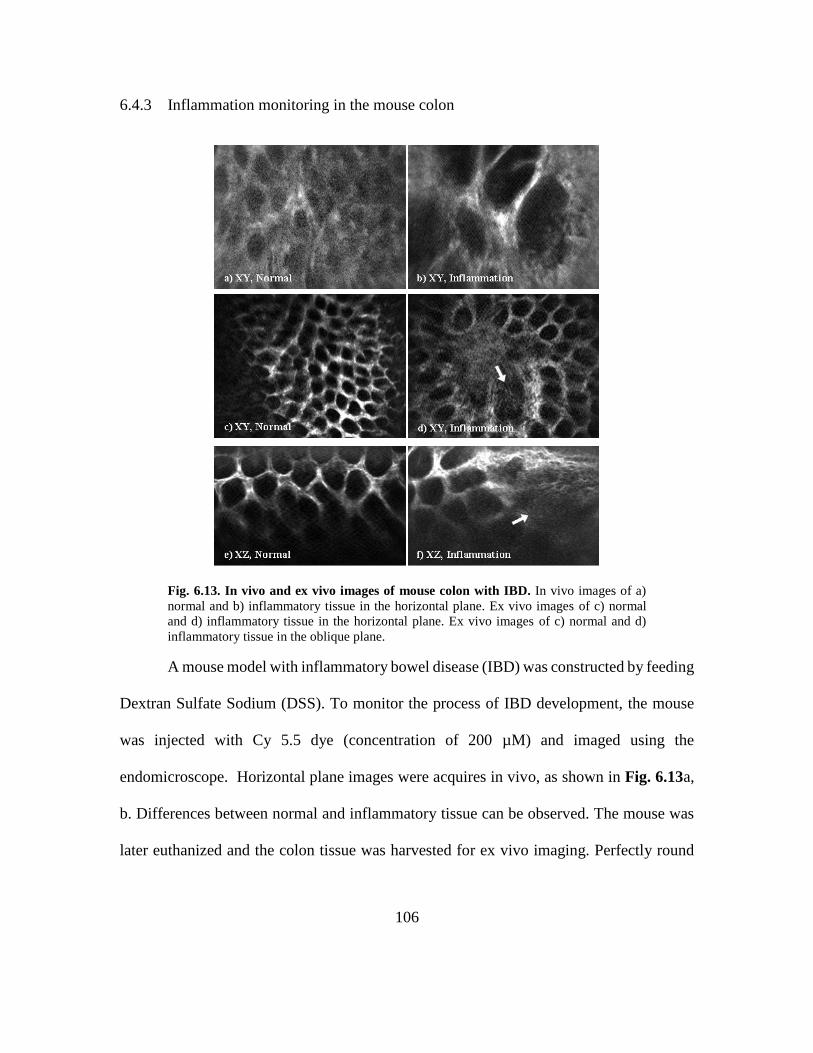
106
6.4.3 Inflammation monitoring in the mouse colon
Fig. 6.13. In vivo and ex vivo images of mouse colon with IBD. In vivo images of a)
normal and b) inflammatory tissue in the horizontal plane. Ex vivo images of c) normal
and d) inflammatory tissue in the horizontal plane. Ex vivo images of c) normal and d)
inflammatory tissue in the oblique plane.
A mouse model with inflammatory bowel disease (IBD) was constructed by feeding
Dextran Sulfate Sodium (DSS). To monitor the process of IBD development, the mouse
was injected with Cy 5.5 dye (concentration of 200 µM) and imaged using the
endomicroscope. Horizontal plane images were acquires in vivo, as shown in Fig. 6.13a,
b. Differences between normal and inflammatory tissue can be observed. The mouse was
later euthanized and the colon tissue was harvested for ex vivo imaging. Perfectly round

107
crypts were observed in the normal area in the horizontal imaging plane, Fig. 6.13c. A
suspicious area was found in Fig. 6.13d. To verify whether this is an inflammatory area,
oblique plane images were acquired, Fig. 6.13f, showing an abrupt change of structure.
This shows that oblique plane imaging can provide extra information to help distinguish
between normal and disease areas.
6.5 Summary
We have developed a side-view confocal endomicroscope that can image either
horizontal or oblique planes in real time. We demonstrate the potential applications of the
probe, including peptide binding validation, tumor development monitoring and IBD
disease monitoring. This will be a useful tool for biologists to perform in vivo studies in
hollow organs of small animals.

108
Chapter 7 MEMS-based multiphoton microscopy for vertical sectioning
7.1 Introduction
Conventional multiphoton microscopes can be used to collect 3-
dimensional (3D) images in optically thick specimens. Images in the horizontal (XY) plane
can be collected easily with lateral beam scanning. Either the objective or specimen must
move physically to collect images in the axial (XZ) direction. Many important biological
processes, such as normal epithelial development [132], stem cell migration [133], wound
healing [134], and neuronal activity [135], are best studied in vivo with images collected
in the direction perpendicular to the tissue surface or the vertical plane. This orientation is
can be achieved by collecting a stack of horizontal images and performing a reconstruction.
However, this approach is not practical because it is time-consuming and prone to motion
artifacts from vibrations introduced in the specimen. We aim to demonstrate a new
approach to perform beam scanning in the axial direction using a microelectromechanical
systems (MEMS) mirror located remotely.
The epithelium of hollow organs, such as colon, is a thin layer of biologically active
tissue with depth of 200 m. Imaging in the vertical plane with beam scanning has
recently been demonstrated using a remotely located mirror. [136] Two objectives are used

109
to introduce equal but opposite aberrations in the beam wavefront during axial scanning to
achieve diffraction-limited image resolution. [118] A fast moving mirror was constructed
using a pair of identical galvanometer motors mounted in opposite directions, with scan
rate up to 2.7 kHz. Using this method, aberration free images can be achieved at fast speeds
while preserving the high numerical aperture needed to produce multiphoton excited
fluorescence images without moving either the objective or specimen. A compact mirror
with a small footprint that performs fast axial scanning may further improve performance
and extend the applicability of this technique for in vivo imaging.
We demonstrate feasibility to scale down this axial scan strategy by using miniature
mirrors and actuators fabricated with MEMS methods. We have previously developed a
lateral MEMS-based scanner using the principle of parametric resonance [67], where the
drive signal is applied at frequency near 2ωo/n (ωo is the natural frequency of vibrational
modes and n is an integer ≥1) [107]. We have also shown a novel axial actuator based on
electrostatic actuation and parametric resonance that can achieve high speeds with large
displacements [126].We combine these two devices in a remote location to collect real time
optical sections of multiphoton excited fluorescence in either the horizontal or vertical
plane. We must achieve minimal lateral tilt angles to produce distortion free images over
the axial scan range at fast speeds.

110
7.2 Methods
7.2.1 System architecture
A Ti-sapphire (Mai Tai DeepSee HP DS, Spectra-Physics) laser with a tunable
spectral range of 690-1040 nm provides excitation (red arrows) with ~100 fs pulse width
at 80 MHz, Fig. 1. The pulse duration was minimized with a dispersion pre-compensation
unit located inside the laser housing. A half wave plate (HWP, 10RP42-3, Newport) is
used in combination with a linear polarizer (LP, 10GL08AR.16, Newport) to adjust power.
The beam is initially p-polarized after passing through a polarizing beam splitter (PBS,
PBS252, Thorlabs). After passing through a quarter wave plate (QWP, WPQ10M-780,
Thorlabs), reflecting off the lateral scanning MEMS mirror M1, and passing back through
the QWP, the beam becomes s-polarized.
Fig. 7.1. Schematic diagram of the 3D multiphoton microscope. Compact, lightweight
MEMS mirrors M1 and M2 are located remotely and used for lateral scanning and axial
actuation, respectively. The mirrors translate the excitation wavefront between two

111
objectives (Obj1 and Obj2) that introduce equal but opposite aberrations to produce axial
scanning below the surface of the specimen. Key: HWP: half wave plate, LP: linear
polarizer, PBS: polarizing beam splitter, QWP: quarter wave plate, L1-6: lenses, Obj1,2:
objectives, M1-3: mirrors, DM: dichroic mirror, BPF: bandpass filter, PMT: photomultiplier
tube.
After reflecting off the PBS at 90°, the excitation beam is expanded by a pair of
lenses, L1 (f = 35 mm, LA1951-B, Thorlabs) and L2 (f = 100 mm, LA1509-B, Thorlabs) to
fill the back aperture of the first objective Obj1 (NA = 0.4, PLN 20X, Olympus). A second
PBS reflects the beam through a QWP onto the axial MEMS mirror M2. The wavefront
passes back through the QWP and PBS. The beam is expanded by a pair of telescope
lenses L3 and L4 (f = 75 mm, LA1608-B, Thorlabs), reflects off a dichroic mirror (DM,
650DCSPXR, Chroma) at 90°, and fills the back aperture of Obj2 (NA = 0.9,
LUMPlanFL/IR 60X/0.9w, Olympus), a water immersion lens. Translation of M2 results
in axial displacement of the focus below the surface of the specimen with a magnification
of 2:1. Multiphoton excited fluorescence (green arrows) generated from the specimen
passes through DM, reflects off the planar mirror (M3, PF10-03-F01, Thorlabs), and is
focused by L5 (f = 60 mm, LA1134-A, Thorlabs) and L6 (f = 35 mm, LA1951-B, Thorlabs)
through a band pass filter (BPF, FGB39, Thorlabs) that has ~80% transmission from 380–
580 nm onto a photomultiplier tube (PMT, H7422-40, Hamamatsu) detector
The PMT signal is amplified by a high-speed current amplifier (59-178, Edmund
Optics). We used high-speed data acquisition boards to digitize the fluorescence signal
from the PMT (National Instruments, PCI-6115) and to generate control signals to drive
the two MEMS scanners (National Instruments, PCI-6711). A personal computer running
custom LabVIEW software was used to control and synchronize the boards. By actuating

112
different axes of the MEMS scanners, we were able to switch the scan direction between
the horizontal (XY) and vertical (XZ) planes.
7.2.2 Optical simulation for axial scan
Two photon absorption intensity has a nonlinear relationship with laser power at
the focal spot. [23] To create a uniform image during vertical sectioning, it is important to
maintain the same laser intensity when M1 is performing out of plane actuation. In the
process of MEMS fabrication, the deep reactive-ion etching (DRIE) and other processes
may cause asymmetric spring or mirror structure. Therefore, large stroke out of plane
motion may be accompanied by a small tilt. To determine the performance requirements
for the axial MEMS scanner and how the tilt angle would affect imaging, we set up an
optical simulation using Zemax. Since most commercial objectives are well corrected, we
created a simplified model using paraxial lenses with corresponding focal lengths to model
L5 and L8. We measured the axial point spread function (PSF) when M2 is at different
displacements, and the axial PSF when there is a tilt during the motion. We used the peak
intensity of the axial PSF as a metric to evaluate the change of laser power at the focal spot
when there is a tilt during vertical actuation.
Using this model, we were also able to calculate required axial displacement and
mirror size for M2, and we could use this information to guide the design of the MEMS
scanners. The design goal is to achieve a field of view of 250x250 um in either the
horizontal plane or the vertical plane, with a peak intensity variation less than 10% during
axial scanning.
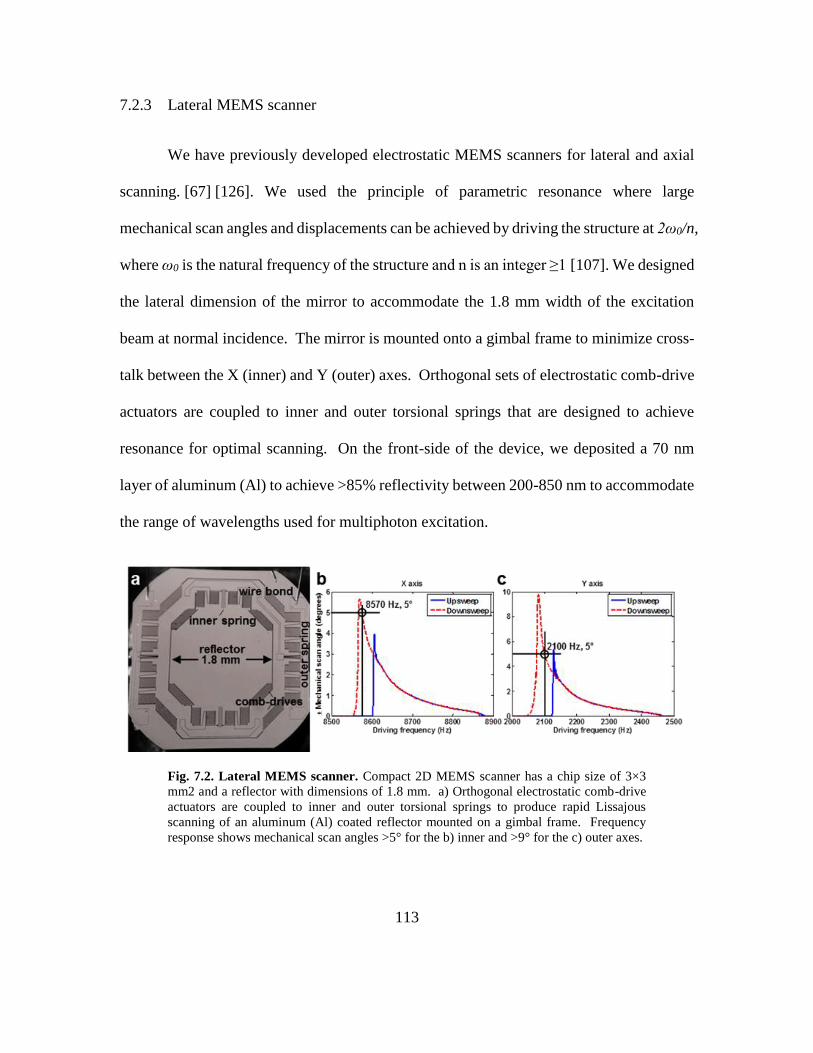
113
7.2.3 Lateral MEMS scanner
We have previously developed electrostatic MEMS scanners for lateral and axial
scanning. [67] [126]. We used the principle of parametric resonance where large
mechanical scan angles and displacements can be achieved by driving the structure at 2ω0/n,
where ω0 is the natural frequency of the structure and n is an integer ≥1 [107]. We designed
the lateral dimension of the mirror to accommodate the 1.8 mm width of the excitation
beam at normal incidence. The mirror is mounted onto a gimbal frame to minimize cross-
talk between the X (inner) and Y (outer) axes. Orthogonal sets of electrostatic comb-drive
actuators are coupled to inner and outer torsional springs that are designed to achieve
resonance for optimal scanning. On the front-side of the device, we deposited a 70 nm
layer of aluminum (Al) to achieve >85% reflectivity between 200-850 nm to accommodate
the range of wavelengths used for multiphoton excitation.
Fig. 7.2. Lateral MEMS scanner. Compact 2D MEMS scanner has a chip size of 3×3
mm2 and a reflector with dimensions of 1.8 mm. a) Orthogonal electrostatic comb-drive
actuators are coupled to inner and outer torsional springs to produce rapid Lissajous
scanning of an aluminum (Al) coated reflector mounted on a gimbal frame. Frequency
response shows mechanical scan angles >5° for the b) inner and >9° for the c) outer axes.

114
The compact lateral MEMS scanner M1 was fabricated with an overall chip size of
3×3 mm2, and the width of the reflector is 1.8 mm, Fig. 7.2a. We measured the angular
deflection of the lateral MEMS scanner in either axis, Fig. 7.2b,c. The frequency response
of the scanner to a sine-wave drive signal at 60 Vpp for rotation about the X and Y axes is
shown. Large scan angles can be achieved with either a downsweep (red) or an upsweep
(blue). We found greater deflection angles with a downsweep, and achieved >5°
mechanical scan angle in both the X and Y axes. We used drive frequencies of 8570 Hz
and 2100 Hz to produce actual tilt frequencies of 4285 Hz and 1050 Hz in the X and Y
axes, respectively, from the parametric resonance effect. Lateral scanning about the X and
Y axes forms a dense Lissajous pattern that repeats itself at 5 frames per sec to create an
image with dimensions of 400×400 pixels at 100% coverage.
7.2.4 Axial MEMS scanner
For axial scanning, we developed a 1D resonant MEMS scanner that produces an
out-of-plane displacement of >400 µm at 60 V, providing >200 µm axial motion at the
focal point within the specimen. The optics is designed with 2:1 magnification. A circular
reflector with a diameter of 2 mm is attached on two U-shaped levers via serpentine springs
located at each corner. Two rows of comb-drives on each side of the scanner provide large
driving forces on each lever, resulting in rotational motion of the lever about the Y axis.
By rotating the levers in-phase, the circular reflector is displaced out-of-plane. However,
when the levers are rotated out-of-phase, the reflector rotates about the Y axis. The
serpentine springs determine the resonant frequency for each actuation mode. The springs

115
are designed to increase the spacing in frequency between the vertical and rotational modes
to avoid crosstalk during actuation. We designed the resonant frequency to be ~400 Hz for
vertical motion.
We used a laser displacement sensor to characterize the frequency response by
measuring the out-of-plane displacement. The scanner performance was determined using
an upward (low-to-high frequency) frequency sweep. Unwanted rotational motion of the
reflector may occur due to minor differences in the spring dimensions. The tilt angle during
axial displacement was also measured at different frequencies using a position sensing
detector (PSD).
Fig. 7.3. Axial MEMS scanner. a) A 2 mm diameter circular reflector is actuated by U-
shaped levers coupled to serpentine springs to produce large out-of-plane displacement.
The laser spot from the displacement sensor (arrow) identifies the location of the mirror
surface b) at rest and c) at resonance with 930 Hz drive frequency. The frequency response
of device shows vertical displacement of 405.8 µm d) with tilt angles 0.004° for X axis e)
and 0.19° for Y axis f) with 930 Hz drive frequency.

116
This compact 1D MEMS scanner has a chip size of 3.7×3.2 mm2 and a reflector
with diameter of 2 mm, Fig. 7.3a. The axial displacement of the mirror surface is measured
using a displacement sensor, and change of the laser spot is shown in Fig. 7.3b and Fig.
7.3c before and after applying the drive signal, respectively. The frequency response of the
scanner is shown by sweeping the drive frequency between 850 Hz and 1000 Hz using a
60 Vpp square wave with 30% duty cycle, Fig. 7.3d. The device has a larger displacement
during upsweep (blue curve) compare to downsweep (red curve). For imaging, we can
achieve axial displacements ~400 µm at a drive frequency of 930 Hz, resulting in actuation
at 465 Hz. Measurements of the tilt angles about X and Y axes over this frequency range
are also shown in Fig. 7.3e and Fig. 7.3f. The tilt angle is less than 0.01° for X axis and
less than 0.2° for Y axis when driven at 930 Hz. We also observed a rotational mode for
this scanner at about 1200 Hz driving frequency which is out of the operating range for
axial scanning. This shows that by properly designing the spring parameters, we can
adequately separate the frequency range between axial and rotational scan modes. At the
operating frequency for imaging, the scanner has very small tilt angles in both axes.
7.2.5 Switchable horizontal/vertical imaging
We can actuate both the inner and outer axes of the lateral scanner to image in the
horizontal (XY) plane. Also, we can combine actuation of the inner axis of the lateral
scanner with the out-of-plane motion of the axial scanner to produce images in the vertical
(XZ) plane. For each imaging mode, a dense Lissajous scan pattern is formed that repeats
itself at 5 frames/sec to generate either horizontal or vertical images with dimensions of

117
400×400 pixels at 100% coverage. Custom software was developed in LabView (National
Instruments) to drive the MEMS scanners and reconstruct the image by remapping the time
series signal to a 2D image using calibrated motion profiles from the scanner to generate a
lookup table (LUT).
7.2.6 Optical properties characterization
First we want to quantify the relationship between the axial scanner displacement
and the resulting focus location or imaging depth. The axial scanner was mounted on a
motorized stage (TRA12CC, Newport) such that its position can be precisely controlled. A
thin layer of fluorescent beads with 1 µm diameter (F13080, Invitrogen) on a microscope
slide was used as a imaging sample for this calibration procedure. Under lateral imaging
mode, the axial scanner was displaced to differently locations, and the sample was moved
accordingly to maintain in focus. The position of the sample is recorded for the
corresponding axial scanner position. The axial resolution was also measured at each axial
scanner location, by moving the sample about the focal plane to create a vertical section of
a 1 µm bead. FWHM of the axial profile was used as the metric for the axial resolution.
We also noticed that the field of view (FOV) in the lateral plane is modulated by
the position of the MEMS scanner. To correctly reconstruct the vertical plane images in
the X axis, we need to measure the lateral FOV size at different imaging depth. A grid
target (R1L3S3P) was placed at the sample plane as an imaging target for FOV
measurement. Reflectance images were acquired at different focus locations by translating
the axial scanner.

118
7.2.7 Imaging performance demonstration
We first used autofluorescent pollen (Carolina Biological Supply Inc) with
dimensions that range from 30-40 m to demonstrate the performance of the system. We
imaged the grains in both the horizontal (XY) and vertical (XZ) planes. A 3D stack of
images collected in the horizontal (XY) plane was taken by moving the sample 50 m in
the axial direction with a 1 m step size. The vertical projection (XZ) was then
reconstructed, and compared with the image collected in the vertical plane (XZ) using the
axial MEMS scanner.
7.2.8 Tissue preparation
All animal studies were performed in compliance with University of Michigan
regulations and with approval by the University Committee on the Use and Care of
Animals (UCUCA). We used a mouse genetically engineered to expresses tdTomato with
peak multiphoton excitation at ~700 nm. For ex vivo imaging, mice were euthanized, and
the colon was excised, rinsed with PBS to remove debris, and mounted on glass slides. We
used an excitation wavelength of 750 nm and 20 mW laser power at the sample plane.

119
7.3 Results
7.3.1 PSF simulation
We simulated the PSF of the imaging system with the axial scan mirror M2 located
at different positions and with various tilt angles. We determined the relative intensity of
the axial PSF at its peak value to evaluate the reduction in laser power at the focus. We
show results for the PSF with either a 100 m upward, Fig. 7.4a-c, or 100 m downward
displacement, Fig. 7.4d-f, of the axial scanner. Tilt angles of 0o, 0.4o, 0.8o, and 1o were
evaluated. We found that tilt angles <0.5o keep the laser intensity stable to <10% of peak
value over the range of axial displacements.
Fig. 7.4. Effect of tilt on PSF. a-c) With a 100 µm downward () scan, a tilt in the axial
MEMS scanner of 0°, 0.5°, and 1° reduces the magnitude of the PSF to 98.6%, 93.2%, and
89.1%, respectively. d-f) With a 100 µm upward () scan, a tilt in the axial MEMS scanner
of 0°, 0.5°, and 1° reduces the magnitude of the PSF to 96.2%, 91.1%, and 72.9%,
respectively.

120
7.3.2 Optical properties characterization
Fig. 7.5a-c show the ray paths when the axial scanner moves out of the neutral
position. When the scanner moves 200 µm away from Obj1 (Zm = -200 µm), a converging
wavefront is generated and imaged onto Obj2, and the resulted focus is about 100 µm closer
to Obj2 (Z = -100 µm). Similarly, when the scanner moves closer to Obj1, a diverging
wavefront is generated and the focus moves about 100 µm away from Obj2. Fig. 7.5d shows
a linear relationship between focus location or imaging depth with respect to axial MEMS
location, with a magnification of about 2 to 1. The axial resolution is also measured at the
same time, showing axial FWHMs ranging from 7 µm to 4.5 µm over the axial scanning
range. Vertical sections of a 1 µm bead is shown when Zm = -150, 0 and 150 µm.
Fig. 7.5. Axial scan performance characterization. a) In the neutral position, the
multiphoton excitation wavefront is imaged onto the focal plane at position Z = 0 µm,

121
defined at a distance of 100 µm below the mucosal surface. b) When the axial MEMS
actuator M2 moves away from Obj2, the wavefront converges, and the focal plane moves
upward axially to Z = -100 µm. c) When M2 moves toward Obj2, the wavefront diverges,
and the focal plane moves downward axially to Z = 100 µm. d) The position of M2 and
depth of the focal plane has a linear relationship. Axial resolution defined by FWHM
varies from 4.5 to 7 mm over scan range. e) Lateral magnification ranges from 0.9 to 1.2
over relevant imaging depths.
The FOV is measured to be 270 x 270 µm2 at the nominal position. During axial
scanning, when Z changes from -100 µm to 100 µm, we found that the FOV changes from
320 µm to 240 µm. This is mainly resulted from the mismatch of Obj1 and Obj2.
Normalized FOVs are plotted against different imaging depth, Fig. 7.5e..
7.3.3 Axial scan performance demonstration
Fig. 7.6. Multiphoton excited fluorescence images of pollen grains. a) XY image using
lateral MEMS scanner only. b-d) XZ images are reconstructed along planes marked by red
lines in a). e-g) XZ images collected using axial MEMS scanner.
Multiphoton excited fluorescence images of pollen grains were collected to
compare vertical images obtained by reconstructing a series of images collected in the
horizontal plane with that collected directly in the vertical plane. A set of horizontal images

122
were collected over a FOV of 100×100 μm2, Fig. 7.6a. A Z-stack was collected while
moving the specimen in the axial direction over a displacement in steps of 50 μm. XZ
images were extracted from the 3D reconstruction along the planes identified by the red
lines in Fig. 7.6a, b–d. We also collected XZ images directly using the axial MEMS
scanner, Fig. 7.6e–g. Both sets of XZ images have a FOV of 100×50 μm2. No differences
are observed in the resolution, intensity, or contrast between these two sets of vertical
images collected using either approach.
7.3.4 Tissue imaging
Fig. 7.7. Multiphoton excited fluorescence images of mouse colonic epithelium ex vivo. Representative image collected in the a) horizontal (XY) plane uses the lateral MEMS
scanner only, and b) vertical (XZ) plane was collected using both the lateral and axial
MEMS scanners. Key: crypt (arrow), lumen (l), goblet cells (g), cytoplasm (c),
inflammatory cells (arrowhead), lamina propria (lp).
Multiphoton excited fluorescence images were collected ex vivo from specimens
of mouse colonic epithelium that express tdTomato. These images demonstrate the
potential for in vivo use to study biological phenomena using a light-weight, compact
mirror that performs fast axial scanning. A representative image obtained in the horizontal

123
(XY) plane over a FOV of 250×250 μm2 is shown, Fig. 7.7a. Hexagonally packed,
circularly-shaped crypts (arrow) surrounding central lumen (l) with uniform dimensions
can be appreciated. Goblet cells (g) can be seen with uniform fluorescence in the cytoplasm
(c). Individual inflammatory cells (arrowhead) can be identified in the lamina propria (lp).
An image of the same specimen was collected in the vertical (XZ) plane over a FOV of
250×200 μm2, Fig. 7.7b, and shows the vertical anatomy of individual crypts.
7.4 Discussion
Here, we demonstrate a multiphoton microscope that uses compact lateral and axial
MEMS scanners to provide fluorescence images in either the horizontal or vertical plane.
Using a remote configuration, we demonstrate images from mouse colonic epithelium in
the vertical plane with a depth of 200 m without moving the specimen. These scanners
use parametric resonance to achieve fast imaging speeds of 5 frames/sec, sufficient to study
biological processes in live animals over time. These devices are mechanically robust,
highly reliable, and fabricated at low cost with high yield. These scanners are a promising
alternative to large, bulky actuators found in conventional microscopes, and can be used in
an ultra-compact intravital microscope or even an endomicroscope to provide real time
horizontal and vertical sectioning capabilities.
We showed results to support multiphoton excited fluorescence images collected
in the vertical plane using axial beam scanning to be equivalent to reconstructing a Z-stack
of horizontal (XY) images acquired by moving the stage. We present fluorescence images
124
collected from mouse colonic epithelium genetically engineered to express the optical
reporter tdTomato with an imaging depth of 200 μm at 5 frames per sec. These results
demonstrate feasibility to collecting vertical sections with an endomicroscope. We
demonstrated feasibility to develop and use a miniature scanner and actuator located
remotely for imaging in either the horizontal or vertical plane. In order to use the full
aperture of the lateral scan mirror M1, we arranged the PBS and QWP so that the excitation
beam is at normal incidence rather than at 45°, Fig. 1. This configuration increases the
beam diameter that can be used by a factor of 1.4, and introduces less scanning induced
distortion.
Recently, other efforts have been made to integrate different types of axial scanners
in remote scan configurations. A commercial piezoelectric motor was used to move a
mirror [137], but the speed was not reported. A fast moving mirror was constructed using
a pair of identical galvanometer motors mounted in opposite directions, with scan rate up
to 2.7 kHz. [118] The scanning performance was excellent with the use of well
characterized and feedback controlled galvo scanner, but it is not suitable for constructing
a more compact system. A voice coil motor was used to build the z-scan module with scan
rate about 100 Hz. [138] Due to the position drift over time in a voice coil motor, a separate
sensor and controller is needed for precise motion control. Our method has the most
compact actuators for both lateral and axial scanning, and scanning performance is
comparable to the above bulky actuators. We believe our technology can potentially be
used to build a miniature 3D multiphoton microscope for live animal study.

125
Despite our promising results, our study has several limitations. In the current
configuration, the back aperture of the imaging objective (Obj2) is slightly underfilled, and
partly explains why the theoretical diffraction limit for axial resolution of ~1 μm with a 0.9
NA objective was not achieved. This problem can be mitigated by increasing the diameter
of the lateral MEMS mirror and expand the width of the excitation beam. Also, the
combined use of two resonant scanners limits collection of optical sections in either the
horizontal or vertical plane. We can advance image acquisition to full 3D volumetric
images by developing an axial scanner that operates in dc mode. In the vertical section,
we noticed a rapid reduction in signal with increased imaging depth as a result of tissue
absorption and scattering over a long optical path. We can collect more signal at greater
depths by modulating the laser power. An electro-optic modulator can be used to provide
the speeds needed to match the fast axial scan rate of 465 Hz achieved by our MEMS
actuator. Finally, degradation in image resolution and reduced FOV can be mitigated by a
better match in the optical parameters between the air and water immersion objectives Obj1
and Obj2.
We showed that it is feasible to develop miniature scanners for both lateral and
axial plane imaging. However, there are still challenges in terms of building a miniature
imaging system with these MEMS scanners. A polarization maintaining fiber with low
dispersion is needed for laser pulse delivery. A miniature objective is also desired if we
want to access hollow organs in small animals. Special care should be taken for packaging

126
and alignment since the performance of the remote scan setup is very sensitive to
misalignment of the optics [139].
7.5. Summary
We demonstrate the use of compact MEMS scanners in a remote configuration to
perform optical sectioning without moving either the optics or specimen. We collect
multiphoton excited fluorescence images from mouse colonic epithelium that expresses
tdTomato with depth of 200 μm at a frame rate of 5 Hz. This scan strategy can be used
to visualize fast biological processes that develop naturally in the direction perpendicular
to the tissue surface.

127
Chapter 8 Future Works
Several types of endomicroscopes have been demonstrated, and we found the side-
viewing architecture to be most effective for in vivo imaging of mouse colon. By
integrating the MEMS scanner in the distal tip of the instrument in a post-objective scan
fashion, an ultra-compact endomicroscope can be developed with wide field of view and
submicron resolution. Using a similar architecture, several variations of side-view probes
can be developed in the future for improved depth penetration, wider field of view and 3D
imaging capability. Here we present some potential designs of side-viewing
endomicroscopes in three imaging modalities: multiphoton, dual axes confocal and wide-
field.
8.1 Side-view multiphoton endomicroscope with distal MEMS scanning
In chapter 4, a side-view multiphoton endomicroscope was developed based on the
previous handheld probe. The MEMS scanner was located in the handheld part of the probe
while the reflected beam was expanded a telescope, and focused by the side-viewing optics.
Due to beam scanning, the beam won’t always be perpendicular to the optical components
in the distal probe, therefore complicated optical design is needed to reduce the off-axis
aberrations. In chapter 5 and 6, the MEMS scanner was integrated into the distal end of a
confocal endomicroscope, with improved optical performance.

128
Fig. 8.1. Side-view multiphoton endomicroscope with post-objective MEMS scanning. a) Schematic. b) CAD drawing of the probe. c) Prototype with 3D printed handheld part.
The same distal optics can be used for a multiphoton instrument with an additional
handheld part for separate beam path for illumination and collection, as show in Fig. 8.1a.
We will use a PBF for short pulse delivery with zero dispersion at 780 nm. The beam
coming out of the fiber is collimated by L1 to a diameter of 3 mm. The beam and passes
through a dichroic mirror DM (62-634, Edmund Optics) into the distal imaging probe. The
distal optics are the same as the previous confocal probe, with L2 and L3 lens combination
for focusing and a 45° orientated MEMS mirror to reflect the beam to the side.
Fluorescence travels in the opposite direction along the same optical path, is reflected by
DM and a reflective mirror M, and is focused by lens L4 into a multimode fiber (MMF) a
large core size to maximize light collection. A CAD drawing for this design is shown in
Fig. 8.1b and a prototype housing is shown in Fig. 8.1c.

129
8.2 Side-view multiphoton endomicroscope with remote axial scanning
Fig. 8.2. Side-view multiphoton endomicroscope with remote axial scanning for 3D
imaging. a) Schematic. b) CAD drawing of the probe.
In chapter 7 we developed a multiphoton microscope using MEMS scanners for
both lateral and axial scanning. A remote axial scanning method was demonstrated in a
tabletop setup where the axial displacement of the scanner will translate to a change of
imaging depth in the tissue. We can incorporate this axial scanning strategy into the side-
view multiphoton probe for 3D imaging capability, as shown in Fig. 8.2a. The collimated
is reflected by a polarizing beam splitter (PBS), passes through a quarter wave plate (QWP),
and is focused by the remote objective L2 into the axial MEMS scanner. The beam passes
through the PBS and a dichroic mirror (DM) into the distal imaging probe. The distal
optics include a pair of relay lenses L3 and L4 and focusing lenses L5 and L6. A 2D MEMS
scanner is placed in the distal end for lateral scanning. Fluorescence path is the same as the
130
previous multiphoton probe. In this design, the axial scanner is placed in the handheld part
which reduces the size constraint of the MEMS device. A DC scanner using either
electrostatic, piezoelectric or electromagnetic actuation can also be used to adjust imaging
depth for 3D imaging. A CAD drawing is shown in Fig. 8.2b.
8.3 Side-view dual axes confocal endomicroscope
Current laser scanning microscopes use the conventional single axis optical design,
shown in Fig. 8.3a, where the pinhole (single mode optical fiber) and objective are located
along the same optical axis. Much of the light that is scattered by the tissue present between
the objective and focal volume (dashed orange lines) is collected with the high NA
objective, reducing the dynamic range of detection and signal to noise ratio. The dual axes
architecture, shown in Fig. 8.3b, is an alternative to single axis confocal microscopy. Here,
two fibers and low NA objectives are used for separate illumination and collection of light,
using the region of overlap between the two beams (focal volume) to achieve high axial
resolution [140]. Very little of the light that is scattered by tissue along the illumination
path (dashed orange lines) is collected by the low NA objective, thus the dynamic range is
significantly improved. We can adapt our single axis confocal endomicroscope, Fig. 8.3c,e,
into a dual axes instrument, Fig. 8.3d,f. Using the same side-viewing design, two separate
fibers are used for illumination and collection.

131
Fig. 8.3. Side-view dual axes confocal endomicroscope. a) In the conventional single
axis configuration, the fiber (pinhole) is aligned with the optical axis of the objective,
requiring a high NA to achieve sub-cellular resolution. b) The dual axes architecture uses
separate, low NA objectives to achieve sub-cellular resolution and long working distance.
Post-objective scanning provides a large field-of-view and instrument scalability to
millimeter dimensions. c),e) Single axis side-view endomicroscope, schematic and CAD
drawing. d),f) Dual axes side-view endomicroscope, schematic and CAD drawing.
8.4 Widefield endoscope
A widefield laser scanning endoscope can be developed with the 2D MEMS
scanner, Fig. 8.4a. Lasers with three wavelengths, 445, 515, 660 nm, are used for
illumination. These three wavelengths were chosen to image blue, green and red channels
respectively. The beam coming out of the fiber is collimated and scanned by the 2D MEMS
mirror, while reflectance/fluorescence signal is collected using a multimode fiber. This

132
geometry allows for low NA large FOV illumination, while using high NA fiber for
collection. Collected signal is separated into 4 channels, including the reflectance from
each channel and fluorescence generated by the red laser. 4 PMTs are used to measure the
signal in 4 channels. A CAD drawing is shown in Fig. 8.4b. Assembled prototype, Fig.
8.4c, with a 2D dog bone shaped MEMS mirror Fig. 8.4d. When the scanner is actuated
with the blue laser on, a 2D projection pattern can be seen in Fig. 8.4e. Widefield images
were acquired in red, green, and blue channels, as shown in Fig. 8.4f-h. Combined color
image from the three channels in shown in Fig. 8.4i.
Fig. 8.4. Wide-field endoscope. a) Schematic. b) CAD drawing. c) Assembled prototype
with a d) 2D dog bone shaped MEMS mirror. e). Projected 2D scan pattern for wide-field
imaging. f-h) Acquired images in red, green and blue channels. f) Merged color image.
133
Chapter 9 Conclusion
9.1 Summary
Motivated by the need of a high-resolution imaging instrument to study small
animals, several types of miniature endomicroscopes have been developed over the time
of this thesis. The final version of the instrument can collect horizontal/oblique plane
images in the mouse colon in real time (>10 frames/sec) with sub-micron resolution (<1
µm), deep tissue penetration (>200 µm) and large field of view (700 x 500 µm). A novel
side-viewing architecture with distal MEMS scanning was developed to create clear and
stable image in the mouse colon. With the use of the instrument, it is convenient to pinpoint
location of interest and create a map of the colon using image mosaicking. Imaging
performance was demonstrated in vivo using fluorescence-labeled peptides that
specifically bind to tumors in the distal colon. This will be an extremely useful tool which
will enable biologists to perform longitudinal studies in vivo.

134
Appendix
Appendix A. Matlab code for distortion profile of a 2D scan mirror
rotMat3.m
% Create a rotation matrix by an axis
% U = (ux, uy, uz): rotation axis
% theta: rotation angle
function output = rotMat3(U, theta)
ux = U(1);
uy = U(2);
uz = U(3);
output = [
cos(theta)+ux^2*(1-cos(theta)), ux*uy*(1-cos(theta))-
uz*sin(theta), ux*uz*(1-cos(theta))+uy*sin(theta);
uy*uz*(1-cos(theta))+uz*sin(theta), cos(theta)+uy^2*(1-
cos(theta)), uy*uz*(1-cos(theta))-ux*sin(theta);
uz*ux*(1-cos(theta))-uy*sin(theta), uz*uy*(1-
cos(theta))+ux*sin(theta), cos(theta)+uz^2*(1-cos(theta));
];
end
MirrorRotationXY_45deg_plot.m
%%
% x: mechanical rotation about MEMS X axis
% y: mechanical rotation about MEMS Y axis
% x = (0:0.1:15)*pi/180;
% y = (0:0.1:10)*pi/180;
figure;
[x_list,y_list] = meshgrid([-10:1:10]);
for i = 1:length(x_list)
for j = 1:length(y_list)
x = x_list(i,j)*pi/180;
y = y_list(i,j)*pi/180;
S_x = [cos(x)+ sin(x/2)^2, -sqrt(2)/2*sin(x), sin(x/2)^2;
sqrt(2)/2*sin(x), cos(x), -sqrt(2)/2*sin(x);
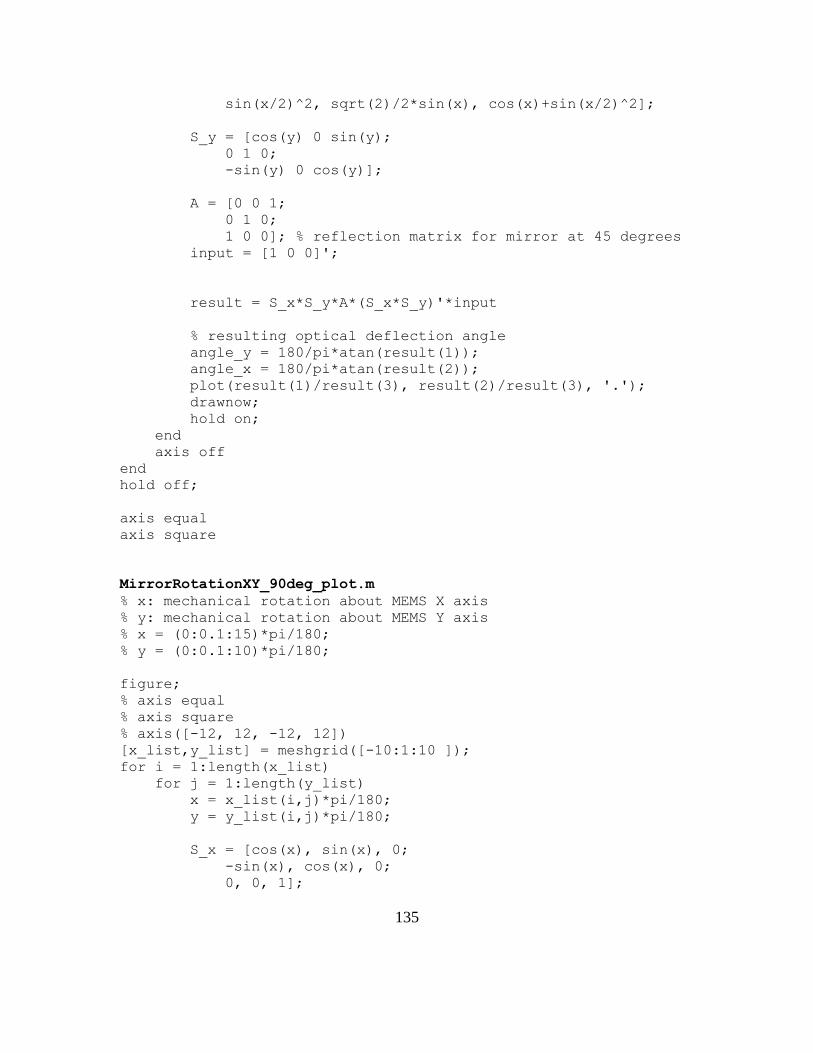
135
sin(x/2)^2, sqrt(2)/2*sin(x), cos(x)+sin(x/2)^2];
S_y = [cos(y) 0 sin(y);
0 1 0;
-sin(y) 0 cos(y)];
A = [0 0 1;
0 1 0;
1 0 0]; % reflection matrix for mirror at 45 degrees
input = [1 0 0]';
result = S_x*S_y*A*(S_x*S_y)'*input
% resulting optical deflection angle
angle_y = 180/pi*atan(result(1));
angle_x = 180/pi*atan(result(2));
plot(result(1)/result(3), result(2)/result(3), '.');
drawnow;
hold on;
end
axis off
end
hold off;
axis equal
axis square
MirrorRotationXY_90deg_plot.m
% x: mechanical rotation about MEMS X axis
% y: mechanical rotation about MEMS Y axis
% x = (0:0.1:15)*pi/180;
% y = (0:0.1:10)*pi/180;
figure;
% axis equal
% axis square
% axis([-12, 12, -12, 12])
[x_list,y_list] = meshgrid([-10:1:10 ]);
for i = 1:length(x_list)
for j = 1:length(y_list)
x = x_list(i,j)*pi/180;
y = y_list(i,j)*pi/180;
S_x = [cos(x), sin(x), 0;
-sin(x), cos(x), 0;
0, 0, 1];

136
S_y = [cos(y) 0 sin(y);
0 1 0;
-sin(y) 0 cos(y)];
R = [-1 0 0;
0 1 0;
0 0 1]; % reflection matrix for mirror at 45 degrees
input = [1 0 0]';
result = S_x*S_y*R*(S_x*S_y).'*input;
% resulting optical deflection angle
angle_y = 180/pi*atan(result(2));
angle_x = 180/pi*atan(result(3));
drawnow;
hold on;
end
end
hold off;
axis off
axis equal
axis square

137
References
1. A. Masedunskas, M. Sramkova, L. Parente, and R. Weigert, "Intravital Microscopy
to Image Membrane Trafficking in Live Rats," Methods Mol. Biol. 931, 153–167
(2013).
2. B. K. Edwards, A. M. Noone, A. B. Mariotto, E. P. Simard, F. P. Boscoe, S. J.
Henley, A. Jemal, H. Cho, R. N. Anderson, B. A. Kohler, C. R. Eheman, and E. M.
Ward, "Annual Report to the Nation on the status of cancer, 1975-2010, featuring
prevalence of comorbidity and impact on survival among persons with lung,
colorectal, breast, or prostate cancer," Cancer 120, 1290–1314 (2014).
3. "Cancer Facts and Figures 2016, American Cancer Society," Am. Cancer Soc. Inc
(2016).
4. J. C. Van Rijn, J. B. Reitsma, J. Stoker, P. M. Bossuyt, S. J. Van Deventer, and E.
Dekker, "Polyp miss rate determined by tandem colonoscopy: A systematic review,"
Am. J. Gastroenterol. 101, 343–350 (2006).
5. T. Fujii, B. J. Rembacken, M. F. Dixon, S. Yoshida, and A. T. R. Axon, "Flat
adenomas in the United Kingdom: Are treatable cancers being missed?," Endoscopy
30, 437–443 (1998).

138
6. A. R. Hart, S. Kudo, E. H. Mackay, J. F. Mayberry, and W. S. Atkin, "Flat adenomas
exist in asymptomatic people: important implications for colorectal cancer screening
programmes.," Gut 43, 229–231 (1998).
7. G. Gualco, N. Reissenweber, I. Cliché, and C. E. Bacchi, "Flat elevated lesions of
the colon and rectum: a spectrum of neoplastic and nonneoplastic entities," Ann.
Diagn. Pathol. 10, 333–338 (2006).
8. P. M. Delaney, R. G. King, J. R. Lambert, and M. R. Harris, "Fibre optic confocal
imaging (FOCI) for subsurface microscopy of the colon in vivo.," J. Anat. 184 ( Pt
1, 157–60 (1994).
9. S. H. Yun, G. J. Tearney, B. J. Vakoc, M. Shishkov, W. Y. Oh, A. E. Desjardins, M.
J. Suter, R. C. Chan, J. A. Evans, I.-K. Jang, N. S. Nishioka, J. F. de Boer, and B. E.
Bouma, "Comprehensive volumetric optical microscopy in vivo.," Nat. Med. 12,
1429–1433 (2006).
10. T. D. Wang, S. Friedland, P. Sahbaie, R. Soetikno, P. L. Hsiung, J. T. C. Liu, J. M.
Crawford, and C. H. Contag, "Functional Imaging of Colonic Mucosa With a
Fibered Confocal Microscope for Real-Time In Vivo Pathology," Clin.
Gastroenterol. Hepatol. 5, 1300–1305 (2007).
11. R. Kiesslich, M. Goetz, E. M. Angus, Q. Hu, Y. Guan, C. Potten, T. Allen, M. F.
Neurath, N. F. Shroyer, M. H. Montrose, and A. J. M. Watson, "Identification of
Epithelial Gaps in Human Small and Large Intestine by Confocal Endomicroscopy,"
139
Gastroenterology 133, 1769–1778 (2007).
12. B. A. Flusberg, E. D. Cocker, W. Piyawattanametha, J. C. Jung, E. L. M. Cheung,
and M. J. Schnitzer, "Fiber-optic fluorescence imaging," 2, 941–950 (2005).
13. M. Goetz, C. Footner, E. Schirrmacher, P. Delaney, S. Gregor, C. Schneider, D.
Strand, S. Kanzler, B. Memadathil, E. Weyand, M. Holtmann, R. Schirrmacher, M.
M. Weber, M. Anlauf, G. Klöppel, M. Vieth, P. R. Galle, P. Bartenstein, M. F.
Neurath, and R. Kiesslich, "In-vivo confocal real-time mini-microscopy in animal
models of human inflammatory and neoplastic diseases," Endoscopy 39, 350–356
(2007).
14. R. Cotran, V. Kumar, and S. Robbins, "Robbins And Cotran Pathologic Basis Of
Disease, 7th ed," Philadelphia, PA Saunders, Ipswich, MA 69, 1–1368 (2010).
15. J. Fujimoto, "Optical coherence tomography for ultrahigh resolution in vivo
imaging.," Nat Biotechnol 21, 1361–1367 (2003).
16. M. J. Gora, J. S. Sauk, R. W. Carruth, K. a Gallagher, M. J. Suter, N. S. Nishioka,
L. E. Kava, M. Rosenberg, B. E. Bouma, and G. J. Tearney, "Tethered capsule
endomicroscopy enables less invasive imaging of gastrointestinal tract
microstructure.," Nat. Med. 19, 238–40 (2013).
17. T. R. C. and G. S. Kino, Confocal Scanning Optical Microscopy and Related
Imaging Systems (Academic Press, 1996).
140
18. J. Art, Photon Detectors for Confocal Microscopy (Plenum, 2006).
19. A. D. Mehta, J. C. Jung, B. A. Flusberg, and M. J. Schnitzer, "Fiber optic in vivo
imaging in the mammalian nervous system," Curr. Opin. Neurobiol. 14, 617–628
(2004).
20. P. Theer, M. T. Hasan, and W. Denk, "Two-photon imaging to a depth of 1000
microm in living brains by use of a Ti:Al2O3 regenerative amplifier.," Opt. Lett. 28,
1022–1024 (2003).
21. P. Theer and W. Denk, "On the fundamental imaging-depth limit in two-photon
microscopy," J. Opt. Soc. Am. A 23, 3139–3149 (2006).
22. D. Kobat, N. G. Horton, and C. Xu, "In vivo two-photon microscopy to 1.6-mm
depth in mouse cortex," J. Biomed. Opt. 16, 106014 (2011).
23. W. Denk, J. H. Strickler, and W. W. Webb, "Two-photon laser scanning
fluorescence microscopy.," Science 248, 73–6 (1990).
24. G. H. Patterson and D. W. Piston, "Photobleaching in two-photon excitation
microscopy.," Biophys. J. 78, 2159–62 (2000).
25. C. Xu, W. Zipfel, J. B. Shear, R. M. Williams, and W. W. Webb, "Multiphoton
fluorescence excitation: new spectral windows for biological nonlinear
microscopy.," Proc. Natl. Acad. Sci. U. S. A. 93, 10763–8 (1996).
26. A. F. Gmitro and D. Aziz, "Confocal microscopy through a fiber-optic imaging

141
bundle," Opt. Lett. 18, 565 (1993).
27. E. Laemmel, "Fibered Confocal Fluorescence Microcopy (Cell-viZio tm) Facilitates
Extended Imagingn in the Field of Microcirculation," J Vasc Res 41, 400–411
(2004).
28. K. Carlson, M. Chidley, K.-B. Sung, M. Descour, A. Gillenwater, M. Follen, and R.
Richards-Kortum, "In vivo fiber-optic confocal reflectance microscope with an
injection-molded plastic miniature objective lens.," Appl. Opt. 44, 1792–1797
(2005).
29. A. M. Buchner, M. W. Shahid, M. G. Heckman, M. Krishna, M. Ghabril, M. Hasan,
J. E. Crook, V. Gomez, M. Raimondo, T. Woodward, H. C. Wolfsen, and M. B.
Wallace, "Comparison of Probe-Based Confocal Laser Endomicroscopy With
Virtual Chromoendoscopy for Classification of Colon Polyps," Gastroenterology
138, 834–842 (2010).
30. A. a Tanbakuchi, A. R. Rouse, J. a Udovich, K. D. Hatch, and A. F. Gmitro, "Clinical
confocal microlaparoscope for real-time in vivo optical biopsies.," J. Biomed. Opt.
14, 44030 (2014).
31. W. Göbel, J. N. D. Kerr, A. Nimmerjahn, and F. Helmchen, "Miniaturized two-
photon microscope based on a flexible coherent fiber bundle and a gradient-index
lens objective.," Opt. Lett. 29, 2521–3 (2004).
32. G. Oh, E. Chung, and S. H. Yun, "Optical fibers for high-resolution in vivo
142
microendoscopic fluorescence imaging," Opt. Fiber Technol. 19, 760–771 (2013).
33. Y. S. Sabharwal, A. R. Rouse, L. Donaldson, M. F. Hopkins, and A. F. Gmitro, "Slit-
scanning confocal microendoscope for high-resolution in vivo imaging.," Appl. Opt.
38, 7133–7144 (1999).
34. M. Risi, H. Makhlouf, A. Rouse, A. Tanbakuchi, and A. Gmitro, "Design and
Performance of a Multi-Point Scan Confocal Microendoscope," Photonics 1, 421–
431 (2014).
35. M. Hughes and G. Z. Yang, "High speed, line-scanning, fiber bundle fluorescence
confocal endomicroscopy for improved mosaicking," Biomed Opt Express 6, 1241–
1252 (2015).
36. M. Kyrish, R. Kester, R. Richards-Kortum, and T. Tkaczyk, "Improving spatial
resolution of a fiber bundle optical biopsy system," Proc SPIE 7558, 755807 (2010).
37. Y. Choi, C. Yoon, M. Kim, T. D. Yang, C. Fang-Yen, R. R. Dasari, K. J. Lee, and
W. Choi, "Scanner-free and wide-field endoscopic imaging by using a single
multimode optical fiber," Phys. Rev. Lett. 109, 1–5 (2012).
38. C. MacAulay, P. Lane, and R. Richards-Kortum, "In vivo pathology:
Microendoscopy as a new endoscopic imaging modality," Gastrointest. Endosc.
Clin. N. Am. 14, 595–620 (2004).
39. C. M. Lee, C. J. Engelbrecht, T. D. Soper, F. Helmchen, and E. J. Seibel, "Scanning

143
fiber endoscopy with highly flexible, 1 mm catheterscopes for wide-field, full-color
imaging.," J. Biophotonics 3, 385–407 (2010).
40. S. J. Miller, C. M. Lee, B. P. Joshi, A. Gaustad, E. J. Seibel, and T. D. Wang,
"Targeted detection of murine colonic dysplasia in vivo with flexible multispectral
scanning fiber endoscopy," 17, 1–11 (2012).
41. C. J. Engelbrecht, R. S. Johnston, E. J. Seibel, and F. Helmchen, "Ultra-compact
fiber-optic two-photon microscope for functional fluorescence imaging in vivo.,"
Opt. Express 16, 5556–5564 (2008).
42. Y. Wu, Y. Leng, J. Xi, and X. Li, "Scanning all-fiber-optic endomicroscopy system
for 3D nonlinear optical imaging of biological tissues.," Opt. Express 17, 7907–15
(2009).
43. M. T. Myaing, D. J. MacDonald, and X. Li, "Fiber-optic scanning two-photon
fluorescence endoscope.," Opt. Lett. 31, 1076–8 (2006).
44. D. R. Rivera, C. M. Brown, D. G. Ouzounov, I. Pavlova, D. Kobat, W. W. Webb,
and C. Xu, "Compact and flexible raster scanning multiphoton endoscope capable
of imaging unstained tissue," (2011).
45. D. A. Roberts and R. R. A. Syms, "1D and 2D laser line scan generation using a
fiber optic resonant scanner," Proc. SPIE 4075, 62–73 (2000).
46. E. J. Seibel, Q. Y. J. Smithwick, J. L. Crossman-bosworth, and J. A. Myers,

144
"Prototype scanning fiber endoscope," 4616, 173–179 (2002).
47. Z. Qiu and W. Piyawattanametha, "MEMS-Based Medical Endomicroscopes,"
IEEE J. Sel. Top. Quantum Electron. 21, (2015).
48. H. Ra, W. Piyawattanametha, Y. Taguchi, D. Lee, M. J. Mandella, and O. Solgaard,
"Two-dimensional MEMS scanner for dual-axes confocal microscopy," J.
Microelectromechanical Syst. 16, 969–976 (2007).
49. K. H. Kim, B. H. Park, G. N. Maguluri, T. W. Lee, F. J. Rogomentich, M. G. Bancu,
B. E. Bouma, J. F. de Boer, and J. J. Bernstein, "Two-axis magnetically-driven
MEMS scanning catheter for endoscopic high-speed optical coherence
tomography.," Opt. Express 15, 18130–18140 (2007).
50. L. Liu, L. Wu, J. Sun, E. Lin, and H. Xie, "Miniature endoscopic optical coherence
tomography probe employing a two-axis microelectromechanical scanning mirror
with through-silicon vias.," J. Biomed. Opt. 16, 26006 (2011).
51. T. Naono, T. Fujii, M. Esashi, and S. Tanaka, "A large-scan-angle piezoelectric
MEMS optical scanner actuated by a Nb-doped PZT thin film," J. Micromechanics
Microengineering 24, 15010 (2014).
52. R. Kiesslich, J. Burg, M. Vieth, J. Gnaendiger, M. Enders, P. Delaney, A. Polglase,
W. McLaren, D. Janell, S. Thomas, B. Nafe, P. R. Galle, and M. F. Neurath,
"Confocal laser endoscopy for diagnosing intraepithelial neoplasias and colorectal
cancer in vivo," Gastroenterology 127, 706–713 (2004).

145
53. L. Thiberville, S. Moreno-Swirc, T. Vercauteren, E. Peltier, C. Cavé, and G. B.
Heckly, "In Vivo imaging of the bronchial wall microstructure using fibered
confocal fluorescence microscopy," Am. J. Respir. Crit. Care Med. 175, 22–31
(2007).
54. W. Piyawattanametha, E. D. Cocker, L. D. Burns, R. P. Barretto, J. C. Jung, H. Ra,
O. Solgaard, and M. J. Schnitzer, "In vivo brain imaging using a portable 2.9 g two-
photon microscope based on a microelectromechanical systems scanning mirror.,"
Opt. Lett. 34, 2309–2311 (2009).
55. H. Bao, J. Allen, R. Pattie, R. Vance, and M. Gu, "Fast handheld two-photon
fluorescence microendoscope with a 475 μm × 475 μm field of view for in vivo
imaging," Opt. Lett. 33, 1333 (2008).
56. K. Murakami, "A Miniature Confocal Optical Scanning Microscope for
Endoscope," MOEMS Disp. Imaging Syst. III 5721, 119–131 (2005).
57. W. Piyawattanametha, H. Ra, Z. Qiu, S. Friedland, J. T. C. Liu, K. Loewke, G. S.
Kino, O. Solgaard, T. D. Wang, M. J. Mandella, and C. H. Contag, "In vivo near-
infrared dual-axis confocal microendoscopy in the human lower gastrointestinal
tract," J. Biomed. Opt. 17, 21102 (2012).
58. L. Liu, E. Wang, X. Zhang, W. Liang, X. Li, and H. Xie, "MEMS-based 3D confocal
scanning microendoscope using MEMS scanners for both lateral and axial scan,"
Sensors Actuators A Phys. 215, 89–95 (2014).
146
59. T. Meinert, N. Weber, H. Zappe, and A. Seifert, "Varifocal MOEMS fiber scanner
for confocal endomicroscopy," Opt. Express 22, 31529 (2014).
60. X. Duan, H. Li, J. Zhou, Q. Zhou, K. R. Oldham, and T. D. Wang, "Visualizing
epithelial expression of EGFR in vivo with distal scanning side-viewing confocal
endomicroscope," Sci. Rep. 6, 37315 (2016).
61. Y. Zhao, H. Nakamura, and R. J. Gordon, "Development of a versatile two-photon
endoscope for biological imaging.," Biomed. Opt. Express 1, 1159–1172 (2010).
62. C. L. Hoy, O. Ferhanoğlu, M. Yildirim, W. Piyawattanametha, H. Ra, O. Solgaard,
and A. Ben-Yakar, "Optical design and imaging performance testing of a 9.6-mm
diameter femtosecond laser microsurgery probe.," Opt. Express 19, 10536–52
(2011).
63. Y. Zhang, M. L. Akins, K. Murari, J. Xi, M.-J. Li, K. Luby-Phelps, M. Mahendroo,
and X. Li, "A compact fiber-optic SHG scanning endomicroscope and its application
to visualize cervical remodeling during pregnancy," Proc. Natl. Acad. Sci. 109,
12878–12883 (2012).
64. B. Smith, M. Naji, and S. Murugkar, "Portable, miniaturized, fibre delivered,
multimodal CARS exoscope," Opt. Express 21, 1–5 (2013).
65. H.-Y. Chung, W.-C. Kuo, Y.-H. Cheng, C.-H. Yu, S.-H. Chia, C.-Y. Lin, J.-S. Chen,
H.-J. Tsai, A. B. Fedotov, A. a. Ivanov, A. M. Zheltikov, and C.-K. Sun, "Blu-ray
disk lens as the objective of a miniaturized two-photon fluorescence microscope,"

147
Opt. Express 21, 31604 (2013).
66. D. Do, H. Yoo, and D.-G. Gweon, "Fiber-optic raster scanning two-photon
endomicroscope using a tubular piezoelectric actuator.," J. Biomed. Opt. 19, 66010
(2014).
67. X. Duan, H. Li, Z. Qiu, B. P. Joshi, A. Pant, A. Smith, K. Kurabayashi, K. R. Oldham,
and T. D. Wang, "MEMS-based multiphoton endomicroscope for repetitive imaging
of mouse colon," Biomed. Opt. Express 6, 3074 (2015).
68. G. Ducourthial, P. Leclerc, T. Mansuryan, M. Fabert, J. Brevier, R. Habert, F. Braud,
R. Batrin, C. Vever-Bizet, G. Bourg-Heckly, L. Thiberville, A. Druilhe, A.
Kudlinski, and F. Louradour, "Development of a real-time flexible multiphoton
microendoscope for label-free imaging in a live animal.," Sci. Rep. 5, 18303 (2015).
69. L. Huang, A. K. Mills, Y. Zhao, D. J. Jones, and S. Tang, "Miniature fiber-optic
multiphoton microscopy system using frequency-doubled femtosecond Er-doped
fiber laser," Biomed. Opt. Express 7, 1948 (2016).
70. Y. Wang, Z. Li, X. Liang, and L. Fu, "Four-plate piezoelectric actuator driving a
large-diameter special optical fiber for nonlinear optical microendoscopy," Opt.
Express 24, 19949 (2016).
71. P.-L. Hsiung, P.-L. Hsiung, J. Hardy, S. Friedland, R. Soetikno, C. B. Du, A. P. Wu,
P. Sahbaie, J. M. Crawford, A. W. Lowe, C. H. Contag, and T. D. Wang, "Detection
of colonic dysplasia in vivo using a targeted heptapeptide and confocal

148
microendoscopy.," Nat. Med. 14, 454–8 (2008).
72. M. B. Sturm, B. P. Joshi, S. Lu, C. Piraka, S. Khondee, B. J. Elmunzer, R. S. Kwon,
D. G. Beer, H. D. Appelman, D. K. Turgeon, and T. D. Wang, "Targeted Imaging
of Esophageal Neoplasia with a Fluorescently Labeled Peptide: First-in-Human
Results," Sci. Transl. Med. 5, 184ra61-184ra61 (2013).
73. M. Li, C. P. Anastassiades, B. Joshi, C. M. Komarck, C. Piraka, B. J. Elmunzer, D.
K. Turgeon, T. D. Johnson, H. Appelman, D. G. Beer, and T. D. Wang, "Affinity
peptide for targeted detection of dysplasia in barrett’s esophagus," Gastroenterology
139, 1472–1480 (2010).
74. B. P. Joshi, S. J. Miller, C. M. Lee, E. J. Seibel, and T. D. Wang, "Multispectral
endoscopic imaging of colorectal dysplasia in vivo," Gastroenterology 143, 1435–
1437 (2012).
75. J. Zhou, B. P. Joshi, X. Duan, A. Pant, Z. Qiu, R. Kuick, S. R. Owens, and T. D.
Wang, "EGFR Overexpressed in Colonic Neoplasia Can be Detected on Wide-Field
Endoscopic Imaging," 6, e101-11 (2015).
76. E. F. Rabinsky, B. P. Joshi, A. Pant, J. Zhou, X. Duan, A. Smith, R. Kuick, S. Fan,
A. Nusrat, S. R. Owens, H. D. Appelman, and T. D. Wang, "Overexpressed Claudin-
1 Can Be Visualized Endoscopically in Colonic Adenomas In Vivo," C. Cell. Mol.
Gastroenterol. Hepatol. 2, 222–237 (2016).
77. B. P. Joshi, J. Zhou, A. Pant, X. Duan, Q. Zhou, R. Kuick, S. R. Owens, H.

149
Appelman, and T. D. Wang, "Design and Synthesis of Near-Infrared Peptide for in
Vivo Molecular Imaging of HER2," Bioconjug. Chem. 27, 481–494 (2016).
78. M. G. Pomper, "Translational molecular imaging for cancer.," Cancer Imaging 5
Spec No, S16-26 (2005).
79. S. Gross and D. Piwnica-Worms, "Molecular imaging strategies for drug discovery
and development," Curr. Opin. Chem. Biol. 10, 334–342 (2006).
80. R. Kneuer, H. U. Gremlich, N. Beckmann, H. Karmouty-Quintana, F. X. Blé, and
M. Müller, "In vivo mouse imaging and spectroscopy in drug discovery.," NMR
Biomed 20, 154–185 (2007).
81. S. Ricketts, P. D. Hockings, and J. C. Waterton, "Small Animal Imaging," (2011).
82. T. Hinoi, A. Akyol, B. K. Theisen, D. O. Ferguson, J. K. Greenson, B. O. Williams,
K. R. Cho, and E. R. Fearon, "Mouse model of colonic adenoma-carcinoma
progression based on somatic Apc inactivation.," Cancer Res. 67, 9721–30 (2007).
83. A. J. Rowan, H. Lamlum, M. Ilyas, J. Wheeler, J. Straub, A. Papadopoulou, D.
Bicknell, W. F. Bodmer, and I. P. M. Tomlinson, "APC mutations in sporadic
colorectal tumors: A mutational “hotspot” and interdependence of the “two hits,”"
Proc. Natl. Acad. Sci. 97, 3352–3357 (2000).
84. E. Gratton, E. Gratton, M. J, and M. J, "Laser Sources for Confocal Microscopy," in
(2006), pp. 80–125.

150
85. A. Nolte, J. B. Pawley, and L. Höring, "Non-laser light sources for three-
dimensional microscopy," in Handbook of Biological Confocal Microscopy: Third
Edition (2006), pp. 126–144.
86. R. Liang, Optical Design for Biomedical Imaging (2010).
87. Z. Liu, S. J. Miller, B. P. Joshi, and T. D. Wang, "In vivo targeting of colonic
dysplasia on fluorescence endoscopy with near-infrared octapeptide.," Gut 62, 395–
403 (2013).
88. Z. Qiu, Z. Liu, X. Duan, S. Khondee, B. Joshi, M. J. Mandella, K. Oldham, K.
Kurabayashi, and T. D. Wang, "Targeted vertical cross-sectional imaging with
handheld near-infrared dual axes confocal fluorescence endomicroscope.," Biomed.
Opt. Express 4, 322–30 (2013).
89. Q. Zhou, Z. Li, J. Zhou, B. P. Joshi, G. Li, X. Duan, R. Kuick, S. R. Owens, and T.
D. Wang, "In vivo photoacoustic tomography of EGFR overexpressed in
hepatocellular carcinoma mouse xenograft," Photoacoustics (2015).
90. Z. Qiu, S. Khondee, X. Duan, H. Li, M. J. Mandella, B. P. Joshi, Q. Zhou, S. R.
Owens, K. Kurabayashi, K. R. Oldham, and T. D. Wang, "Vertical Cross-sectional
Imaging of Colonic Dysplasia In Vivo With Multi-spectral Dual Axes Confocal
Endomicroscopy," Gastroenterology 146, 615–617 (2014).
91. J. Livet, T. a Weissman, H. Kang, R. W. Draft, J. Lu, R. a Bennis, J. R. Sanes, and
J. W. Lichtman, "Transgenic strategies for combinatorial expression of fluorescent
151
proteins in the nervous system.," Nature 450, 56–62 (2007).
92. H. J. Snippert, L. G. van der Flier, T. Sato, J. H. van Es, M. van den Born, C. Kroon-
Veenboer, N. Barker, A. M. Klein, J. van Rheenen, B. D. Simons, and H. Clevers,
"Intestinal crypt homeostasis results from neutral competition between
symmetrically dividing Lgr5 stem cells.," Cell 143, 134–44 (2010).
93. L. Madisen, T. A. Zwingman, S. M. Sunkin, S. W. Oh, H. A. Zariwala, H. Gu, L. L.
Ng, R. D. Palmiter, M. J. Hawrylycz, A. R. Jones, E. S. Lein, and H. Zeng, "A robust
and high-throughput Cre reporting and characterization system for the whole mouse
brain.," Nat. Neurosci. 13, 133–40 (2010).
94. J. B. Pawley, "Confocal and two-photon microscopy: Foundations, applications and
advances," Microsc. Res. Tech. 59, 148–149 (2002).
95. S. Kimura and T. Wilson, "Confocal scanning optical microscope using single-mode
fiber for signal detection.," Appl. Opt. 30, 2143–2150 (1991).
96. R. L. Fork, O. E. Martinez, and J. P. Gordon, "Negative dispersion using pairs of
prisms," Opt. Lett. 9, 150 (1984).
97. E. B. Treacy, "Optical Pulse Compression With Diffraction Gratings," IEEE J.
Quantum Electron. 5, 454–458 (1969).
98. R. H. Stolen and C. Lin, "Self-phase-modulation in silica optical fibers," Phys. Rev.
A 17, 1448–1453 (1978).

152
99. L. Fu and M. Gu, "Fibre-optic nonlinear optical microscopy and endoscopy.," J.
Microsc. 226, 195–206 (2007).
100. J. Knight, Photonic Crystal Fibres (2003), Vol. 424.
101. F. Helmchen, D. W. Tank, and W. Denk, "Enhanced two-photon excitation through
optical fiber by single-mode propagation in a large core," (2002).
102. L. Fu, X. Gan, and M. Gu, "Nonlinear optical microscopy based on double-clad
photonic crystal fibers," Opt. Express 13, 5528–5534 (2005).
103. L. Fu, A. Jain, H. Xie, C. Cranfield, and M. Gu, "Nonlinear optical endoscopy based
on a double-clad photonic crystal fiber and a MEMS mirror.," Opt. Express 14,
1027–32 (2006).
104. L. Fu, X. Gan, and M. Gu, "Nonlinear optical microscopy based on double-clad
photonic crystal fibers," Opt. Express 13, 5528–5534 (2005).
105. D. G. Ouzounov, K. D. Moll, M. a Foster, W. R. Zipfel, W. W. Webb, and A. L.
Gaeta, "Delivery of nanojoule femtosecond pulses through large-core
microstructured fibers.," Opt. Lett. 27, 1513–1515 (2002).
106. W. Göbel, A. Nimmerjahn, and F. Helmchen, "Distortion-free delivery of nanojoule
femtosecond pulses from a Ti:sapphire laser through a hollow-core photonic crystal
fiber.," Opt. Lett. 29, 1285–7 (2004).
107. K. Turner, S. Miller, and P. Hartwell, "Five parametric resonances in a

153
microelectromechanical system," Nature 396, 149–152 (1998).
108. H. Li, Z. Qiu, X. Duan, K. R. Oldham, K. Kurabayashi, and T. D. Wang, "2D
resonant microscanner for dual axes confocal fluorescence endomicroscope," Proc.
IEEE Int. Conf. Micro Electro Mech. Syst. 805–808 (2014).
109. M. Hafez, T. Sidler, and R.-P. Salathe, "Study of the beam path distortion profiles
generated by a two-axis tilt single-mirror laser scanner," Opt. Eng. 42, 1048 (2003).
110. W. Denk, J. H. Strickler, and W. W. Webb, "Two-photon laser scanning
fluorescence microscopy.," Science 248, 73–76 (1990).
111. R. H. Webb, "Optics for laser rasters.," Appl. Opt. 23, 3680 (1984).
112. W. Piyawattanametha, R. P. J. Barretto, T. H. Ko, B. a Flusberg, E. D. Cocker, H.
Ra, D. Lee, O. Solgaard, and M. J. Schnitzer, "Fast-scanning two-photon
fluorescence imaging based on a microelectromechanical systems two- dimensional
scanning mirror.," Opt. Lett. 31, 2018–20 (2006).
113. L. Fu, A. Jain, C. Cranfield, H. Xie, and M. Gu, "Three-dimensional nonlinear
optical endoscopy.," J. Biomed. Opt. 12, 40501 (2009).
114. W. Shahid, Z. Qiu, X. Duan, H. Li, T. D. Wang, and K. R. Oldham, "Modeling and
Simulation of a Parametrically Resonant Micromirror With Duty-Cycled
Excitation.," J. Microelectromech. Syst. 23, 1440–1453 (2014).
115. L. Ritsma, S. I. J. Ellenbroek, A. Zomer, H. J. Snippert, F. J. de Sauvage, B. D.
154
Simons, H. Clevers, and J. van Rheenen, "Intestinal crypt homeostasis revealed at
single-stem-cell level by in vivo live imaging.," Nature 507, 362–5 (2014).
116. R. Le Harzic, I. Riemann, M. Weinigel, K. König, and B. Messerschmidt, "Rigid
and high-numerical-aperture two-photon fluorescence endoscope.," Appl. Opt. 48,
3396–400 (2009).
117. D. M. Huland, C. M. Brown, S. S. Howard, D. G. Ouzounov, I. Pavlova, K. Wang,
D. R. Rivera, W. W. Webb, and C. Xu, "In vivo imaging of unstained tissues using
long gradient index lens multiphoton endoscopic systems.," Biomed. Opt. Express
3, 1077–85 (2012).
118. E. J. Botcherby, C. W. Smith, M. M. Kohl, D. Debarre, M. J. Booth, R. Juškaitis, O.
Paulsen, and T. Wilson, "Aberration-free three-dimensional multiphoton imaging of
neuronal activity at kHz rates.," Proc. Natl. Acad. Sci. U. S. A. 109, 2919–24 (2012).
119. P. Kim, E. Chung, H. Yamashita, K. E. Hung, A. Mizoguchi, R. Kucherlapati, D.
Fukumura, R. K. Jain, and S. H. Yun, "In vivo wide-area cellular imaging by side-
view endomicroscopy.," Nat. Methods 7, 303–5 (2010).
120. S. Tang, W. Jung, D. McCormick, T. Xie, J. Su, Y.-C. Ahn, B. J. Tromberg, and Z.
Chen, "Design and implementation of fiber-based multiphoton endoscopy with
microelectromechanical systems scanning," J. Biomed. Opt. 14, 34005 (2009).
121. T. Wang, Q. Li, P. Xiao, J. Ahn, Y. E. Kim, M. Kim, M. Song, E. Chung, W. K.
Chung, S. Kim, P. Kim, S. Myung, and K. H. Kim, "Gradient index lens based

155
combined two-photon microscopy and optical coherence tomography," 22, 12962–
12970 (2014).
122. S. Lee, J. Xie, and X. Chen, "Peptides and peptide hormones for molecular imaging
and disease diagnosis," Chem. Rev. 110, 3087–3111 (2010).
123. G. M. Thurber, M. M. Schmidt, and K. D. Wittrup, "Antibody tumor penetration:
Transport opposed by systemic and antigen-mediated clearance," Adv. Drug Deliv.
Rev. 60, 1421–1434 (2008).
124. C.-H. Wu, Y.-H. Kuo, R.-L. Hong, and H.-C. Wu, " -Enolase-binding peptide
enhances drug delivery efficiency and therapeutic efficacy against colorectal
cancer," Sci. Transl. Med. 7, 290ra91-290ra91 (2015).
125. D. Kang, R. W. Carruth, M. Kim, S. C. Schlachter, M. Shishkov, K. Woods, N.
Tabatabaei, T. Wu, and G. J. Tearney, "Endoscopic probe optics for spectrally
encoded confocal microscopy.," Biomed. Opt. Express 4, 1925–36 (2013).
126. H. Li, X. Duan, Z. Qiu, Q. Zhou, K. Kurabayashi, K. R. Oldham, and T. D. Wang,
"Integrated monolithic 3D MEMS scanner for switchable real time vertical /
horizontal cross- sectional imaging," Opt. Express 24, 462–471 (2016).
127. N. Barker, R. a Ridgway, J. H. van Es, M. van de Wetering, H. Begthel, M. van den
Born, E. Danenberg, A. R. Clarke, O. J. Sansom, and H. Clevers, "Crypt stem cells
as the cells-of-origin of intestinal cancer.," Nature 457, 608–11 (2009).

156
128. A. L. Polglase, W. J. McLaren, S. A. Skinner, R. Kiesslich, M. F. Neurath, and P.
M. Delaney, "A fluorescence confocal endomicroscope for in vivo microscopy of
the upper- and the lower-GI tract," Gastrointest. Endosc. 62, 686–695 (2005).
129. J. W. Jeong, M. J. Mandella, G. S. Kino, C. H. Contag, and O. Solgaard, "3-D
MEMS scanning system for dual-axis confocal microendoscopy," Int. Conf. Opt.
MEMS Nanophotonics 71–72 (2011).
130. M. Drobizhev, N. Makarov, S. Tillo, T. Hughes, and A. Rebane, "Two-photon
absorption properties of fluorescent proteins," Nat. Methods 8, 393–399 (2011).
131. T. Hinoi, M. Loda, and E. R. Fearon, "Silencing of CDX2 Expression in Colon
Cancer via a Dominant Repression Pathway," J. Biol. Chem. 278, 44608–44616
(2003).
132. E. K. Griffiths, O. Sanchez, P. Mill, C. Krawczyk, C. V Hojilla, E. Rubin, M. M.
Nau, R. Khokha, S. Lipkowitz, C.-C. Hui, and J. M. Penninger, "Cbl-3-deficient
mice exhibit normal epithelial development.," Mol. Cell. Biol. 23, 7708–7718
(2003).
133. H. Clevers, "The intestinal crypt, a prototype stem cell compartment," Cell 154,
274–284 (2013).
134. M. J. Koehler, T. Vogel, P. Elsner, K. K??nig, R. B??ckle, and M. Kaatz, "In vivo
measurement of the human epidermal thickness in different localizations by
multiphoton laser tomography," Ski. Res. Technol. 16, 259–264 (2010).

157
135. F. Helmchen, W. Go, W. Göbel, and B. M. Kampa, "Imaging cellular network
dynamics in three dimensions using fast 3D laser scanning.," Nat Methods 4, 73–79
(2007).
136. E. J. Botcherby, R. Juskaitis, M. J. Booth, and T. Wilson, "Aberration-free optical
refocusing in high numerical aperture microscopy," Opt. Lett. 32, 2007 (2007).
137. E. E. Hoover, M. D. Young, E. V Chandler, A. Luo, J. J. Field, K. E. Sheetz, A. W.
Sylvester, and J. a Squier, "Remote focusing for programmable multi-layer
differential multiphoton microscopy.," Biomed. Opt. Express 2, 113–22 (2010).
138. P. Rupprecht, A. Prendergast, C. Wyart, and R. W. Friedrich, "Remote z-scanning
with a macroscopic voice coil motor for fast 3D multiphoton laser scanning
microscopy," Biomed. Opt. Express 7, 1656 (2016).
139. A. D. Corbett, R. A. B. Burton, G. Bub, P. S. Salter, S. Tuohy, M. J. Booth, and T.
Wilson, "Quantifying distortions in two-photon remote focussing microscope
images using a volumetric calibration specimen," Front. Physiol. 5, (2014).
140. T. D. Wang, M. J. Mandella, C. H. Contag, and G. S. Kino, "Dual-axis confocal
microscope for high-resolution in vivo imaging.," Opt. Lett. 28, 414–6 (2003).