mendel university brno - agriculturaits.czu.cz · modelling irrigation water requirements at...
TRANSCRIPT
MENDEL UNIVERSITY BRNO
AGRICULTURATROPICA ET SUBTROPICA
VOLUME 49
PRAGUE 20161-4

Editorial Board
BEJCEK Vladimir, Faculty of Environmental Sciences, CULS Prague, Czech Republic BLAHOVEC Jiri, Faculty of Engineering, CULS Prague, Czech Republic HAVRLAND Bohumil, Faculty of Tropical AgriSciences, CULS Prague, Czech Republic HENSEL Oliver, Agricultural Engineering Group, University of Witzenhausen, Germany CHYSKY Jan, Faculty of Mechanical Engineering, Czech Technical University in Prague, Czech Republic ILLEK Josef, University of Veterinary and Pharmaceutical Sciences Brno, Czech Republic JELLEN Eric N., Brigham Young University, Provo, UT, USAKABAT Ladislav, Faculty of Social and Economic Sciences, Comenius University in Bratislava, Slovak Republic KAPILA Patrick Francis, University of Venda, South Africa KLIMA Miroslav, Crop Research Institute Prague, Czech Republic KOCISOVA Alica, University of Veterinary Medicine and Pharmacy in Košice, Slovak Republic KREPL Vladimir, Faculty of Tropical AgriSciences, CULS Prague, Czech Republic LOwENBERg-DEBOER Jess, Purdue University, West Lafayette, IN, USAMAROUNEK Milan, Institute of Animal Science, Prague-Uhříněves and Institute of Animal Physiology and Genetic AS, Czech Republic RAPISARDA Carmelo, Universita degli Studi di Catania, Italy SATO Shusuke, Tohoku University, Miyagi, JapanSOCH Miloslav, Faculty of Agriculture, University of South Bohemia, Ceske Budejovice, Czech Republic
EDITORIAL BOARD AND MANAgEMENT
Editor-in-Chief: BARANYIOVA Eva, Faculty of Tropical AgriSciences, CULS Prague, Czech Republic
Section Editors: BARANYIOVA Eva, Faculty of Tropical AgriSciences, CULS Prague, Czech Republic Section of Animal Production SISAK Ludek, Faculty of Forestry and Wood Sciences, CULS Prague, Czech Republic Section of Agroforestry SVATOSOVA Libuse, Faculty of Economics and Management, CULS Prague, Czech Republic Section of Economy FERNANDEZ Eloy, Faculty of Tropical AgriSciences, CULS Prague, Czech Republic Section of Plant Production KUMHALA Frantisek, Faculty of Engineering, CULS Prague, Czech Republic Section of Machinery
Managing Editor: LUKESOVA Daniela, Faculty of Tropical AgriSciences, CULS Prague, Czech Republic
Secretary: VLKOVA Vlasta, Faculty of Tropical AgriSciences, CULS Prague, Czech Republic
Technical assistance: PLACHY Michal, CULS Prague, Czech Republic

CONTENTS
Review Article
State Ownership of Land in Uzbekistan – an Impediment to Further Agricultural growth?Lea Melnikovová, Bohumil Havrland ������������������������������������������������������������������������������������������������������������������������������������� 5
Original Research ArticlesLaying Performance, Survival Rate, Egg Quality and Shell Characteristics in Laying PulletsOffered Honey in Drinking Water during Hot Season Monsuru Oladimeji Abioja, Maryam Oluwakemi Adekunle, John Adesanya Abiona,Olubunmi Grace Sodipe, Adebayo Vincent Jegede ��������������������������������������������������������������������������������������������������������������� 12
Modelling Irrigation water Requirements at Physiological growth Stages of Okra Life Cycle UsingCROPwAT Model for Derived Savannah and Humid Forest Zones of NigeriaOrevaOghene Aliku, Suarau Odutola Oshunsanya �������������������������������������������������������������������������������������������������������������� 20
Climate Variability and Livestock Production in Nigeria: Lessons for Sustainable Livestock Production Grace Zibah Rekwot, Anosike Francis Ugo, Oke-Egbodo Brenda Engo ������������������������������������������������������������������������������� 30
Performance Analysis of Small Scale Sweet Potato Farms in Oyo State, Nigeria Olayinka Isiaka Baruwa �������������������������������������������������������������������������������������������������������������������������������������������������������� 38
Technical Efficiency of Catfish Farming in Alimosho Local Government Area of Lagos State, Nigeria: a gender Perspective Oyinbo Oyakhilomen, Mohammed Olajide Murtala, Abraham Falola, Saleh Mamman Kwagyang ������������������������������������ 45
AGRICULTURA TROPICA ET SUBTROPICA VOL. 49 (1-4) 2016


INTRODUCTION
The agricultural sector in Uzbekistan is characterized by an extensive shift of resources from the Soviet model of collective agriculture to more market-oriented individual and family farming� The present paper aims to demonstrate how the state land ownership affects development of agriculture and to emphasize the importance of secure land rights of the new agricultural entities� It characterizes land tenure rights in Uzbekistan: how their definition and application supports or hampers the activities of Uzbek farmers� Another key factor affecting the production process in agriculture is the state interventions, especially the ongoing state quotas for crops�
The concept of state ownership of land has been, to some extent, acknowledged by many countries all over the world� In its extreme form, the state may own all or nearly all the land and allocate rights of access and use, development and transfer. In different cases, only areas of strategic importance or as a reserve right in case of future needs are reserved for state ownership (Prosterman and Hanstad, 1999)�
The concept of state land ownership is often a reaction to the presumptive and actual negative consequences
of unrestricted private ownership� However, there are limitations, e� g� the administrative system cannot always respond efficiently to changes in demand for land.
Land is a critical asset for economic growth, social development, and poverty reduction� It is the primary means for generating a livelihood for most of the Uzbek rural population� Land is the key determinant of economic activities in the rural sector and therefore the definition of land rights plays a crucial role in the development of rural society� The terms on which land is held, used and transferred have important consequences for economic growth, the distribution of wealth, and alleviation of poverty�
With more effective land distribution and engagement of an increasing number of households in agriculture and crop diversification, agricultural outputs have increased significantly since the 1990s. Large collective and state farms have been restructured and transformed into cooperative enterprises. However, they did not prove to be more efficient (Khalikov, 2013)� This process eventually resulted in the formation of smaller private farms which replaced most of the inefficient large enterprises, and the expansion of small household plots� Both have been main pillars of the growth of agricultural output in recent years� Over the years the three
5
DOI: 10.1515/ats-2016-0001 AGRICULTURA TROPICA ET SUBTROPICA, 49/1-4, 5-11, 2016
Review Article
State Ownership of Land in Uzbekistan – an Impediment to Further Agricultural growth?
Lea Melnikovová1, Bohumil Havrland2
1 Department of International Business, Metropolitan University Prague, Czech Republic2 Department of Sustainable Technologies, Faculty of Tropical AgriSciences, Czech University of Life Sciences, Prague, Czech Republic
Abstract
The present paper aims to demonstrate how the state land ownership affects development of agricultural sector in Uzbekistan, and what are its strengths and weaknesses� It highlights the importance of secure land right regardless of ownership� Land in Uzbekistan is state-owned; the exclusive state ownership of land was first incorporated in the 1992 Constitution. The official rationale was to ensure food security and social stability; another concern was the state-run irrigation system, operation of which would be hampered in the event of land privatization�Farming entities in Uzbekistan possess different rights to land: from long-life inheritable rights of the dehkans (small-scale household farms) to rights limited by 30 to 50 years and defined by lease contracts of the private farmers. The latter are monitored by the state and are subject to state interventions; in the first place they have to carry the burden of state quotas for cotton and wheat and they are obliged to sell these crops for state-dictated prices� Dehkans provide a major part of livestock production and they can, unlike private farmers, sell all their production at market prices� Land tenure rights in Uzbekistan lack certain qualities that would make land tenure rights meaningful� The duration of land rights is sufficient, however they do not assure the holders that rights will be recognized and enforced at low costs and do not provide them with mechanisms allowing adjustment under changing conditions.The authors conclude that the insufficient land tenure security, which is further undermined by state interventions, poses a significant barrier impeding development in the agricultural sector. The paper identifies opportunities for change arising from the gradual strengthening of market principles.
Keywords: dehkans; land tenure rights; private farmers; rural population; state control; state ownership of land�

forms of current agricultural entities have developed: private farms, dehkans working on small-scale household plots, and shirkats (former cooperative enterprises; only a few have remained)�
Not only the state retained exclusive land ownership, it also retained control over production of certain crops� Since cotton and wheat production is crucial for the state, the government wants to maintain its supervision� State ordered quotas for cotton and wheat, which are by far the two major crops grown in Uzbekistan, have to be fulfilled by most private farmers. Cotton is the most important cash crop, export revenues of which are significant, and wheat is of essential importance to maintain food security (Rustamova, 2013)�
Livestock production, just like horticulture, functions within the framework of a free market economy, and is dominated by dehkans� There are only a few government interventions in these sectors and the government does not provide any significant level of support (World Food Programme, 2008).
LAND TENURE CHARACTERISTICS
In order to assess the impact of state ownership of land, it is necessary to analyse legal framework, characteristics of land tenure in the country, and its consequences� To further determine whether or not the state ownership of land is an impediment to further agricultural growth, it is necessary to analyse land tenure security�
Land tenure can be generally defined as “the set of rules and relationship among people concerning the use, development, transfer and succession of rights to land. Land tenure rules define the rights held and duties owed concerning land by private and public actors, by individuals and by groups” (Prosterman et al�, 2009)� Land tenure arrangements may range from private to leasehold, community, group, shareholder, or other types of corporate rights�
Land tenure rights constitute one of the most basic and important institutions by which social and economic relations are conditioned� This is especially true in rural areas where land relations have profound implications for agricultural productivity, environmental sustainability, and the economic and social status of rural households (Prosterman and Hanstad, 1999). Land tenure rights refer to a bundle of rights that reflect agreement among people about how this asset is held, used, and exchanged� This includes the right “to occupy, enjoy and use; to restrict others from entry and use; to dispose, buy, or inherit; to develop or improve; to cultivate; to sublet; to realize financial benefits; and to access services in association with land” (USAID, 2007)�
Land tenure security refers to the right of individuals or groups to effective protection by a central authority (the government) against any forcible evictions� Land tenure security is an element of property rights: the right to remain
on land, and make use of and profit from it (Prosterman et al., 2009)� Secure land rights are of crucial importance because they substantially affect rural development and subsequently economic development as a whole� Land tenure security can be measured and defined in a variety of ways. A definition by Deininger (2003) contains several key concepts:
“Land tenure security exists when an individual or group is confident that they have rights to a piece of land on a long-term basis, protected from dispossession by outside sources, and with the ability to reap the benefits of labour and capital invested in the land, whether through direct use or upon transfer to another holder.”
The key characteristics are “confident”, “long-term”, “protected” and “ability to reap”. Land tenure security can be therefore assessed using three important measures: breadth, duration and assurance (Deininger, 2003)�
Breadth refers to the quantity and quality of the land rights (rights to possess land, to grow or/and harvest crops, to pass rights to heirs, to sell land, to lease land to others, to use land rights as collateral or to build structures)� An important aspect of breadth involves transferability of land rights� Market transfers typically include selling or sub-leasing of rights, non-market transfers include passing them to heirs� The marketability of land is an important moment: once it becomes marketable, it can be efficiently allocated from less productive to more productive users� Marketable land can be also used as collateral for credits� Duration refers to the period for which land rights are valid. As one of the main effects of secure property rights to land is to increase incentives for investment, the duration needs at least to match the time frame during which returns from possible investments may accrue� Longer duration implies greater tenure security� Assurance tells us the level of certainty of the breadth and duration of the land tenure rights. If the rights of a specific breadth and duration are difficult to exert or enforce, the assurance is low and such right is not a meaningful right�
Legal FrameworkAfter 1991, the exclusive state ownership of land was first
incorporated in the 1992 Constitution and subsequently in the Land Code, adopted in 1998� The legal foundation for all land tenure in Uzbekistan is contained in three key documents: the Constitution (Article 55), the Land Code (Head 4), and the Civil Code (Head 8, Head 13 and Head 17)�
The Land code stipulates that land is a state-owned national treasure, it is subject to rational use and it is protected by the state as a base of life, activities and welfare of the population (Land Code of the Republic of Uzbekistan, Head 4, article 16, 1998)�
Lifelong inheritable land tenure is possible in the following cases and it includes Uzbek citizens only: dehkan farms, individual homestead construction and household operation, and collective orchards and vineyards (Land Code of the
6
AGRICULTURA TROPICA ET SUBTROPICA VOL. 49 (1-4) 2016

Republic of Uzbekistan, Head 4, article 19, 1998)�Land plots can be provided to legal and physical entities
for a continuous, long-term or temporary tenure and use� Continuous land use envisages, first of all, agricultural production and forestry (Land Code of the Republic of Uzbekistan, Head 4, article 20, 1998)�
Land plots are given on lease to citizens and legal entities by hokims (mayors) of districts and cities; however, if any foreign element is involved, the contracting authority is the government of Uzbekistan (Land Code of the Republic of Uzbekistan, Head 4, article 24� 1998)� Users pay for the use of the land in the form of land tax�
It is not permitted to sublease the leased land plot as a whole or even part of it (Land Code of the Republic of Uzbekistan, Head 4, article 24, 1998)� This is quite a controversial provision since the common practice is to let the land after the harvest to be cultivated by a dehkan family for a prearranged payment either in cash or crop� This provision further says that leased land plots cannot be sold and purchased, cannot serve as collateral, and cannot be donated or exchanged. A specific form of subleasing, “intrafarm leasing”, is permitted only to worker families within a shirkat (Lerman, 2008)�
Nowadays, the tenure structure of private farms remains leasehold� Land is leased for a minimum of 10 years, usually for a period of not less than 30 years and not more than 50 years (Law on Farms, 1998)� Apart from the above mentioned state interventions, i�e� quotas for cotton and wheat, private farms are at mercy of local authorities (hokimiyat) – lease contracts can be cancelled for various transgressions, usually if the leaseholder fails to comply with the contract terms such as the cropping plan (Wehrheim et al�, 2008)�
Dehkan farms are rural household producers operating on small household plots received on lifetime inheritable tenure rights� They can function as both physical and legal entities (Law on Dehkans, Head 1, article 1, 1998)� Dehkan farms are the smallest of the three entities but the most numerous and very important� They satisfy basic needs of the large rural population – food, income (their surpluses are sold in the city and dehkan markets) and employment� Dehkan farms tend to specialize in vegetables, fruit and they are crucial for livestock production, they produce vast majority of meat, milk, eggs and other animal related products� Dehkans often work for private farmers – for cash or on the basis of a sharecropping agreement (dehkans receive a percentage of the yield) (Veldwisch and Spoor, 2008)�
Official Rationale for State Land OwnershipLand is the only productive asset that cannot be owned
privately. The official rationale against privatization of land included several concerns (Saidakbarov, 2013):
1� Food security� To secure enough food for such large population with limited land resources, agricultural production has to be well organized and no land speculations
and accumulation of large tracts in the hands of absentee owners should take place�
2� Social stability� Stable agricultural sector secures stability in rural society�
3� Cultivation in Uzbekistan is totally dependent on irrigation, which is delivered by a state-run irrigation system�
The key question, whether the state ownership system in Uzbekistan impedes further development and under what conditions, will be discussed in detail�
wEAKNESSES OF THE CURRENT LAND TENURE MODEL
Land tenure rights in Uzbekistan lack a few qualities that make land tenure rights meaningful� Land rights should be of sufficient duration to provide incentives for investment, they should assure the holder that rights will be recognized and enforced at low costs and provided with mechanisms allowing adjustment under changing conditions�
Agricultural enterprises in Uzbekistan possess different levels of land rights security: dehkans have an obviously better position thanks to their lifelong lease rights so they tend to invest more into their plots� The position of private farmers, on the other hand, is not as secure; land tenure security in their case lacks some key aspects� The length of their lease contract is sufficient; however, the assurance to prevent outside interference is rather low� The farmer’s lease contract can be terminated in case of violations of the lease contract, low effectivity of production or non-compliance of the state quotas for crops� Another burning problem is the transferability of rights� Land rights are inheritable only in the case of dehkans, but otherwise they are not transferable – neither market nor non-market transfers are permitted� The users (agricultural entities) cannot flexibly adjust the size of their leased land when they need it� They cannot easily acquire more land, if they want to expand their production, from a less efficient farmer or a farmer who does not need the whole area he or she disposes of� Removing restraints on transfer of land would enable more efficient producers to obtain more land from those who are less efficient, without any administrative obstructions.
Under circumstances described above, land markets cannot fully function� Absence of land markets where individual agricultural entities would trade their lands is a serious barrier to improving the efficiency of agriculture and economy as a whole.
Factors weakening Land Tenure SecurityLand rights in Uzbekistan, as described above, do not
provide the farmers with sufficient level of assurance and cannot be transferred� Land tenure security is further weakened by state interventions�There are two particularities in the Uzbek agricultural sector; the first one is a permanent phenomenon and the other one took place in the not so remote
7
AGRICULTURA TROPICA ET SUBTROPICA VOL. 49 (1-4) 2016

past� First, it is a continuing process of state quotas when state dictates what private farmers should grow on their fields.Rights associated with land have to correspond with the state endeavour to keep this system going� Second, an intervention that significantly changed the private farmers’ sector was the consolidation of farms (the so-called “optimization”), which took place in three rounds between 2008 and 2010�
State QuotasState ordered quotas determine the organization of
production and mutual relationship between private farms and processing enterprises� As mentioned above, farmers are obliged to meet quotas set by the state for cotton and wheat� If the farmers fail to comply, they can be deprived of their lease contract and therefore lose rights to land (Wehrheim et al�, 2008)� The state keeps controlling not only the quantities produced but also the sown area� The production is being bought up by the state for low, state-dictated prices� The dual price system is typical for Uzbek agricultural system: production depending on its character (kind of crop) is sold either for state-set low prices (cotton and wheat) or for market prices (commercial crops such as rice, vegetables, fruits etc� or wheat surplus) (Khushmatov, 2013; Veldwisch and Spoor, 2008)�The state, on the other hand, provides material support to the farmers� These resources and services constitute of fertilizers, seeds, fuel and tractors rental at preferential prices� Farmers are also entitled to buy fuel at subsidized prices� For agricultural machinery the farmers are largely dependent on the state-owned “Motor Tractor Parks” which prioritize production of state-ordered crops (Pulatova, 2013)� Some of the Motor Tractor Parks are run by farmers themselves (Khushmatov, 2013)�
During the cultivation period of the state-ordered crops, the cropping area is monitored by the state through regular controls to make sure that the field is sown under the appropriate crop, that fertilizers are applied in time and specifically used on the designated field and not elsewhere, and that the whole process is running according to directions (Trevisani, 2007)�
Wheat producers are better off; the farmers are allowed to market, process or use as fodder 50% of their wheat production� However, in the case of cotton, even the surplus goes to the same processing enterprise (Khushmatov, 2013)�
The discussion whether the state quotas should be abolished or kept and adjusted is principal� If the quotas get abolished, the farmers’ situation can rapidly change and therefore such step has to be carefully considered� Many farmers are dependent on subsidized rental of agricultural machinery, on supplies of fertilizers and seeds, and on special credits for cotton production. Without this “initial capital” their farm might face enormous financial difficulties.
Another concern is the specialization of production� Would such release of the existing mechanisms lead to a rapid change in production specialization, which would have consequences
for farmers’ welfare, food security and irrigation requirements of the country? From the authors’ point of view, abandoning of the state order system should be gradual and careful to mitigate negative impacts on producers, and introducing a well-functioning micro-financing scheme would be necessary. The initial phase might involve a simple solution: to fix only the required quantity of production, not the area sown under cotton or wheat� The crucial criterion would be the output, not the sown area� This would serve as an incentive for the farmers to increase the yields and it could lead to increased productivity� Abandoning of the state order system should be gradual to not cause a rapid change in cropping patterns�
If the quota and price liberalization gets implemented, shifts from wheat to cotton production can be expected (a reverse of what happened in the early 1990s)� The reason is competitive imports of wheat (e�g�, from Kazakhstan) and also the competitiveness of cotton on international markets� It is also the physical conditions of Uzbekistan that give a comparative advantage in growing cotton� This would impact water management as well – cotton is more water intensive than wheat, completely dependent on irrigation� This would probably lead to higher water consumption, which is a scarce resource in Uzbekistan� Introducing volumetric pricing of water, may, however, mitigate such consequence�
Farm OptimizationThe consolidation of farms which took place between 2008
and 2010 proved that farmers’ land rights can be difficult to exert. The so-called “farm optimization” took place between 2008 and 2010 on an involuntary basis� Some of the smaller farms merged with others and the total number of farms in Uzbekistan therefore decreased�
The preceding stages of farm restructuring involved dismantling of large-scale farms, sovkhozes and kolkhozes, and subsequent fragmenting shirkats into smaller private farms� Farms have been successfully established since 1998 and, in general, they have proved to be more efficient than the existing shirkats� However, in 2008 the state initiated a reverse land reform� Farm sizes were subject to adjusting in order to suit better the existent infrastructure (which had not changed much)� A major challenge was the irrigation system because the network was aimed at large-scale farms� This new reforming procedure consisted in consolidating the smaller private farms into larger private farm units: particularly cotton and wheat farmers with land size under 30 ha were requested to give up their land (Djanibekov et al�, 2012)� This process was called the “optimization of farms”.
Moreover, some of the farms had been facing difficulties, especially financial. They had taken credits and many of them were not able to comply with the credit terms and conditions� These farms were struggling and the state took measures to eliminate them (Pulatova, 2013)�
8
AGRICULTURA TROPICA ET SUBTROPICA VOL. 49 (1-4) 2016

The process triggered by the Decree “On Optimization of Cropping Areas and Enhancing Food Crop Production” and “Instruction on Constitution of a Special Committee in Charge of Developing Proposals for Optimization of Farm Plots” issued by the President of the Republic of Uzbekistan in October 2008� The key objective of the decree was to consolidate a large number of existing small (less than 10 ha) leasehold farms into sustainable (around 50 ha) agricultural enterprises and to improve the efficiency of irrigation (MAWR, 2009)� In particular, cotton and wheat farmers with holdings of less than 30 ha were requested to give their farmlands back to the state� Subsequently, the returned lands were leased back to larger private farms� At the same time, the minimum size for cotton and wheat farms increased from 10 to 30 ha and the minimum size for other types of farms (horticultural, gardening) from 1 to 5 ha (Djanibekov, 2012)� The average size of cotton and wheat growing farms after the consolidation is 105 ha (Khushmatov, 2013)�
Optimization of the size of a land plot owned by a farm is construed in the regulations as change of the land size for more rational use of land and water resources and ensuring financial stability of the farm. In practice, it meant termination of lease contracts and resulted in a substantial decrease in the number of farms: from 215�776 in 2008 to 66�134 in 2010 (TGAU, 2014)�
This reform’s aim was to strengthen the farm households by drawing small farmlands under one holder� Obviously, a potential of dwarf size farms cannot go far beyond providing subsistence for farmers� As farmers remain uncontrollable, they also hamper the promotion of long-term plans of the government, negatively influencing a mass production of agricultural products (“Ferghana” News Agency, 2008).
The above mentioned regulations established the order of land optimization on a voluntary basis, the order of land optimization and liquidation of the farming entity on the ground of a violation of contract and inefficient activity of the farm� The regulation also prescribes the mechanism of debt amortization of the defunct farms�Voluntary liquidation shall be performed according to the Resolution of the President of Uzbekistan number PP-630 dated 27th of April 2007 “On Development of the Procedure of Voluntary Liquidation and Cessation of Activity of Entrepreneurial Entities” (Azizov and Partners, 2013)�
However, during optimization, legal problems occurred and many farmers complained about the process� The president therefore issued a decree “On measures on Compliance with Law and Order during Re-organization and Optimization of Farm Plots” in April 2011. It is stated that without any exceptions, all questions regarding the farm plots must be arbitrated only (Uznews�net ,2011)�
The selection of famers receiving the enlarged farms was not always clear. Officially the most successful farmers were chosen according to their results in the past� But this fact is
arguable since socio-political connections have always played an important role in the economy – a fact emphasized by many authors (Trevisani 2007; Veldwisch and Spoor 2008; Djanibekov 2012)�
Moreover, increasing productivity thanks to economies of scale is a debatable issue as international experience indicates� It shows that there is little empirical evidence of the existence of economies of scale in farming (Brooks et al� 1996; Hanstad 1998; Lerman 2008)� Brooks et al� (1996) claim that the common view in most post-Soviet countries is that large farms are more efficient and competitive than small or mid-sized farms and the main argument is the presumed existence of economies of scale� They state that this assertion has not been confronted with empirical evidence on farm size and efficiency from around the world. Djanibekov (2012) argues that the land consolidations as implemented since 2008 will have limited effect. He claims that increasing the farm size alone will provide insufficient incentives for creating economically efficient farm enterprises. He supports this assertion by detailed evidence of the process of land reform in the Khorezm province in northwest Uzbekistan, which mirrors the nationwide farm restructuring processes�
Due to lack of statistical data, it is not possible to evaluate whether or not the optimization of farms in Uzbekistan achieved expected results�
Results of the Current Model of State Ownership of LandUzbekistan has promoted state ownership of land with
supporting arguments of food security thanks to change in cropping patterns and limiting speculations with land, and social stability� Another argument is the state-run irrigation system� Privatization of land would bring complications in operating of the current irrigation network. These official goals have been fulfilled. The goal of food security was ensured thanks to the state order system� Since the early 1990s, the state has been taking measures to secure the rapidly growing population with food� The most important step was the change in cropping patterns where vast areas sown under cotton were sown with wheat to ensure food security of the population� The result of these measures was an expansion of the winter wheat area from 620�000 ha in 1991 to 750�000 ha in 1996 with a respective decline in the area sown with cotton; wheat production increased substantially, from 1 million tonnes in 1991 to 5�2 million tonnes in 2004 (Abdullaev et al�, 2009)�Complex evaluation of social stability is, however, hampered by lack of data� The current model of land ownership also facilitates operating of the state-owned and state-run irrigation network� On the other hand, state ownership of land is also a tool to control the agricultural sector� State interventions are typical for Uzbekistan� The current situation in the agricultural sector is characterized by gradual reforms that are supposed to liberalize the economic environment and introduce market principles� In fact, state control persists, and
9
AGRICULTURA TROPICA ET SUBTROPICA VOL. 49 (1-4) 2016

although agricultural production is mainly in private hands, many aspects are still under state regulation, such as crop production or water allocation�
The previous analysis shows that a major barrier in further development of the agricultural sector lies in the insufficient land tenure security. To summarize the effects of secure land rights on economic development, the following benefits can be identified:•Crop productivity rises through increased investment in land�•Land can be transferred from less efficient to more efficient
land users (farmers)� •Access to credit is facilitated thanks to the possibility of
using land or land rights as collateral�•Farmers invest more into measures to reduce soil erosion,
soil salinization and other land degradation; they try to keep it in good conditions for the following years�
•Favourable conditions for farmers also create a stable social environment and strengthen political stability�
•Migration from rural to urban areas is reduced thanks to increased attractiveness of agricultural activities�It is debatable whether private ownership of land is non-
essential for agricultural development� China represents an example of a country that has maintained state land ownership and at the same time has experienced agricultural growth� Chinese agricultural success showed that private ownership of land is not a prerequisite for a strong supply response to reform (Lin, 1992; Zhu and Prosterman, 2009; Zhao, 2011)� In Russia, land was privatized but the outcome in the 1990s was similar (and disappointing) to the one in Uzbekistan�1
The Chinese success demonstrated what was done to improve rural population’s livelihood – especially what was done in the early stages of reforms where even a little land tenure security dramatically improved the lives of hundreds of millions of people� China has already released state quotas for crops and increasing the level of security of land rights proved that such efforts can help to achieve a significant improvement to the life standard of the rural population� Zhao (2011) predicts that further development of land reforms might include an explicit perpetual use rights to the contracted land�
CONCLUSION
Many experts perceive the state and ownership as a major obstacle in successful economic development� However, the advantages of privatization of land are often overestimated� It
could lead to the situation that existed before 1917; landlords and tenants may re-emerge� This could lead to poverty of many of the rural workers and the rural sector would lose its stability� Private ownership of land may lead to more economically efficient use of land but it often excludes the poor� People with better relations to the local administration would very likely have preferential conditions and would be able to buy land at lower prices or more easily� Under the state ownership of land, the rural population is protected (more or less) from exploitation� On the other hand they are exposed to vagaries of local or regional state officers.
The choice to privatize land or not was affected by historical and legal legacies of landownership in the former socialist countries� Without a history of private land rights, in Uzbekistan, where no such tradition existed, the state did not take land rights from households that were farming individually, but the land was transferred from collective ownership to the state� As Swinnen and Rozelle (2006) point out, the absence of a tradition in private farming was reinforced by decades of collectivization�
State ownership can indeed be a great impediment to development of the agricultural sector� However, the state ownership itself is not the main hurdle if it does not restrict economic activities of the farmers� State ownership may lead to flourishing bureaucracy and corruption practices, but it facilitates equal access and distribution of land� The authors conclude that the major barrier impeding development in the agricultural sector lies in misusing the state power, manifesting itself in the insufficient land tenure security, which is further undermined by state interventions� Their gradual releasing and introducing market principles would be beneficial for farmers since they would gain more freedom in decision making and could maximize their profits.
REFERENCES
Abdullaev I�, DeFraiture C�, Giordano M�, Yakubov M�, Rasulov A� (2009): Agricultural Water Use and Trade in Uzbekistan: Situation and Potential Impacts of Market Liberalization� Water Resources Development 25(1): 47-63�
Azizov & Partners (2013): Available at http://www�azizovpartners�uz/index�php/ru/news: Accessed 2014-04-23�
Brooks K�, Krylatykh E�, Lerman Z�, Petrikov A�, Uzun V� (1996): Agricultural Reform in Russia: A View from the Farm Level� World Bank Discussion Papers 327� The World Bank, Washington, D�C�
Civil Code of the Republic of Uzbekistan (1996): as last amended by the Law of the Republic Uzbekistan no� 355 of October 7, 2013�
Constitution of the Republic of Uzbekistan (1992): as last amended by the Law of the Republic Uzbekistan no� 366 of April 16, 2014�
10
AGRICULTURA TROPICA ET SUBTROPICA VOL. 49 (1-4) 2016
1 Lerman (2001) claims that privatization of land in Russia did not result in transfer of direct control to individuals, and most land privatized by the state got in the hands of large-scale successors of former collective farms. As a consequence, the anticipated benefits of privatization could not be fully realized�

Deininger K� (2003): Land Policies for Growth and Poverty Reduction� A World Bank Policy Research Report� Washington, DC: World Bank�
Djanibekov N�, Van Assche K�, Bobojonov I�, Lamers J�P�A� (2012): Farm Restructuring and Land Consolidation in Uzbekistan: New Farms with Old Barriers� Europe-Asia Studies 64(6): 1101-1126�
Ferghana News Agency (2008): Uzbekistan: Farmers are against land reforms� Available at http://enews�fergananews�com/articles/2476: Accessed 2013-02-23�
Hanstad T� (1998): Are Smaller Farms Appropriate for Former Soviet Republics? RDI Reports on Foreign Aid and Development ’97� Seattle WA: Rural Development Institute�
Land Code (1998): as last amended by the Law of the Republic Uzbekistan no� 365 of January 20, 2014�
Law on Dehkan Farms (1998): as last amended by the Law of the Republic Uzbekistan no� 355 of October 7, 2013�
Law on Farms (1998): new redaction 2004; as last amended by the Law of the Republic Uzbekistan no� 355 of October 7, 2013�
Lerman Z� (2008): Agricultural Development in Uzbekistan: The Effect of Ongoing Reforms. Discussion Paper No. 7.08. Hebrew University of Jerusalem� Department of Agricultural Economics and Management�
Lin Y�J� (1992): Rural Reforms and Agricultural Growth in China� The American Economic Review 82(1): 34-51�
Ministry of Agriculture and Water Resources (MAWR) (2009): Ferghana Valley Water Resources Management Project – Phase 1. Resettlement Policy Framework and Specific Resettlement Action Plan� Available at http://goo�gl/7FFAuE: Accessed 2013-07-04�
Prosterman R�, Hanstad T� (1999): Legal Impediments to effective rural land relations in Eastern Europe and Central Asia: a comparative assessment� Washington, DC: World Bank�
Prosterman R�, Mitchell R�, Hanstad T� (2009): One Billion
Rising: Law, Land and the Alleviation of Global Poverty� Amsterdam: Leiden University Press, 455 p�
Swinnen J�F�M�, Rozelle S� (2006): From Marx and Mao to the Market: The Economics and Politics of Agricultural Transition� New York: Oxford University Press Inc� 218 p�
Trevisani T� (2007): After the Kolkhoz: rural elites in competition� Central Asian Survey 26(1): 85-104�
USAID (2007): Land Tenure and Property Rights� Volume I� Framework� Available at http://usaidlandtenure�net/sites/default/files/USAID_Land_Tenure_Framework_Tool_0�pdf: Accessed 2014-07-22�
Uznews�net (2011): Minsel’ vodhoz Uzbekistana protiv “Parizhskoj kommuny”. Available at http://fermerville�ru/minselvodhoz-uzbekistana-protiv-parizhskoj-kommuny: Accessed 2015-01-05 (the original resource Uznews�net does not exist any more)�
Veldwisch G�J�A�, Spoor M� (2008): Contesting Rural Resources: Emerging ‘Forms’ of Agrarian Production in Uzbekistan� Journal of Peasant Studies 35(3): 424-451�
Wehrheim P�, Schoeller-Schletter A�, Martius C� (2008): Continuity and change: land and water use reforms in rural Uzbekistan: socio-economic and legal analyses for the region Khorezm� Halle/Saale: Leibnitz-Institut für Agrarentwicklung in Mittel- und Osteuropa (IAMO)� 203 p�
World Food Programme (2008): Poverty and Food Security in Uzbekistan� Available at http://documents�wfp�org/stellent/groups/public/documents/ena/wfp179011�pdf: Accessed 2014-07-02�
Zhao Y� (2011): China’s land tenure reform: Time for a new direction? China Review 11(2): 125-151�
Zhu K�, Prosterman R� (2009): Securing Land Rights for Chinese Farmers: A Leap Forward for Stability and Growth� Yale Economic Review 5(2): 15-16, 18-21�
Received: November 6, 2015 Accepted after revisions: June 21, 2016
11
AGRICULTURA TROPICA ET SUBTROPICA VOL. 49 (1-4) 2016
Interviews were held with the following experts (2013): Tashkent State Agrarian University: Mr Kh� Saidakbarov (Head of Department of Agricultural Economics, associate
professor), Ms R� Pulatova (Head of Department of Farm Management, professor), Ms I� Rustamova (Department of Agricultural Economics, associate professor), Mr S� Khalikov (Department of Agricultural Economics, associate professor)�
Institute of Market Reforms in Agriculture, Tashkent: Mr N� Khushmatov (Head)
Corresponding author:
Lea Melnikovová, Ph.D.Metropolitní univerzita Praha, o.p.s.Prokopova 100/16130 00 Praha 3Phone: 732 104 532E-mail: lea�melnikovova@mup�cz

INTRODUCTION
High ambient temperature commonly experienced in poultry houses, in the tropical zones and sometimes during summer in the temperate regions, elicits a series of responses in laying pullets generally termed heat stress (Ayo et al�, 2011)� Heat stress (HS) causes drastic reduction in egg production, size and quality (Al-Saffar and Rose, 2002), and may be lethal if not controlled (Lara and Rostagno, 2013). Heat-stressed layer birds in a flock respond to the condition by first laying eggs with reduced size, followed by fewer number of eggs laid and later thin-shelled and/or shell-less eggs (Grieve, 2003)� Production of thin-shelled eggs results from acid-base perturbations in the blood (respiratory alkalosis) of heat-stressed laying pullets� High blood pH reduces the amount of ionized calcium in the blood� Shell gland in chickens utilizes ionized calcium in secreting egg shell which when in short supply leads to soft eggs� Increasing dietary calcium intake does not correct this problem� This poses a major challenge to poultry production globally�
The onslaught of HS on poultry production is further aggravated as the evidences of climate change with the resultant global warming are becoming more pronounced� Intergovernmental Panel on Climate Change in the Fourth Assessment Report (IPCC, 2007) concluded that besides
other things, the surface air warming in the 21st century by best estimate will range from 1�1 to 2�9 oC for a low scenario and of 2�4 to 6�4 oC for a high scenario (Nardone et al�, 2010)� Hisas (2011) stated that by 2020, the temperature of the planet would increase by, at least, 2�4 oC above pre-industrial times, going by current business-as-usual path� Climate change is advancing much faster than anticipated� ctic Any procedure that will arrest further increment in global greenhouse gases (GHGs) must be followed�
Most poultry farmers make use of commercial and synthetic anti-stress and anti-oxidants to help chickens cope with HS� Alternatives to the use of chemicals such as anti-stress, anti-oxidants and antibiotics lie in discovery and proper utilization of natural plant materials and extracts that have the properties needed (Bedford, 2000; Wenk, 2003; Vidanarachchi et al�, 2005; Ramnath et al�, 2008; Zhang et al., 2009; Ali et al., 2010). Various efforts had been geared towards exploration of these materials� One of the promising sources of natural anti-stress/anti-oxidant is honey (Estevinho et al�, 2008; Mohamed et al�, 2002; Gheldof et al�, 2003; Aljadi and Kamaruddin, 2004; Wasagu et al�, 2013)� In human beings, honey has been used as antibacterial (Adetuyi et al�, 2009; Omafuvbe and Akanbi, 2009), antioxidant (Aljadi and Kamaruddin, 2004) and in semen diluents (Oyelowo et al�, 2014)� It is a thick, viscous and sweet liquid made by bees from the nectar of
12
DOI: 10.1515/ats-2016-0002 AGRICULTURA TROPICA ET SUBTROPICA, 49/1-4, 12-19, 2016
Original Research Article
Laying Performance, Survival Rate, Egg Quality and Shell Characteristics in Laying Pullets Offered Honey in Drinking Water during Hot Season
Monsuru Oladimeji Abioja1, Maryam Oluwakemi Adekunle1, John Adesanya Abiona1,Olubunmi Grace Sodipe1, Adebayo Vincent Jegede2
1Department of Animal Physiology; 2Department of Animal Nutrition, College of Animal Science and Livestock Production, Federal University of Agriculture, PMB 2240 Abeokuta, Nigeria
Abstract
Egg production, survival, egg quality and shell characteristics in laying pullets offered honey in drinking water during hot season were determined using hens (28-week-old, n = 120) allotted to either 0 (CONTROL), 10 (10H) or 20 ml honey/L water (20H) for 16 weeks divided into 4 phases of 4 weeks each� Data on hen-day production (EP), egg weight (EW), length (EL), breadth (EB), shape index (ESI),yolk weight (YW), yolk percentage (YP), albumen height (AH), albumen weight (AW), albumen percentage (AP), Haugh unit (HU), shell weight (SW), shell percentage (SP), shell thickness (ST) and survival (SR) were subjected to ANOVA� EP was significantly (P < 0.001) affected by treatment during phases 1-4. 20H resulted in higher EP than CONTROL in phase 1� In phase 2, EP was similar in CONTROL and 20H, but 10H was lower than the two� Higher EPs were recorded in CONTROL than in honey groups (phases 3, 4). EW was significantly (P < 0.01) affected by honey in week 1 only. Birds on 10H laid heavier eggs than CONTROL. 10H hens laid significantly longer (P < 0�001) eggs with higher (P = 0�008) ESI than control hens while 20H birds had significantly lower values of AH (P < 0�01), AP (P = 0�05) and HU (P = 0�05)� Honey had no significant (P > 0.05) effect on EB, YW, YP, AW, SW, SP and SR, but improved (P < 0.05) ST in the first 2 phases. To ensure improvement in egg production and egg shell thickness in laying pullets during hot season, honey at 20 ml/L water can be offered for 4 weeks.
Keywords: egg; heat stress; phyto-chemical; anti-oxidant; climate change; global warming�
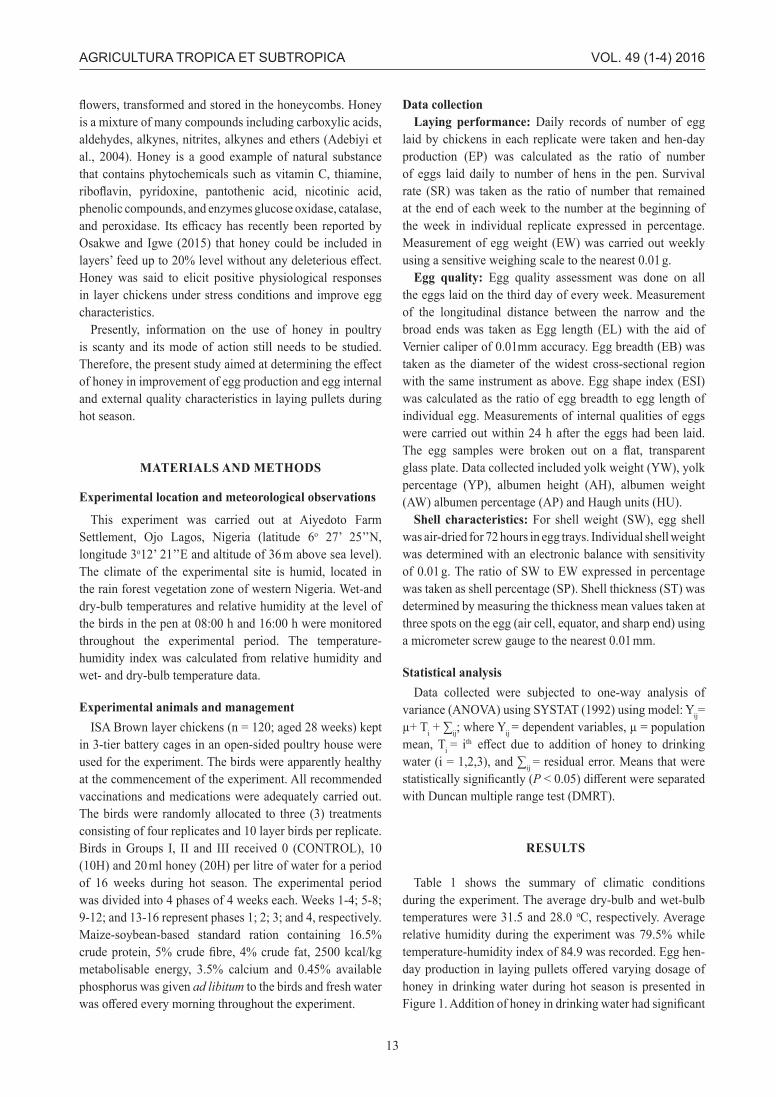
flowers, transformed and stored in the honeycombs. Honey is a mixture of many compounds including carboxylic acids, aldehydes, alkynes, nitrites, alkynes and ethers (Adebiyi et al�, 2004)� Honey is a good example of natural substance that contains phytochemicals such as vitamin C, thiamine, riboflavin, pyridoxine, pantothenic acid, nicotinic acid, phenolic compounds, and enzymes glucose oxidase, catalase, and peroxidase. Its efficacy has recently been reported by Osakwe and Igwe (2015) that honey could be included in layers’ feed up to 20% level without any deleterious effect. Honey was said to elicit positive physiological responses in layer chickens under stress conditions and improve egg characteristics�
Presently, information on the use of honey in poultry is scanty and its mode of action still needs to be studied� Therefore, the present study aimed at determining the effect of honey in improvement of egg production and egg internal and external quality characteristics in laying pullets during hot season�
MATERIALS AND METHODS
Experimental location and meteorological observations
This experiment was carried out at Aiyedoto Farm Settlement, Ojo Lagos, Nigeria (latitude 6o 27’ 25’’N, longitude 3o12’ 21’’E and altitude of 36 m above sea level)� The climate of the experimental site is humid, located in the rain forest vegetation zone of western Nigeria� Wet-and dry-bulb temperatures and relative humidity at the level of the birds in the pen at 08:00 h and 16:00 h were monitored throughout the experimental period� The temperature-humidity index was calculated from relative humidity and wet- and dry-bulb temperature data�
Experimental animals and managementISA Brown layer chickens (n = 120; aged 28 weeks) kept
in 3-tier battery cages in an open-sided poultry house were used for the experiment� The birds were apparently healthy at the commencement of the experiment� All recommended vaccinations and medications were adequately carried out� The birds were randomly allocated to three (3) treatments consisting of four replicates and 10 layer birds per replicate� Birds in Groups I, II and III received 0 (CONTROL), 10 (10H) and 20 ml honey (20H) per litre of water for a period of 16 weeks during hot season� The experimental period was divided into 4 phases of 4 weeks each� Weeks 1-4; 5-8; 9-12; and 13-16 represent phases 1; 2; 3; and 4, respectively� Maize-soybean-based standard ration containing 16�5% crude protein, 5% crude fibre, 4% crude fat, 2500 kcal/kg metabolisable energy, 3�5% calcium and 0�45% available phosphorus was given ad libitum to the birds and fresh water was offered every morning throughout the experiment.
Data collectionLaying performance: Daily records of number of egg
laid by chickens in each replicate were taken and hen-day production (EP) was calculated as the ratio of number of eggs laid daily to number of hens in the pen� Survival rate (SR) was taken as the ratio of number that remained at the end of each week to the number at the beginning of the week in individual replicate expressed in percentage� Measurement of egg weight (EW) was carried out weekly using a sensitive weighing scale to the nearest 0�01 g�
Egg quality: Egg quality assessment was done on all the eggs laid on the third day of every week� Measurement of the longitudinal distance between the narrow and the broad ends was taken as Egg length (EL) with the aid of Vernier caliper of 0�01mm accuracy� Egg breadth (EB) was taken as the diameter of the widest cross-sectional region with the same instrument as above� Egg shape index (ESI) was calculated as the ratio of egg breadth to egg length of individual egg� Measurements of internal qualities of eggs were carried out within 24 h after the eggs had been laid� The egg samples were broken out on a flat, transparent glass plate� Data collected included yolk weight (YW), yolk percentage (YP), albumen height (AH), albumen weight (AW) albumen percentage (AP) and Haugh units (HU)�
Shell characteristics: For shell weight (SW), egg shell was air-dried for 72 hours in egg trays� Individual shell weight was determined with an electronic balance with sensitivity of 0�01 g� The ratio of SW to EW expressed in percentage was taken as shell percentage (SP)� Shell thickness (ST) was determined by measuring the thickness mean values taken at three spots on the egg (air cell, equator, and sharp end) using a micrometer screw gauge to the nearest 0�01 mm�
Statistical analysisData collected were subjected to one-way analysis of
variance (ANOVA) using SYSTAT (1992) using model: Yij= µ+ Ti + ∑ij; where Yij = dependent variables, µ = population mean, Ti = ith effect due to addition of honey to drinking water (i = 1,2,3), and ∑ij = residual error� Means that were statistically significantly (P < 0.05) different were separated with Duncan multiple range test (DMRT)�
RESULTS
Table 1 shows the summary of climatic conditions during the experiment� The average dry-bulb and wet-bulb temperatures were 31�5 and 28�0 oC, respectively� Average relative humidity during the experiment was 79�5% while temperature-humidity index of 84�9 was recorded� Egg hen-day production in laying pullets offered varying dosage of honey in drinking water during hot season is presented in Figure 1. Addition of honey in drinking water had significant
13
AGRICULTURA TROPICA ET SUBTROPICA VOL. 49 (1-4) 2016
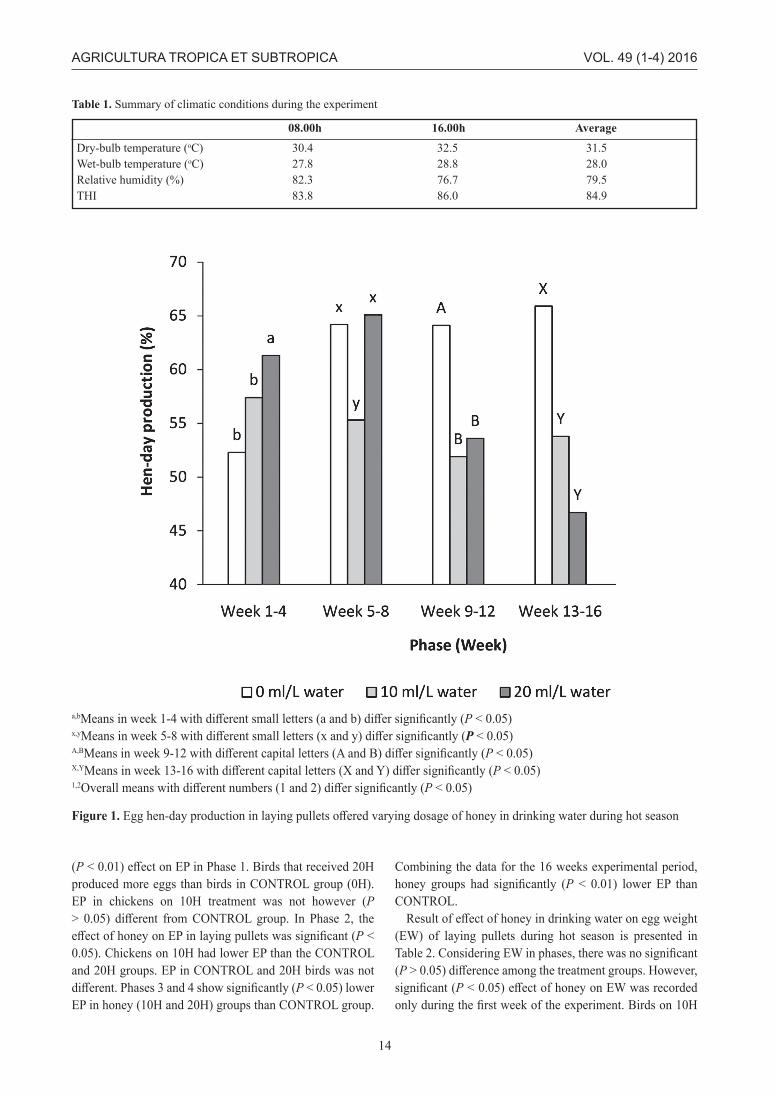
(P < 0.01) effect on EP in Phase 1. Birds that received 20H produced more eggs than birds in CONTROL group (0H)� EP in chickens on 10H treatment was not however (P > 0.05) different from CONTROL group. In Phase 2, the effect of honey on EP in laying pullets was significant (P < 0�05)� Chickens on 10H had lower EP than the CONTROL and 20H groups� EP in CONTROL and 20H birds was not different. Phases 3 and 4 show significantly (P < 0�05) lower EP in honey (10H and 20H) groups than CONTROL group�
Combining the data for the 16 weeks experimental period, honey groups had significantly (P < 0�01) lower EP than CONTROL�
Result of effect of honey in drinking water on egg weight (EW) of laying pullets during hot season is presented in Table 2. Considering EW in phases, there was no significant (P > 0.05) difference among the treatment groups. However, significant (P < 0.05) effect of honey on EW was recorded only during the first week of the experiment. Birds on 10H
14
AGRICULTURA TROPICA ET SUBTROPICA VOL. 49 (1-4) 2016
08.00h 16.00h Average
Dry-bulb temperature (oC) 30�4 32�5 31�5Wet-bulb temperature (oC) 27�8 28�8 28�0Relative humidity (%) 82�3 76�7 79�5THI 83�8 86�0 84�9
Table 1. Summary of climatic conditions during the experiment
a,bMeans in week 1-4 with different small letters (a and b) differ significantly (P < 0�05)x,yMeans in week 5-8 with different small letters (x and y) differ significantly (P < 0�05)A,BMeans in week 9-12 with different capital letters (A and B) differ significantly (P < 0�05)X,YMeans in week 13-16 with different capital letters (X and Y) differ significantly (P < 0�05)1,2Overall means with different numbers (1 and 2) differ significantly (P < 0�05)
Figure 1. Egg hen-day production in laying pullets offered varying dosage of honey in drinking water during hot season

treatment laid heavier eggs than the CONTROL and 20H groups. From week 2 till 16, there were no significant (P > 0.05) differences in EW among the groups. Similarly, the difference was not significant in overall EW among the treatment groups�
Table 3 shows the overall effect of honey on egg quality and shell characteristics in laying pullets during 16-week experiment. There were no significant (P > 0�05) differences in EB, YW, YP, AW, SW and SP of the 3 honey treatment groups� Hens in CONTROL group (5�59 cm) laid significantly (P < 0�001) longer eggs than 10H group (5�52 cm), though not (P > 0.05) different from eggs of 20H hens
(5.55 cm). Egg shape index was significantly (P < 0�01) affected by honey treatment. Hens on 10H had highest value (78) of the groups, while CONTROL (77) and 20H (76) had similar values. Honey in drinking water had significant effect on AH (P < 0�01) and AP (P < 0�05) in eggs laid� The values obtained in CONTROL group (0�59 cm and 60�55%) were higher than 20H group (0�54 cm and 56�82%), respectively� Egg shell thickness (Fig. 2) was significantly (P < 0�05) affected by honey in drinking water offered laying pullets during hot season. The significant effect was observed in phases 1 and 2. Overall ST showed a significant effect of honey in laying pullets� In the phases 1 and 2, hens on CONTROL treatment laid eggs with thinner shell compared to honey groups, while phases 3 and 4 revealed no difference in ST among the 3 groups� Overall, 20H group had higher ST value than CONTROL but not 10H� Table 4 shows survival rate (SR) in laying pullets as affected by honey in drinking water� The SR for the 3 treatment groups was similar (P > 0�05) in all the four phases�
DISCUSSION
Chickens perform optimally under environmental temperature ranging from 16 and 25 oC (Sahin et al�, 2006)� Various indicators of performance in laying pullets usually nose-dive whenever ambient temperature is higher than
15
AGRICULTURA TROPICA ET SUBTROPICA VOL. 49 (1-4) 2016
Table 2. Effect of honey on weight of eggs of laying pullets during hot season
week Honey (ml/L water)
0H 10H 20H sem 1 56�5b 62�5a 58�8b 1�05 2 58�4 58�2 59�8 1�16 3 58�3 57�6 59�6 1�13 4 56�3 54�4 54�2 1�09 5 56�4 55�9 55�5 0�71 6 54�1 52�7 53�7 1�02 7 56�2 56�1 56�3 0�75 8 53�4 52�9 51�1 1�20 9 56�2 57�9 56�0 1�0210 59�3 57�5 58�4 1�6011 61�7 59�6 61�5 1�3812 60�1 57�9 58�2 1�4113 58�9 58�8 58�7 1�4014 56�2 54�4 54�0 1�3615 56�4 57�3 57�3 1�0716 58�6 56�3 59�4 1�33Overall 57�2 56�9 57�0 0�31
a,bMeans with different superscripts in the same row differ significantly (P < 0�05)
Parameter Honey (ml/L water)
0H 10H 20H sem P
Egg length (cm) 5�59a 5�52b 5�55ab 0�013 < 0�001Egg breadth (cm) 4�32 4�31 4�31 0�008 0�385Egg shape index (%) 77�0ab 78�0a 76�0b 0�01 0�008Yolk weight (g) 14�95 14�85 13�94 0�202 0�119Yolk percentage (%) 25�83 25�96 24�86 0�485 0�215Albumen height (cm) 0�59a 0�57ab 0�54b 0�011 0�007Albumen weight (g) 35�12 34�25 34�14 0�492 0�306Albumen percentage (%) 60�55a 59�83ab 56�82b 1�026 0�026Haugh unit 76�8a 75�8ab 71�7b 1�35 0�019Shell weight (g) 5�9 6�0 5�7 0�138 0�197Shell percentage (%) 10�26 10�59 9�99 0�213 0�137
Table 3. Effect of honey on egg quality and shell characteristics in laying pullets during hot season
a,bMeans with different superscripts in the same row differ significantly (P < 0�05)
Table 4. Survival rate in laying pullets offered varying dosage of honey during hot season
Phase Honey (ml/L water)
0H 10H 20H sem1 97�5 97�5 92�5 4�792 87�5 95�0 77�5 6�773 80�0 87�5 67�5 9�354 75�0 77�5 67�5 10�34

the chickens can cope with (Peguri and Coon, 1991; Al-Saffar and Rose, 2002). Meteorological variables obtained in this study were above thermal comfort zone for egg laying pullets� The average temperature recorded during this experiment was 31�5 oC, about 6�5 oC above the upper critical limit� Attaining the optimal range in the open-sided poultry houses commonly used in the tropics is difficult (Abioja et al�, 2012)� Average temperature-humidity index during the experiment was such that elicited stress responses from the birds� This accounts for the reduction in egg production over the phases, instead of expected increment� HS causes among other adverse effects reduction in egg production (Mashaly et al�, 2004; Deng et al�, 2012; Lara and Rostagno, 2013)� Reduction in egg production may stem from the behavioural reduction in feed consumption by chickens during hot spell in the bid to reduce metabolic heat production� This causes a low intake of essential metabolites needed for egg formation� Nutrient digestibility is hampered in birds exposed to HS� Another reason for low egg production may be the diversion of nutrients to thermoregulation instead of production activities� Vasodilatation brings much blood and metabolites into the periphery (areas not covered with feathers - skin, comb and wattle) at the expense of the internal organs at the body core�
In the present study, honey was found to be effective in improving egg production in laying pullets only in the first
four weeks of administration while its effect on egg weight was positive only in the first one week. Honey contains various vitamins, electrolytes, natural anti-oxidants and phenolic compounds (Blasa et al�, 2006) that may help chickens overcome the negative demands imposed by HS� Comprehensive report on the effect of honey in drinking water of broiler chickens was given by Abioja et al� (2012)� Honey reduced pulse and respiratory rate during heat spell and helped improve calcium metabolism in broiler chickens� By-products of honey such as honey slum gum (Babarinde et al�, 2011), propolis (Chen et al�, 2009) and bee pollen (Wang et al., 2005; Hašcík et al., 2012) had been used in broiler production and found to be effective.
Long-term administration of honey to laying pullets was causing a decrease in EP� The reason may be adduced to the higher dosage than needed by the birds or that longer duration of treatment� Recently, Osakwe and Igwe (2015) reported that dietary inclusion of honey up to 20ml improved hen-day production and egg characteristics� This seems to be in contrast to the findings of the present study as some of the parameters are not affected by honey. Analyses of the data were on overall means for 84 days while the present study was phased. This might account for the differences in results obtained� As good as honey is, there is a need for caution in its application in poultry production� Avwioro et al� (2012) reported that there were infiltrations of fat cells in the liver
16
AGRICULTURA TROPICA ET SUBTROPICA VOL. 49 (1-4) 2016
a,bMeans in week 1-4 with different small letters (a and b) differ significantly (P < 0�05)x,yMeans in week 5-8 with different small letters (x and y) differ significantly (P < 0�05)A,BOverall means with different numbers (A and B) differ significantly (P < 0�05)
Figure 2. Egg shell thickness in laying pullets offered varying dosage of honey in drinking water during hot season

tissue of albino rats which was dosage-dependent� This may result in non-alcoholic fatty liver disease or in other unpleasant conditions harmful to health if abused� Alagwu et al� (2009) had earlier stated that chronic consumption of unprocessed Nigerian honey resulted in decreased bile flow, increased bile cholesterol and decreased plasma cholesterol in albino rats�
The result obtained on egg length and shape index is similar to the finding of Balnave and Muheeresa (1997) which showed an increased in egg length when layers where given 200 mg of Vitamin C/kg diet� The reason for this remains unknown� However, Nikolova and Kocevski (2006) stated that egg shape index is necessary for estimation of egg shell quality� Similarly, an increase in egg shape index was reported by Radwan et al. (2008) in laying hens offered natural antioxidants� But this report disagrees with the results of Tatli (2008) who reported that propolis and honey inclusion in the bird’s diet, respectively, did not affect the egg shape index� The present data report that honey does not affect egg breadth, yolk weight, yolk percentage, albumen weight, shell weight and shell percentage does not agree with the findings of Osakwe and Igwe (2015) who stated that 20 ml honey per litre water improved egg characteristics and shell quality in laying pullets�
The problem of shell-less and thin-shelled eggs in laying pullets is a major one that is facing the whole world� A trace of likely solution from any corner will always attract attention of poultry farmers and researchers� Egg shell is made up of about 95% calcium carbonate and the remaining 5% shared among phosphorus, magnesium and traces of sodium, potassium, zinc, manganese, iron and copper� Exposure to heat decreases plasma protein and calcium concentration, both of which are required for egg formation (Mashaly et al�, 2004)� Low quality of egg shell in heat-stressed chickens is not entirely due to dietary calcium deficiency resulting from decreased feed intake, but due to alterations in acid-base balance (Mahmoud et al�, 1996; Grieve, 2003)� Heat stress results in increased blood pH in chickens exposed to high ambient temperature, a condition known as respiratory alkalosis� The alkalinity of the blood reduces its capability of carrying calcium to the reproductive system for shell formation which may not be corrected by increasing dietary calcium (Emery et al�, 1984)� Resulting diminished ability of duodenal cells to transport calcium could be a critical factor in egg shell characteristics and skeletal integrity� Respiratory alkalosis restricts availability of bicarbonate for egg shell mineralization and increases organic acid availability which decreases free calcium levels in the blood (Marder and Arad, 1989). Every research effort at ameliorating the detrimental effects of heat stress in laying pullets aims directly or indirectly at reducing this condition�
The present findings show that offering honey to laying pullets did improve shell thickness� This agrees
with Osakwe and Igwe (2015) that gave similar report in laying pullets� This could be linked to improved calcium digestibility and absorption as reported by Tatli (2008) who also reported an increase in egg shell thickness due to certain acid derivates found in propolis� Improvement in shell thickness may be adduced to vitamin C content of honey as vitamin C stimulates 1,25 dihydroxy cholecalciferol and increases calcium mobilization from bone� Plasma calcium is improved by vitamin C supplementation (El-Gendi et al�, 1999)� Whitehead and Keller (2003) in a review alluded to the fact that vitamin C can be beneficial in countering the adverse effects on shell quality. Honey has been shown to improve tibial weight, density, calcium and phosphorus contents in heat-stressed broiler chickens (Abioja et al�, 2012)� To ensure improvement in egg production and egg shell thickness in laying pullets during hot season, honey can be offered in drinking water. However, duration of honey administration should not exceed first 4 weeks if the dosage is as high as 20ml/L water�
REFERENCES
Abioja M�O�, Ogundimu K�B�, Akibo T�E�, Odukoya K�E�, Ajiboye O�O�, Abiona, J�A�, Williams, T�J�, Oke, O�E�, Osinowo O�A� (2012): Growth, Mineral Deposition and Physiological Responses of Broiler Chickens Offered Honey in Drinking Water during Hot-Dry Season� International Journal of Zoology 2012: 1-6�
Adebiyi F�M�, Akpan,I�, Obiajunwa E�I�,Olaniyi H�B� (2004): Chemical/physical characterization of Nigerian honey� Pakistan Journal of Nutrition 3: 278-281�
Adetuyi F�O�, Ibrahim T�A�, Jude-Ojei O� , Ogundahunsi G�A� (2009): Total phenol, tocopherol and antibacterial quality of honey Apis mellifera sold in Owo community, Ondo State, Nigeria� Electronic Journal of Environmental, Agricultural and Food Chemistry 8(8): 596-601�
Alagwu E�, Nneli R�O�, Okwari O�O�, Osim E�E� (2009): Bile secretion in albino rat following chronic honey intake� Nigerian Journal of Physiological Sciences 24(2): 203-206�
Ali M�N�, Qota E� M�A�, Hassan R�A� (2010): Recovery from adverse effects of heat stress on slow-growing chicks using natural antioxidants without or with sulphate� International Journal of Poultry Science 9(2): 109-117�
Aljadi A�M�, Kamaruddin M�Y� (2004): Evaluation of the phenolic contents and antioxidant capacities of two Malaysian floral honeys. Food Chemistry 85: 513-518.
Al-Saffar A.A., Rose S.P. (2002): Ambient temperature and the egg laying characteristics of laying fowl� World’s Poultry Science Journal 58(3): 317-332�
Avwioro G�O�, Onyije F�M�, Atoni A�D�, Nduku A� (2012): Non-alcoholic fatty liver disease following administration
17
AGRICULTURA TROPICA ET SUBTROPICA VOL. 49 (1-4) 2016

of unprocessed Nigerian honey� Advances in Biological Research 6(4): 141-145�
Ayo J�O�, Obidi J�A�, Rekwot P�I. (2011): Effects of heat stress on the well-being, fertility and hatchability of chickens in the Northern Guinea savannah zone of Nigeria: a review� ISRN Veterinary Science : 1-10� doi:10�5402/2011/838606�
Babarinde S�A�, Oladunjoye I�O�, Ojebiyi O�O�, Oyedeji S�A� (2011): Inclusion of honey bee slum gum in broiler chicken feed� International Journal of Agriculture and Biology 13(5): 781-785�
Balnave D�, Muheareza S�K� (1997): Improving egg shell quality at high temperature with natural antioxidant and sodium bicarbonate� Poultry Science 76: 588- 593�
Bedford M� (2000): Removal of antibiotic growth promoters from poultry diets: implications and strategies to minimise subsequent problems� World’s Poultry Science Journal 56: 347-365�
Blasa M�, Candiracci M�, Accorsi A�, Piacentini M�P�, Albertini M�C�, Piatti E� (2006): Raw Millefiori honey is packed full of antioxidants� Food Chemistry 97: 217-222�
Chen Y�J�, Huang A�C�, Chang H�H�, Liao,H�F�, Jiang, C�M�, Lai,L�Y�, Chan J�T�, Chen Y�Y�, Chiang J� (2009): Caffeic acid phenethyl ester, an antioxidant from propolis, protects peripheral blood mononuclear cells of competitive cyclists against hyperthermal stress� Journal of Food Science 74(6): H162-H167�
Deng W�, Dong X�F�, Tong J�M�, Zhang Q� (2012): The probiotic Bacillus licheniformis ameliorates heat stress-induced impairment of egg production, gut morphology, and intestinal mucosal immunity in laying hens� Poultry Science 91: 575-582�
El-Gendi G.M., Iraqi M.M., Elrahman A.A.A. (1999): Effect of vitamin C supplementation on some productive and physiological parameters in laying hens� Egyptian Journal of Nutrition and Feeds 2: 649-664�
Emery D�A�, Vohra P�, Ernst R�A�, Morrison S�R� (1984): The effect of cyclic and constant ambient temperatures on feed consumption, egg production, egg weight and shell thickness of heat-stressed chickens� Poultry Science 63: 2027-2035�
Estevinho L�, Pereira A�P�, Moreira L�, Dias L�G�, Pereira E� (2008): Antioxidant and antimicrobial effects of phenolic compounds extracts of Northeast Portugal honey� Food and Chemical Toxicology 46: 3774-3779�
Gheldof N�, Wang X�H�, Engeseth N�J� (2003): Buckwheat honey increases serum antioxidant capacity in humans� Journal of Agricultural and Food Chemistry 51: 1500-1505�
Grieve D� (2003): Heat stress in commercial layers and breeders� Technical Bulletin Hy-Line International, Iowa HLST 19(1): 1-3�
Hašcík P., Elimam I., Garlík J., Kacániová M., Cubon J., Bobko M�, Abdulla H� (2012): Impact of beer pollen as
feed supplements on the body weight of broiler Ross 308� African Journal of Biotechnology 11(89): 15596-15599�
Hisas L� (2011): The food gap: Impacts of climate change on food production: A 2020 perspective� FEU-US Universal Ecological Fund, United States of America� 55 p�
IPCC (2007): Intergovernmental Panel on Climate Change: AR4-The Intergovernmental Panel on Climate Change 4th Assessment Report� Jackson Institute, University College, London�
Lara L�J�, Rostagno M�H� (2013) ? Impact of heat stress on poultry production� Animals 3: 356-369�
Mahmoud K�Z�, Beck M�M�, Scheideler S�E�, Forman M�F�, Anderson K�P�,Kachman S�D� (1996): Acute high environmental temperature and calcium-estrogen relationship in the hen� Poultry Science 75: 1555-1562�
Marder J�, Arad Z� (1989): Panting and acid-base regulation in heat stressed birds� Biochemistry Physiology 94: 395-400�
Mashaly M�M�, Hendricks G�L�, Kalama M�A�, Gehad A�E�, Abbas A�O�, Patterson P�H� (2004): Effect of heat stress on production parameters and immune responses of commercial laying hens� Poultry Science 83: 889-894�
Mohamed A�, Ali A�, Molham A� (2002): Antioxidant activities and total phenolics of different types of honey. Nutrtion Research 22: 1041-1047�
Nardone A�, Ronchi B�, Lacetera N�, Ranieri M�S�, Bernabucci U. (2010): Effects of climate changes on animal production and sustainability of livestock systems� Livestock Science 130: 57-69�
Nikolova N�, Kocevski D� (2006): Forming egg shape index as influenced by ambient temperatures and age of hens. Biotechnology in Animal Husbandry 22(1-2): 119-125�
Omafuvbe B�O�, Akanbi O�O� (2009): Microbiological and physico-chemical properties of some commercial Nigerian honey� African Journal of Microbiology Research 3(12): 891-896�
Osakwe I�, Igwe R� (2015): Physiological responses of laying birds fed honey and vitamin C in drinking water� Conference on International Research on Food Security, Natural Resource Management and Rural Development� Humboldt-Universität zu Berlin and the Leibniz Centre for Agricultural Landscape Research (ZALF) Tropentag, Berlin, Germany, September 16-18�
Oyelowo O�T�, Adekunbi D�A�, Dada K�A� (2014): Protective role of Nigerian honey on sperm indices and testis in sucrose-fed rats� Bangladesh Journal of Medical Science 13(2): 180-189�
Peguri A., Coon C. (1991): Effect of temperature and dietary energy on layer performance� Poultry Science 70: 126-138�
Radwan N� L�, Hassan R�A�, Qota E�M�, Fayek H�M� (2008): Effect of natural antioxidant on oxidative stability of eggs and productive and reproductive performance of laying
18
AGRICULTURA TROPICA ET SUBTROPICA VOL. 49 (1-4) 2016

hens� International Journal of Poultry Science 7(2): 134-150�
Ramnath V�, Rekha P�S�, Sujatha K�S� (2008): Amelioration of heat stress induced disturbances of antioxidant defense system in chicken by Brahma Rasayana� Evidence-Based Complementary and Alternative Medicine 5(1): 77-84�
Sahin K�, Onderci M�, Sahin N�, Gursu M�F� Khachik F�, Kucuk O. (2006): Effects of lycopene supplementation on antioxidant status, oxidative stress, performance and carcass characteristics in heat-stressed Japanese quail� Journal of Thermal Biology 31(4): 307-312�
Tatli S.P. (2008): The effects of dietary Turkish propolis and vitamin C on performance, digestibility, egg production and egg quality in laying hens under different environmental temperatures� Asian-Australian Journal of Animal Science 21: 1164-1170�
Vidanarachchi J�K�, Mikkelsen L�L�, Sims I�, Iji P�A�, Choct M� (2005): Probiotics: alternatives to antibiotic growth promoters in monogastric animal feeds� Recent Advances in Animal Nutrition in Australia 15: 131-144�
Wang J�, Jin G�M�, Zheng Y�M�, Li S�H�, Wang H� (2005):
Effect of bee pollen on development of immune organ of animal� Zhongguo Zhong Yao Za Zhi 30: 1532-1536�
Wasagu R�S�U�, Shehu S�, Mode Y�D� (2013): Comparative proximate composition and antioxidant vitamins contents of two honey varieties (light amber and dark amber) from Sokoto State, Nigeria� Bayero Journal of Pure and Applied Sciences 6(2): 118-120�
Wenk C� (2003): Herbs and botanicals as feed additive in monogastric animals� Asian–Australasian Journal of Animal Science 16: 282-289�
Whitehead C�C�, Keller T� (2003): An update on ascorbic acid in poultry� World’s Poultry Science Journal 59: 161-184�
Zhang G�F�, Yang Z�B�, Wang Y�, Yang W�R�, Jiang S�Z�, Gai G�S� (2009): Effects of ginger root (Zingiber officinale) processed to different particle sizes on growth performance, antioxidant status, and serum metabolites of broiler chickens� Poultry Science 88(10): 2159-2166�
Received: January 15, 2016 Accepted after revisions: June 28, 2016
19
AGRICULTURA TROPICA ET SUBTROPICA VOL. 49 (1-4) 2016
Corresponding author:
M. O. AbiojaDepartment of Animal PhysiologyCollege of Animal Science and Livestock Production Federal University of Agriculture PMB 2240 Abeokuta, NigeriaE-mail: dimejiabioja@yahoo�comPhone: +234-803-395-2155

INTRODUCTION
Over the past decade, many countries around the world have witnessed a growing scarcity of water and competition for water among different users (domestic, municipal, industrial, and environmental purposes), with increase in population resulting in higher demand for food� The need for increase in food production to match the population growth is becoming a major concern to all governments of the world� All-season crop production programmes are only possible in the presence of sustained availability of adequate moisture� Irrigation practice, therefore, becomes a most reasonable option as it is able to assist agriculture in areas with either low amount of rainfall or erratic rainfall distribution pattern� Hence, this ever increasing need has resulted in the transformation from arid land farming to irrigated agriculture relying, to a great extent, on the ground water as the main source of irrigation water� The groundwater is a non-renewable resource in the fragile arid ecosystems of the world, and its exploitation calls for an environmentally compatible and ecologically sustainable water resource management (Saif-ud-din et al�, 2004; FAO-Aquastat, 2009)�
The groundwater exploitation, if not managed judiciously, will result in environmental degradation of the fragile arid ecosystem and increase in the frequency and intensity of extreme weather events, such as droughts and floods (El-Quasy, 2009), which may cause economic, social and environmental effects (Abu Zeid and Abdel Megeed,
2004; Ouda et al�, 2011)� Under such circumstances, adoption of optimum water management practices is very important for attaining national food and water security� In agricultural water management, significant improvements can be achieved through irrigation scheduling� Irrigation schedule deals with when and how much to irrigate a crop� Efficient use of water resources can be made possible through the assessment of crop water requirements and proper scheduling of irrigation� Temporal prediction of soil moisture and evapotranspiration plays a crucial role in irrigation water management (Abdelhadi et al�, 2000; Ali et al�, 2007) and drought monitoring (Narasimhan and Srinivasan, 2005)� This can be achieved using information derived from detailed irrigation evaluation study� According to Ojanuga (1979), several irrigation projects that disregarded these studies have failed because they could not predict salinity and drainage problems, among others, that soon developed after the inception of the projects� The results of such study form the basis for the decision to either go ahead or not to invest� It has been demonstrated that optimal irrigation scheduling requires accurate estimation of daily evapo-transpiration (ETc) (Kamel et al�, 2012)� Quantitative irrigation scheduling methods are based on three approaches, namely, crop monitoring, soil monitoring and water balance technique� However, most irrigation schedules and crop water requirement studies have been based on crop monitoring and water balance technique, which provides little information on the relevance of soil data to irrigation schedules� Methods based on estimated
20
10.1515/ats-2016-0003 AGRICULTURA TROPICA ET SUBTROPICA, 49/1-4, 20-29, 2016
Original Research Article
Modelling Irrigation water Requirements at Physiological growth Stages of Okra Life Cycle Using CROPwAT Model for Derived Savannah and Humid Forest Zones of Nigeria
OrevaOghene Aliku, Suarau Odutola Oshunsanya
Department of Agronomy, Faculty of Agriculture and Forestry, University of Ibadan, Ibadan, Nigeria
Abstract
Accurate quantification of irrigation water requirement at different physiological growth stages of okra (Abelmoschus esculentus L�) life cycle is important to prevent over or under irrigation� Field experiments were therefore initiated to model okra irrigation water requirements at the four physiological growth stages of okra life cycle using CROPWAT model� Derived savannah 1 (DS1), derived savannah 2 (DS2) and humid forest (HF) occupying 493�36 ha, 69�83 ha and 305�25 ha respectively were used� Some selected soil physical properties coupled with weather parameters were used to develop irrigation water requirements for okra crop� In DS1, the estimated crop co-efficient (Kc) values were 0.30, 0.52, 0.84 and 0.70 for the germination, crop growth, flowering and fruiting stages, respectively� Corresponding Kc values in DS2 were 0�30, 0�54, 0�90 and 0�84 and in the HF were 0�30, 0�56, 0�87 and 0�86 respectively� Daily crop evapo-transpiration values ranged from 1�16 to 3�36, 1�17 to 3�64, and 1�2 to 3�38 mm day-1 for DS1, DS2 and HF respectively with significant (p = 0.05) peak at the flowering stage for the three locations. Sustainable okra cultivation would require maximum daily irrigation water at flowering stage (reproductive phase) to meet the crop physiological needs and evapo-transpiration demand of the atmosphere�
Keywords: crop co-efficient; crop evapo-transpiration; irrigation schedule; okra.

ratio of irrigation water to cumulative pan evaporation (Aiyelaagbe and Ogbonnaya, 1996), open pan evaporation rate (Singh, 1987; Manjunath et al�, 1994) and soil moisture depletion (Home et al�, 2000) have been widely used for scheduling irrigation�
However, these methods are expensive and tedious, and are best done in research settings� Allen et al� (1998) reported that factors such as soil salinity, poor soil fertility, presence of hard or impenetrable soil profiles and soil water content may reduce evapo-transpiration (ET)� According to Van Genuchten and Leij (1992), difficulty in assessing the water characteristics of soils and measuring soil moisture under cropped surfaces has led to the often use of models� According to Phene et al� (1990), models that employ the use of water balance techniques in combination with the analysis of historical climate and soil data have been recommended for irrigation scheduling� CROPWAT software has been widely used for predicting reference evapotranspiration, crop evapotranspiration, irrigation scheduling, deficit irrigation scheduling and cropping patterns in Greece, Taiwan, USA, Morocco, Turkey, Zimbabwe and Pakistan (George et al�, 2000; Anadranistakis et al�, 2000; Sheng-Feng et al�, 2006; Kang et al�, 2009; Nazeer, 2009; Mimi and Jamous, 2010; Stancalie et al�, 2010; Mhashu, 2007)�
Ogun, Oyo and Edo States are agriculturally based areas which involve the cultivation of a wide range of crops such as okra, maize, yam, cassava, potato etc� Like most Southern States in Nigeria, with near optimum rainfall, Ogun, Oyo and Edo States have both dry and wet seasons characterised with an occasionally erratic rainfall distribution pattern� In spite of all these, there is no known functional irrigation scheme for okra crops produced in these regions� Furthermore, studies on possible effects of variation in soil characteristics on crop water requirement for okra in these regions are also
limited; while understanding of such effects is important to aid water resources management as Ojanuga (1979) attributed the agricultural failure in Nigeria to refusal to incorporate a detailed soil survey into the overall irrigation investigations� Hence, the objective of this study was to predict crop water requirements and irrigation schedules for various stages of okra life cycle for derived savannah and humid forest agro-ecological zones of Nigeria�
MATERIALS AND METHODS
Study areaThe field studies were conducted in the three locations;
derived savannah1 (Ogun state), derived savannah2 (Oyo state) and Humid forest (Edo State) and CROPWAT 8�0 model was used to model okra crop water requirement and irrigation water requirement� General description of the study areas are presented in Table 1�
CROPwAT model descriptionCROPWAT is a collection of modules that integrates
several models necessary to predict crop water requirement (CWR), irrigation water management and irrigation scheduling (Smith 1991)� It utilizes the FAO modified Penman–Monteith method to predict reference evapotranspiration (ETo), crop evapotranspiration (ETc) and irrigation water management (FAO, 1998; Smith, 1991)� It is to be noted that ETc represents the amount of water that crop losses due to evapotranspiration while CWR represent the amount of water to be supplied (Mhashu, 2007)�
CROPwAT data input and application
Modelling of crop evapotranspiration and irrigation
21
AGRICULTURA TROPICA ET SUBTROPICA VOL. 49 (1-4) 2016
Parameter Location Derived savannah 1 (Ogun State) Derived savannah 2 (Oyo State) Humid forest (Edo State)
Area (ha) 493�36 69�83 305�25Rainfall (mm/year) 1150 1200 – 1400 1200Temperature range (°C) 20�0 – 34�7 22 – 33 15 – 34Geology
Slope (%)DrainageAgro-ecologyType of vegetationSoil series (area coverage)
Table 1. Summary of sites description
Eocene sediment
≤ 2Well-drainedDerived savannahSecondary forestOwode series (49�336 ha), Igbessa series (24�663 ha), Agege series (39�4688 ha), Yanpere series (157�8752 ha), Iweke series (14�8008 ha), Alagba series (207�2112 ha)
Crystalline basement complex rocks≤ 4.5Fairly drainedDerived savannahSecondary forestAdio series (15�38 ha), Oyo series (9�44 ha), Temidere series (23�07 ha), Owutu (22�01 ha)
Alluvial kandiudult deposits of River Niger2 – 3%poorly-drainedHumid forestSecondary forestIpaja (76�31 ha), Katcha (30�53 ha), Iweke (97�68 ha), Orlu (82�42 ha), Kulfo (18�32 ha)
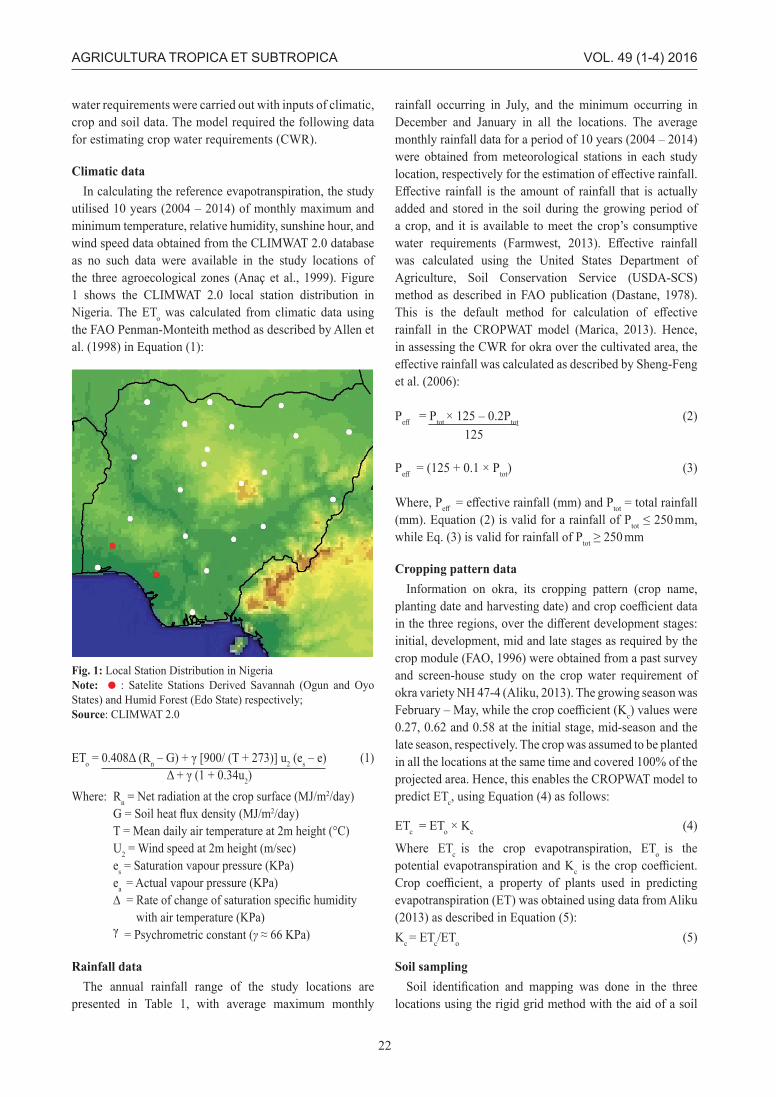
water requirements were carried out with inputs of climatic, crop and soil data� The model required the following data for estimating crop water requirements (CWR)�
Climatic dataIn calculating the reference evapotranspiration, the study
utilised 10 years (2004 – 2014) of monthly maximum and minimum temperature, relative humidity, sunshine hour, and wind speed data obtained from the CLIMWAT 2�0 database as no such data were available in the study locations of the three agroecological zones (Anaç et al�, 1999)� Figure 1 shows the CLIMWAT 2�0 local station distribution in Nigeria� The ETo was calculated from climatic data using the FAO Penman-Monteith method as described by Allen et al� (1998) in Equation (1):
ETo = 0.408Δ (Rn – G) + γ [900/ (T + 273)] u2 (es – e) (1) Δ + γ (1 + 0.34u2) Where: Rn = Net radiation at the crop surface (MJ/m2/day) G = Soil heat flux density (MJ/m2/day) T = Mean daily air temperature at 2m height (°C) U2 = Wind speed at 2m height (m/sec) es = Saturation vapour pressure (KPa) ea = Actual vapour pressure (KPa) ∆ = Rate of change of saturation specific humidity with air temperature (KPa) γ = Psychrometric constant (γ ≈ 66 KPa)
Rainfall dataThe annual rainfall range of the study locations are
presented in Table 1, with average maximum monthly
rainfall occurring in July, and the minimum occurring in December and January in all the locations� The average monthly rainfall data for a period of 10 years (2004 – 2014) were obtained from meteorological stations in each study location, respectively for the estimation of effective rainfall. Effective rainfall is the amount of rainfall that is actually added and stored in the soil during the growing period of a crop, and it is available to meet the crop’s consumptive water requirements (Farmwest, 2013). Effective rainfall was calculated using the United States Department of Agriculture, Soil Conservation Service (USDA-SCS) method as described in FAO publication (Dastane, 1978)� This is the default method for calculation of effective rainfall in the CROPWAT model (Marica, 2013)� Hence, in assessing the CWR for okra over the cultivated area, the effective rainfall was calculated as described by Sheng-Feng et al� (2006):
Peff = Ptot × 125 – 0�2Ptot (2) 125
Peff = (125 + 0�1 × Ptot) (3)
Where, Peff = effective rainfall (mm) and Ptot = total rainfall (mm)� Equation (2) is valid for a rainfall of Ptot ≤ 250 mm, while Eq� (3) is valid for rainfall of Ptot ≥ 250 mm
Cropping pattern dataInformation on okra, its cropping pattern (crop name,
planting date and harvesting date) and crop coefficient data in the three regions, over the different development stages: initial, development, mid and late stages as required by the crop module (FAO, 1996) were obtained from a past survey and screen-house study on the crop water requirement of okra variety NH 47-4 (Aliku, 2013)� The growing season was February – May, while the crop coefficient (Kc) values were 0�27, 0�62 and 0�58 at the initial stage, mid-season and the late season, respectively� The crop was assumed to be planted in all the locations at the same time and covered 100% of the projected area� Hence, this enables the CROPWAT model to predict ETc, using Equation (4) as follows:
ETc = ETo × Kc (4)
Where ETc is the crop evapotranspiration, ETo is the potential evapotranspiration and Kc is the crop coefficient. Crop coefficient, a property of plants used in predicting evapotranspiration (ET) was obtained using data from Aliku (2013) as described in Equation (5):Kc = ETc/ETo (5)
Soil sampling Soil identification and mapping was done in the three
locations using the rigid grid method with the aid of a soil
22
AGRICULTURA TROPICA ET SUBTROPICA VOL. 49 (1-4) 2016
Fig. 1: Local Station Distribution in Nigeria Note: •: Satelite Stations Derived Savannah (Ogun and Oyo States) and Humid Forest (Edo State) respectively; Source: CLIMWAT 2�0

auger� A predetermined format of 50 m × 50 m sampling procedure was adopted� Traverses were cut at 50 m apart along a predetermined baseline and observation points were made at 50 m apart along the traverses� Auger holes were made at every observation point down to a depth of 1�2 m and soil was examined at each of 0 – 0�15 m, 0�15 – 0�30 m, 0�30 – 0�60 m, 0�60 – 0�90 m and 0�90 – 1�2 m depths� Profile pits (1.5 – 2.0 m deep) were dug at points typical of each mapping units. The profiles were described following FAO guidelines (FAO, 1977)� Soil samples were collected from all the horizons of each profile using 5 cm diameter cores for laboratory analysis� Soil properties such as bulk density, infiltration rate, maximum rooting depth, available soil moisture, and initial soil moisture depletion (%TAM) relevant to CROPWAT 8�0 model for scheduling irrigation were determined. Infiltration rate was measured at a surface depth of 0 – 15 cm using the double ring infiltrometer as described by Smith and Mullins (1991)�
Statistical analysisAll experimental data were statistically analysed using
the analysis of variance (ANOVA) based on the randomised complete block design using GenStat statistical software (8th edition). Means were separated using least significant difference (LSD) at 5% level of significance.
RESULTS AND DISCUSSION
Soil properties
Soil properties from derived savannah 1 (DS1) in Ogun state, derived savannah 2 (DS2) in Oyo state and humid forest (HF) in Edo state are presented in Table 2� At DS1,
the clay content ranged from 37 – 177 g/kg; silt, 7�0 – 27 g/kg and sand was from 806 – 956 g/kg indicating a coarse textured soil� Derived savannah 2 had clay content that ranged from 97 – 450 g/kg; silt from 17 – 107 g/kg; and sand from 483 – 866 g/kg, indicating a range of coarse texture to fairly fine texture soil. In the HF agro-ecological zone, the clay content ranged from 26 to 446 g/kg silt from 14 – 224 g/kg and sand from 430 – 960 g/kg revealing a coarse texture to a fine texture. On the average, DS2 and HF soil particles are finer than DS1, an indication of their ability to retain more water for crop use when irrigated than DS1 soils (Hillel, 2003)� The soils in all the locations were deep, consistently more than 1.80 m. Mean equilibrium infiltration rate was highest in DS1 (7�4 – 27�0 cm/hr), followed by HF (4�5 – 19�6 cm/hr) and least by DS2 (1�2 – 23�08 cm/hr). Variation in equilibrium infiltration rates among the three locations could be attributed to differences in soil texture, which affects the surface entry, profile transmission characteristics and soil water storage capacity (Hillel, 2003)� Drip irrigation could be suggested for these sites so as to avoid runoff situations in DS2 and loss of irrigation water via deep percolation in DS1 and HF� Oshunsanya et al� (2016) reported that drip irrigation could make large volume of water available to plants by gradually dispensing water such that runoff and deep percolation losses are avoided.
Effective rainfallThe results of the effective rainfall for the three agro-
ecological zones for a decade of okra cultivation were presented in Figure 2. The weather data for different soil types from DS1, DS2 and HF gave the highest effective rainfall at the flowering stage of crop growth. This gave significant differences in effective rainfall at the germination, crop growth and fruiting stages of okra life cycle, respectively� Though, there was no significant difference at the flowering stage among the three locations, humid forest had significantly higher
23
AGRICULTURA TROPICA ET SUBTROPICA VOL. 49 (1-4) 2016
Land characteristics Locations DS1 DS2 HFBulk density (g/cm3) 1�13 – 1�64 0�80 – 1�80 1�09 – 1�97Pore space (%) 38�1 – 57�4 32�1 – 69�8 25�7 – 58�9Slope (%) 0�15 – 3�5 0�2 – 29�05 0�20 – 2�79Depth of groundwater (cm) >180 >180 >210Effective depth (cm) >180 >180 >180*Infiltration rate (cm/hr1)Mean equilibrium rate SR – VR VR – O SR – NOSoil TextureSurface S – LS LS – SCL S – SCSub-surface LS – SL SCL – SC LS – SCL
Table 2. Summary of land characteristics relevant to irrigation
*According to Sys (1985): SR = Somewhat rapid; VR = Very rapid; NO = Nearly optimal; O = Optimal
S=Sandy; LS=Loamy sand; SL=Sandy loam; SCL= Sandy clay loam; SC=Sandy clay� Note: DS1 – Derived Savannah 1 (Ogun State), DS2 – Derived Savannah 2 (Oyo State), HF – Humid Forest (Edo State)
Fig. 2. Mean effective rain of the three agro-ecological zones
Note: DS1 = Derived Savannah 1 (Ogun State); DS2 = Derived Savannah 2 (Oyo State); HF = Humid Forest (Edo State)

effective rainfall (p = 0.05) than derived savannah 1 and 2 at the germination, crop growth and fruiting stages� The highest effective rainfall was estimated at humid forest, with a mean of 45.73 mm/decade at the flowering stage of okra, where derived savannah 1 and 2 had mean values of 40�67 and 37�97 mm/decade, respectively� On the other hand, Figure 3 presents the estimation of okra irrigation water requirement for a decade� The irrigation water requirement for derived savannah 1 and 2 were estimated for germination stage (4�3 and 3�15 mm/decade, respectively), crop growth stage (2�30 and 3�27 mm/decade, respectively), flowering stage (1.87 and 3.30 mm/decade, respectively) and fruiting stage (0�93 and 1�03 mm/decade, respectively) for the next 10 years� This is due to the fact that the precipitation which is received during this growing period of okra is available to meet the consumptive water requirement of the crop (Dastane, 1978). The high effective rainfall which resulted to high soil moisture content could also have resulted from low initial soil moisture content. The high effective rainfall and soil moisture consequently resulted to low irrigation water requirement and as such little or no water should be programmed in the irrigation schedule for that period of crop growth� This situation is especially true for the
humid forest, where okra cultivation will require little irrigation (0�6 mm/decade) especially at the germination stage where the effective rainfall is low.
Crop evapotranspiration/crop water requirement The daily ETc values for okra under the different
agroecological zones are presented in Table 3� The values of ETc and crop water requirements (CWR) are identical, whereby ETc refers to the amount of water lost through evapotranspiration while CWR refers to the amount of water that is needed to compensate for that loss� In other words, ETc values are values for CWR� The study presents ETc values for a decade with the lowest ETc of 6�45 mm recorded in the derived savannah 1 at the germination stage, while the highest value was obtained as 37�57 mm during the flowering stage in derived savannah 2. Mean daily ETc of okra was observed to increase from 1�16 to 3�36 mm/day and dropped to 2�99 mm/day at the end of the fruiting stage (Table 3)� The corresponding values for derived savannah 2 were 1�17 to 3�64 mm/day for germination stage which later dropped to 3�28 mm/day at fruiting stage, while those of humid forest increased from 1�20 to 3�38 mm/day for germination stage and finally dropped to 3.04 mm/day at the fruiting stage. This trend agrees with the findings of Odofin et al. (2011) who reported that average weekly ETc for Amugbadu okra variety rose from an initial value of 2�7 to 6�8 mm/day and dropped to 2�2 mm/day at the end of the late season, with corresponding values of 2�8, 6�6 and 2�0 mm/day for Oniyaya� The low ET at the initial stage could be due to the low canopy cover of the crop at that stage and this suggests higher soil evaporation rate than transpiration in the early growth stage� The soil evaporation would then gradually decrease while transpiration increases as the plant develops more overlapping leaves and increase its canopy cover� At the later stages of okra development when senescence and leaf aging begins, soil evaporation increases while transpiration reduces�
Daily soil moisture balanceThe components of daily soil moisture balance which
involved the use of daily stress coefficient (Ks) values based
24
AGRICULTURA TROPICA ET SUBTROPICA VOL. 49 (1-4) 2016
Fig. 3. Irrigation water requirement for different growth stages of okra under three agro-ecological zones
Note: DS1 = Drived Savannah 1 (Ogun State); DS2 = Drived Savannah 2 (Oyo State); HF = Humid FGorest (Edo State)
Locations Initial Dev Mid Late Initial Dev Mid Late ETc (mm day-1) ETc (mm dec-1)DS1 1�16 2�06 3�36 2�99 6�45 19�73 34�70 21�53DS2 1�17 2�18 3�64 3�28 6�50 20�90 37�57 23�53HF 1�2 2�18 3�38 3�04 7�20 21�78 33�83 29�70LSD ns ns ns ns ns ns ns ns
Table 3. Estimated crop evapotranspiration for three agro-ecological zones
NOTE: DS1 – Derived Savannah 1 (Ogun State), DS2 – Derived Savannah 2 (Oyo State), HF – Humid Forest (Edo State), ns: not significant at p=0.05

on the depletion of available soil water content to estimate the actual crop evapo-transpiration (ETa) are discussed as follows. There was no significant (p = 0.05) difference in the mean actual evapotranspiration (ETa) which was calculated by multiplying the water stress coefficient (Ks) by the crop evapotranspiration (ETc) for locations, respectively� However, Figure 4 presents the ETa to be the highest at the flowering stage in the derived savannah 2 (3�59 mm/day), followed by humid forest (3�40 mm/day) and least by derived savannah 1 (3�36 mm/day)� Figure 5 presents the result of soil available water and soil depleted moisture for derived savannah 1, derived savannah 2 and humid forest, respectively� Although, there was no significant (p = 0.05) difference in soil available moisture and soil depleted moisture among the locations, the mean
highest percentage depletion during the period of growth was obtained at the germination stage of okra growth in derived savannah 2 (24�93%), followed by derived savannah 2 (21�71%) and least by humid forest (19�21%)� The water stress coefficient (Ks) was equal to 1 throughout the growth period in all the three locations (Tables 4, 5 and 6)� This may be due to the fact that the soil available water exceeded the depleted soil water in all locations after the cessation of rainfall� Snyder and Bali (2012) reported that until the soil water depletion exceeds the readily available water, no water stress is assumed and Ks is equal to 1� The Net irrigation application was found to be zero in all locations throughout the season (February to May)� This implies that the locations require little or no supplementary irrigation during these months� Though similar in trend,
25
AGRICULTURA TROPICA ET SUBTROPICA VOL. 49 (1-4) 2016
Weeks Stage Rain Ks ETa Depletion Net Irri Deficit Loss Gross Irri Flow (mm) (mm/day) (%) (mm/day) 1 Init 0�29 1�00 1�19 19�43 0�00 12�36 0�00 0�00 0�00 2 Init 1�14 1�00 1�24 24�00 0�00 19�99 0�00 0�00 0�00 3 Dev 0�86 1�00 1�50 23�00 0�00 23�87 0�00 0�00 0�00 4 Dev 2�71 1�00 2�00 19�00 0�00 23�83 0�00 0�00 0�00 5 Dev 1�79 1�00 2�69 21�29 0�00 30�79 0�00 0�00 0�00 6 Dev 4�64 1�00 3�01 20�00 0�00 33�07 0�00 0�00 0�00 7 Mid 2�86 1�00 3�30 16�14 0�00 28�01 0�00 0�00 0�00 8 Mid 4�29 1�00 3�39 15�00 0�00 25�77 0�00 0�00 0�00 9 Mid 9�71 1�00 3�40 6�29 0�00 10�57 0�00 0�00 0�0010 Mid 5�43 1�00 3�40 5�43 0�00 9�14 0�00 0�00 0�0011 End 10�63 1�00 3�20 6�29 0�00 10�29 0�00 0�00 0�0012 End 4�94 1�00 3�09 6�14 0�00 10�36 0�00 0�00 0�0013 End 4�94 1�00 2�57 5�14 0�00 8�42 0�00 0�00 0�00
Table 4. Soil moisture balance and irrigation schedule for Derived Savannah 1 (Ogun State)
Note – Irri: Irrigation, Init: Initial growth stage, Dev: Development stage, Mid: mid-season stage, End: Late season growth stage
Fig. 5. Soil moisture content
Note: DS1 = Derived Savannah 1 (Ogun State); DS2 = Derived Savannah 2 (Oyo State); HF = Humid Forest (Edo State)
Fig. 4. Daily actual crop evapotranspiration of okra under three agro-ecological zones
Note: DS1 = Derived Savannah 1 (Ogun State); DS2 = Derived Savannah 2 (Oyo State); HF = Humid Forest (Edo State)

these results are contrary to the findings of Hashim et al. (2012) who reported higher values than the values obtained from this study� The irrigation schedules resulting from the contributions of various moisture balance components for derived savannah 1, derived savannah 2 and humid forest respectively are presented in Tables 4, 5 and 6�
Crop coefficient
The crop coefficient curve of okra across the germination, growth, flowering, and fruiting stages is presented in Figure 6. There was no significant (p = 0.05) difference among Kc values obtained from all locations across okra growth stages. The crop coefficient (Kc) values increased from the germination to the flowering stage for all locations, with the peak crop coefficient of
26
AGRICULTURA TROPICA ET SUBTROPICA VOL. 49 (1-4) 2016
Weeks Stage Rain Ks ETa Depletion Net Irri Deficit Loss Gross Irri Flow (mm) (mm/day) (%) (mm/day) 1 Init 2�57 1�00 1�20 7�43 0�00 4�87 0�00 0�00 0�00 2 Init 2�57 1�00 1�29 5�14 0�00 4�93 0�00 0�00 0�00 3 Dev 7�86 1�00 1�50 3�00 0�00 3�47 0�00 0�00 0�00 4 Dev 4�99 1�00 2�27 5�29 0�00 7�07 0�00 0�00 0�00 5 Dev 9�90 1�00 2�74 5�14 0�00 8�03 0�00 0�00 0�00 6 Dev 4�91 1�00 3�20 5�00 0�00 8�77 0�00 0�00 0�00 7 Mid 9�37 1�00 3�50 6�00 0�00 10�69 0�00 0�00 0�00 8 Mid 4�73 1�00 3�44 6�29 0�00 11�43 0�00 0�00 0�00 9 Mid 4�73 1�00 3�39 5�86 0�00 10�76 0�00 0�00 0�0010 Mid 9�77 1�00 3�30 5�00 0�00 9�03 0�00 0�00 0�0011 End 5�11 1�00 3�19 7�00 0�00 13�00 0�00 0�00 0�0012 End 5�11 1�00 3�06 5�29 0�00 9�57 0�00 0�00 0�0013 End 10�57 1�00 2�40 3�71 0�00 8�07 0�00 0�00 0�00
Table 6. Soil moisture balance and irrigation schedule for Humid Forest (Edo State)
Note – Irri: Irrigation, Init: Initial growth stage, Dev: Development stage, Mid: mid-season stage, End: Late season growth stage
Weeks Stage Rain Ks ETa Depletion Net Irri Deficit Loss Gross Irri Flow (mm) (mm/day) (%) (mm/day) 1 Init 0�47 1�00 1�19 23�86 0�00 17�56 0�00 0�00 0�00 2 Init 1�44 1�00 1�29 26�00 0�00 25�23 0�00 0�00 0�00 3 Dev 0�97 1�00 1�60 24�86 0�00 30�09 0�00 0�00 0�00 4 Dev 2�86 1�00 2�10 21�71 0�00 31�60 0�00 0�00 0�00 5 Dev 1�83 1�00 2�87 24�14 0�00 41�09 0�00 0�00 0�00 6 Dev 4�47 1�00 3�26 24�00 0�00 46�47 0�00 0�00 0�00 7 Mid 2�64 1�00 3�60 23�00 0�00 45�86 0�00 0�00 0�00 8 Mid 3�76 1�00 3�60 24�14 0�00 48�31 0�00 0�00 0�00 9 Mid 8�40 1�00 3�60 15�86 0�00 31�63 0�00 0�00 0�0010 Mid 4�64 1�00 3�60 7�29 0�00 14�64 0�00 0�00 0�0011 End 8�80 1�00 3�50 5�71 0�00 11�17 0�00 0�00 0�0012 End 3�79 1�00 3�33 5�71 0�00 11�29 0�00 0�00 0�0013 End 3�79 1�00 2�74 5�14 0�00 9�18 0�00 0�00 0�00
Table 5. Soil moisture balance and irrigation schedule for Derived Savannah2 (Oyo State)
Note – Irri: Irrigation, Init: Initial growth stage, Dev: Development stage, Mid: mid-season stage, End: Late season growth stage
Fig. 6. Estimated crop coefficient values for of okra under three agro-ecological zones of NigeriaNote: DS1 = Derived Savannah 1 (Ogun State); DS2 = Derived Savannah 2 (Oyo State); HF = Humid Forest (Edo State)

0.90 in the flowering stage of okra growth in derived savannah 2� During the fruiting period, the Kc for derived savannah 1, derived savannah 2 and humid forest dropped from their peak values of 0�84, 0�90 and 0�87 respectively at the flowering stage to 0.77, 0.84 and 0.86 respectively. Similar observations were made by Snyder and Bali (2012) where Kc was reported to have dropped from peak during the irrigation schedule of Alfalfa in California� The values estimated at the germination stage is in line with the values of the initial growth period observed by Hunsaker et al� (2002) who stated that the basal Kc is in the range of 0�20 and 0�40�
CONCLUSION
Daily crop evapo-transpiration and crop coefficient values for okra were significantly different among derived savannah 1, derived savannah 2 and humid forest agro-ecological zones of Nigeria� This indicates that the amount of water needed by okra to offset evapo-transpirational demand of the atmosphere varied across the three agro-ecological zones due partly to differences in climatic factors. Variation in available soil moisture and moisture depletion also occurred due to differences in soil properties in the three agro-ecological zones. It must be noted that crop coefficient increased as daily crop evapo-transpiration and actual crop evapo-transpiration increased in all locations� In addition, water requirement of okra was found to depend on age of the plant with maximum demand at reproductive (flowering) stage. Therefore, effective modelling of irrigation water for okra will require data on soil properties, climatic factors and age of the crop for sustainable cultivation�
REFERENCES
Abdelhadi A�W�, Hata T�, Tanakumaru H�, Tada A�, Tariq M�A� (2000): Estimation of crop water requirements in arid region using Penman-Monteith equation with derived crop coefficients: a case study on Acala cotton in Sudan Gezira irrigated scheme� Agricultural Water Management 45(3): 203–214�
Abu Zeid K�, Abdel Megeed A� (2004): Status of Integrated water resources management planning in Arab Mediterranean Countries� IWRM, International Water Demand Management Conference, Dead Sea, Jordan� June 2004�
Aiyelaagbe I�O�O�, Ogbonnaya F�C� (1996): Growth, fruit production and seed yield of okra (Abelmoschus esculentus L) in response to irrigation and mulching�
Research Bulletin No� 18� National Horticultural Research Institute, Ibadan, 13 p�
Ali M�H�, Hoque M�R�, Hassan A�A�, Khair A� (2007): Effects of deficit irrigation on yield, water productivity, and economic returns of wheat� Agricultural Water Management 92: 151-161�
Aliku O� (2013): Determination of crop water requirement for two okra varieties under three rates of potential evapotranspiration� Ph�D Thesis, the Department of Agronomy, University of Ibadan, Nigeria�
Allen R�G�, Pereira L�S�, Raes D�, Smith M� (1998): Crop evapotranspiration guidelines for computing crop water requirements� FAO Irrigation and Drainage Paper No� 56, United Nations – Food and Agricultural Organization, Rome, Italy, 300 p�
Anaç M�S�, Ali U�M�, Tuzal I�H�, Anac D�, Okur B�, Hakerlerler H� (1999): Optimum irrigation schedules for cotton under deficit irrigation conditions. In: C� Kirda, P� Moutonnet, C� Hera, D�R Nielsen, eds� Crop Yield Response to Deficit Irrigation. p� 196-212� Dordrecht, Netherlands, Kluwer Academic Publishers�
Anadranistakis M�, Liakatas A�, Kerkides P�, Rizos S� (2000): Crop water requirements model tested for crop grown in Greece� Agricultural Water Management 45 (3), 297–316�
Dastane N.G. (1978): Effective rainfall. Irrigation and drainage paper 25, FAO, Rome, Italy�
El-Quasy D� (2009): Impact of climate change: vulnerability and adaptation on fresh water� In: (Ed�) Tolba MK, and Saab NW, Impact of climate change on Arab countries� Arab Forum for Environment and Development pp �75–86�
FAO (1977): Guidelines for profile description. Second Edition, FAO, Rome�
FAO (1979): Soil survey investigations for irrigation� Soil Bulletin No� 42� FAO, Rome�
FAO (1998): Crop Evapotranspiration, Guidelines for Computing Crop Water Requirements – FAO Irrigation and Drainage Paper No� 56� FAO Rome�
FAO (1996): Irrigation scheduling: From theory to practice –Proceedings� Food and Agriculture Organization of United Nations� ICID-CIID� Water Reports 8� Rome� ISBN 92-5-103968-2. [Online]. Available from: http://www�fao�org/docrep/W4367E/W4367E00�htm#Contents. [Accessed 23 November, 2015].
FAO-Aquastat (2009): Water Reports, 34� In: (Ed�) Karen Frenken., Irrigation in the Middle East region in figures AQUASTAT Survey – 2008� Land and Water Division, FAO Rome� ftp://ftp�fao�org/agl/aglw/docs/wr34_eng�pdf�
Farmwest (2013): Effective precipitation: http://www.farmwest.com/node/934 [Accessed 23 November, 2015].
27
AGRICULTURA TROPICA ET SUBTROPICA VOL. 49 (1-4) 2016

George B�, Shende S�, Raghuwanshi N�, (2000): Development and testing of an irrigation scheduling model� Agricultural Water Management 46 (2), 121–136�
Hashim M�A�A�, Siam N�, Al-Dosari A�, Asl-Gaadi K�A�, Patil V�C� (2012): Determination of Water Requirement and Crop Water Productivity of Crops Grown in the Makkah Region of Saudi Arabia� Australian Journal of Basic and Applied Sciences 6(9): 196–206�
Hillel D� (2003): Environmental soil physics� Academic Press, New York� 484 p�
Home P.G., Kar S., Panda R.K. (2000): Effect of irrigation scheduling on water and nitrogen balances in the crop root zone� Zeitschrift fuer Bewasserungswirtschaft 35(2), 223-235� http://www�fao�org/docrep/X5560E/X5560E00.htm [Accessed 23 November, 2015].
Hunsaker D�J�, Pinter P�J� Jr�, Cai H� (2002): Alfalfa basal crop coefficients for FAO-56 procedures in the desert regions of the Southwestern U�S�, Transactions of the ASAE 45(6): 1799–1815�
Kamel N�, Mohamed M�M�, Mechliaba N�B� (2012): Impacts of irrigation regimes with saline water on carrot productivity and soil salinity� Journal of the Saudi Society of Agricultural Sciences 11(1): 19–27�
Kang S�, Payne W�A�, Evett S�R�, Stewart B�A�, Robinson C�A� (2009): Simulation of winter wheat evapotranspira- tion in Texas and Henan using three models of differing complexity. Agricultural Water Management 96, 167–178�
Manjunath B�L�, Mishra P�K�, Rao J�V�, Reddy G�S� (1994): Water requirement of vegetables in a dry-land watershed� Indian Journal of Agricultural Sciences 64 (12), 845–846�
Marica A� (2013): Short description of the CROPWAT model� http://agromet cost.bo.ibimet.cnr.it/fileadmin/cost718/repository/cropwat�pdf) (Accessed 24 April, 2014)
Mhashu S�V� (2007): Yield response to water function and simulation of deficit irrigation scheduling of sugarcane at estate in Zimbabwe using CROPWAT 8�0 and CLIMWAT 2�0, Master thesis, Universita` degli Studi di Firenze Facolta´ di Agraria (University of Florence, Faculty of Agriculture)�
Mimi Z�A�, Jamous S�A� (2010): Climate change and agricultural water demand: impacts and adaptations� African Journal of Environmental Science and Technology 4 (4), 183–191�
Narasimhan B�, Srinivasan R� (2005): Development and evaluation of Soil Moisture Deficit Index (SMDI) and Evapotranspiration Deficit Index (ETDI) for agricultural drought monitoring� Agricultural and Forest Meteorology, 133: 69–88�
Nazeer M� (2009): Simulation of maize crop under
irrigated and rainfed conditions with CROPWAT model� ARPN Journal of Agricultural and Biological Sciences 4 (2), 68–73�
Odofin A.J., Oladiran J.A., Oladipo J.A., Wuya E.P. (2011): Determination of evapotranspiration and crop coefficients for bush okra (Corchorus olitorius) in a sub-humid area of Nigeria� African Journal of Agricultural Research 6(17) :3949 – 3953�
Ojanuga A�G� (1979): Evaluation of existing soil surveys of Northern Nigeria for irrigation development� 6th National Irrigation Seminar Proceeding, A�B�U�, Zaria, pp� 124 – 137�
Oshunsanya S�O�, Aiyelari E�A�, Aliku O�, Odekanyin R�A� (2016): Comparative Performance of Okra (Abelmoschus Esculentus) Under Subsistence Farming Using Drip and Watering Can Methods of Irrigation� Irrigation and Drainage System Engineerging 5: 159� doi:10�4172/2168-9768�1000159�
Ouda S�, Khalil F�, Gamal A�, Sayed A�H� (2011): Prediction of total water requirements for agriculture in the Arab world under climate change� Fifteenth International Water Technology Conference, IWTC-15 2011, Alexandria, Egypt�
Phene C�J�, Reginato R�J�, Itier B�, Tanner B�R� (1990): Sensing irrigation needs� pp� 207-261� In: G.J. Hoffman, T�A� Howell, and K�H� Solomon (eds�) Management of Farm Irrigation Systems, Am� Soc� Agric� Engr�, St� Joseph, MI� USA
Saif-ud-din, Al-Rumikhani Y�A�, Mohammad S�L� (2004): Use of remote sensing and agrometerology for irrigation management in arid lands: A case study from Northwestern Saudi Arabia� Journal of Environmental Hydrology 2 (9): 10–17�
Sheng-Feng K�, Shin-Shen H�, Chen-Wuing L� (2006): Estimation irrigation water requirements with derived crop coefficients for upland and paddy crops in Chia Nan Irrigation Association, Taiwan� Agricultural Water Management 82 (6), 433–451�
Singh B.P. (1987): Effect of irrigation on the growth and yield of okra� Horticulture Science, 22, 879–880�
Smith K�A�, Mullins C�E� (1991): Soil Analysis: Physical Methods� Marcel Dekker, New York, 620 p�
Smith M� (1991): CROPWAT Manual and Guidelines� FAO of UN, Rome�
Snyder R�L�, Bali K�M� (2012): Irrigation scheduling of alfalfa using evapotranspiration� In: Proceedings, 2008 California Alfalfa and Forage Symposium and Western Seed Conference, San Diego, CA, 2-4 December, 2008�
Stancalie G�, Marica A�, Toulios L� (2010): Using earth observation data and CROPWAT model to estimate the actual crop evapotranspiration� Physics and Chemistry of the Earth 35, 25–30�
28
AGRICULTURA TROPICA ET SUBTROPICA VOL. 49 (1-4) 2016

Sys C� (1985): Land evaluation� State University of Ghent, International Training Centre for Postgraduate Soil Scientists, Parts 1, 11, and 111, Ghent�
Van Genuchten M�Th�, Leij F�J� (1992): On estimating the hydraulic properties of unsaturated soils� pp� 1–14� In: M�Th� Van Genuchten et al� (ed�) indirect methods for
estimating the hydraulic properties of unsaturated soils� University of California, Riverside, CA�
Received: November 29, 2015 Accepted after revisions: September 29, 2016
29
AGRICULTURA TROPICA ET SUBTROPICA VOL. 49 (1-4) 2016
Corresponding author:
OrevaOghene Aliku Department of AgronomyFaculty of Agriculture and Forestry University of Ibadan, Ibadan, NigeriaE-mail: orevaoghenealiku@gmail�com Phone: +234 803 939 7324

30
Introduction
The global livestock sector is growing faster than any other agricultural sector; it is currently the single largest anthropogenic user of land, and the source of many environmental problems, including global warming and climate change (Keith, 2008)�The switch in food consumption pattern from traditional cereals and root crops to wheat based processed foods, high protein and animal products has accentuated the demand for more livestock� The global meat and milk production is expected to be more than double in the next half century (Mongabay, 2006)� FAO (2007) report showed that livestock contributes 37% of methane emission, 9% of carbon-dioxide output and utilizes 8% of the world water� �According to the United Nations Food and Agriculture Organization, animal production is presently responsible for 18% of all human-induced greenhouse gas emissions (Steinfeld, 2006)� The threat that climate changes pose to agricultural production does not only cover the area of crop husbandry but also includes livestock and in fact the total agricultural sector� African farmers also depend on livestock for income, food and animal products (Nin et al. 2007). Climate can affect livestock both directly and indirectly (Adams et al� 1999; Manning and Nobrew, 2001). Direct effects of climate variables such as air, temperature, humidity, wind speed and other climate factors influence animal performance such as
growth, milk production, wool production and reproduction� Climate can also affect the quantity and quality of feedstuffs such as pasture, forage, and grain and the severity and distribution of livestock diseases and parasite (Niggol and Mendelsohn, 2008)� Hence, the totality of agricultural sector is considered by examining agricultural productivity�
Climate change is the most severe problem that the world is facing today (Ayindeet al., 2011). It has been identified that it is a more serious threat than global terrorism (King, 2004). Climate change affects food and water resources that are critical for livelihood in Africa where much of the population especially the poor, rely on local supply system that are sensitive to climate variation (Ayinde et al�, 2011)� Rainfall is by far the most important element of climate change in Nigeria and water resources potential in the country (Adejumo, 2004)� Agriculture in Nigeria is mostly rain-fed, it follows therefore that any change in climate is bound to influence agricultural productivity and livestock production in particular and other socio-economic activities in the country (Ayinde et al�, 2011)� The issue of climate change has become more threatening not only to the sustainable development of socio-economic and agricultural activities of any nation but also to the totality of human existence (Adejuwon, 2004)�
The nation’s natural and agricultural ecosystems, including freshwater and coastal resources, are highly susceptible to the effects of climate change (NASPA-CCN,
DOI: 10.1515/ats-2016-0004 AGRICULTURA TROPICA ET SUBTROPICA, 49/1-4, 30-37, 2016
Original Research Paper
Climate Variability and Livestock Production in Nigeria: Lessons for Sustainable Livestock Production
Grace Zibah Rekwot, Anosike Francis Ugo, Oke-Egbodo Brenda Engo
National Animal Production Research Institute,Ahmadu Bello University, Shika-Zaria, Nigeria
Abstract
The study examined the relationship between climate variability and livestock production and the lessons that can be drawn for achieving sustainable livestock production in Nigeria� The study employed time series data on annual rainfall and livestock production given by index of the aggregate livestock production over the period of 1970 to 2008� The data were obtained from various publications of the Central Bank of Nigeria and the Nigerian Meteorological Agency� The data were analyzed through the instrumentality of econometric tools such as Augmented Dickey Fuller (ADF) test, Vector auto regression (VAR) lag order selection test and Pairwise granger causality� The results of the data analysis revealed the existence of unidirectional causality from climate variability to livestock production in Nigeria and this implies that climate variability has been significant in influencing livestock production over the period under study. Based on the foregoing, it is recommended as a matter of urgency that government should continually sensitize farmers on the challenges of climate change and feasible adaptation measures that they can adhere to in order to avert the detrimental effects of climate change on sustainable livestock production� In other words, implementation of the policy thrust on climate smart agriculture should be pursued vigorously�
Keywords: Livestock production; climate variability; flood; drought.
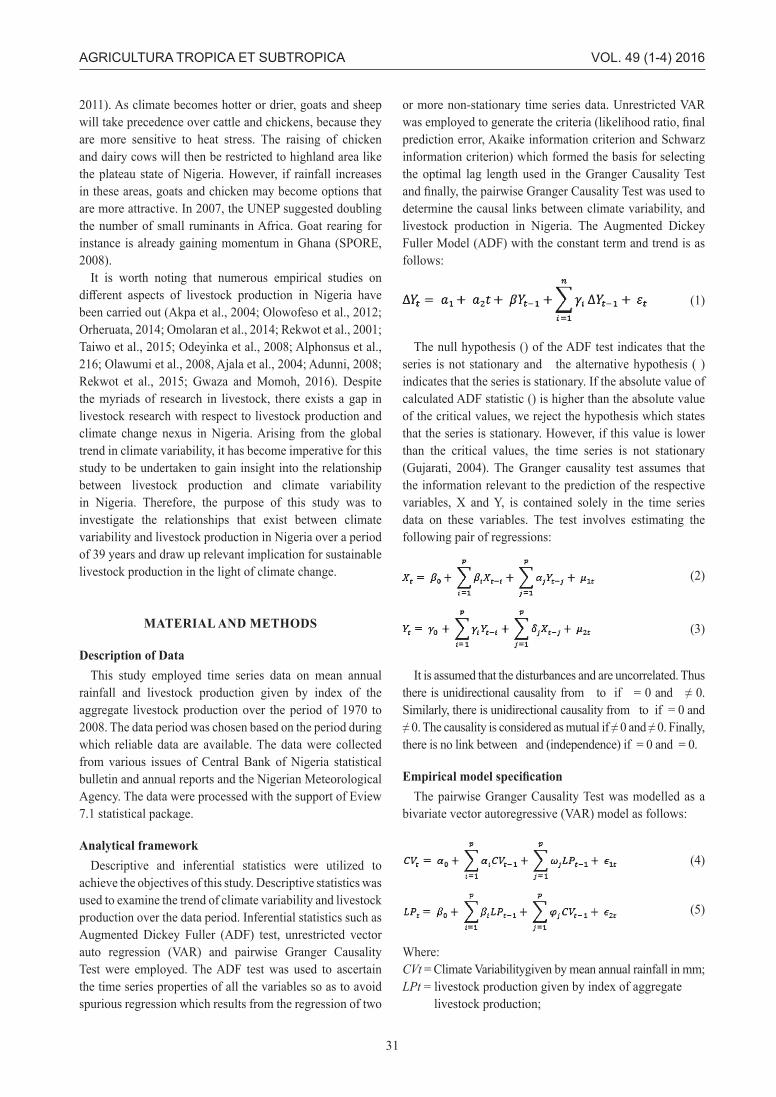
2011)� As climate becomes hotter or drier, goats and sheep will take precedence over cattle and chickens, because they are more sensitive to heat stress� The raising of chicken and dairy cows will then be restricted to highland area like the plateau state of Nigeria� However, if rainfall increases in these areas, goats and chicken may become options that are more attractive� In 2007, the UNEP suggested doubling the number of small ruminants in Africa� Goat rearing for instance is already gaining momentum in Ghana (SPORE, 2008)�
It is worth noting that numerous empirical studies on different aspects of livestock production in Nigeria have been carried out (Akpa et al�, 2004; Olowofeso et al�, 2012; Orheruata, 2014; Omolaran et al�, 2014; Rekwot et al�, 2001; Taiwo et al�, 2015; Odeyinka et al�, 2008; Alphonsus et al�, 216; Olawumi et al�, 2008, Ajala et al�, 2004; Adunni, 2008; Rekwot et al�, 2015; Gwaza and Momoh, 2016)� Despite the myriads of research in livestock, there exists a gap in livestock research with respect to livestock production and climate change nexus in Nigeria� Arising from the global trend in climate variability, it has become imperative for this study to be undertaken to gain insight into the relationship between livestock production and climate variability in Nigeria� Therefore, the purpose of this study was to investigate the relationships that exist between climate variability and livestock production in Nigeria over a period of 39 years and draw up relevant implication for sustainable livestock production in the light of climate change�
MATERIAL AND METHODS
Description of DataThis study employed time series data on mean annual
rainfall and livestock production given by index of the aggregate livestock production over the period of 1970 to 2008� The data period was chosen based on the period during which reliable data are available� The data were collected from various issues of Central Bank of Nigeria statistical bulletin and annual reports and the Nigerian Meteorological Agency� The data were processed with the support of Eview 7�1 statistical package�
Analytical frameworkDescriptive and inferential statistics were utilized to
achieve the objectives of this study� Descriptive statistics was used to examine the trend of climate variability and livestock production over the data period� Inferential statistics such as Augmented Dickey Fuller (ADF) test, unrestricted vector auto regression (VAR) and pairwise Granger Causality Test were employed� The ADF test was used to ascertain the time series properties of all the variables so as to avoid spurious regression which results from the regression of two
or more non-stationary time series data� Unrestricted VAR was employed to generate the criteria (likelihood ratio, final prediction error, Akaike information criterion and Schwarz information criterion) which formed the basis for selecting the optimal lag length used in the Granger Causality Test and finally, the pairwise Granger Causality Test was used to determine the causal links between climate variability, and livestock production in Nigeria� The Augmented Dickey Fuller Model (ADF) with the constant term and trend is as follows:
(1)
The null hypothesis () of the ADF test indicates that the series is not stationary and the alternative hypothesis ( ) indicates that the series is stationary� If the absolute value of calculated ADF statistic () is higher than the absolute value of the critical values, we reject the hypothesis which states that the series is stationary� However, if this value is lower than the critical values, the time series is not stationary (Gujarati, 2004)� The Granger causality test assumes that the information relevant to the prediction of the respective variables, X and Y, is contained solely in the time series data on these variables� The test involves estimating the following pair of regressions:
(2)
(3)
It is assumed that the disturbances and are uncorrelated� Thus there is unidirectional causality from to if = 0 and ≠ 0. Similarly, there is unidirectional causality from to if = 0 and ≠ 0. The causality is considered as mutual if ≠ 0 and ≠ 0. Finally, there is no link between and (independence) if = 0 and = 0�
Empirical model specificationThe pairwise Granger Causality Test was modelled as a
bivariate vector autoregressive (VAR) model as follows:
(4)
(5)
Where:CVt = Climate Variabilitygiven by mean annual rainfall in mm;LPt = livestock production given by index of aggregate livestock production;
31
AGRICULTURA TROPICA ET SUBTROPICA VOL. 49 (1-4) 2016

α0, β0= Constant terms,αi, ϖj = Estimated coefficients;ε1t, ε2t = Gaussian white noise error terms;p = optimal lag length�
RESULTS AND DISCUSSION
Descriptive statistics of variables It is important to examine the summary statistics of the
variables under study (climate variability and livestock production)� The basic features of livestock production
and climate variability in this study are given in Table 1� Livestock production is positively skewed (most values are concentrated on left of the mean, with extreme values to the right), platykurtic (flatter than a normal distribution with a wider peak) and the probability value (0�08) of its Jarque-Bera statistic (4�99) denotes that its errors are normally distributed� Climate variability is positively skewed; platykurtic and its errors are normally distributed based on the Jarque-Bera statistic (14.99) which is significant at 1% probability level�
Augmented dickey fuller unit root testThe result of the unit root test from the augmented
dickey fuller (ADF) test is presented in Table 2� lnCV and lnLP were found to be non-stationary at level form leading to the acceptance of the null hypothesis of the ADF test. The variables became stationary after first difference. The differencing was necessary so as to avoid spurious result when the variables are used in their non-stationary form�
Vector Autoregression (VAR) lag order selection criteriaThe result presented Table 3 shows that VAR model was
fitted to the time series data in order to find an appropriate lag structure for the granger causality test� This was necessitated by the sensitivity of granger causality to lag length structure (Foresti, 2006; Afzal, 2012; Oyinbo and Rekwot, 2014)� The result on Table 3 indicates that the optimal lag length is one
32
AGRICULTURA TROPICA ET SUBTROPICA VOL. 49 (1-4) 2016
Variable ADF Statistic Test Critical value (5%) InferenceLevel LnRF0�3226 -3�6156Non-StationaryLnLP0�9044 -3�6156Non-stationaryFirst difference∆lnRF-6.7073 -3.6210 Stationary∆lnLP-4.8311 -3.6122 Stationary
Table 2. Summarized result of Augmented Dickey Fuller test
NB: ln = natural logarithm ∆ = difference operator Lag length selection was automatic based on Schwarz Information criterion (SIC)
t-Statistic Prob�*
Augmented Dickey-Fuller test statistic 0�322598 0�9765Test critical values: 1% level -3�615588 5% level -2�941145 10% level -2�609066
Original printoutNull Hypothesis: RF has a unit rootExogenous: ConstantLag Length: 0 (Automatic - based on SIC, maxlag=9)
*MacKinnon (1996) one-sided p-values�
Mean 152�7995 573�0000 Median 117�8000 395�0000 Maximum 321�4000 1735�000 Minimum 73�60000 193�0000 Std� Dev� 80�17630 449�4793 Skewness 0�828852 1�491753 Kurtosis 2�429430 3�572739 Jarque-Bera 4�994492 14�99768 Probability 0�082311 0�000554 Sum 5959�180 22347�00 Sum Sq� Dev� 244273�1 7677204� Observations 39 39
Table 1. Descriptive statistics of livestock production and rainfall in Nigeria (1970 – 2008)Original printout
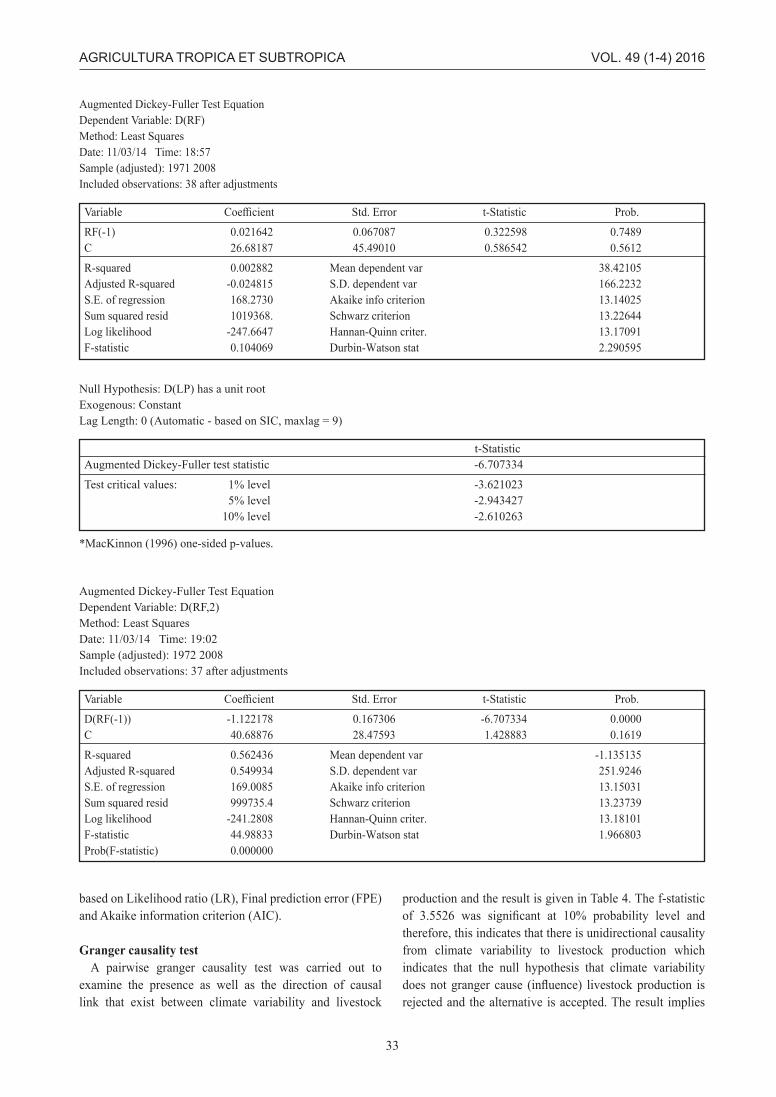
based on Likelihood ratio (LR), Final prediction error (FPE) and Akaike information criterion (AIC)�
granger causality test A pairwise granger causality test was carried out to
examine the presence as well as the direction of causal link that exist between climate variability and livestock
production and the result is given in Table 4� The f-statistic of 3.5526 was significant at 10% probability level and therefore, this indicates that there is unidirectional causality from climate variability to livestock production which indicates that the null hypothesis that climate variability does not granger cause (influence) livestock production is rejected and the alternative is accepted� The result implies
33
AGRICULTURA TROPICA ET SUBTROPICA VOL. 49 (1-4) 2016
Variable Coefficient Std. Error t-Statistic Prob.
RF(-1) 0�021642 0�067087 0�322598 0�7489C 26�68187 45�49010 0�586542 0�5612
R-squared 0�002882 Mean dependent var 38�42105Adjusted R-squared -0�024815 S�D� dependent var 166�2232S�E� of regression 168�2730 Akaike info criterion 13�14025Sum squared resid 1019368� Schwarz criterion 13�22644Log likelihood -247�6647 Hannan-Quinn criter� 13�17091F-statistic 0�104069 Durbin-Watson stat 2�290595
Augmented Dickey-Fuller Test Equation Dependent Variable: D(RF) Method: Least Squares Date: 11/03/14 Time: 18:57 Sample (adjusted): 1971 2008 Included observations: 38 after adjustments
t-StatisticAugmented Dickey-Fuller test statistic -6�707334
Test critical values: 1% level -3�621023 5% level -2�943427 10% level -2�610263
Null Hypothesis: D(LP) has a unit root Exogenous: Constant Lag Length: 0 (Automatic - based on SIC, maxlag = 9)
*MacKinnon (1996) one-sided p-values�
Variable Coefficient Std. Error t-Statistic Prob.
D(RF(-1)) -1�122178 0�167306 -6�707334 0�0000C 40�68876 28�47593 1�428883 0�1619
R-squared 0�562436 Mean dependent var -1�135135Adjusted R-squared 0�549934 S�D� dependent var 251�9246S�E� of regression 169�0085 Akaike info criterion 13�15031Sum squared resid 999735�4 Schwarz criterion 13�23739Log likelihood -241�2808 Hannan-Quinn criter� 13�18101F-statistic 44�98833 Durbin-Watson stat 1�966803Prob(F-statistic) 0�000000
Augmented Dickey-Fuller Test Equation Dependent Variable: D(RF,2) Method: Least Squares Date: 11/03/14 Time: 19:02 Sample (adjusted): 1972 2008 Included observations: 37 after adjustments
that climate variability has been significant in influencing the trend of livestock production over the period under study and this collaborates the findings of Adeolu and Adeyemo (2011) who noted that climate variability especially rainfall has a direct often adverse effects on the quantity and quality of agricultural production� Therefore, in the face of changing climate, which influences rainfall and drought, climate variability affects livestock production in Nigeria. Low rainfall (drought) induces environmental changes in temperature which results in heat stress especially in Nigeria
which has a negative effect on the reproductive capacity of livestock� This is in consistent with Ayinde et al� (2011) who reported that high temperature depletes soil nutrient making it hard on livestock and agricultural production� Besides drought, high rainfall (flooding) has negative feeding and reproduction effect on livestock and it causes damage to pasture� In the words of Smith et al� (1996) climate change will affect animal production in four ways; the impact of changes on livestock feed-grain availability and price; the impact on livestock pastures and forage crop production
34
AGRICULTURA TROPICA ET SUBTROPICA VOL. 49 (1-4) 2016
Variable Coefficient Std. Error t-Statistic Prob.
LP(-1) 0�023241 0�025699 0�904356 0�3718C 2�430295 4�303165 0�564769 0�5757
R-squared 0�022214 Mean dependent var 5�892105Adjusted R-squared -0�004947 S�D� dependent var 12�08789S�E� of regression 12�11775 Akaike info criterion 7�878415Sum squared resid 5286�234 Schwarz criterion 7�964604Log likelihood -147�6899 Hannan-Quinn criter� 7�909081F-statistic 0�817860 Durbin-Watson stat 1�711721Prob(F-statistic) 0�371819
Augmented Dickey-Fuller Test Equation Dependent Variable: D(LP) Method: Least Squares Date: 11/03/14 Time: 19:01 Sample (adjusted): 1971 2008 Included observations: 38 after adjustments
*MacKinnon (1996) one-sided p-values�
t-Statistic Prob�*
Augmented Dickey-Fuller test statistic 0�904356 0�9945Test critical values: 1% level -3�615588 5% level -2�941145 10% level -2�609066
Null Hypothesis: LP has a unit root Exogenous: Constant Lag Length: 0 (Automatic - based on SIC, maxlag=9)
*MacKinnon (1996) one-sided p-values�
t-Statistic Prob�*
Augmented Dickey-Fuller test statistic -4�831111 0�0004
Test critical values: 1% level -3�621023 5% level -2�943427 10% level -2�610263
Null Hypothesis: D(LP) has a unit root Exogenous: Constant Lag Length: 0 (Automatic - based on SIC, maxlag=9)

and quality; changes in livestock diseases and pests; and the direct effects of weather and extreme events on animal health, growth and reproduction�
Lessons for sustainable livestock productionThis study has succeeded in establishing the significant
influence of climate variability in enhancing livestock in
35
AGRICULTURA TROPICA ET SUBTROPICA VOL. 49 (1-4) 2016
Variable Coefficient Std. Error t-Statistic Prob.
D(LP(-1)) -0�869027 0�179881 -4�831111 0�0000C 5�158555 2�346840 2�198086 0�0346
R-squared 0�400065 Mean dependent var -0�585946Adjusted R-squared 0�382924 S�D� dependent var 15�66729S�E� of regression 12�30731 Akaike info criterion 7�910803Sum squared resid 5301�448 Schwarz criterion 7�997879Log likelihood -144�3498 Hannan-Quinn criter� 7�941501F-statistic 23�33963 Durbin-Watson stat 1�907087Prob(F-statistic) 0�000027
Augmented Dickey-Fuller Test Equation Dependent Variable: D(LP,2) Method: Least Squares Date: 11/03/14 Time: 19:02 Sample (adjusted): 1972 2008 Included observations: 37 after adjustments
Lag LogL LR FPE AIC SC HQ
0 -456�9612 NA 4�06e+08 25�49784 25�58582 25�52855 1 -366�2051 166�3861* 3279109�* 20�67806* 20�94198* 20�77018* 2 -364�5502 2�850190 3746011� 20�80834 21�24821 20�96187 3 -361�5507 4�832380 3985635� 20�86393 21�47974 21�07887
Original printoutVAR Lag Order Selection Criteria Endogenous variables: LP RF Exogenous variables: C Date: 11/03/14 Time: 19:14 Sample: 1970 2008 Included observations: 36
Table 3� VAR lag order selection result
* indicates lag order selected by the criterion LR: sequential modified LR test statistic (each test at 5% level) FPE: Final prediction error AIC: Akaike information criterion SC: Schwarz information criterion HQ: Hannan-Quinn information criterion
Null Hypothesis: Obs F-Statistic Prob�
LP does not Granger Cause RF 38 1�18436 0�2839 RF does not Granger Cause LP 3�55261 0�0678
Pairwise granger Ccausality Test
Pairwise Granger Causality Tests Date: 11/03/14 Time: 19:15 Sample: 1970 2008 Lags: 1
Table 4. Result of P

Nigeria. The results confirmed the findings of NRC (2002) who noted that lack of prior conditioning of livestock to weather events such as temperature and drought often result to catastrophic losses in the domestic livestock industry. Ambient temperature has the greatest influence on voluntary feed intake and this explain the poor performances of local herds in the supply of animal protein required in Nigeria� Also, Amogu (2009) noted that those unfavorable environmental situations hinder livestock production in Nigeria� Climate change will have far-reaching consequences for livestock production, especially in vulnerable parts of the country where it is vital for nutrition and livelihoods� The impact of climate change can heighten the vulnerability of livestock systems and exacerbate existing stress upon them, such as droughtthat affects livestock production. Hence, sustainability of livestock production in the face of climatic variation calls for adaptation measures to prevent its adverse effect on livestock production.
Implementation of climate smart agriculture (an approach that helps to guide actions needed to transform and reorient agricultural systems to effectively support development and ensure food security in a changing climate) in Nigeria can guarantee sustainable livestock production in the face of climate change� The policy trust on climate smart agriculture contained in the agriculture promotion policy for the period of 2016 – 2020 (FMARD, 2016) will reduce the effects of climate change on agriculture (livestock inclusive) if properly implemented�
CONCLUSION
Using annual data on rainfall and index of livestock production in Nigeria over the period of 1970 to 2008, this study investigated the relationships that exist between climate variability and livestock production in Nigeria� The major finding of the study was that climate variability has been significant in influencing livestock production over the years� Climate variability resulting from climatic change poses a threat to livestock production in terms of their reproductive capacity and feeding habit of the animals� Based on the foregoing, it is recommended as a matter of urgency that government should continually sensitize farmers on the challenges of climate change and feasible adaptation measures that they can adhere to in order to avert the detrimental effects of climate change on livestock production� Essentially, the policy trust on climate smart agriculture put forward in the agriculture promotion policy (2016 – 2020) in Nigeria should be implemented accordingly�
REFERENCES
Adams R�, McCarl B�, Segerson K�, Rosenzweig C�, Bryant, K�J�, Dixon, B� L�, Conner R�, Everson R�E�, Ojima D�
(1999): The economic effect of climate change on United States agriculture� In: R Mendelsohn, J Neuman (Eds�): The Impact of Climate Change on the United States Economy�: Cambridge University, pp� 18–54�
Adejuwon S�A� (2004): Impact of climate variability and climate change on crop yield in Nigeria� Contributed Paper to Stakeholders Workshop on Assessment of Impact and Adaptation to Climate Change (AIACC): 2–8
Adeolu B�A�, Adeyemo V�A� (2011): Rainfall variability and food cropproduction: the case of maize in Osun state, Nigeria� In: Erahabor, P�O�, Ada-Okungbowa, C�I�, Emokaro, C�O� and Abiola, M�O� (Eds), From Farm to Table: Whither Nigeria? Proceeding of the 12th National Conference of the Nigerian Association of Agricultural Economists (NAAE), University of Benin, 13th – 16th November� pp� 524–533�
Adunni S�A� (2008): Animal traction: an underused low external input technology among farming communities in Kaduna state, Nigeria� Tropicultura 26 (1): 48–52�
Ajala M�K�, Alli-Balogun J�K� (2004): Economics of rabbit production in Zaria, Kaduna State, Nigeria�Tropical Journals of Animal Science 7: 1–10�
Akpa, G�N�, Jokthan, G�E�, Ogunleye, K�O� Lakpini, C�A�M� (2004): Genetic and non-genetic sources of variation for litter size, gestation length and sex ratio in Nigerian goats� Journal of sustainable Tropical Agricultural Research 12: 66–70�
Alphonsus C�, Akpa G� N�, Nwagu B� I�, Barje P� P�, Sam I� M�, Abdullahi I�, Finangwai H� I�, Achi N� P�, Olobatoke R� Y., Olaiya O., Opoola E. (2016): Effect of Post-Partum Body Condition Score on Fertility and Milk Yield of Friesian X Bunaji Dairy Cows� Journal of Animal Science Advances 6 (2): 1537–1542�
Amogu U� (2009): Maximizing the animal production value addition chain in Nigeria� Invited presentation at Nigeria Institute of Animal science, Annual General Meeting, University of Calabar, July 28, 2009�
Ayinde O.E., Muchiea M., Olatunjib G.B. (2011): Effect of Climate Change on Agricultural Productivity in Nigeria: A Co-integration Model Approach Journal of Human Ecology 35(3): 189–194�
Food and Agriculture Organization (FAO), (2007): Managing livestock-environment interactions, a report to the FAO committee on Agriculture� In: CTA special issue- August 2008� http://spore�cta�int�
Federal Ministry of Agriculture & Rural Development (FMARD), (2016): The Agriculture Promotion Policy (2016 – 2020): Building on the Successes of the ATA, Closing Key Gaps� Policy and Strategy Document�
Gwaza, D�S�, Momoh, O�M� (2016): Endangered indigenous cattle Breeds of Nigeria a case for their conservation and management. World Scientific News 30: 68–88.
Intergovernmental Panel on Climate Change (IPCC) (2007): Impacts, adaptation and vulnerability: The Working Group II Contribution to the Intergovernmental panel on climate
36
AGRICULTURA TROPICA ET SUBTROPICA VOL. 49 (1-4) 2016

change fourth assessment report� Cambridge University Press�
Keith R� (2008): Farm animal production and climate change� http://www�temasactuales�com�
Manning M�, Nobrew C� (2001): Technical Summary Impact, Adaption and Vulnerability: A Report of Working Group II of the Intergovernmental Panel on Climate Change� In: J� McCarthy, O�F� Canziani, N�A� Leavy, J�D� Dekken, C� White Eds�): Climate Change: Impact, Adaption and Vulnerability� Cambridge: Cambridge University Press, pp� 44-65�
Mungabay C� (2006): Cattle produce more global warming gases than cow� http://newa�mongabay�com/2006/1130-un�html�
National Adaptation Strategy and Plan of Action on Climate Change for Nigeria (NASPA-CCN) (2011): Prepared for the Federal Ministry of Environment special Climate Change unit by the Building Nigeria’s Response to Climate Change (BNRCC) project�
Niggol S�, Mendelsohn R� (2008): Animal Husbandry in Africa: Climate impacts and adaptations� African Association of Agricultural Economists 2(1): 66�
Nin A�, Ehui S�, Benin S� (2007): Livestock productivity in developing countries: An assessment� In: R� Evenson, P� Pingali (Eds�): Handbook of Agricultural Economics (3)� North Holland, Oxford Press, pp� 2467–2532�
(NRC) National Research Council (2002): Abrupt climate change inevitable surprises� National Academy Ppress, Washington, D� C�, National Academy Press�
Odeyinka S� M�, Oyedele O� J�, Adeleke T� O�, Odedire J� A� (2008): Reproductive performance of rabbits fed Moringa oleifera as a replacement for Centrosema pubescens� 9th World Rabbit Congress Verona-Italy, June 10-13, pp� 411-416
Olowofeso, O�, Adejuwon, A� J�, Ademokoya V�A�, Durosaro, S�O� (2012): Breeding and Productive Performance of Three Breeds of Rabbit in South-West Nigeria� Global Journal of Science Frontier Research Bio-Tech & Genetics 12(5):35–38�
Omolaran B� B�, Odunayo J� O�, Sunday A� I�, Jimoh M�, Micheal S�, Afolabi�, Musibau A� A�, Suleiman, Y� A� (2014): Agro-nutritional variations of quality protein maize (Zea mays) in Nigeria� Journal of Agricultural Sciences 59 (2): 101–116�
Orheruata M� A� (2014): Animals with low productivity everywhere: increasing productivity, the breeder’s task� Inaugural lecture Series 140, University of Benin�
Oyetade L. (2007): Desertification in Nigeria (African Agriculture)�Text of a lecture delivered at the 38th interdisciplinary research discourse, postgraduate school, University of Ibadan, 11th December, 2007�
Olawunmi, O�O�, Salako, A�E�, Afuwape, A�A� (2008): Morphometric differentiation andassessment of function of the Fulani and Yoruba ecotype indigenous Chickens of Nigeria� International Journal Morphology 26(4): 975–980�
Oyinbo O�, Emmanuel, Y�D� (2012): Empirical Assessment of the Growth Rate of Maize Production in the Pre – SAP, SAP and Post – SAP Periods in Nigeria, Russian Journal of Agricultural and Socio-economic Sciences 5 (5) : 23–27�
Oyinbo O�, Rekwot G�Z� (2014): The Relationships of Inflationary Trend, Agricultural Productivity and Economic Growth in Nigeria, CBN Journal of Applied Statistics 5 (1): 35-47�
Rekwot P�I�, Oguw D�, Oyedipo E�O�, Sekini V�O� (2001): The role of pheromones and biostimulation in animal reproduction� Animal Reproductive Science 30 (3-4):157–170�
Rekwot G� Z�, Oyinbo O�, Lasisi T�O� (2015): Adoption of IAR improved groundnut varieties for livestock production in Jigawa state, Nigeria� Biological and Environmental Sciences Journal for the Tropics 12(2): 790–794�
Smith B�, McNabb D�, Smithers J� (1996): Agricultural adaptation to climatic variation� Climate Change 43: 7-29�
Steinfeld H�,Gerber P�, Wassenaar T�, Castel V�, Rosales M�, de Haan C� (2006): ‘Livestock’s Long Shadow: Environmental Issues and Options, Food and Agricultural Organization’ p� 21�
Spore (2008): Climate Change� Leplaideur M (ed�) SPORE Magazine, August, The Netherlands�
Taiwo B.B.A., Buvanendran V., Adu I.F. (2005): Effect of body condition score on the reproductive performance of Red Sokoto goats� Nigerian Journal of Animal Production 32 (1):1–6�
Received: October 14, 2015 Accepted after revisions: September 29, 2016
37
AGRICULTURA TROPICA ET SUBTROPICA VOL. 49 (1-4) 2016
Corresponding author:
Rekwot grace ZibahNational Animal Production Research InstituteAhmadu Bello University, Shika-Zaria, NigeriaE-mail: zrekwot@gmail�comPhone: 08038013957

INTRODUCTION
Nigeria is the first largest producer of sweet potato (Ipomoea batatas (L) Lam) in Africa with 3�46 million metric tons annually (FAO, 2008)� Sweet potato is one of the most important staple carbohydrate foods in sub-Saharan Africa� As a crop that requires low inputs of land, labour and capital and less management in its production; it does well on marginal soils and erratic rainfall, giving reasonable yield than most other crops (Ogbonna et al�, 2005; Attaliru and Ilangantileke, 2007)� It has high energy fixing efficiency, produces much dry matter at a short period of time and contains high levels of vitamins A and C (Nwokocha and Onunka, 2002)� Apart from the roots, the young leaves of sweet potato serve as green vegetable for man, while the leaves and vines are cherished as fodder and hay by livestock (Villareal et al�, 1985)� Its short life cycle of less than 20 weeks and yield potentials make crops like yam (Dioscorea spp.) relatively poor competitors for general industrial starch (NRCRI, 2009)�
The importance of sweet potatoes is increasing in the Nigerian food system because it is very easy to plant, matures easily and has numerous industrial and economic potentials (Chukwuka, 1999), it ranks among the five most important food crops in over 50 developing countries (All about sweet potatoes, 2008) and as the fifth primary investment commodity in south east Nigeria. It offers a particularly significant potential for increasing food production and income in Nigeria� Sweet potato is an important crop in many areas of the world being cultivated in over 100
countries (Le Van An, 2004)� Globally, it is estimated that sweet potato production will grow by 2�7% annually up to 2020� This exceeds the growth rate of all other major food crops (Scott et al�, 2000)�
Sweet potato benefits Nigeria as a whole by reducing the level of unemployment through creation of job in the farm (production sector) and provision of raw materials for industries to expand their scale of production (industrial sector). Industrially, sweet potato flour can be used to substitute wheat flour in bread making or mixed flour balanced feeds. Baby foods have been formulated using sweet potato while some bakeries blend 15-30% of sweet potato flour for making bread and 20-30% for pastries� It is also used in the brewing of alcoholic drinks and sweeteners in non-alcoholic drinks (Agbo and Ene, 1994)� Sweet potatoes also have medicinal value� It is a folk remedy for asthma, bug bite, burns, diarrhea, fever, stomach distress and weight loss; the leaf concoction is used as remedies for tumours of mouth and throat (Duke and Wain, 1981).
To harness the current potentials for sweet potato production and export, its production must be improved� Various government supported research and development activities have been undertaken in an effort to raise productivity of small-holder farmers. Despite the efforts directed at improving sweet potato production over the years, low productivity remains a major challenge in the sector� However, the resources must be used much more efficiently with more attention paid to eliminating waste. Studies have shown that food crop farmers in developing countries in general and Nigeria in particular, have low
38
DOI: 10.1515/ats-2016-0005 AGRICULTURA TROPICA ET SUBTROPICA, 49/1-4, 38-44, 2016
Original Research Article
Performance Analysis of Small Scale Sweet Potato Farms in Oyo State, Nigeria
Olayinka Isiaka Baruwa
Department of Agricultural Economics, Obafemi Awolowo University, Ile-Ife, Nigeria
Abstract
This study carried out an analysis of the performance of sweet potato production among small holder farmers in Oyo State of Nigeria� A combination of purposive and a two-stage random sampling technique were used to obtain information from 65 respondents� Data collected were analyzed using descriptive statistics, stochastic frontier functions and budgetary technique� Results indicated that majority of the farmers were literate, aged 43�3 years on the average, full time in sweet potato production and with mean farm size of 1.0 hectare. The gross margin and net profit were ₦76, 884.8 and ₦67,292.8, respectively (₦, naira Nigerian Currency, ₦160 = 1$US) indicating that sweet potato production was profitable. The return to scale (RTS) for the production function revealed that farmers operated in the irrational zone (stage I) of the production surface� The stochastic production frontier analysis revealed that the technical efficiencies of farmers was found to be fairly high with a mean of 0.92% which suggest that the average sweet potato output falls 0.08% short of the maximum possible level but the efficiency can be increased by better use of available resources�
Keywords: profitability; root and tuber crops; sub-Saharan Africa; technical efficiency.
productivity because of inefficiency in resource use (Amodu et al., 2011). For sweet potato specifically, empirical studies by Babatunde et al� (2007), Fawole (2007), and many others presented a similar picture. There is still insufficient production of sweet potato in Nigeria and room to improve on production through increased efficiency (Ndukwu, 2010).
Many researchers have tried to justify why efficiency is important in developing countries’ agriculture� Obwona (2006) stated that productivity increases do not depend on adoption rates of new technologies but effective use of available technologies� Thus, real productivity problems emanate from social and economic characteristics of the farmers� To achieve higher productivity, technological innovation is a necessary but not sufficient condition; efficient use of old technology is necessary. In developing countries, new technologies have partially succeeded in improving productivity due to institutional and cultural constraints (Xu and Jeffrey, 1998). If farmers are not efficiently using existing technologies, then ways of improving efficiency will be more cost effective in the short run than introducing another technology (Shapiro, 1983)� Unless the potential of existing technology is known and completely exploited, the benefits from new one may not be realized in the short run (Feder, 1985)�
Sweet potato is largely grown potentially as food, animal feeds, and raw materials source in Oyo State, Nigeria� Production of the crop is therefore motivated by the economic objective of producing maximum output to earning a positive economic return (profit). Meeting this objective requires efficient utilization of scarce resources. However, there could be intervening variables which may hinder agents to realize this objective� Hence there is need to examine the variables that influence technical efficiency of small-scale sweet potato farmers in Oyo State and their profitability. Specifically, the study examines the socio-economic characteristics of small-scale sweet potato farmers, determine the variables that influence technical efficiency of sweet potato production and estimate the profitability of small-scale sweet potato farmers in Oyo State with a view to determining profitability. Knowledge of this is necessary by suggesting measures that could be adopted towards increasing the level of production of sweet potato in the study area and in Nigeria�
MATERIALS AND METHODS
The study was carried out in Oyo State located in the south west Nigeria� The State has the population of 5,591,589 (NPC, 2006). Oyo State has thirty-three Local Government Areas (LGAs) distributed into two agro-ecological zones; rainforest and savannah zones� These zones are conducive for the practice of agriculture� The climate is equatorial,
notably with dry and wet season, the dry season starts from November to March while the wet season starts from April and ends in October� It is characterized by minimum rainfall of 1,211 mm and maximum of 1,262 mm which is suitable for the production of sweet potato in the State� A multi-stage sampling procedure was employed in selecting the sample� First stage involved a purposively sampling of three Local Government Areas (LGAs) namely Oyo East, Oyo West and Atiba LGAs in Oyo State because they are the major sweet potato producing areas in the State. At the second stage, four villages were randomly selected from each of the LGAs and at the last stage six sweet potato farmers from each of the four selected villages were randomly selected totaling seventy-two respondents� Out of the 72 copies of the questionnaire administered only 65 were found analyzable� Both primary and secondary data were used in this study� The primary data were collected using a pre-tested questionnaire on the socio-economic characteristics of the respondents; physical quantities and prices of inputs and output in the area during the 2013/2014 farming season� Data collected were analyzed using descriptive statistics, stochastic frontier functions and budgetary technique� The specific type of budgetary technique used was the gross margin analysis as well as the net farm income� The model is stated thus: GM = GI – TVC (1) Where: GM = Gross Margin; GI = Gross Income; TVC = Total Variable Cost NFI = GM – TFC (2) Where: NFI = Net Farm Income; GM = Gross Margin; TFC = Total Fixed Cost The model used for estimating net farm income can be expressed by the equation:
NFI = (3)
Where:Yi = Enterprise’s Product(s) (where i = 1, 2, 3……�n products); Pyi = Unit price of the product Xj = Quantity of the variable inputs (where j =, 1, 2, 3……… m variable inputs) Pxj = Price per unit of variable inputs; Fk = Cost of fixed inputs; Σ = Summation (addition) sign The total variable costs (TVC) include items like total cost of labour, transportation, fertilizer and seed� The total fixed cost (TFC) includes the depreciation on farm tools like hoes and cutlasses and the cost of renting land�
A stochastic production frontier model was used to measure technical efficiency and inefficiency of resources. The approach specifies the relationship between output and input levels using two errors terms� One error term is the traditional normal error term with a mean zero and constant variance� The other error term represents the
39
AGRICULTURA TROPICA ET SUBTROPICA VOL. 49 (1-4) 2016
nΣ P Y – i = 1 yi i
nΣ P Y – i = 1 xj ij
kΣ F k = 1 k

technical inefficiency which is subsequently estimated via Maximum Likelihood Estimation method (MLE) (Aigner et al�, 1977; Rahji, 2005)� The implicit function of the model can be written as:Yi=f (Xi,β) eε (4) Where: Yi= sweet potato output; Xi= vector of input; β = the parameter to be estimated,f (X1, β) = the deterministic part; eɛ= the stochastic part of the production frontierε = is the random error term; ε = Vi-Ui (5)Where,Vi= random variables called technical efficiency associated with the technical efficiency of production of farmers involved�Ui= random variables called technical inefficiency of production of farmers involved�An explicit function of the technical efficiency model is assumed to be specified by a Cobb Douglas frontier production function and defined as LnYi= βo + β1InX1 +β2lnX2 +β3lnX3 + β4lnX4+ Vi– Ui (6)Where, Ln = Natural logarithm i�e (logarithm to base e); Yi= Output of sweet potato in Kilogram (Kg)X1 = Land area in hectares (Ha); X2 = Fertilizer used (Kg); X3 = Seeds (sweet potato vine) (Kg)X4 = Labor (man-days); βo= Technical efficiency levelβ1, β2, β3, β4 = Coefficients of various inputs with respect to output level�An inefficiency model which assumes that the inefficiency effects are independently distributed is written in form of Cobb-Douglas production function�Ui = δo + δ1Z1 + δ2Z2 + δ3Z3 + δ4Z4 (7)Where, Ui = Farmers technical inefficiency; Z1 = Household size (Number); Z2 = Sex of farmer Z3 = Educational level; Z4 = Income from other crops (₦); δo, δ1, δ2,δ3, δ4 = Parameters to be estimatedIf Ui = 0 no technical inefficiency occurs, the production lies on the stochastic frontier� If Ui> 0, production lies below the frontier and it is inefficient.
Because the dependent variable in equation (7) is a measure of inefficiency, farm-specific variables with negative (positive) coefficient will have a positive (negative) effect on efficiency levels.
RESULTS AND DISCUSSION
Socio-economic characteristics of farmers
The majority (52�3%) of the respondents were within the age range of 41-50 years� The mean age (43�3 years)
of the respondents indicated that sweet potato farmers were mostly middle aged people� This falls within the economically productive proportion of the population as defined by Food and Agriculture Organization (1983). Gender distribution among farmers in sweet potato production is skewed slightly towards males (78�5%)� This finding agrees with Mbanaso et al. (2012) in the Southeast agro-ecological zone of Nigeria but at variance with the findings of Jude et al. (2011) in Imo State, Nigeria� Large proportions of (73�8%) of the sweet potato farmers were married with mean family size of 6� This may have a positive effect on the availability of family labour and thereby reduce the cost of hiring labour for sweet potato production� Table 1 also revealed that 30�8% of the farmers had no formal education, 20% had primary education, and 41�5% had secondary education, and 7�7% had tertiary education� The high (69�2%) literacy of the farmer will not only increases his productivity but also enhances his ability to understand and evaluate new production techniques (Amanze et al�, 2010)� Over 63% of farmers were primarily into sweet potato farming showed that sweet potato production can be relied upon as a major source of income for the family� None of the farmers cultivated more than 4�0 hectares of land� This means that all the sweet potato farmers in the study area were small-scale farmers� This in agreement with the findings by Amanze et al. (2010). The implication of this is that agricultural production in the study area is still not mechanized� Acquisition of farmland among sweet potato farmers had not deviated from the age-long trend as most of the farmers (60%) acquired their farmland through inheritance�
Stochastic frontier production function
The estimated sigma-square, (s2) (1�06) is statistically significant and different from zero at 1% level of significant indicates a good fit and correctness of the specified distribution assumption of composite error term (Table 2)� The estimate of the gamma (g) parameter is quite large (0�96) which is closest to 1 confirming that technical inefficiency effects are highly statistically significant at 1% in the stated model indicating that only 0�04% of the total variation in sweet potato output was due to technical inefficiency. This means that systematic influences that are unexplained by the production function are the dominant sources of random errors� The value of g suggests that the variance in production inefficiency effects accounts for 96% of the total variance in production� The log likelihood function was estimated to be 58�39� This value represents the value that maximizes the joint densities in the estimated model� Estimates of the coefficients of the frontier and inefficiency models are presented in Table 2�
40
AGRICULTURA TROPICA ET SUBTROPICA VOL. 49 (1-4) 2016

In both frontier and inefficiency models, the coefficients estimated for most parameters have the anticipated impacts on production and efficiency. In the frontier model, the positive and highly significant coefficient of land and other variables confirm the expected positive relationship between output of sweet potato and variables� The more the hectares of land and other variables used in production, the more the yield� The functional form used in the efficiency model was that of Cobb Douglas, so the coefficients are elasticity. The elasticity for all input parameters is >1, meaning that a 1% increase in the input of each coefficient would cause a >1% increase in the sweet potato production� The output elasticities for land
(0�42%), fertilizer (0�52%), seed (0�51% ) and labour (0�86% ) means that a 10% increase in land, fertilizer, seed and labour would lead to increases output of sweet potato by 4�2%, 5�2%, 5�1%, and 8�6% respectively� The return to scale estimate (2�31) indicates that sweet potato production in the study area was in stage one of production curve� Stage one is a region of increasing return to scale� This is an inefficient stage because increase in the use of inputs will lead to more than proportional increase in output� This means that sweet potato producers were inefficient at their level of production, their income and output can be improved if more inputs are utilized�
In inefficiency model, positive but less than unity of coefficients of farming experience, and household size indicates that these factors lead to decrease in technical efficiency. The positive and significant of farming experience at 5% does not follow the a priori expectation� In general, the more experience a farmer has the higher is his output and higher is the technical efficiency (Revilla-Molina et al., 2009). The finding is in line with the results of Fasasi (2007) and Raphael (2008)� The implication of estimated coefficient for household size been positive and significant at 10% level is that large household size would have negative impact on profitability of sweet potato production. This finding agrees with Okoye et
41
AGRICULTURA TROPICA ET SUBTROPICA VOL. 49 (1-4) 2016
Characteristics Distribution (%) Mean
Age of farmers (Years) 20-30 7�7 31-40 23�1 43�3 (8�21)*41-50 52�3 51 and above 16�9 gender of farmers Male 78�5 Female 21�5 Marital status Single 6�2 Married 73�8 Divorced 4�6 Widowed 15�4 Household size Less than 3 6�2 3-5 33�8 5�6 (1�82) *6 and above 60�0 Literacy level Primary 20�0 Secondary 41�5 Tertiary 7�7 No formal education 30�8 Mode of farming Full time 63�1 Part time 36�9 Farm Size distribution (Ha) 0�50- 0�999 69�2 1�00- 1�499 24�7 1�50-1�999 4�6 1�0 (1�51) *2�00 and above 1�5 Farmland acquired Gift 20�0 Lease 12�3 Purchase 7�7 Inheritances 60�0
Table 1. Percentage distribution of respondents according to their socio-economic characteristics
Source: Data analysis, 2014* Standard deviations
Variable Parameter Coefficient t-ratio
Frontier ModelConstant β0 4�57 (0�87) 5�25***Land β4 0�42 (0�19) 2�21***Fertilizer β2 0�52 (0�15) 3�47***Seed β3 0�51 (0�13) 3�92***Labour β4 0�86 (0�32) 2�69***
Inefficiency modelConstant δ0 -0�10(-0�51) -2�00Farming experience δ1 0�73(0�25) 2�93**Level of education δ2 -0�59(0�32) -2�71**Farm size δ3 -0�26 (0�14) -1�84*Household size δ4 0�36(0�19) 1�89*Diagnostic statisticsSigma-Squared (σ2 = σv
2 +σm2). σ2 -1�06(0�29) 3�65***
Gamma (γ = σm2 /σ2) γ 0.96 17.61***
Log Likelihood. λ 58.39Mean efficiency 0.92
Table 2. Maximum likelihood estimates of the stochastic frontier production function
Source: Computed from survey data, 2014*, **, *** Statistically significant at the 10%, 5%, and 1% levels, respectively�Note: A negative sign of the parameters in the inefficiency function means that the associated variable has a positive effect on technical efficiency, and vice versa.

al� (2007) who reported that a relatively large household size enhances the availability of labour though large household sizes may not guarantee increased efficiency since family labour which comprises mostly children of school age are always in school. Negativity of coefficient of education implies that increase in educational level of the farmers has the tendency of reducing the inefficiency level of sweet potato production� Education is expected to increase efficiency. This conforms to Amaza and Olayemi (2000) findings. The coefficient for farm size was significant and negatively related to technical efficiency at 1% levels of probability respectively� These results imply that smallholder farmers were more efficient; this reflects an intensive use of land resources by smallholder farmers (Jude et al�, 2011)� This is contrary to a priori expectations but agrees with Helfand and Levine (2004) who noted that if farm size is small, farmers are able to combine their resources better� A higher level of efficiency is due to the higher productivity of farm family labour and lower supervision costs compared to large farms (Eastwood et� al�, 2010)�
Budgetary analysis
The estimated costs and return for 1 hectare of sweet potatoes enterprises were ₦41,457.2 and ₦108,750, respectively (Table 3)� Cost of labour had the highest share of 25�3% of total cost followed by seed cost (22�4%) and fertilizer cost (20�4%)� The highest share of total cost of labour indicates that labour is an important input, and may be attributed to frequent harvesting of sweet potato vines� The high cost of labour emphasis that most farm operation was done by labour under small-scale farming system with little or no uses of machinery equipment for their farm operation� This indicates the need to evaluate mechanized options to determine whether it is cost effective. The total variable costs and total fixed costs constituted 76.9% and 23.1% of the total cost of production, respectively, suggesting that the enterprise is not rigid� The total revenue on the average was ₦108,750/ha while the gross margin and return to management were ₦76,884.8 and ₦67,292.8 per farmer per hectare for last season production cycle respectively�
The profit margin percentage of 61.9% and return per capital outlay of 1.6 implied that for every ₦1 invested in sweet potato production enterprise there is a return of ₦1.60 to the enterprise and the operating cash expenses ratio of 29�3% connotes that 29�3% of gross revenue was to cover the operating expenses. The benefit cost ratio (BCR) was ₦2.6; it shows profit and indicates that the enterprise is profitable even with little capital invested into it� It is therefore possible to have higher value of BCR with increased capita, skilled labour� Using all these
measures of performance, sweet potato enterprise can be said to be profitable and profitability can still be increased under improved management�
CONCLUSION
The study examined the performance analysis of small scale sweet potato production in Oyo State in relation to the objective of the study� Sweet potato farmers were small scale and resource-poor, but they are fairly efficient in the use of their resources and any expansion in the use of any resources would bring more than proportionate increase in their output, given the increase returns – to – scale value obtained for the study� In order to meet the objective of boosting food production so as to reduce the level of food insecurity in Nigeria, it is suggested that sweet potato production should be increased by empowering sweet potato farmers and mobilizing them to enable them acquire production resources necessary to expand their farmland� Farm size, planting material, fertilizer and labour inputs were significant variables having positive impact on sweet potato output. For better efficiency, improvement on those key variables needed to be address�
42
AGRICULTURA TROPICA ET SUBTROPICA VOL. 49 (1-4) 2016
Item Mean amount Percentage of Na revenue/cost
Revenue1087�54kg of Sweet potato output at 100�kg-1 108,750 Total Revenue (TR) 108,750 Variable costsSeed cost (464�16 kg at N20� kg-1) 9,283�2 22�4Fertilizer cost( 84�62 kg at N100�Kg-1) 8,462 20�4Pesticide cost (0�62 L at N1000 L-1) 620 1�4Total labor cost (N750� man-day-1) 10,500 25�3Transportation cost 3,000 7�2Total Variable Cost (TVC) 31,865�2 76�9gross margin (gM) = (TR-TVC) 76,884�8 Fixed costs Land rent 4,500 10�8Depreciation on tools 5,092 12�3Total Fixed Costs (TFC) 9,592 23�1Total Cost (TC) = (TVC +TFC) 41,457�2 Net Income (NI) = (gM-TFC) 67,292�8 Profit margin (%) = NI/TR x100 61.9Rate of Return On Investment (RORI)= NI/TC 1�6Operating expenses ratio (%) = TVC/TR x 100 29�3Benefit cost ratio (BCR) = TR/TC 2.6
Table 3. Enterprise budget for one hectare of sweet potato production in Oyo State
Source: Field Survey, 2014.aN (Nigerian currency) = 1$ = N160

REFERENCES
Agbo F�M�, Ene L�S�O� (1994): Sweet potato situation and priority research in west/central Africa� Proceedings of the International Potato Center Workshop held at Douala, Cameroon 27-29 July 1992, pp� 27–34�
Aigner D�, Lovell C�A�, Schmidt P� (1977): Formulation and Estimation of Stochastic frontier production function models� Journal of Econometrics 16 (1): 21–37�
All about sweet potatoes (2008)�http://www�allabout sweetpotatoes�com/ production – consumption html� Downloaded on Nov 5, 2008�
Amanze B., Eze C. C., Eze V. (2010): Factors influencing the use of fertilizer in arable crop production among smallholder farmers in Owerri Agricultural Zone of Imo State� Academia Arena, 2 (6): 90–96�
Amaza P.S., Olayemi J.K. (2000): The influence of education and extension contact on food crop production in Gombe State, Nigeria� Nigerian Journal of Agribusiness and Rural Development 1: 80–92�
Amodu M�Y�, Owolabi O�J�, Adeola S�S� (2011): Resource Use Efficiency in Part-time Food Crop Production: The Stochastic Frontier Approach� Nigerian Journal of Basic and Applied Science 19(1):102- 110 http://www�ajol�info/index�php/njbas/index
Attaliru S�, Ilangantileke S� (2007): Evaluation and Promotion of Orange-Fleshed Sweet Potatoes to Alleviate Vitamin A Deficiency in Orissa and Eastern Uttar Pradesh in India� Roots and Tuber Crops: Opportunities for Poverty Alleviation and Sustainable Livelihoods in Developing Countries, and G� Tusiime (eds�), Proceedings of the 13th Triennial Symposium of the International Society for Tropical Root Crops, pp� 732–736�
Babatunde R� O�, Olorunsanya E� O�, Orebiyi, J� S�, Falola A� (2007): Optimal Farm Plan in Sweet Potato Cropping Systems: The Case of Offa and Oyun Local Government Areas of Kwara State, North-Central, Nigeria� Agricultural Journal 2(2):285–289�
Chukwuka G�O� (1999): Scheduling irrigation on sweet potatoes (Ipomea batata) (L) Lam� African journal of root and tuber crops, 3(2): 1 – 3�
Duke J�A�, Wain K�K� (1981): Medicinal Plants of the World of the Computer Index with more than 85000 entries 3 http://www�hort_purdue�Edu/newcrop/duke_energy/ipomea_batatas�htm/
Eastwood R�, Lipton M�, Newell A� (2010): Farm size� In: P� Pingali and R� Evenson, eds� Handbook of Agricultural Economics, Amsterdam, Elsevier�4: 3323–3397�
FAO (1983): World Food Security: a Reappraisal of the Concepts and Approaches� Director Generals Report, Rome�www.fao.org/forestry/13128-e6f36f27e0091055bec28ebe830f46b3
FAO (2008): Potato world: Africa - International Year of the Potato 2008 www�fao�org/potato-2008/en/world/africa�html
Fasasi A.R. (2007): Technical efficiency in food crop production in Oyo state, Nigeria� Journal of Human Ecology 22(3): 245–249�
Fawole O�P� (2007): Constraints to Production, Processing and Marketing of Sweet- Potato in Selected Communities in Offa Local Government Area, Kwara State Nigeria� Journal of Human Ecology 22(1):23–25�
Feder G� (1985): The Relation between Farm Size and Farm Productivity� Journal of Development Economics 18 (2-3): 297–314�
Helfand S�, Levine E� S� (2004): Farm Size and the Determinants of Productive Efficiency in the Brazilian Center-West Zone� Agricultural Economics 31:241–249�
Jude C� N�, Benjamen C�O�, Patrick C�N� (2011): Measurement & Determinants of Sweet Potato Production Efficiency among Small-holder Sweet Potato Farmers in Imo State� Agricultural Journal 2(4):1–3�
Le Van An (2004): Sweet potato leaves for growing pigs: Biomass yield, digestion and nutritive value� Doctoral dissertation� ISSN 1401-6249, ISBN 91-576-6750-0 http://diss-epsilon�slu�se/archive/00000639/01/Agraria470�pdf
Mbanaso E� O�, Agwu A� E�, Anyanwu C�, Asumugha G� N� (2012): Assessment of the Extent of Adoption of Sweet potato Production Technology by Farmers in the Southeast Agro-Ecological Zone of Nigeria� Journal of Agriculture and Social Research 12(1): 124–136�
National Root Crops Research Institute (2009): National Root Crops Research Institute, Umudike- Root Crops Division�
http://74�6�239�67/search/cache?ei=UTF-8&p=www�nrcri�org%2fpages%2fspotato�htm&i
Ndukwu P. C. (2010): Gender and Relative Efficiency in Sweet Potato (Ipomoea batas) Production in Imo State, Nigera� M� Sc� Thesis, Department of Agricultural Economics, Michael Okpara University of Agriculture, Umudike, Nigeria�
NPC (2006): Natural Population Commission Census Result Federal Republic of Nigeria Official Gazette, Govt� Press, Abuja� www.population.gov.ng/index.php/censuses Wednesday, January 10, 17(19) Pp 1
Nwokocha H�N�, Onunka N�A� (2002): Field performance of successive pruning of Sweet potato� In: M�U� Iloeje, G�E� Osuji, U�Herbert and G�N� Asumugha (eds) Agriculture: A Basis for Poverty Eradication and Conflict Resolution. Proceedings of the 36th Annual Conference of the Agricultural Society of Nigeria held at the Federal University of Technology, Owerri, Oct� 20 – 24, pp� 230–248�
43
AGRICULTURA TROPICA ET SUBTROPICA VOL. 49 (1-4) 2016
Obwona M. (2006): Determinants of technical efficiency differentials amongst small and medium-scale farmers in Uganda: A case of tobacco growers� AERC Research Paper No� 152� African Economic Research Consortium, Nairobi, Kenya, pp� 1–30�
Ogbonna M�C�, Nwauzor E�C�, Asumugha G�N�, Emehute J�K�U�, Korieocha D�S�, Anyaegbunam H�N� (2005): Cost and return analysis for the production of sweet potato in Nigeria: A case study of NRCRI, Umudike� Annual Report of the National Root Crops Research Institute, Umudike, pp� 73–76�
Okoye B�C�, Onyenweaku C�E�, Asumugha G�N� (2007): Technical Efficiency of Small Holder Cocoyam Production in Anambra State, Nigeria: A Cobb-Douglas Stochastic Frontier Production Approach Munich Personal RePEc Archive http://mpra�ub�uni-uenchen�de/17421/ MPRA Paper No� 17421 posted 25� September 2009 18:01 UTC
Rahji M.A.Y. (2005): Determinant of efficiency differentials in lowland rice production systems in Niger State, Nigeria� Ibadan Journal of Agricultural Research 1(1): 7–17
Raphael I. O. (2008): Technical efficiency of cassava
farmers in Southeastern Nigeria: Stochastic frontier approach� Agricultural Journal 3:152–156�
Revilla-Molina I�M�, Bastiaans L�, Van Keulen H�, Mew T�W�, Zhu Y�Y�, Villano R�A� (2009): Improvement of technical efficiency in rice farming through interplanting: A stochastic frontier analysis in Yunnan, China� http://www�degit�ifw-kiel�de/papers/degit_13/c013_015.pdf [August 2009].
Scott J�S�, Rosegrant M�W�, Ringler C� (2000): Roots and tubers for the 21st century: trend, projections and policy options� Food, Agriculture and the Environment Discussion P31, IFPRI, 64 p�
Shapiro K.H. (1983): Efficiency differentials in peasant agriculture and their implications for development policies� Journal of Development Studies 19(2): 177–190�
Villareal L� R�, Tsou C� S�, Lo F� H�, Chiu C� S� (1985): Sweet Potato Vine Tips as Vegetables� In Sweet Potato Products: A Natural Resource for the Tropics� Bounwkamp, C� J� ( Editor), CRC Press Inc�, Boca Raton, Florida�
Received: October 14, 2015 Accepted after revisions: December 20, 2016
44
AGRICULTURA TROPICA ET SUBTROPICA VOL. 49 (1-4) 2016
Corresponding author:
Olayinka Isiaka BaruwaDepartment of Agricultural EconomicsObafemi Awolowo University, Ile-Ife, NigeriaE-mail: aragbon2005@yahoo�co�uk or ebaruwa@oauife�edu�ng

INTRODUCTION
Fisheries occupy a unique position in the agricultural sector of the Nigerian economy� Its contribution of the agricultural share of gross domestic product was estimated as 1�3% in the year 2010, out of the total estimate of 40�9% being contributed by agriculture to GDP (CBN, 2011)� As a maritime nation with a vast population of over 160 million people and a coastline measuring approximately 853 kilometres, fish production as an enterprise possesses the capacity to contribute significantly to the agricultural sector (Osagie, 2012)� As reported by FAO (2005), Nigeria have aquaculture potential which constitutes 75% of 923,768 km2 of the land mass and 14 million hectares of inland freshwater, but less than 1% is utilized for fish production. Despite the popularity of farming in Nigeria, the fish farming industry can be best described as being at the infant stage when compare to the large market potential for its production and marketing (Nwiro, 2012). Nigeria can substitute fish importation with domestic production to create jobs, reduce poverty in rural and peri-urban areas where 70 per cent of the population live and ease the balance of payments deficits (Areola, 2007)�
Nigeria spends N100 billion on fish importation annually and the current fish demand consumption in Nigeria stands at over 2�66 million tonnes per annum, while the present importation rate is over 750,000 metric tonnes (Oota, 2012). With importation of more than 750,000 MT of fish, more than USD 600 million are spent in hard currency and thousands of jobs are exported (USAID, 2010)� The continuous importation of fish portends a colossal loss of foreign exchange earnings to Nigeria� In order to bridge the demand-supply gap, an aquaculture transformation agenda plans to increase annual fish production from the current production of 0�78 million metric tonnes to 3�0 million metric tonnes in order to achieve self-sufficiency in fish production and supply by the year 2015 (Tijani, 2011)� This will be achieved through fish farm development program, fish seeds and feed mill development program, fish pen and cage culture development program and fish post-harvest management and marketing program� However, Oyinbo et al. (2013) noted that fishery extension program should be included as a component of the fishery transformation plan of Nigeria so as to facilitate the delivery of fishery extension services to fish farmers, fish marketers, fish feed millers and other actors in the fish value chain.
45
10.1515/ats-2016-0006 AGRICULTURA TROPICA ET SUBTROPICA, 49/1-4, 45-49, 2016
Original Research Article
Technical Efficiency of Catfish Farming in Alimosho Local Government Area of Lagos State, Nigeria: a gender Perspective
1Oyinbo Oyakhilomen, 1Mohammed Olajide Murtala, 2Falola Abraham, 1Saleh Mamman Kwagyang
1Department of Agricultural Economics and Rural Sociology,Ahmadu Bello University, Zaria, Nigeria.2Department of Agricultural Economics and Farm ManagementUniversity of Ilorin, Nigeria.
Abstract
This research was undertaken to examine the gender perspective of the technical efficiency of catfish farming in Alimosho Local Government Area of Lagos State. Primary data elicited from a sample size of 70 catfish farmers (38 male and 32 female catfish farmers) were employed in the study� Analysis of the data was done using descriptive statistics and stochastic frontier production function� The maximum likelihood estimates of the stochastic frontier production function revealed that the mean technical efficiency of the male catfish farmers (86%) was higher than that of the female catfish famers (20%) and this implies that the male and female catfish farmers have the scope of improving their efficiency by 14% and 80%, respectively, through the use of farming practices used by the most efficient male and female catfish farmers. The factors that were significant in influencing the technical efficiency of the female catfish farmers were farming experience and credit while in the case of the male catfish farmers, farming experience significantly influenced their technical efficiency. In the light of the low technical efficiency of the female catfish farmers relative to the male catfish farmers, it was recommended that gender equality infishery training, extension delivery, distribution of resources and access to supportive services should be encouraged in a bid to improve the technical efficiency of the catfish farmers especially that of the female catfish farmers.
Keywords: descriptive statistics; stochastic frontier production function; equal opportunities�

Efficiency is a very important factor for productivity growth and hence in an economy where resources are scarce and opportunities to use new technologies are limited, inefficiency studies indicate the potential possibility to raise productivity by improving efficiency without necessarily developing new technologies or increasing the resource base (Bifarin et al., 2010). Measuring technical efficiency at the farm level, identifying important factors associated with the efficient production systems would serve as a panacea to assessing potential for developing sustainable aquaculture (Kareem et al�, 2008)� It is worth noting that several studies (Adewuyi et al�, 2010;Akinrotimi et al�, 2009;Nwiro, 2012 and others) on catfish production have been carried out but there exists dearth ofempirical information on gender-based analysis of technical efficiency of cat fish farming and therefore, this study was undertaken to fill the knowledge gap by providing information on the gender perspective of technical efficiency of cat fish farming. A gender perspective is necessary as it allows for the advancement of gender equality and equity regardless of whether it is women or men who are disadvantaged and whose position needs to be addressed in a bid to enhance efficiency of production.
MATERIALS AND METHODS
Description of the study areaThe study area is located in the north-western part
of Lagos State� It is located at latitude 6�61056 ° N and
longitude 3�29583 ° E with a temperature range of 28 °C to
33 °C� It occupies a land area of 173�6 square km (67 square miles)� Geographically, the River Owo demarcates the study area from Ado-Odo/Ota Local Government Areas of Ogun state on the northern and western side� Towards the east, it is bounded by IfakoIjaye, Agege and Ikeja Local Government Areas of Lagos State� The old Abeokuta expressway forms the frontier line between the Local Government Areas� On the southern part, the study area is bounded by Oshodi/Isolo, Amuwo Odofin and Ojo Local Government Areas of Lagos State� It is the largest local government area in Lagos state with 1,277,714 inhabitants according to the official 2006 Census. It is estimated that the population will increase to 1,592,911 by 2013 based on national Population Commission (NPC) annual growth rate of 3�2%�
Sampling procedure A two-stage sampling technique was used in the study�
The first stage involved a purposive selection ofwards M1, G North, G South, H, D, F, and ward E1 out of the eleven wards in the local government area on the basis of the peculiarity of catfish farming in the wards. The second stage involved a random selection of 10 fish farmers from each of the 7 selected wards to give a sample size of 70 fish
farmers which represents 50% of the sampling frame (140 fish farmers) of the fish farmers in the study area.
Data collectionPrimary data were used in this study� The primary data
were obtained from the respondents using a well structured questionnaire with the aid of personal interview during the field survey. The primary data collected include socio-economic characteristics of catfish farmers in the study area, inputs used for catfish production per production cycle and the output of catfish production cycle.
Analytical frameworkThe Cobb-Douglas functional form of the stochastic
frontier production function was employed to estimate the technical efficiencies of the male and female cat fish farmers in the study areausing frontier version 4�1 software� The stochastic frontier production function has the advantage of allowing simultaneous estimation of individual technical efficiencies of farmers as well as the determinants of technical efficiency (Battese and Coelli, 1995).
It is assumed that the farm frontier production function is expressed as:Q = f (Xi; β) + ei (1)Where: Q = quantity of output, Xi= vector of input quantitiesβ = vector of parametersei = farm specific composite residual term comprising of a random error term (Vi) and an inefficiency component (Ui).The explicit form of the Cobb-Douglas stochastic frontier production function employed in the study is expressed as:lnY = β0 + β1 lnX1 + β2 lnX2 + β3 lnX3 + β4 lnX4 + Vi – Ui (2)Where:Y= Quantity of output (Kg)X1 = pond size (m2)X2 = Labour in man-daysX3 = cost of fingerlings (N)X4 = quantity of feeds (Kg)β0 = Interceptβ = Vector of the coefficients for the associated independent variables in the production functionUi = one-sided component, which captures deviation from frontier as a result of inefficiency of the firmVi = effect of random stocks outside the firm control, observation and measurement error and other stochastic (noise) error term�The technical inefficiency model is expressed as:Ui = δ0 + δ1Z1 + δ2Z2 + δ3Z3 + δ4Z4 + δ5Z5 +δ6Z6 + δ7Z7 (3)Z1 = age (years)Z2 = education (years of formal schooling)Z3 = household sizeZ4= years of farming experience (years)
46
AGRICULTURA TROPICA ET SUBTROPICA VOL. 49 (1-4) 2016
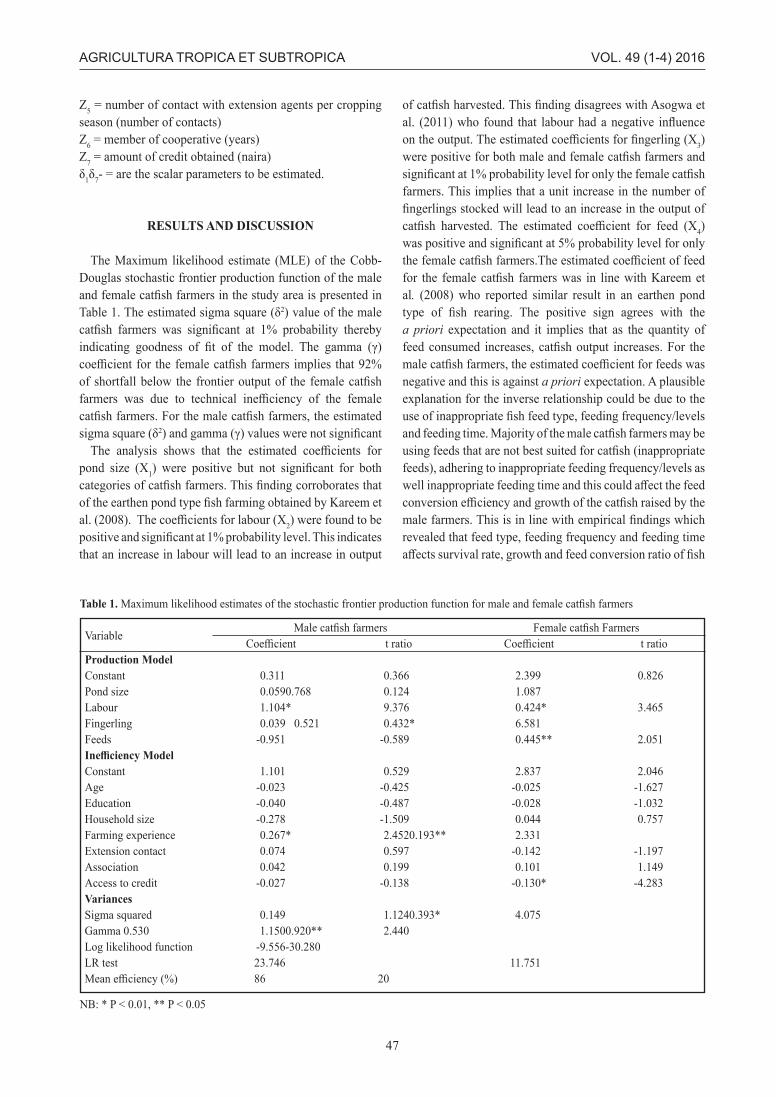
Z5 = number of contact with extension agents per cropping season (number of contacts)Z6 = member of cooperative (years) Z7 = amount of credit obtained (naira) δ1δ7- = are the scalar parameters to be estimated�
RESULTS AND DISCUSSION
The Maximum likelihood estimate (MLE) of the Cobb-Douglas stochastic frontier production function of the male and female catfish farmers in the study area is presented in Table 1. The estimated sigma square (δ2) value of the male catfish farmers was significant at 1% probability thereby indicating goodness of fit of the model. The gamma (γ) coefficient for the female catfish farmers implies that 92% of shortfall below the frontier output of the female catfish farmers was due to technical inefficiency of the female catfish farmers. For the male catfish farmers, the estimated sigma square (δ2) and gamma (γ) values were not significant
The analysis shows that the estimated coefficients for pond size (X1) were positive but not significant for both categories of catfish farmers. This finding corroborates that of the earthen pond type fish farming obtained by Kareem et al. (2008). The coefficients for labour (X2) were found to be positive and significant at 1% probability level. This indicates that an increase in labour will lead to an increase in output
of catfish harvested. This finding disagrees with Asogwa et al. (2011) who found that labour had a negative influence on the output. The estimated coefficients for fingerling (X3) were positive for both male and female catfish farmers and significant at 1% probability level for only the female catfish farmers� This implies that a unit increase in the number of fingerlings stocked will lead to an increase in the output of catfish harvested. The estimated coefficient for feed (X4) was positive and significant at 5% probability level for only the female catfish farmers.The estimated coefficient of feed for the female catfish farmers was in line with Kareem et al. (2008) who reported similar result in an earthen pond type of fish rearing. The positive sign agrees with the a priori expectation and it implies that as the quantity of feed consumed increases, catfish output increases. For the male catfish farmers, the estimated coefficient for feeds was negative and this is against a priori expectation� A plausible explanation for the inverse relationship could be due to the use of inappropriate fish feed type, feeding frequency/levels and feeding time. Majority of the male catfish farmers may be using feeds that are not best suited for catfish (inappropriate feeds), adhering to inappropriate feeding frequency/levels as well inappropriate feeding time and this could affect the feed conversion efficiency and growth of the catfish raised by the male farmers. This is in line with empirical findings which revealed that feed type, feeding frequency and feeding time affects survival rate, growth and feed conversion ratio of fish
47
AGRICULTURA TROPICA ET SUBTROPICA VOL. 49 (1-4) 2016
Male catfish farmers Female catfish FarmersVariable
Coefficient t ratio Coefficient t ratioProduction ModelConstant 0�311 0�366 2�399 0�826Pond size 0�0590�768 0�124 1�087Labour 1�104* 9�376 0�424* 3�465Fingerling 0�039 0�521 0�432* 6�581Feeds -0�951 -0�589 0�445** 2�051Inefficiency ModelConstant 1�101 0�529 2�837 2�046Age -0�023 -0�425 -0�025 -1�627Education -0�040 -0�487 -0�028 -1�032 Household size -0�278 -1�509 0�044 0�757Farming experience 0�267* 2�4520�193** 2�331Extension contact 0�074 0�597 -0�142 -1�197 Association 0�042 0�199 0�101 1�149Access to credit -0�027 -0�138 -0�130* -4�283VariancesSigma squared 0�149 1�1240�393* 4�075Gamma 0�530 1�1500�920** 2�440Log likelihood function -9�556-30�280LR test 23�746 11�751Mean efficiency (%) 86 20
Table 1. Maximum likelihood estimates of the stochastic frontier production function for male and female catfish farmers
NB: * P < 0�01, ** P < 0�05

(Hossain et al� 2002; Ashley-dejo et al� 2015; Karabulut et al� 2010; Jamabo et al� 2015)�
The result presented in Table 1also revealed the determinants of the technical inefficiency of the male and female catfish farmers. Farming experience (P < 0�01) was the only significant factor that influenced the technical inefficiency of the male cat fish farmers whereas in the case of the female catfish farmers, farming experience (P < 0�05) and access to credit (P < 0.01) were the significant factors that influenced their technical inefficiency. The result implies that an increase in farming experience of the male cat fish farmers will reduce the technical inefficiency of the farmers. This result is in consonance with the finding of Asogwa et al� (2011) who obtained similar results in their study. The positive coefficients of farming experience for the male and female catfish farmers were against a priori expectation and a plausible explanation for this is that as the farming experience of the catfish farmers increases, there is tendency for them to become conservative and get to use the old but less productive farm management practises for catfish farming. This result is against that of Ajibefun et al. (2002) who reported that farming experience was negative and significant. The negative sign of credit for the female catfish farmers implies that as the access of the farmers to credit increases, their technical efficiency tends to increase and this is because credit enables them to acquire farm inputs and other necessary resources for catfish production.This result compares favourably with that of Bifarin et al� (2010) who noted that access to credit was negatively and significantly related to technical inefficiency.
The mean technical efficiency of the male catfish farmers (86%) was higher than that of the female catfish famers (20%) and this implies that the male and female catfish farmers have the scope of improving their efficiency by 14% and 80%, respectively, through efficient resource utilization given the current level of available resources� This result is not consistent with that of Olagunji et al� (2013) who reported that female sweet potato producers had a higher technical efficiency (80%) compared to male sweet potato producers with technical efficiency of 54%. The higher efficiency of the male catfish farmers relative to the female catfish farmers could be attributed to the differences in the access to and control of productive resources, differences in access to extension services and other supportive services as well as differences in decision making power between the male and female catfish farmers with the female catfish farmers being more disadvantaged� Hence, in order to enhance the efficiency of the cat fish farmers especially the female ones, mainstreaming gender in fishery training, extension delivery, distribution of resources and access to supportive services should be encouraged so as to offer both categories of catfish farmers equal opportunities in enhancing their productivity� Promoting equality in access
to production resources and services towards enhancement of their efficiencies was necessitated as the efficiencies of both categories of catfish farmers is low compared to the technical efficiencies of 89% and 94% for small catfish farms and large catfish farms respectively in a study on technical efficiency of catfish production in Anambra State by Ugwumba (2011)�
CONCLUSION AND RECOMMENDATION
The kernel of this study was to determine the technical efficiency differential of catfish production on the basis of gender. Male catfish farmers were established to be more technically efficient than their female counterparts in the study area and this was attributed to favourable disposition of male catfish farmers in terms of access to productive resources, access to fishery training and other supportive services� On the account of the foregoing, it was recommended that policy measures aimed at encouraging gender equity in fishery training, extension delivery, distribution of resources and access to supportive services should be encouraged in a bid to improve the technical efficiency of the catfish farmers especially that of the female catfish farmers.
REFERENCES
Akinrotimi O�A�, Abu O�M�G�, Ibemere I�F�, Opara C�A� (2009): Economic viability and marketing strategies of periwinkle Tympanotonus fuscatus in Rivers State, Nigeria� International Journal of Tropical Agriculture and Food systems 3(3): 238 – 244�
Areola F� O� (2007): Fish marketing and export potentials of fish and fisheries products of Nigeria. A lecture delivered at educative and informative aqua-culture workshop and aqua-exhibitions tagged: sustainable fisheries livelihood, management and food security in Nigeria� 23 p�
Adewuyi S� A�, Phillip B�B�, Ayinde I�A�, Akerele D� (2010): Analysis of Profitability of Fish Farming in Ogun State, Nigeria� Journal of Human Ecology 31(3): 179–184�
Ajibefun I� A�, Battese G� E�, Daramola A� G� (2002): Determinant of Technical Efficiency in Small Holder Food Crop Farming: Application of Stochastic Frontier Production Function quarterly� Journal International Agriculture 41:225–240�
Ashley-dejo S� S�, Olaoye O� J�, Adelaja O� A�, Abdulraheem I. (2014): Effects of feeding levels on growth performance, feed utilization and body composition of African catfish (Clarias gariepinus, Burchell 1822)� International Journal of Biology and Biological Sciences 3(2):12–16�
Asogwa B�C�, Umeh J�C�, Penda S�T� (2011): Analysis of
48
AGRICULTURA TROPICA ET SUBTROPICA VOL. 49 (1-4) 2016

Economic Efficiency of Nigerian Small Scale Farmers: A Parametric Frontier Approach� Journal of Economics 2(2): 89–98�
Batesse G� E�, Coelli T� J� (1995): A Model for technical inefficiency effects in a Stochastic frontier production function for panel data� Empirical Economics 20: 325-332�
Bifarin J� O�, Alimi T�, Baruwa O�I�, Ajewole O�C� (2010): Determinants of Technical, Allocative and Economic Efficiencies in the Plantain (Musa spp�) Production Industry, Ondo State, Nigeria� In: Proceedings of International Conference on Banana & Plantain in Africa, pp� 199–210�
Central Bank of Nigeria (2011): Annual Report for the Year Ended 31st December� 2011�
Food and Agricultural Organization (FAO) (2005): Farming Nigeria’s Waters� A Compilation of the News Letters of the Aquaculture and Inland Fisheries Project on National Special Programme for Food Security� Vol�1, Nos 1-2, October, 2003-June, 2005� Technical note 16�
Hossain M., Haylor G.S., Beveridge M. (2002): Effect of feeding time and frequency on the growth and feed utilization of African catfish Clarias gariepinus (Burchell 1822) fingerlings. Aquaculture Research 32(12):999 – 1004�
Jamabo N�A�, Fubara R�I�, Dienye H�E� (2015): Feeding Frequency on Growth and Feed Conversion of Clarias gariepinus (Burchell, 1822) Fingerlings� International Journal of Fisheries and Aquatic Studies 3(1): 353–356�
Karabulu H.A., Yandi I., Aras N.M. (2010): Effects of Different Feed and Temperature Conditions on Growth, Meat Yield, Survival Rate, Feed Conversion Ratio and Condition Factor in Rainbow Trout (Oncorhynchus mykiss) Fingerlings� Journal of Animal and Veterinary Advances 9(22):2818–2823�
Kareem R� O�, Dipeolu A� O�, Aromolaran A� B�, Samson A� (2008): Analysis of technical, allocative and economic efficiency of different pond systems in Ogun state, Nigeria. African Journal of Agricultural Research 3 (4):246–254�
Nwiro E� (2012): Fish Farming a Lucrative Business� Accessed online 20th October 2012 from http://www�thisdaylive�com/articles/fish-farming-a-lucrative-business/119253/
Olagunju F� I�, Fakayode S� B�, Babatunde R� O�, Ogunwole-Olapade F� (2013): Gender Analysis of Sweet Potato Production in Osun State, Nigeria� Asian Journal of Agricultural Extension, Economics and Sociology 2(1): 1–13�
Osagie C� (2012): Aquaculture as path to thriving Agriculture� Accessed online 5th October 2012 from http://www�thisdaylive�com/articles/aquaculture-as-path-to-thriving-agriculture/124614/
Oota L� (2012): Is Nigeria Committed to Fish Production� Accessed online 20th October 2012 from http://blueprintng�com/2012/07/is-nigeria-committed-to-fish-production/
Oyinbo O�, Rekwot G�Z�, Owolabi J�O� (2013): Transformation of the Fishery Subsector of Nigeria: The Need for Fishery Extension Program� Journal of Management and Science 3(2): 28–33�
Tijani, B� (2011)� Federal Ministry of Agriculture and Rural Development Action Plan Towards the Attainment of a Sustainable Agricultural Transformation in Nigeria� Being a Lead Paper Delivered at the World Food Day Seminar, Agricultural Show Ground Keffi Road, Abuja, Nigeria. pp� 1 – 10�
Ugwumba C.O.A. (2011). Technical Efficiency of Catfish Production in Anambra State, Nigeria: A Translog Stochastic Frontier Production Function Approach� Agricultura Tropica et Subtropica 44(1): 30 – 36�
United States Agency for International Development (USAID),(2010)� Best management practices for Fish farmers in Nigeria� USAID Markets Programme – Nigeria� pp� 1 – 38�
Received: October 14, 2015 Accepted December 20, 2016
49
AGRICULTURA TROPICA ET SUBTROPICA VOL. 49 (1-4) 2016
Corresponding author:Oyinbo OyakhilomenAhmadu Bello University, Zaria, NigeriaP�M�B 1044Phone: +2348032779442E-mail: ooyakhilomen@gmail�com
