mercury sources and trophic ecology for hawaiian bottomd284f45nftegze.cloudfront.net/drazen/sackett...
TRANSCRIPT
Mercury Sources and Trophic Ecology for Hawaiian BottomfishDana K. Sackett,*,† Jeffrey C. Drazen,† C. Anela Choy,†,‡ Brian Popp,§ and Gerald L. Pitz∥
†Department of Oceanography, University of Hawaii, Manoa, 1000 Pope Road, Honolulu, Hawaii 96822, United States‡Monterey Bay Aquarium Research Institute, 7700 Sandholdt Road, Moss Landing, California 95039, United States§Department of Geology and Geophysics, University of Hawaii, Manoa, 1680 East-West Road, Honolulu, Hawaii 96822, UnitedStates∥Hawaii Department of Health, State Laboratory Division, 2725 Waimano Home Road, Pearl City, Hawaii 96782, United States
ABSTRACT: In Hawaii, some of the most important commercial and recreational fishes comprisean assemblage of lutjanids and carangids called bottomfish. Despite their importance, we knowlittle about their trophic ecology or where the mercury (Hg) that ultimately resides in their tissueoriginates. Here we investigated these topics, by analyzing muscle samples for mercury content,nitrogen, carbon, and amino acid specific nitrogen isotope ratios in six species distributed acrossdifferent depths from the Northwestern Hawaiian Islands (NWHI) and the Main Hawaiian Islands(MHI). Fishes had different sources of nitrogen and carbon, with isotopic values suggestingbenthic food sources for shallow nearshore species. High trophic position lutjanids that foraged indeeper water, benthic environments generally had higher Hg levels. Model results also suggestedthat benthic Hg methylation was an important source of Hg for shallow benthic feeders, whiledeepwater sources of mercury may be important for those with a diet that derives, at least in part,from the pelagic environment. Further, despite the lack of freshwater sources of Hg in the NWHI,statistical models explaining the variation in tissue Hg in the MHI and NWHI were nearlyidentical, suggesting freshwater Hg inputs were not a major source of Hg in fish tissue.
■ INTRODUCTION
An extensive amount of research has been directed atunderstanding mercury (Hg), a highly toxic heavy metal thataccumulates in fish tissue and is distributed throughout globalmarine, terrestrial, and atmospheric environments.1,2 Much ofthis research is directed at aquatic ecosystems becauseconsumption of contaminated fish is the most direct pathwayfor Hg to affect the health of humans and wildlife.1−3
Consequently, a number of important predictors have beenlinked to fish tissue Hg concentrations such as trophic level, fishsize, depth of forage, geographic region, dissolved oxygen, pH,and dissolved organic carbon (DOC).4−8 Despite this knowl-edge the source or relative contribution of different sources ofmethylmercury (MeHg), the organic neurotoxic form of Hg,which ultimately resides in fishes, can rarely be identified.Additionally, because MeHg enters at the base of the food weband bioaccumulates through diet,4,9,10 understanding sources ofMeHg to fishes, provides information on foraging ecology andfood web dynamics; information largely lacking for our studyspecies, the economically important bottomfishes of Hawaii.11
Nitrogen and carbon isotopic compositions (δ15N and δ13Cvalues) have also been used in ecology to improve ourunderstanding of trophic ecology, dietary partitioning andenergy flow.12,13 For instance, δ15N values can be used toestimate relative trophic position6,14 while δ13C values can beuseful indicators of the sources of dietary carbon (e.g., benthicvs pelagic).15−17 Here we aim to use stable isotopic data to linkfeeding ecology with the trophic transfer of the bioaccumulativecontaminant, Hg.17,18
While studies have examined Hg inputs to the open ocean ona global scale to provide insight into Hg in marine biota,19,20
the scale of these studies often do not take the regional andlocal influence of benthic and coastal sources of Hg intoaccount. For example, understanding that freshwater inputs ofHg to the open ocean are comparatively low to other oceanicsources does not account for the larger impact freshwater Hginput has on coastal ecosystems where a large number ofmarine species frequent or reside.21 In addition, though manystudies have examined trophic position and mercury values infishes,19,20 few have combined carbon, amino acid, and bulknitrogen isotope values with Hg concentrations to determinethe primary sources of Hg in fish tissue.21−23 This informationis particularly important as research on Hg sources in fish tissuecan be equivocal. For instance, some studies examining pelagicfishes have suggested that marine fish derive tissue Hg fromfreshwater and coastal benthic bacterial methylation andsubsequent advection to the open ocean,24 while other morerecent studies have indicated water column methylation in theoxygen minimum zone (OMZ) as the primary source of Hg inpelagic fish tissue, suggesting no necessary connection tobenthic or coastal food webs.19,20,25,26 A recent study by Choyet al.27 found that Pacific pelagic fishes that primarily foraged atdepths below the surface mixed layer in the open ocean had
Received: August 5, 2014Revised: April 30, 2015Accepted: May 2, 2015
Article
pubs.acs.org/est
© XXXX American Chemical Society A DOI: 10.1021/acs.est.5b01009Environ. Sci. Technol. XXXX, XXX, XXX−XXX
higher tissue Hg levels, suggesting a deep-ocean source of Hgmethylation.28 Mercury isotopic analysis confirmed that up to80% of Hg in these pelagic fish was methylated below thesurface mixed layer of the ocean.28 However, Senn et al.21
demonstrated that while open ocean pelagic species showedsimilar results in the Gulf of Mexico, coastal pelagic speciesderived Hg from freshwater and coastal sources of Hgmethylation. Here we aimed to examine the generality ofthese finding for demersal fishes. For bottomfish, or fish thatlive in association with the seafloor and may forage on thebottom or in the water column just above it,29−33 we are unableto predict sources of Hg exposure because close associationwith the benthos, both in coastal and deep-ocean habitats, mayexpose them to different sources of MeHg with differentbioaccumlation pathways. For instance, shallow speciesassociated with the benthos will often by-default be close to alandmass and potentially exposed to high levels of freshwater,coastal and benthic sources of Hg methylation. Unlike pelagicfish species, deepwater benthic species have two potentialsources of MeHg exposure, that from the benthos in addition toin situ methylation from the OMZ. As such, the primarysources of MeHg in fish tissue, particularly in fish that residenear the seafloor, are still unresolved. This lack of under-standing hampers effective natural resource management anddevelopment of human health policy pertaining to bottom-fish.29 In addition, few studies have examined bottomfish Hglevels34 and none to our knowledge have examined Hawaiianbottomfish; a surprise considering how highly valued bottom-fish are as a food item in Hawaii35,36 and how widespread thisgroup of fish is across the greater IndoPacific region.Determining Hg sources and obtaining detailed informationon feeding ecology will improve our knowledge of trophicpathways and dietary partitioning. This information is alsocritical to understanding Hg biogeochemical cycling inecosystems, to parametrize ecosystem models,37 and to guidefuture attempts at contaminant mitigation or remediation.The goals of our research were to quantify the sources and
pathways of MeHg bioaccumulation in six common, econom-ically important, and frequently consumed Hawaiian bottomfishspecies and to use isotopic data to better understand theirforaging ecology. We hypothesized that the depth ofoccurrence for four lutjanid and two carangid bottomfishspecies would influence Hg accumulation similarly to pelagicfish despite accumulating Hg, in part, from the benthos.27
Further, we aim to determine how Hg sources and pathwayscompare between the Main Hawaiian Islands (MHI) andNorthwestern Hawaiian Islands (NWHI). Contrary to the MHI(∼200 to 10 000 km2 in size), the NWHI lack freshwaterecosystems and areas where large volumes of freshwater andsaltwater mix because the islands are submerged or haveminimal atmospheric exposure (<4 km2), which wouldpresumably limit freshwater and coastal sites of Hgmethylation.38−41 This is an important distinction as Hgconcentrations in freshwater runoff from the MHI haveexceeded the United States Environmental Protection Agency(USEPA) recommended criteria for aquatic life and have beenseen to concentrate in coastal aquatic species.42,43 Additionally,groundwater discharges in the MHI are a significant source ofHg to coastal areas compared to other sites across the globe,have been seen to exceed water concentrations of Hg in surfaceocean waters (groundwater Hg ∼4 pM, surface ocean water ∼1pM), and have caused Hg concentrations to double in coastalwaters (1.2−2.4 pM).26,44 We, therefore, hypothesized that
shallow bottomfish in the MHI would have higher Hg levelsthan those same species in the NWHI. We also hypothesizedthat the variation in Hg levels with depth of occurrence for fishwould differ between the MHI and NWHI as a result of coastalHg inputs in the MHI. We also used δ15N and δ13C valuesmeasured in bottomfish tissue to quantify relative trophicposition1,45 and the primary sources of nitrogen and carbon(e.g., benthic versus pelagic) for individual fish.16 Lastly relativetrophic position estimated from amino acid compound specificisotope analysis were compared to reported trophic positionfrom diet studies to further evaluate bottomfish feedingecology.
■ MATERIALS AND METHODSSample Collection. We analyzed fish muscle tissue from
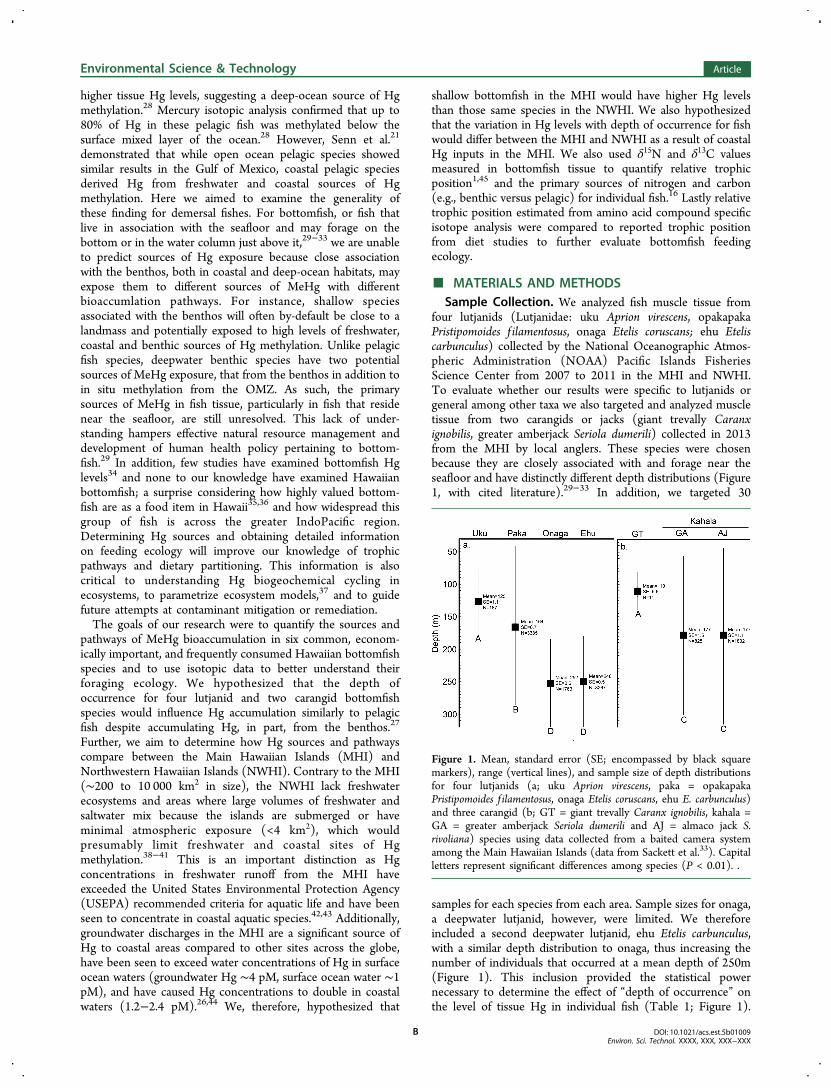
four lutjanids (Lutjanidae: uku Aprion virescens, opakapakaPristipomoides f ilamentosus, onaga Etelis coruscans; ehu Eteliscarbunculus) collected by the National Oceanographic Atmos-pheric Administration (NOAA) Pacific Islands FisheriesScience Center from 2007 to 2011 in the MHI and NWHI.To evaluate whether our results were specific to lutjanids orgeneral among other taxa we also targeted and analyzed muscletissue from two carangids or jacks (giant trevally Caranxignobilis, greater amberjack Seriola dumerili) collected in 2013from the MHI by local anglers. These species were chosenbecause they are closely associated with and forage near theseafloor and have distinctly different depth distributions (Figure1, with cited literature).29−33 In addition, we targeted 30
samples for each species from each area. Sample sizes for onaga,a deepwater lutjanid, however, were limited. We thereforeincluded a second deepwater lutjanid, ehu Etelis carbunculus,with a similar depth distribution to onaga, thus increasing thenumber of individuals that occurred at a mean depth of 250m(Figure 1). This inclusion provided the statistical powernecessary to determine the effect of “depth of occurrence” onthe level of tissue Hg in individual fish (Table 1; Figure 1).
Figure 1. Mean, standard error (SE; encompassed by black squaremarkers), range (vertical lines), and sample size of depth distributionsfor four lutjanids (a; uku Aprion virescens, paka = opakapakaPristipomoides f ilamentosus, onaga Etelis coruscans, ehu E. carbunculus)and three carangid (b; GT = giant trevally Caranx ignobilis, kahala =GA = greater amberjack Seriola dumerili and AJ = almaco jack S.rivoliana) species using data collected from a baited camera systemamong the Main Hawaiian Islands (data from Sackett et al.33). Capitalletters represent significant differences among species (P < 0.01). .
Environmental Science & Technology Article
DOI: 10.1021/acs.est.5b01009Environ. Sci. Technol. XXXX, XXX, XXX−XXX
B
Further, greater amberjack and almaco jack (Seriola rivoliana)are both called kahala among the Hawaiian Islands because theyare morphologically similar, have similar depth distributionsand similar diets (Figure 1).46−48 As such, although we targetedgreater amberjack, our samples included both carangid speciescalled kahala. These data were pooled for analyses due to smallsample size (greater amberjack, n = 3; almaco jack, n = 5),similarity between species, and because isotopic and Hg datawere not significantly different between kahala species(Kruskal−Wallis test, P-value range = 0.63−0.88). In addition,mean depth of occurrence for giant trevally (110m) wereestimated using data collected from a baited camera systemwith an upper limitation of 90m (Figure 1).33 Because thesedata likely overestimated the mean depth of occurrence of thisshallow water species, we used mean depth of occurrenceestimates determined by Kelley and Moriwake32 for gianttrevally in our statistical analyses (80 m), as this data set wasmore robust and did not have an upper depth limit to thesampling design.
Tissue Analyses. Because MeHg generally constitutes>95% of total mercury in fish tissue,10,49 all samples wereanalyzed for total Hg, a much more cost-effective approachthan analyzing MeHg. However, a subset of samples (foursamples of each species, n = 24) was analyzed for MeHg tovalidate this assumption for bottomfish. Tissue samples werefreeze-dried, ground into a homogeneous powder andmeasured for total Hg using a Direct Mercury Analyzer(DMA-80; Milestone Inc., Monroe, CT) according to USEPAMethod 7437.50 Following analysis, total Hg (hereafter referredto as Hg) concentrations were converted from dry to wetweight using percent moisture values obtained from lyophiliz-ing each sample. Analyses were performed with appropriatequality assurance/quality control (QA/QC) protocols, includ-ing four National Research Council (NRC) certified referencematerials (CRMs; CRM-TMF 100; CRM-TMF 1000, DORM-3 fish protein, DOLT-4 dogfish liver), and 28 randomizedreplicate samples (∼10% of all samples). On each day ofanalysis, two calibration standards were used for verification ofthe current nine point calibration curve (SPEX-CertiPrep,NIST traceable) for analysis of the samples (n = 222) and QCsamples. Fresh calibration standards were prepared monthly.All CRM results (n = 103) were within acceptable limits andhad a mean recovery of 101% ± 4% SD. The mean relativestandard deviation (RSD) for 28 replicate samples was 2.60%.For MeHg analysis, 80−120 mg of freeze-dried tissue from eachsample was digested with protease XIV and analyzed for MeHgand inorganic Hg (iHg) by high performance liquidchromatography and inductively coupled plasma mass spec-trometry (HPLC-ICPMS).51 This method has a lower limit ofquantification of 0.005 ppm for Hg. Digestion with protease hasalso been reported to provide the most accurate ratio of MeHgto inorganic Hg (iHg) as it results in a very high extractionefficiency while preventing transformation of MeHg to iHg.51
The mean percent of MeHg to total Hg (MeHg+iHg) for all 24samples tested was 99% ± 0.46% SE. The mean RSD for sixreplicate samples was 0.07%.Bulk tissue nitrogen and carbon isotopic compositions
(hereafter δ15N and δ13C values) of a subset of freeze-driedfish tissue samples (≥40% for each species) were determinedby combustion using a Costech ECS 4010 ElementalCombustion System (Costech Analytical Technologies Inc.,Valencia, CA) coupled with a ConFlo IV interface to introducesamples to a Delta XP Isotope Ratio Mass Spectrometer
Table 1. Summary Statistics of Fish Length and Fish TissueHg for Six Species of Bottomfish Collected in the MainHawaiian Islands (a. MHI) and Northwestern HawaiianIslands (b. NWHI)a
length (cm) fish tissue Hg (mg·kg−1 ww)
location species N mean SE mean SE range
a. MHI Uku 30 59.64 1.06 0.39 0.03 0.17−0.79Paka 30 58.00 0.88 0.13 0.02 0.04−0.57Onaga 30 63.09 1.80 0.30 0.04 0.10−0.80Ehu 14 35.70 0.96 0.57 0.06 0.28−1.13GT 15 76.62 4.51 0.45 0.15 0.08−2.41Kahala 8 77.95 2.97 0.76 0.07 0.51−1.12
b.NWHI
Uku 30 60.19 0.97 0.51 0.05 0.17−1.65
Paka 30 58.77 0.72 0.17 0.03 0.04−0.78Onaga 12 63.69 3.25 0.47 0.12 0.16−1.25Ehu 19 43.20 1.44 0.66 0.07 0.29−1.42
aN = sample sizes. Lutjanid species: uku = Aprion virescens, paka =opakapaka Pristipomoides f ilamentosus, onaga = Etelis coruscans, ehu =E. carbunculus. Carangid species: GT = giant trevally Caranx ignobilis,kahala = greater amberjack Seriola dumerili and almaco jack S.rivoliana..
Table 2. Mean and Standard Error (SE) of the δ15N Values of Three Source Amino Acids (AAsource; Glycine, Lysine,Phenylalaninea
AAsource TPNielsen Δ δ15Nb TPFishBase
species N mean SE mean SE N mean SE mean SE
uku 5 −2.18B 1.12 3.98B 0.08 24 13.19B 0.10 4.50 0.80paka 9 −1.25B 0.29 3.99B 0.07 24 10.69D 0.09 3.80 0.50onaga 5 −1.05B 0.51 3.95B 0.05 18 11.99C 0.10 4.50 0.80ehu 5 −2.26B 0.89 4.37A 0.10 14 14.67A 0.18 4.50 0.80GT 4 1.26A 0.81 3.56C 0.13 8 10.19E 0.50 4.20 0.70kahala 4 −0.88AB 0.8 4.11B 0.03 8 12.11C 0.07 4.50 0.80
aSee eq 2), trophic position (TP) estimated using the equation developed by Nielsen et al.,54 a proxy for relative trophic position (Δ δ15N) for sixspecies of bottomfish collected in the Main Hawaiian Islands and Northwestern Hawaiian Islands. Mean and SE of trophic position estimates fromFishBase are also indicated in the table.54,57,58. bData used in models as a proxy for relative trophic position (see Table 3). Superscript capital lettersindicate significant differences among species (P < 0.05). N = sample sizes for the columns following the N column. Lutjanid species: uku = Aprionvirescens, paka = opakapaka Pristipomoides f ilamentosus, onaga = Etelis coruscans, ehu = E. carbunculus. Carangid species: GT = giant trevally Caranxignobilis, kahala = greater amberjack Seriola dumerili and almaco jack S. rivoliana
Environmental Science & Technology Article
DOI: 10.1021/acs.est.5b01009Environ. Sci. Technol. XXXX, XXX, XXX−XXX
C
(Thermo Finnigan, Bremen, Germany). Because all tissuesamples presented low lipid content (C:N molar ratio <4.0),lipid extractions were unnecessary.52 We also analyzed a subsetof tissue samples for amino acid compound specific isotopiccomposition (AA-CSIA) to characterize baseline δ15N valuesand to determine relative trophic position of individual fish(Table 2). The methods and instrumentation used havepreviously been described in Dale et al.14 Briefly, dried tissuesamples were subjected to acid hydrolysis, esterification of thecarboxyl terminus and trifluoracetylation of the amine groupprior to being introduced into a Delta V or MAT 253 massspectrometer interfaced with a Trace GC gas chromatographthrough a GC-C III combustion furnace (980 °C), reductionfurnace (650 °C) and liquid N cold trap. All 20 samples wereanalyzed in triplicate. Reproducibility of amino acids used inour analyses (alanine, leucine, glutamic acid, glycine, lysine,phenylalanine) averaged 0.31‰ SD and ranged from 0.01‰ to0.85‰ SD. Instrument accuracy was determined using knownδ15N values of aminoadipic acid and norleucine coinjected withall samples. The mean difference between known and measuredδ15N values of aminoadipic acid and norleucine was 0.64‰ ±0.49‰SD (n = 20). Due to the high cost of AA-CSIA onlythree samples per lutjanid species and area and four samplesper carangid species were analyzed. Individuals chosen for AA-CSIA encompassed the size and geographic ranges of our datafor each species being tested. In addition, previous research atthe University of Hawaii also conducted amino acid nitrogenisotope analysis, providing 12 additional data records for ourlutjanid species. These data supplemented our estimates oftrophic position although tissue Hg was not measured in thesespecimens.Trophic Position and Statistical Analyses. We calcu-
lated trophic position for those samples where AA-CSIA datawere available using glutamic acid and phenylalanine asdescribed by Chikaraishi et al.53 and Nielsen et al.54
δ δ β= − − +TP (( N N )/TEF) 115Glu
15Phe (1)
where TP is the trophic position, δ15NGlu is the δ15N value for
the trophic amino acid glutamic acid (Glu), δ15NPhe is the δ15N
value for the source amino acid phenylalanine (Phe), β is thedifference between δ15NGlu and δ15NPhe in marine primaryproducers, and TEF is the trophic enrichment factor or therelative change in δ15NGlu and δ15NPhe values with each trophictransfer. The values suggested by Chikaraishi et al.53 for β andTEF are 3.4 ± 0.9 SD and 7.6 ± 1.2 SD. However, not allstudies agree with the values of these constants14,55,56 because
they were developed using 17 primary producers, a fewzooplankton and two fish species in the larval stage ofdevelopment in controlled laboratory feeding experiments.Conversely, Nielsen et al.54 used 359 different marine specieswith diets spanning four trophic levels. It is thereforereasonable to expect that the equation developed using alarge compendium of marine organisms54 would be best inproviding an estimate of trophic position for large oceanpredators such as bottomfish. We therefore estimated trophicposition using the β and TEF values suggested by Nielsen etal.54 (β = 2.8 ± 2.0SD, TEF = 6.6 ± 1.7SD). We comparedestimates of trophic position based on AA-CSIA to reportedtrophic position estimates published online by FishBase.57,58
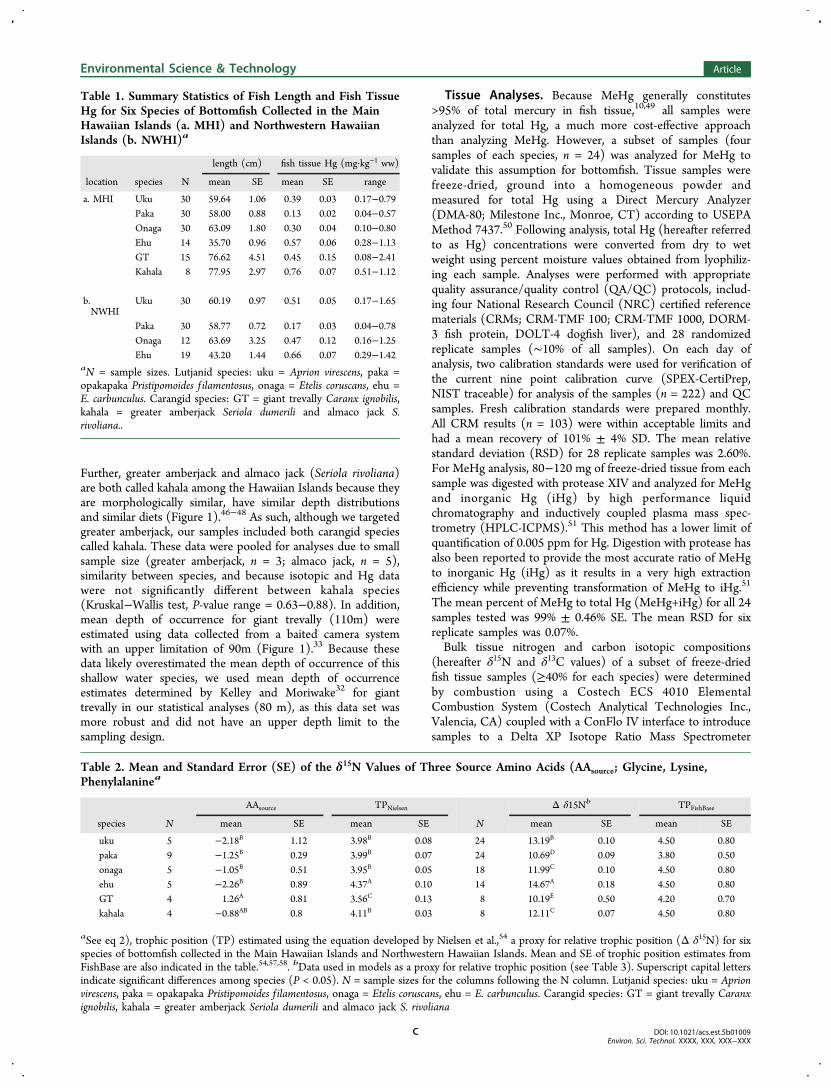
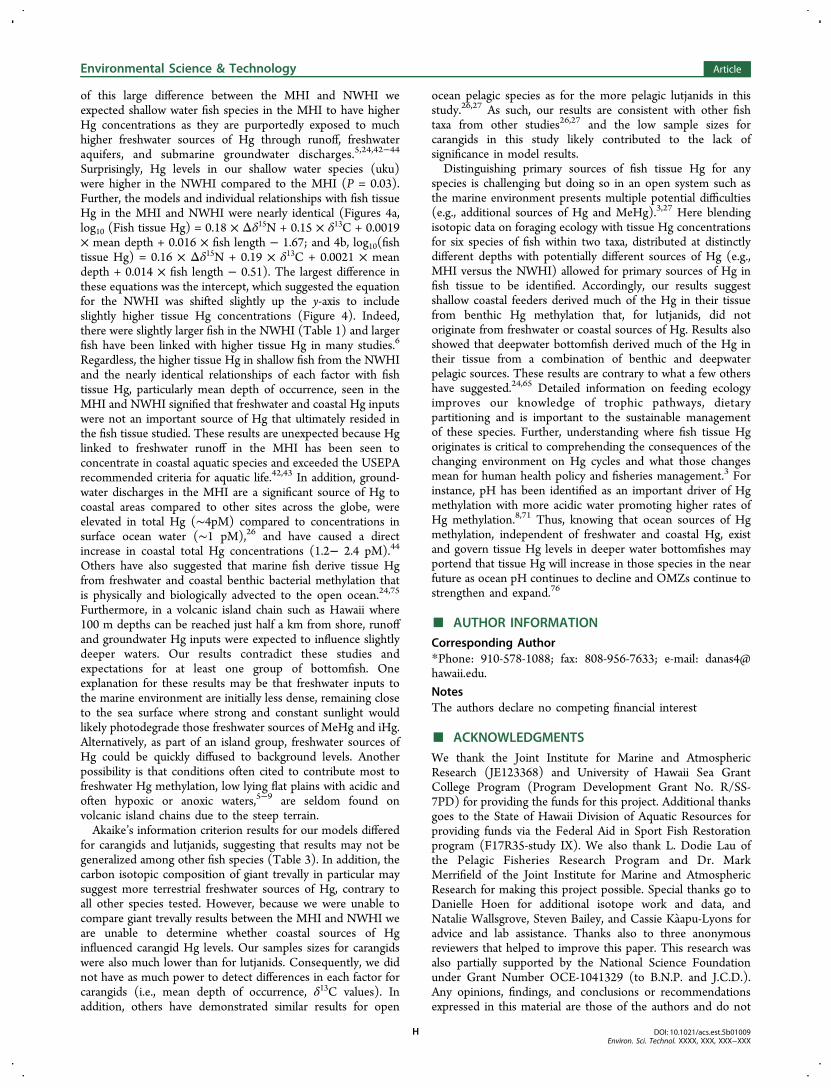
For bulk δ15N values, which were analyzed for a much largerportion of the data set compared to AA-CSIA (Table 2), β andTEF are unknown and thus these data could not be used todetermine precise trophic positions. However, a proxy fortrophic position (Δδ15N) was estimated by subtracting aweighted mean δ15N value of source amino acids (δ15Nsource)
59
for each species from bulk tissue δ15N values measured for eachindividual (Δδ15N) to use in our models. This processnormalized bulk δ15N values so different baseline δ15N valuesdid not confound our analyses or interpretation of relativetrophic position and made no assumption about the magnitudeof the TEF for bulk data. The necessity of this normalizationwas evident because baseline isotopic variations stronglyinfluenced bulk δ15N values (Figure 2).13 This approach isfurther justified because trophic position estimates using AA-CSIA data did not correlate with bulk δ15N data, but didcorrelate with our proxy for trophic position, Δδ15N (Figure 2).Only individuals with Hg data were used to create our Δδ15Nproxies. We calculated weighted mean δ15N values of sourceamino acids using glycine, lysine, and phenylalanine
δ =Σ
Σ
δ
σ
σ
N15source
N
10
x
x
x
15
2
2 (2)
where δ15Nx is the δ15N value of a specific source amino acidand σx is the standard deviation of triplicate isotopic analysis ofthe specific amino acid.59
Mercury data were log transformed for statistical tests tomeet assumptions of normality and equal variance. Differencesin fish size, depth distributions, tissue Hg and C and N isotopedata among species and sites were determined using a one-wayanalysis of variance (ANOVA). Posthoc comparisons among
Figure 2. Baseline δ15N values (a; using the source amino acid, phenylalanine) and trophic position (b; based on AA-CSIA using constants derivedby Nielsen et al.54) versus bulk δ15N values. Trophic position estimates using AA-CSIA were also regressed against a proxy for trophic position (c;Δδ15N). Different symbols represent different species. Uku Aprion virescens = open rectangles, opakapaka Pristipomoides f ilamentosus = closedrectangles, onaga Etelis coruscans = open circles, ehu Etelis carbunculus = closed circles, giant trevally Caranx ignobilis = open triangles, kahala,amberjack Seriola dumerili and almaco jack S. rivoliana = closed triangles.
Environmental Science & Technology Article
DOI: 10.1021/acs.est.5b01009Environ. Sci. Technol. XXXX, XXX, XXX−XXX
D
means were conducted using an each-pair student t test. Inaddition, standard least-squares models including each factorseparately (fish length, trophic position proxy Δδ15N, δ13Cvalues, mean depth of occurrence) and all factors together weretested to reveal which model was the best in explaining thevariation in fish tissue Hg for lutjanid species in the MHI andNWHI and carangid species in the MHI separately (Table 3).Variance inflation factors (VIF) were calculated for models thatincluded all factors together as a test of collinearity. All VIFswere well below 10 (range = 1.3−4.7) indicating little to nocollinearity of independent factors.60 All models were rankedand the best model was determined using Akaike’s InformationCriterion adjusted for small sample size (AICc).
61 Modelweights were also calculated to determine the probability thatthe top model was the best of those tested (Wi).
61 Further, ifthe model with all four factors was ranked the best, parameterestimates and leverage plots were evaluated to determine thesignificance of each factor. However, because AICc penalizesmodels (raises the AICc value) for each additional parameteradded to a model it would be unlikely for the model with themost factors to be ranked the best unless those parameterssignificantly explained additional variation in fish tissue Hgdata.61 Further, to ensure ages (i.e., variable growth rates)among species did not affect our results, age was estimatedusing the von Bertalanffy growth equation (L(t) = Linf × (1 −exp(−k × (t − t0))))
62 for those species where reliable growthparameters were available (ehu, onaga, opakapaka, and gianttrevally).57,63 The ages of lutjanid species were not significantlydifferent in the MHI (P = 0.22) or NWHI (P = 0.53). Thecarangids, however, could not be compared as ages could notbe estimated for kahala. All analyses were conducted using JMPPro 9.0.2 (2010 SAS Institute Inc.).
■ RESULTS AND DISCUSSION
Food Web Dynamics. Trophic position varied amongspecies (P < 0.01), though were generally consistent withpublished values from stomach content analyses on FishBase.57
For instance, giant trevally were reported to have a trophic
position of 4.2 ± 0.7 SE by FishBase and a diet consisting offishes, cephalopods, and benthic crustaceans.57,58 Our estimateswere slightly, though not significantly, lower than FishBaseestimates with a mean of 3.6 ± 0.13 SE, the lowest of thespecies we examined (P < 0.01; Table 2), suggesting their dietmay consist of more benthic crustaceans and/or herbivorousfishes and less carnivorous fishes than previously stated (Table2). The fish in Sudekum et al.’s58 study were comparable in sizeto fish in our study. Papastamatiou et al.64 found that thetrophic positions of giant trevally were bimodal and related totwo contingents of behavior, one similar to Galapagos sharksand another with a lower trophic position of approximately3.8.64 The trophic position of the fish in our study wereconsistent with the latter contingent which is perhaps the resultof sampling the population captured largely by shore fishers.These results were further supported by relatively high δ13Cand δ15Nsource values which indicated that the diets of gianttrevally from this study were primarily derived from thebenthos (Table 2; Figure 3).15,65 Conversely, opakapaka havebeen estimated to have a trophic level of 3.8 ± 0.5 SE and dietthat consists of fishes and planktivorous invertebrates thatreside in or come into close proximity with the seafloor (e.g.,filter feeding tunicates).11,57,66 Our mean estimate was slightly,though not significantly, higher at 4.0 ± 0.07 SE suggesting thatopakapaka sampled in our study were slightly more piscivorousthan those in Haight et al.11 Opakapaka in our study were alsogenerally larger (50.7−67.6 cm) than those in Haight et al.11
(26.7−65.4 cm). Low δ13C values also supported the reliance,at least in part, of opakapaka on the pelagic food web (Figure3). Ehu had the highest trophic position compared to all otherspecies (P < 0.05). Although this species attains smallermaximum sizes than many other Hawaiian bottomfish and wasthe smallest on average of the fish we sampled (Table 1),studies have suggested a diet of mostly benthic fishes.11
FishBase estimates for ehu, onaga, uku, and kahala wereprimarily piscivorous, with similar trophic levels of approx-imately 4.5 ± 0.8 SE.47,48,57 Likewise, the trophic positions ofonaga, uku, kahala, and opakapaka were not significantly
Table 3. Standard Least Squares Regression Models to Predict Lutjanid (uku Aprion virescens, opakapaka Pristipomoidesf ilamentosus, onaga Etelis coruscans, ehu E. carbunculus), and Carangid (giant trevally Caranx ignobilis, kahala = greateramberjack Seriola dumerili and almaco jack S. rivoliana) Fish Tissue Hg, Ranked with Akaike’S Information Criterion (AICc)
61
in the Main Hawaiian Islands (a. MHI) and Northwestern Hawaiian Islands (b. NWHI)a
location group model N P R2 AICc Wi
a. MHI Carangids Δ δ15N 16 <0.01 0.54 −17.26 0.45length 16 <0.01 0.50 −16.71 0.34Δ δ15N, δ13C, depth, length 16 <0.01 0.81 −14.17 0.10δ13C 16 0.07 0.22 −13.54 0.07depth 16 0.01 0.30 −12.86 0.05
Lutjanids Δ δ15N, δ13C, depth, length 42 <0.01 0.77 −57.36 0.99Δ δ15N 42 <0.01 0.43 −47.89 0.01δ13C 42 <0.01 0.19 −41.35 0.00length 42 0.31 0.03 −38.00 0.00depth 42 0.35 0.02 −37.93 0.00
b. NWHI Lutjanids Δ δ15N, δ13C, depth, length 38 <0.01 0.75 −44.57 0.91Δ δ15N 38 <0.01 0.47 −39.57 0.07δ13C 38 <0.01 0.35 −36.15 0.01depth 38 0.29 0.03 −29.55 0.00length 38 0.43 0.02 −29.31 0.00
aΔ δ15N = proxy for relative trophic position calculated by subtracting bulk δ15N from δ15Nsource (see eq 2). Depth = mean depth of occurrence (seeFigure 1). Wi = probability that the model was the best of those tested..
Environmental Science & Technology Article
DOI: 10.1021/acs.est.5b01009Environ. Sci. Technol. XXXX, XXX, XXX−XXX
E
different (P < 0.05; Table 2). Despite the small sample sizesused to calculate trophic position using AA-CSIA, the valueshere are in general agreement with the few previous studies thathave used diet to determine trophic level for these species whenthe constants of Nielsen et al.54 were adopted.11,47,48,57,58 Inaddition, our proxy for relative trophic position (Δδ15N) was ingeneral agreement with our trophic position estimates usingonly δ15NGlu and δ15NPhe values (Figure 2). For example, ehuhad the highest mean relative trophic position estimated fromΔδ15N values and giant trevally the lowest (P < 0.05; Table 2).However, where trophic position was calculated using AA-CSIAsuggested that other species were similar, Δδ15N valuessuggested that there were significant differences in trophicposition among other species. For instance, using Δδ15N, ukuoccupied the second highest trophic position, onaga and kahalaoccupied very similar intermediate trophic positions andopakapaka occupied the second lowest trophic position (P <0.05; Table 2). These differences were likely more evidentusing Δδ15N because of the larger sample size for these datacompared to AA-CSIA data (Table 2). Isotope and trophicposition results were also consistent between species from boththe MHI and NWHI (Figure 3).While trophic position can be determined using isotopic
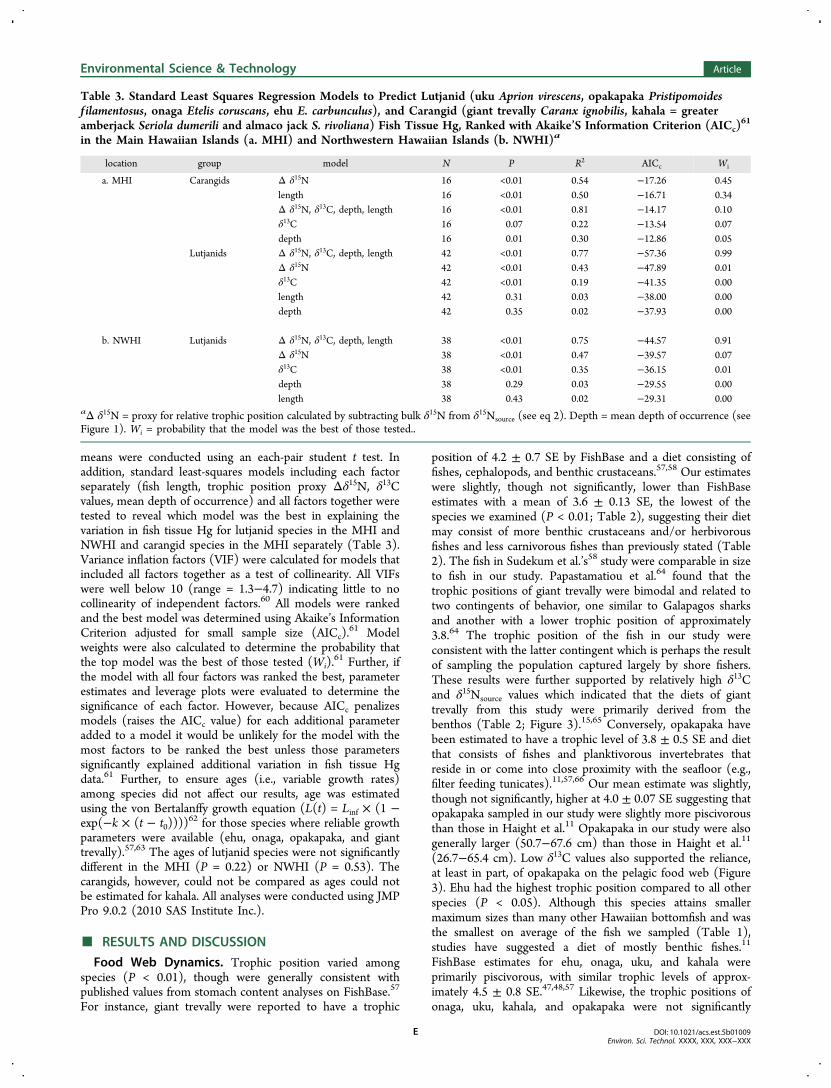
values of nitrogen, dietary resources from different food webscan also be distinguished using δ13C and δ15Nsource values. Highδ15Nsource values indicate a nitrate-rich (e.g., coastal benthos oroffshore upwelling) versus a nitrate-poor (e.g., atmospheric N)source of nitrogen.14,15,65 Giant trevally had the highestδ15Nsource values of any species (P < 0.05; Table 2). While
kahala, the other carangid, had the second highest δ15Nsourcevalues, these were not significantly different from the δ15Nsourcevalues of lutjanid species. In addition, the two species thatinhabit the shallowest waters (giant trevally and uku) had thehighest δ13C values among species (δ13C = −13.4 ± 0.47‰ SEand −15.8 ± 0.11‰ SE), with giant trevally having asignificantly higher carbon isotopic composition than anyother species (P < 0.01; Figure 3). These results imply that ukuand especially giant trevally rely more on a nearshore benthic-based food web because global mean δ13C values for marinebenthic algae are −17‰, whereas δ13C values for marinephytoplankton are approximately −22‰ and δ13C valuesrecord the relative isotopic compositions of carbon at the baseof the foodweb.15,16 Other lutjanid and carangid species hadmore intermediate carbon isotope compositions with kahalaand ehu having slightly higher values than onaga andopakapaka. These results suggest that the latter species reliedmore on pelagic sources of carbon than the others (Figure 3).However, the δ13C values for bottomfish in this study were allgreater than those of marine primary producers and althoughcoarse, this relative comparison demonstrated that all bottom-fish relied to some extent on the benthic food web. This resultis further supported by carbon isotopic values in the Pacific67
and at Station ALOHA in the MHI (pelagic particulate organicmatter from 0 to 400 m = −22 ± 0.1‰ SE) that wereconsistent with global averages, and diet studies that showvarying proportions of benthic and pelagic prey.57 It isimportant to note that benthic species are not excluded frompelagic influences simply because they reside near the seafloor.For instance, the bottomfish with more pelagic δ13C values inthis study likely consume vertically migrating or advectedpelagic prey that come into close proximity with the seafloor(e.g., Thaliacea or pelagic tunicates in the case ofopakapaka).11,57,66
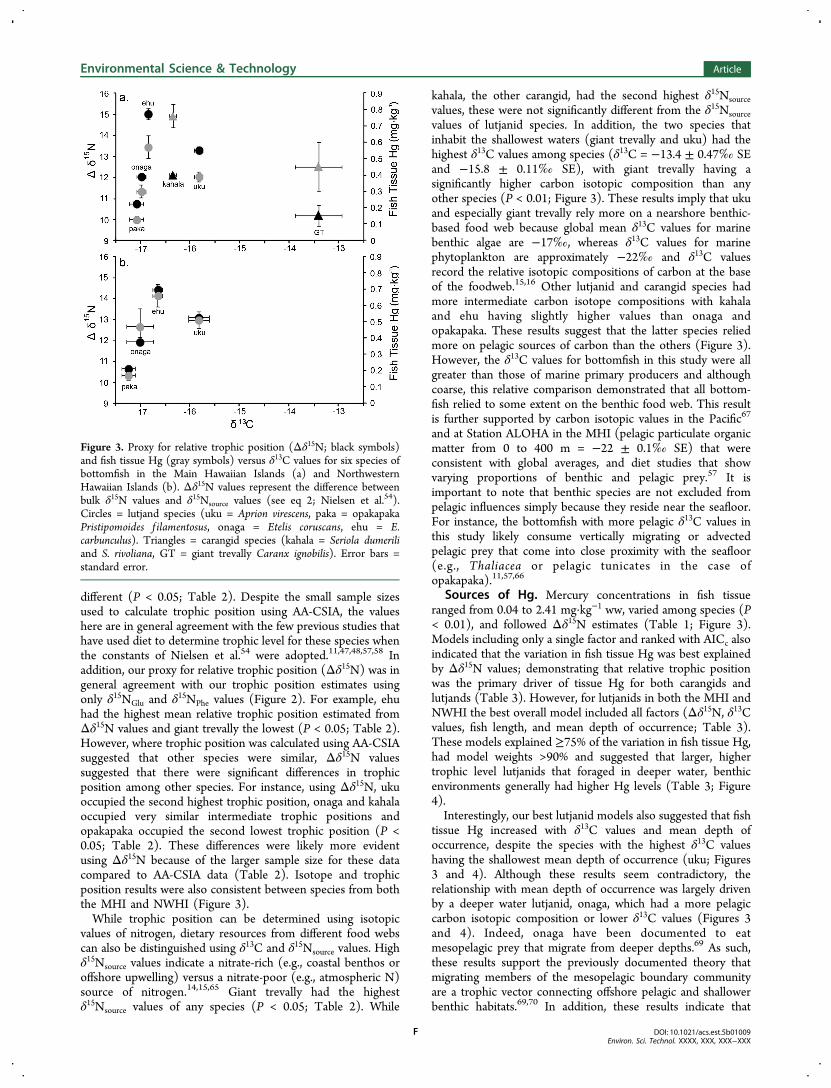
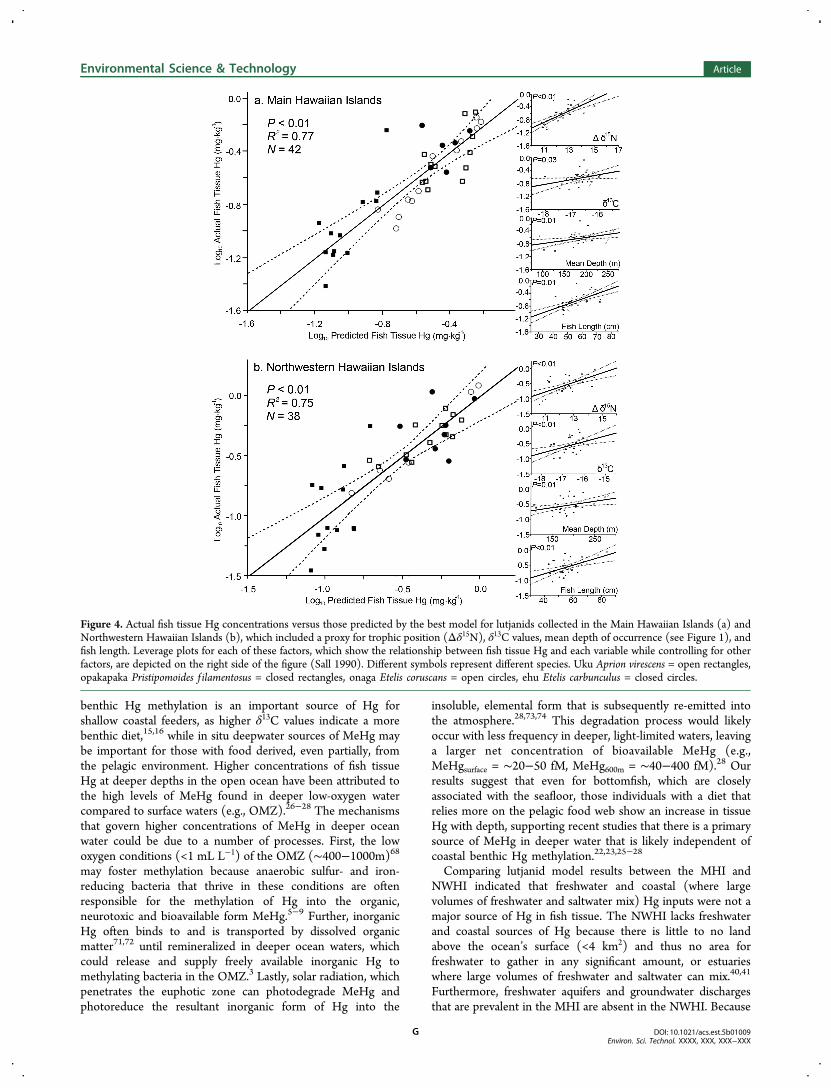
Sources of Hg. Mercury concentrations in fish tissueranged from 0.04 to 2.41 mg·kg−1 ww, varied among species (P< 0.01), and followed Δδ15N estimates (Table 1; Figure 3).Models including only a single factor and ranked with AICc alsoindicated that the variation in fish tissue Hg was best explainedby Δδ15N values; demonstrating that relative trophic positionwas the primary driver of tissue Hg for both carangids andlutjands (Table 3). However, for lutjanids in both the MHI andNWHI the best overall model included all factors (Δδ15N, δ13Cvalues, fish length, and mean depth of occurrence; Table 3).These models explained ≥75% of the variation in fish tissue Hg,had model weights >90% and suggested that larger, highertrophic level lutjanids that foraged in deeper water, benthicenvironments generally had higher Hg levels (Table 3; Figure4).Interestingly, our best lutjanid models also suggested that fish
tissue Hg increased with δ13C values and mean depth ofoccurrence, despite the species with the highest δ13C valueshaving the shallowest mean depth of occurrence (uku; Figures3 and 4). Although these results seem contradictory, therelationship with mean depth of occurrence was largely drivenby a deeper water lutjanid, onaga, which had a more pelagiccarbon isotopic composition or lower δ13C values (Figures 3and 4). Indeed, onaga have been documented to eatmesopelagic prey that migrate from deeper depths.69 As such,these results support the previously documented theory thatmigrating members of the mesopelagic boundary communityare a trophic vector connecting offshore pelagic and shallowerbenthic habitats.69,70 In addition, these results indicate that
Figure 3. Proxy for relative trophic position (Δδ15N; black symbols)and fish tissue Hg (gray symbols) versus δ13C values for six species ofbottomfish in the Main Hawaiian Islands (a) and NorthwesternHawaiian Islands (b). Δδ15N values represent the difference betweenbulk δ15N values and δ15Nsource values (see eq 2; Nielsen et al.54).Circles = lutjand species (uku = Aprion virescens, paka = opakapakaPristipomoides f ilamentosus, onaga = Etelis coruscans, ehu = E.carbunculus). Triangles = carangid species (kahala = Seriola dumeriliand S. rivoliana, GT = giant trevally Caranx ignobilis). Error bars =standard error.
Environmental Science & Technology Article
DOI: 10.1021/acs.est.5b01009Environ. Sci. Technol. XXXX, XXX, XXX−XXX
F
benthic Hg methylation is an important source of Hg forshallow coastal feeders, as higher δ13C values indicate a morebenthic diet,15,16 while in situ deepwater sources of MeHg maybe important for those with food derived, even partially, fromthe pelagic environment. Higher concentrations of fish tissueHg at deeper depths in the open ocean have been attributed tothe high levels of MeHg found in deeper low-oxygen watercompared to surface waters (e.g., OMZ).26−28 The mechanismsthat govern higher concentrations of MeHg in deeper oceanwater could be due to a number of processes. First, the lowoxygen conditions (<1 mL L−1) of the OMZ (∼400−1000m)68may foster methylation because anaerobic sulfur- and iron-reducing bacteria that thrive in these conditions are oftenresponsible for the methylation of Hg into the organic,neurotoxic and bioavailable form MeHg.5−9 Further, inorganicHg often binds to and is transported by dissolved organicmatter71,72 until remineralized in deeper ocean waters, whichcould release and supply freely available inorganic Hg tomethylating bacteria in the OMZ.3 Lastly, solar radiation, whichpenetrates the euphotic zone can photodegrade MeHg andphotoreduce the resultant inorganic form of Hg into the
insoluble, elemental form that is subsequently re-emitted intothe atmosphere.28,73,74 This degradation process would likelyoccur with less frequency in deeper, light-limited waters, leavinga larger net concentration of bioavailable MeHg (e.g.,MeHgsurface = ∼20−50 fM, MeHg600m = ∼40−400 fM).28 Ourresults suggest that even for bottomfish, which are closelyassociated with the seafloor, those individuals with a diet thatrelies more on the pelagic food web show an increase in tissueHg with depth, supporting recent studies that there is a primarysource of MeHg in deeper water that is likely independent ofcoastal benthic Hg methylation.22,23,25−28
Comparing lutjanid model results between the MHI andNWHI indicated that freshwater and coastal (where largevolumes of freshwater and saltwater mix) Hg inputs were not amajor source of Hg in fish tissue. The NWHI lacks freshwaterand coastal sources of Hg because there is little to no landabove the ocean’s surface (<4 km2) and thus no area forfreshwater to gather in any significant amount, or estuarieswhere large volumes of freshwater and saltwater can mix.40,41
Furthermore, freshwater aquifers and groundwater dischargesthat are prevalent in the MHI are absent in the NWHI. Because
Figure 4. Actual fish tissue Hg concentrations versus those predicted by the best model for lutjanids collected in the Main Hawaiian Islands (a) andNorthwestern Hawaiian Islands (b), which included a proxy for trophic position (Δδ15N), δ13C values, mean depth of occurrence (see Figure 1), andfish length. Leverage plots for each of these factors, which show the relationship between fish tissue Hg and each variable while controlling for otherfactors, are depicted on the right side of the figure (Sall 1990). Different symbols represent different species. Uku Aprion virescens = open rectangles,opakapaka Pristipomoides f ilamentosus = closed rectangles, onaga Etelis coruscans = open circles, ehu Etelis carbunculus = closed circles.
Environmental Science & Technology Article
DOI: 10.1021/acs.est.5b01009Environ. Sci. Technol. XXXX, XXX, XXX−XXX
G
of this large difference between the MHI and NWHI weexpected shallow water fish species in the MHI to have higherHg concentrations as they are purportedly exposed to muchhigher freshwater sources of Hg through runoff, freshwateraquifers, and submarine groundwater discharges.5,24,42−44
Surprisingly, Hg levels in our shallow water species (uku)were higher in the NWHI compared to the MHI (P = 0.03).Further, the models and individual relationships with fish tissueHg in the MHI and NWHI were nearly identical (Figures 4a,log10 (Fish tissue Hg) = 0.18 × Δδ15N + 0.15 × δ13C + 0.0019× mean depth + 0.016 × fish length − 1.67; and 4b, log10(fishtissue Hg) = 0.16 × Δδ15N + 0.19 × δ13C + 0.0021 × meandepth + 0.014 × fish length − 0.51). The largest difference inthese equations was the intercept, which suggested the equationfor the NWHI was shifted slightly up the y-axis to includeslightly higher tissue Hg concentrations (Figure 4). Indeed,there were slightly larger fish in the NWHI (Table 1) and largerfish have been linked with higher tissue Hg in many studies.6
Regardless, the higher tissue Hg in shallow fish from the NWHIand the nearly identical relationships of each factor with fishtissue Hg, particularly mean depth of occurrence, seen in theMHI and NWHI signified that freshwater and coastal Hg inputswere not an important source of Hg that ultimately resided inthe fish tissue studied. These results are unexpected because Hglinked to freshwater runoff in the MHI has been seen toconcentrate in coastal aquatic species and exceeded the USEPArecommended criteria for aquatic life.42,43 In addition, ground-water discharges in the MHI are a significant source of Hg tocoastal areas compared to other sites across the globe, wereelevated in total Hg (∼4pM) compared to concentrations insurface ocean water (∼1 pM),26 and have caused a directincrease in coastal total Hg concentrations (1.2− 2.4 pM).44
Others have also suggested that marine fish derive tissue Hgfrom freshwater and coastal benthic bacterial methylation thatis physically and biologically advected to the open ocean.24,75
Furthermore, in a volcanic island chain such as Hawaii where100 m depths can be reached just half a km from shore, runoffand groundwater Hg inputs were expected to influence slightlydeeper waters. Our results contradict these studies andexpectations for at least one group of bottomfish. Oneexplanation for these results may be that freshwater inputs tothe marine environment are initially less dense, remaining closeto the sea surface where strong and constant sunlight wouldlikely photodegrade those freshwater sources of MeHg and iHg.Alternatively, as part of an island group, freshwater sources ofHg could be quickly diffused to background levels. Anotherpossibility is that conditions often cited to contribute most tofreshwater Hg methylation, low lying flat plains with acidic andoften hypoxic or anoxic waters,5−9 are seldom found onvolcanic island chains due to the steep terrain.Akaike’s information criterion results for our models differed
for carangids and lutjanids, suggesting that results may not begeneralized among other fish species (Table 3). In addition, thecarbon isotopic composition of giant trevally in particular maysuggest more terrestrial freshwater sources of Hg, contrary toall other species tested. However, because we were unable tocompare giant trevally results between the MHI and NWHI weare unable to determine whether coastal sources of Hginfluenced carangid Hg levels. Our samples sizes for carangidswere also much lower than for lutjanids. Consequently, we didnot have as much power to detect differences in each factor forcarangids (i.e., mean depth of occurrence, δ13C values). Inaddition, others have demonstrated similar results for open
ocean pelagic species as for the more pelagic lutjanids in thisstudy.26,27 As such, our results are consistent with other fishtaxa from other studies26,27 and the low sample sizes forcarangids in this study likely contributed to the lack ofsignificance in model results.Distinguishing primary sources of fish tissue Hg for any
species is challenging but doing so in an open system such asthe marine environment presents multiple potential difficulties(e.g., additional sources of Hg and MeHg).3,27 Here blendingisotopic data on foraging ecology with tissue Hg concentrationsfor six species of fish within two taxa, distributed at distinctlydifferent depths with potentially different sources of Hg (e.g.,MHI versus the NWHI) allowed for primary sources of Hg infish tissue to be identified. Accordingly, our results suggestshallow coastal feeders derived much of the Hg in their tissuefrom benthic Hg methylation that, for lutjanids, did notoriginate from freshwater or coastal sources of Hg. Results alsoshowed that deepwater bottomfish derived much of the Hg intheir tissue from a combination of benthic and deepwaterpelagic sources. These results are contrary to what a few othershave suggested.24,65 Detailed information on feeding ecologyimproves our knowledge of trophic pathways, dietarypartitioning and is important to the sustainable managementof these species. Further, understanding where fish tissue Hgoriginates is critical to comprehending the consequences of thechanging environment on Hg cycles and what those changesmean for human health policy and fisheries management.3 Forinstance, pH has been identified as an important driver of Hgmethylation with more acidic water promoting higher rates ofHg methylation.8,71 Thus, knowing that ocean sources of Hgmethylation, independent of freshwater and coastal Hg, existand govern tissue Hg levels in deeper water bottomfishes mayportend that tissue Hg will increase in those species in the nearfuture as ocean pH continues to decline and OMZs continue tostrengthen and expand.76
■ AUTHOR INFORMATIONCorresponding Author*Phone: 910-578-1088; fax: 808-956-7633; e-mail: [email protected].
NotesThe authors declare no competing financial interest
■ ACKNOWLEDGMENTSWe thank the Joint Institute for Marine and AtmosphericResearch (JE123368) and University of Hawaii Sea GrantCollege Program (Program Development Grant No. R/SS-7PD) for providing the funds for this project. Additional thanksgoes to the State of Hawaii Division of Aquatic Resources forproviding funds via the Federal Aid in Sport Fish Restorationprogram (F17R35-study IX). We also thank L. Dodie Lau ofthe Pelagic Fisheries Research Program and Dr. MarkMerrifield of the Joint Institute for Marine and AtmosphericResearch for making this project possible. Special thanks go toDanielle Hoen for additional isotope work and data, andNatalie Wallsgrove, Steven Bailey, and Cassie Kaapu-Lyons foradvice and lab assistance. Thanks also to three anonymousreviewers that helped to improve this paper. This research wasalso partially supported by the National Science Foundationunder Grant Number OCE-1041329 (to B.N.P. and J.C.D.).Any opinions, findings, and conclusions or recommendationsexpressed in this material are those of the authors and do not
Environmental Science & Technology Article
DOI: 10.1021/acs.est.5b01009Environ. Sci. Technol. XXXX, XXX, XXX−XXX
H
necessarily reflect the views of the National ScienceFoundation. This is SOEST contribution number 9331.
■ REFERENCES(1) Mergler, D.; Anderson, H. A.; Hing Man Chan, L.; Mahaffey, K.R.; Murray, M.; Sakamoto, M.; Stern, A. H. Methylmercury exposureand health effects in humans: A worldwide concern. Ambio 2007, 36,3−11.(2) Scheuhammer, A. M.; Meyer, M. W.; Sandheinrich, M. B.;Murray, M. W. Effects of environmental methylmercury on the healthof wild birds, mammals, and fish. Ambio 2007, 36, 12−18.(3) Lamborg, C.; Bowman, K.; Hammerschmidt, C.; Gilmour, C.;Munson, K.; Selin, N.; Tseng, C. M. Mercury in the anthropoceneocean. Oceanogr 2014, 27, 76−87.(4) Hall, B. D.; Bodaly, R. A.; Fudge, R. J. P.; Rudd, J. W. M.;Rosenberg, D. M. Food as the dominant pathway of methylmercuryuptake by fish. Water, Air, Soil Pollut. 1997, 100, 13−24.(5) Ullrich, S. M.; Tanton, T. W.; Abdrashitova, S. A. Mercury in theaquatic environment: A review of factors affecting methylation.Environ. Sci. Technol. 2001, 31, 241.(6) Sackett, D. K.; Cope, W. G.; Rice, J. A.; Aday, D. D. Theinfluence of fish length on tissue mercury dynamics: Implications fornatural resource management and human health risk. Int. J. Environ.Res. Public Health 2013, 10, 638−659.(7) DiGiulio, R. T.; Hinton, D. E. The toxicology of fishes. CRC Press:Boca Raton, FL, 2008.(8) Sackett, D. K.; Aday, D. D.; Rice, J. A.; Cope, W. G. A statewideassessment of mercury dynamics in North Carolina water bodies andfish. Trans. Am. Fish. Soc. 2009, 138, 1328−1341.(9) Gilmour, C. C.; Henry, E. A.; Mitchell, R. Sulfate stimulation ofmercury methylation in fresh-water sediments. Environ. Sci. Technol.1992, 26, 2281−2287.(10) Harris, H. H.; Pickering, I. J.; George, G. N. The chemical formof mercury in fish. Science 2003, 301, 1203.(11) Haight, W. R.; Parrish, J. D.; Hayes, T. A. Feeding ecology ofdeepwater Lutjanid snappers at Penguin Bank, Hawaii. Trans. Am. Fish.Soc. 1993, 122, 328−347.(12) Minagawa, M.; Wada, E. Stepwise enrichment of 15N along foodchains: Further evidence and the relation between 15N and animal age.Geochim. Cosmochim. Acta 1984, 48, 1135−1140.(13) Post, D. M. Using stable isotopes to estimate trophic position:Models, methods, and assumptions. Ecology 2002, 83, 703−718.(14) Dale, J. J.; Wallsgrove, N. J.; Popp, B. N.; Holland, K. N.Nursery habitat use and foraging ecology of the brown stingrayDasyatis lata determined from stomach contents, bulk and amino acidstable isotopes. Mar. Ecol.: Prog. Ser. 2011, 433, 221−236.(15) McConnaughey, T.; McRoy, C. P. 13C label identifies eelgrass(Zostera marina) carbon in an Alaskan estuarine food web. Mar. Biol.1979, 53, 263−269.(16) France, R. L. Carbon-13 enrichment in benthic compared toplanktonic algae: Foodweb implications. Mar. Ecol.: Prog. Ser. 1995,124, 307−312.(17) Stewart, A. R.; Saiki, M. K.; Kuwabara, J. S.; Alpers, C. N.;Marvin DiPasquale, M.; Krabbenhoft, D. P. Influence of planktonmercury dynamics and trophic pathways on mercury concentrations oftop predator fish of a mining-impacted reservoir. Can. J. Fish. Aquat.Sci. 2008, 65, 2351−2366.(18) Coelho, J. P.; Mieiro, C. L.; Pereira, E.; Duarte, A. C.; Pardal, M.A. Mercury biomagnification in a contaminated estuary food web:Effects of age and trophic position using stable isotope analyses. Mar.Pollut. Bull. 2013, 69, 110−115.(19) Mason, R. P.; Choi, A. L.; Fitzgerald, W. F.; Hammerschmidt, C.R.; Lamborg, C. H.; Soerensen, A. L.; Sunderland, E. M. Mercurybiogeochemical cycling in the ocean and policy implications. Environ.Res. 2012, 119, 101−117.(20) Driscoll, C. T.; Mason, R. P.; Chan, H. M.; Jacob, D. J.; Pirrone,N. Mercury as a global pollutant: Sources, pathways, and effects.Environ. Sci. Technol. 2013, 47, 4967−4983.
(21) Senn, D. B.; Chesney, E. J.; Blum, J. D.; Bank, M. S.; Maage, A.;Shine, J. P. Stable isotope (N, C, Hg) study of methylmercury sourcesand trophic transfer in the northern Gulf of Mexico. Environ. Sci.Technol. 2010, 44, 1630−1637.(22) Newman, M. C.; Xu, X.; Cotton, C. F.; Tom, K. R. Highmercury concentrations reflect trophic ecology of three deep-waterchondrichthyans. Arch. Environ. Contam. Toxicol. 2011, 60, 618−625.(23) Pethybridge, H.; Butler, E. C. V.; Cossa, D.; Daley, R.; Boudou,A. Trophic structure and biomagnifications of mercury in anassemblage of deepwater chondrichthyans from southeastern Australia.Mar. Ecol.: Prog. Ser. 2012, 451, 163−174.(24) Hammerschmidt, C. R.; Fitzgerald, W. F. Methylmercurycycling in sediments on the continental shelf of southern NewEngland. Geochim. Cosmochim. Acta 2006, 70, 918−930.(25) Mason, R. P.; Rolfhus, K. R.; Fitzgerald, W. F. Methylated andelemental mercury cycling in surface and deep ocean waters of theNorth Atlantic. Water Air Soil Poll. 1995, 80, 665−667.(26) Sunderland, E. M.; Krabbenhoft, D. P.; Moreau, J. W.; Strode, S.A.; Landing, W. M. Mercury sources, distributions and bioavailabilityin the North Pacific Ocean: Insights from data and models. GlobalBiogeochem. Cycles. 2009, 23.(27) Choy, C. A.; Popp, B. N.; Kaneko, J. J.; Drazen, J. C. Theinfluence of depth on mercury levels in pelagic fishes and their prey.PNAS 2009, 106, 13865−13869.(28) Blum, J. D.; Popp, B. N.; Drazen, J. C.; Choy, C. A.; Johnson, M.W. Methylmercury production below the mixed layer in the NorthPacific Ocean. Nat. Geo. 2013, 6, 879−884.(29) Kelley, C.; Moffitt, R.; Smith, J. R. Mega- to micro-scaleclassification and description of bottomfish essential fish habitat onfour banks in the Northwestern Hawaiian Islands. Atoll. Res. Bull. 2006,543, 319−332.(30) Merritt, D.; Donovan, M. K.; Kelley, C.; Waterhouse, L.; Parke,M.; Wong, K.; Drazen, J. C. BotCam: A baited camera systemdeveloped for non-extractive monitoring of bottomfish species. FishBull. 2011, 109, 56−67.(31) Misa, W. F. X. E.; Drazen, J. C.; Kelley, C. D.; Moriwake, V. N.Establishing species-−habitat associations for 4 eteline snappers withthe use of a baited stereo-video camera system. Fish. Bull. 2014, 111,293−308.(32) Kelley, C. D.; Moriwake, V. N. Appendix 3: Essential fish habitatdescriptions, Part 1: Bottomfish. In Final Fishery Management Plan forCoral Reef Ecosystems of the Western Pacific Region, Essential FishHabitat for Management Unit Species; WPRFMC, 2012; p 3.(33) Sackett, D. K.; Drazen, J. C.; Moriwake, V. N.; Kelley, C. D.;Schumacher, B. D.; Misa, W. F. X. E. Marine protected areas fordeepwater fish populations: An evaluation of their effects in Hawai’i.Mar. Biol. 2014, 161, 411−425.(34) Bank, M. S.; Chesney, E.; Shine, J. P.; Maage, A.; Senn, D. B.Mercury bioaccumulation and trophic transfer in sympatric snapperspecies from the Gulf of Mexico. Ecol. Appl. 2007, 17, 2100−2110.(35) Pooley, S. G. Demand considerations in fisheries manage-mentHawaii’s market for bottom fish. In Tropical Snappers andGroupers: Biology and Fisheries Management; Polovina, J. J., Ralston, S.,Eds.; Westview Press: Boulder, CO. 1987.(36) Hospital, J.; Pan, M. Demand for Hawaii Bottomfish Revisited:Incorporating Economics into Total Allowable Catch Management,NOAA-TM-NMFS-PIFSC-20; U.S. Department of Commerce,NOAA Techbnical Memoranda, 2009.(37) Ferriss, B. E.; Essington, T. E. Can fish consumption rateestimates be improved by linking bioenergetics and mercury massbalance models? Application to tunas. Ecol. Modell. 2014, 272, 232−241.(38) Doty, M. S.; Oguri, M. The island mass effect. J. Cons., Cons. Int.Explor. Mer 1956, 22, 33−37.(39) Gilmartin, M.; Revelante, N. The ‘island mass’ effect on thephytoplankton and primary production of the Hawaiian islands. J. Exp.Mar. Biol. Ecol. 1974, 16, 181−204.(40) Hines, M.; Faganeli, J.; Adatto, I.; Horvat, M. Microbial mercurytransformations in marine, estuarine and freshwater sediment
Environmental Science & Technology Article
DOI: 10.1021/acs.est.5b01009Environ. Sci. Technol. XXXX, XXX, XXX−XXX
I
downstream of the Idrija Mercury Mine, Slovenia. Appl. Geochem.2006, 21, 1924−1939.(41) Merritt, K. A.; Amirbahman, A. Mercury methylation dynamicsin estuarine and coastal marine environmentsA critical review. EarthSci. Rev. 2009, 96, 54−66.(42) Luoma, S. N. The dynamics of biologically available mercury ina small estuary. Estuarine Coastal Mar. Sci. 1977, 5, 643−652.(43) Yamane, C. M.; Lum, M. G. Quality of storm-water runoff,Mililani Town, Oahu, Hawaii 1980−84, USGS Water ResourcesInvestigations Report 85-4265, 1985. 64p.(44) Ganguli, P. M.; Swarzenski, P. W.; Dulaiova, H.; Glenn, C. R.;Flegal, A. R. Mercury dynamics in a coastal aquifer: Maunalua Bay,Oahu, Hawai’i. Estuarine Coastal Mar. Sci. 2014, 140, 52−65.(45) Peterson, B. J.; Fry, B. Stable isotopes in ecosystem studies.Annu. Rev. Ecol. Syst. 1987, 18, 293−320.(46) Humphreys, R. L.; Kramer, S. H. Ciguatera and the feedinghabits of the greater amberjack, Seriola dumerili, in the HawaiianArchipelago. In Proceedings of the Second Symposium on ResourceInvestigations in the Northwestern Hawaiian Islands, Vol. 2; Grigg, R. W.;Tanoue, K. Y., Eds.; University of Hawaii Sea Grant: Honolulu, HI.2014, 237−264.(47) Bowman, R. E.; Stillwell, C. E.; Michaels, W. L.; Grosslein, M.D. Food of Northwest Atlantic Fishes and Two Common Species of Squid,NMFS-NE 155; NOAA Technical Memoranda, 2000.(48) Barreiros, J. P.; Morato, T.; Santos, R. S.; de Borba, A. E.Interannual changes in the diet of the almaco jack, Seriola rivoliana(Perciformes: Carangidae) from the Azores. Cybium. 2003, 27, 37−40.(49) Bloom, N. S. On the chemical form of mercury in edible fish andmarine invertebrate tissue. Can. J. Fish. Aquat. Sci. 1992, 49, 1010−1017.(50) United States Environmental Protection Agency. Mercury insolids and solutions by thermal decomposition, amalgamation, andatomic absorption spectrophotometry. Method 7473; February, 2007.(51) Reyes, L. H.; Mizanur Rahman, G. M.; Fahrenholz, T.; SkipKingston, H. M. Comparison of methods with respect to efficiencies,recoveries and quantitation of mercury species interconversions infood demonstrated using tuna fish. Anal. Bioanal. Chem. 2008, 390,21−23-2132.(52) Post, D. M.; Layman, C. A.; Arrington, D. A.; Takimoto, G.;Quattrochi, J.; Montana, C. G. Getting to the fat of the matter:Models, methods and assumptions for dealing with lipids in stableisotope analyses. Oecologia 2007, 152, 179−189.(53) Chikaraishi, Y.; Ogawa, N. O.; Kashiyama, Y.; Takano, Y.; Suga,H.; Tomitani, A.; Miyashita, H.; Kitazato, H.; Ohkouchi, N.Determination of aquatic food-web structure based on compound-specific nitrogen isotopic composition of amino acids. Limnol.Oceanogr. Methods 2009, 7, 740−750.(54) Nielsen, J. M.; Popp, B. N.; Winder, M. Meta-analysis of aminoacid stable nitrogen isotope ratios for estimating trophic position inmarine organisms. Oecologia 2015, DOI: 10.1007/s00442-015-3305-7.(55) Choy, C. A.; Davison, P. C.; Drazen, J. C.; Flynn, A.; Gier, E. J.;Hoffman, J. C.; McClain-Counts, J. P.; Miller, T. W.; Popp, B. N.;Ross, S. W.; Sutton, T. T. Global trophic position comparison of twodominant mesopelagic fish families (Myctophidae, Stomiidae) usingamino acid nitrogen isotopic analyses. PLoS One 2012, 7, e50133.(56) Germain, L. R.; Koch, P. L.; Harvey, J.; McCarthy, M. D.Nitrogen isotope fractionation in amino acids from harbor seals:Implications for compound-specific trophic position calculations. Mar.Ecol.: Prog. Ser. 2013, 482, 265.(57) FishBase; Creative Commons Attribution-Noncommercial 3.0Unported License, 2014, http://www.fishbase.org/.(58) Sudekum, A. E.; Parrish, J. D.; Radtke, R. L.; Ralston, S. Lifehistory and ecology of large jacks in undisturbed, shallow, oceaniccommunities. Fish. Bull. 1991, 89, 493−513.(59) Bradley, C. Testing the Use of Compound Specific Isotopic Analysisof Amino Acids in Trophic Ecosystem Studies; University of Hawaii:Manoa, Dissertation, 2013.(60) Neter, J.; Kutner, M. H.; Nachtsheim, C. J.; Wasserman, W.Applied Linear Statistical Models, 4th ed.; Irwin: Chicago, 1996.
(61) Burnham, K. P.; Anderson, D. R.Model Selection and Inference: APractical Information-Theoretic Approach; Springer-Verlag: New York,1998.(62) Hilborn, R.; Walters, C. J. Quantitative Fisheries Stock Assessment:Choice, Dynamics and Uncertainty; Kluwer Academic Publishers:Norwell, MA, 1992.(63) Andrews, A. H.; DeMartini, E. E.; Brodziak, J.; Nichols, R. S.;Humphreys, R. L. A long-lived life history for a tropical, deepwatersnapper (Pristipomoides filamentosus): Bomb radiocarbon and lead-radium dating as extensions of daily increment analyses in otoliths.Can. J. Fish Aquat. Sci. 2012, 69, 1850−1869.(64) Papastamatiou, Y. P.; Meyer, C. G.; Kosaki, R. K.; Wallsgrove,N. J.; Popp, B. N. Migration and foraging of predators associated withmesophotic coral reefs and their potential for linking ecologicalhabitats. Mar. Ecol.: Prog. Ser. 2015, 521, 155−170.(65) Sherwood, O. A.; Lehmann, M. F.; Schubert, C. J.; Scott, D. B.;McCarthy, M. D. Nutrient regime shift in the western North Atlanticindicated by compound-specific δ15N of deep-sea gorgonian corals.Proc. Natl. Acad. Sci. U.S.A. 2011, 108, 1011−1015.(66) Tew, K. S.; Lo, W.-T. Distribution of Thaliacea in SW Taiwancoastal water in 1997, with special reference to Doliolum denticulatum,Thalia democratic and T. orientalis. Mar. Ecol.: Prog. Ser. 2005, 292,181−193.(67) Max, L. M.; Hamilton, S. L.; Gaines, S. D.; Warner, R. R.Benthic processes and overlying fish assemblages drive thecomposition of benthic detritus on a central Pacific coral reef. Mar.Ecol.: Prog. Ser. 2013, 482, 181−195.(68) DeLeo, F. C.; Drazen, J. C.; Vetter, E. W.; Rowden, A. A.; Smith,C. R. The effects of submarine canyons and the oxygen minimum zoneon deep-sea fish assemblages off Hawaii. Deep Sea Res., Part I 2012, 64,54−70.(69) Haight, W. R.; Parrish, J. D.; Hayes, T. A. Feeding ecology ofdeepwater lutjanid snappers at Penguin Bank. Hawaii. Trans. Am. Fish.Soc. 1993, 122, 328−347.(70) Benoit-Bird, K. J.; Au, W. W. L. Extreme diel horizontalmigrations by a tropical nearshore resident micronekton community.Mar. Ecol.: Prog. Ser. 2006, 319, 1−14.(71) Ravichandran, M. Interactions between mercury and dissolvedorganic mattera review. Chemospere 2004, 55, 319−331.(72) Chiasson-Gould, S. A.; Blais, J. M.; Poulain, A. J. Dissolvedorganic matter kinetically controls mercury bioavailability to bacteria.Environ. Sci. Technol. 2014, 48, 3153−3161.(73) Amyot, M.; Mierle, G.; Lean, D.; McQueen, D. J. Effect of solarradiation on the formation of dissolved gaseous mercury in temperatelakes. Geochim. Cosmochim. Acta 1997, 61, 975−987.(74) Sellers, P.; Kelly, C. A.; Rudd, J. W. M. Fluxes of methylmercuryto the water column of a drainage lake: The relative importance ofinternal and external sources. Limnol. Oceanogr. 2001, 46, 623−631.(75) Macdonald, R. W.; Barrie, L. A.; Bidleman, T. F.; Diamond, M.L.; Gregor, D. J.; Semkin, R. G.; Strachan, W. M. J.; Li, Y. F.; Wania,F.; Alaee, M.; Alexeeva, L. B.; Backus, S. M.; Bailey, R.; Bewers, J. M.;Gobeil, C.; Halsall, C. J.; Harner, T.; Hoff, J. T.; Jantunen, L. M. M.;Lockhart, W. L.; Mackay, D.; Muir, D. C. G.; Pudykiewicz, J.; Reimer,K. J.; Smith, J. N.; Stern, G. A.; Schroeder, W. H.; Wagemann, R.;Yunker, M. B. Contaminants in the Canadian Arctic: 5 years ofprogress in understanding sources, occurrence and pathways. Sci. TotalEnviron. 2000, 254, 93−234.(76) Stramma, L.; Johnson, G. C.; Sprintall, J.; Mohrholz, V.Expanding oxygen-minimum zones in the tropical oceans. Science2008, 320, 655−658.
Environmental Science & Technology Article
DOI: 10.1021/acs.est.5b01009Environ. Sci. Technol. XXXX, XXX, XXX−XXX
J