metabolism of sitosterol in -...
TRANSCRIPT

Metabolism of # - Sitosterol in Man
GERALDSALEN, E. H. AHRENS, JR., and Scorr M. GRUNDY
From The Rockefeller University, NewYork 10021
A B S T R A C T The metabolism of P-sitosterol was com-pared to that of cholesterol in 12 patients. Sterol bal-ance methods were supplemented by radiosterol studies,with the following results. (a) Plasma concentrationsof P-sitosterol ranged from 0.30 to 1.02 mg/100 mlplasma in patients on intakes of 6-sitosterol typical ofthe American diet. Plasma levels were raised littlewhen intakes were increased greatly, and on fixed in-takes they were constant from week to week. On dietsdevoid of plant sterols, the plasma and feces rapidly be-came free of p-sitosterol. (b) The percentage of esterifiedP-sitosterol in the plasma was the same as for cholesterol.However, the rate of esterification of P-sitosterol wasslower than that for cholesterol. (c) Specific activity-time curves after simultaneous pulse labeling with#-sitosterol-3H and cholesterol-"C conformed to two-pool models. The two exponential half-lives of f-sito-sterol were much shorter than for cholesterol, and poolsizes were much smaller. Values of turnover for,8-sitosterol obtained by the sterol balance method agreedclosely with those derived by use of the two-pool model.There was no endogenous synthesis of P-sitosterol in thepatients studied; hence, daily turnover of P-sitosterolequaled its daily absorption. Absorption of P-sitosterolwas 5% (or less) of daily intake, while cholesterol ab-sorption ranged from 45 to 54% of intake. (d) About20% of the absorbed f-sitosterol was converted to cholicand chenodeoxycholic acids. The remainder was ex-creted in bile as free sterol; this excretion was morerapid than that of cholesterol. (e) The employment ofi3-sitosterol as an internal standard to correct for lossesof cholesterol in sterol balance studies is further vali-dated by the results presented here.
INTRODUCTIONThe fastidious work of Sch6nheimer (1, 2) in the 1930'sdemonstrated that little if any intestinal absorption ofplant sterols occurs in mammals. In five animal speciesSchbnheimer found no increase in the total sterol con-tent of the liver after feeding large amounts of plant
Received for publication 17 October 1969 and in revisedform 14 January 1970.
sterols and concluded that plant sterols were not ab-sorbed to any appreciable extent. These conclusionswere sharpened in 1955 by Gould, Jones, Wissler, andTaylor (3, 4), who addressed the question of 8-sitosterolabsorption in moribund patients and in rats with thegreater sensitivity inherent in the use of radioactivesterols; these authors estimated the absorption of radio-sterol at less than 5% of the dose fed. In rats Borg-str6m (5) in 1968 verified these low levels of absorp-tion of P-sitosterol.
However, later investigators (6-9) reached differentconclusions: they measured P-sitosterol absorption inrats by means of various sterol balance procedures andascribed to absorption any difference between oral in-take and fecal excretion. In this manner they ascertainedthat up to 50% of the intake was absorbable. However,these workers did not consider that losses of plantsterols during intestinal transit can be due to bacterialdestruction of the sterol ring, a possibility that to usseems highly likely (10).
Since we have claimed (10) that p-sitosterol is anideal internal standard to correct for degradative lossesof cholesterol in sterol balance studies, we considered itnecessary to reevaluate the question of 8-sitosterol ab-sorption in man. Wemeasured the absorption of P-sito-sterol by the isotopic balance method (11 ) and by analysisof specific activity-time curves after pulse labeling in-travenously (12); we then compared these resultswith data for cholesterol absorption obtained simultane-ously in the same patients. Our findings agree with theresults of Gould and of Borgstr6m, namely, that lessthan 5% of -dietary 1-sitosterol is absorbed. In thecourse of these studies we obtained other data concern-ing the metabolism of 3-sitosterol in man, such as thequestion of its endogenous synthesis (13), its esterifica-tion and transport in the plasma, and its transformationinto cholic and chenodeoxycholic acids.
METHODSPatientsStudies were carried out on the metabolic ward at The
Rockefeller University Hospital; the age, sex, body build,and clinical diagnosis of each patient are given in Table I.Eight patients had familial hypercholesterolemia with normal
952 The Journal of Clinical Investigation Volume 49 1970

plasma triglyceride concentrations (type II by the lipo-protein phenotyping method of Fredrickson, Levy, and Lees[15] ); three patients had elevations in both plasma cho-lesterol and triglyceride concentrations (one type IV andtwo type V); and one patient had normal concentrations oflipoproteins.
DietsFood intakes consisted exclusively of orally administered
liquid formula feedings in which dietary fats contributed40%, protein 15%, and glucose 45% of total caloric intake,or were fat free (15% protein and 85%o glucose) ; vitaminand mineral supplements were given as described previ-ously (16). In each case the caloric intake was adjustedto maintain total body weight at a constant level throughouteach study.
Table II lists the dietary fats used and the sterol con-tents of the various formulas. When the plant sterols andcholesterol were not inherent in the dietary fats, they were
dissolved in them prior to their incorporation in the formu-las during large scale homogenization (16). Aliquots ofeach formula were repeatedly analyzed for sterol content(17) as tests of formula homogeneity.
Experimental design(a) Patient la. Patient 1 was studied on different diets
in two successive years. In the earlier study (la) a formuladiet containing tracer amounts of 8-sitosterol-22,23-3H was
fed five times daily for 83 days in order to attain the isotopicsteady state (18) for f-sitosterol. During this steady state,measurements of the concentration of fi-sitosterol in theplasma were found to be the same by two independentmethods, gas-liquid chromatographic (GLC), and isotopic(see section Isotopes). After oral administration of labeledjS-sitosterol was discontinued, the cumulative clearance of#-sitosterol from the body was determined as a measure ofthe amount of the sterol retained in the body.
(b) Patients lb, 2, and 3. The rates of turnover offi-sitosterol and cholesterol in the plasma were determinedfrom specific activity-time curves in patients lb, 2, and 3after simultaneous pulse labeling with f-sitosterol-22,23-3Hand cholesterol-4-'4C by the intravenous route; calculationsof body pool sizes and intestinal absorption of cholesteroland fi-sitosterol also were made. Conversion of 6-sitosterolinto the primary bile acids was demonstrated on samples ofbile obtained by duodenal intubation.
(c) Patients 4-8. In these five patients the effects ofmoderate and high intakes of dietary #-sitosterol (desig-nated as studies a and b, respectively) on plasma concentra-tions of cholesterol and P-sitosterol were assessed. Mea-surements of turnover and pool sizes of 8-sitosterol weremade in patient 4 on the two intake levels.
(d) Patients 9-12. Stools from these patients were ana-
lyzed for the presence of #-sitosterol at a time when thissterol had been absent from the diets for at least 4 wk.Measurements were made by gas-liquid chromatography(GLC), utilizing the maximum sensitivity that we canpresently attain (see under Results).
TABLE IClinical Data
%ofPatient Ideal
No. Initials Age Sex Height Weight Weight* Diagnosist
yr cm kg
1 H. T. 57 M 162 46 84 Hypercholesterolemia (Type II)2 M. R. 60 M 167 67 109 Hyperglyceridemia (Type V)
3 C. Z. 63 M 181 94 122 Normocholesterolemia, IHD,§ PVD§4 M. S. 37 M 167 54 93 Hypercholesterolemia (Type II), IHD,
xanthomatosis5 J. R. 36 F 164 53 98 Hypercholesterolemia (Type II), IHD,
PVD, xanthomatosis6 R. G. 58 F 147 61 120 Hypercholesterolemia (Type II), IHD,
xanthomatosis, essential hypertension7 J. H. 39 M 172 74 104 Hypercholesterolemia (Type II)
8 N. A. 30 M 170 67 102 Hypercholesterolemia (Type II), IHD9 A. M. 60 F 164 66 108 Hyperglyceridemia (Type IV), IHD, PVD,
chronic lymphatic leukemia10 E. K. 45 F 159 56 105 Hypercholesterolemia (Type II), IHD
11 R. W. 41 M 176 75 102 Hyperglyceridemia (Type V), PVD12 R. F. 55 F 154 64 128 Hypercholesterolemia (Type II), IHD
* According to life insurance tables (14).t Phenotyping of hyperlipoproteinemia by paper strip electrophoresis according to Fredrickson, Levy, and Lees (15).§ IHD, ischemic heart disease; PVD, peripheral vascular disease.
P-Sitosterol Metabolism in Man 953
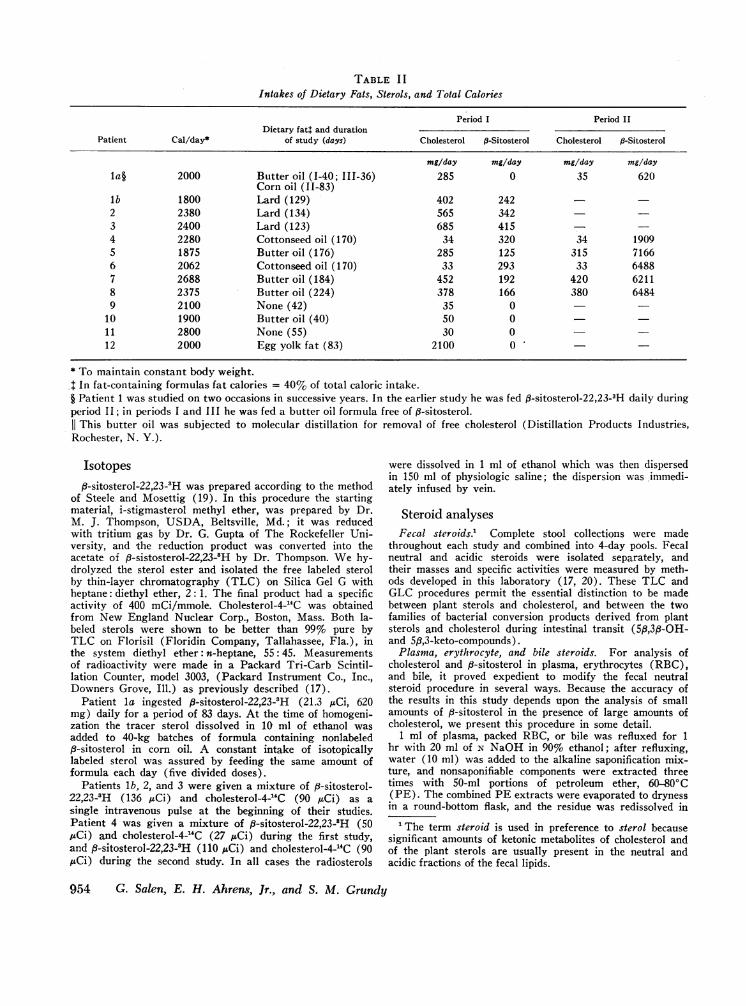
TABLE I IIntakes of Dietary Fats, Sterols, and Total Calories
Period I Period IIDietary fat: and duration
Patient Cal/day* of study (days) Cholesterol P-Sitosterol Cholesterol P-Sitosterol
mg/day mg/day mg/day mg/dayla§ 2000 Butter oil (1-40; 111-36) 285 0 35 620
Corn oil (11-83)lb 1800 Lard (129) 402 2422 2380 Lard (134) 565 3423 2400 Lard (123) 685 4154 2280 Cottonseed oil (170) 34 320 34 19095 1875 Butteroil (176) 285 125 315 71666 2062 Cottonseed oil (170) 33 293 33 64887 2688 Butter oil (184) 452 192 420 62118 2375 Butter oil (224) 378 166 380 64849 2100 None (42) 35 0
10 1900 Butter oil (40) 50 011 2800 None (55) 30 012 2000 Egg yolk fat (83) 2100 0
* To maintain constant body weight..: In fat-containing formulas fat calories = 40% of total caloric intake.§ Patient 1 was studied on two occasions in successive years. In the earlier study he was fed f3-sitosterol-22,23-3H daily duringperiod II; in periods I and III he was fed a butter oil formula free of ,3-sitosterol.
This butter oil was subjected to molecular distillation for removal of free cholesterol (Distillation Products Industries,Rochester, N. Y.).
Isotopes3-sitosterol-22,23-8H was prepared according to the method
of Steele and Mosettig (19). In this procedure the startingmaterial, i-stigmasterol methyl ether, was prepared by Dr.M. J. Thompson, USDA, Beltsville, Md.; it was reducedwith tritium gas by Dr. G. Gupta of The Rockefeller Uni-versity, and the reduction product was converted into theacetate of 8-sistosterol-22,23-8H by Dr. Thompson. Wehy-drolyzed the sterol ester and isolated the free labeled sterolby thin-layer chromatography (TLC) on Silica Gel G withheptane: diethyl ether, 2: 1. The final product had a specificactivity of 400 mCi/mmole. Cholesterol-4-'4C was obtainedfrom New England Nuclear Corp., Boston, Mass. Both la-beled sterols were shown to be better than 99%c pure byTLC on Florisil (Floridin Company, Tallahassee, Fla.), inthe system diethyl ether: n-heptane, 55: 45. Measurementsof radioactivity were made in a Packard Tri-Carb Scintil-lation Counter, model 3003, (Packard Instrument Co., Inc.,Downers Grove, Ill.) as previously described (17).
Patient la ingested 8-sitosterol-22,23-'H (21.3 MCi, 620mg) daily for a period of 83 days. At the time of homogeni-zation the tracer sterol dissolved in 10 ml of ethanol wasadded to 40-kg batches of formula containing nonlabeled#-sitosterol in corn oil. A constant intake of isotopicallylabeled sterol was assured by feeding the same amount offormula each day (five divided doses).
Patients lb, 2, and 3 were given a mixture of 8-sitosterol-22,23-3H (136 ,uCi) and cholesterol-4-J4C (90 ,uCi) as asingle intravenous pulse at the beginning of their studies.Patient 4 was given a mixture of fi-sitosterol-22,23-3H (50,Ci) and cholesterol-4-"C (27 ,uCi) during the first study,and 8-sitosterol-22,23-8H (110 ,uCi) and cholesterol-4-"C (90MuCi) during the second study. In all cases the radiosterols
were dissolved in 1 ml of ethanol which was then dispersedin 150 ml of physiologic saline; the dispersion was immedi-ately infused by vein.
Steroid analysesFecal steroids.' Complete stool collections were made
throughout each study and combined into 4-day pools. Fecalneutral and acidic steroids were isolated separately, andtheir masses and specific activities were measured by meth-ods developed in this laboratory (17, 20). These TLC andGLC procedures permit the essential distinction to be madebetween plant sterols and cholesterol, and between the twofamilies of bacterial conversion products derived from plantsterols and cholesterol during intestinal transit (5#,3p-OH-and 5,8,3-keto-compounds).
Plasma, erythrocyte, and bile steroids. For analysis ofcholesterol and f-sitosterol in plasma, erythrocytes (RBC),and bile, it proved expedient to modify the fecal neutralsteroid procedure in several ways. Because the accuracy ofthe results in this study depends upon the analysis of smallamounts of j8-sitosterol in the presence of large amounts ofcholesterol, we present this procedure in some detail.
1 ml of plasma, packed RBC, or bile was refluxed for 1hr with 20 ml of N NaOH in 90% ethanol; after refluxing,water (10 ml) was added to the alkaline saponification mix-ture, and nonsaponifiable components were extracted threetimes with 50-ml portions of petroleum ether, 60-80'C(PE). The combined PE extracts were evaporated to drynessin a round-bottom flask, and the residue was redissolved in
1 The term steroid is used in preference to sterol becausesignificant amounts of ketonic metabolites of cholesterol andof the plant sterols are usually present in the neutral andacidic fractions of the fecal lipids.
954 G. Salen, E. H. Ahrens, Jr., and S. M. Grundy

5.00 ml of ethyl acetate containing 350 Ag of 5a-cholestane.4 ml of this solution was utilized for radioactivity counting.The remaining 1 ml was taken for sterol analysis by GLC;solvent was evaporated and the trimethylsilyl (TMS)ethers of the sterols were formed by addition of 50 gl ofTMS reaction mixture (Sil Prep, Applied Science Labora-tories, State College, Pa.). Generally, about 3 pl of thismixture was analyzed by GLC; this was equivalent to about1% (1/5 X 3/50) of the neutral sterols in the original 1 mlsample of plasma, packed RBC, or bile.
Much greater sensitivity was required for analyses ofmaterials obtained from patients fed diets free of p-sitosterol.In these cases the neutral sterol fraction was extracted asdescribed above from 1 ml of plasma or fecal homogenateand dissolved in 1.00 ml ethyl acetate containing 70 ,ug of 5a-cholestane. This in turn was concentrated in the tip of asmall conical tube during the evaporation of solvent; TMSethers were formed by addition of 5 IAI of TMSreaction mix-ture. As much of this mixture as possible was then injectedinto the GLC column, and the analysis of the 8-sitosterolderivative was accomplished at the maximum instrumentsensitivity consistent with acceptable base line noise. Underour conditions a peak for TMS-B-sitosterol 2 X base linenoise was equivalent to no more than 65 ng per ml of plasmaor per g of fecal homogenate.
Quantitative analysis of TMS ethers of cholesterol andfi-sitosterol was carried out by GLC on 4-ft columns packedwith 1% DC-560 (Applied Science Laboratories) at a col-umn temperature of 240'C with a flame ionization detector,F and M Biomedical Gas Chromatograph, Model 400(F and M Scientific Corp., Avondale, Pa.); these columnshad 2000-3000 theoretical plates for TMS-cholesterol. In-dividual peak areas were measured by electronic integration,Model CRS-100, (Infotronics, Inc., Houston, Tex.). Be-cause of the large excess of cholesterol relative to 8-sito-sterol in all samples, the sensitivity of the GLC detector wasusually increased 32-fold after emergence of the cholesterolpeak. The two sterols were individually quantified by relatingtheir peak areas to that of the internal recovery standard,5a-cholestane; correction factors are not required (17).In tests with standard mixtures of these two sterols, wefound we could reliably measure 65 ng of 8-sitosterol perml of plasma or per g of fecal homogenate, in the presence oflarge excesses of cholesterol.
In the analysis of bile, neutral sterols were removed byextraction with PE, and the unconjugated bile acids wereisolated from the aqueous alcohol phase after alkaline hy-drolysis of the conjugated acids according to our method forisolation of fecal acidic steroids (20). The methyl esters ofthe trihydroxy- and dihydroxycholanic acids were isolatedby TLC on Silica Gel H in the system chloroform: acetone:methanol, 70: 25: 5, and the specific activity of each bileacid class was measured. For quantification of bile acidsby GLC, 6-ft columns containing 1% HiEff 8BP (AppliedScience Laboratories) were used at 2300C; they offeredabout 3000 theoretical plates for TMS chenodeoxycholicmethyl ester, with a separation factor of 1.10 between thisderivative and that of deoxycholic acid.
Free and esterified sterols in plasma. The lipids in 2 mlof plasma were extracted into 38 ml of chloroform: methanol,2: 1. During evaporation of solvent small quantities of ethanolwere added to facilitate the removal of water; the residuewas redissolved in exactly 15.00 ml of ethyl acetate. 10.00ml was taken for TLC on 0.5 mmSilica Gel H plates; thedeveloping system contained petroleum ether: ethyl ether:acetic acid, 85: 15: 0.5, in which free sterols have an Rf of0.30 and esterified sterols 0.90. The free and esterified sterols
were collected separately according to the method of Gold-rick and Hirsch (21), and measurement of sterol content wasmade by GLC after saponification and TMS-ether forma-tion, as described earlier in this paper.
CalculationsCorrections for neutral steroid losses. Corrections for
losses of neutral steroids during intestinal transit and forvariations in fecal flow rates were made with nonlabeleddietary plant sterols as internal standard (10).
Cholesterol absorption. The absorption of dietary cho-lesterol was measured as the difference between dietary in-take and unabsorbed dietary neutral steroids in feces. Thelatter quantity was obtained by the procedure designated asMethod I in this laboratory (22): unabsorbed dietary neu-tral steroids equal total fecal neutral steroids (determinedby chromatographic methods) minus fecal neutral steroidsof endogenous origin (determined by the isotopic balancetechnique after intravenous pulse labeling with radio-active cholesterol).
RESULTSP-Sitosterol in feces of patients fed diets free of
P-sitosterol. If P-sitosterol is synthesized by the body,it should be excreted in the feces continuously; the mag-nitude of this endogenous synthesis will be most clearlydefined when the diet is free of plant sterols. With theseconsiderations in mind we attempted to measure P-sito-sterol in the feces of patients 9-12 who had been fedformula diets free of this sterol for periods longer than4 wk. Diets and feces were analyzed, and no 9-sitosterolor its bacterial transformation products could be detected.
Since 65 ng of P-sitosterol per ml of plasma or per gof fecal homogenate can be reliably measured by ourGLC techniques, we can conclude that excretion ofP-sitosterol in patients 9-12 was less than 10 /g/day(the daily weight of feces of these patients ranged from70 to 150 g). Thus, it appears improbable that thesepatients synthesized more than 10 lyg of P-sitosterol perday.
Measurement of cholesterol and P-sitosterol concentra-tions in plasma and RBC. Table III presents the re-sults obtained for plasma and RBC levels of cholesteroland P-sitosterol in patients lb, 2, and 3 who were feddiets in which the amounts of cholesterol and P-sitosterolapproximated those of the average American diet. Mea-surements of plasma cholesterol and P-sitosterol concen-trations were made twice weekly for 9 wk, as well asmeasurements of levels of RBC sterols. The averageconcentrations of plasma cholesterol ranged from 226to 300 mg/100 ml, and of plasma P-sitosterol from 0.30to 1.02; thus, the ratios of cholesterol to P-sitosterol inplasma ranged from about 300-800 to 1. The relativelysmall standard deviations of the means for plasma con-centrations of cholesterol and P-sitosterol indicate a highdegree of constancy of plasma levels of these two sterolsthroughout each study. RBC concentrations of cho-lesterol varied from 105 to 131 mg/100 ml of packed
f-Sitosterol Metabolism in Man 955
TABLE I I IConcentrations of P-Sitosterol and Cholesterol in Plasma and RBCas Measured by GLC
P-Sitosterol Cholesterol Cholesterol/fl-sitosterol
Patient Diet Plasma RBC Diet Plasma RBC Plasma RBC
mg/day mg/100 ml* mg/100 ml mg/day mg/100 ml* mg/1JO mlpacked cells* packed cells*
lb 242 1.02 40.06 0.40 40.05 402 287 4110 131 4:9 286 328(18) (9) (18) (9)
2 342 0.51 40.02 0.17 565 287 49 105 564 617(18) (2) (18) (2)
3 415 0.30 40.05 0.17 685 226 412 129 786 758(18) (2) (18) (2)
4a 320 0.90 ±0.07 0.29 34 300 410 120 350 413(20) (2) (20) (2)
4b 1909 1.73 ±0.15 0.88 34 254 46 129 150 147(19) (3) (17) (3)
5a 125 0.80 285 448 560
Sb 7166 1.46 315 354 242
6a 293 0.73 33 267 366
6b 6488 1.25 33 198 158
7a 192 trace 452 196
7b 6211 0.46 420 156 339
8a 166 0.42 378 132 314
8b 6484 0.60 380 102 170
* Mean ±SD. Figures in parentheses indicate number of determinations.
cells, and p-sitosterol concentrations from 0.17 to 0.40mg/100 ml of packed cells. The cholesterol to P-sitosterolratios in RBCwere nearly the same as those in plasma,suggesting a free exchange of both sterols betweenplasma and RBC.
In five patients (patients 4-8) who received P-sito-sterol at two levels of intake, concentrations of p-sitosterolin plasma were consistently higher during the periodof the higher intake; but, despite eightfold or greater in-creases in intakes of 8-sitosterol, plasma concentrationsincreased less than twofold. The increase in plasma9-sitosterol during the greater intake was associatedwith a similar increase in RBCf8-sitosterol (patient 4b),and again the ratio of cholesterol to 8-sitosterol in RBCwas the same as that of plasma.
A comparison of the degree of esterification of 8-sito-sterol with that of cholesterol is presented in Table IV.Three patients (lb, 2, and 3) were pulse labeled simul-taneously by the intravenous route with 8-sitosterol-'Hand cholesterolW4C, and the distribution of labeled sterolsin the free and esterified sterol fractions of plasma was
analyzed 30-39 days after administration of isotopes;labeled 9-sitosterol was found to be esterified to the sameextent as labeled cholesterol (60-75% esterified). Inpatient 4, measurements of the free and ester ratios ofthe two radiosterols were begun earlier. Differences inesterification rate were most noticeable during the 1stfew days; in this patient P-sitosterol appeared to beesterified at a slower rate than cholesterol.
The attainment of the isotopic steady state for f-sito-sterol. In another experiment designed to examinewhether 6-sitosterol was synthesized endogenously, pa-tient la received a diet free of 9-sitosterol (40% butteroil) for 40 days in period I. After 1 wk and through-out the remaining 5 wk on the P-sitosterol-free formula,we found less than 65 ng of f-sitosterol per ml of plasmaor per g of feces.
In period 11 (83 days) the patient was given a formuladiet containing 40% of calories as corn oil in which9-sitosterol-22,23-5H had been incorporated during itsmanufacture; each day the patient ingested 620 mg of13-sitosterol of specific activity 74,245 dpm/mg. On the
956 G. Salen, E. H. Ahrens, Jr., and S. M. Grundy
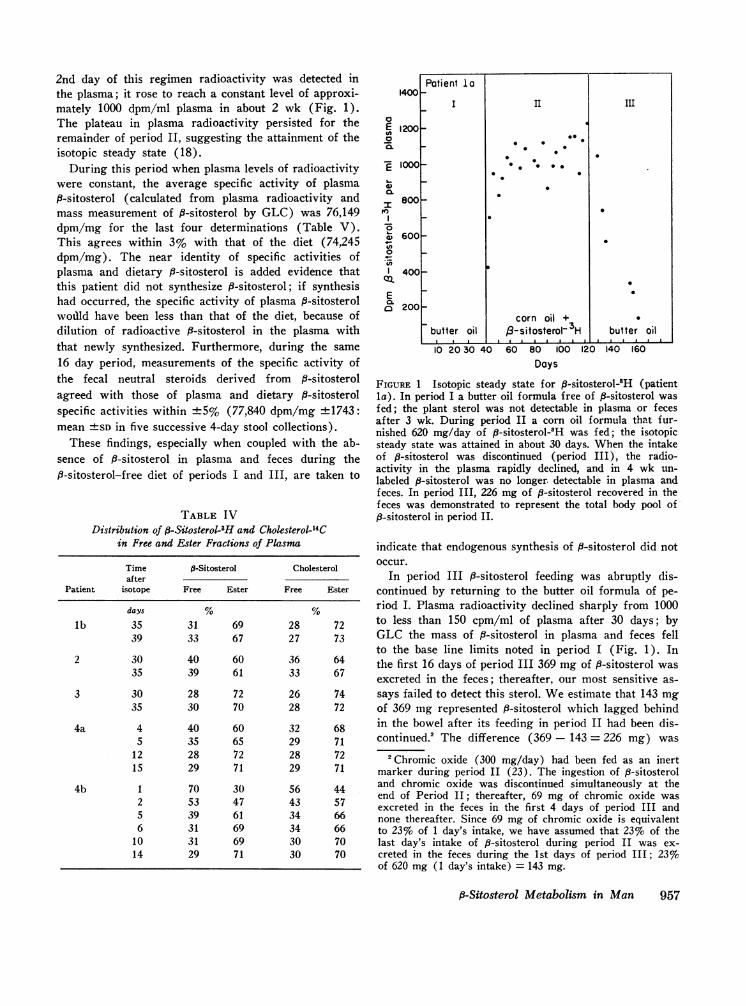
2nd day of this regimen radioactivity was detected inthe plasma; it rose to reach a constant level of approxi-mately 1000 dpm/ml plasma in about 2 wk (Fig. 1).The plateau in plasma radioactivity persisted for theremainder of period II, suggesting the attainment of theisotopic steady state (18).
During this period when plasma levels of radioactivitywere constant, the average specific activity of plasma8-sitosterol (calculated from plasma radioactivity andmass measurement of P-sitosterol by GLC) was 76,149dpm/mg for the last four determinations (Table V).This agrees within 3% with that of the diet (74,245dpm/mg). The near identity of specific activities ofplasma and dietary 8-sitosterol is added evidence thatthis patient did not synthesize 8-sitosterol; if synthesishad occurred, the specific activity of plasma 9-sitosterolwodld have been less than that of the diet, because ofdilution of radioactive f3-sitosterol in the plasma withthat newly synthesized. Furthermore, during the same16 day period, measurements of the specific activity ofthe fecal neutral steroids derived from f-sitosterolagreed with those of plasma and dietary P-sitosterolspecific activities within +5% (77,840 dpm/mg +1743:mean +SD in five successive 4-day stool collections).
These findings, especially when coupled with the ab-sence of P-sitosterol in plasma and feces during theP-sitosterol-free diet of periods I and III, are taken to
TABLE IVDistribution of #-Sitosterol-3H and Cholesterol-14C
in Free and Ester Fractions of Plasma
Time P-Sitosterol Cholesterolafter
Patient isotope Free Ester Free Ester
days % %lb 35 31 69 28 72
39 33 67 27 73
2 30 40 60 36 6435 39 61 33 67
3 30 28 72 26 7435 30 70 28 72
4a 4 40 60 32 685 35 65 29 71
12 28 72 28 7215 29 71 29 71
4b 1 70 30 56 442 53 47 43 575 39 61 34 666 31 69 34 66
10 31 69 30 7014 29 71 30 70
1400
0E 120000.
E 1000t-
I800ovs
w 600O._-0
en1 400
CatEo 200
II
Patient la
I II III
0 0
0 O
_ ~~~corn oil +
3
butter oil /3-sitosterol~ 3H butter oil
.~~~ ~.
10 20 30 40 60 80 100 120Days
140 160
FIGURE 1 Isotopic steady state for 8-sitosterol-3H (patientla). In period I a butter oil formula free of fi-sitosterol wasfed; the plant sterol was not detectable in plasma or fecesafter 3 wk. During period II a corn oil formula that fur-nished 620 mg/day of fi-sitosterol-3H was fed; the isotopicsteady state was attained in about 30 days. When the intakeof p-sitosterol was discontinued (period III), the radio-activity in the plasma rapidly declined, and in 4 wk un-labeled P-sitosterol was no longer detectable in plasma andfeces. In period III, 226 mg of fi-sitosterol recovered in thefeces was demonstrated to represent the total body pool of,8-sitosterol in period II.
indicate that endogenous synthesis of P-sitosterol did notoccur.
In period III i8-sitosterol feeding was abruptly dis-continued by returning to the butter oil formula of pe-riod I. Plasma radioactivity declined sharply from 1000to less than 150 cpm/ml of plasma after 30 days; byGLC the mass of B-sitosterol in plasma and feces fellto the base line limits noted in period I (Fig. 1). Inthe first 16 days of period III 369 mg of 3-sitosterol wasexcreted in the feces; thereafter, our most sensitive as-says failed to detect this sterol. Weestimate that 143 mgof 369 mg represented f-sitosterol which lagged behindin the bowel after its feeding in period II had been dis-continued.2 The difference (369 - 143 = 226 mg) was
2Chromic oxide (300 mg/day) had been fed as an inertmarker during period II (23). The ingestion of 6-sitosteroland chromic oxide was discontinued simultaneously at theend of Period II; thereafter, 69 mg of chromic oxide wasexcreted in the feces in the first 4 days of period III andnone thereafter. Since 69 mg of chromic oxide is equivalentto 23% of 1 day's intake, we have assumed that 23%o of thelast day's intake of #-sitosterol during period II was ex-creted in the feces during the 1st days of period III; 23%of 620 mg (1 day's intake) = 143 mg.
fi-Sitosterol Metabolism in Man 957

TABLE VPlasma ,3-Sitosterol Concentrations Determined by GLCand Isotopic Methods in Patient la,
Fed -Sitosterol-22,23-3H Daily for 83 Days (Period II)
Plasma P-Sitosterol
Difference inTime concentrationafter Concentration Concentration* (GLC vs.
start of measured calculated isotopicPeriod II by GLC Radioactivity Specific activity isotopically calculation)
days mg/100 ml dpm/100 ml dpm/mg mg/100 ml %8 0.91 79,100 86,923 1.06 -17
11 1.11 83,200 74,955 1.12 -115 1.37 93,500 68,248 1.26 +818 1.22 88,900 72,868 1.20 +229 1.38 104,100 75,434 1.40 -132 1.26 98,000 77,778 1.32 -536 1.28 100,500 78,516 1.35 -5
Average oflast4values .... 1.29 40.06 97,875 ±6,486 76,149 ±2,551 1.32 ±0.08
* Plasma ,3-sitosterol concentration calculated by dividing plasma radioactivity (dpm/100 ml)by specific activity of dietary j-sitosterol (74,245 dpm/mg).
taken to represent the total body pool of 8-sitosterolfluxing from the body after removal of P-sitosterol fromthe diet.
The fact that no further p-sitosterol was excreted inthe feces or found in the plasma after 30 days on a8-sitosterol-free diet is offered as evidence that the syn-thesis of f-sitosterol in this man was not repressed bythe 3-sitosterol absorbed in period II.
TABLE VIMeasurement of f3-Sitosterol Turnover by the Isotopic Balance
Method after Pulse Labeling with ,3-Sitosterol-3H
TurnoverNeutral Acidic (neutral
Patient steroids* steroids* + acidic)
mg/day mg/day mg/daylb 7.82 2.25 10.07
(4)
2 7.15 1.45 8.60(4)
3 6.34 2.31 8.65(4)
4a 5.01 0.17 5.18(6)
4b 13.91 0.08 13.98(6)
* mg/day = dpm/day in each fraction of fecal steroids-dpm/mg of plasma fl-sitosterol 2 days earlier. This 2 day
interval represents the average transit time for intestinal con-tents to pass through the intestine (23).
Analysis of 8-sitosterol turnover by the isotopic bal-ance method. The turnover of P-sitosterol in patientslb, 2, 3, 4a, and 4b was measured by the isotopic balancemethod after pulse labeling with P-sitosterol-22,23-2H.This calculation was based on the assumption (proventrue in section 3) that the specific activity of the fecalneutral steroids derived from j-sitosterol is the same asthe specific activity of plasma P-sitosterol. Thus, thedaily excretion (milligrams per day) of neutral andacidic steroids derived from f-sitosterol can be calcu-lated by dividing the total number of disintegrationsper minute of tritium excreted per day in each fecalsteroid fraction by the specific activity (dpm/mg) ofplasma 9-sitosterol.
The values thus obtained are shown in Table VI: 5-14mg/day were excreted as neutral steroids and 0.08-2.31mg/day as acidic steroids. In the metabolic steady statethe sum of the fecal neutral and acidic steroids reflectsthe daily turnover of ,8-sitosterol (since all other ex-cretion routes are trivial in man except in biliaryobstruction, in which the excretion of bile acids viathe kidney may be sizable).
The isotopic balance method also provides a mea-sure of daily bile acid synthesis from P-sitosterol, forin the steady state the daily excretion of fecal acidicsteroids is equivalent to their daily synthesis. Patientslb, 2, and 3 formed 2.25, 1.45, and 2.31 mg of bile acidsfrom P-sitosterol each day, respectively. In contrast, thisconversion was almost immeasurable in patient 4; asshown, this patient also converted very small amountsof cholesterol into bile acids.
958 G. Salen, E. H. Ahrens, Jr., and S. M. Grundy

2,000,000
1,000,000
0'1E
E
.5
0.
500,000
300,000
200,000
100,000
50,000
30,000
20,000
10,000 I7 14 21 28 36 42 49 56 63 70
Days after pulse labeling (IV.) with 3-sitosterol-3H
FIGURE 2 Specific activity-time curve for plasma 6-sito-sterol after pulse labeling intravenously with 8-sitosterol-'H.A two pool model is suggested by the curve-peeling method:the difference values (small crosses) obtained by subtractingthe points on the extrapolated line from the experimentalpoints fit a straight line.
Analysis of sterol turnover and pool sizes by the twopool model. In the four patients pulse labeled by simul-taneous intravenous administration of f8-sitosterol-22,23-'H and cholesterol-4-'4C, specific activities of each of thesterols in the plasma were measured twice weekly.Specific activity-time curves for each of the sterols in allfour patients showed two components: a rapid non-
linear decline followed by a period of more gradual, butlog linear decay (Figs. 2, 3). When these four sets ofcurves were analyzed mathematically by the equationsgiven by Goodman and Noble (12), each curve con-
formed to that described for a two pool model. Ac-cordingly, we have calculated values for turnover andpool sizes for each of the sterols (Tables VII, and VIII).
The curves illustrated in Fig. 3 show that in each case
the turnover of P-sitosterol was more rapid than thatof cholesterol. This comparison is given numerically inTables VII and VIII: the average value for the ti ofthe first exponential for cholesterol was 1.6 times longerthan that of 8-sitosterol; the ti for the second exponen-tial was 3.5 times longer than that of 8-sitosterol. Themore rapid disappearance of labeled 8-sitosterol previ-ously demonstrated by Gould et al. (3) can be ascribedin part to the smaller body pool of P-sitosterol; however,in the next section we shall present evidence thatP-sitosterol actually is excreted preferentially.
In these four patients the plasma P-sitosterol con-
centration varied from 0.3 to 1.73 mg/100 ml, a fivefoldvariation. Yet, the narrow range of variation of thetwo exponentials of radioactive 6-sitosterol indicates
that the kinetics of P-sitosterol turnover were verymuch alike from patient to patient. Indeed, in patient 4who was tested during periods of low and high dietaryintakes of f-sitosterol, the two sets of half-lives ofP-sitosterol were almost identical, even though theplasma concentration of P-sitosterol had doubled.
Estimates of fi-sitosterol absorption. When the val-ues for turnover of f-sitosterol derived by the two poolmodel (Table VII) were compared with the values ob-tained by the isotopic balance method (Table VI), closeagreement was observed. Since all available evidenceleads us to conclude that #-sitosterol was not synthesizedby our patients, it becomes clear that in the metabolicsteady state the daily turnover of P-sitosterol equalsthe amount absorbed each day from dietary sources(Fig. 4). When these four patients ingested 242 to 415mg of P-sitosterol per day, the absorption of P-sitosterolvaried from 6.5 to 12.5 mg/day according to the twopool model, and 5.2 to 14 mg/day according to the iso-topic balance method; the differences are not signifi-cantly different (Student's t test). Patient 4 absorbed5.2-7.0 mg/day out of a daily intake of 320 mg, andand 13.5-14.0 mg when the diet contained 1909 mg/day,a doubling of absolute absorption with a sixfold in-crease in intake.
I,G;E
E
a-)
Q.
0
c-)
10,ooc. Patient lb Patient 2
5000 o 00 * Cholesterol-14C. *. °.0 o 6-sitosterol- H
0' *.-XX-000~~~~~~~~~~0
1Q000 0 0 00° 0
500 - 0
00 00
0 ~~~~~~00 0
0 Patient 3 -Patient 45000 .
0.0* 0~~~~~~~~~0
100 * 0 00 0P 0 0ti
5000 0- 000
1000 ~00 000
0000 14 28 42 56 14 28 42 56
Days after pulse labeling (i.v.)
FIGURE 3 Comparative specific activity-time curves forplasma sterols after pulse labeling intravenously with f8-sitosterol-'H and cholesterol-'4C simultaneously in four pa-tients. In each case the decay of f8-sitosterol was more rapidthan for cholesterol, indicating a more rapid turnover ofPl-sitosterol.
#-Sitosterol Metabolism in Man 959
Patient Ib
'e-\X
-
0*
\.X\
\.t

TABLE VIITurnover of Tritiated 3-Sitosterol
Plasma,6-sitosterol ,-sitosterol t4 of first t4 of second
Patient intake 4SD (a) CA* CB* exponential exponential
mg/100 ml dpm/mg dpm/mg days days days-'
lb 242 1.02 4-0.06 2,000,000 400,000 4.5 19.0 0.154 0,0864(18)
2 342 0.51 ±0.02 5,000,000 800,000 3.8 13.0 0.187 0.0533(18)
3 415 0.30 ±0.05 6,200,000 638,000 3.3 17.5 0.210 0.0396(18)
4a 320 0.90 4=0.07 1,100,000 460,000 3.8 14.5 0.182 0.0479(20)
4b 1909 1.73 40.15 1,480,000 300,000 3.7 15.2 0.182 0.0456(17)
Mean 3.8 40.2 15.8 ±2.4 0.183 ±0.017 0.0545 ±0).1)14(5) (5) (5) (5)
* Constants which represent the intercepts of straight line (Fig. 2) (12).t Constants calculated from slope of straight lines (Fig. 2) (12).§ MAand MB = size of pools A and B.
PRA, amount of new sterol entering Pool A exclusive of recirculated sterol.
TABLE VIIITurnover of Cholesterol-'4C after
Plasmacholesterol
mg/100 ml
287 ±10(18)
287 ±9(18)
226 ±12
(18)
300 ±10
(20)
254 ±6(17)
CA
dpm/mg
9000
6300
6500
1850
5500
CB
dpm/mg
3000
1490
1350
890
4050
Average
tj offirst
expo-nential
days
6
7
5.7
8
5.6
6.2§
t4 ofsecondexpo-
nential
52
62
49.5
99
46
54.5
a $
days-'
0.1194 0.0133
0.0990 0.0111
0.1215 0.0140
0.0866 0.0070
0.1237 0.0150
0.1133 0.0128
* Analysis of the two pool model for cholesterol cannot provide exact size of pool B (MB), nor can precise values for rateconstants kba, k. or kab be determined (Fig. 4). However, we have estimated the lower limiting value of MB (25) byassuming that SB and kB approach zero (no significant synthesis or degradation of cholesterol from pool B).t Cholesterol intake was too low to permit valid measurement of absorption.§ Averaged value obtained from patients lb, 2, 3.
960 G. Salen, E. H. Ahrens, Jr., and S. M. Grundy
Patient
lb
2
3
4a
4b
Cholesterolintake
mg/day
402
506
685
34
34

after Pulse Labeling Intravenously
MA§ MB§
mg mg
125.0 76.0
51.5 20.5
43.8 35.2
70.5 35.7
111.2 61.6
80.4 436.1 45.8 ±-22.5(5) (5)
Total body,6-sitosterolEMA+ MB]
mg
201.0
72.0
79.0
106.2
172.8
126.2 ±-57.7(5)
RatioMA/MB
1.65
2.50
1.24
1.97
1.81
1.83 ±-0.46(5)
PRAII
mg/day
12.5
7.1
6.5
7.0
13.5
9.3 ±-3.4(5)
Dailyturnover(isotopebalancemethod)
mg/day
10.07
8.60
8.65
5.18
13.98
9.3 43.2(5)
0-sito-sterol Recovery of dietary
absorbed 0-sitosterol
% mg/day %recovery
5.2 255 4:86 105(11)
2.1 223 488 65(10)
1.6 262 ±71 63(8)
2.2 271 -456 87(12)
0.6 1398 -62 73(6)
Simultaneous Pulse Labeling*
By sterol balance method
Total endog. Endog. neutral Acidic steroidsPRA fecal steroids steroids +
mg/day mg/day
596 479 275 ±-29 204 ±-96(11) (11)
1001 742 513 ±-90 229 ±111(10) (10)
1267 1421 1049 ±-191 372 4100(8) (8)
396 359 243 ±-21 116 -±42(12) (12)
644 679 569 ±-39 110 -±27(6) (6)
955 -337 881 -487
Cholesterol absorption
mg/day %of intake
204 -41 (50.7)(11)
311 ±-64 (54.3)(10)
307 ±62 (44.8)
(8)
P-Sitosterol Metabolism in Man 961
MA
mg
15,833
24,390
24,203
21,678
21,884
21,475±-4,887
MB
mg
21,050
36,600
37,800
27,800
17,200
31,817±-9,343
IIa Kb
Ka
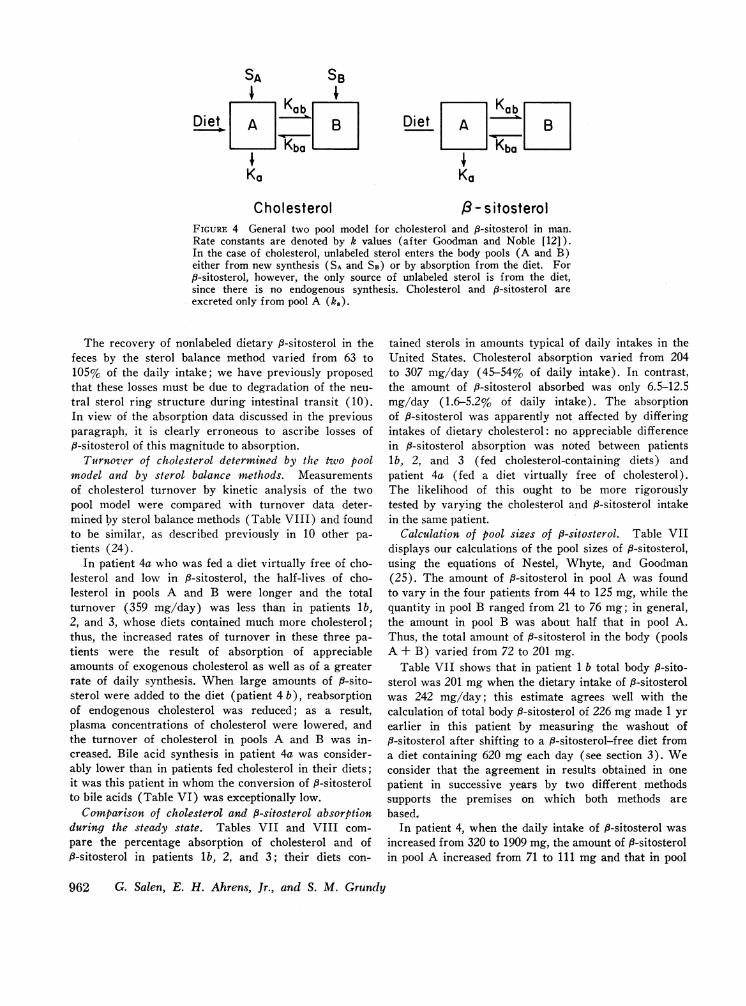
Cholesterol
KabDiet A B
I Kb, LII
Ka
P - s itosterolFIGURE 4 General two pool model for cholesterol and j8-sitosterol in man.Rate constants are denoted by k values (after Goodman and Noble (12]).In the case of cholesterol, unlabeled sterol enters the body pools (A and B)either from new synthesis (SA and SB) or by absorption from the diet. For,8-sitosterol, however, the only source of unlabeled sterol is from the diet,since there is no endogenous synthesis. Cholesterol and j8-sitosterol areexcreted only from pool A (ka).
The recovery of nonlabeled dietary 8-sitosterol in thefeces by the sterol balance method varied from 63 to105% of the daily intake; we have previously proposedthat these losses must be due to degradation of the neu-tral sterol ring structure during intestinal transit (10).In view of the absorption data discussed in the previousparagraph, it is clearly erroneous to ascribe losses ofi3-sitosterol of this magnitude to absorption.
Turnover of cholesterol determined by the two poolmodel and by sterol balance methods. Measurementsof cholesterol turnover by kinetic analysis of the twopool model were compared with turnover data deter-mined by sterol balance methods (Table VIII) and foundto be similar, as described previously in 10 other pa-tients (24).
In patient 4a who was fed a diet virtually free of cho-lesterol and low in P-sitosterol, the half-lives of cho-lesterol in pools A and B were longer and the totalturnover (359 mg/day) was less than in patients lb,2, and 3, whose diets contained much more cholesterol;thus, the increased rates of turnover in these three pa-tients were the result of absorption of appreciableamounts of exogenous cholesterol as well as of a greaterrate of daily synthesis. When large amounts of j8-sito-sterol were added to the diet (patient 4 b), reabsorptionof endogenous cholesterol was reduced; as a result,plasma concentrations of cholesterol were lowered, andthe turnover of cholesterol in pools A and B was in-creased. Bile acid synthesis in patient 4a was consider-ably lower than in patients fed cholesterol in their diets;it was this patient in whom the conversion of P-sitosterolto bile acids (Table VI) was exceptionally low.
Comparison of cholesterol and P-sitosterol absorptionduring the steady state. Tables VII and VIII com-pare the percentage absorption of cholesterol and ofP-sitosterol in patients lb, 2, and 3; their diets con-
tained sterols in amounts typical of daily intakes in theUnited States. Cholesterol absorption varied from 204to 307 mg/day (45-54% of daily intake). In contrast,the amount of P-sitosterol absorbed was only 6.5-12.5mg/day (1.6-5.2% of daily intake). The absorptionof f-sitosterol was apparently not affected by differingintakes of dietary cholesterol: no appreciable differencein 13-sitosterol absorption was noted between patientsib, 2, and 3 (fed cholesterol-containing diets) andpatient 4a (fed a diet virtually free of cholesterol).The likelihood of this ought to be more rigorouslytested by varying the cholesterol and ,8-sitosterol intakein the same patient.
Calculation of pool sizes of 8-sitosterol. Table VIIdisplays our calculations of the pool sizes of 3-sitosterol,using the equations of Nestel, Whyte, and Goodman(25). The amount of 8-sitosterol in pool A was foundto vary in the four patients from 44 to 125 mg, while thequantity in pool B ranged from 21 to 76 mg; in general,the amount in pool B was about half that in pool A.Thus, the total amount of P-sitosterol in the body (poolsA + B) varied from 72 to 201 mg.
Table VII shows that in patient 1 b total body #-sito-sterol was 201 mg when the dietary intake of 3-sitosterolwas 242 mg/day; this estimate agrees well with thecalculation of total body 8-sitosterol of 226 mgmade 1 yrearlier in this patient by measuring the washout of3-sitosterol after shifting to a #-sitosterol-free diet from
a diet containing 620 mg each day (see section 3). Weconsider that the agreement in results obtained in onepatient in successive years by two different, methodssupports the premises on which both methods arebased.
In patient 4, when the daily intake of 8-sitosterol wasincreased from 320 to 1909 mg, the amount of f-sitosterolin pool A increased from 71 to 111 mg and that in pool
962 G. Salen, E. H. Ahrens, Jr., and S. M. Grundy
SA SB

B rose from 36 to 62 mg. Thus, following a sixfoldincrease in dietary intake, the size of pool B was ex-panded to a greater extent than pool A.
Consequently, the amount of 8-sitosterol retained inthe body seems to be roughly proportional to theamount absorbed per day. Although our data are toofew to permit rigorous analysis, a plot of these datacan be extrapolated through the zero intercept; eachmilligram absorbed per day is equivalent to about 15 mgof total body 8-sitosterol (Fig. 5). We take this to beadditional evidence that endogenous synthesis of 8-sito-sterol did not occur in these patients.
Equilibration of labeled sterols between plasma, RBC,and bile after pulse labeling. At various intervals aftersimultaneous pulse labeling with 8-sitosterol-3H and cho-lesterol-24C, samples of duodenal contents rich in bilewere obtained in patients lb, 2, and 3 (in some casesimmediately following the injection of cholecystokininintravenously); blood was drawn at the same time.Neutral sterols were isolated from plasma, RBC, andbile, and the specific activities of 3H- and "4C-labeledsterols were determined.
As shown in Table IX, the specific activities of thetwo neutral sterols were very similar in the plasma,RBC, and bile. While both sets of specific activities de-cayed with fime (Fig. 3), the isotope ratio of P-sitosterolto cholesterol decreased significantly in all cases, indi-cating that the fractional rate of turnover of 8-sitosterolwas more rapid than that of cholesterol. Moreover, theisotope ratios of the two neutral sterols in bile were
15 -
o 10
0
5/
E
consistently higher than those in the plasma. Thisclearly indicates that the liver can differentiate betweenP-sitosterol and cholesterol and that P-sitosterol is pref-erentially secreted into the bile from sterol pools.
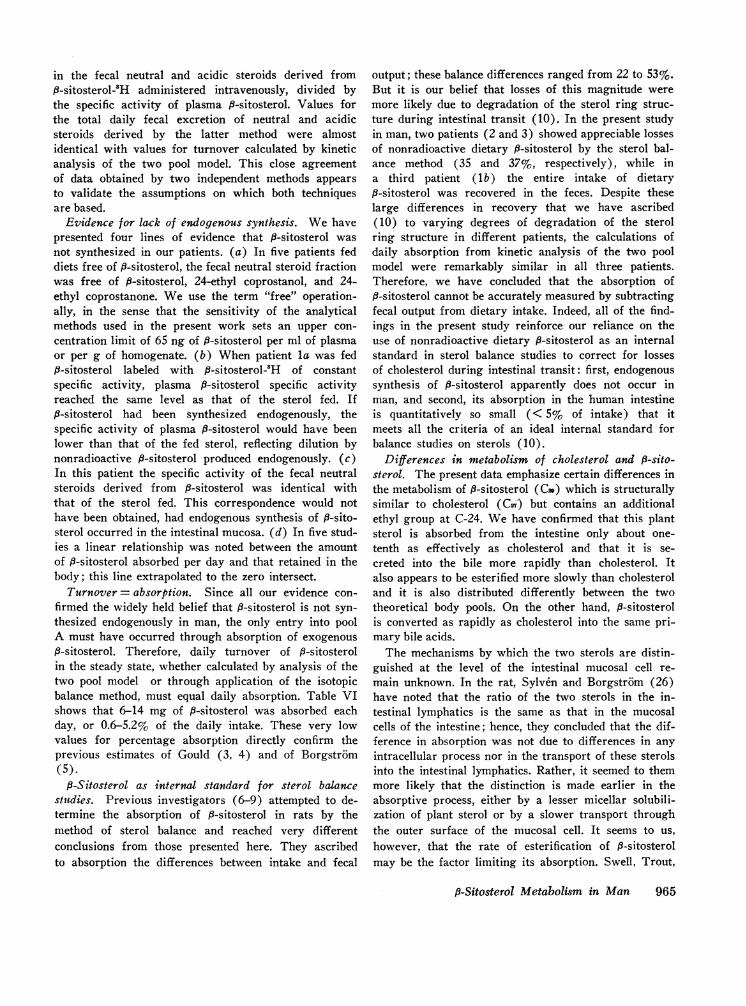
The incorporation of p-sitosterol-H and cholesterol-'4Cinto bile acids. Table X compares the specific activityof the tri- and dihydroxycholanic acids in bile with thatof total neutral sterols (cholesterol + P-sitosterol) inplasma in three patients after simultaneous pulse labelingwith O-sitosterol-3H and cholesterol-"C by the intrave-nous route. It is seen that the biliary bile acids werelabeled both with 'H and "C, indicating the simultaneousconversion of both neutral sterols into the primary bileacids. Moreover, the radioactivities per milligram ofbile acids for both 'H and `C were approximately thesame as those in total plasma neutral sterols, suggestingthat there was little if any enzymatic discriminationbetween the two sterols in this conversion. Comparingthese results with those of section 5, it is apparent that,while P-sitosterol is somehow selected from cholesterolin the liver cell in the process of neutral sterol excretion,the enzymatic conversion of the two neutral sterolsto the two primary bile acids is nonselective.
A separate communication will describe the formationof cholic-3H, chenodeoxycholic-3H, and deoxycholic-'Hacids after pulse labeling with P-sitosterol-22,23-'H;their isolation by countercurrent distribution and pre-parative TLC; and their identification with pure stan-dards by TLC, GLC, melting points, and elementalanalysis.
.
0
50 100 150 200Total body 13-sitosterol in pools A and B (mg)
FIGURE 5 Relationship between total body 8-sitosterol (pools A + B)and the amount of it absorbed each day. Extrapolation of the linethrough zero can occur only if 8-sitosterol is not synthesized endoge-nously.
I8-Sitosterol Metabolism in Man 963
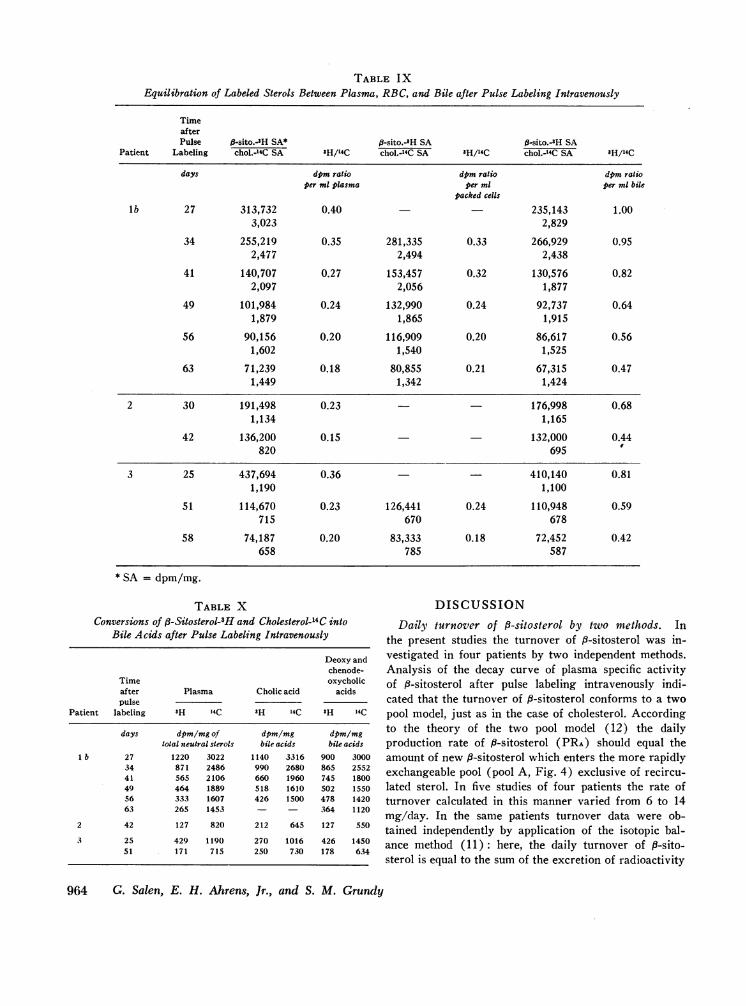
TABLE IXEquilibration of Labeled Sterols Between Plasma, RBC, and Bile after Pulse Labeling Intravenously
TimeafterPulse 3-sito.-sH SA* #-sito.-'H SA ft-sito.-3H SA
Patient Labeling chol.-4C SA 3H/14C chol.-14C SA 'H/14C chol.-'4C SA 'H/14C
days dpm ratio dpm ratio dpm ratioper ml plasma per ml per ml bile
packed cells
lb 27 313,732 0.40 235,143 1.003,023 2,829
34 255,219 0.35 281,335 0.33 266,929 0.952,477 2,494 2,438
41 140,707 0.27 153,457 0.32 130,576 0.822,097 2,056 1,877
49 101,984 0.24 132,990 0.24 92,737 0.641,879 1,865 1,915
56 90,156 0.20 116,909 0.20 86,617 0.561,602 1,540 1,525
63 71,239 0.18 80,855 0.21 67,315 0.471,449 1,342 1,424
2 30 191,498 0.23 - - 176,998 0.681,134 1,165
42 136,200 0.15 132,000 0.44820 695
3 25 437,694 0.36 410,140 0.811,190 1,100
51 114,670 0.23 126,441 0.24 110,948 0.59715 670 678
58 74,187 0.20 83,333 0.18 72,452 0.42658 785 587
* SA = dpm/mg.
TABLE XConversions of 6-Sitosterol-3H and Cholesterol-14 C into
Bile Acids after Pulse Labeling Intravenously
Deoxy andchenode-
Time oxycholicafter Plasma Cholic acid acidspulse
Patient labeling 'H 14C 3H 14C 8H 14C
days dpm/mg of dpm/mg dpm/mgtotal neutral sterols bile acids bile acids
l b 27 1220 3022 1140 3316 900 300034 871 2486 990 2680 865 255241 565 2106 660 1960 745 180049 464 1889 518 1610 502 155056 333 1607 426 1500 478 142063 265 1453 - - 364 1120
2 42 127 820 212 645 127 550
3 25 429 1190 270 1016 426 145051 171 715 250 730 178 634
DISCUSSION
Daily turnover of 8-sitosterol by two methods. Inthe present studies the turnover of 8-sitosterol was in-vestigated in four patients by two independent methods.Analysis of the decay curve of plasma specific activityof 9-sitosterol after pulse labeling intravenously indi-cated that the turnover of f-sitosterol conforms to a twopool model, just as in the case of cholesterol. Accordingto the theory of the two pool model (12) the dailyproduction rate of 8-sitosterol (PRA) should equal theamount of new 8-sitosterol which enters the more rapidlyexchangeable pool (pool A, Fig. 4) exclusive of recircu-lated sterol. In five studies of four patients the rate ofturnover calculated in this manner varied from 6 to 14mg/day. In the same patients turnover data were ob-tained independently by application of the isotopic bal-ance method (11): here, the daily turnover of P-sito-sterol is equal to the sum of the excretion of radioactivity
964 G. Salen, E. H. Ahrens, Jr., and S. M. Grundy
in the fecal neutral and acidic steroids derived from9-sitosterol-8H administered intravenously, divided bythe specific activity of plasma 8-sitosterol. Values forthe total daily fecal excretion of neutral and acidicsteroids derived by the latter method were almostidentical with values for turnover calculated by kineticanalysis of the two pool model. This close agreementof data obtained by two independent methods appearsto validate the assumptions on which both techniquesare based.
Evidence for lack of endogenous synthesis. Wehavepresented four lines of evidence that f-sitosterol wasnot synthesized in our patients. (a) In five patients feddiets free of f-sitosterol, the fecal neutral steroid fractionwas free of fi-sitosterol, 24-ethyl coprostanol, and 24-ethyl coprostanone. We use the term "free" operation-ally, in the sense that the sensitivity of the analyticalmethods used in the present work sets an upper con-centration limit of 65 ng of P-sitosterol per ml of plasmaor per g of homogenate. (b) When patient la was fedP-sitosterol labeled with P-sitosterol-'H of constantspecific activity, plasma P-sitosterol specific activityreached the same level as that of the sterol fed. If9-sitosterol had been synthesized endogenously, thespecific activity of plasma 8-sitosterol would have beenlower than that of the fed sterol, reflecting dilution bynonradioactive P-sitosterol produced endogenously. (c)In this patient the specific activity of the fecal neutralsteroids derived from f-sitosterol was identical withthat of the sterol fed. This correspondence would nothave been obtained, had endogenous synthesis of 8-sito-sterol occurred in the intestinal mucosa. (d) In five stud-ies a linear relationship was noted between the amountof j9-sitosterol absorbed per day and that retained in thebody; this line extrapolated to the zero intersect.
Turnover = absorption. Since all our evidence con-firmed the widely held belief that 8-sitosterol is not syn-thesized endogenously in man, the only entry into poolA must have occurred through absorption of exogenousj3-sitosterol. Therefore, daily turnover of fi-sitosterolin the steady state, whether calculated by analysis of thetwo pool model or through application of the isotopicbalance method, must equal daily absorption. Table VIshows that 6-14 mg of p-sitosterol was absorbed eachday, or 0.6-5.2% of the daily intake. These very lowvalues for percentage absorption directly confirm theprevious estimates of Gould (3, 4) and of Borgstrom(5).
i8-Sitosterol as internal standard for sterol balancestudies. Previous investigators (6-9) attempted to de-termine the absorption of 8-sitosterol in rats by themethod of sterol balance and reached very differentconclusions from those presented here. They ascribedto absorption the differences between intake and fecal
output; these balance differences ranged from 22 to 53%.But it is our belief that losses of this magnitude weremore likely due to degradation of the sterol ring struc-ture during intestinal transit (10). In the present studyin man, two patients (2 and 3) showed appreciable lossesof nonradioactive dietary fi-sitosterol by the sterol bal-ance method (35 and 37%, respectively), while ina third patient (lb) the entire intake of dietary9-sitosterol was recovered in the feces. Despite theselarge differences in recovery that we have ascribed(10) to varying degrees of degradation of the sterolring structure in different patients, the calculations ofdaily absorption from kinetic analysis of the two poolmodel were remarkably similar in all three patients.Therefore, we have concluded that the absorption ofP-sitosterol cannot be accurately measured by subtractingfecal output from dietary intake. Indeed, all of the find-ings in the present study reinforce our reliance on theuse of nonradioactive dietary P-sitosterol as an internalstandard in sterol balance studies to correct for lossesof cholesterol during intestinal transit: first, endogenoussynthesis of P-sitosterol apparently does not occur inman, and second, its absorption in the human intestineis quantitatively so small (< 5% of intake) that itmeets all the criteria of an ideal internal standard forbalance studies on sterols (10).
Differences in metabolism of cholesterol and f8-sito-sterol. The present data emphasize certain differences inthe metabolism of 8-sitosterol (Cm) which is structurallysimilar to cholesterol (CG7) but contains an additionalethyl group at C-24. Wehave confirmed that this plantsterol is absorbed from the intestine only about one-tenth as effectively as cholesterol and that it is se-creted into the bile more rapidly than cholesterol. Italso appears to be esterified more slowly than cholesteroland it is also distributed differently between the twotheoretical body pools. On the other hand, ,3-sitosterolis converted as rapidly as cholesterol into the same pri-mary bile acids.
The mechanisms by which the two sterols are distin-guished at the level of the intestinal mucosal cell re-main unknown. In the rat, Sylven and Borgstr6m (26)have noted that the ratio of the two sterols in the in-testinal lymphatics is the same as that in the mucosalcells of the intestine; hence, they concluded that the dif-ference in absorption was not due to differences in anyintracellular process nor in the transport of these sterolsinto the intestinal lymphatics. Rather, it seemed to themmore likely that the distinction is made earlier in theabsorptive process, either by a lesser micellar solubili-zation of plant sterol or by a slower transport throughthe outer surface of the mucosal cell. It seems to us,however, that the rate of esterification of 9-sitosterolmay be the factor limiting its absorption. Swell, Trout,
,8-Sitosterol Metabolism in Man 965

Field, and Treadwell (9) found that, while #-sitosterol,like cholesterol, is taken up by the intestinal wall, cho-lesterol is largely esterified before incorporation intochylomicrons. P-Sitosterol, on the other hand, is ap-parently not esterified in the intestinal wall: Kuksisand Huang (27), studying dogs with thoracic ductfistulas, observed that virtually all of the plant sterolsin chyle are unesterified, whereas most of the cholesterolin chyle is esterified.
Two factors appear to contribute to the more rapidfractional turnover rate of fi-sitosterol as compared withthat of cholesterol. First, as discussed above, in passagethrough the small intestine at least 10 times more cho-lesterol than j3-sitosterol is returned into body poolsthrough reabsorption. Secondly, it seems clear from theresults of the present study that mechanisms exist in theliver whereby i3-sitosterol is preferentially selected formore rapid secretion into the bile as neutral sterol. Themechanisms by which the liver cell distinguishes betweenP-sitosterol and cholesterol are just as unclear as in thecase of the intestinal cell. Again, we can visualize thepossibility that a retardation in esterification of #-sito-sterol, compared to that of cholesterol might make thefree sterol more available for secretion into bile, butother possibilities should be considered. The intracellularroutes of travel of the two sterols through the liver cellfrom plasma to biliary canaliculus are still not known;nor do we know whether the sterols in the endoplasmicreticulum are in equilibrium with those in the mito-chondria or cell sap, nor how inconstant the sterol con-tents of the different membranous structures may be.At any rate, we have shown for the first time in anyspecies that P-sitosterol is converted into the same pri-mary bile acids as cholesterol, i.e., cholic acid and cheno-deoxycholic acid. The similarities in isotope ratios inTable X suggest that the enzymes responsible for thisconversion fail to differentiate one sterol from the other.At what stage the ethyl group at C-24 is removed re-mains to be determined. Several species of phytophagousinsects are known to dealkylate C28 and C.% sterols toprovide cholesterol during their larval growth (28).Therefore, it would be of considerable importance toascertain whether the 3-sitosterol incorporated into bileacids was initially dealkylated to cholesterol, or whetherdealkylation occurred simultaneously with side chainoxidation during bile acid synthesis.
Striking differences in distribution of the two sterolsin the two theoretical pools of readily exchangeablesterols (pools A and B) have been demonstrated inthis study. According to theory (12, 24) the two poolmodel permits the calculation of the sizes of pools A andB. For cholesterol the size of pool A can be calculatedfrom data obtained from specific activity-time curves ofplasma cholesterol; but the size of pool B can be deter-
mined only if entry and removal of cholesterol fromthis pool are negligible (except for isotopic exchangewith pool A). If one makes the latter assumption, thedata of Goodman and associates indicate that in sixadult normocholesterolemic men and women pool Avaried from 15 to 27 g; pool B from 27 to 45 g. Ourown data (similarly derived) in 21 adult patients withhyperlipoproteinemic states showed that pool A variedfrom 16 to 32' g, pool B from 21 to 49 g; the lack ofdifference between normo- and hypercholesterolemicpatients is astonishing, if true. In contrast, the presentstudy shows that, for P-sitosterol pool A was invariablythe larger pool, ranging in hypercholesterolemic adultsfrom 52 to 125 mg, with only 21 to 76 mg in pool B.Thus, in all adults tested, cholesterol is more richly dis-tributed in pool B than in pool A; the converse holds for,-sitosterol. Thus, the total amount of readily exchange-able cholesterol is vastly greater than for 3-sitosterol,and furthermore the distribution of the two sterols in thebody is different. Why this difference exists remainsto be shown, but it seems to rule out the possibility ofusing the distribution of the plant sterol as a guide tocholesterol distribution in specific tissue pools.
ACKNOWLEDGMENTSWe are grateful to Mrs. Eleanor Mathusek for cholesteroldeterminations, to Mr. Albert Angevin for the preparationof stool homogenates, to Miss Esperanza Piezas and Mr.John Crouse for GLC analyses, and especially to MissNorma Glennon for excellent technical assistance.
This study was supported in part by U. S. Public HealthService Grant HE-06222 from the National Heart Institute,and by U. S. Public Health Service Grant FR-00102 fromthe General Clinical Research Centers Branch of the Divi-sion of Research Facilities and Resources.
REFERENCES1. Schonheimer, R. 1929. Uber die Bedeutung der Pflanzen-
sterine fur den tierischen Organismus. Hoppe-Seyler'sZ. Physiol. Chem. 180: 1.
2. Schonheimer, R. 1931. New contributions in sterolmetabolism. Science. 74: 579.
3. Gould, R. G., R. J. Jones, G. V. LeRoy, R. W. Wissler,and C. B. Taylor. 1969. Absorbability of p-sitosterol inhumans. Metabolism. 18: 652.
4. Gould, R. G. 1955. Absorbability of beta-sitosterol.Trans. N. Y. Acad. Sci. 18: 129.
5. Borgstr6m, B. 1968. Quantitative aspects of the in-testinal absorption and metabolism of cholesterol and,6-sitosterol in the rat. J. Lipid Res. 9: 473.
6. Ivy, A. C., T. Lin, and E. Karvinen. 1955. Absorptionof dihydrocholesterol and soya sterols by the rat's in-testine. Amer. J. Physiol. 183: 79.
7. Roth, M. and P. Farvarger. 1955. La digestibilite desgraisses en presence de certains sterols. Helv. Physiol.Pharmacol. Acta. 13: 249.
8. Swell, L., T. A. Boiter, H. Field, Jr., and C. R. Tread-well. 1956. The absorption of plant sterols and their effecton serum and liver sterol levels. J. Nutr. 58: 385.
966 G. Salen, E. H. Ahrens, Jr., and S. M. Grundy
9. Swell, L., E. C. Trout, H. Field, Jr., and C. R. Tread-well. 1959. Absorption of 'H-,f-sitosterol in the lymphfistula rat. Proc. Soc. Exp. Biol. Med. 100: 140.
10. Grundy, S. M., E. H. Ahrens, Jr., and G. Salen. 1968.Dietary P-sitosterol as an internal standard to correctfor cholesterol losses in sterol balance studies. J. LipidRes. 9: 374.
11. Hellman, L., R. S. Rosenfeld, W. Insull, Jr., and E. H.Ahrens, Jr. 1957. Intestinal excretion of cholesterol: amechanism for regulation of plasma levels. J. Clin. In-vest. 36: 898. (Abstr.)
12. Goodman, DeW. S., and R. P. Noble. 1968. Turnover ofplasma cholesterol in man. J. Clin. Invest. 47: 231.
13. Gordan, G. S., M. E. Fitzpatrick, and W. P. Lubich.1967. Identification of osteolytic sterols on human breastcancer. Trans. Ass. Amer. Physicians (Philadelphia).80: 183.
14. Metropolitan Life Insurance Company Statistical Bul-letin 40. 1959. November, December.
15. Fredrickson, D. S., R. I. Levy, and R. S. Lees. 1967.Fat transport in lipoproteins: an integrated approach tomechanisms and disorders. N. Engl. J. Med. 276: 34, 94,148, 215, 273.
16. Ahrens, E. H. Jr., V. P. Dole, and D. H. Blankenhorn.1954. The use of orally-fed liquid formulas in metabolicstudies. Amer. J. Clin. Nutr. 2: 236.
17. Miettinen, T. A., E. H. Ahrens, Jr., and S. M. Grundy.1965. Quantitative isolation and gas-liquid chromato-graphic analysis of total dietary and fecal neutral steroids.J. Lipid Res. 6: 411.
18. Morris, M. D., I. L. Chaikoff, J. M. Felts, S. Abraham,and N. 0. Fansah. 1957. The origin of serum cholesterol
in the rat: diet versus synthesis. J. Biol. Chem. 224:1039.
19. Steele, J. A., and E. Mosettig. 1963. The solvolysis ofstigmasteryl tosylate. J. Org. Chem. 28: 571.
20. Grundy, S. M., E. H. Ahrens, Jr., and T. A. Miettinen.1965. Quantitative isolation and gas-liquid chromato-graphic analysis of total fecal bile acids. J. Lipid Res. 6:397.
21. Goldrick, B., and J. Hirsch. 1963. A technique for quan-titative recovery of lipids from chromatoplates. J. LipidRes. 4: 482.
22. Grundy, S. M., and E. H. Ahrens, Jr. 1969. Measure-ments of cholesterol turnover, synthesis, and absorptionin man, carried out by isotope kinetic and sterol balancemethods. J. Lipid Res. 10: 91.
23. Davignon, J., W. J. Simmonds, and E. H. Ahrens, Jr.1968. Usefulness of chromic oxide as an internal standardfor balance studies in formula-fed patients and for as-sessment of colonic function. J. Clin. Invest. 47: 127.
24. Grundy, S. M., E. H. Ahrens, Jr., and J. Davignon. 1969.The interaction of cholesterol absorption and cholesterolsynthesis in man. J. Lipid Res. 10: 304.
25. Nestel, P. J., H. M. Whyte, and DeW. S. Goodman. 1969.Distribution and turnover of cholesterol in humans.J. Clin. Invest. 48: 982.
26. Sylven, C., and B. Borgstrom. 1969. Absorption andlymphatic transport of cholesterol and sitosterol in therat. J. Lipid Res. 10: 179.
27. Kuksis, A., and T. C. Huang. 1962. Differential absorp-tion of plant sterols in the dog. Can. J. Piochem. 40:1493.
28. Clayton, R. B. 1964. The utilization of sterols by insects.J. Lipid Res. 5: 3.
jf-Sitosterol Metabolism in Man 967