methane emissions - oxford institute for energy studies · 3 executive summary methane emissions...
TRANSCRIPT
July 2017
OIES PAPER: NG 122
Methane Emissions: from blind spot to spotlight
Chris Le Fevre
Senior Visiting Research Fellow, OIES
1
The contents of this paper are the author’s sole responsibility. They do not
necessarily represent the views of the Oxford Institute for Energy Studies or any of
its members.
Copyright © 2017
Oxford Institute for Energy Studies
(Registered Charity, No. 286084)
This publication may be reproduced in part for educational or non-profit purposes without special
permission from the copyright holder, provided acknowledgment of the source is made. No use of this
publication may be made for resale or for any other commercial purpose whatsoever without prior
permission in writing from the Oxford Institute for Energy Studies.
ISBN 978-1-78467-088-7

2
Acknowledgements
I would like to record my thanks for the help I have been given by many individuals in writing this
paper. I received much valuable input from experts in methane emissions working for sponsors of the
Oxford Institute for Energy Studies Gas Programme and academic institutions and particular thanks
go to Paul Balcombe at the Sustainable Gas Institute. I am also most grateful to colleagues at the
OIES who have provided many valuable insights and suggestions, especially Jonathan Stern, Howard
Rogers and Jim Henderson. I would also like to thank Liz Henderson for editing the final document
and to Kate Teasdale for formatting and layout. Any remaining errors are fully my own.
3
Executive Summary
Methane emissions can be defined as all releases of the gas – intentional or otherwise – that occur
across the entire gas supply chain from exploration and production to final consumption. Releases of
methane have long been seen by the industry as an unfortunate, if necessary, part of doing business.
For safety reasons, unplanned gas escapes were avoided where possible, though a release to
atmosphere was often the chosen option during maintenance and when dealing with minor
distribution leaks. This mind-set was also evident in venting and flaring associated gas during oil
production and the use of pressurised gas to operate valves and other equipment.
The economic cost of this activity was recognised but expenditure to reduce emissions often
outweighed any benefit. Furthermore, many regulatory regimes included allowances for unaccounted
for gas so operators could pass on the cost of emissions to consumers. The environmental impact of
gas emissions was at best a minor consideration and in most cases an industry blind spot.
In wider environmental circles the impact of methane emissions – which come from a wide range of
natural and anthropogenic sources – has received growing attention. Methane is a potent
greenhouse gas (GHG) and whilst it degrades rapidly (it is sometimes referred to as a short-lived
climate pollutant), the increased focus on shorter term environmental targets has raised its profile.
Global ambient methane levels have been rising and the coinciding growth in global gas production –
and the rise of unconventional gas and hydraulic fracturing - led some to conclude that methane
emissions from the natural gas industry were primarily responsible. This hypothesis received further
support in 2016 when the US EPA published a major upgrade (subsequently partially reversed) in
emission estimates from natural gas supply.
There has been a great deal of technical and scientific analysis of the level and impact of methane
emissions. This, however, has not always led to greater consensus. At a general level, our
understanding of the chemistry of the atmosphere, how this changes over time and the impact on
temperature and climate is still evolving.
More specifically, whilst there is no shortage of academic studies of emissions from the oil and gas
industry, these have used a wide range of estimation methods, data, and system definitions and
boundaries. These approaches have resulted in a big variation in estimates of the magnitude of
natural gas emissions. This state of affairs has been exacerbated by the lack of available or
consistent data from the gas companies themselves. The gas industry’s attempts to improve and
standardise monitoring and reporting methane emissions have often resulted in arcane debates over
data and impact. As a result, the hitherto, largely unchallenged, environmental credentials of natural
gas as the “greenest” fossil fuel have been questioned by environmental groups and some
government agencies. Even objective observers have suspected the worst, perhaps best exemplified
by the Economist article of July 2016, `A dirty little secret’.
These issues were highlighted in Jonathan Stern’s paper “The Future of Gas in Decarbonising
European Energy Markets: the need for a new approach” (OIES, 2017) which flagged the risk that
emissions of unburned methane in the supply chain could undermine the environmental case for gas.
This paper examines the issues in more detail – primarily regarding the gas industry - but also
recognising the wider context.
The key messages from the paper are:
Whilst there are many data gaps and inconsistencies, most databases and studies support the view that the increase in global atmospheric methane in the last ten years was not a result of the increase in global gas production over this period. Many countries have reported a reduction in both the absolute and relative level of emissions from the natural gas sector. Furthermore, whilst the full chain effect of methane emissions reduces the environmental case for gas, it is still preferable to coal as a fuel for power generation.
4
On the other hand, the lack of consistent and transparent data and a failure from industry players to articulate a coherent message on methane emissions has resulted in a data vacuum that has been filled by less rigorous, and in some cases self-serving, alternative conclusions. The gas industry has been increasingly active in countering this trend, both through greater efforts to reduce emission levels and in improved accuracy and transparency of data. The environmental case for gas is, however, in many policy maker’s minds still likely to remain at best unclear.
Several studies suggest that a global average emissions rate of between 1.5 - 2 per cent of sales gas across the entire supply chain is broadly correct, though some of this may be the result of oil production whilst a few estimates put the numbers much higher. Further action is required to confirm these numbers, to provide a consistent and proven database across the entire gas supply chain and for this to be reflected in government as well as industry statistics. Gas producing countries in particular, need to move quickly to ensure they are reporting updated and reliable numbers.
Regulatory pressure on emissions control is likely to increase and companies should be prepared to meet greater reporting requirements and financial measures. At an operational level creating a “zero-emissions” mind-set remains a worthwhile objective.
The gas industry is still on a journey though the issue of methane emissions is clearly receiving much
greater attention than hitherto. If the industry can build on the progress to date and deliver a clearer
picture on the level of emissions and actions to address them, the arguments for gas displacing coal
in power generation and oil products in transport become much stronger and the role for gas in a
decarbonising economy more secure.

5
Contents
Acknowledgements .............................................................................................................................. 2
Executive Summary .............................................................................................................................. 3
1. Introduction ....................................................................................................................................... 6
2. Methane emissions and why they are important ........................................................................... 6
3. Measuring methane emissions ...................................................................................................... 10
4. The impact of methane emissions ................................................................................................ 19
5. Methane leakage and the decarbonisation agenda ..................................................................... 20
6. Methane emissions from a company perspective – work to date ............................................. 24
7. Methane emissions from a regulatory perspective – sticks and carrots .................................. 26
8. Conclusions ..................................................................................................................................... 27
US Country Profile .......................................................................................................................... 29 UK Country Profile .......................................................................................................................... 33
Glossary ............................................................................................................................................... 35
References ........................................................................................................................................... 37
Figures
Figure 1: Global methane levels ............................................................................................................. 7
Figure 2: Global methane budget ........................................................................................................... 7
Figure 3: Global methane emissions by source 2003-2012 (bottom-up calculation).............................. 8
Figure 4: UK Anthropogenic methane emissions by source (%), 2015 .................................................. 8
Figure 5: USA Anthropogenic methane emissions by source (%), 2015 ................................................ 9
Figure 6: Estimated median and 95th percentile GHG Emissions for the natural gas supply chain ..... 20
Figure 7: Lifecycle GHG Emissions for selected supply chains, GWP=100 ......................................... 22
Figure 8: Contribution of different GHG emissions to total life cycle assessment, GWP=100 ............. 23
Tables Table 1: Estimated methane emissions by source and method (million tonnes of CH4 / yr) ................ 12
Table 2: Methane emissions from the oil and gas sector in major producing countries (where reported) .............................................................................................................................................................. 13
Table 3: Methane emissions from the energy sector for selected Annex 1 countries in 2015 (Thousand tonnes of methane) ............................................................................................................. 14
Table 4: Methane emissions from the natural gas sector in selected Annex 1 countries in 2015 (Thousand tonnes of methane) ............................................................................................................. 15
Table 5: Methane emissions from the energy sector for Annex 1 countries: 1990-2015 (Thousand tonnes of methane) ............................................................................................................................... 15
Table 6: Main sources of methane emissions in the natural gas supply chain ..................................... 16
Table 7: Methane emission estimates from well completions ............................................................... 17
Table 8: Comparative emissions for fossil fuel generation ................................................................... 22
Table 9: Well to Wheel/Wake GHG emissions for different fuels ......................................................... 23
Table 10: Examples of environmental reporting by major gas companies ........................................... 25
Table 11: Examples of technical solutions introduced to reduce methane emissions.......................... 25
6
1. Introduction
This paper summarises the main issues relating to methane emissions and examines the various
activities, underway and planned, to assess and reduce them. It attempts to take a wide ranging, non-
specialist, overview that covers both the technical and scientific perspectives as well as operational
and regulatory considerations.
The paper is structured as follows:
The global picture for methane emissions and the part played by the energy sector
Why controlling and reducing methane emissions is important.
How methane emissions are measured and reported levels and sources for the energy and gas
sectors
How the impact of methane emissions is assessed
The overall impact of methane emissions on the environmental case for natural gas
Company and regulatory responses to the challenges of methane emissions
The paper looks at the issues globally, though a recurrent theme is the wide range of practices,
regulatory controls, and data availability around the world. To provide greater granularity and illustrate
some of the key points, two country profiles, focussing on the USA and Great Britain, have been
included.
2. Methane emissions and why they are important
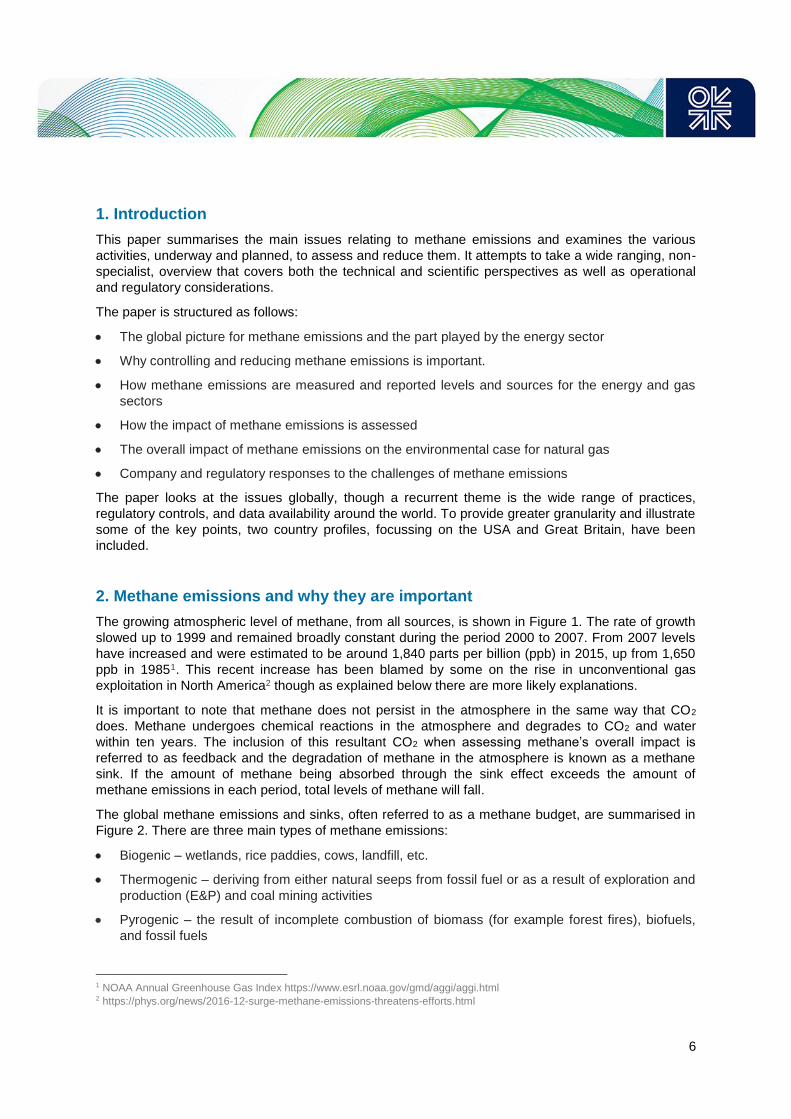
The growing atmospheric level of methane, from all sources, is shown in Figure 1. The rate of growth
slowed up to 1999 and remained broadly constant during the period 2000 to 2007. From 2007 levels
have increased and were estimated to be around 1,840 parts per billion (ppb) in 2015, up from 1,650
ppb in 19851. This recent increase has been blamed by some on the rise in unconventional gas
exploitation in North America2 though as explained below there are more likely explanations.
It is important to note that methane does not persist in the atmosphere in the same way that CO2
does. Methane undergoes chemical reactions in the atmosphere and degrades to CO2 and water
within ten years. The inclusion of this resultant CO2 when assessing methane’s overall impact is
referred to as feedback and the degradation of methane in the atmosphere is known as a methane
sink. If the amount of methane being absorbed through the sink effect exceeds the amount of
methane emissions in each period, total levels of methane will fall.
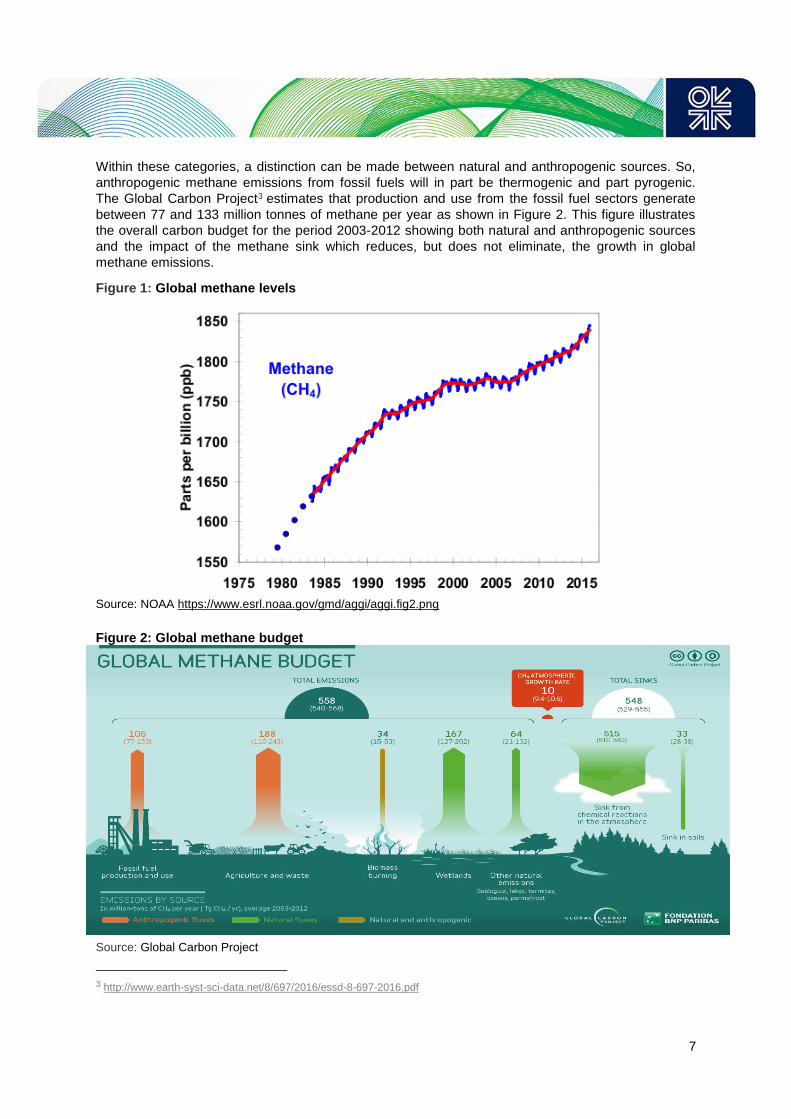
The global methane emissions and sinks, often referred to as a methane budget, are summarised in
Figure 2. There are three main types of methane emissions:
Biogenic – wetlands, rice paddies, cows, landfill, etc.
Thermogenic – deriving from either natural seeps from fossil fuel or as a result of exploration and
production (E&P) and coal mining activities
Pyrogenic – the result of incomplete combustion of biomass (for example forest fires), biofuels,
and fossil fuels
1 NOAA Annual Greenhouse Gas Index https://www.esrl.noaa.gov/gmd/aggi/aggi.html 2 https://phys.org/news/2016-12-surge-methane-emissions-threatens-efforts.html
7
Within these categories, a distinction can be made between natural and anthropogenic sources. So,
anthropogenic methane emissions from fossil fuels will in part be thermogenic and part pyrogenic.
The Global Carbon Project3 estimates that production and use from the fossil fuel sectors generate
between 77 and 133 million tonnes of methane per year as shown in Figure 2. This figure illustrates
the overall carbon budget for the period 2003-2012 showing both natural and anthropogenic sources
and the impact of the methane sink which reduces, but does not eliminate, the growth in global
methane emissions.
Figure 1: Global methane levels
Source: NOAA https://www.esrl.noaa.gov/gmd/aggi/aggi.fig2.png
Figure 2: Global methane budget
Source: Global Carbon Project
3 http://www.earth-syst-sci-data.net/8/697/2016/essd-8-697-2016.pdf

8
A percentage breakdown of the main sources of methane emissions, averaged over the period 2003-
2012, is shown in Figure 3. This gives a global share for oil and natural gas of 13 per cent and coal 7
per cent. The numbers in Figures 2 and 3 are based on a “bottom-up” calculation as part of the Global
Carbon Project (see below).
Figure 3: Global methane emissions by source 2003-2012 (bottom-up calculation)
Source: Global Carbon Project
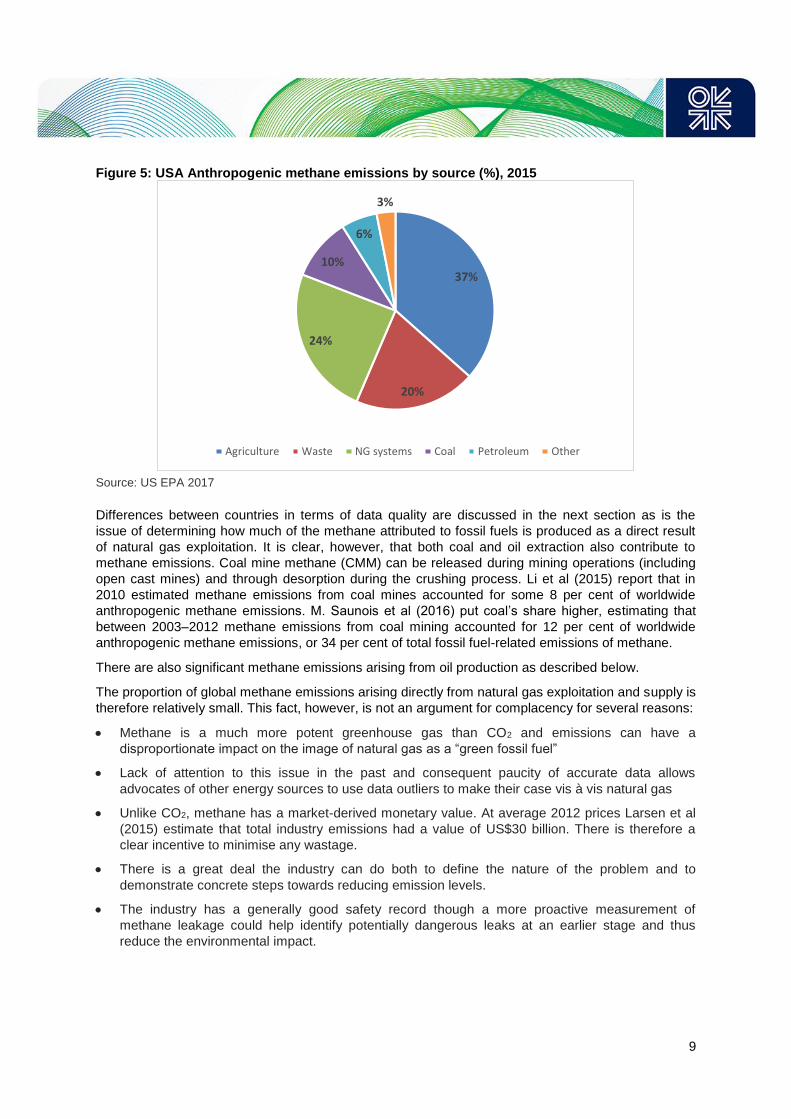
There are wide differences between countries both in terms of the level and source of methane
emissions and the quality of reported data. Differences between sources is illustrated in Figures 4 and
5 which shows the breakdown in the US and UK respectively. The greater level of detail from the US
and the high proportion arising from natural gas systems are particularly notable, suggesting that
applying US experience of emissions to other systems may be inappropriate. These countries are
considered in more detail in the country profiles.
Figure 4: UK Anthropogenic methane emissions by source (%), 2015
Source: UK BEIS 2017
9
Figure 5: USA Anthropogenic methane emissions by source (%), 2015
Source: US EPA 2017
Differences between countries in terms of data quality are discussed in the next section as is the
issue of determining how much of the methane attributed to fossil fuels is produced as a direct result
of natural gas exploitation. It is clear, however, that both coal and oil extraction also contribute to
methane emissions. Coal mine methane (CMM) can be released during mining operations (including
open cast mines) and through desorption during the crushing process. Li et al (2015) report that in
2010 estimated methane emissions from coal mines accounted for some 8 per cent of worldwide
anthropogenic methane emissions. M. Saunois et al (2016) put coal’s share higher, estimating that
between 2003–2012 methane emissions from coal mining accounted for 12 per cent of worldwide
anthropogenic methane emissions, or 34 per cent of total fossil fuel-related emissions of methane.
There are also significant methane emissions arising from oil production as described below.
The proportion of global methane emissions arising directly from natural gas exploitation and supply is
therefore relatively small. This fact, however, is not an argument for complacency for several reasons:
Methane is a much more potent greenhouse gas than CO2 and emissions can have a
disproportionate impact on the image of natural gas as a “green fossil fuel”
Lack of attention to this issue in the past and consequent paucity of accurate data allows
advocates of other energy sources to use data outliers to make their case vis à vis natural gas
Unlike CO2, methane has a market-derived monetary value. At average 2012 prices Larsen et al
(2015) estimate that total industry emissions had a value of US$30 billion. There is therefore a
clear incentive to minimise any wastage.
There is a great deal the industry can do both to define the nature of the problem and to
demonstrate concrete steps towards reducing emission levels.
The industry has a generally good safety record though a more proactive measurement of
methane leakage could help identify potentially dangerous leaks at an earlier stage and thus
reduce the environmental impact.
37%
20%
24%
10%
6%
3%
Agriculture Waste NG systems Coal Petroleum Other

10
Whilst methane is a potent GHG it is also relatively short-lived in the atmosphere (less than ten
years4), so reducing emissions would have an immediate benefit (Larsen et al, 2015). In addition,
when compared with other key emitting sectors there are opportunities to reduce emissions
relatively cheaply and effectively.
There are therefore many good reasons for addressing the issue of methane emissions though doing
so is not without its challenges:
In the past, preventing methane emissions was often not a high priority and given that the gas is
lighter than air and potentially explosive in confined spaces, venting to atmosphere was often
incorporated as a design feature to ensure safe operations.
Some supply systems – particularly those offshore – were configured in such a way that
retrofitting equipment to reduce emissions would be extremely costly even if it were practically
possible.
Regulatory arrangements allowing the cost of “own use gas” to be passed on to consumers
encouraged wasteful practices such as using pressurised gas to actuate valves and to fuel
inefficient compressors.
To summarise there are a wide range of sources for methane emissions and these can vary
significantly between countries. The total level of emissions has been growing in recent years and
regardless of whether these are due to increases in natural gas production there are good reasons for
the industry to reduce methane emission levels. Industry attitudes and approaches have been
changing for some time, but there is still no clear consensus about the best way to proceed. There is,
however, broad agreement that the issues that need to be most urgently addressed, are measuring
the extent of the emissions and to determine their impact. These are considered in the following two
sections.
3. Measuring methane emissions
Methane emissions as a direct result of gas industry activity can be identified at each stage of the
supply and delivery chain. Some of the emissions are deliberate or part of a system’s design.
Examples include releasing well gas during production operations, the use of gas pressure to actuate
valves, and emergency venting for safety reasons. Other emissions are unintentional (sometimes
referred to as fugitive emissions) and usually proactively managed by the industry. These include
leaks from pipelines, valves, joints, and accidental damage.
Natural gas reservoirs are either associated with oil or non-associated. Gas produced from the former
is often a by-product with no opportunity for commercialisation and if it is not reinjected into the
reservoir this gas is vented or more often flared. As a result, there can be significant methane
emissions arising from oil production. Whilst flaring primarily results in the production of CO2 there is
nearly always some unburned methane as well. Where associated gas is used commercially, it is
necessary to allocate methane emissions to both oil and gas production. Wherever possible, methane
emissions associated with oil are excluded from this analysis, though in many cases it is not possible
to distinguish between upstream sources of methane emissions.
Many studies have been undertaken to measure the extent of oil and gas industry related methane
emissions. There are two broad approaches – top-down and bottom-up.
The top-down approach is based on measuring atmospheric concentrations of methane either at the
surface using road vehicles or at higher altitudes by aircraft or satellite. The major issues with top-
down measures are:
4 4th Assessment Report of the Intergovernmental Panel on Climate Change, 2007

11
Extrapolating from point measurements to derive a figure for a larger region. Bruhwiler et al
(2017) explain factors such as atmospheric variability, sampling biases, and choice of upwind
background can make these estimates unreliable.
Attributing global methane measurements to specific sources of emission. Estimates of emissions
from the oil and gas sector have been achieved by various methods including determining the
level of emissions from other sources and then subtracting these from the total, the use of “finger
printing” techniques by measuring the presence of other gases such as ethane that are present in
natural gas streams (Balcombe et al, 2015), or the use of carbon isotopes (Nisbet 2016,
Schwietzke 2016).
The bottom-up approach measures emissions at a particular point in the supply chain and then
extrapolates the data using sampling techniques. In the natural gas chain this would involve applying
emission factors based on measurements of, for example, the number of production wells or
kilometres of pipeline. This approach can generate inaccuracies if:
the factors are out of date5,
the factors fail to reflect the wide variability across facilities (for example applying US distribution
leakage rates to continental European systems),
the number of facilities are miscounted
the presence of possible so-called “super-emitters”6 is ignored.
There are three major global inventories based on bottom-up analysis and each differs in their
classification and regional breakdown7. In aggregate, bottom-up approaches tend to provide larger
estimates of global methane emissions than top-down methods8. Given the range of approaches and
the varying degree of proactivity across the industry there are understandably wide ranging estimates
of the total amount of methane emissions by country and process.
Table 1 shows the difference between the two approaches. The discrepancies between the two
methods regarding fossil fuel emissions are relatively small. A recent study by Schweitzke et al (2016)
used isotopes to separate naturally occurring methane emissions from those arising from the industry.
This suggested that fossil fuel industry emissions were higher than previous estimates at 156 MT of
CH4/year ( 24) though natural gas emissions had fallen dramatically. The study allocated emissions
to each sector generating an approximate split of coal (50 per cent), natural gas (40 per cent) and oil
(10 per cent)9, and reported that the level of emissions per unit of production in the natural gas
industry had fallen from nearly 8 per cent in the mid-1980s to just over 2 per cent in the late 2000s
and early 2010s. Nisbet et al (2016) also examined the isotopic evidence to conclude that observed
atmospheric methane increases between 2007 and 2014 were predominantly caused by biogenic
methane emissions and that fossil fuels had not been the dominant cause.
5 Costello, 2015 6 Balcombe et al p 58. 7 Saunois, 2016, p 703. 8 This is primarily due to greater levels of uncertainty surrounding emissions from wetland and other natural sources (Saunois) 9 Supplementary information, Figure 10

12
Table 1: Estimated methane emissions by source and method (million tonnes of CH4 / yr)
Source Top-down Bottom-up
Mid-point range Mid-point range
Wetlands 167 127-202 185 153-227
Agriculture & waste 188 115-243 195 178-206
Biomass burning 34 15-53 30 25-35
Fossil Fuel prodn &
use
105 77-133 121 114-133
Of which: Coal n/a n/a 41 26-50
Oil + NG n/a n/a 79 69-88
Other natural 64 21-132 199 104-297
Total 558 54-568 736 596-884
Source: M. Saunois et al.: The global methane budget 2000–2012
The most comprehensive review of emissions estimates specific to the gas industry has been
undertaken by the Sustainable Gas Institute (Balcombe et al 2015) which reviewed in detail 25010
papers. This study reported that total methane emissions across the whole supply chain ranged from
0.2 per cent to 10 per cent of produced methane with a mean and median across the estimates of 2.2
per cent and 1.6 per cent respectively. The mean of 2.2 per cent is the same as that reported by
Schweitzke (2016) described above.
The SGI study highlighted a wide range of approaches to data collection and publication, and many
apparent anomalies. This is a particular issue in producing countries where data is often absent or
highly aggregated. Differences between countries in terms of data quality are primarily a factor of a
country’s status11 under the UN Framework Convention on Climate Change (UNFCCC). Larsen et al
(2015) note that only Annex 1 countries are required to report emissions on an annual basis
separated by source. Non-Annex I countries report much less frequently with significant lags in
data12. China for example has issued leakage data based on 2005 measurements. This shows very
low rates compared to other countries with similar gas production and processing structures, applying
US leakage rates to Chinese gas production figures would increase the latter’s overall methane
emissions by 6 times.
Even in countries with comprehensive data collection systems there can be significant variations in
estimates of methane emissions from the natural gas industry. In 2016, the US EPA greenhouse gas
inventory (EPA, 2016) reported a 12 per cent upward revision in methane emissions from natural gas
systems in 2013. This increase was, according to the IEA (2016), primarily a result of applying rates
of fugitive emissions to increased estimates of the number of wells and other equipment. The latest
report (EPA, 2017) records a downward revision of 6 per cent for the same year.
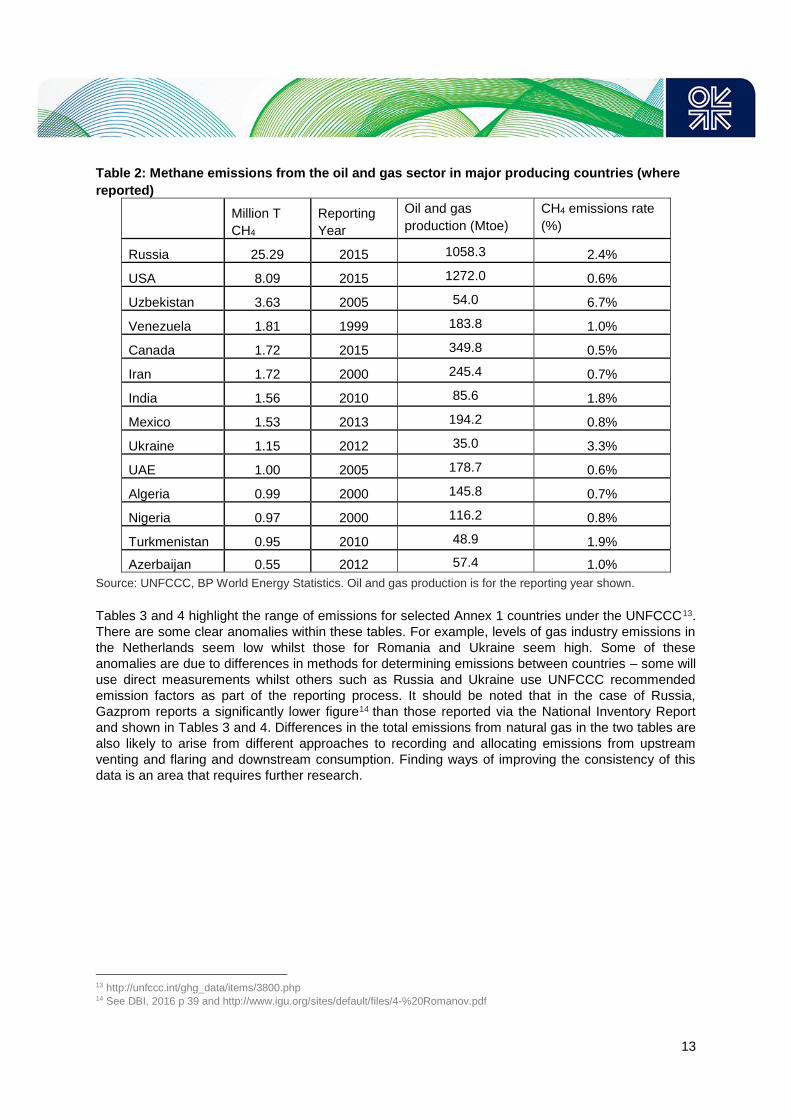
Table 2 shows reported methane emissions from the oil and gas sector for oil and gas producers in
both Annex 1 and non-Annex 1 countries with the year of reporting shown. These countries reportedly
account for at least 60 per cent of global methane emissions from oil and gas production – and
approximately 55% of oil and gas production. The reporting year can vary widely and there are also
some notable omissions – Iraq for example. The Table also shows a rate of emissions that is
calculated on the basis of tonnes of methane per tonne of oil equivalent oil and gas production.
10 54 per cent of these were US studies 11 Countries are either Annex 1 (developed) or non-Annex 1 (developing/in transition) see
http://unfccc.int/parties_and_observers/parties/annex_i/items/2774.php 12 See http://www.ipcc-nggip.iges.or.jp/public/2006gl/pdf/2_Volume2/V2_4_Ch4_Fugitive_Emissions.pdf for details of the
emissions factors that are to be applied
13
Table 2: Methane emissions from the oil and gas sector in major producing countries (where
reported)
Million T
CH4
Reporting
Year
Oil and gas
production (Mtoe)
CH4 emissions rate
(%)
Russia 25.29 2015 1058.3 2.4%
USA 8.09 2015 1272.0 0.6%
Uzbekistan 3.63 2005 54.0 6.7%
Venezuela 1.81 1999 183.8 1.0%
Canada 1.72 2015 349.8 0.5%
Iran 1.72 2000 245.4 0.7%
India 1.56 2010 85.6 1.8%
Mexico 1.53 2013 194.2 0.8%
Ukraine 1.15 2012 35.0 3.3%
UAE 1.00 2005 178.7 0.6%
Algeria 0.99 2000 145.8 0.7%
Nigeria 0.97 2000 116.2 0.8%
Turkmenistan 0.95 2010 48.9 1.9%
Azerbaijan 0.55 2012 57.4 1.0%
Source: UNFCCC, BP World Energy Statistics. Oil and gas production is for the reporting year shown.
Tables 3 and 4 highlight the range of emissions for selected Annex 1 countries under the UNFCCC13.
There are some clear anomalies within these tables. For example, levels of gas industry emissions in
the Netherlands seem low whilst those for Romania and Ukraine seem high. Some of these
anomalies are due to differences in methods for determining emissions between countries – some will
use direct measurements whilst others such as Russia and Ukraine use UNFCCC recommended
emission factors as part of the reporting process. It should be noted that in the case of Russia,
Gazprom reports a significantly lower figure14 than those reported via the National Inventory Report
and shown in Tables 3 and 4. Differences in the total emissions from natural gas in the two tables are
also likely to arise from different approaches to recording and allocating emissions from upstream
venting and flaring and downstream consumption. Finding ways of improving the consistency of this
data is an area that requires further research.
13 http://unfccc.int/ghg_data/items/3800.php 14 See DBI, 2016 p 39 and http://www.igu.org/sites/default/files/4-%20Romanov.pdf

14
Table 3: Methane emissions from the energy sector for selected Annex 1 countries in 2015
(Thousand tonnes of methane)
Oil Gas Venting or
Flaring
Solid fuels Total
Australia* 5 290 - 1,212 1,510
Canada 295 483 944 46 1768
France 2 44 1 1 48
Germany 9 193 0 124 326
Italy 12 182 3 2 199
Netherlands 1 13 12 - 26
Poland 4 35 50 676 765
Romania 99 185 92 40 416
Russia 13,304 5,376 6,608 2,450 27,738
Spain 26 2 6 34
Turkey 11 80 19 49 159
Ukraine* 5 1,141 - 943 2,090
UK 7 154 41 55 257
USA 1,595 6,497 IE 2,692 10,784
Source: UNFCC http://di.unfccc.int/detailed_data_by_party
Note: * 2012 numbers, IE Included elsewhere
15
Table 4: Methane emissions from the natural gas sector in selected Annex 1 countries in 2015
(Thousand tonnes of methane)
E&P Transmission Distribution Other Total Rate **
Australia* 42 12 172 0 226 0.2%
Canada 104 46 38 295 483 0.2%
France 0 24 20 - 44 0.1%
Germany 1 76 89 27 193 0.2%
Italy 9 31 142 - 182 0.2%
Netherlands 0 7 6 - 13 Neg
Poland 16 6 13 - 35 0.1%
Romania 138 7 20 20 185 1.2%
Russia 1164 3715 497 - 5376 0.6%
Spain 0 2 24 - 26 0.1%
Turkey 2 24 54 - 80 0.1%
Ukraine* 75 54 433 575 1137 1.4%
UK 3 2 149 - 154 0.1%
USA 4709 1349 439 - 6497 0.5%
Source: UNFCC http://di.unfccc.int/detailed_data_by_party, BP World Energy Statistics
Note: * 2012 numbers, ** the rate is the level of reported emissions as a percentage of either the country’s
reported 2012 natural gas production or consumption, whichever is greater.
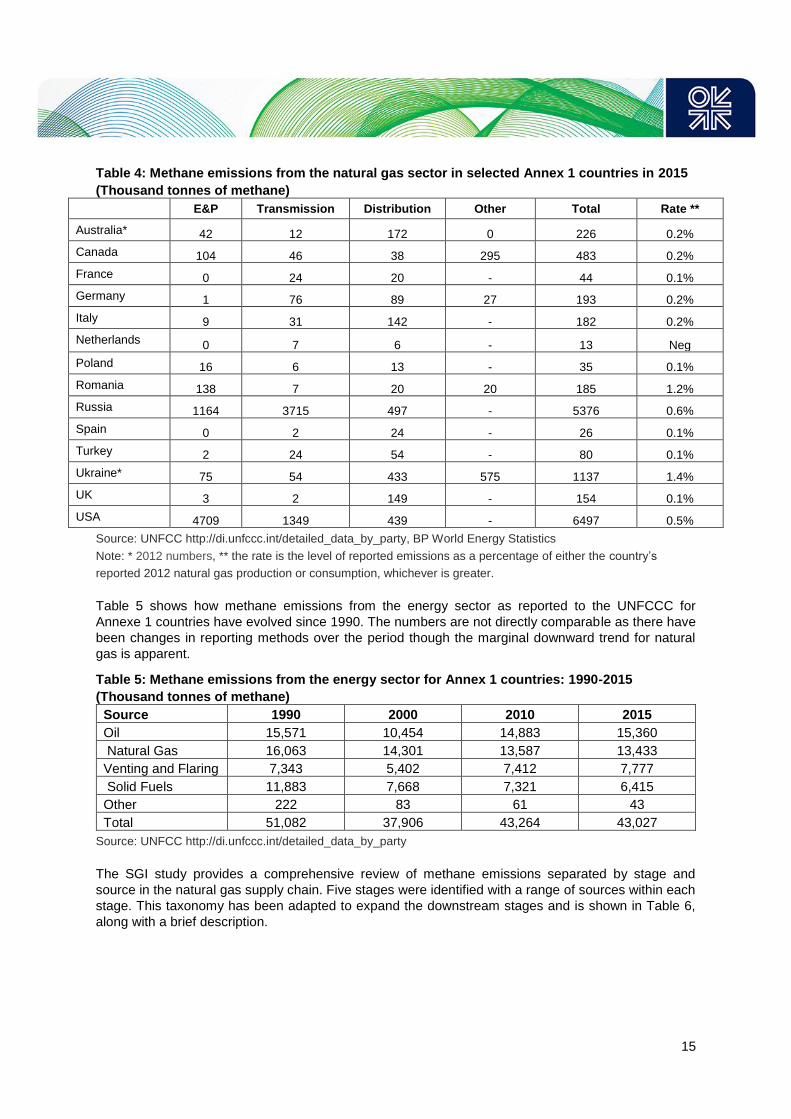
Table 5 shows how methane emissions from the energy sector as reported to the UNFCCC for
Annexe 1 countries have evolved since 1990. The numbers are not directly comparable as there have
been changes in reporting methods over the period though the marginal downward trend for natural
gas is apparent.
Table 5: Methane emissions from the energy sector for Annex 1 countries: 1990-2015
(Thousand tonnes of methane)
Source 1990 2000 2010 2015
Oil 15,571 10,454 14,883 15,360
Natural Gas 16,063 14,301 13,587 13,433
Venting and Flaring 7,343 5,402 7,412 7,777
Solid Fuels 11,883 7,668 7,321 6,415
Other 222 83 61 43
Total 51,082 37,906 43,264 43,027
Source: UNFCC http://di.unfccc.int/detailed_data_by_party
The SGI study provides a comprehensive review of methane emissions separated by stage and
source in the natural gas supply chain. Five stages were identified with a range of sources within each
stage. This taxonomy has been adapted to expand the downstream stages and is shown in Table 6,
along with a brief description.

16
Table 6: Main sources of methane emissions in the natural gas supply chain
Stage Source Example
Pre-production Drilling and Hydraulic
Fracturing
Shallow gas encountered whilst drilling vented
to atmosphere
Well completion Gas vented during the completion process
Extraction Flaring (non-routine) Unburned methane
Liquids unloading Gas vented during the process
Workovers Intentional venting during workover
Fugitive Equipment leaks
Processing Flaring (non-routine) Unburned methane
Fuel Unburned methane
Fugitive and vent Equipment leaks
Transmission, Storage &
Distribution
Fuel Unburned methane in compressor engine
Fugitive Corroded metallic mains
Utilisation Leakage and methane
slip
Unburned methane in NGV engines and
domestic and industrial appliances
Note: Shading indicates a potentially major source of emissions
An additional dimension to the categories listed in Table 6 is the concept of super-emitters – these are
specific points on the system that are responsible for disproportionately large volumes of gas leakage.
These are normally located upstream but could occur in pipelines or storage facilities. In some cases,
super-emitters may be a consequence of system design - for example, large volumes of gas being
vented as a safety measure. More usually, however, they occur following a catastrophic failure,
malfunction or operational error (see below).
Upstream
In the upstream stages of natural gas production, the most prominent sources of methane emissions
are:
Flow back emissions during completion (see below)
Fugitive emissions from gathering pipelines and stations
Liquids unloading – this seems to be a particular issue in older, onshore US wells where liquids
accumulate in the well as a result of declining flow rates and need to be pumped out. This
process typically results in methane escaping from the system15.
Flaring (resulting in small amounts of unburned methane) and venting are also prominent sources of
methane emissions though these primarily arise from the associated gas from oil production that is
not gathered and so are not a direct result of natural gas production and supply. Indeed, it is assumed
that if gas is flared as part of the gas supply operation it is usually being done as a safety measure
during a maintenance operation.
Upstream methane emissions in the US have grown in recent years and this has been linked,
amongst other things, to increases in onshore gathering lines and field booster stations (EPA 2016) in
line with the rapid increase in shale gas production. Stern (2017) has noted that in the minds of
politicians and the media, emissions from upstream operations are directly connected with
unconventional gas and hydraulic fracturing. A 2011 paper (Howarth et al) concluded that because
3.6 - 7.9 per cent of shale gas escaped into the atmosphere it had a larger GHG footprint than coal if
used in power generation, although more recent US EPA reports (2016) suggest that the evidence is
15 See Balcombe et al, 2015 p 11 for a description of the various causes of emissions during the liquids unloading process.

17
less clear cut. Balcombe et al (2015, p22) point out that, based on US data, the highest reported
levels of emissions from well completions come from secondary assessments based on models that
have used either unsuitable or unverified data including excessively high levels of assumed gas flows.
Direct or primary measurements do show that some unconventional wells have higher levels of
emissions, although those adopting “reduced emission techniques” (for example by capturing gas that
would otherwise be vented - also referred to as “green completions”) are below the levels reported for
conventional wells. The numbers are summarised in Table 7.
Table 7: Methane emission estimates from well completions
Well Type Assessment method Average methane emissions (‘000m3/completion)
Conventional Primary 4.9
Secondary 0.9
Unconventional – reduced emission completion
Primary 3.0
Secondary 39.3
Unconventional – non-reduced emission completion
Primary 11.9
Secondary 606.0
Source: Balcombe et al, SGI 2016
LNG
LNG liquefaction, shipping and regasification processes are relatively carbon-intensive compared to
pipeline transportation. There is, however, not much evidence to suggest that these stages have a
higher percentage of methane emissions than the rest of the gas supply chain. This is an area where
more measurement and greater transparency would be beneficial. (Balcombe et al, 2015 p 35)
Transmission
Methane emissions during the transmission stage (which includes long-distance transportation) would
appear to arise primarily from above ground installations such as compressors and pressure
regulation stations where equipment type, age, and maintenance levels can be crucial and from
maintenance and repair operations. Sources can also include venting from pneumatic controllers
which are actuated by pipeline pressure. Emissions arising during repair operations can be an issue if
the gas in pipelines is vented to the atmosphere prior to work commencing. In 2015 Gazprom
reported 1.3 million tonnes of methane emissions of which 77 per cent arose from venting during
repairs (Gazprom, 2016, p22). This source of emissions is being reduced by using portable
compressors to pump the gas forward using nitrogen, rather than venting it.
High pressure pipelines are typically closely monitored both by telemetry and above ground surveys,
and large scale leakage is expected to be minimal. Leakage rates can vary widely however. A recent
DBI study (2016) assessed leakage rates for Russian export gas transiting Ukraine as 0.38 per cent
of sales gas whilst a European transmission operator reports a reduction in measured pipeline
leakage rates from 0.024 per cent of sales gas to 0.01 per cent after a major repair programme
carried out between 2015 and 2017.
Storage
Underground gas storage is likely to have similar characteristics to transmission with fugitive
emissions most likely to be the result of outdated or leaking compressors and surface valves.
However, the presence of a very large volume of high pressure gas creates the potential for a super-
emitter in the event of a catastrophic failure. A striking example of this was the Aliso Canyon storage
facility which suffered a well pipe casing failure resulting in an uncontrolled escape of gas between
October 2015 and February 2016. Nearly 100,000 tonnes of methane escaped16.
16
http://www.bbc.co.uk/news/science-environment-35659947

18
Distribution
In gas distribution, the most prominent source of methane emissions is normally from older metallic
mains. These typically arise from holes or cracks in iron mains or from leaking joints where the
original seals are no longer effective. This is a particular issue in the USA and UK which still have a
large number of metallic mains (see Country profile) but may be of less concern where distribution
pipelines are predominantly polyethylene. Some US studies17 have indicated relatively high levels of
leakage from plastic pipes though this experience is not replicated in Europe. Discussions with UK
companies, where operating pressures may be lower, suggests that whilst there may be some
permeation through the walls of older pipes, most leaks from plastic pipes occur because of poor
quality jointing and installation techniques that can be reduced with an effective performance and
acceptance testing system18.
One area where plastic pipelines are more susceptible to causing emissions is as a result of
interference damage (this may in part explain the high US leakage numbers). This is where a third
party accidentally damages a gas pipeline whilst excavating. The nature of polyethylene pipes is that
they are susceptible to fracturing if struck forcefully and can therefore emit large volumes of gas –
particularly in the case of medium pressure pipelines. Minimising the possibility of interference
damage is therefore an important component of a leakage reduction strategy.
Other emission sources at the distribution stage can include metering and regulating stations and
intentional venting during operations. In most countries, leaks in customer services and meters are
dealt with as a priority due to safety considerations though where retail meter installations are located
away from the property (as in many parts of the US) these can also be a cause of sustained leakage.
The explosive property of methane means that gas leaks from distribution systems are attended to
quickly, although this does not always mean the leaks are repaired quickly. Leaks are typically
prioritized according to safety criteria and those that do not present a hazard are deferred or
reprogrammed. This can result in venting to the atmosphere for prolonged periods. In California in
2015, repairs to 22,156 reported gas leaks were carried over to 2016. (Charkowicz et al – more
details in the US Country profile).
Gas consumption
It is to be expected that methane emissions downstream of the meter would normally be insignificant
as any leaks would be treated as a priority for repair. The UNFCC statistics show a number of
anomalies: although many countries report zero or very low proportions of leakage from consumer
premises, Russia identifies that 26 per cent of emissions from natural gas supply are from consumer
(mainly industrial) premises and both Romania and Ukraine report 51 per cent. These very high
numbers could be due to data collection anomalies19 though high leakage rates from inefficient
district heating and other large scale plant cannot be ruled out. Figures from the USA cite an average
of 0.3 per cent of metered methane escaping from power plants20.
One growing area of potential emissions is ‘methane slip’ in the transport sector where gas-fired
engines are not able to fully combust all the methane and this escapes to the atmosphere. Thinkstep
(2017) estimates this to be in the region of 0.13 - 0.16 per cent of the mass of gas consumed. This
amount should be reduced as engine designs are adapted specifically for natural gas as a fuel,
though dual fuel engines are still likely to be susceptible to some degree of methane slip. The same
study estimates methane emissions of 0.05 - 0.2 per cent during fuel dispensing.
17 Lamb et al (2015 – see Country profile). 18 http://www.smarternetworks.org/Project.aspx?ProjectID=1622#downloads 19 Analysis in the UK of the industrial processes, residential and business sectors showed the main sources were coal used in
the manufacture of bricks, household composting, and accidental fires. 20 https://www.purdue.edu/newsroom/releases/2017/Q1/estimates-of-emissions-from-natural-gas-fueled-plants-much-too-low,-
study-finds.html
19
In conclusion, there has been progress on several fronts in identifying, recording, and monitoring
methane emissions in the gas supply chain, and some of the initiatives are summarised in Section 5.
There is, however continuing concern over the quality and consistency of data. Factors explaining
these differences include:
Differing definitions of sources - for example, flaring gas in association with oil production being
allocated to the gas industry
Different methodologies for the calculation and application of emissions factors
Top-down and bottom-up methane emissions measurements
The application of different global warming potential values
Conversion factors (density, gross calorific value, etc.)
Pipeline distances (for example, route kilometres versus pipe kilometres)
Providing accurate, and accepted, data for the natural gas value chain remains a major problem in
many countries and this in turn distorts the debate over the impact of methane emissions from the gas
industry which is considered in the next section.
4. The impact of methane emissions
The second key issue relates to impact. It is clearly important to be able to develop a levelised metric
for all greenhouse gases (expressed in CO2 equivalents) to compare their comparative impact on the
climate. Methane is a much more potent greenhouse gas than the equivalent quantity of CO2: at the
time of emission, the instantaneous climate forcing impact of methane is between 100 and 120 times
greater although it decays rapidly over time, oxidising to CO2 after around twelve years on average.
After 100 years, its impact (over and above the resulting CO2 product) is virtually zero. CO2 on the
other hand accumulates in the atmosphere and remains there almost indefinitely.
The time horizon is therefore crucial in order to assess the comparative impact of methane on the
atmosphere. The most common approach is to calculate the average global warming potential
(GWP)21 over a 100-year horizon which generates a GWP of 2822, whilst a 20-year horizon increases
this to 84. The former number has been adopted by the IPCC.
This approach, however, is not without its critics. Whilst it is outside the scope of this paper to go into
details, it is certainly the case that to use the higher GWP factors for methane as a means of
comparing fossil fuel options is potentially misleading. The rationale for the 100-year time horizon is
that it is more appropriate for assessing the relative merits of investments designed to reduce
greenhouse gas emissions overall, although as Balcombe et al (2015) point out, the choice of time
horizon may vary depending on the nature of the policy question being considered. There is the risk
that by focussing too much on short-lived climate pollutants such as methane, which will have little
impact on the warming experienced by future generations, the longer-term temperature reduction
goals which can only be achieved through CO2 reduction will be jeopardised. Pierrehumbert 23 ,
amongst others, notes that GWPs do a very poor job of representing the reversible/irreversible
dichotomy between methane and CO2.
To counter these drawbacks, it has been argued that a more appropriate environmental metric to use
is Global Temperature Change Potential (GTP) which uses assumptions to translate the radiative
forcing measured by GWP into actual temperature change. GTP measures the absolute change in
21 For a detailed definition of GWP see the glossary. The comparison of with CO2is on a weight not volume basis 22 This is before feedback. After feedback the figure is 34. 23 https://dotearth.blogs.nytimes.com/2013/08/01/two-climate-analysts-fault-gas-leaks-but-not-as-a-big-warming-
threat/?_php=true&_type=blogs&_php=true&_type=blogs&_r=2 See also see Solomon et al 2012
20
global mean surface temperature at the end of a defined time frame, arising from a specific emission,
relative to the temperature change due to the emission of an equal amount of CO224. The IPCC 5th
Assessment Report (AR5)25, states that the GTP approach is more suitable for policies targeting a
defined future temperature change as it answers the question, “What will the temperature change be
in year X as a result of certain GHG emissions?” The GTP of methane after 100 years is around 6 (or
13 with feedback) though this time horizon does not take into account the short-term warming impact
of methane which could be significant. It is also clear that our understanding of the impact of methane
in the atmosphere is still evolving. There is widespread scientific debate surrounding the uncertainty
of the influence of methane on both climate change and the formation of ozone, together with several
explanations for past trends in atmospheric CH4. To take just one example of how our understanding
is evolving, there is now scientific evidence (Pohlmana et al, 2017) that methane seeps from the
ocean actually contribute to climate cooling.
5. Methane leakage and the decarbonisation agenda
A previous study (Le Fevre, 2014) has described in detail how the relative environmental performance
of different fuels should incorporate the entire life-cycle of the fuel from production to combustion
including extraction, separation and treatment, transportation, refining and distribution, and utilization.
This is usually referred to as the well to wheel (WTW) or well to wire carbon intensity (CI) depending
on the end use. The pre-utilization phases (well to tank or WTT) typically cover CO2 emissions from
gas processing and the energy to transport the gas, as well as emissions of methane from each stage
of the system.
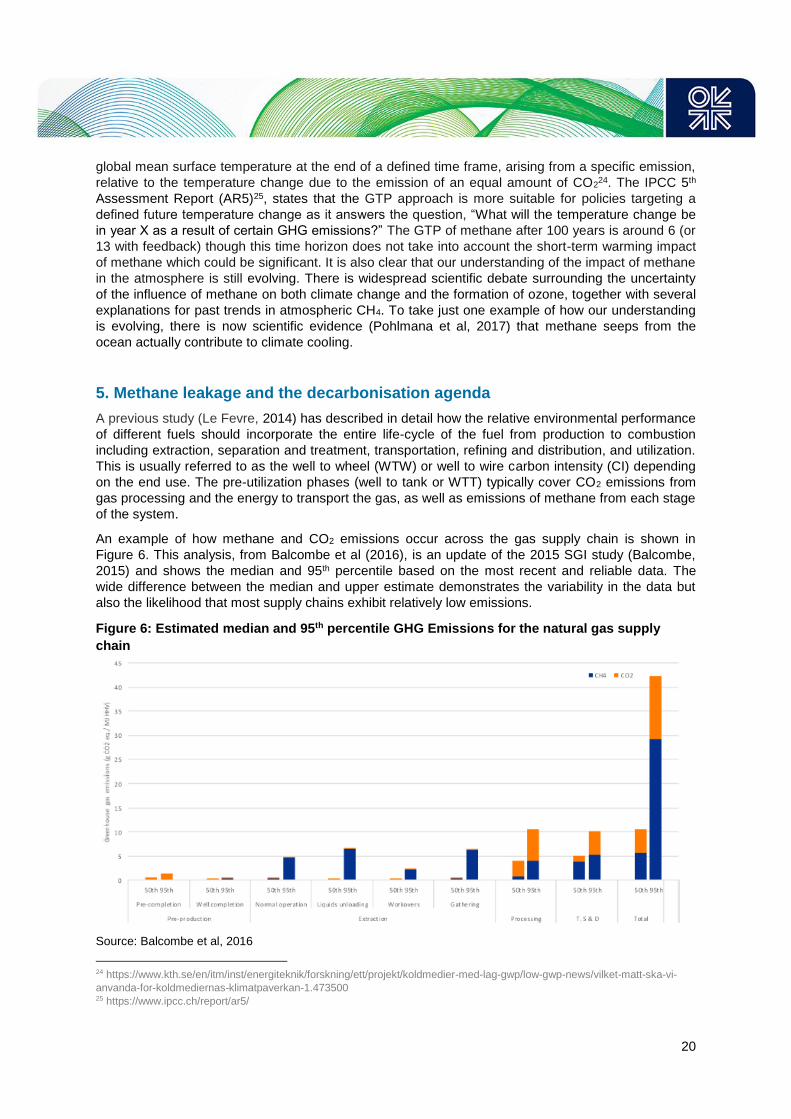
An example of how methane and CO2 emissions occur across the gas supply chain is shown in
Figure 6. This analysis, from Balcombe et al (2016), is an update of the 2015 SGI study (Balcombe,
2015) and shows the median and 95th percentile based on the most recent and reliable data. The
wide difference between the median and upper estimate demonstrates the variability in the data but
also the likelihood that most supply chains exhibit relatively low emissions.
Figure 6: Estimated median and 95th percentile GHG Emissions for the natural gas supply
chain
Source: Balcombe et al, 2016
24 https://www.kth.se/en/itm/inst/energiteknik/forskning/ett/projekt/koldmedier-med-lag-gwp/low-gwp-news/vilket-matt-ska-vi-
anvanda-for-koldmediernas-klimatpaverkan-1.473500 25 https://www.ipcc.ch/report/ar5/

21
The issues with data and disputes over the impact of emissions of methane described above can
result in an information vacuum. This has allowed some consultants and environmental lobby groups
to paint a particularly disadvantageous picture for natural gas, often based on sparse or misapplied
data. For example:
In March 2016, a press release issued by the environmental lobby group Transport and
Environment stated, “Gas-powered trucks and buses will always result in higher overall GHG
emissions ……. because the lower exhaust emissions are undone by higher emissions and
methane leakage during the extraction, production and transport of gas.” 26
A study for the European Commission by Exergia (EC, 2015) concluded that the carbon intensity
of natural gas was some 50 per cent higher than previous studies due to the underestimation
methane leakage rates27.
UK environmental lobby group, Help Rescue the Planet, has used questionable assumptions
regarding methane emissions from US fracking to argue that the supposed benefit of natural gas
over coal should be reversed and that “this is an absolutely key point for decision makers
contemplating the future of energy generation in the UK”.28
There are also reasons other than lack of data explaining why methane emissions may be overstated.
These include:
the inappropriate use of broad based emission factors, for example applying US distribution
factors to European systems or extrapolating on the basis of worst-case estimates
Allocating methane emissions from oil production to natural gas
Using outdated numbers that fail to take account of improvements in assets and processes that
are reducing absolute levels of leakage
There is no doubt that the treatment of methane emissions can have an important impact on interfuel
comparisons. Balcombe et al (2015) note that a typical gas fired power station will produce total life
cycle emissions of between 400 and 600 grams of CO2eq per kWh of electricity generated. Methane
emissions at a rate of 2.2 per cent are equivalent to 92 grams of CO2 per kWh so represent a
significant element of total emissions. The comparison with coal fired power is shown in Table 8.
A key point from Table 8 is that whilst methane emissions may reduce the environmental case for
gas, it is still preferable to coal or lignite even without taking account of the supply chain emissions
associated with those fuels. This comparison is based on a 100-year methane GWP of 34. It should
be noted that the environmental harm caused by additional methane emissions is a transitory effect
whilst the additional CO2 from coal burn is one that will persist for centuries29.
A life cycle assessment of gas and coal supply chains in the EU and Asia was undertaken by CIRAIG
for Total (2016). This analysis included the upstream emissions in the coal supply chain. The results
of the base case are summarised in Figures 7 and 8 confirming the differentials shown in Table 8.
Figure 8 also illustrates the proportion of methane in total emissions for each chain illustrating that it is
as common in coal production as it is in gas. The CIRAIG study also undertook various sensitivity
analyses. This showed that in the case of Utica shale production, fugitive emissions would have to
26 https://www.transportenvironment.org/press/natural-gas-vehicles-expensive-ineffective-way-cut-car-and-truck-emissions-
%E2%80%93-not-%E2%80%98bridge-fuel%E2%80%99 27 The DBI study (2016) discussed in this paper concluded that methane emissions for supplies to Germany were around 40
per cent less than those quoted in the Exergia study. 28 https://helprescuetheplanet.com/2016/03/14/we-stand-by-our-conclusions-on-methane-emissions-and-fracking/ 29 See Pierrehumbert quoted in https://dotearth.blogs.nytimes.com/2013/08/01/two-climate-analysts-fault-gas-leaks-but-not-as-
a-big-warming-threat/?_php=true&_type=blogs&_php=true&_type=blogs&_r=2

22
reach 11 per cent (against an assessed level of 1 per cent) in order to reach emissions parity with
hard coal in Europe.
Table 8: Comparative emissions for fossil fuel generation
Fuel grams of CO2eq per kWh
CH4 GWP=100
Gas
Supply chain* No LNG LNG
92 175
Combustion 350 350
Total 442 525
Coal Combustion only 850
Lignite Combustion only 1,200
*CH4 and CO2 emissions for the full supply chain. Split between CH4/CO2 is 60%/40% for non-LNG and
44%/56% with LNG
Source: Balcombe 2015, EIA, DBI 2016 and author’s estimates
Figure 7: Lifecycle GHG Emissions for selected supply chains, GWP=100
Source: CIRAIG 2016

23
Figure 8: Contribution of different GHG emissions to total life cycle assessment, GWP=100
Source: CIRAIG 2016
Analysis by Thinkstep (2017) for the Natural Gas Vehicles Association has assessed the total well to
tank (WTT) emissions for an EU based CNG vehicle as 12.5 g CO2 eq/MJ of which 3.4g CO2 eq/MJ
(27 per cent) is due to methane emissions. These are assessed as 45 per cent arising from
production, processing and liquefaction, 32 per cent from transmission, distribution and storage, 15
per cent from LNG feedstock transportation, and 8 per cent from dispensing. For an LNG vehicle, the
total well to tank (WTT) emissions are 19.9 g CO2 eq/MJ of which 5.4g CO2 eq/MJ (27 per cent) is due
to methane emissions with 78 per cent arising from production, processing and liquefaction.
When emissions downstream of the tank are considered, the total well to wheel (or well to wake in the
case of shipping) emissions picture is shown in Table 9 with an indication of the proportion arising
from methane emissions. These metrics are shown in terms of CO2 equivalent per kilometre in the
case of road vehicles and per kwh (namely the amount of engine power produced) for shipping.
Methane emissions account for between 6 - 8 per cent of total GHG emissions in road transport and
between 8 -18 per cent in marine.
Table 9: Well to Wheel/Wake GHG emissions for different fuels
Mode Petrol Diesel CNG LNG
Total Of which
methane
Total Of which
methane
Car CO2eq/km 169 140 131 7.7 -
HGV CO2eq/km - 1074 908 54.0 912 69.0
Mode Fuel Oil Marine
diesel
LNG 4-
stroke
Of which
methane
LNG 2-
stroke
Of which
methane
Marine CO2eq/kwh 742 750 662 120 589 49
Source: Thinkstep (2017). Note figures for LNG HGVs are based on HPDI engines and for LNG shipping on dual
fuel engines.
24
Whilst the environmental case for natural gas remains broadly positive compared to other fossil fuels,
reducing methane emissions could further enhance its prospects. Furthermore, the scope for
disinformation is such that gas companies cannot afford to ignore the issue. The next section
describes some of the initiatives that are underway.
6. Methane emissions from a company perspective – work to date
Companies along the supply chain have increasingly recognised that the emission of methane is an
issue that needs to be tackled in terms of data transparency and reporting. Furthermore, there is likely
to be little argument from most gas companies that best practice should include minimising methane
emissions wherever possible. However, the dilemma to be faced is that there are some
circumstances where reducing or eliminating methane emissions is not economically justifiable and
there could be a mismatch between this and a societal view of the cost of methane leakage.
Hausman30 suggests that whilst methane leakage does represent a cost to companies, the incentive
to fix the problem is much less than the social cost, which he puts at US$27/mmbtu, of the emissions.
Gas companies active in the upstream and elsewhere in the gas supply chain have taken several
steps both jointly and independently. Joint initiatives include:
The Oil and Gas Climate Initiative (OGCI). Objectives include improving methane data collection
and selecting and deploying cost-effective methane management technologies31
IPIECA32, the global oil and gas industry association for environmental and social issues, provides
guidance on reporting direct methane emissions as a common reporting element
The International Gas Union (IGU) has a task force addressing the methane challenge33 to follow
on from its report (IGU, 2012) recommending a number of best practices to reduce methane
emissions.
Marcogaz, the technical association of the European gas industry, has a methane emissions
working group and is collaborating with the European Gas Research Group (GERG) on the
development of proposals for a Europe-wide set of methane emission estimation methods
(MEEM)34 based on data from different companies. Marcogaz is also producing a “Best Practices”
document which includes the best available technology to reduce methane emissions.
The UNECE Group of Experts on Gas is working on a Model Framework for Reducing Methane
Emissions along the Gas Value Chain35.
In the US, the Natural Gas Star Methane Challenge program36 provides a mechanism for oil and
gas companies to make specific and transparent commitments to reducing methane emissions.
Also in the US, the downstream natural gas initiative37 is a group of leading natural gas utilities
(including National Grid US and PG&E) collaborating to address key technical, regulatory, and
workforce challenges affecting methane emission reduction opportunities from the natural gas
distribution segment. This includes improving data and sharing best practice.
30 https://theconversation.com/why-utilities-have-little-incentive-to-plug-leaking-natural-gas-63092 31 http://www.oilandgasclimateinitiative.com/climateinvestments 32 http://www.ipieca.org/news/ipieca-s-work-on-methane/ 33 http://www.igu.org/news/igu-council-workshop-measure-document-and-reduce-gas-industry%C2%B4s-commitment-
managing-methane 34 http://www.dbi-gut.de/emissionen.html 35 https://www.unece.org/fileadmin/DAM/energy/se/pdfs/nat_gas/geg/geg4_March2017/Item_5.1_-_Foster_-
_UNECE_Model_Framework_on_Reducing_Methane_Emissions_xxxWeb.pdf 36 https://www.epa.gov/natural-gas-star-program/natural-gas-star-methane-challenge-program 37 http://www.mjbradley.com/content/downstream-natural-gas-initiative

25
Various industry partnerships with governments and NGOs such as the Climate and Clean Air
Coalition and the Oil & Gas Methane Partnership
Individual companies have improved transparency and many now publish detailed environmental
reports. A selection is summarised in Table 10. Whilst these reports provide aggregate data, the
general lack of detailed breakdown (for example by country) still leaves the industry exposed to
charges of inadequate reporting.
Table 10: Examples of environmental reporting by major gas companies
Company Report
Shell In 2016, methane emissions contributed less than 5 per cent of
Shell’s GHG emissions on a CO2-equivalent basis. More than 60 per cent of
reported methane emissions in 2016 came from flaring and venting in upstream
operations.
BP Its Annual Sustainability report 38 publishes methane emissions. Calculates
methane intensity39 at around 0.2 per cent. Introduced green completions in
onshore US wells and is replacing pressure-operated equipment.
Enagas Publishes an annual carbon footprint report on its website which details the
proportion of methane emissions as a percentage of total GHG emissions.
Gazprom Annual Ecology report40 recording methane emissions split by company. Targeted
reduction of methane emissions during repair.
Companies have also developed a range of technical solutions covering gas leak detection, process
and equipment redesign to eliminate emissions, and have targeted replacement programmes. Some
examples are shown in Table 11 and in the country profiles.
Table 11: Examples of technical solutions introduced to reduce methane emissions
Sector Example
All sectors New technology to detect and swiftly repair leaks but also to get a better
understanding of the data.
LDAR programmes using infrared cameras to identify and repair fugitive
leaks
Improved techniques such as Flame Ionisation Detector to quantify fugitive
leaks
Review of training and processes to establish a “no emissions” culture
Upstream Green completions
Reduction/elimination of venting and flaring
Capturing methane during liquids unloading
Transmission
& Distribution
Proactive monitoring of high risk super-emitters – storage sites, processing
facilities, and compressors
Forward pumping using portable compressors during maintenance
operations
Increased survey cycles, use of telemetry, and pressure monitoring
Pipeline replacement programmes
Replace gas driven compressor engines with electric ones
Proactive corrosion repair
Replacement of devices operated by pipeline pressure
Targeted inspections
38 https://www.bp.com/content/dam/bp/en/corporate/pdf/sustainability-report/group-reports/bp-sustainability-report-2016.pdf 39 Methane emissions as a percentage of marketed gas production 40 Gazprom 2016
26
To summarise company performance has improved both in terms of reporting and reducing the level
of methane emissions. There are also a number of pan-industry initiatives that are beginning to bear
fruit though there are still many gaps and inconsistencies and scope for more proactive approaches.
For example, greater efforts from gas importers to determine the level of emissions from their
suppliers would be beneficial. The range and inconsistency of approaches means there remains a
strong interest by, and a role for, government and other regulatory agencies. This is considered in the
next section.
7. Methane emissions from a regulatory perspective – sticks and carrots
Restricting the amount of natural gas that is released to the atmosphere has long been a feature of
many government and regulator’s policies for both safety and environmental reasons. In the upstream
the focus has been on restrictions on the venting and flaring of natural gas during the production
process. In the downstream sector, safety legislation puts strict requirements on gas pipeline
companies to deal swiftly with gas escapes, though as noted above this can include a requirement to
“make safe” that might not actually stop emissions in the short-term.
Growing awareness of the wider environmental ramifications of methane emissions has led
governments to take more proactive and specific measures. Developments on the legislative front
have occurred in the following countries (see also country profiles):
the USA where the EPA has increased reporting requirements
Russia, which is currently the only country in Europe that has regulation on methane. In Russia
methane is treated as both a GHG and an atmospheric pollutant and legislative treatment to
restrict methane emissions was introduced in 200941. This legislation was primarily directed at
limiting the flaring of associated gas but includes widespread reporting requirements and fines for
methane emissions (Carlarne et al, 2016). It is to be noted that there is a separate GHG reporting
system based on activity levels and international IPCC co-efficients. Methane emissions reporting
is based on actual measurements which result in lower reported levels of methane emissions.
In the EU, there is no specific legislation aimed at methane emissions. There was some pressure to
include methane within the National Emission Ceilings Directive (NECD) which would have introduced
a country level cap. This move was successfully resisted by the agricultural lobby though the
Commission may still submit legislative proposals to reduce methane emissions42. These emissions
are also indirectly addressed through various waste and agriculture regulations such as the Landfill
Directive.
In the downstream, traditional treatment by regulators has focussed on unaccounted for gas (UAG)43.
This term covers a wide range of factors including variations in calorific value, metering inaccuracies
and theft, as well as leakage. In many cases regulated utilities were compensated for these amounts
and so the incentive to try and reduce emissions was limited. The liberalisation of markets has led to
greater focus in this area and a requirement for the precise causes of UAG to be identified and
minimised. It has also been recognised that passing costs on to consumers is inequitable; Costello
(2013) reports that the Pennsylvania Public Utility Commission has estimated that gas customers may
be paying as much as US$131 million annually for UAG.
Regulators have turned increasingly towards incentive regimes, and other measures have evolved to
encourage/enforce greater attention to the issue – particularly where companies can take active
measures to reduce losses. Examples include:
41 http://government.ru/docs/all/108250/ 42 http://data.consilium.europa.eu/doc/document/ST-10493-2016-INIT/en/pdf 43 Sometimes referred to as “lost and un-accounted for” (LAUF) gas. See Costello 2013.

27
Incentives to replace metallic mains
Enhanced data reporting requirements – this alone can have a beneficial impact on leakage
reduction
Funding for technical innovations aimed at reducing emissions
Nevertheless, some disincentives may still exist. For example, rate base regulatory systems
encourage the replacement of mains but may not incentivise operating expenditure to fix non-
hazardous leaks.
In conclusion, a combination of incentives, mandating and monitoring is likely to provide the most
efficient and effective approach to minimising emissions.
8. Conclusions
This paper has sought to put the issue of methane emissions from the natural gas industry into a
global context and highlight the key issues of measurement and impact. It has identified how the issue
might shape the role of natural gas within the broader carbonisation agenda and the various actions
that industry and regulators are taking.
The main conclusions from this study are:
There has been a significant increase in the measured amount of global atmospheric methane
since 2006. Over this period global gas production has increased by around 2.4% annually
though there is no evidence that the increase in atmospheric methane levels is a result of this
increase. Indeed, many countries have reported a reduction in both the absolute and relative level
of emissions from the natural gas sector.
Estimating an accurate figure for global methane emissions from the natural gas industry remains
a work in progress. Several studies suggest that a global average of between 1.5 - 2 per cent of
gas across the entire supply chain is broadly correct though some of this may be the result of oil
production whilst a few estimates put the numbers much higher. There are significant gaps and
inconsistencies in the data picture - particularly in some major producing countries.
There also appears to be a significant gap in some countries between government reporting of
methane emissions using standard UNFCCC emission factors and templates, and the more
accurate assessments provided by companies and other organisations within these countries.
These gaps and inconsistencies add to the level of confusion and distrust over industry reporting.
The issue of methane emissions is now on the agenda of most gas companies though responses
are still varied and data provision is inadequate. There is general recognition that best practice
should include minimising methane emissions wherever possible, and many initiatives have been
pursued to good effect, though there may be circumstances where removal is not economically
justified. There is likely to be a continuing gap between some groups’ view of the societal cost of
methane leakage and the commercial cost of eliminating methane emissions completely.
The industry has much to gain from an increase in transparency. The absence of data will lead
some agencies and competing fuels to postulate misleadingly high estimates and these, in the
absence of information to the contrary, will achieve purchase in some quarters. Furthermore, the
absence of comprehensive and reliable data is hampering efforts by the industry to be part of the
debate. Studies such as the recent Thinkstep report demonstrate what can be achieved in terms
of data consistency and transparency. Greater efforts from gas importers to determine and
publish the level of emissions from their suppliers would be also be beneficial.
The inappropriate use of broad brush emission factors and disputes over the impact of methane
emissions on global warming has led to a confusing picture of the relative environmental merits of
28
natural gas versus other fuels. The lack of a common accounting and reporting standard (which
could also apply to other sectors such as coal and agriculture) is also unhelpful.
There would appear to be broad agreement that the GWP potential for methane should be
assessed on a 100-year basis making methane between 28 and 34 times more potent than the
equivalent amount of CO2. There is a case for using Global Temperature Potential rather than
GWP as a comparator as it measures the temperature outcome at a particular point in time,
though it would tend to understate the short-term warming impact of methane. The depth of
understanding on the true impact of methane emissions on climate change is still evolving and
policy decisions based on short-term benefits may be unwise.
Whilst the full chain effect of methane emissions reduces the environmental case for gas, it is
preferable to coal as a fuel for power generation on a full well to wire basis using the 100-year
assessment. The case for gas in transport is less clear cut and improvements in engine and fuel
delivery performance will be necessary to demonstrate the benefits in GHG terms though gas has
other important benefits44.
It is possible that upstream emissions are most prevalent in low output onshore wells, for example
during liquids unloading. The hydraulic fracturing of some shale wells has probably resulted in
high emissions levels though there are no apparent reasons why unconventional gas
developments should have a higher rate of emissions than any other type of gas well.
The country profiles illustrate the ways in which regulatory interventions can be productive as a
means of standardising data collection and publication requirements and in developing an
appropriate mix of incentives. A combination of incentives, mandating, and monitoring is likely to
provide the most efficient and effective approach to minimising emissions.
Risk-based assessment of potential super-emitters could see an increased requirement for real-
time monitoring of salt cavity storage and similar assets. More broadly, a better understanding of
the conditions that are likely to precipitate super-emissions could enable better identification and
more targeted responses.
Methane emissions influence but do not undermine the environmental case for gas. If the industry can
build on the progress to date and deliver a clearer picture on the level of emissions and actions to
address them, the arguments for gas displacing coal in power generation and oil products in transport
become much stronger.
44 Natural gas has clear advantages in terms of reduced pollution of Sox, Nox and PM
29
US Country Profile
Extensive data collection and state-led regulation.
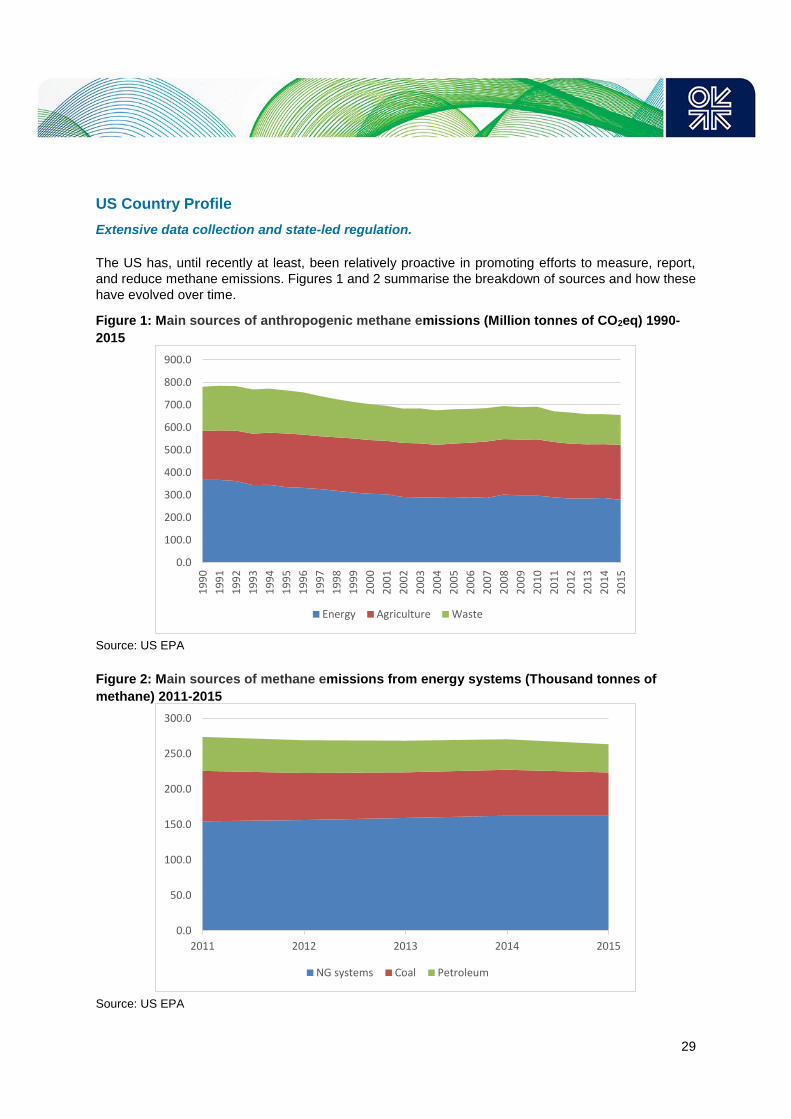
The US has, until recently at least, been relatively proactive in promoting efforts to measure, report,
and reduce methane emissions. Figures 1 and 2 summarise the breakdown of sources and how these
have evolved over time.
Figure 1: Main sources of anthropogenic methane emissions (Million tonnes of CO2eq) 1990-
2015
Source: US EPA
Figure 2: Main sources of methane emissions from energy systems (Thousand tonnes of
methane) 2011-2015
Source: US EPA
0.0
100.0
200.0
300.0
400.0
500.0
600.0
700.0
800.0
900.0
19
90
19
91
19
92
19
93
19
94
19
95
19
96
19
97
19
98
19
99
20
00
20
01
20
02
20
03
20
04
20
05
20
06
20
07
20
08
20
09
20
10
20
11
20
12
20
13
20
14
20
15
Energy Agriculture Waste
0.0
50.0
100.0
150.0
200.0
250.0
300.0
2011 2012 2013 2014 2015
NG systems Coal Petroleum

30
The natural gas industry claims to have made good progress in this area pointing out that production
rose by 39 per cent between 1990 and 2013 during which time methane emissions fell by 12 per cent.
However, as Figure 2 shows emissions have remained fairly static in the past five years. This was
due to increased gas production which countered the effects of new technologies, pipeline
replacements, and voluntary efforts by producers and pipeline and distribution companies (Costello
2015).
Figure 3: Main sources of methane emissions from natural gas systems 2015
Source: US EPA
Figure 3 shows the main sources of emissions from natural gas systems and the significant share that
is attributed to upstream production, although it is understood that these figures include unburned
methane from flaring associated gas from oil production. The other main emissions sources in the
upstream arise from deliberate venting from production wells during liquids unloading or for safety or
operational reasons, leaks from gathering stations, and pneumatic controllers and pressure relief
valves. Growth in methane emissions in the US are linked to increases in the absolute number of
wells, gathering facilities, and in-field booster stations. Outside the upstream sector the most common
source of leaks are compressor stations and distribution pipelines.
A multi-utility study published in 2015 (Lamb et al) collected data on distribution system emissions
from 13 different gas companies. As shown in Figure 4 this study demonstrated that most
downstream leaks came from metallic mains and services.
65%7%
21%
7%
Field prodn processing T&S Distribution
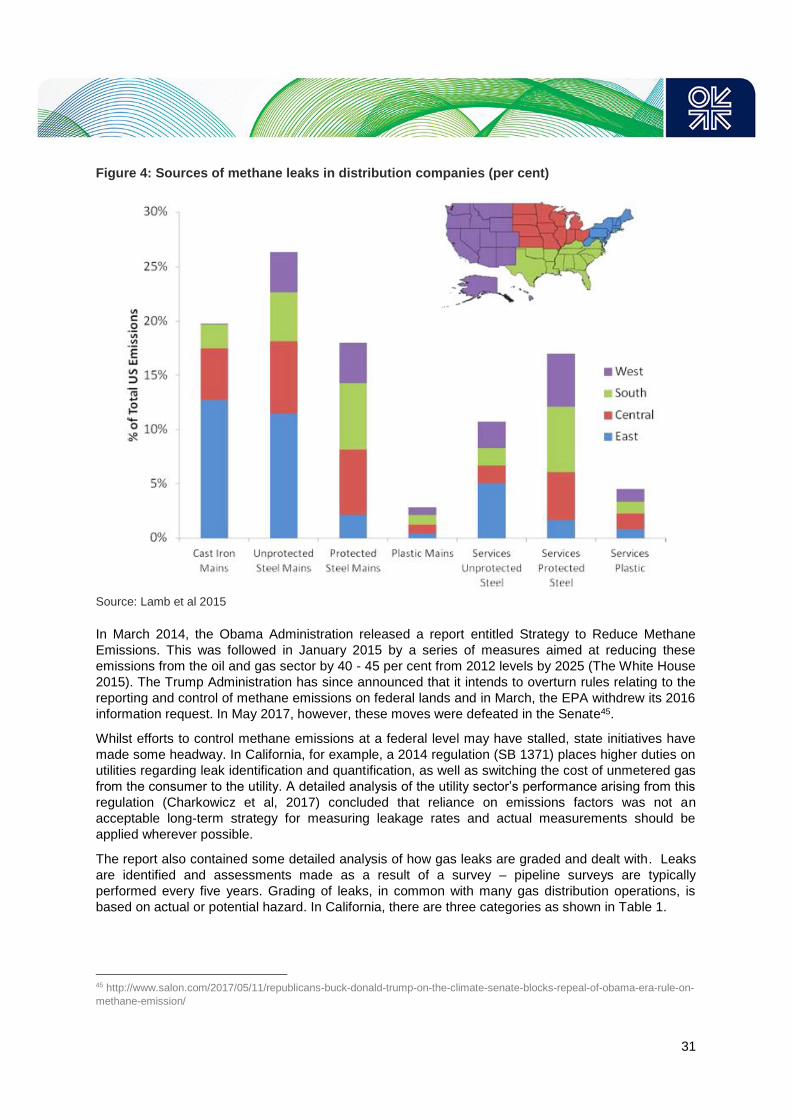
31
Figure 4: Sources of methane leaks in distribution companies (per cent)
Source: Lamb et al 2015
In March 2014, the Obama Administration released a report entitled Strategy to Reduce Methane
Emissions. This was followed in January 2015 by a series of measures aimed at reducing these
emissions from the oil and gas sector by 40 - 45 per cent from 2012 levels by 2025 (The White House
2015). The Trump Administration has since announced that it intends to overturn rules relating to the
reporting and control of methane emissions on federal lands and in March, the EPA withdrew its 2016
information request. In May 2017, however, these moves were defeated in the Senate45.
Whilst efforts to control methane emissions at a federal level may have stalled, state initiatives have
made some headway. In California, for example, a 2014 regulation (SB 1371) places higher duties on
utilities regarding leak identification and quantification, as well as switching the cost of unmetered gas
from the consumer to the utility. A detailed analysis of the utility sector’s performance arising from this
regulation (Charkowicz et al, 2017) concluded that reliance on emissions factors was not an
acceptable long-term strategy for measuring leakage rates and actual measurements should be
applied wherever possible.
The report also contained some detailed analysis of how gas leaks are graded and dealt with. Leaks
are identified and assessments made as a result of a survey – pipeline surveys are typically
performed every five years. Grading of leaks, in common with many gas distribution operations, is
based on actual or potential hazard. In California, there are three categories as shown in Table 1.
45 http://www.salon.com/2017/05/11/republicans-buck-donald-trump-on-the-climate-senate-blocks-repeal-of-obama-era-rule-on-
methane-emission/
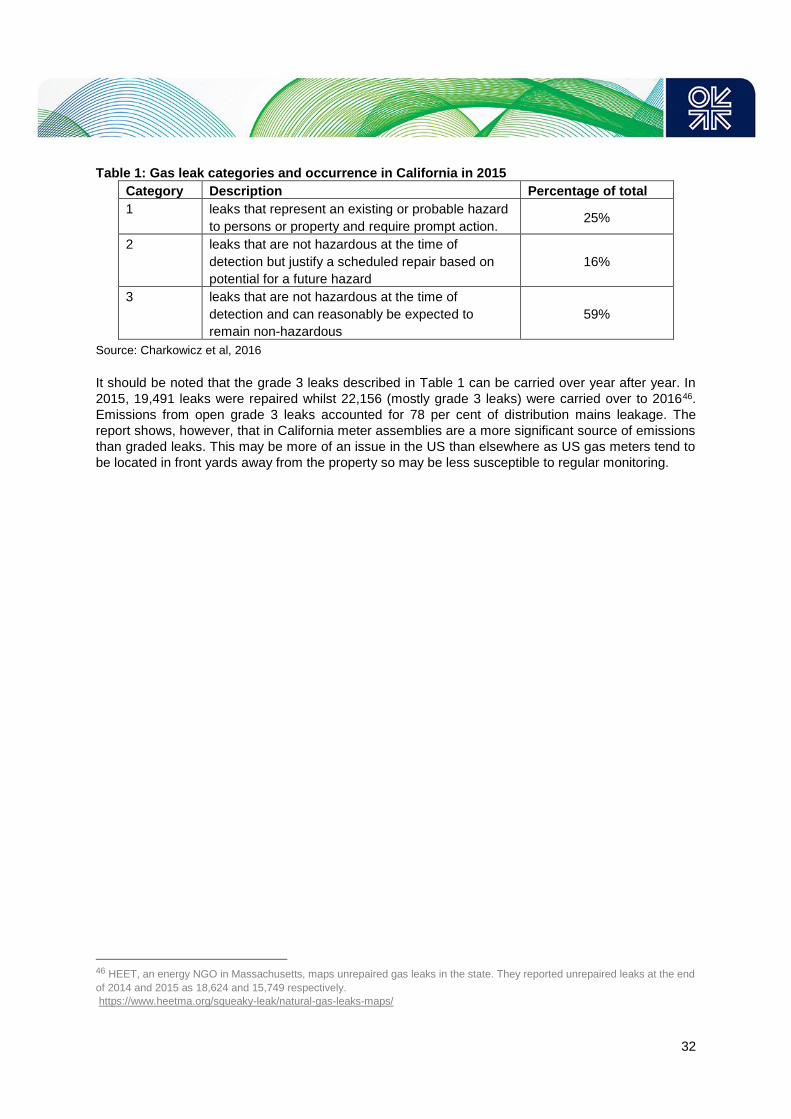
32
Table 1: Gas leak categories and occurrence in California in 2015
Category Description Percentage of total
1 leaks that represent an existing or probable hazard
to persons or property and require prompt action. 25%
2 leaks that are not hazardous at the time of
detection but justify a scheduled repair based on
potential for a future hazard
16%
3 leaks that are not hazardous at the time of
detection and can reasonably be expected to
remain non-hazardous
59%
Source: Charkowicz et al, 2016
It should be noted that the grade 3 leaks described in Table 1 can be carried over year after year. In
2015, 19,491 leaks were repaired whilst 22,156 (mostly grade 3 leaks) were carried over to 201646.
Emissions from open grade 3 leaks accounted for 78 per cent of distribution mains leakage. The
report shows, however, that in California meter assemblies are a more significant source of emissions
than graded leaks. This may be more of an issue in the US than elsewhere as US gas meters tend to
be located in front yards away from the property so may be less susceptible to regular monitoring.
46 HEET, an energy NGO in Massachusetts, maps unrepaired gas leaks in the state. They reported unrepaired leaks at the end
of 2014 and 2015 as 18,624 and 15,749 respectively.
https://www.heetma.org/squeaky-leak/natural-gas-leaks-maps/
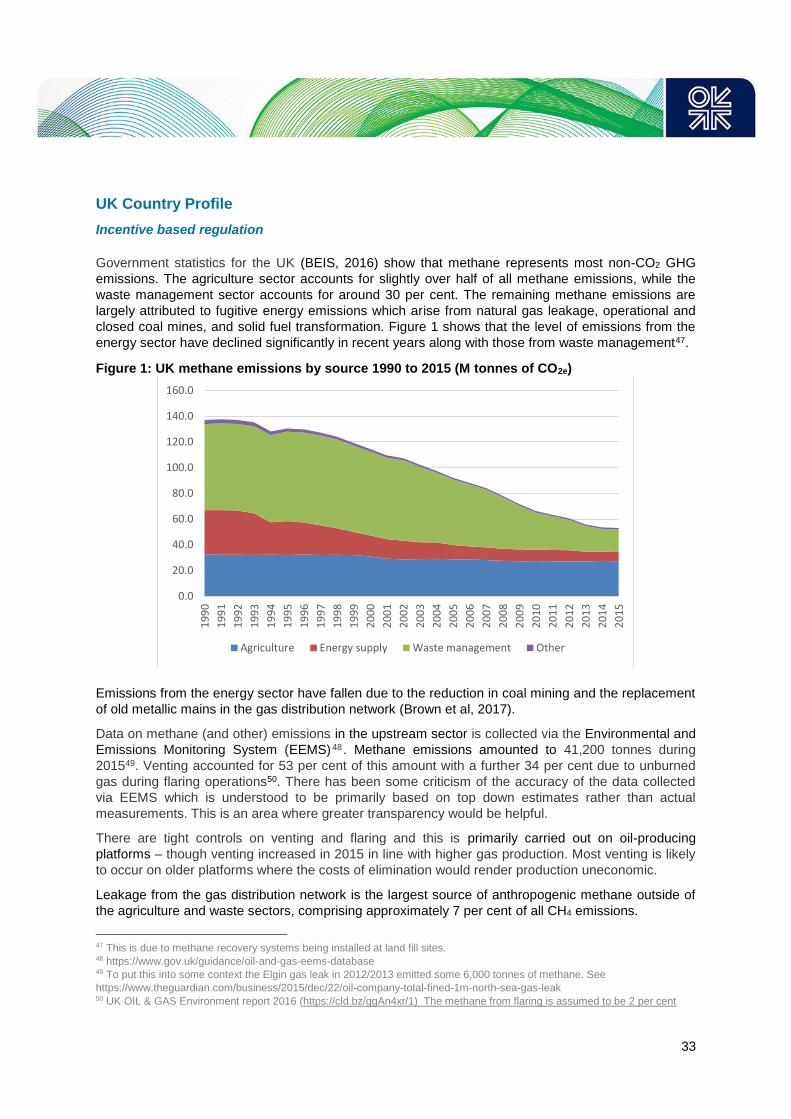
33
UK Country Profile
Incentive based regulation
Government statistics for the UK (BEIS, 2016) show that methane represents most non-CO2 GHG
emissions. The agriculture sector accounts for slightly over half of all methane emissions, while the
waste management sector accounts for around 30 per cent. The remaining methane emissions are
largely attributed to fugitive energy emissions which arise from natural gas leakage, operational and
closed coal mines, and solid fuel transformation. Figure 1 shows that the level of emissions from the
energy sector have declined significantly in recent years along with those from waste management47.
Figure 1: UK methane emissions by source 1990 to 2015 (M tonnes of CO2e)
Emissions from the energy sector have fallen due to the reduction in coal mining and the replacement
of old metallic mains in the gas distribution network (Brown et al, 2017).
Data on methane (and other) emissions in the upstream sector is collected via the Environmental and
Emissions Monitoring System (EEMS) 48 . Methane emissions amounted to 41,200 tonnes during
201549. Venting accounted for 53 per cent of this amount with a further 34 per cent due to unburned
gas during flaring operations50. There has been some criticism of the accuracy of the data collected
via EEMS which is understood to be primarily based on top down estimates rather than actual
measurements. This is an area where greater transparency would be helpful.
There are tight controls on venting and flaring and this is primarily carried out on oil-producing
platforms – though venting increased in 2015 in line with higher gas production. Most venting is likely
to occur on older platforms where the costs of elimination would render production uneconomic.
Leakage from the gas distribution network is the largest source of anthropogenic methane outside of
the agriculture and waste sectors, comprising approximately 7 per cent of all CH4 emissions.
47 This is due to methane recovery systems being installed at land fill sites. 48 https://www.gov.uk/guidance/oil-and-gas-eems-database 49 To put this into some context the Elgin gas leak in 2012/2013 emitted some 6,000 tonnes of methane. See
https://www.theguardian.com/business/2015/dec/22/oil-company-total-fined-1m-north-sea-gas-leak 50 UK OIL & GAS Environment report 2016 (https://cld.bz/qgAn4xr/1) The methane from flaring is assumed to be 2 per cent
0.0
20.0
40.0
60.0
80.0
100.0
120.0
140.0
160.0
19
90
19
91
19
92
19
93
19
94
19
95
19
96
19
97
19
98
19
99
20
00
20
01
20
02
20
03
20
04
20
05
20
06
20
07
20
08
20
09
20
10
20
11
20
12
20
13
20
14
20
15
Agriculture Energy supply Waste management Other

34
For safety reasons the replacement of ageing metallic gas mains has been a priority for the gas
distribution sector since the late 1970s though absolute levels of replacement were around 2,500 km
per year 51 . In 2002, following three fatal incidents arising from mains leakage, the replacement
programme was accelerated after an enforcement policy from the Health and Safety Executive (HSE).
Records showed that there were approximately 101,000 kilometres of iron mains within 30 metres of
properties which could be a risk to people52. The HSE considered it reasonable to expect the industry
to replace these over a 30-year period. The regulatory price control arrangements for the gas
distribution networks (GDNs) included provision for the mains replacement programme with some
incentives for outperformance. However, the programme does not target high leakage pipes per se,
just those seen as presenting the highest safety risk. GDNs appear to be making good progress with
most recently reported figures showing annual replacement levels at around 4,200 kms53.
There is a separate regulatory arrangement to encourage leakage reduction via two incentives54:
The Shrinkage Incentive acknowledges that 95 per cent of shrinkage is caused by pipeline leaks.
GDNs receive a payment based on the gas commodity price for exceeding agreed targets. In
2015-16 the GDNs earned £3.1 million via this mechanism
The Environmental Emissions Incentive (EEI) is a further payment to GDNs with a payment based
on the government’s non-traded carbon value for reducing methane emissions below their
leakage targets. In 2015-16 the GDNs earned £17 million via this mechanism.
The regulator also allows expenditure to be recovered on agreed innovation schemes, some of which
are aimed at reducing emissions.
To continue leakage reduction from remaining metallic mains the GDNs have employed or
experimented with various approaches including55:
System pressure control to reduce pressure during periods of low demand
Targeted sealants for leaking joints using aerosol sealants, robots, or gas polymerisation
Advanced gas detection techniques
Analysis of the type of polyethylene pipe leaks/failures
GDNs have also sought to employ best practice from elsewhere including other sectors, such as the
water industry, which have experience of dealing with pipeline leaks.
51 http://www.hse.gov.uk/research/rrpdf/rr888.pdf 52 http://www.hse.gov.uk/gas/supply/mainsreplacement/irongasmain.htm 53 http://www.energynetworks.org/assets/files/news/publications/GAS%20FAST%20FACT%20CARDS%20-%20ALL.pdf 54 https://www.ofgem.gov.uk/system/files/docs/2017/02/riio-gd1_annual_report_2015-16_0.pdf 55 More details are on the Energy Networks Association portal http://www.smarternetworks.org/site.aspx
35
Glossary
Bcm: one billion cubic metres.
Bcma: one billion cubic metres per annum.
CCGT: Combined cycle gas turbine power station
CNG: compressed natural gas, made by compressing natural gas (which is mainly composed of
methane [CH4]), to less than 1% of the volume it occupies at standard atmospheric pressure. It is
a fossil fuel substitute for gasoline (petrol), diesel, or propane/LPG.
CO2: Carbon dioxide
CO2-eq: Carbon Dioxide-Equivalent Emissions
CH4: Methane
Conventional Gas: Natural gas produced from an underground reservoir other than shale gas,
tight gas or coal bed methane.
ENTSOG: The European Network of Transmission System Operators for Gas
EPA: Environmental Protection Agency – A US Government Agency
EU Emissions Trading System: A cap and trade system under which participating EU Member
States allow qualifying CO2 emitting installations to trade CO2 permits. The number of CO2
permits are limited by agreed caps on CO2 emissions at the Member State level.
Flaring: The combustion of emissions of methane, usually deliberate as a result of operations
Fugitive emissions: Leaks from pipelines and other facilities (i.e. unplanned emissions, see
venting)
GDNs: gas distribution networks
GHG: Greenhouse Gas
GTP: Global Temperature Change Potential: the ratio between the global mean surface
temperature change at a given future time horizon (TH) following an emission (pulse or sustained)
of a compound x relative to a reference gas r such as CO2
GTP100: Global Temperature Change Potential at a 100-year time horizon
GWP: Global Warming Potential, a measure of how much energy the emissions of 1 ton of a gas
will absorb over a given period of time, relative to the emissions of 1 ton of carbon dioxide (CO2).
It is important to note that the comparison is based on weight (1 tonne of CO2 versus 1 tonnes of
CH4) and not on a molecule or volume basis.
GWP100: Global Warming Potential over a 100-year time horizon
IEA: International Energy Agency
IPCC: Intergovernmental Panel on Climate Change
JRC: Joint Research Centre (of the European Commission)
kWh: Kilo Watt Hour
LAUF: Lost and unaccounted for gas
LCA: Life Cycle Assessment
LNG Terminal: Facility for importing ship borne LNG. Normally the LNG is stored at the terminal
before regasification and injection into the transmission system.

36
LNG: Liquefied natural gas, natural gas liquefied by cooling to minus 162 degrees Centigrade
Methane slip: CH4 emissions from the dispensing or incomplete combustion of natural gas in
transportation
Mmbtu: Million British thermal units
MT: Million Tonnes
MTPA: Million Tonnes per annum
MTOE: Million Tonnes of oil equivalent
MWh: A unit of energy equivalent to a Megawatt of power over the duration of one hour.
N2O: Nitrous oxide
NOx: A mixture of various nitrogen oxides as emitted by combustion sources
NTS: The National Transmission System – GB’s high pressure gas grid.
Ofgem: The Office of Gas and Electricity Markets, the GB gas and electricity regulator
PE: Polyethylene
PM: Particulate matter - microscopic emissions from diesel engines that have been shown to
cause breathing difficulties and to have a carcinogenic effect
RF: Radiative Forcing - the measurement of the capacity of a gas to contribute to climate change
Shale Gas: natural gas formed in fine-grained shale rock (called gas shales) with low permeability
in which gas has been adsorbed by clay particles or is held within minute pores and micro
fractures.
Super emitters: A source of large scale fugitive emissions
TSO: Transmission System Operator
TTW: Tank-To-Wheels, emissions from burning a fuel in a vehicle
TWh: A unit of energy equivalent to a Terawatt of power over the duration of one hour.
UAG: Unaccounted for gas
Venting: Deliberate emissions of methane as a result of operations
WTT: Well-To-Tank, emissions from producing and distributing a fuel (starting from the primary
energy resource), including vehicle refueling
WTW: Well-To-Wheels, emissions from the integration of all steps required to produce and
distribute a fuel (starting from the primary energy resource) and use it in a vehicle. Can also refer
to Well-to-Wire for fuel used in power generation
37
References
Akopova, 2010 Gazprom activities on methane emissions reduction, Gazprom Moscow 2010.
Balcombe et al (2015) Methane and CO2 Emissions from the Natural Gas Supply Chain: an evidence
assessment, White Paper 1, Sustainable Gas Institute, 2015.
Balcombe et al (2016) The Natural Gas Supply Chain: The importance of Methane and CO2
Emissions Article in Sustainable Chemistry and Engineering, ACS Publications, October 2016
http://pubs.acs.org/doi/abs/10.1021/acssuschemeng.6b00144
BEISS, 2017 Annex: 1990 - 2014 UK Greenhouse Gas Emissions, final figures by end-user sector
and uncertainties estimates
https://www.gov.uk/government/uploads/system/uploads/attachment_data/file/511698/20160331_199
0-2014_UK_GHG_final_end_user_emissions_and_uncertainties.pdf
Brown et al 2017 UK Greenhouse Gas Inventory 1990-2015, Annual Report for Submission under the
Framework Convention on Climate Change, Report by Ricardo for UK Department for Business,
Energy & Industrial Strategy, April 2017.
https://uk-air.defra.gov.uk/assets/documents/reports/cat07/1705121352_ukghgi-90-
15_Main_Issue2.pdf
Bruhwiler et al (2017) U.S. CH4 emissions from oil and gas production: Have recent large increases
been detected? Wiley, April 2017. http://onlinelibrary.wiley.com/wol1/doi/10.1002/2016JD026157/full
Carlarne C. et al, 2016 The Oxford Handbook of International Climate Change Law, OUP, 2016.
Charkowicz E. et al, 2017 Analysis of the Utilities' June 17, 2016, Methane Leak and Emissions
Reports. California Air Resources Board and California Public Utilities
Commission Joint Staff Report, January 2017.
CIRAIG 2016, GHG Emissions related to the Life Cycle of Natural Gas and Coal in different
Geographical contexts, A study for Total, June 2016.
http://www.ciraig.org/pdf/CIRAIG_LCA_gas_vs_coal_final_report_version.pdf
Costello, 2013, Lost and Unaccounted-for Gas: Practices of State Utility Commissions, Ken Costello,
NRRI, June 2013. http://nrri.org/download/nrri-13-06-lost-and-unaccounted-for-gas/
Costello, 2015, Methane Emissions, Ken Costello, NRRI, June 2015. http://nrri.org/research-
papers/?f=natural-gas#
DBI, 2016 Critical Evaluation of Default Values for the GHG Emissions of the Natural Gas Supply
Chain
The Economist, `A dirty little secret’, July 23, 2016, pp.50-51.
European Commission 2015 Study on Actual GHG data for diesel, Petrol, Kerosene and Natural Gas,
SA report for DG Energy by Exergia SA, July 2015.
Enagas, 2017 Country profile on activities to reduce methane emissions (Presentation).
http://www.gastechnology.org/CH4/Documents/2016/18-Jesus-Manuel-Gil-Jimenez-CH4-
Presentation-2016.pdf
EPA (2016) Inventory of US Greenhouse Gas Emissions and Sinks: 1990-2014, April 2016.
https://www.epa.gov/sites/production/files/2017-04/documents/us-ghg-inventory-2016-main-text.pdf

38
EPA (2017) Inventory of US Greenhouse Gas Emissions and Sinks, US Environmental Protection
Agency, April 2017. https://www.epa.gov/ghgemissions/inventory-us-greenhouse-gas-emissions-and-
sinks
Gazprom 2016; PJSC Gazprom Environmental Report, 2016.
http://www.gazprom.com/f/posts/53/331565/gazprom-ecology-report-2016-en.pdf
IGU, 2012, Sustainability in 2009 – 2012 Triennium, IGU Committee A, International Gas Union,
IPCC, 2006 Guidelines for National Greenhouse Gas Inventories.
https://www.ipcc.ch/meetings/session25/doc4a4b/vol2.pdf
Lamb et al 2015 Lamb, Brian K. et al. “Direct Measurements Show Decreasing Methane Emissions
from Natural Gas Local Distribution Systems in the United States.” Environmental Science and
Technology, published online, March 31, 2015.
Larsen et al (2015) “Untapped potential - Reducing Global Methane Emissions from Oil and Natural
Gas Systems” Kate Larsen, Michael Delgado and Peter Marsters
Rhodium Group, April 2015. http://rhg.com/wp-
content/uploads/2015/04/RHG_UntappedPotential_April2015.pdf
Le Fevre 2014, The Prospects for Natural Gas as a Transportation Fuel in Europe, OIES Working
Paper No. 84, 3 March 2014 Oxford. https://www.oxfordenergy.org/wpcms/wp-
content/uploads/2014/03/NG-84.pdf
Li, W., Younger, P. L., Cheng, Y., Zhang, B., Zhou, H., Liu, Q., Dai, T., Kong, S., Jin, K., and Yang, Q.
(2015) Addressing the CO2 emissions of the world's largest coal producer and consumer: lessons
from the Haishiwan Coalfield, China. Energy, 80. pp. 400-413. Feb 2015.
http://eprints.gla.ac.uk/102311/1/102311.pdf
Nisbet, E. G., et al. (2016), Rising atmospheric methane: 2007–2014 growth and isotopic shift, Global
Biogeochem. Cycles, 30, 1356–1370, doi:10.1002/2016GB005406.
Pohlmana J et al (2017) “Enhanced CO2 uptake at a shallow Arctic Ocean seep field overwhelms the
positive warming potential of emitted methane”, Article in
Proceedings of the National Academy of Sciences PNAS, May 23, 2017.
www.pnas.org/cgi/doi/10.1073/pnas.1618926114
Schwietzke et al (2016), Upward revision of global fossil fuel methane emissions based on isotope
database. Published in NATURE, Volume 538, 6 October 2016.
M. Saunois et al.: The global methane budget 2000–2012.
http://www.earth-syst-sci-data.net/8/697/2016/essd-8-697-2016.pdf
Stern J. 2017, The Future of Gas in Decarbonising European Energy Markets – the need for a new
approach, OIES Gas programme, 9 January 2017. https://www.oxfordenergy.org/wpcms/wp-
content/uploads/2017/01/The-Future-of-Gas-in-Decarbonising-European-Energy-Markets-the-need-
for-a-new-approach-NG-116.pdf
Solomon et al 2012 Atmospheric composition, irreversible climate change, and mitigation policy
http://geosci.uchicago.edu/~rtp1/papers/WCRPAnthropocene2012.pdf )
The White House 2015, “Administration Takes Steps Forward on Climate Action Plan by Announcing
Actions to Cut Methane Emissions.” Fact Sheet, January 14, 2015.
UNFCC Annual Greenhouse gas (GHG) emissions database.
http://unfccc.int/di/FlexibleQueries/Event.do?event=go

39
US EPA Inventory of US Greenhouse Gas Emissions and Sinks: 1990-2015.
https://www.epa.gov/sites/production/files/2017-02/documents/2017_complete_report.pdf