methane recovery in wastewater treatment project …€¦ · this proposed project activity is to...
TRANSCRIPT
PROJECT DESIGN DOCUMENT FORM (CDM-SSC-PDD) - Version 03 CDM – Executive Board
METHANE RECOVERY IN WASTEWATER TREATMENT
PROJECT AIN07-W-01, SUMATERA UTARA, INDONESIA
UNFCCC Clean Development Mechanism Simplified Project Design Document
for Small Scale Project Activity
DOCUMENT ID: AIN07-W-01 VER 1, 18 SEPTEMBER 2007

1
CLEAN DEVELOPMENT MECHANISM
PROJECT DESIGN DOCUMENT FORM (CDM-SSC-PDD) Version 03 - in effect as of: 22 December 2006
CONTENTS
A. General description of the small scale project activity B. Application of a baseline and monitoring methodology C. Duration of the project activity / crediting period D. Environmental impacts E. Stakeholders’ comments
Annexes Annex 1: Contact information on participants in the proposed small scale project activity Annex 2: Information regarding public funding Annex 3: Baseline information
Annex 4: Monitoring Information

2
Revision history of this document Version Number
Date Description and reason of revision
01 21 January 2003
Initial adoption
02 8 July 2005 • The Board agreed to revise the CDM SSC PDD to reflect guidance and clarifications provided by the Board since version 01 of this document.
• As a consequence, the guidelines for completing CDM SSC PDD have been revised accordingly to version 2. The latest version can be found at <http://cdm.unfccc.int/Reference/Documents>.
03 22 December 2006
• The Board agreed to revise the CDM project design document for small-scale activities (CDM-SSC-PDD), taking into account CDM-PDD and CDM-NM.

3
SECTION A. General description of small-scale project activity A.1 Title of the small-scale project activity: Methane Recovery in Wastewater Treatment, Project AIN07-W-01, Sumatera Utara (North Sumatera), Indonesia, Ver 1, 18 September 2007 (18/09/2007). A.2. Description of the small-scale project activity: Purpose: This project will recover methane caused by the decay of biogenic matter in the effluent stream of an existing oil palm processing mill by introducing methane recovery and combustion to the existing anaerobic effluent treatment system (lagoons). Explanation of GHG emission reductions: The proposed project activities will reduce GHG emissions in an economically sustainable manner, and will result in other environmental benefits, such as improved water quality and reduced odour. In simple terms, the project proposes to move from a high-GHG-emitting open air lagoon, to a lower-GHG-emitting anaerobic digester with capture and combustion of the resulting biogas. Contribution to sustainable development: Worldwide, agricultural operations are becoming progressively more intensive to realize the economies of production and scale. The pressure to become more efficient drives significant operational similarities between facilities of a “type,” as inputs, outputs, practices, and technology have become similar around the world. This is especially true in palm oil operations. Because Palm Oil Mill Effluent (POME) is quite concentrated1,2, its handling and disposal can create profound environmental consequences, such as greenhouse gas emissions, odour, and water/land contamination (including seepage, runoff, and over application). The project will have positive effects on the local environment by improving air quality through the reduction of odor and cleaner emissions. The project will be installed with an extensive monitoring system, and is designed to comply with all the local environmental regulations. This proposed project activity is to be implemented at Pabrik Kelapa Sawit (PKS) Milano Pinang Awan which processes 298,145 tonnes of fresh fruit bunch (FFB) per year, generating approximately 193,794 cubic meters of wastewater per year. The wastewater from the mill is treated through a ponding system consisting of a cooling pond, sludge pond, neutral pond, two anaerobic lagoons, facultative lagoons, an aerobic lagoon, and sedimentation ponds. The depth of each anaerobic lagoons is approximately 4.5m, although sludge can reduce lagoon depth and volume. The lagoons are de-sludged as needed to comply with effluent discharge requirements. The average temperature in the region is about 27.8oC. These factors create anaerobic conditions within the lagoons, resulting in methane generation from the biodegradation of the organic content in the wastewater.
1 Untreated POME from an average sized mill, i.e., processing capacity of about 30 tonnes FFB per hour, has an organic content equivalent to the raw domestic sewage from a population of 300,000 persons. POME has an industry mean standard Chemical Oxygen Demand rating of 50,000 mg/l. (Industrial Processes & the Environment (Handbook #3) Crude Palm Oil Industry, pp. 23 & 27.) 2 Notwithstanding the industry average cited herein, AES AgriVerde has observed a wide range of empirical values, between approximately 25,000 – 140,000 mg/l, using third party test laboratories.
4
A.3. Project participants: Table 1. Project Participants
Name of Party involved (*) (host) indicates a host Party
Private and/or public
entity(ies) project participants (*) (as
applicable)
Kindly indicate if the party involved wishes to be considered as project participant (Yes/No)
Netherlands • AES AgriVerde Ltd. No
Indonesia (host) • PT AES AgriVerde Indonesia No
(*) In accordance with the CDM modalities and procedures, at the time of making the CDM-PDD public at the stage of validation, a Party involved may or may not have provided its approval. At the time of requesting registration, the approval by the Party(ies) involved is required. A.4. Technical description of the small-scale project activity: A.4.1. Location of the small-scale project activity: A.4.1.1. Host Party(ies): The host party for this project activity is Indonesia. A.4.1.2. Region/State/Province etc.:
The project will be located in Sumatera Utara.
A.4.1.3. City/Town/Community etc:
The project sites are shown in Figure 1 with specifics detailed in Table 2 (Section A.4.1.4).
A.4.1.4. Details of physical location, including information allowing the unique identification of this small-scale project activity : The physical location of the project activity site is shown in Figure 1 and listed in Table 2. PT Perkebunan Milano has the following facility in Sumatera Utara:
• PKS Milano Pinang Awan (0034) is a palm oil mill located in Sumatera Utara, Indonesia. This facility processes approximately 298,145 tonnes of Fresh Fruit Bunches (FFBs) per year. The mill is in operation approximately 20 hours per day, 300 days per year and is in regulatory compliance. The mill uses a system of open lagoons to process POME effluent, including a cooling pond, sludge pond, neutral pond, two anaerobic lagoons, facultative lagoons, an aerobic lagoon, and sedimentation ponds.
5
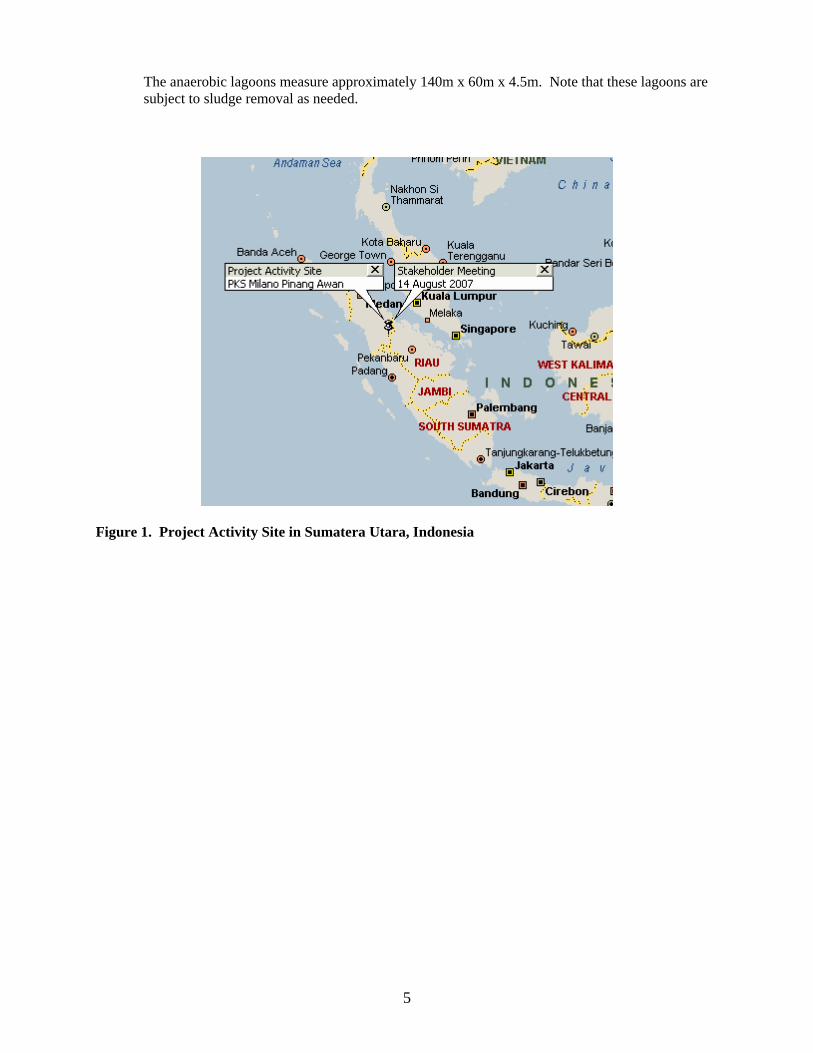
The anaerobic lagoons measure approximately 140m x 60m x 4.5m. Note that these lagoons are subject to sludge removal as needed.
Figure 1. Project Activity Site in Sumatera Utara, Indonesia
PROJECT DESIGN DOCUMENT FORM (CDM-SSC-PDD) - Version 03 CDM – Executive Board
6
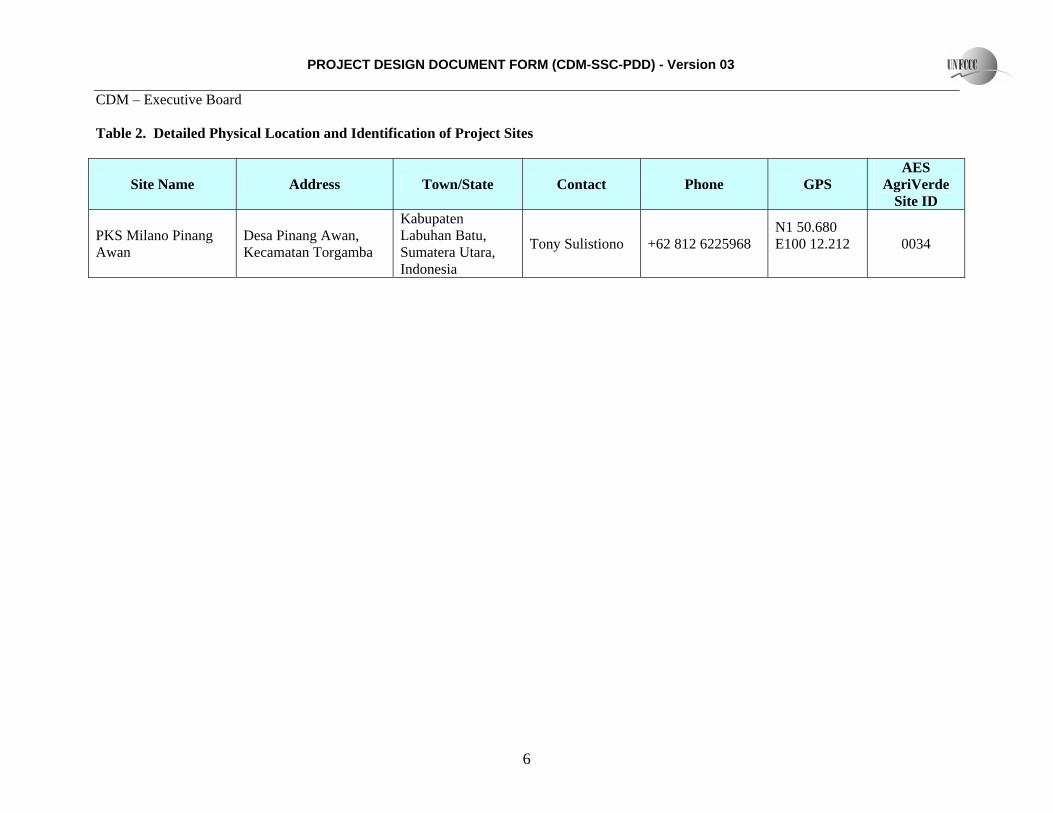
Table 2. Detailed Physical Location and Identification of Project Sites
Site Name Address Town/State Contact Phone GPS AES
AgriVerde Site ID
PKS Milano Pinang Awan
Desa Pinang Awan, Kecamatan Torgamba
Kabupaten Labuhan Batu, Sumatera Utara, Indonesia
Tony Sulistiono +62 812 6225968 N1 50.680 E100 12.212
0034
PROJECT DESIGN DOCUMENT FORM (CDM-SSC-PDD) - Version 03 CDM – Executive Board
7
A.4.2. Type and category(ies) and technology/measure of the small-scale project activity:
The project activity described in this document is classified as a Type III, Other Project Activities, Category III H/Version 6, option iv, Methane recovery in wastewater treatment. The project activity will capture and combust methane gas produced from the anaerobic portion of an existing wastewater treatment system in Sumatera Utara, Indonesia.
The project activity utilizes a simple, effective and reliable technology to capture lagoon-produced biogas: installing sealed covers over existing anaerobic POME lagoons to create an anaerobic digester system. Each cover will consist of a synthetic high-density polyethylene (HDPE) geo-membrane which is sealed by means of strip-to-strip welding and a peripheral anchor trench dug around the perimeter of the existing lagoon. The welded seams will be tested to ensure air-tight coupling between all HDPE pieces. In addition, lagoon berms will be upgraded, if necessary, to ensure secure anchoring. HDPE is an excellent product for large applications requiring UV, ozone, and chemical resistance and because of these attributes is one of the most commonly used geo-membranes worldwide. This covering approach effectively enables capture/combustion of 100% of the biogas produced in these lagoons. The digester will incorporate other features to enhance long-term reliability including a sludge handling system that enables sludge removal without breaking the digester’s air-tight seal. Another feature that may be installed depending on site specific conditions is multiple agitators to gently turn over the POME, simulating the natural atmospheric and solar turbulence which will be blocked by the HDPE covers. POME will continue to flow from the anaerobic treatment section to other lagoons and/or land application so that the effluent discharge requirements can be met. The captured biogas will be routed to one or more high temperature, enclosed flares to destroy methane gas as it is produced. Digester sludge will continue to be handled as in the past: it is occasionally pumped into drying beds and is used as fertilizer for oil palm trees. Biogas will be accurately metered using a thermal mass flow meter that has two sensing elements: a velocity sensor and a temperature sensor that automatically corrects for changes in gas temperature. The transducer electronics heats the velocity sensor to a constant temperature differential above the gas temperature and measures the cooling effect of the gas flow. The meter runs on DC power and includes a UPS back-up system to provide for the possibility of power outages. This meter type offers distinct advantages over standard flow meters including direct mass flow sensing that eliminates the need for temperature and pressure compensation, high accuracy and repeatability for low-pressure gas flow measurement applications, outstanding rangeability, lower flow blockage and pressure drop than conventional meters, and no moving parts. The flaring combustion system is automated to ensure that all biogas that exits the digester and passes through a meter and flare is combusted. A continuous flare ignition system with redundant electrodes ensures methane is combusted whenever biogas is present at the flare. This continuous ignition system is powered by a solar module (solar-charged battery system) that does not require external power. With a fully charged battery, the module will provide power to the igniter for up to two weeks without sunlight. The flare includes thermocouples to monitor flare exhaust gas temperature, a parameter that is checked more often than hourly. The component parts are verified functional on a periodic basis in accordance with manufacturer and other technical specifications. The mill has indicated a willingness to undertake a second project phase, using anaerobic digester produced biogas to create renewable energy, once they better understand the characteristics of biogas generation (including consistency of output) and issues associated with filtering the gas to prepare it for use. The mill presently uses diesel fuel generators for both daily start-up and overnight operations;
PROJECT DESIGN DOCUMENT FORM (CDM-SSC-PDD) - Version 03 CDM – Executive Board
8
biomass is used to fuel the boilers. The mill will determine what option (such as use of a package boiler or biogas generator) will optimize their use of the biogas once these characteristics are understood. Once this second phase is undertaken, the renewable energy generation and associated biogas usage will be carefully monitored to confirm biogas combustion. Sludge disposition will be monitored to ensure final disposition is the same (as pre-project) or that the appropriate allowance is made for project leakage. Technology and know-how transfer: Expertise and equipment will be integrated from several countries including the USA, Mexico, Italy, India, Brazil, S. Korea, New Zealand, and Malaysia. A multi-faceted approach will be taken to ensure that technology transfer proceeds smoothly, including a methodical process for identifying and qualifying appropriate technology/services providers, transferring the manufacture and maintenance of certain subassemblies to local manufacturers, supervision of the complete installation, staff training, ongoing monitoring (by both site and project developer personnel) and development/implementation of a Monitoring Plan (by the project developer). The materials and labour used in this project are sourced from the host country whenever possible. By working closely with the project on a day-to-day basis, the project developer will ensure that all installed equipment is properly operated and maintained, and will carefully monitor the data collection and recording process. Moreover, by working with the mill site’s staff over many years, the project developer will ensure that site personnel acquire appropriate expertise and resources to operate the system on an ongoing/continuous basis (even after CDM status retires).
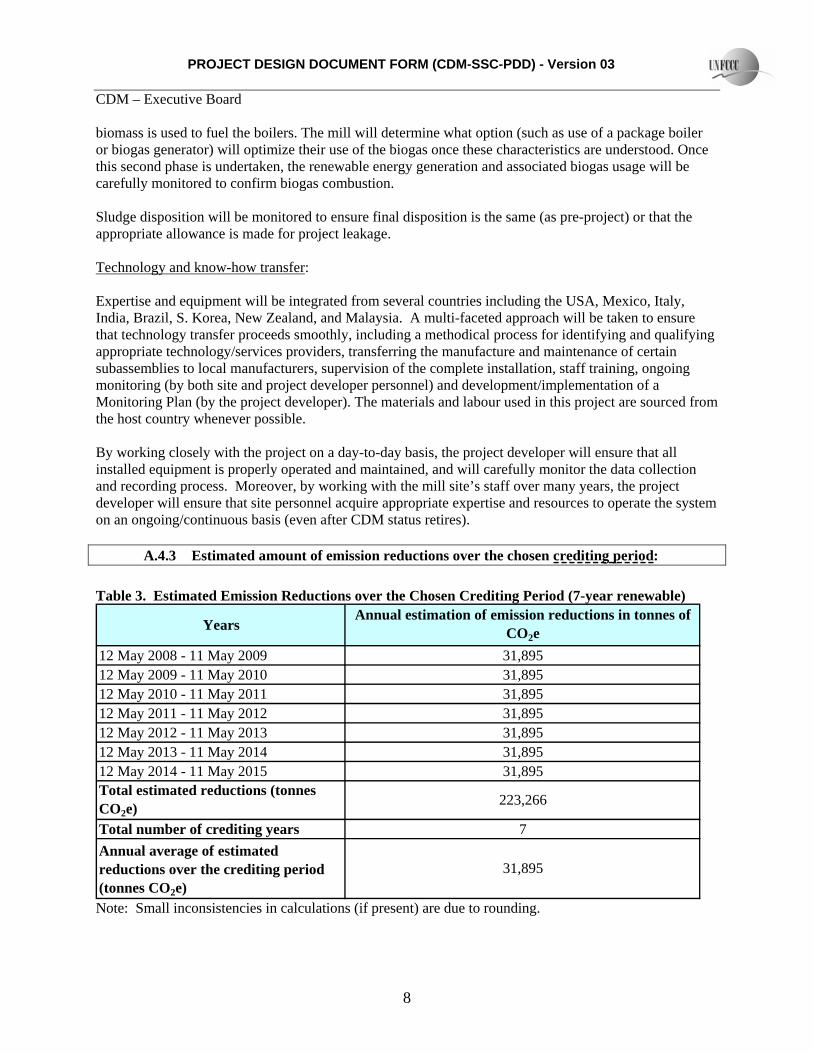
A.4.3 Estimated amount of emission reductions over the chosen crediting period:
Table 3. Estimated Emission Reductions over the Chosen Crediting Period (7-year renewable)
12 May 2014 - 11 May 201512 May 2013 - 11 May 201412 May 2012 - 11 May 201312 May 2011 - 11 May 2012
Total estimated reductions (tonnes CO2e)Total number of crediting yearsAnnual average of estimated reductions over the crediting period (tonnes CO2e)
Annual estimation of emission reductions in tonnes of CO2e
31,895
7
223,266
31,89531,895
Years
31,89531,89531,89531,895
12 May 2010 - 11 May 201112 May 2009 - 11 May 201012 May 2008 - 11 May 2009 31,895
Note: Small inconsistencies in calculations (if present) are due to rounding.

PROJECT DESIGN DOCUMENT FORM (CDM-SSC-PDD) - Version 03 CDM – Executive Board
9
A.4.4. Public funding of the small-scale project activity:
There is no official development assistance being provided for this project.
A.4.5. Confirmation that the small-scale project activity is not a debundled component of a large scale project activity:
A proposed small-scale project activity shall be deemed to be a de-bundled component of a large project activity if there is a registered small-scale CDM project activity or an application to register another small-scale CDM project activity:
• With the same project participants, • In the same project category and technology/measure; and • Registered within the previous two years; and • Whose project boundary is within 1 km of the project boundary of the proposed small-scale
activity at the closest point.
At this site, there are no other SSC CDM project activities registered, or applied for registration, with the same project participants.
SECTION B. Application of a baseline and monitoring methodology B.1. Title and reference of the approved baseline and monitoring methodology applied to the small-scale project activity:
The project follows the AMS III H small scale methodology for Methane Recovery in Wastewater Treatment, Version 6, Scope 13, applicable as of the 33rd meeting of the CDM Executive Board.
The project qualifies as a small scale project because total annual project emission reductions will not exceed 60 kt CO2e. ( Justification of the choice of the project category: The project proposes to introduce methane recovery and combustion to an existing wastewater treatment system, in this case, a system of anaerobic and facultative lagoons at an oil palm processing facility. This fits the methodology’s applicability criterion option iv:
iv. Introduction of methane recovery and combustion to an existing anaerobic wastewater treatment system such as anaerobic reactor, lagoon, septic tank or an on site industrial plant.
The CDM project will add sealed lagoon covers (to the two anaerobic lagoons), gas distribution, combustion and measurement systems. Absent the proposed project activity, methane from the existing system of lagoons would continue to be emitted into the atmosphere.
GHG emissions calculations can be determined using a combination of internationally accepted IPCC guidance and direct measurements. Based on historical oil palm Fresh Fruit Bunch (FFB) processing rates and baseline calculations, the estimated emission reductions of the project activity will not exceed 60 Kt CO2e in any year of the crediting period as shown in Table 3 of Section A.4.3.
PROJECT DESIGN DOCUMENT FORM (CDM-SSC-PDD) - Version 03 CDM – Executive Board
10
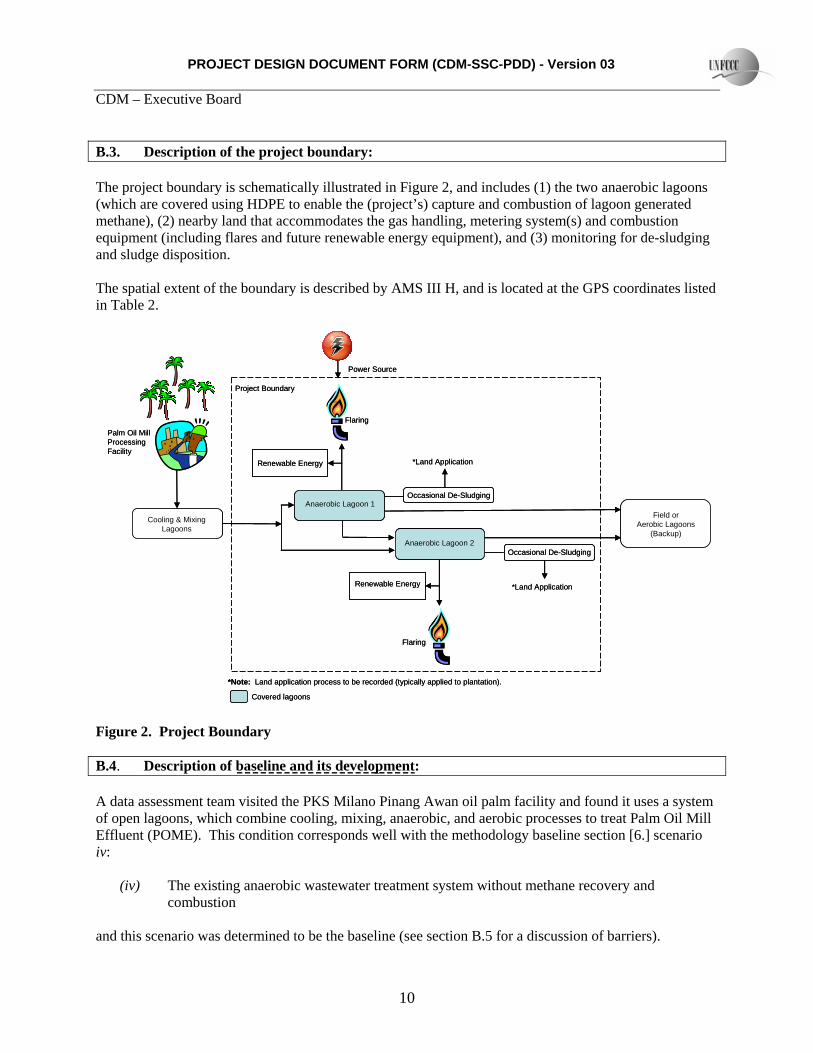
B.3. Description of the project boundary: The project boundary is schematically illustrated in Figure 2, and includes (1) the two anaerobic lagoons (which are covered using HDPE to enable the (project’s) capture and combustion of lagoon generated methane), (2) nearby land that accommodates the gas handling, metering system(s) and combustion equipment (including flares and future renewable energy equipment), and (3) monitoring for de-sludging and sludge disposition. The spatial extent of the boundary is described by AMS III H, and is located at the GPS coordinates listed in Table 2.
Palm Oil Mill Processing Facility
Anaerobic Lagoon 1
Anaerobic Lagoon 2
Flaring
Project Boundary
Power Source
Occasional De-Sludging
Cooling & Mixing Lagoons
*Land Application
*Note: Land application process to be recorded (typically applied to plantation).
Covered lagoons
Renewable Energy
Field or Aerobic Lagoons
(Backup)
Occasional De-Sludging
*Land Application
Renewable Energy
Flaring
Palm Oil Mill Processing Facility
Anaerobic Lagoon 1Anaerobic Lagoon 1
Anaerobic Lagoon 2Anaerobic Lagoon 2
Flaring
Project Boundary
Power Source
Occasional De-Sludging
Cooling & Mixing Lagoons
*Land Application
*Note: Land application process to be recorded (typically applied to plantation).
Covered lagoons
Renewable Energy
Field or Aerobic Lagoons
(Backup)
Occasional De-Sludging
*Land Application
Renewable Energy
Flaring
Figure 2. Project Boundary B.4. Description of baseline and its development: A data assessment team visited the PKS Milano Pinang Awan oil palm facility and found it uses a system of open lagoons, which combine cooling, mixing, anaerobic, and aerobic processes to treat Palm Oil Mill Effluent (POME). This condition corresponds well with the methodology baseline section [6.] scenario iv:
(iv) The existing anaerobic wastewater treatment system without methane recovery and combustion
and this scenario was determined to be the baseline (see section B.5 for a discussion of barriers).
PROJECT DESIGN DOCUMENT FORM (CDM-SSC-PDD) - Version 03 CDM – Executive Board
11
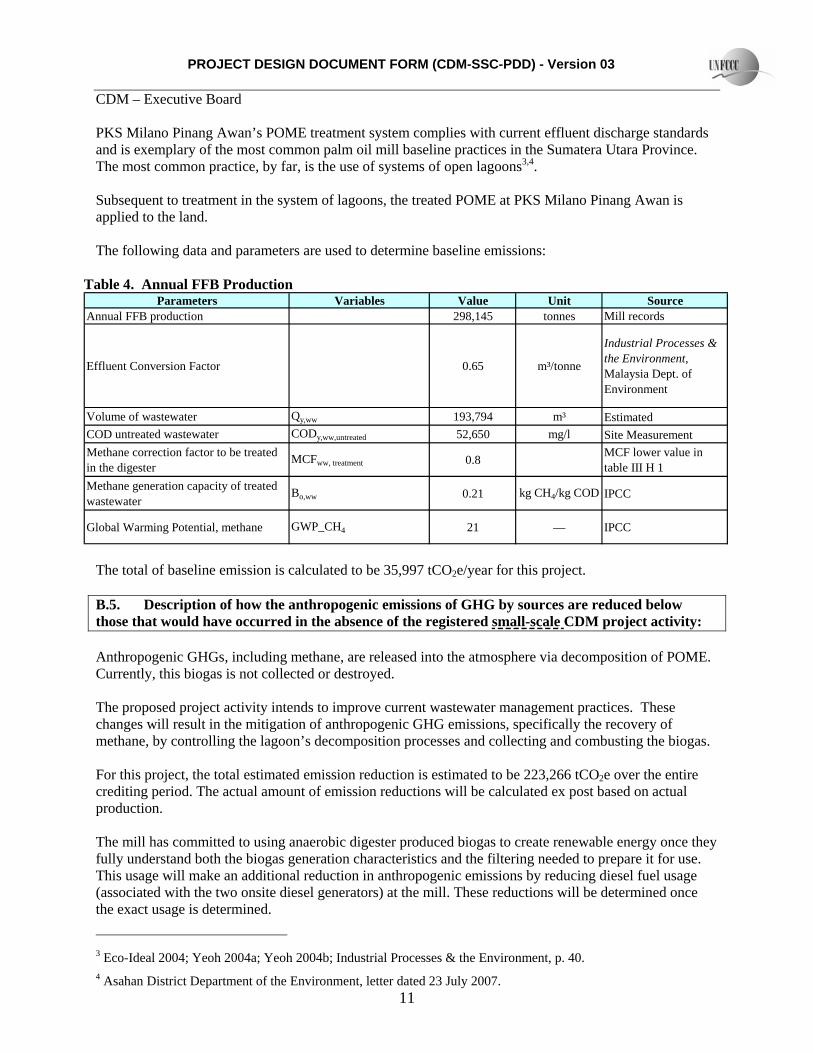
PKS Milano Pinang Awan’s POME treatment system complies with current effluent discharge standards and is exemplary of the most common palm oil mill baseline practices in the Sumatera Utara Province. The most common practice, by far, is the use of systems of open lagoons3,4. Subsequent to treatment in the system of lagoons, the treated POME at PKS Milano Pinang Awan is applied to the land. The following data and parameters are used to determine baseline emissions:
Table 4. Annual FFB Production Parameters Variables Value Unit Source
Annual FFB production 298,145 tonnes Mill records
Effluent Conversion Factor 0.65 m³/tonne
Industrial Processes & the Environment, Malaysia Dept. of Environment
Volume of wastewater Qy,ww 193,794 m³ EstimatedCOD untreated wastewater CODy,ww,untreated 52,650 mg/l Site MeasurementMethane correction factor to be treated in the digester
MCFww, treatment 0.8 MCF lower value in table III H 1
Methane generation capacity of treated wastewater
Bo,ww 0.21 kg CH4/kg COD IPCC
Global Warming Potential, methane GWP_CH4 21 — IPCC
The total of baseline emission is calculated to be 35,997 tCO2e/year for this project. B.5. Description of how the anthropogenic emissions of GHG by sources are reduced below those that would have occurred in the absence of the registered small-scale CDM project activity: Anthropogenic GHGs, including methane, are released into the atmosphere via decomposition of POME. Currently, this biogas is not collected or destroyed. The proposed project activity intends to improve current wastewater management practices. These changes will result in the mitigation of anthropogenic GHG emissions, specifically the recovery of methane, by controlling the lagoon’s decomposition processes and collecting and combusting the biogas. For this project, the total estimated emission reduction is estimated to be 223,266 tCO2e over the entire crediting period. The actual amount of emission reductions will be calculated ex post based on actual production. The mill has committed to using anaerobic digester produced biogas to create renewable energy once they fully understand both the biogas generation characteristics and the filtering needed to prepare it for use. This usage will make an additional reduction in anthropogenic emissions by reducing diesel fuel usage (associated with the two onsite diesel generators) at the mill. These reductions will be determined once the exact usage is determined.
3 Eco-Ideal 2004; Yeoh 2004a; Yeoh 2004b; Industrial Processes & the Environment, p. 40. 4 Asahan District Department of the Environment, letter dated 23 July 2007.

PROJECT DESIGN DOCUMENT FORM (CDM-SSC-PDD) - Version 03 CDM – Executive Board
12
There are no existing, pending, or planned national regulatory requirements that govern GHG emissions from agro-industry operations (specifically, palm oil mill processing activities) as outlined in this PDD. The project participants have solicited information regarding this issue during conversations with local and state government officials and through legal representation and have determined there is no regulatory impetus for producers to upgrade current wastewater treatment systems beyond the recommended open air anaerobic lagoon. The following paragraphs discuss the Indonesia palm oil industry and how conditions hinder changes in current practices. Assessment of barriers: Absent CDM project activities, the proposed project activity has not been adopted on either a national or worldwide scale due to the following barriers: • Financial/Investment Barriers: This wastewater treatment approach is considered one of the most
advanced systems in the world. In only a few countries have producers implemented such technology on a widespread basis because of high associated materials and ongoing maintenance costs compared to other types of systems. Though costs vary according to required lagoon size and other factors, initial costs to install an anaerobic digester system can run in the tens of thousands of US dollars, while total system costs can exceed $1 million5. Cost estimates and IRR are provided under separate cover.
Within any industry, producers have to focus on being competitive; Indonesian palm oil mills face the same economic challenges as producers in other nations due to increased worldwide production and the challenge of maximizing operating margins. Mill owners focus on the bottom line. Odour benefits, potential water quality enhancements, and the incremental savings associated with using biogas to create energy are rarely enough to compel owners to upgrade to an (expensive) advanced treatment system. Unless the treatment upgrade activity affords the producer the means to (partially) offset the practice change cost (via the sale of Certified Emission Reduction (CER) credits, for instance) the prevailing practice will remain the common method of wastewater treatment – and all effluent system biogas (including GHGs) will continue to be emitted.
• Technology barriers: Anaerobic digester systems have to be sized to handle projected effluent volumes with a Hydraulic Retention Time (HRT) consistent with extracting all methane from the POME. These systems become progressively more expensive on a ‘per cubic meter’ basis as production is decreased. Moreover, operations and maintenance requirements involved with this technology, including the means to maintain pond circulation (once they’re covered), maintaining biochemical equilibrium within the digester(s) and a detailed monitoring (including equipment and material maintenance ) program to maintain system performance levels must also be considered6. There is a need for skilled and experienced operators and the availability of such personnel locally is limited as such biogas systems are still relatively rare. Worldwide, few anaerobic digesters have achieved successful long-term operations, due primarily to inappropriate operations and maintenance.
• Barrier due to prevailing practice: The current lagoon-based treatment system is considered the
standard operating practice in palm oil mills in Indonesia while the proposed project activity is not. Despite numerous changes to maximum discharge standards over the years, the combination of anaerobic lagoons and aerobic/facultative lagoons has been able to meet the current permitted discharge levels for land application and waterway discharge. The highest wastewater management
5 http://www.mrec.org/pubs/25145.pdf 6 http://www.mrec.org/biogas/adgpg.pdf p.39-42.
PROJECT DESIGN DOCUMENT FORM (CDM-SSC-PDD) - Version 03 CDM – Executive Board
13
priority for most palm oil mills is to simply maintain compliance with local effluent discharge regulations.
While past practices cannot predict future events, it is worth noting that the site included in this project activity has been in existence for many years, during which time the prevailing wastewater management practice was open lagoons. Therefore, the baseline scenario should be the current practice for this project.
• Other barriers: Other common barriers include legal, social and business culture.
Legal: Legal barriers are considered ‘absolute’ - because illegal options can not be the baseline. For instance, direct release of wastewater into the nearby water bodies is not permitted and is illegal; therefore this option cannot be considered. There is no legal barrier to this project, as it does not adversely affect any of the environmental regulations, either existing or pending. Social: There are no general social barriers for this kind of project. The proposed project creates no socially unacceptable products and working with the system challenges no cultural or religious views. Business Culture: The PKS Milano Pinang Awan owners have applied a careful and rigorous business view to the overall project and have determined not to use the biogas for other purposes (such as energy generation or offset) until they have seen the system operate for a year or two and gain comfort with the supply/reliability of the biogas. They are supportive of the CDM project goals, however, and agreed to be a host site for such a project. Moreover, they have agreed to eventually use the biogas in some form of renewable energy, such as cogeneration, creating heat/steam, or to modify the existing biomass burner(s) to use a combination of both site produced biomass (such as kernels) and biogas.
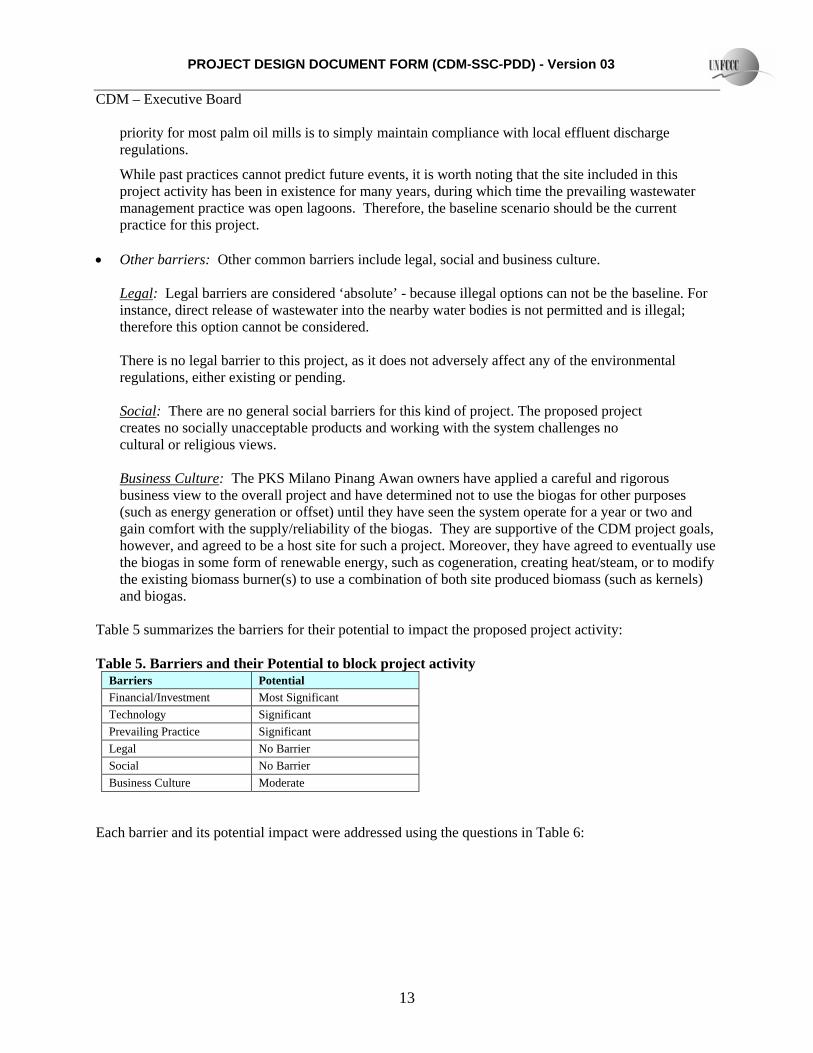
Table 5 summarizes the barriers for their potential to impact the proposed project activity: Table 5. Barriers and their Potential to block project activity
Barriers Potential Financial/Investment Most Significant Technology Significant Prevailing Practice Significant Legal No Barrier Social No Barrier Business Culture Moderate
Each barrier and its potential impact were addressed using the questions in Table 6:

PROJECT DESIGN DOCUMENT FORM (CDM-SSC-PDD) - Version 03 CDM – Executive Board
14
Table 6. Barrier Test Framework
Barrier Potential baseline options
Direct release
Aerobic system
Business as usual Biogas Compost
** Y: Barrier exists N: Barrier does not exist NA: Question is not relevant (Y): Changing
Financial/Investment
Is the technology intervention financially less attractive in comparison to other technologies (taking into account potentially available subsidies, soft loans or tax windows)?
NA Y N Y Y
Is local equity participation difficult to find? NA Y N Y Y
Is international equity participation difficult to find? NA NA NA NA NA
Are site owners/project beneficiaries carrying any risk? NA Y N Y Y
Technology
Is technology option currently difficult to purchase through local equipment suppliers? NA Y N Y N
Are local skills and labor to operationalize and maintain this technology insufficient? NA Y N (Y) (Y)
Is this technology outside common practice in similar industries in the country? NA Y N Y Y
Is performance certainty not guaranteed with tolerance limits NA N N N N
Is there real or perceived risk associated with the technology? NA Y N Y Y
Legal
Does the practice violate host country laws or regulations or is it in non-compliance? Y N N N N
Social
Is the understanding of the technology low in the host country/industry considered? NA Y N Y Y
Business Culture
Is there a reluctance to change to alternative management practices in the absence of regulation? NA Y N Y Y
Others
Is there lack of experience in applying the technologies? NA Y N Y Y
B.6. Emission reductions: B.6.1. Explanation of methodological choices: Baseline Emissions
The project follows the AMS III H small scale methodology for Methane Recovery in Wastewater Treatment, Version 6, Scope 13, applicable as of EB 33.

PROJECT DESIGN DOCUMENT FORM (CDM-SSC-PDD) - Version 03 CDM – Executive Board
15
The baseline was found to correspond to methodology section 6 option iv:
(iv) The existing anaerobic wastewater treatment system without methane recovery and combustion
and Total Baseline Emissions are calculated as follows:
BEy = (MEPy,ww,treatment + MEPy,s,treatment ) * GWP_CH4 Equation B1
Where:
MEPy,ww,treatment = Methane emission potential of the wastewater treatment system in the year y (measured in tonnes)
MEPy,s,treatment = Methane emission potential of the untreated sludge in the year y (tonnes) GWP_CH4 = Global Warming Potential of methane (value of 21 is used)
Step 1 – Calculate open lagoon baseline emissions The baseline emissions from the lagoons are estimated based on the Chemical Oxygen Demand (COD) of the POME that would enter the lagoons in the absence of the project activity, the maximum methane producing capacity of wastewater (Bo) and a Methane Conversion Factor (MCF) that expresses what proportion of the effluent would be anaerobically digested in the open lagoons.
MEPy,ww,treatment = Qy,ww *CODy,ww,untreated *Bo,ww * MCFww,treatment Equation B2
Where:
MEPy,ww,treatment = Methane emission potential of the wastewater treatment system in the year y, (tonnes)
Qy,ww = Volume of wastewater treated in the year y (m3/yr)
CODy,ww,untreated = Chemical Oxygen Demand of the wastewater entering the anaerobic treatment system in the year y (tonnes/m3)
Bo,ww = Methane generation capacity of the treated wastewater (0.21 kg CH4 /kg COD)7
MCFww, treatment = Methane correction factor for the existing wastewater treatment system to which the sequential anaerobic treatment step is being introduced (MCF lower value in Table III H 1)
7 The IPCC default value of 0.25 kg CH4/kg COD was corrected to take uncertainties into account.
PROJECT DESIGN DOCUMENT FORM (CDM-SSC-PDD) - Version 03 CDM – Executive Board
16
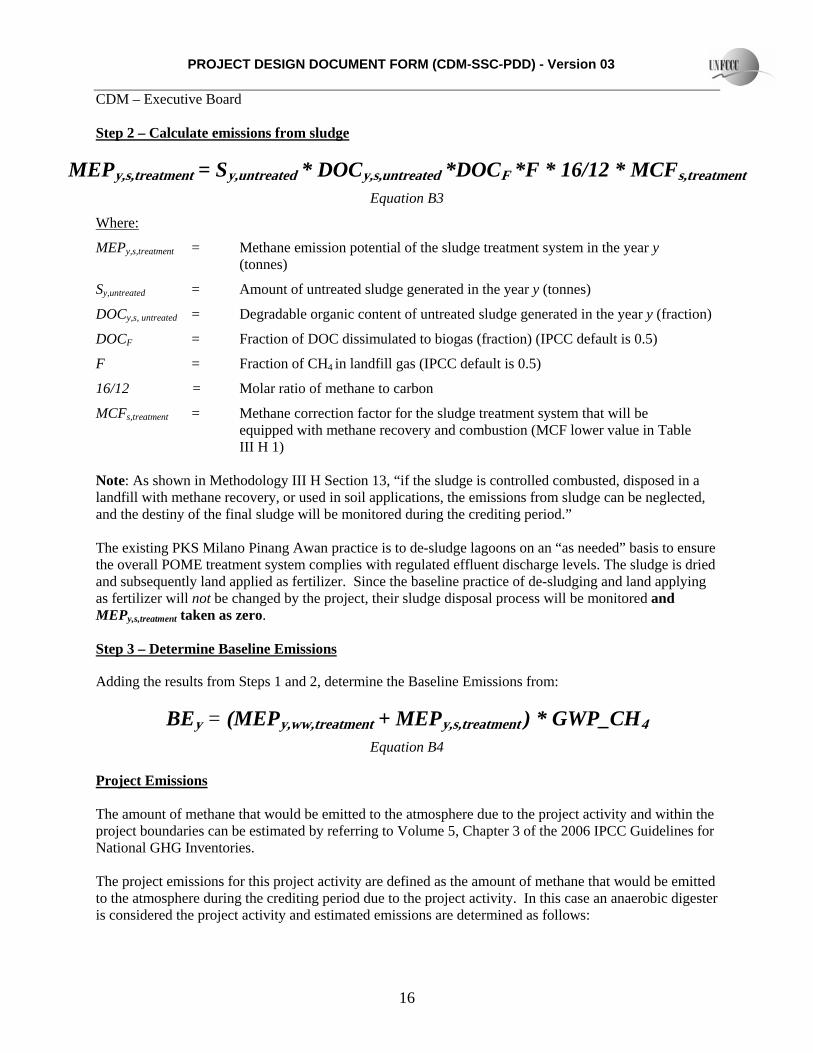
Step 2 – Calculate emissions from sludge
MEPy,s,treatment = Sy,untreated * DOCy,s,untreated *DOCF *F * 16/12 * MCFs,treatment Equation B3
Where:
MEPy,s,treatment = Methane emission potential of the sludge treatment system in the year y (tonnes)
Sy,untreated = Amount of untreated sludge generated in the year y (tonnes)
DOCy,s, untreated = Degradable organic content of untreated sludge generated in the year y (fraction)
DOCF = Fraction of DOC dissimulated to biogas (fraction) (IPCC default is 0.5)
F = Fraction of CH4 in landfill gas (IPCC default is 0.5)
16/12 = Molar ratio of methane to carbon
MCFs,treatment = Methane correction factor for the sludge treatment system that will be equipped with methane recovery and combustion (MCF lower value in Table
III H 1) Note: As shown in Methodology III H Section 13, “if the sludge is controlled combusted, disposed in a landfill with methane recovery, or used in soil applications, the emissions from sludge can be neglected, and the destiny of the final sludge will be monitored during the crediting period.” The existing PKS Milano Pinang Awan practice is to de-sludge lagoons on an “as needed” basis to ensure the overall POME treatment system complies with regulated effluent discharge levels. The sludge is dried and subsequently land applied as fertilizer. Since the baseline practice of de-sludging and land applying as fertilizer will not be changed by the project, their sludge disposal process will be monitored and MEPy,s,treatment taken as zero. Step 3 – Determine Baseline Emissions
Adding the results from Steps 1 and 2, determine the Baseline Emissions from:
BEy = (MEPy,ww,treatment + MEPy,s,treatment ) * GWP_CH4 Equation B4
Project Emissions The amount of methane that would be emitted to the atmosphere due to the project activity and within the project boundaries can be estimated by referring to Volume 5, Chapter 3 of the 2006 IPCC Guidelines for National GHG Inventories. The project emissions for this project activity are defined as the amount of methane that would be emitted to the atmosphere during the crediting period due to the project activity. In this case an anaerobic digester is considered the project activity and estimated emissions are determined as follows:
PROJECT DESIGN DOCUMENT FORM (CDM-SSC-PDD) - Version 03 CDM – Executive Board
17
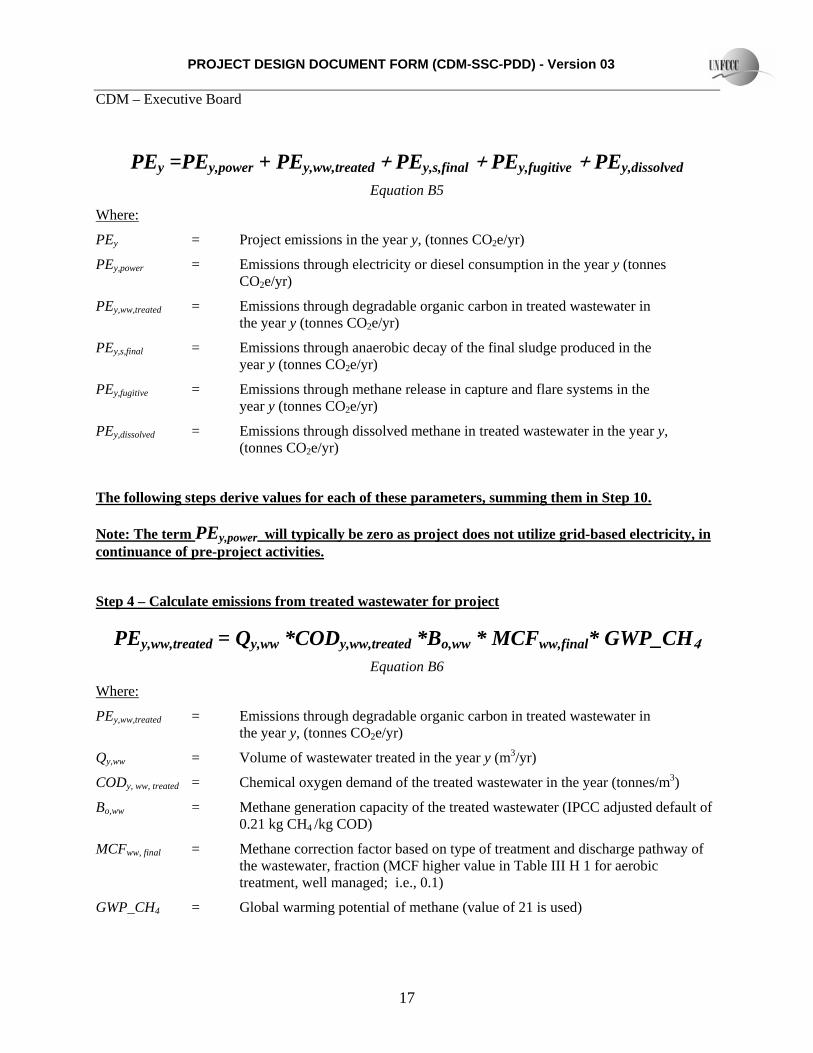
PEy =PEy,power + PEy,ww,treated + PEy,s,final + PEy,fugitive + PEy,dissolved
Equation B5
Where:
PEy = Project emissions in the year y, (tonnes CO2e/yr)
PEy,power = Emissions through electricity or diesel consumption in the year y (tonnes CO2e/yr)
PEy,ww,treated = Emissions through degradable organic carbon in treated wastewater in the year y (tonnes CO2e/yr)
PEy,s,final = Emissions through anaerobic decay of the final sludge produced in the year y (tonnes CO2e/yr)
PEy,fugitive = Emissions through methane release in capture and flare systems in the year y (tonnes CO2e/yr)
PEy,dissolved = Emissions through dissolved methane in treated wastewater in the year y, (tonnes CO2e/yr)
The following steps derive values for each of these parameters, summing them in Step 10.
Note: The term PEy,power will typically be zero as project does not utilize grid-based electricity, in continuance of pre-project activities.
Step 4 – Calculate emissions from treated wastewater for project
PEy,ww,treated = Qy,ww *CODy,ww,treated *Bo,ww * MCFww,final* GWP_CH4 Equation B6
Where:
PEy,ww,treated = Emissions through degradable organic carbon in treated wastewater in the year y, (tonnes CO2e/yr)
Qy,ww = Volume of wastewater treated in the year y (m3/yr)
CODy, ww, treated = Chemical oxygen demand of the treated wastewater in the year (tonnes/m3)
Bo,ww = Methane generation capacity of the treated wastewater (IPCC adjusted default of 0.21 kg CH4 /kg COD)
MCFww, final = Methane correction factor based on type of treatment and discharge pathway of the wastewater, fraction (MCF higher value in Table III H 1 for aerobic treatment, well managed; i.e., 0.1)
GWP_CH4 = Global warming potential of methane (value of 21 is used)

PROJECT DESIGN DOCUMENT FORM (CDM-SSC-PDD) - Version 03 CDM – Executive Board
18
Step 5 – Calculate total amount of organic material removed in lagoon system
PEy,s,final = Sy,final *DOCy,s,final *MCFs,final * DOCF*F*16/12* GWP_CH4 Equation B7
Where:
PEy,s,final = Methane emissions from the anaerobic decay of the final sludge generated in wastewater system in year y (tonnes CO2e/yr)
Sy,final = Amount of final sludge generated by the wastewater system in the year y (tonnes)
DOCy,s,final = Degradable organic content of the final sludge generated by wastewater treatment in the year y (fraction)
MCFs, final = Methane correction factor of the landfill that receives the final sludge, estimated as described in category AMS III G.
DOCF = Fraction of DOC dissimulated to biogas (IPCC default value is 0.5)
F = Fraction of CH4 in landfill gas (IPCC default value is 0.5)
16/12 = Molar ratio of methane to carbon
GWP_CH4 = Global warming potential of methane (value of 21 is used)
Note: Similar to Step 3, above, the value for PEy,s,final will be taken as zero because the existing practices for sludge disposition will continue unchanged in the project. During the project, sludge disposition will be verified.
Step 6 – Calculate fugitive emissions from capture and flare inefficiencies
PEy,fugitive,ww = (1-CFEww) *MEPy,ww,treatment *GWP_CH4 Equation B8
Where:
PEy,fugitive,ww = Fugitive emissions through capture and flare inefficiencies in the anaerobic wastewater treatment in year y (tonnes CO2e/yr)
CFEww = Capture and flare efficiency of the methane recovery and combustion equipment in the wastewater treatment
MEPy,ww,treatment = Methane emission potential of the wastewater treatment plant in the year y (tonnes)
GWP_CH4 = Global warming potential of methane (value of 21 is used)

PROJECT DESIGN DOCUMENT FORM (CDM-SSC-PDD) - Version 03 CDM – Executive Board
19
Step 7 – Calculate fugitive emissions from capture and flare inefficiencies in sludge treatment
PEy,fugitive,s = (1-CFEs) *MEPy,s,treatment *GWP_CH4 Equation B9
Where:
PEy,fugitive,s = Fugitive emissions through capture and flare inefficiencies in the sludge treatment in the year y (tonnes CO2e/yr)
CFEs = Capture and flare efficiency of the methane recovery and combustion equipment in the sludge treatment system
MEPy,s,treatment = Methane emission potential of the sludge treatment system in the year y (tonnes)
GWP_CH4 = Global warming potential of methane (value of 21 is used)
Step 8 – Calculate total fugitive emissions
PEy,fugitive = PEy,fugitive,ww + PEy,fugitive,s Equation B10
Where:
PEy,fugitive = Emissions through methane release in capture and flare systems in the year y (tonnes CO2e/yr)
PEy,fugitive,ww = Fugitive emissions through capture and flare inefficiencies in the anaerobic wastewater treatment in year y (tonnes CO2e/yr)
PEy,fugitive,s = Fugitive emissions through capture and flare inefficiencies in the anaerobic sludge treatment in year y (tonnes CO2e/yr)
Note: Similar to Step 3, above, the value for PEy,fugitive,s will be taken as zero because the existing practices for sludge disposition will continue unchanged in the project. During the project, sludge disposition will be verified.
Step 9 – Calculate emissions from methane dissolved in treated wastewater
PEy,dissolved =Qy,ww *[CH4] y,ww,treated * GWP_CH4 Equation B11
Where:
PEy,dissolved = Emissions through dissolved methane in treated wastewater in the year y (tonnes CO2e/yr)
Qy,ww = Volume of wastewater treated in the year y, (m3/yr)
PROJECT DESIGN DOCUMENT FORM (CDM-SSC-PDD) - Version 03 CDM – Executive Board
20
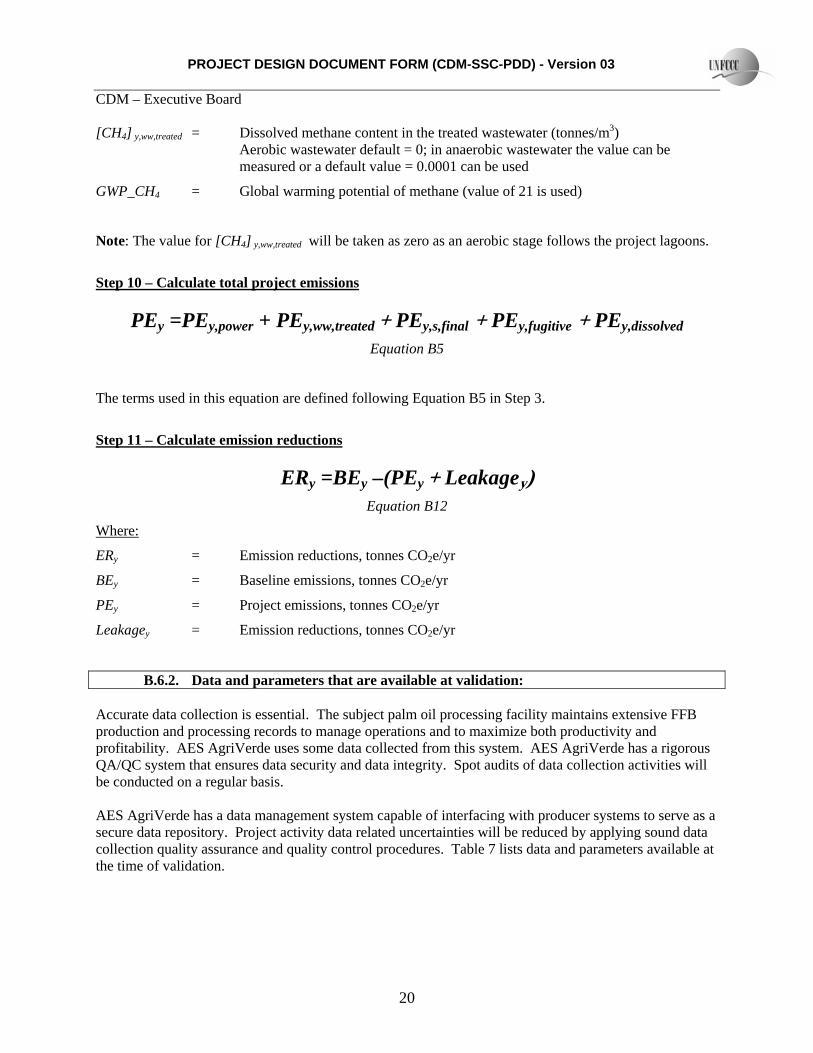
[CH4] y,ww,treated = Dissolved methane content in the treated wastewater (tonnes/m3) Aerobic wastewater default = 0; in anaerobic wastewater the value can be measured or a default value = 0.0001 can be used
GWP_CH4 = Global warming potential of methane (value of 21 is used)
Note: The value for [CH4] y,ww,treated will be taken as zero as an aerobic stage follows the project lagoons.
Step 10 – Calculate total project emissions
PEy =PEy,power + PEy,ww,treated + PEy,s,final + PEy,fugitive + PEy,dissolved
Equation B5
The terms used in this equation are defined following Equation B5 in Step 3.
Step 11 – Calculate emission reductions
ERy =BEy –(PEy + Leakagey) Equation B12
Where:
ERy = Emission reductions, tonnes CO2e/yr
BEy = Baseline emissions, tonnes CO2e/yr
PEy = Project emissions, tonnes CO2e/yr
Leakagey = Emission reductions, tonnes CO2e/yr
B.6.2. Data and parameters that are available at validation: Accurate data collection is essential. The subject palm oil processing facility maintains extensive FFB production and processing records to manage operations and to maximize both productivity and profitability. AES AgriVerde uses some data collected from this system. AES AgriVerde has a rigorous QA/QC system that ensures data security and data integrity. Spot audits of data collection activities will be conducted on a regular basis. AES AgriVerde has a data management system capable of interfacing with producer systems to serve as a secure data repository. Project activity data related uncertainties will be reduced by applying sound data collection quality assurance and quality control procedures. Table 7 lists data and parameters available at the time of validation.

PROJECT DESIGN DOCUMENT FORM (CDM-SSC-PDD) - Version 03 CDM – Executive Board
21
Table 7. Data / Parameter Values and References Data / Parameter: GWP CH4 Data unit: Description: Global Warming Potential of Methane Source of data used: Intergovernmental Panel on Climate Change, Climate Change 1995: The
Science of Climate Change (Cambridge, UK: Cambridge University Press, 1996)
Value applied: 21 Justification of the choice of data or description of measurement methods and procedures actually applied:
Comments: Data / Parameter: Bo,ww Data unit: kg CH4/kg COD Description: Methane producing capacity of the treated wastewater Source of data used: IPCC default value for domestic wastewater as cited in UNFCCC
AMS III H, V.6 methodology Value applied: 0.21 Justification of the choice of data or description of measurement methods and procedures actually applied:
Comments: Data / Parameter: MCFww,treatment Data unit: Fraction Description: Methane correction factor Source of data used: IPCC default value as cited in UNFCCC AMS III H, V.6 methodology Value applied: 0.8 for anaerobic deep lagoon (baseline) Justification of the choice of data or description of measurement methods and procedures actually applied:
Comments: Data / Parameter: MCFww,final Data unit: Fraction Description: Methane correction factor Source of data used: IPCC default value as cited in UNFCCC AMS III H, V.6 methodology Value applied: 1.0 for anaerobic digester with methane recovery (project) Justification of the choice of data or description of measurement methods and procedures actually applied:
Comments:

PROJECT DESIGN DOCUMENT FORM (CDM-SSC-PDD) - Version 03 CDM – Executive Board
22
Data / Parameter: MCFs,treatment Data unit: Fraction Description: Methane correction factor Source of data used: IPCC default value as cited in UNFCCC AMS III H, V.6 methodology Value applied: 0 for aerobic treatment, well managed (project and baseline) Justification of the choice of data or description of measurement methods and procedures actually applied:
Comments: Data / Parameter: CFEww Data unit: Description: Capture and flare efficiency of the methane recovery and combustion
equipment Source of data used: Default value specified in UNFCCC AMS III H., V.6 methodology, p.4 Value applied: 0.9 in wastewater treatment Justification of the choice of data or description of measurement methods and procedures actually applied:
Comments: Data / Parameter: Qy,ww Data unit: m3
Description: Volume of wastewater treated in the year y Source of data used: Calculated Value applied: 193,794 Justification of the choice of data or description of measurement methods and procedures actually applied:
Determined from FFB production data and site verified effluent conversion factor
Comments: Data / Parameter: CODy,ww, untreated Data unit: Tonnes/m3
Description: Chemical oxygen demand of the wastewater entering the anaerobic treatment reactor/system with methane capture in the year y
Source of data used: Site Data Value applied: 0.05265 Justification of the choice of data or description of measurement methods and procedures actually applied:
Comments:

PROJECT DESIGN DOCUMENT FORM (CDM-SSC-PDD) - Version 03 CDM – Executive Board
23
Data / Parameter: CODy,ww, treated Data unit: Tonnes/m3
Description: Chemical Oxygen Demand of the treated wastewater in the year y Source of data used: Site Data Value applied: 0.001115 Justification of the choice of data or description of measurement methods and procedures actually applied:
Comments:
Data / Parameter: CH4, y, ww, treated Data unit: Tonnes/m3
Description: Dissolved methane content in the treated wastewater Source of data used: Refer to UNFCCC AMS III H, V.6 methodology Value applied: 0.0001 Justification of the choice of data or description of measurement methods and procedures actually applied:
Comments: B.6.3 Ex-ante calculation of emission reductions:
Emission factors for the baseline are calculated as described in Section B.4. To estimate total yearly baseline methane emissions, the selected emission factors are calculated by determining the methane emission potential of untreated wastewater and untreated sludge. Table 8. Baseline Emissions (Methane shown in metric tonnes of CO2e)
1,7140
2135,997
Year 1 2 3 4 5 6 7Expected Growth%
0% 0% 0% 0% 0% 0% 0%
Baseline Emissions (CO2e/year)
35,997 35,997 35,997 35,997 35,997 35,997 35,997 251,980
Total
PKS Milano Pinang Awan
PKS Milano Pinang AwanMethane emission potential of untreated wastewater in tonnes CH4/yr (MEPy,ww,treatment)Methane emission potential of untreated sludge in tonnes CH4/yr (MEPy,s,treatment)Global warming potential of methane (GWP_CH4)
Total annual baseline emissions in tonnes of CO2e (BEy)
Note: Small inconsistencies in calculations (if present) are due to rounding. Emission factors for the project activity are calculated as described in Section B.6.1. To estimate total yearly project methane emissions, the types of emissions listed in Table 9 are summed.
PROJECT DESIGN DOCUMENT FORM (CDM-SSC-PDD) - Version 03 CDM – Executive Board
24
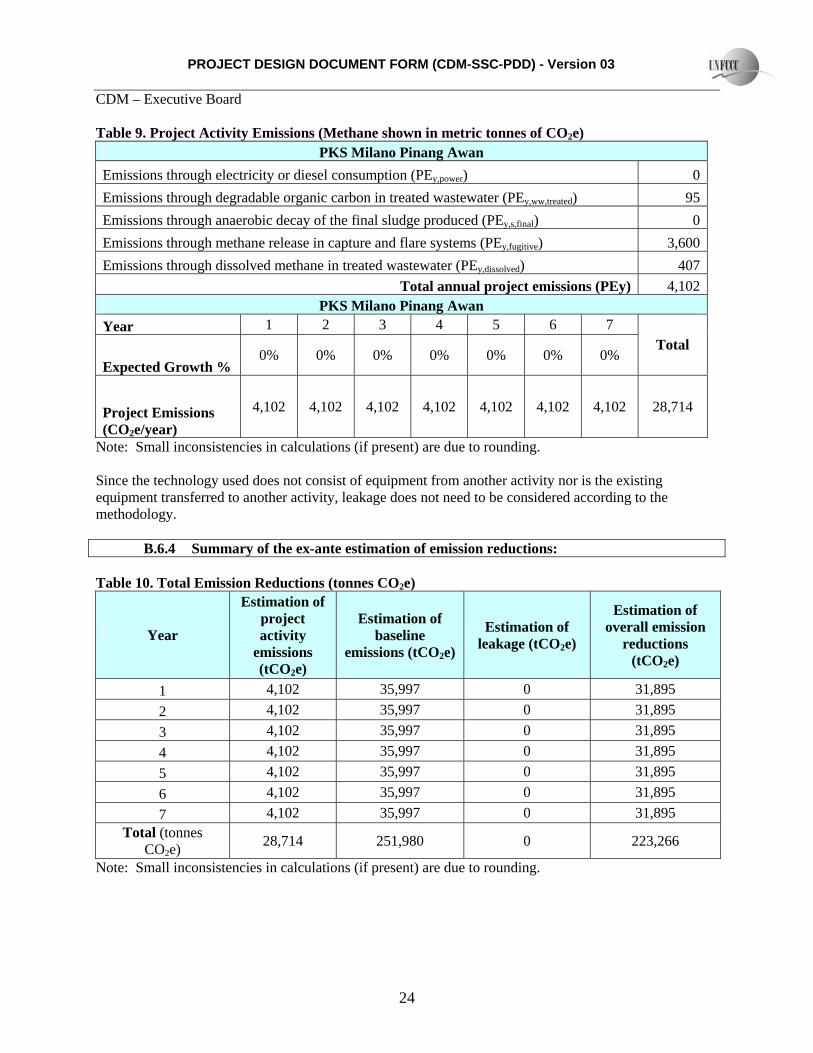
Table 9. Project Activity Emissions (Methane shown in metric tonnes of CO2e) PKS Milano Pinang Awan
Emissions through electricity or diesel consumption (PEy,power) 0Emissions through degradable organic carbon in treated wastewater (PEy,ww,treated) 95Emissions through anaerobic decay of the final sludge produced (PEy,s,final) 0Emissions through methane release in capture and flare systems (PEy,fugitive) 3,600Emissions through dissolved methane in treated wastewater (PEy,dissolved) 407
Total annual project emissions (PEy) 4,102PKS Milano Pinang Awan
Year 1 2 3 4 5 6 7
Expected Growth % 0% 0% 0% 0% 0% 0% 0%
Total
Project Emissions (CO2e/year)
4,102 4,102 4,102 4,102 4,102 4,102 4,102 28,714
Note: Small inconsistencies in calculations (if present) are due to rounding. Since the technology used does not consist of equipment from another activity nor is the existing equipment transferred to another activity, leakage does not need to be considered according to the methodology. B.6.4 Summary of the ex-ante estimation of emission reductions: Table 10. Total Emission Reductions (tonnes CO2e)
Year
Estimation of project activity
emissions (tCO2e)
Estimation of baseline
emissions (tCO2e)
Estimation of leakage (tCO2e)
Estimation of overall emission
reductions (tCO2e)
1 4,102 35,997 0 31,895 2 4,102 35,997 0 31,895 3 4,102 35,997 0 31,895 4 4,102 35,997 0 31,895 5 4,102 35,997 0 31,895 6 4,102 35,997 0 31,895 7 4,102 35,997 0 31,895
Total (tonnes CO2e) 28,714 251,980 0 223,266
Note: Small inconsistencies in calculations (if present) are due to rounding.
PROJECT DESIGN DOCUMENT FORM (CDM-SSC-PDD) - Version 03 CDM – Executive Board
25
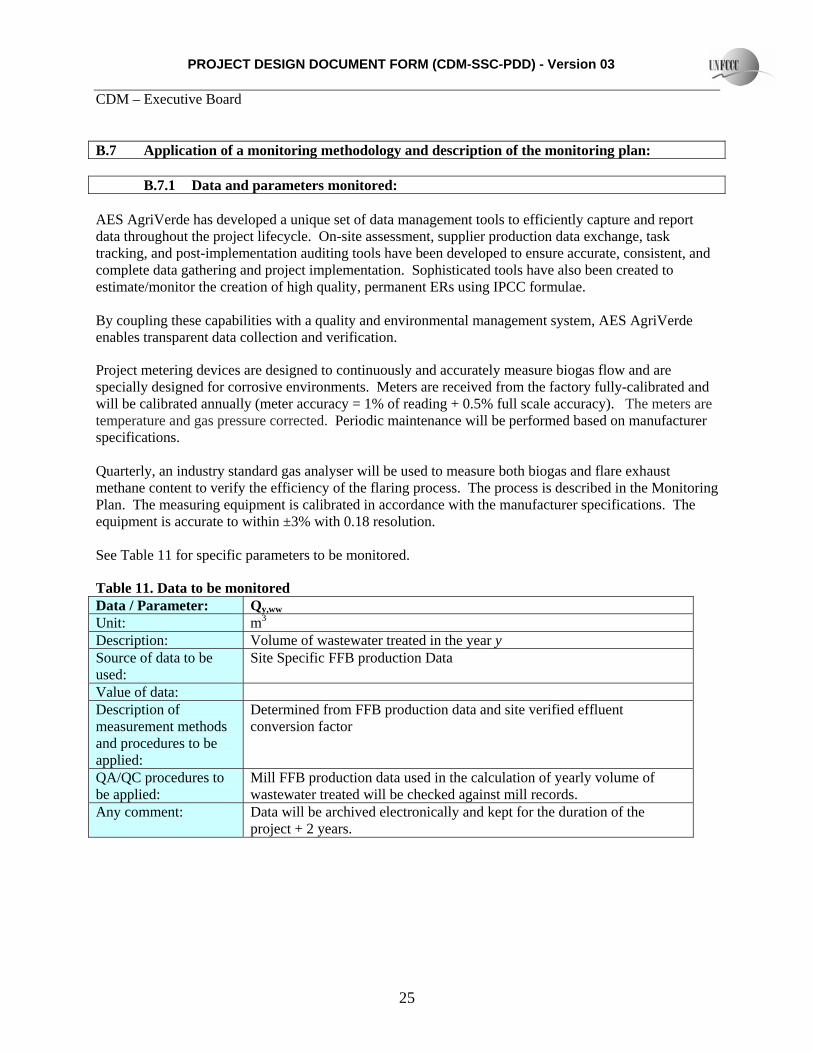
B.7 Application of a monitoring methodology and description of the monitoring plan: B.7.1 Data and parameters monitored: AES AgriVerde has developed a unique set of data management tools to efficiently capture and report data throughout the project lifecycle. On-site assessment, supplier production data exchange, task tracking, and post-implementation auditing tools have been developed to ensure accurate, consistent, and complete data gathering and project implementation. Sophisticated tools have also been created to estimate/monitor the creation of high quality, permanent ERs using IPCC formulae. By coupling these capabilities with a quality and environmental management system, AES AgriVerde enables transparent data collection and verification.
Project metering devices are designed to continuously and accurately measure biogas flow and are specially designed for corrosive environments. Meters are received from the factory fully-calibrated and will be calibrated annually (meter accuracy = 1% of reading + 0.5% full scale accuracy). The meters are temperature and gas pressure corrected. Periodic maintenance will be performed based on manufacturer specifications. Quarterly, an industry standard gas analyser will be used to measure both biogas and flare exhaust methane content to verify the efficiency of the flaring process. The process is described in the Monitoring Plan. The measuring equipment is calibrated in accordance with the manufacturer specifications. The equipment is accurate to within ±3% with 0.18 resolution. See Table 11 for specific parameters to be monitored.
Table 11. Data to be monitored Data / Parameter: Qy,ww
Unit: m3
Description: Volume of wastewater treated in the year y Source of data to be used:
Site Specific FFB production Data
Value of data: Description of measurement methods and procedures to be applied:
Determined from FFB production data and site verified effluent conversion factor
QA/QC procedures to be applied:
Mill FFB production data used in the calculation of yearly volume of wastewater treated will be checked against mill records.
Any comment: Data will be archived electronically and kept for the duration of the project + 2 years.

PROJECT DESIGN DOCUMENT FORM (CDM-SSC-PDD) - Version 03 CDM – Executive Board
26
Data / Parameter: CODy,ww,untreated
Unit: Tonnes/m3
Description: Chemical oxygen demand of the wastewater entering the anaerobic treatment system in the year y
Source of data to be used:
Data collected on the AES AgriVerde Monitoring Form.
Value of data: Description of measurement methods and procedures to be applied:
Measured and recorded semi-annually
QA/QC procedures to be applied:
COD analysis of wastewater samples will be conducted in accordance to analysis equipment manufacturer’s specifications and will include blank and calibration standards.
Any comment: Data will be archived electronically and kept for the duration of the project + 2 years.
Data / Parameter: CODy,ww,treated
Unit: Tonnes/m3 Description: Chemical oxygen demand of the treated wastewater in the year y Source of data to be used:
Data collected on the AES AgriVerde Monitoring Form.
Value of data: Description of measurement methods and procedures to be applied:
Measured and recorded semi-annually
QA/QC procedures to be applied:
COD analysis of wastewater samples will be conducted in accordance to analysis equipment manufacturer’s specifications and will include blank and calibration standards.
Any comment: Data will be archived electronically and kept for the duration of the project + 2 years.
Data / Parameter: MCbiogas
Unit: Percentage Description: Methane content of biogas Source of data to be used:
Gas analyzer
Value of data: Description of measurement methods and procedures to be applied:
Measured and recorded quarterly. The measuring equipment is calibrated in accordance with the manufacturer specifications. Sufficient measurements will be made to meet a 95% confidence level.
QA/QC procedures to be applied:
Use and calibration of the methane analyzer will be conducted in accordance with manufacturer’s standards. A calibration/service log will be maintained for each methane analyzer.
Any comment: Data will be archived electronically or on paper and kept for the duration of the project + 2 years.

PROJECT DESIGN DOCUMENT FORM (CDM-SSC-PDD) - Version 03 CDM – Executive Board
27
Data / Parameter: CFEww Unit: Percentage Description: Efficiency of flaring process Source of data to be used:
Refer to UNFCCC AMS III H, V.6 methodology
Value of data: 0.90 Description of measurement methods and procedures to be applied:
Flares shall be operated in accordance with manufacturer specifications. Flare combustion temperature and biogas flow rate data will be recorded more frequently than hourly. If in any specific hour either of these parameters is out of specification, a flare efficiency of 50% will be used for this specific hour. If at any given time the temperature of the flare is below 500oC, 0% efficiency will be used for this period. Provided these parameters are within specification, a value of 0.9 shall be used.
QA/QC procedures to be applied:
All flare monitoring equipment will be operated and calibrated according to manufacturer’s specifications. Flare temperature and biogas flow data will be compiled and analyzed using software. Electronic flare monitoring data will be stored for the duration of the project + years.
Any comment: Data will be archived electronically or on paper and kept for the duration of the project + 2 years.
Data / Parameter: BGPFlare
Unit: m3
Description: Amount of biogas recovered and directed to flare for combustion Source of data to be used:
Continuous flow meter
Value of data: Description of measurement methods and procedures to be applied:
Measured continuously and recorded quarterly
QA/QC procedures to be applied:
AES AgriVerde employs an internal QA audit process that ensures monitoring activities are conducted in accordance with the monitoring plan and verifies the accuracy of data reported.
Any comment: Data will be archived electronically or on paper and kept for the duration of the project + 2 years.
PROJECT DESIGN DOCUMENT FORM (CDM-SSC-PDD) - Version 03 CDM – Executive Board
28
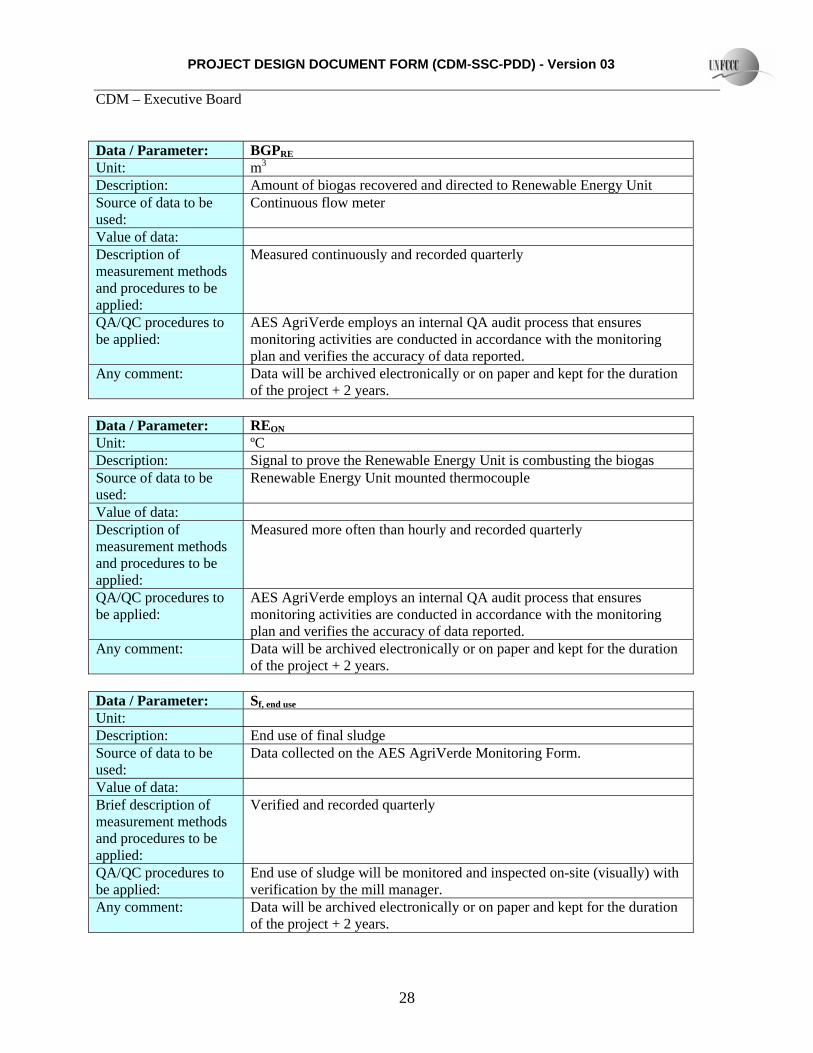
Data / Parameter: BGPRE
Unit: m3
Description: Amount of biogas recovered and directed to Renewable Energy Unit Source of data to be used:
Continuous flow meter
Value of data: Description of measurement methods and procedures to be applied:
Measured continuously and recorded quarterly
QA/QC procedures to be applied:
AES AgriVerde employs an internal QA audit process that ensures monitoring activities are conducted in accordance with the monitoring plan and verifies the accuracy of data reported.
Any comment: Data will be archived electronically or on paper and kept for the duration of the project + 2 years.
Data / Parameter: REON
Unit: ºC
Description: Signal to prove the Renewable Energy Unit is combusting the biogas Source of data to be used:
Renewable Energy Unit mounted thermocouple
Value of data: Description of measurement methods and procedures to be applied:
Measured more often than hourly and recorded quarterly
QA/QC procedures to be applied:
AES AgriVerde employs an internal QA audit process that ensures monitoring activities are conducted in accordance with the monitoring plan and verifies the accuracy of data reported.
Any comment: Data will be archived electronically or on paper and kept for the duration of the project + 2 years.
Data / Parameter: Sf, end use Unit:
Description: End use of final sludge Source of data to be used:
Data collected on the AES AgriVerde Monitoring Form.
Value of data: Brief description of measurement methods and procedures to be applied:
Verified and recorded quarterly
QA/QC procedures to be applied:
End use of sludge will be monitored and inspected on-site (visually) with verification by the mill manager.
Any comment: Data will be archived electronically or on paper and kept for the duration of the project + 2 years.

PROJECT DESIGN DOCUMENT FORM (CDM-SSC-PDD) - Version 03 CDM – Executive Board
29
B.7.2 Description of the monitoring plan: A complete set of procedures and a Monitoring Plan (see Annex 4) has been developed to ensure that accurate and relevant measurements and observations are made to document palm oil mill production metrics, project biogas production and equipment operation, including possible sources of sludge, emissions and leakage. This plan meets the requirements outlined in the approved methodology as shown in Appendix B of the simplified modalities and procedures for small-scale CDM project activities as it applies to the proposed project activity.
AES AgriVerde has established a dedicated regional O&M staff to perform activities including but not limited to monitoring and collection of parameters, quality audits, personnel training, palm oil mill staff training and equipment inspections. The associated Monitoring Plan has been developed to provide guidance (work instructions) to individuals that collect and/or process data. AES AgriVerde staff will perform audits of Operations personnel on a regular basis to ensure integrity in the data collection and handling process. B.8 Date of completion of the application of the baseline and monitoring methodology and the name of the responsible person(s)/entity(ies) The final draft of the application of the methodology was completed on 18 September 2007 (18/09/2007). The entity determining the baseline and monitoring methodology is AES AgriVerde who is the project developer as well as a project participant. Contact information is listed in Annex 1. SECTION C. Duration of the project activity / crediting period C.1 Duration of the project activity: C.1.1. Starting date of the project activity: The starting date for this activity is 14 August 2007 (14/08/2007). C.1.2. Expected operational lifetime of the project activity: The expected life of this project is 22y – 8m. C.2 Choice of the crediting period and related information: The project activity will use a renewable crediting period. C.2.1. Renewable crediting period C.2.1.1. Starting date of the first crediting period:
The starting date of the crediting period is 12 May 2008 (12/05/2008).
PROJECT DESIGN DOCUMENT FORM (CDM-SSC-PDD) - Version 03 CDM – Executive Board
30
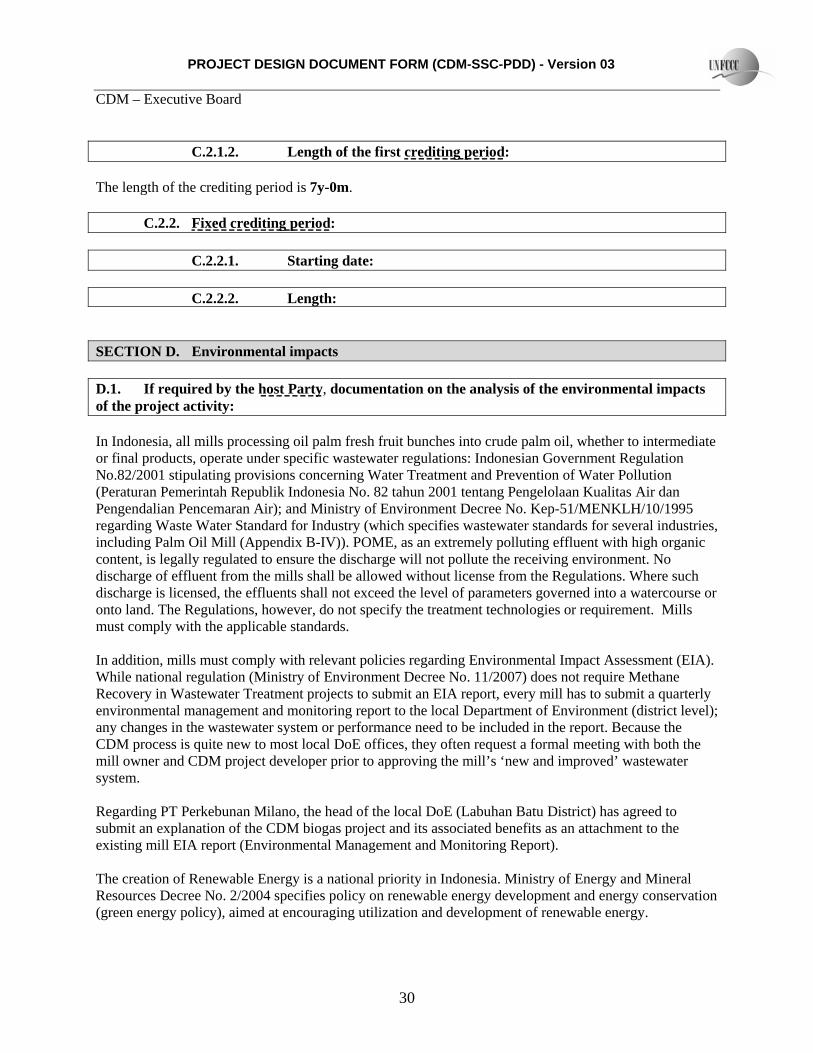
C.2.1.2. Length of the first crediting period: The length of the crediting period is 7y-0m. C.2.2. Fixed crediting period: C.2.2.1. Starting date: C.2.2.2. Length: SECTION D. Environmental impacts D.1. If required by the host Party, documentation on the analysis of the environmental impacts of the project activity: In Indonesia, all mills processing oil palm fresh fruit bunches into crude palm oil, whether to intermediate or final products, operate under specific wastewater regulations: Indonesian Government Regulation No.82/2001 stipulating provisions concerning Water Treatment and Prevention of Water Pollution (Peraturan Pemerintah Republik Indonesia No. 82 tahun 2001 tentang Pengelolaan Kualitas Air dan Pengendalian Pencemaran Air); and Ministry of Environment Decree No. Kep-51/MENKLH/10/1995 regarding Waste Water Standard for Industry (which specifies wastewater standards for several industries, including Palm Oil Mill (Appendix B-IV)). POME, as an extremely polluting effluent with high organic content, is legally regulated to ensure the discharge will not pollute the receiving environment. No discharge of effluent from the mills shall be allowed without license from the Regulations. Where such discharge is licensed, the effluents shall not exceed the level of parameters governed into a watercourse or onto land. The Regulations, however, do not specify the treatment technologies or requirement. Mills must comply with the applicable standards. In addition, mills must comply with relevant policies regarding Environmental Impact Assessment (EIA). While national regulation (Ministry of Environment Decree No. 11/2007) does not require Methane Recovery in Wastewater Treatment projects to submit an EIA report, every mill has to submit a quarterly environmental management and monitoring report to the local Department of Environment (district level); any changes in the wastewater system or performance need to be included in the report. Because the CDM process is quite new to most local DoE offices, they often request a formal meeting with both the mill owner and CDM project developer prior to approving the mill’s ‘new and improved’ wastewater system. Regarding PT Perkebunan Milano, the head of the local DoE (Labuhan Batu District) has agreed to submit an explanation of the CDM biogas project and its associated benefits as an attachment to the existing mill EIA report (Environmental Management and Monitoring Report). The creation of Renewable Energy is a national priority in Indonesia. Ministry of Energy and Mineral Resources Decree No. 2/2004 specifies policy on renewable energy development and energy conservation (green energy policy), aimed at encouraging utilization and development of renewable energy.

PROJECT DESIGN DOCUMENT FORM (CDM-SSC-PDD) - Version 03 CDM – Executive Board
31
Environment: There are no negative environmental impacts resulting from the proposed project activity. Beyond the principal benefit of mitigating GHG emissions (the primary focus of the proposed project), the proposed activity will also result in positive environmental co-benefits. They include a reduction in atmospheric emissions of Volatile Organics Compounds (VOCs) that cause odour and acid rain, and promotion of an improved, modernized image of the palm oil production industry. The combination of these factors will make the proposed project site more “neighbour friendly” and environmentally responsible. D.2. If environmental impacts are considered significant by the project participants or the host Party, please provide conclusions and all references to support documentation of an environmental impact assessment undertaken in accordance with the procedures as required by the host Party: No action required. SECTION E. Stakeholders’ comments E.1. Brief description how comments by local stakeholders have been invited and compiled: AES AgriVerde invited stakeholders to the PKS Milano Pinang Awan project site to explain both the UNFCCC CDM process and proposed project activity. This meeting was held on 14 August 2007 (14/08/2007) at the project site, Sumatera Utara, Indonesia. AES AgriVerde issued invitations to government officials at the federal, state, and local levels. Furthermore, AES AgriVerde published an announcement of the meeting in the local newspaper, which covers Labuhan Batu and surrounding districts. These public announcements appeared in:
1. Harian Mandiri on 6 August 2007 (06/08/2007).
All invitations were in the Indonesian Bahasa language. The meeting was attended by project participants, various members from the local community, and producer representatives. A full list of attendees and the meeting minutes are available on request. Mr. Adlin Tanjung, Secretary of District DoE (Bapedalda Labuhan Batu), officially opened the GSP meeting on behalf of the head of Bapedalda Labuhan Batu. He stressed 3 points: (1) this CDM Biogas Project at the palm oil mill is the first in the district, as well as in Indonesia, (2) the project will bring a positive impact for the local environment as well as the global environment, and (3) the project will be a pilot project and hopefully will be followed by other 42 mills in the district. Mark Leslie explained AES AgriVerde’s business role in the world, region and Indonesia for reducing carbon emissions, and AES AgriVerde’s on-going partnership with AgCert which has achieved significant regulatory experience through project work performed at over 1,000 sites. Dr. Haskarlianus Pasang of PT AES AgriVerde Indonesia gave a presentation addressing the following topics: the purpose of the stakeholder meeting, global warming and the Kyoto Protocol, UNFCCC CDM

PROJECT DESIGN DOCUMENT FORM (CDM-SSC-PDD) - Version 03 CDM – Executive Board
32
and Indonesia processes, project processes and responsibilities, project participants, equipment used for evaluation and audits, and the PT Perkebunan Milano – PKS Milano Pinang Awan CDM Project, including benefits of the project (social, environmental, economic and technology), and where to get further information.
Figure 3. Presentations at the PKS Milano Pinang Awan Stakeholder’s Meeting
Figure 4. PKS Milano Pinang Awan Stakeholder’s Meeting
PROJECT DESIGN DOCUMENT FORM (CDM-SSC-PDD) - Version 03 CDM – Executive Board
33
E.2. Summary of the comments received: After the presentations, attendees were afforded the opportunity to ask questions regarding the proposed project activities. Overall, the comments from the attendees at the stakeholders’ meeting were positive and supportive of the project. Additional comments are available in the Stakeholder’s Meeting Minutes document. E.3. Report on how due account was taken of any comments received:
No action required. A summary of comments, questions and answers is available.
PROJECT DESIGN DOCUMENT FORM (CDM-SSC-PDD) - Version 03 CDM – Executive Board
34
Annex 1
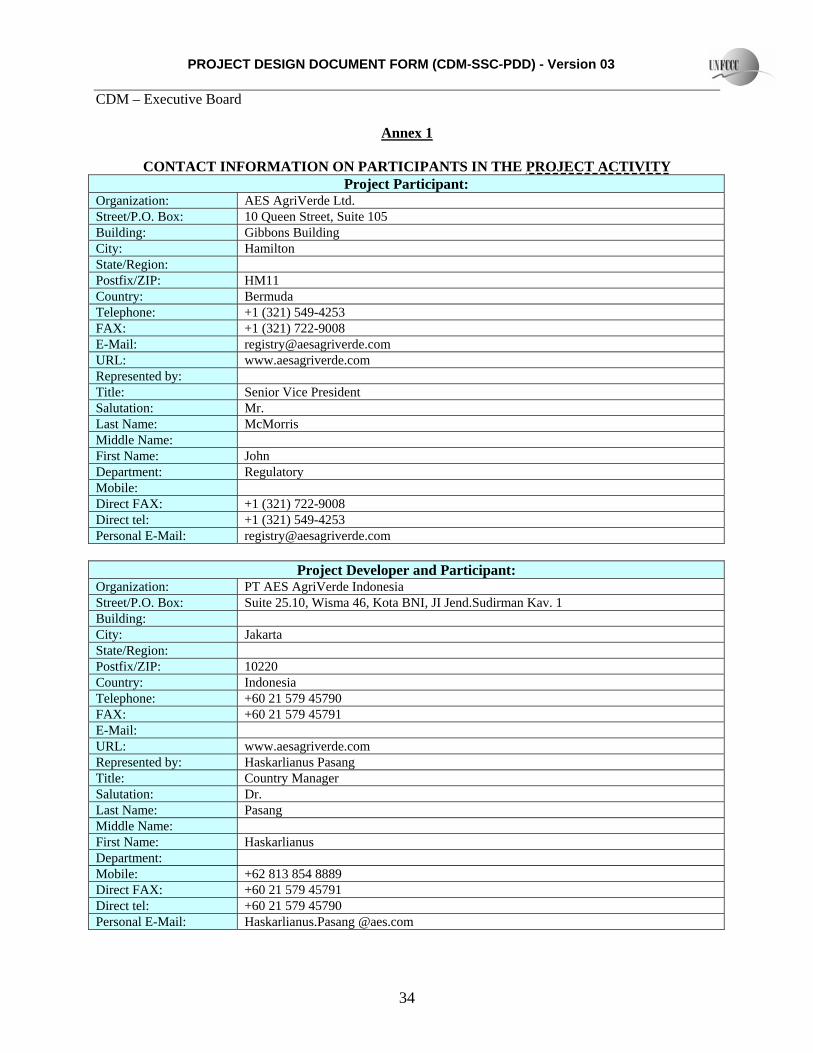
CONTACT INFORMATION ON PARTICIPANTS IN THE PROJECT ACTIVITY Project Participant:
Organization: AES AgriVerde Ltd. Street/P.O. Box: 10 Queen Street, Suite 105 Building: Gibbons Building City: Hamilton State/Region: Postfix/ZIP: HM11 Country: Bermuda Telephone: +1 (321) 549-4253 FAX: +1 (321) 722-9008 E-Mail: [email protected] URL: www.aesagriverde.com Represented by: Title: Senior Vice President Salutation: Mr. Last Name: McMorris Middle Name: First Name: John Department: Regulatory Mobile: Direct FAX: +1 (321) 722-9008 Direct tel: +1 (321) 549-4253 Personal E-Mail: [email protected]
Project Developer and Participant: Organization: PT AES AgriVerde Indonesia Street/P.O. Box: Suite 25.10, Wisma 46, Kota BNI, JI Jend.Sudirman Kav. 1 Building: City: Jakarta State/Region: Postfix/ZIP: 10220 Country: Indonesia Telephone: +60 21 579 45790 FAX: +60 21 579 45791 E-Mail: URL: www.aesagriverde.com Represented by: Haskarlianus Pasang Title: Country Manager Salutation: Dr. Last Name: Pasang Middle Name: First Name: Haskarlianus Department: Mobile: +62 813 854 8889 Direct FAX: +60 21 579 45791 Direct tel: +60 21 579 45790 Personal E-Mail: Haskarlianus.Pasang @aes.com
PROJECT DESIGN DOCUMENT FORM (CDM-SSC-PDD) - Version 03 CDM – Executive Board
35
Annex 2
INFORMATION REGARDING PUBLIC FUNDING There is no official development assistance being provided for this project.

PROJECT DESIGN DOCUMENT FORM (CDM-SSC-PDD) - Version 03 CDM – Executive Board
36
Annex 3
BASELINE INFORMATION
The following parameters are used in the application of the baseline methodology:
Baseline Input
Parameters Variables Value Unit SourceAnnual FFB production 298,145 tonnes Mill data records
Volume of wastewater Qy,ww 193,794 m³/yr Determined from mill FFB production records
COD untreated wastewater
CODy,ww,untreated 52,650 mg/l
Average of successive monthly readings; independent test laboratory results
Methane correction factor to be treated in the digester
MCFww,treatment 0.8 — MCF lower value in Table III.H.1
Methane generation capacity of treated wastewater
Bo,ww 0.21 kg CH4/kg COD IPCC
Global Warming Potential, methane
GWP_CH4 21 — IPCC
Sludge Disposition Sf, end use
Mill records. If sludge is land applied, PEy,s,final = 0 & MEPy,s,treatment = 0
PROJECT DESIGN DOCUMENT FORM (CDM-SSC-PDD) - Version 03 CDM – Executive Board
37
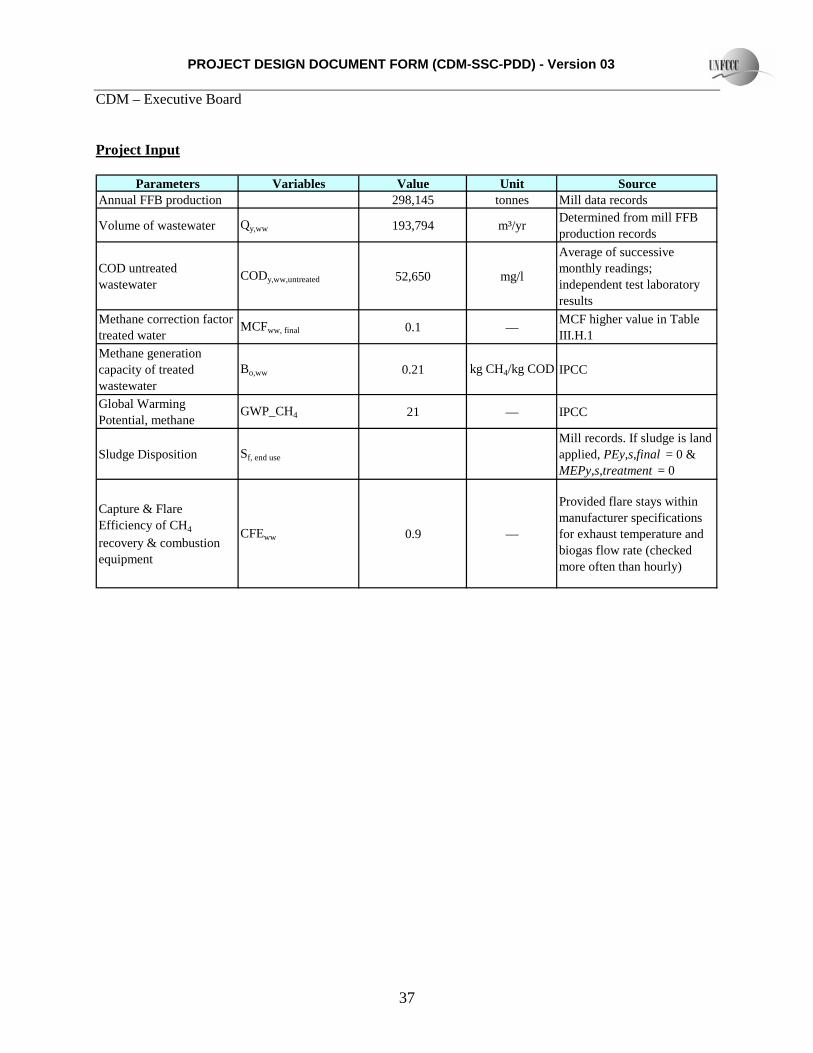
Project Input
Parameters Variables Value Unit SourceAnnual FFB production 298,145 tonnes Mill data records
Volume of wastewater Qy,ww 193,794 m³/yr Determined from mill FFB production records
COD untreated wastewater
CODy,ww,untreated 52,650 mg/l
Average of successive monthly readings; independent test laboratory results
Methane correction factor treated water
MCFww, final 0.1 — MCF higher value in Table III.H.1
Methane generation capacity of treated wastewater
Bo,ww 0.21 kg CH4/kg COD IPCC
Global Warming Potential, methane
GWP_CH4 21 — IPCC
Sludge Disposition Sf, end use
Mill records. If sludge is land applied, PEy,s,final = 0 & MEPy,s,treatment = 0
Capture & Flare Efficiency of CH4
recovery & combustion equipment
CFEww 0.9 —
Provided flare stays within manufacturer specifications for exhaust temperature and biogas flow rate (checked more often than hourly)

PROJECT DESIGN DOCUMENT FORM (CDM-SSC-PDD) - Version 03 CDM – Executive Board
38
Annex 4
MONITORING INFORMATION
Monitoring Plan
PURPOSE
The purpose of this method specification is to describe the criteria for maintaining equipment, reporting equipment outages, and to provide detailed guidance for collection and processing of data that is used in the determination of Green House Gas (GHG) emissions and emission reductions.
SCOPE
This document applies to GHG Mitigation Project activities. It applies to all personnel that operate and/or maintain project activity equipment and/or have an active role in data collection and processing.
ASSOCIATED DOCUMENTS
• UNFCCC approved monitoring methodology: AMS III H, Methane recovery in wastewater treatment, Version 6: http://cdm.unfccc.int/UserManagement/FileStorage/CDMWF_AM_UOWMJU5ZNUE0SGBGAZZNVFU9HVOV99
• Jody Zall Kusek, and Ray C. Rist, June 2004. Ten Steps to a Results-based Monitoring and Evaluation System: A Handbook for Development Practitioners, World Bank. http://www.worldbankinfoshop.org/ecommerce/catalog/product?item_id=3688663
• As-built documentation for:
o Anaerobic digester
o Biogas transfer system including a biogas flow-meter
o Combustion system (Flare)
• O & M Weekly Monitoring Checklist
• O & M Quarterly Monitoring Form
• O & M Maintenance Log
• Data Collection Procedure
• Inventory Control
• Quarterly Inventory Reporting
• Control of Nonconforming Product/Service
• Control of Monitoring & Measurement Devices
• Equipment Calibration & Verification
• Competence, Training, and Awareness
• Stage 2 (Form B) – Palm Oil Mills
PROJECT DESIGN DOCUMENT FORM (CDM-SSC-PDD) - Version 03 CDM – Executive Board
39
• Operations Manual, CH4 Analyzer
• EnviroCert Operations Management System (OMS)
OPERATION AND MAINTENANCE ACTIVITIES
System Overview
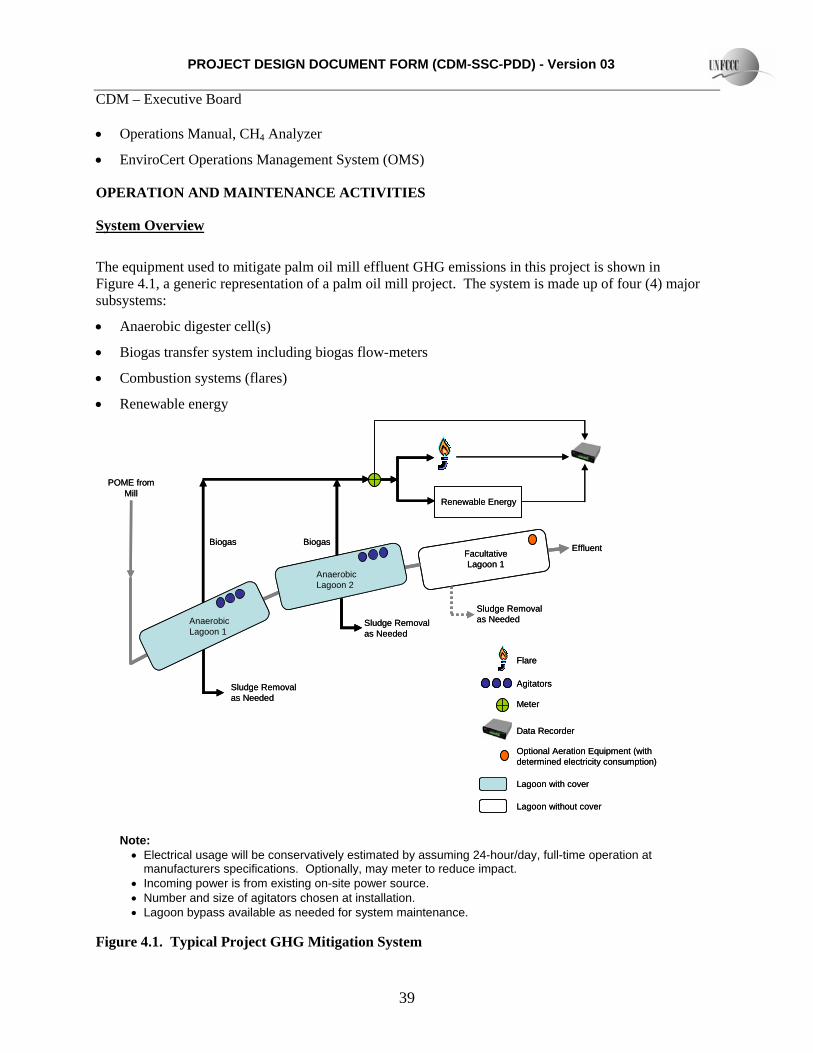
The equipment used to mitigate palm oil mill effluent GHG emissions in this project is shown in Figure 4.1, a generic representation of a palm oil mill project. The system is made up of four (4) major subsystems:
• Anaerobic digester cell(s)
• Biogas transfer system including biogas flow-meters
• Combustion systems (flares)
• Renewable energy
Facultative Lagoon 1
POME from Mill
Flare
Agitators
Meter
Data Recorder
Anaerobic Lagoon 1
Anaerobic Lagoon 2
Effluent
Sludge Removal as Needed
Sludge Removal as Needed
Sludge Removal as Needed
Biogas
Optional Aeration Equipment (with determined electricity consumption)
Lagoon with cover
Lagoon without cover
Biogas
Renewable Energy
Note: • Electrical usage will be conservatively estimated by assuming 24-hour/day, full-time operation at
manufacturers specifications. Optionally, may meter to reduce impact. • Incoming power is from existing on-site power source. • Number and size of agitators chosen at installation. • Lagoon bypass available as needed for system maintenance.
Figure 4.1. Typical Project GHG Mitigation System
PROJECT DESIGN DOCUMENT FORM (CDM-SSC-PDD) - Version 03 CDM – Executive Board
40
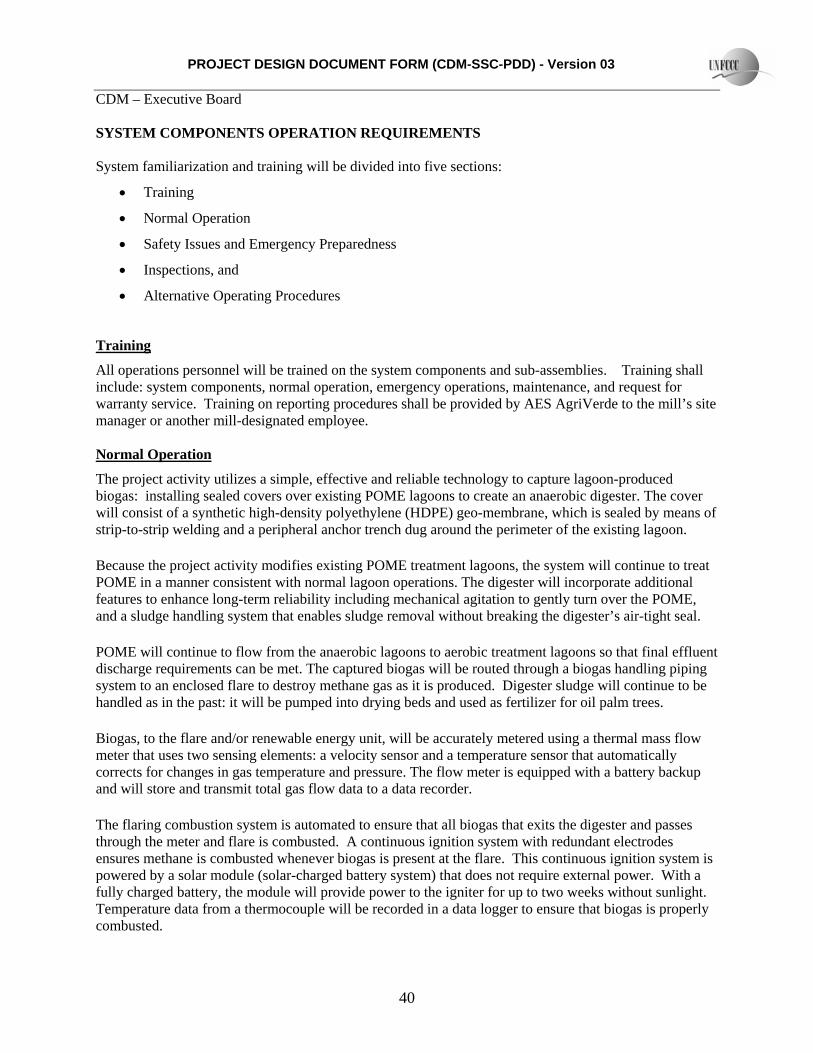
SYSTEM COMPONENTS OPERATION REQUIREMENTS System familiarization and training will be divided into five sections:
• Training
• Normal Operation
• Safety Issues and Emergency Preparedness
• Inspections, and
• Alternative Operating Procedures
Training
All operations personnel will be trained on the system components and sub-assemblies. Training shall include: system components, normal operation, emergency operations, maintenance, and request for warranty service. Training on reporting procedures shall be provided by AES AgriVerde to the mill’s site manager or another mill-designated employee. Normal Operation
The project activity utilizes a simple, effective and reliable technology to capture lagoon-produced biogas: installing sealed covers over existing POME lagoons to create an anaerobic digester. The cover will consist of a synthetic high-density polyethylene (HDPE) geo-membrane, which is sealed by means of strip-to-strip welding and a peripheral anchor trench dug around the perimeter of the existing lagoon.
Because the project activity modifies existing POME treatment lagoons, the system will continue to treat POME in a manner consistent with normal lagoon operations. The digester will incorporate additional features to enhance long-term reliability including mechanical agitation to gently turn over the POME, and a sludge handling system that enables sludge removal without breaking the digester’s air-tight seal.
POME will continue to flow from the anaerobic lagoons to aerobic treatment lagoons so that final effluent discharge requirements can be met. The captured biogas will be routed through a biogas handling piping system to an enclosed flare to destroy methane gas as it is produced. Digester sludge will continue to be handled as in the past: it will be pumped into drying beds and used as fertilizer for oil palm trees.
Biogas, to the flare and/or renewable energy unit, will be accurately metered using a thermal mass flow meter that uses two sensing elements: a velocity sensor and a temperature sensor that automatically corrects for changes in gas temperature and pressure. The flow meter is equipped with a battery backup and will store and transmit total gas flow data to a data recorder.
The flaring combustion system is automated to ensure that all biogas that exits the digester and passes through the meter and flare is combusted. A continuous ignition system with redundant electrodes ensures methane is combusted whenever biogas is present at the flare. This continuous ignition system is powered by a solar module (solar-charged battery system) that does not require external power. With a fully charged battery, the module will provide power to the igniter for up to two weeks without sunlight. Temperature data from a thermocouple will be recorded in a data logger to ensure that biogas is properly combusted.

PROJECT DESIGN DOCUMENT FORM (CDM-SSC-PDD) - Version 03 CDM – Executive Board
41
Safety Issues and Emergency Preparedness
Care should be exercised when working around project equipment as trapped biogas can be highly flammable.
WARNING
The gas contained in the digester cell is EXTREMELY flammable.
Sources of ignition and smoking are not permitted
within 10 meters of the cell and gas handling system.
Death or serious injury may result.
Gas to the metering system should be disconnected prior to performing maintenance on the flow-meter or gas handling equipment. Care should be exercised when digging in the area where biogas pipes are buried (when applicable).
Prior to performing maintenance on the flare (or other combustion) system, the gas flow must be turned off. Care should be exercised when working near the flare system as flare system components can be extremely hot.
Weekly Inspection
A periodic inspection shall include the following:
• Influent piping:
o check for pipeline obstructions, leaks, or corrosion at exposed joints
• Cover material: check for cracks, tears or points of distress (or wear) around the perimeter of the digester cell
• Check for excessive ballooning of cover (indicating excess biogas build-up) or presence of odour (indicating the possibility of a leak)
• Check for signs of gas or POME leakage through the cover
• Verify agitator operation
• Biogas piping: check for leaks and/or cracks in piping
• Check for proper operation of the data recorder
• Check for proper operation of the flow meter (compare meter reading to previous reading. Meter reading should have changed since last reading)
• Check for proper operation of the flare thermocouples
• Visually inspect flare to determine if flare is combusting biogas. This system will typically be quite hot when operating
PROJECT DESIGN DOCUMENT FORM (CDM-SSC-PDD) - Version 03 CDM – Executive Board
42
Alternative Operating Procedures
The site manager or operations employee should IMMEDIATELY notify AES AgriVerde in accordance with the Emergency Maintenance section of this annex if any project equipment or subsystems appear to be inoperative or operating abnormally. The mill’s site manager and AES AgriVerde’s Regional Maintenance Technician (RMT) shall work together to identify a mutually satisfactory approach to repairing affected equipment and to ensure that mill operations can continue unaffected. If at all possible, biogas should continue to be captured and combusted. If maintenance or warranty service is required, AES AgriVerde shall contact the appropriate service provider. The RMT and site manager will stay in close communications until the problem(s) are satisfactorily resolved. Maintenance, Trouble Reporting and Documentation Emergency Maintenance:
Situations requiring immediate attention due to failure of components in the digester or combustion system that may cause significant damage to the physical structure, or could result in the release of GHG or failure to capture GHG, should be immediately reported to the Regional Maintenance Technician. If unavailable, contact the National or International Monitoring Manager of the country where the project is located.
Table 4.1. Contacts
Title Phone e-mail
Regional Maintenance Technician (RMT) Will be supplied during training
Supplied during training
Indonesian National Monitoring Manager +603 2287 9868 [email protected]
International Monitoring Manager +1 321 544 1705 [email protected]
Unscheduled Maintenance:
Situations requiring maintenance (not resulting in the release or failure to capture GHG) should be reported to the Regional Maintenance Technician, normally within 1 to 24 hours of discovery. Records Keeping
Maintenance and servicing of equipment shall be recorded.
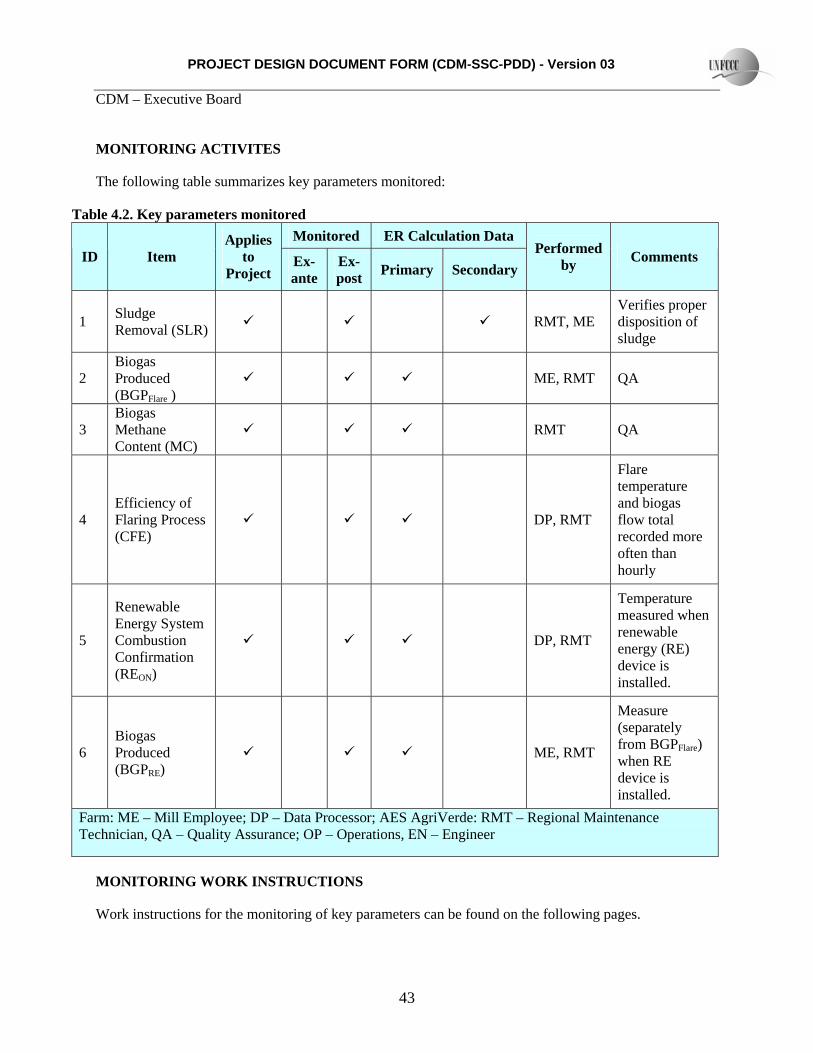
PROJECT DESIGN DOCUMENT FORM (CDM-SSC-PDD) - Version 03 CDM – Executive Board
43
MONITORING ACTIVITES
The following table summarizes key parameters monitored:
Table 4.2. Key parameters monitored Monitored ER Calculation Data
ID Item Applies
to Project
Ex-ante
Ex-post Primary Secondary
Performed by Comments
1 Sludge Removal (SLR) RMT, ME
Verifies proper disposition of sludge
2 Biogas Produced (BGPFlare )
ME, RMT QA
3 Biogas Methane Content (MC)
RMT QA
4 Efficiency of Flaring Process (CFE)
DP, RMT
Flare temperature and biogas flow total recorded more often than hourly
5
Renewable Energy System Combustion Confirmation (REON)
DP, RMT
Temperature measured when renewable energy (RE) device is installed.
6 Biogas Produced (BGPRE)
ME, RMT
Measure (separately from BGPFlare) when RE device is installed.
Farm: ME – Mill Employee; DP – Data Processor; AES AgriVerde: RMT – Regional Maintenance Technician, QA – Quality Assurance; OP – Operations, EN – Engineer
MONITORING WORK INSTRUCTIONS
Work instructions for the monitoring of key parameters can be found on the following pages.
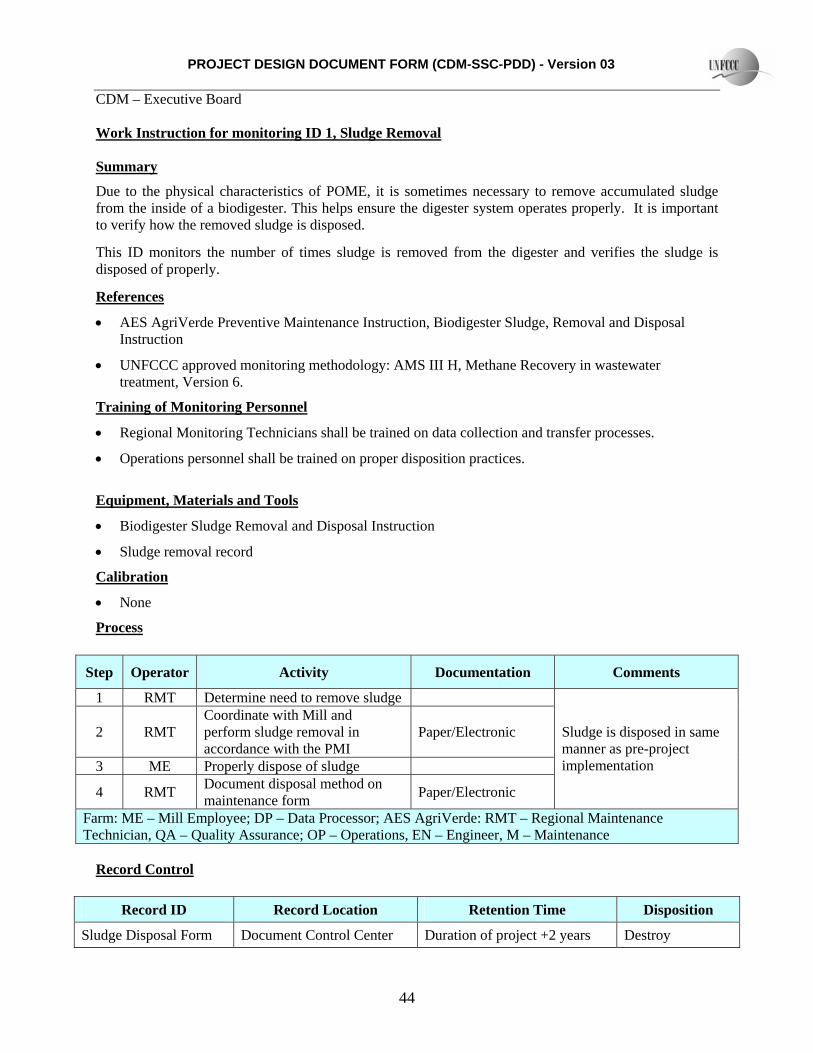
PROJECT DESIGN DOCUMENT FORM (CDM-SSC-PDD) - Version 03 CDM – Executive Board
44
Work Instruction for monitoring ID 1, Sludge Removal Summary
Due to the physical characteristics of POME, it is sometimes necessary to remove accumulated sludge from the inside of a biodigester. This helps ensure the digester system operates properly. It is important to verify how the removed sludge is disposed.
This ID monitors the number of times sludge is removed from the digester and verifies the sludge is disposed of properly.
References
• AES AgriVerde Preventive Maintenance Instruction, Biodigester Sludge, Removal and Disposal Instruction
• UNFCCC approved monitoring methodology: AMS III H, Methane Recovery in wastewater treatment, Version 6.
Training of Monitoring Personnel
• Regional Monitoring Technicians shall be trained on data collection and transfer processes.
• Operations personnel shall be trained on proper disposition practices.
Equipment, Materials and Tools
• Biodigester Sludge Removal and Disposal Instruction
• Sludge removal record
Calibration
• None
Process
Record Control
Step Operator Activity Documentation Comments
1 RMT Determine need to remove sludge
2 RMT Coordinate with Mill and perform sludge removal in accordance with the PMI
Paper/Electronic
3 ME Properly dispose of sludge
4 RMT Document disposal method on maintenance form Paper/Electronic
Sludge is disposed in same manner as pre-project implementation
Farm: ME – Mill Employee; DP – Data Processor; AES AgriVerde: RMT – Regional Maintenance Technician, QA – Quality Assurance; OP – Operations, EN – Engineer, M – Maintenance
Record ID Record Location Retention Time Disposition
Sludge Disposal Form Document Control Center Duration of project +2 years Destroy
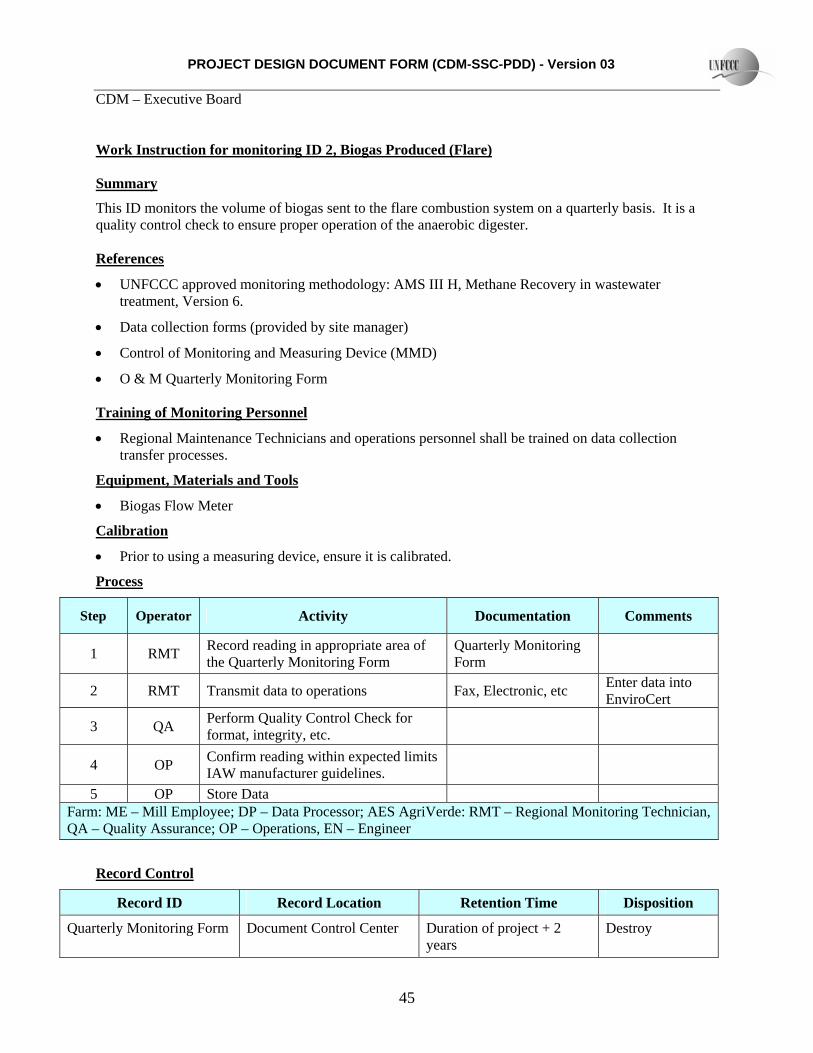
PROJECT DESIGN DOCUMENT FORM (CDM-SSC-PDD) - Version 03 CDM – Executive Board
45
Work Instruction for monitoring ID 2, Biogas Produced (Flare) Summary
This ID monitors the volume of biogas sent to the flare combustion system on a quarterly basis. It is a quality control check to ensure proper operation of the anaerobic digester. References
• UNFCCC approved monitoring methodology: AMS III H, Methane Recovery in wastewater treatment, Version 6.
• Data collection forms (provided by site manager)
• Control of Monitoring and Measuring Device (MMD)
• O & M Quarterly Monitoring Form Training of Monitoring Personnel
• Regional Maintenance Technicians and operations personnel shall be trained on data collection transfer processes.
Equipment, Materials and Tools
• Biogas Flow Meter
Calibration
• Prior to using a measuring device, ensure it is calibrated.
Process
Step Operator Activity Documentation Comments
1 RMT Record reading in appropriate area of the Quarterly Monitoring Form
Quarterly Monitoring Form
2 RMT Transmit data to operations Fax, Electronic, etc Enter data into EnviroCert
3 QA Perform Quality Control Check for format, integrity, etc.
4 OP Confirm reading within expected limits IAW manufacturer guidelines.
5 OP Store Data Farm: ME – Mill Employee; DP – Data Processor; AES AgriVerde: RMT – Regional Monitoring Technician, QA – Quality Assurance; OP – Operations, EN – Engineer
Record Control
Record ID Record Location Retention Time Disposition
Quarterly Monitoring Form Document Control Center Duration of project + 2 years
Destroy

PROJECT DESIGN DOCUMENT FORM (CDM-SSC-PDD) - Version 03 CDM – Executive Board
46
Work Instruction for monitoring ID 3, Biogas Methane Content
Summary
This ID determines the methane content of the biogas. It is a snapshot view of digestor operation. Methane concentration is determined with a gas analyzer. A range of ± 3% points is sufficient to determine uncertainties. For example, the nominal percentage of CH4 in biogas is approximately 65%. Readings between 55% and 75% indicate proper operation of the digester prior to sampling and analysis. The measuring equipment is field calibrated in accordance with the manufacturer specifications.
References
• UNFCCC approved monitoring methodology: AMS III H, Methane Recovery in wastewater treatment, Version 6.
• Control of Monitoring and Measuring Device (MMD)
• Operations Manual CH4 Analyzer
• Quarterly Monitoring Form
• O & M Maintenance Log Training of Monitoring Personnel
• Operating the CH4 Analyzer
• Regional Maintenance Technicians shall be trained on data collection transfer processes.
• Operations personnel shall be trained on data processing and storage
Equipment, Materials and Tools
• CH4 Analyzer
Calibration
• As required by the manufacturer.
Process
Step Operator Activity Documentation Comments
1 RMT Prepare the gas analyzer as directed in the operator manual.
CH4 Analyzer Operations Manual
2 RMT Connect the CH4 analyzer to the system test port.
3 RMT Open valve on test port
4 RMT Take gas reading in accordance with Operations Manual Take 5 readings and
average the results.
5 RMT Record CH4 readings in appropriate spaces of the Quarterly Monitoring Form
Quarterly Monitoring Form
If there is greater than 10% points difference from previous reading, initiate appropriate maintenance actions.
6 RMT Close valve on test port
7 RMT Disconnect hose in reverse order of connection
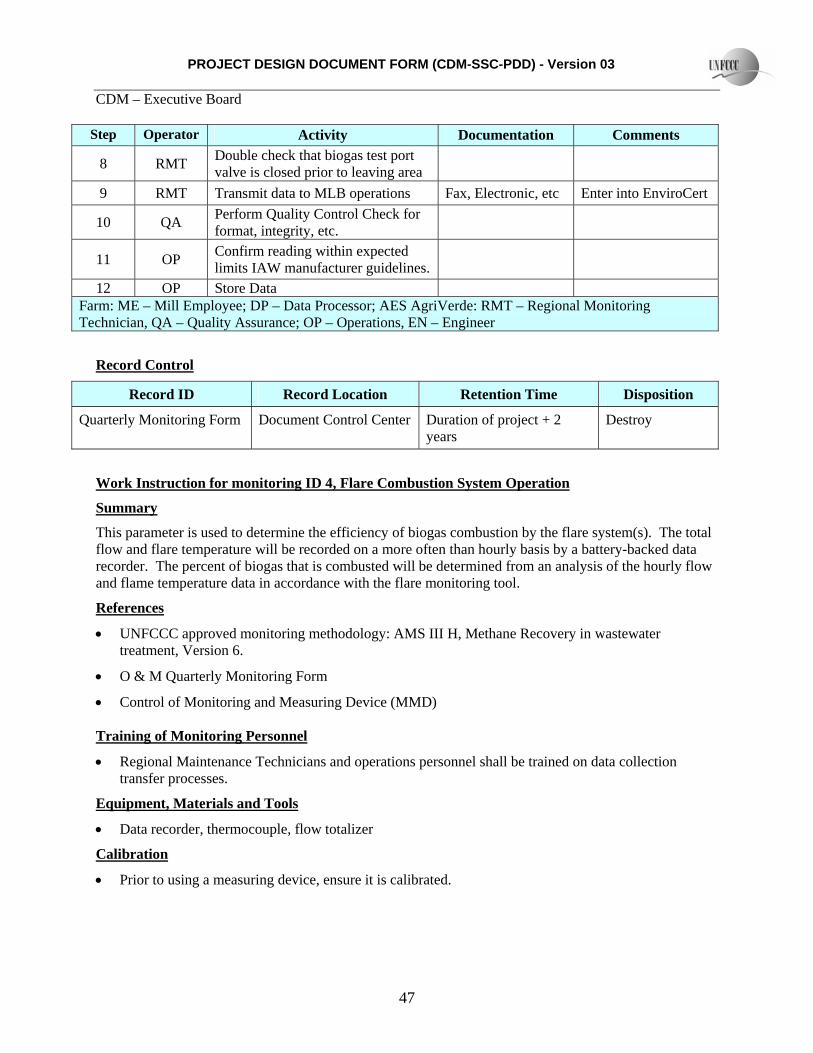
PROJECT DESIGN DOCUMENT FORM (CDM-SSC-PDD) - Version 03 CDM – Executive Board
47
Step Operator Activity Documentation Comments
8 RMT Double check that biogas test port valve is closed prior to leaving area
9 RMT Transmit data to MLB operations Fax, Electronic, etc Enter into EnviroCert
10 QA Perform Quality Control Check for format, integrity, etc.
11 OP Confirm reading within expected limits IAW manufacturer guidelines.
12 OP Store Data Farm: ME – Mill Employee; DP – Data Processor; AES AgriVerde: RMT – Regional Monitoring Technician, QA – Quality Assurance; OP – Operations, EN – Engineer
Record Control
Record ID Record Location Retention Time Disposition
Quarterly Monitoring Form Document Control Center Duration of project + 2 years
Destroy
Work Instruction for monitoring ID 4, Flare Combustion System Operation
Summary
This parameter is used to determine the efficiency of biogas combustion by the flare system(s). The total flow and flare temperature will be recorded on a more often than hourly basis by a battery-backed data recorder. The percent of biogas that is combusted will be determined from an analysis of the hourly flow and flame temperature data in accordance with the flare monitoring tool.
References
• UNFCCC approved monitoring methodology: AMS III H, Methane Recovery in wastewater treatment, Version 6.
• O & M Quarterly Monitoring Form
• Control of Monitoring and Measuring Device (MMD) Training of Monitoring Personnel
• Regional Maintenance Technicians and operations personnel shall be trained on data collection transfer processes.
Equipment, Materials and Tools
• Data recorder, thermocouple, flow totalizer
Calibration
• Prior to using a measuring device, ensure it is calibrated.
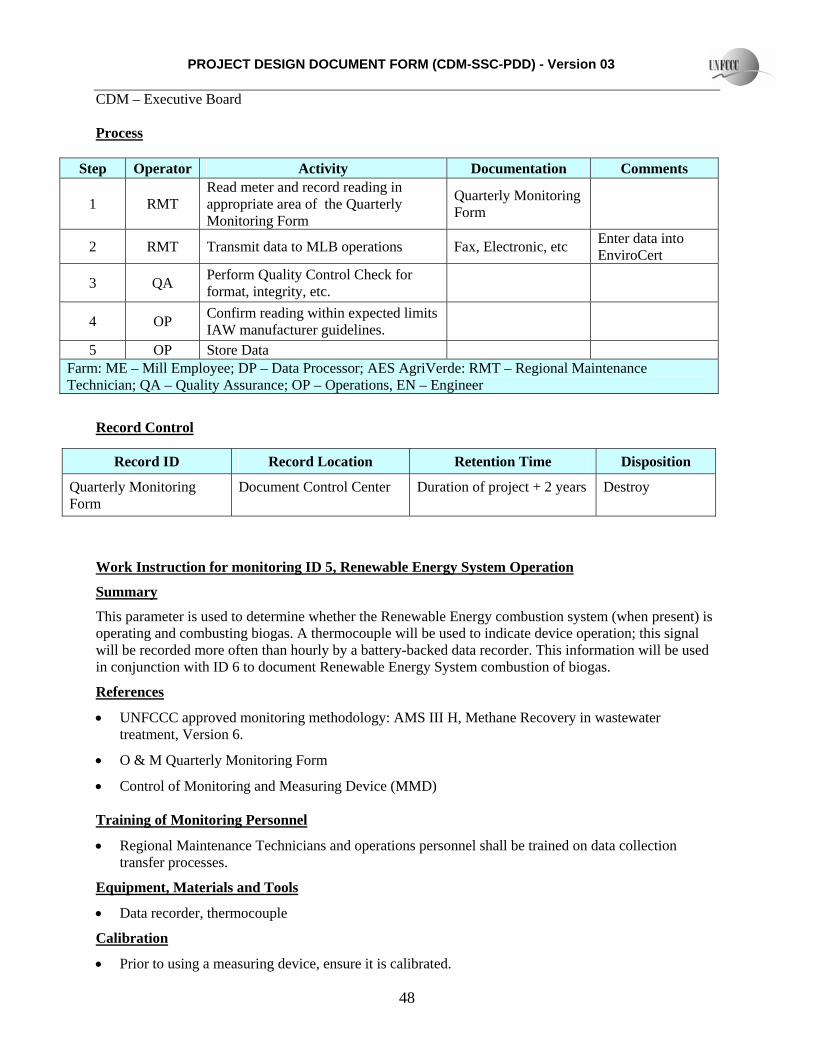
PROJECT DESIGN DOCUMENT FORM (CDM-SSC-PDD) - Version 03 CDM – Executive Board
48
Process
Step Operator Activity Documentation Comments
1 RMT Read meter and record reading in appropriate area of the Quarterly Monitoring Form
Quarterly Monitoring Form
2 RMT Transmit data to MLB operations Fax, Electronic, etc Enter data into EnviroCert
3 QA Perform Quality Control Check for format, integrity, etc.
4 OP Confirm reading within expected limits IAW manufacturer guidelines.
5 OP Store Data Farm: ME – Mill Employee; DP – Data Processor; AES AgriVerde: RMT – Regional Maintenance Technician; QA – Quality Assurance; OP – Operations, EN – Engineer
Record Control
Work Instruction for monitoring ID 5, Renewable Energy System Operation
Summary
This parameter is used to determine whether the Renewable Energy combustion system (when present) is operating and combusting biogas. A thermocouple will be used to indicate device operation; this signal will be recorded more often than hourly by a battery-backed data recorder. This information will be used in conjunction with ID 6 to document Renewable Energy System combustion of biogas.
References
• UNFCCC approved monitoring methodology: AMS III H, Methane Recovery in wastewater treatment, Version 6.
• O & M Quarterly Monitoring Form
• Control of Monitoring and Measuring Device (MMD) Training of Monitoring Personnel
• Regional Maintenance Technicians and operations personnel shall be trained on data collection transfer processes.
Equipment, Materials and Tools
• Data recorder, thermocouple
Calibration
• Prior to using a measuring device, ensure it is calibrated.
Record ID Record Location Retention Time Disposition
Quarterly Monitoring Form
Document Control Center Duration of project + 2 years Destroy
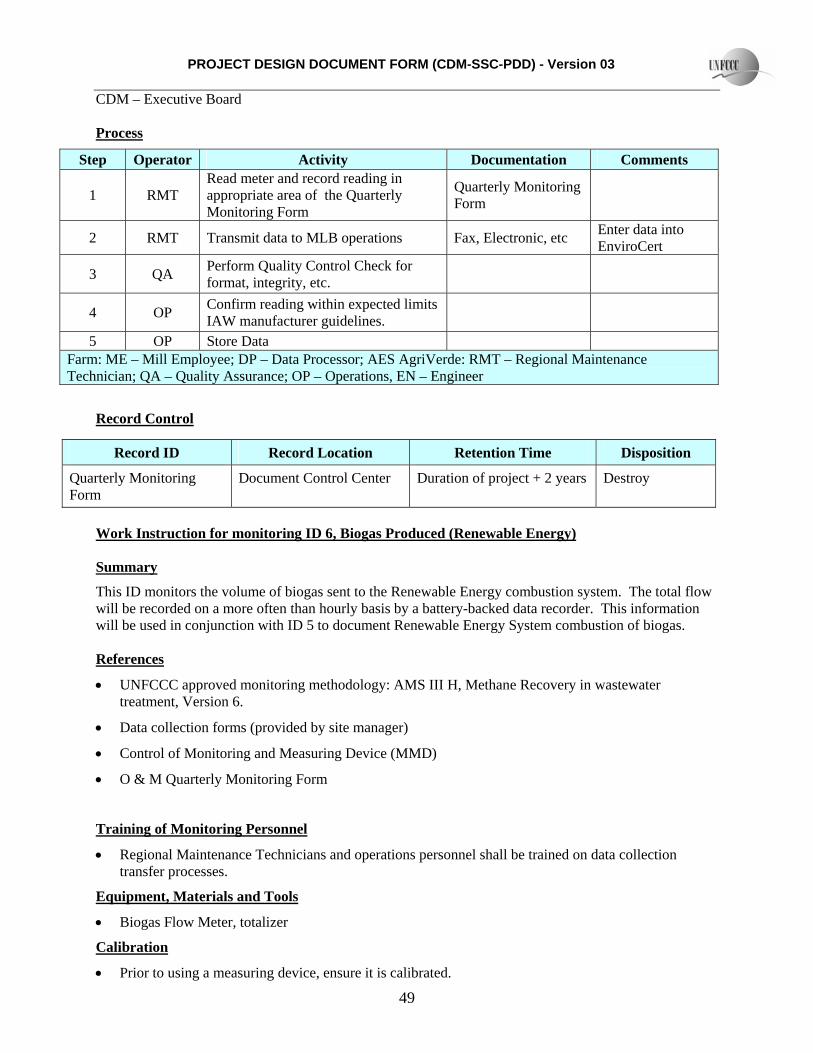
PROJECT DESIGN DOCUMENT FORM (CDM-SSC-PDD) - Version 03 CDM – Executive Board
49
Process
Step Operator Activity Documentation Comments
1 RMT Read meter and record reading in appropriate area of the Quarterly Monitoring Form
Quarterly Monitoring Form
2 RMT Transmit data to MLB operations Fax, Electronic, etc Enter data into EnviroCert
3 QA Perform Quality Control Check for format, integrity, etc.
4 OP Confirm reading within expected limits IAW manufacturer guidelines.
5 OP Store Data Farm: ME – Mill Employee; DP – Data Processor; AES AgriVerde: RMT – Regional Maintenance Technician; QA – Quality Assurance; OP – Operations, EN – Engineer
Record Control
Work Instruction for monitoring ID 6, Biogas Produced (Renewable Energy) Summary
This ID monitors the volume of biogas sent to the Renewable Energy combustion system. The total flow will be recorded on a more often than hourly basis by a battery-backed data recorder. This information will be used in conjunction with ID 5 to document Renewable Energy System combustion of biogas. References
• UNFCCC approved monitoring methodology: AMS III H, Methane Recovery in wastewater treatment, Version 6.
• Data collection forms (provided by site manager)
• Control of Monitoring and Measuring Device (MMD)
• O & M Quarterly Monitoring Form
Training of Monitoring Personnel
• Regional Maintenance Technicians and operations personnel shall be trained on data collection transfer processes.
Equipment, Materials and Tools
• Biogas Flow Meter, totalizer
Calibration
• Prior to using a measuring device, ensure it is calibrated.
Record ID Record Location Retention Time Disposition
Quarterly Monitoring Form
Document Control Center Duration of project + 2 years Destroy
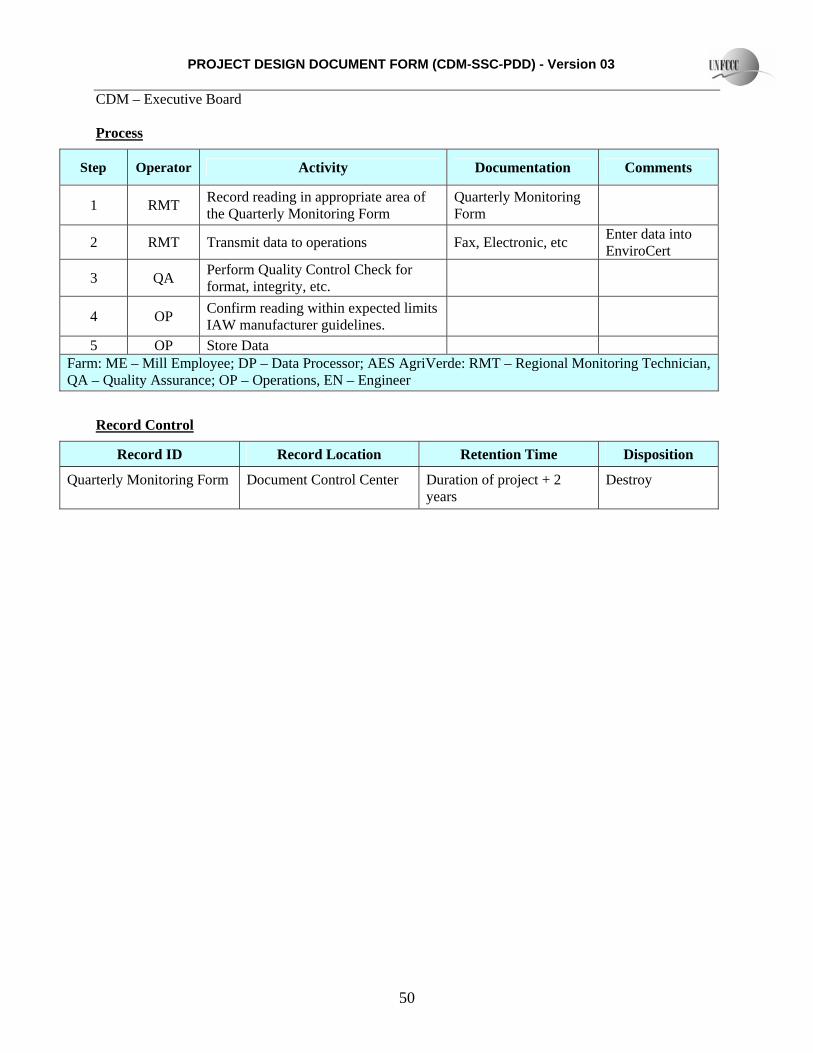
PROJECT DESIGN DOCUMENT FORM (CDM-SSC-PDD) - Version 03 CDM – Executive Board
50
Process
Step Operator Activity Documentation Comments
1 RMT Record reading in appropriate area of the Quarterly Monitoring Form
Quarterly Monitoring Form
2 RMT Transmit data to operations Fax, Electronic, etc Enter data into EnviroCert
3 QA Perform Quality Control Check for format, integrity, etc.
4 OP Confirm reading within expected limits IAW manufacturer guidelines.
5 OP Store Data Farm: ME – Mill Employee; DP – Data Processor; AES AgriVerde: RMT – Regional Monitoring Technician, QA – Quality Assurance; OP – Operations, EN – Engineer
Record Control
Record ID Record Location Retention Time Disposition
Quarterly Monitoring Form Document Control Center Duration of project + 2 years
Destroy
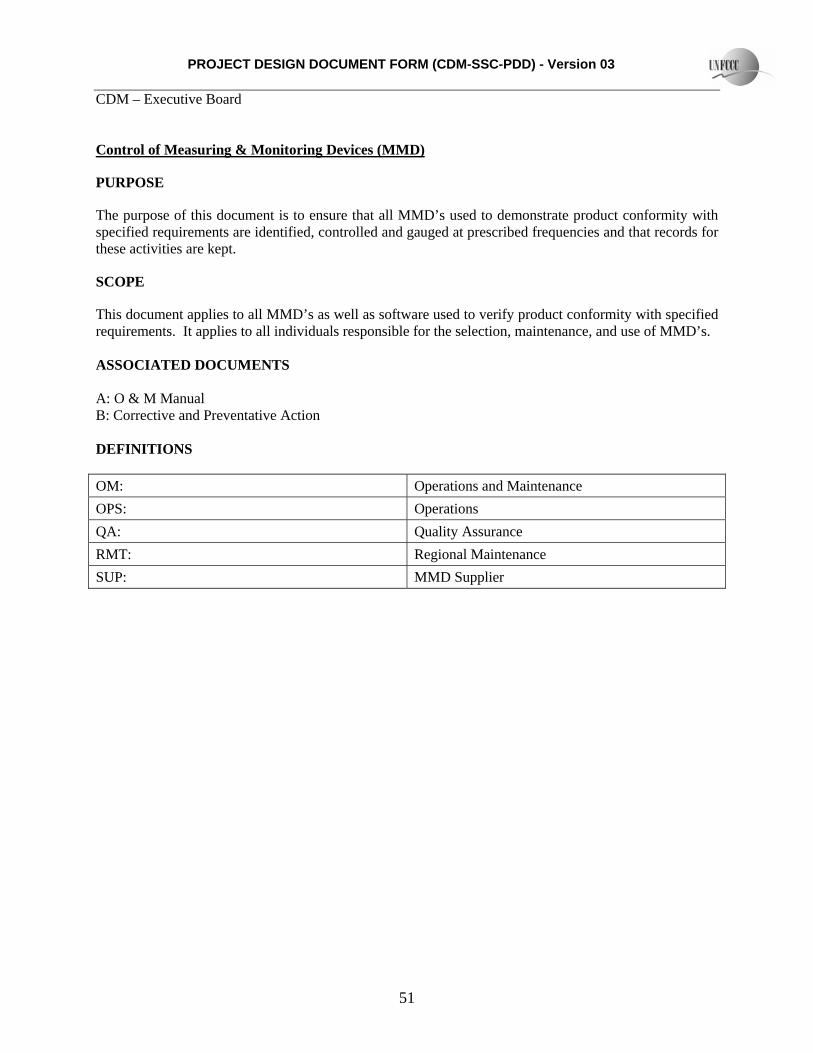
PROJECT DESIGN DOCUMENT FORM (CDM-SSC-PDD) - Version 03 CDM – Executive Board
51
Control of Measuring & Monitoring Devices (MMD)
PURPOSE
The purpose of this document is to ensure that all MMD’s used to demonstrate product conformity with specified requirements are identified, controlled and gauged at prescribed frequencies and that records for these activities are kept.
SCOPE
This document applies to all MMD’s as well as software used to verify product conformity with specified requirements. It applies to all individuals responsible for the selection, maintenance, and use of MMD’s. ASSOCIATED DOCUMENTS A: O & M Manual B: Corrective and Preventative Action DEFINITIONS OM: Operations and Maintenance OPS: Operations QA: Quality Assurance RMT: Regional Maintenance SUP: MMD Supplier
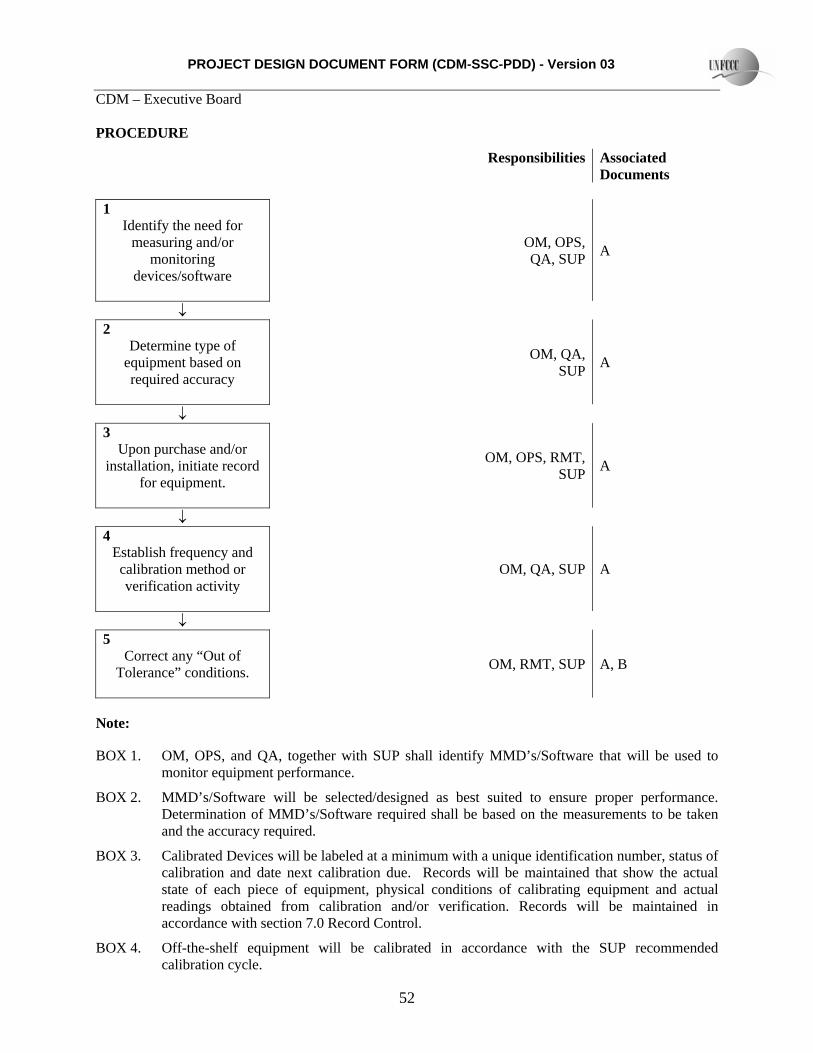
PROJECT DESIGN DOCUMENT FORM (CDM-SSC-PDD) - Version 03 CDM – Executive Board
52
PROCEDURE
Responsibilities Associated Documents
1
Identify the need for measuring and/or
monitoring devices/software
OM, OPS, QA, SUP A
↓ 2
Determine type of equipment based on required accuracy
OM, QA, SUP A
↓ 3
Upon purchase and/or installation, initiate record
for equipment.
OM, OPS, RMT, SUP A
↓ 4
Establish frequency and calibration method or verification activity
OM, QA, SUP A
↓ 5
Correct any “Out of Tolerance” conditions.
OM, RMT, SUP A, B
Note:
BOX 1. OM, OPS, and QA, together with SUP shall identify MMD’s/Software that will be used to monitor equipment performance.
BOX 2. MMD’s/Software will be selected/designed as best suited to ensure proper performance. Determination of MMD’s/Software required shall be based on the measurements to be taken and the accuracy required.
BOX 3. Calibrated Devices will be labeled at a minimum with a unique identification number, status of calibration and date next calibration due. Records will be maintained that show the actual state of each piece of equipment, physical conditions of calibrating equipment and actual readings obtained from calibration and/or verification. Records will be maintained in accordance with section 7.0 Record Control.
BOX 4. Off-the-shelf equipment will be calibrated in accordance with the SUP recommended calibration cycle.
PROJECT DESIGN DOCUMENT FORM (CDM-SSC-PDD) - Version 03 CDM – Executive Board
53
Custom-gauged equipment calibration intervals shall be defined by OM & SUP. The calibration intervals can be adjusted based on the analysis of previous calibration results and at the discretion of OM & SUP. Third Party Calibration Service will be managed as if activity was performed by company personnel. This will include requirement that all Qualifying Certifications and references to the National Institute of Standards and Technology (NIST) be submitted/maintained.
BOX 5. Devices found to be out of tolerance will be adjusted/repaired. An investigation will be conducted to determine the effect that the out of tolerance condition may have had on the ability to verify conformance of product to customer requirements and to determine what action, if any, should be taken.
RECORD CONTROL
RECORD ID FILE LOCATION RETENTION TIME
DISPOSITION
Equipment calibration records Site of use 1 year after equipment has been removed from service
Destroyed
PROJECT DESIGN DOCUMENT FORM (CDM-SSC-PDD) - Version 03 CDM – Executive Board
54
References
Chua, C.K., Ong, K.P., Zainuriah, A., and Zulkornian, A.H., 2006. Benefits of Bio-Compost to the Estate Environment. Paper for Seminar on Available Technology to Achieve Zero Discharge/20 ppm BOD Water Course Discharge of Treated POME, Bangi, 3 April 2006.
Eco-Ideal Consulting Sdn. Bhd. (Eco-Ideal), 2004. MEWC/PTM/DANIDA: Study on Clean Development Mechanism Potential in the Waste Sectors in Malaysia. Unpublished.
International Law Book Services (ILBS), 2004. Environmental Quality (Prescribed Premises) (Crude Palm-Oil) Regulations 1977 in: Environmental Quality Act 1974. Kuala Lumpur, Direct Art Company, 49-62.
Ma, A. N., Cheah, S. C. & Chow, M.C., 1993. Current Status of Palm Oil Processing Wastes Management in Waste Management in Malaysia: Current Status and Prospects for Bioremediation. pg 111-136.
Shamsudin, A.L., The Way Forward: The Need for Better Management of Palm Oil Mill Waste. Presentation at Seminar on Available Technology to Achieve Zero Discharge/20 ppm BOD Water Course Discharge of Treated POME, Bangi, 3 April 2006.
Shirai, Y., Wakisaka, M., Yacob, S., Hassan, M.A., and Suzuki, S., 2003. Reduction of Methane Released from Palm Oil Mill Lagoon in Malaysia and its Countermeasures. Mitigation and Adaptation Strategies for Global Change, 8: 237–252, 2003.
Suki, A. and Wok, K., 2006. Composting at Golden Hope Plantations Berhad. Presentation at Seminar on Available Technology to Achieve Zero Discharge/20 ppm BOD Water Course Discharge of Treated POME, Bangi, 3 April 2006.
Thani, Mohd. Ishak, et al, 1999. Industrial Processes & The Environment (Handbook No.3,) Crude Palm Oil Industry, Department of the Environment, Malaysia.
Yeoh, B.G. 2004a. A Technical and Economic Analysis of Heat and Power Generation from Biomethanation of Palm Oil Mill Effluent. Paper presented at the Electricity Supply Industry in Transition: Issues and Prospect for Asia Conference, Thailand 14-16 January 2004.
Yeoh, B.G., 2004b. Energy Recovery From Wastewater Treatment: A Case Study in the Biomethanation of Palm Oil Mill Effluent. Presentation at Brunei Darussalam Cogeneration Week 2004, Bandar Seri Bagawan, 23-24 November 2004.