method oia 1677-09: availablecyanide by ligand … · 1.4 this method can be used by analysts...
TRANSCRIPT

www.epa.gov
Method OIA 1677-09: Available Cyanide by Ligand Exchange and Flow Injection Analysis (FIA)
2010

Method OIA-1677: Available Cyanide
Methodology
Method OIA-1677: Available Cyanide by Ligand Exchange and Flow Injection Analysis (FIA)
WARNING: Cyanide solutions may product toxic hydrogen cyanide gas when acidified. For these reasons, any method involving cyanide in a sample or reagent should only be performed by properly trainedpersonnel wearing adequate personal protective equipment.
WARNING: Two separate waste bottles should be used: one clearly marked “Cyanide Waste” and another marked“Acid Waste”. The waste line from the amperometric flow cell must go to the Cyanide Waste bottle. The waste line from the gas diffusion module must go to the Acid Waste bottle.
1.0 Scope and Application
1.1 This method is used for determining available cyanide in water and wastewater by ligand exchange, flowinjection analysis, and amperometric detection (References 15.1, 15.2,15.5, 15.6, and 15.9). This method isused in the USEPA’s data gathering and monitoring programs associated with the Clean Water Act, ResourceConservation and Recovery Act, Comprehensive Environmental Response, Compensation and Liability Act,and Safe Drinking Water Act.
1.2 Cyanide ion (CN–), hydrogen cyanide in water (HCN[aq]), and cyano-complexes of zinc, copper, cadmium, mercury, nickel, and silver can be determined by this method.
1.3 The Method Detection Limit (MDL) is 0.5 μg/L cyanide (Reference 15.9) and the Minimum Level (ML) is 2 μg/L. The applicable range of the method is 2.0 to 5,000 μg/L cyanide using a 200-μL sample loop. Extendthe range to analyze higher concentrations by sample dilution or changing the sample loop volume.
1.4 This method can be used by analysts experienced with flow injection analysis equipment or working under the close supervision of such qualified persons.
1.5 The laboratory is permitted to modify the method to overcome interferences or to lower the cost of measurements, provided that all performance criteria in this method are met. Requirements for establishing method equivalency are given in Section 9.1.2.
1

Method OIA-1677: Available Cyanide
2.0 Method Summary
2.1 Prior to analysis, treat the sample to remove potential interferences (Section 4.0 and 8.0). Add ligandexchange reagents to the sample. Thermodynamically stable complexes form with the transition metal ions listed in Section 1.2, releasing the cyanide ion from the cyano-complexes. Inject an aliquot of the treated sample into the FIA system (Reference 15.2). Addition of acid converts the cyanide ion to hydrogen cyanide gas (HCN), which passes under a gas diffusion membrane. The hydrogen cyanide gas diffuses through the membrane into an alkaline receiving solution where it converts back to cyanide ion. The cyanide ion ismonitored amperometrically with a silver working electrode, silver/silver chloride reference electrode, and platinum/stainless steel counter electrode at an applied potential of zero volt. The current generated is proportional to the cyanide concentration present in the original sample.
2.2 Assure analysis quality through reproducible calibration and testing of the FIA system.
2.3 A general flow diagram of the FIA system appears below.
Gas Diffusion
To Cyanide Waste
To Acid Waste
AMP Detector
Module
Base Reagent
Carrier
Acid Reagent
Sample
3.0 Definitions
3.1 Definitions for terms used in this method are provided in Section 16.0, “Glossary of Definitions and Purposes.”
4.0 Interferences
4.1 Method interferences can be caused by contaminants in the reagents, reagent water, and glassware, which may bias the results. Take care to keep all such items free of contaminants.
4.2 Sulfide is a positive interferant in this method (Reference 15.11). When sulfide is acidified, it forms hydrogen sulfide, which passes through the gas diffusion membrane and produces a signal at the silverelectrode. In addition, sulfide ion reacts with cyanide ion in solution to reduce its concentration over time. Use the online Sulfide Acidification Reagent (Section 8.4) for all samples suspected to contain sulfide.
4.3 Treat sample containing water soluble aldehydes, such as formaldehyde or acetaldehyde, by adding ethylenediamine solution (Section 8.5), at the time of sampling.
2

Method OIA-1677: Available Cyanide
4.4 Remove oxidizing agents that decompose cyanides by adding ascorbic acid (Section 8.6) if analysis is to bewithin 24 hours, otherwise use sodium arsenite.
4.5 High concentrations of carbonate can result in a negative response in the amperometric detector when carbondioxide diffuses across the gas diffusion membrane into the alkaline receiving solution, reducing its pH. Treat effluents from high-carbonate containing wastes, such as coal gasification waste and atmospheric emission scrub water, with hydrated lime to stabilize the sample (Reference 15.11).
4.6 Tests conducted on samples containing large amounts of colloids indicate rapid cyanide losses. Filter turbid or colloidal samples.
4.7 Nitrate and nitrite do not interfere in this method.
4.8 Thiocyanate, sulfite, or thiosulfate do not interfere with this method.
5.0 Safety
5.1 The toxicity or carcinogenicity of each compound or reagent used in this method has not been fully established. Treat each chemical as a potential health hazard. Reduce exposure to these chemicals to the lowest possible level.
5.2 For reference purposes, make available the Material Safety Data Sheets (MSDS) for each chemical used in this method to all personnel involved in this chemical analysis. Also, prepare a formal safety plan.
5.3 The following chemicals used in this method may be highly toxic or hazardous. Handle with extreme caution at all times. Consult the appropriate MSDS before handling.
5.3.1 Acetic acid, glacial, C2H4O2 (FW 60.05)
5.3.2 Acetone, C3H6O (FW 58.08)
5.3.3 Ligand exchange reagent, available cyanide (WAD) reagent A (PN A001416)
5.3.4 Ligand exchange reagent, available cyanide (WAD) reagent B (PN A001417)
5.3.5 Bismuth nitrate pentahydrate, Bi(NO3)3•5H2O (FW 485.07)
5.3.6 5-[4-(Dimethylamino)benzylidene]rhodanine, C12H12N2OS2 (FW 264.37)
5.3.7 Ethylenediamine, anhydrous, C2H8N2 (FW 60.10)
5.3.8 Mercury(II) cyanide, Hg(CN)2 (FW 252.63)
5.3.9 Nickel Potassium Cyanide, K2Ni(CN)4)•H2O (FW 240.96)
5.3.10 Potassium cyanide, KCN (FW 65.12)
3
Method OIA-1677: Available Cyanide
5.3.11 Silver nitrate, AgNO3 (FW 169.88)
5.3.12 Sodium acetate, anhydrous, C2H3O2Na (FW 82.03)
5.3.13 Sodium hydroxide, NaOH (FW 40.00)
5.3.14 Sulfuric acid, concentrated, H2SO4 (FW 98.08)
5.4 Unknown samples may be potentially hazardous. Handle with extreme caution at all times.
5.5 Use proper personal protective equipment (PPE) when handling or working with chemicals.
5.6 This method does not address all safety issues associated with its use. The laboratory is responsible for maintaining a safe work environment and a current awareness file of OSHA regulations regarding the safe handling of the chemicals specified in this method.
6.0 Apparatus, Equipment, and Supplies
6.1 FIA system with Available Cyanide, Method OIA-1677 configuration
6.2 Data acquisition system (PC or notebook PC)
6.3 Available Cyanide Cartridge
6.4 Gas diffusion membrane (OIA PN A001520)
NOTE: Replace the gas diffusion membrane when the baseline becomes noisy or every one to two weeks of use.
6.5 Sampling equipment include a sample bottle, amber glass, with polytetrafluoroethylene (PTFE)-lined cap. Clean by washing with detergent and water, rinsing with two reagent water aliquots, and drying by baking at 110 °–150 °C for a minimum of one hour.
6.6 Standard laboratory equipment such as volumetric flasks, pipettes, and syringes should be cleaned, rinsed, and dried per bottle cleaning procedure in Section 6.4.
7.0 Reagents and Calibrants
7.1 Raw materials
7.1.1 Acetic acid, glacial, C2H4O2 (FW 60.05)
7.1.2 Acetone, C3H6O (FW 58.08)
7.1.3 Ligand exchange reagent, available cyanide (WAD) reagent A (OIA PN A001416)
7.1.4 Ligand exchange reagent, available cyanide (WAD) reagent B (OIA PN A001417)
4

Method OIA-1677: Available Cyanide
7.1.5 Bismuth nitrate pentahydrate, Bi(NO3)3•5H2O (FW 485.07)
7.1.6 Deionized water (ASTM Type I or II)
7.1.7 5-[4-(Dimethylamino)benzylidene]rhodanine, C12H12N2OS2 (FW 264.37)
7.1.8 Ethylenediamine, anhydrous, C2H8N2 (FW 60.10)
7.1.9 Mercury(II) cyanide, Hg(CN)2 (FW 252.63)
7.1.10 Nickel Potassium Cyanide, K2Ni(CN)4)•H2O (FW 240.96)
7.1.11 Potassium cyanide, KCN (FW 65.12)
7.1.12 Silver nitrate, AgNO3 (FW 169.88)
7.1.13 Sodium acetate, anhydrous, C2H3O2Na (FW 82.03)
7.1.14 Sodium hydroxide, NaOH (FW 40.00)
7.1.15 Sulfuric acid, concentrated, H2SO4 (FW 98.08)
7.2 Reagent preparation
NOTE: For best results, filter and degas all reagents prior to use.
WARNING: Do not add surfactants to reagents as its presence could severely hinder or impede proper diffusionof cyanide through the gas diffusion membrane.
7.2.1 Reagent water
7.2.1.1 Prepare degassed and deionized reagent water using one of the following methods:
7.2.1.1.1 Place distilled/deionized water under a strong vacuum for 15–20 minutes. Magnetic stirring or sonication aids in the degassing process.
7.2.1.1.2 Purge distilled/deionized water with nitrogen gas (or other inert gas) through a glass frit for approximately five minutes.
7.2.1.1.3 Boil distilled/deionized water in an Erlenmeyer flask for 15–20 minutes. Remove the flask from the heat source, cover it with an inverted beaker, and allow it to cool to room temperature.
7.2.1.2 After preparing degassed reagent water, store it in a tightly-sealed container to protect it from reabsorbing atmospheric gases. For best results, store degassed reagent water under a slight vacuum when not used.
7.2.2 Startup Solution/Carrier–Reagent Water
5
Method OIA-1677: Available Cyanide
7.2.3 Sample preservation reagents
7.2.3.1 Acetate buffer (1 L)
7.2.3.1.1 Dissolve 146 g of sodium acetate anhydrous in 400 mL of reagent water (Section 7.2.1).
7.2.3.1.2 Add 480 g of glacial acetic acid. Dilute to 1,000 mL with reagent water in a 1-L volumetric flask and mix well.
7.2.3.2 Ethylenediamine solution, 3.5% v/v (100 mL)
7.2.3.2.1 Dilute 3.5 mL of ethylenediamine to 100 mL with reagent water in a 100-mL volumetric flask and mix well.
7.2.3.3 Ascorbic acid—crystals
7.2.3.4 Sodium Arsenite–crystals
7.2.4 Quality control reagents
WARNING: Cyanide ion, hydrocyanic acid, all cyanide salts, and most metal-cyanide complexes are extremely dangerous. As a contact poison, cyanide does not need to be ingested to produce toxicity. Also, cyanide solutions produce fatally toxic hydrogen cyanide gas when acidified. For these reasons, any method involving cyanide in a sample or reagent should only be performed by properly trainedpersonnel wearing adequate personal protective equipment.
7.2.4.1 Sodium hydroxide solution, 1 M (1 L)
7.2.4.1.1 While stirring, carefully add 40 g of sodium hydroxide in 700 mL of reagent water in a 1-L volumetric flask.
7.2.4.1.2 Cool to room temperature. Dilute to 1,000 mL with reagent water and mix well.
WARNING: Mixing sodium hydroxide with water releases a great amount of heat. Take appropriate precautions.
NOTE: Store in an amber bottle at room temperature.
7.2.4.2 Nickel(II) cyanide stock solution, 1,000 mg/L cyanide (100 mL)
7.2.4.2.1 Dissolve 0.2488 g of nickel potassium cyanide in 25 mL of reagent water and1 mL of 1 M sodium hydroxide (Section 7.2.4.1) in a 100-mL volumetric flask.
7.2.4.2.2 Dilute to 100 mL with reagent water and mix well.
7.2.4.3 Mercury(II) cyanide stock solution, 1,000–mg/L cyanide (100 mL)
7.2.4.3.1 Dissolve 0.486 g of mercury(II) cyanide in 25 mL of reagent water and 1 mL of 1 M sodium hydroxide (Section 7.2.4.1) in a 100-mL volumetric flask.
6

Method OIA-1677: Available Cyanide
7.2.4.3.2 Dilute to 100 mL with reagent water and mix well.
7.2.4.4 Nickel(II) cyanide working solution, 2 mg/L cyanide (100 mL)
7.2.4.4.1 Add 0.2 mL of nickel(II) cyanide stock solution (Section 7.2.4.2) to 25 mL ofreagent water and 1 mL of 1 M sodium hydroxide (Section 7.2.4.1) in a 100-mL volumetric flask.
7.2.4.4.2 Dilute to 100 mL with reagent water and mix well.
7.2.4.5 Mercury(II) cyanide working solution, 2 mg/L cyanide (100 mL)
7.2.4.5.1 Add 0.2 mL of mercury(II) cyanide stock solution (Section 7.2.4.3) to 25 mL of reagent water and 1 mL of 1 M sodium hydroxide (Section 7.2.4.1) in a 100-mL volumetric flask.
7.2.4.5.2 Dilute to 100 mL with reagent water and mix well.
7.2.5 FIA reagents
7.2.5.1 Carrier, available acid reagent, WAD Carrier (1 L)
NOTE: For use when Sulfide is not present.
7.2.5.1.1 Add 8 mL of concentrated hydrochloric acid to approximately 800 mL ofreagent water in a 1-L volumetric flask.
7.2.5.1.2 Dilute to 1,000 mL with reagent water and mix well.
WARNING: Mixing hydrochloric acid with water releases a great amount of heat. Take appropriate precautions.
7.2.5.2 Sulfide Removal acidification reagent SAR(1 L) (OIA PN A001872)
7.2.5.2.1 Weigh 1.00 g of bismuth nitrate pentahydrate into a 1-L volumetric flask.
7.2.5.2.2 Add 55 mL of reagent water.
7.2.5.2.3 Carefully add 55 mL of concentrated sulfuric acid. Gently swirl the flask to dissolve the bismuth nitrate pentahydrate.
7.2.5.2.4 Dilute to 1,000 mL with reagent water and mix well.
7.2.5.3 Sulfide Removal Carrier Reagent (SCR) (OIA PN A001668)
7.2.5.3.1 Deionized water (ASTM Type I or II)
NOTE: Use the SAR and SCR reagents for all samples suspected to contain sulfide.
WARNING: Mixing concentrated sulfuric acid with water releases a great amount of heat. Take appropriate precautions.
7

Method OIA-1677: Available Cyanide
7.2.5.4 Base reagent stock solution, 10 M sodium hydroxide (1 L)
7.2.5.4.1 While stirring, carefully add 400 g of sodium hydroxide in 700 mL of reagent water in a 1-L volumetric flask.
7.2.5.4.2 Cool to room temperature. Dilute to 1,000 mL with reagent water and mix well.
WARNING: Mixing sodium hydroxide with water releases a great amount of heat. Take appropriate precautions.
NOTE: Store in a plastic bottle at room temperature.
7.2.5.5 Base reagent, 0.1 M sodium hydroxide (1 L)
7.2.5.5.1 Dilute 10 mL of acceptor stock solution (Section 7.2.5.4) with reagent water to 1,000 mL in a 1-L volumetric flask and mix well.
NOTE: CO2 from atmosphere absorbs into NaOH solution. Do not shake or mix stock reagent prior to pipeting. Always pipet from top.
NOTE: Store in a plastic bottle at room temperature.
7.2.5.6 Ligand exchange reagent, available cyanide (WAD) reagent A (OIA PN A001416)
NOTE: Store at 4 °C. Keep the bottle closed, unless in use. If stored properly, available cyanide reagent A is stable for approximately six months after opening.
NOTE: Check available cyanide reagent A monthly after opening. Adjust a sample of 2 mg/L nickel(II) cyanide working solution (Section 7.2.4.4) to pH 12. Treat the nickel(II) cyanide sample with the available cyanide reagent A according to Section 11.1 and proceed with the analysis to confirm cyanide recovery.
7.2.5.7 Ligand exchange reagent, available cyanide (WAD) reagent B (OIA PN A001417)
NOTE: Store at 4 °C. Keep the bottle closed, unless in use. If stored properly, available cyanide reagent B is stable for approximately six months after opening.
NOTE: Check available cyanide reagent B monthly after opening. Adjust a sample of 2 mg/L mercury(II)cyanide working solution (Section 7.2.4.5) to pH 12. Treat the mercury(II) cyanide sample with the available cyanide reagent B according to Section 11.1 and proceed with the analysis to confirm cyanide recovery.
7.3 Calibrant preparation
WARNING: Cyanide ion, hydrocyanic acid, all cyanide salts, and most metal-cyanide complexes are extremely dangerous. As a contact poison, cyanide does not need to be ingested to produce toxicity. Also, cyanide solutions produce fatally toxic hydrogen cyanide gas when acidified. For these reasons, any method involving cyanide in a sample or reagent should only be performed by properly trainedpersonnel wearing adequate personal protective equipment.
8
Method OIA-1677: Available Cyanide
7.3.1 Stock solutions
7.3.1.1 Standard silver nitrate solution, 0.0192 N (1 L)
7.3.1.1.1 Dissolve 3.27 g of silver nitrate in 700 mL of reagent water in a 1-L volumetric flask.
7.3.1.1.2 Dilute to 1,000 mL with reagent water and mix well.
NOTE: Store in an amber bottle at room temperature.
7.3.1.2 Rhodanine solution, 0.2 mg/mL in acetone (100 mL)
7.3.1.2.1 Dissolve 20 mg of 5-[4-(dimethylamino)benzylidene]rhodanine in 80 mL of acetone in a 100-mL volumetric flask.
7.3.1.2.2 Dilute to 100 mL with acetone and mix well.
7.3.1.3 Potassium cyanide stock solution, 1,000 mg/mL (1 L)
7.3.1.3.1 Dissolve 2 g of sodium hydroxide in 500 mL of reagent water in a 1-L volumetric flask.
WARNING: Mixing sodium hydroxide with water releases a great amount of heat. Take appropriate precautions.
7.3.1.3.2 Add 2.51 g of potassium cyanide. Dilute to 1,000 mL with reagent water and mix well.
NOTE: Store in an amber bottle at 4 °C. If stored properly, this reagent is typically stable for two months.
NOTE: This stock solution can be purchased from a reputable supplier.
7.3.1.4 Standardized potassium cyanide stock solution
7.3.1.4.1 Add 0.5 mL of rhodanine solution (Section 7.3.1.2) to 25 mL of potassium cyanide stock solution (Section 7.3.1.3).
7.3.1.4.2 Titrate with silver nitrate solution (Section 7.3.1.1) until the color changes from canary yellow to a salmon hue.
7.3.1.4.3 Based on the determined potassium cyanide concentration, dilute the potassium cyanide stock solution to a final concentration of 1.00 g/L using Equation 1. If the concentration is not 1.00 g/L, correct the intermediate and working calibration concentrations accordingly.
9

Method OIA-1677: Available Cyanide
NOTE: Store in an amber bottle at 4 °C. If stored properly, this reagent is typically stable for 1 year
EQUATION 1
(xV1 )= CV2
Where:
x = Concentration of potassium cyanide stock solution (in mg/L) determined from titrations V1 = Volume (in L) of potassium cyanide stock solution needed to prepare 1 L of 1.00 g/L standardized potassium cyanide stock solutionC = 1.00 g/L potassium cyanide V2 = 1 L, final volume (in L) of standardized potassium cyanide stock solution
7.3.2 Secondary calibrants
7.3.2.1 Cyanide, 100 mg/L (1 L)
7.3.2.1.1 Add 100 mL of standardized potassium cyanide stock solution (Section 7.3.1.4)and 10 mL of 1 M sodium hydroxide (Section 7.2.4.1) to a 1-L volumetric flask.
7.3.2.1.2 Dilute to 1,000 mL with reagent water and mix well.
NOTE: Store in an amber bottle at 4 °C. If stored properly, this reagent is typically stable for 6 months.
7.3.2.2 Cyanide, 10 mg/L (1 L)
7.3.2.2.1 Use a volumetric pipet to add 10 mL of standardized potassium cyanide stock solution (Section 7.3.1.4) and 10 mL of 1 M sodium hydroxide (Section 7.2.4.1)to a 1-L volumetric flask.
7.3.2.2.2 Dilute to 1,000 mL with reagent water and mix well.
NOTE: Store in an amber bottle at 4 °C. If stored properly, this reagent is typically stable for 6 months.
7.3.2.3 Cyanide, 1 mg/L (1 L)
7.3.2.3.1 Use a volumetric pipet to add 1 mL of standardized potassium cyanide stock solution (Section 7.3.1.4) and 1 mL of 1 M sodium hydroxide (Section 7.2.4.1) to a 1-L volumetric flask.
7.3.2.3.2 Dilute to 1,000 mL with reagent water and mix well.
NOTE: Prepare secondary calibrants weekly.
7.3.3 Working calibrants
10
Method OIA-1677: Available Cyanide
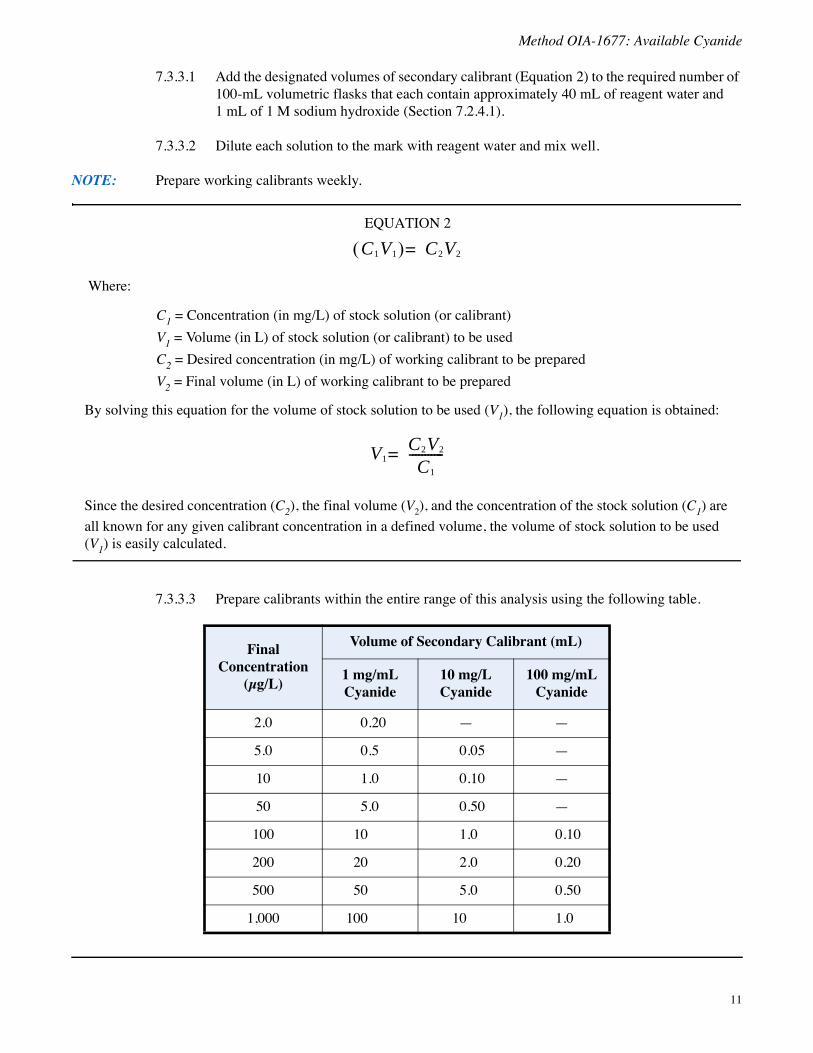
7.3.3.1 Add the designated volumes of secondary calibrant (Equation 2) to the required number of100-mL volumetric flasks that each contain approximately 40 mL of reagent water and 1 mL of 1 M sodium hydroxide (Section 7.2.4.1).
7.3.3.2 Dilute each solution to the mark with reagent water and mix well.
NOTE: Prepare working calibrants weekly.
EQUATION 2
(C1 V1 )= C2 V2
Where:
C1 = Concentration (in mg/L) of stock solution (or calibrant) V1 = Volume (in L) of stock solution (or calibrant) to be used C2 = Desired concentration (in mg/L) of working calibrant to be prepared V2 = Final volume (in L) of working calibrant to be prepared
By solving this equation for the volume of stock solution to be used (V1), the following equation is obtained:
C2 V2V1 = -----------C1
Since the desired concentration (C2), the final volume (V2), and the concentration of the stock solution (C1) are all known for any given calibrant concentration in a defined volume, the volume of stock solution to be used (V1) is easily calculated.
7.3.3.3 Prepare calibrants within the entire range of this analysis using the following table.
Final Concentration
(μg/L)
Volume of Secondary Calibrant (mL)
1 mg/mL Cyanide
10 mg/L Cyanide
100 mg/mL Cyanide
2.0 0.20 — —
5.0 0.5 0.05 —
10 1.0 0.10 —
50 5.0 0.50 —
100 10 1.0 0.10
200 20 2.0 0.20
500 50 5.0 0.50
1,000 100 10 1.0
11

Method OIA-1677: Available Cyanide
Final Concentration
(μg/L)
Volume of Secondary Calibrant (mL)
1 mg/mL Cyanide
10 mg/L Cyanide
100 mg/mL Cyanide
3,000 — 30 3.0
5,000 — 50 5.0
8.0 Sample Collection, Preservation, and Storage
8.1 Collect samples in amber glass bottles with minimal headspace that have been thoroughly cleaned and rinsed with reagent water (Section 7.2.1).
8.2 Ensure the volume of sample collected is sufficient to obtain a representative sample, analyze replicates, and minimize waste disposal. 40 mL amber VOA vials have been found sufficient. Adjust the pH to 11–12 by adding 1 drop of 10 M NaOH (7.2.4.4) per vial.
8.3 Perform sample analyses of unpreserved samples within 14 days or as soon as possible to eliminate changein analyte concentration with time.
8.4 Treat samples containing sulfide ion.
8.4.1 Test samples with lead acetate test paper moistened with acetate buffer (7.2.2.1) to determine the presence or absence of sulfide ion. Note that the lead acetate test paper can be unreliable and istypically not usable for sulfide concentrations below approximately 50 ppm.
8.4.1.1 If sulfide is detected by the lead acetate test strip (sulfide > 50 ppm), dilute sample so that sulfide is below amount detected by test strips and preserve according to Sections 8.1 and 8.2. Record dilution factor on chain of custody/sample bottle analyze samples within 14 days using sulfide removal acidification reagents (SAR section 7.2.4.2 and SCR 7.2.4.3).
8.4.1.2 Lead acetate test paper should be tested for minimum level of sulfide detection by spiking reagent water with 50–ppm sulfide. The spiked sample is tested with lead acetate test paper moistened with acetate buffer (Section 7.2.3.1). Test each new batch of test paper oracetate buffer to verify detectability of sulfide of 50 ppm
8.4.1.3 Sulfide abatement procedure: To remove up to 50 mg/L sulfide use the sulfide acidification reagent SAR (Section 7.2.5.2) instead of 0.10 M hydrochloric acid WAD AR, and use SCR (Section 7.2.4.3) for WAD carrier. The acidic solution of bismuth nitrate reacts with sulfide to form insoluble bismuth(III) sulfide that does not interfere with this test method.
8.4.2 If the sample contains particulate matter that would be removed with filtration, filter the sample. Available CN species are soluble in water, so particulate matter need not be analyzed.
12

Method OIA-1677: Available Cyanide
8.5 Treat samples containing or suspected to contain formaldehyde, acetaldehyde, or other water-soluble aldehydes with 20 mL of 3.5% ethylenediamine solution (Section 7.2.3.2) per liter of sample.
NOTE: Samples that have been disinfected by UN irradiation may to contain aldehydes.
8.6 Oxidizing agents such as chlorine can destroy most of the cyanide during storage and manipulation. Destroy the oxidizing agent at the time of sample collection so the test result reflects an accurate cyanide concentration in the source at the time of collection. Treat samples containing chlorine, hypochlorite, or sulfite with 0.6 g of ascorbic acid per liter of sample. If sample cannot be analyzed within 24 hours, use 0.1 g sodium arsenite per 100 mL sample.
8.6.1 Using a plastic pipette, place a drop of sample on a strip of potassium iodide-starch test paper.
8.6.2 If observing a bluish discoloration on the paper, add a few crystals of ascorbic acid or sodium arsenite to the sample with a spatula. Continue to add crystals and testing a drop of sample on the test paper until color is no longer produced on the test paper.
8.6.3 Add an additional 0.06 g of ascorbic acid (approximately one spatula full of crystals) per liter of sample.
NOTE: Samples treated with asorbic acid have a holding time of 24 hours.
8.7 High concentrations of carbonate can result in a negative response in the amperometric detector when carbon dioxide diffuses across the membrane into the alkaline acceptor reagent, reducing its pH. The high buffer capacity of the acceptor reagent largely eliminates sensitivity to carbonate. Use hydrated lime to stabilize samples such as effluents from coal gasification wastes, atmospheric emission scrub waters, and other high carbonate-containing wastes (> 1,500 mg/L CO -2). 3
8.7.1 Slowly add hydrated lime while stirring to raise the pH of the sample to 12.0–12.5.
8.7.2 Decant the sample after the precipitate settles.
9.0 Quality Control
9.1 Each laboratory that uses this method is required to operate a formal quality assurance program (Reference 15.9). The minimum requirements of this program consist of an initial demonstration of laboratory capability and the periodic analysis of Laboratory Control Samples (LCS) and Matrix Spike/Matrix Spike Duplicates (MS/MSD) as a continuing check on performance. Laboratory performance is compared to established performance criteria to determine if the results of the analyses meet the performance characteristics of the method.
9.1.1 The analyst shall make an initial demonstration of the ability to generate acceptable precision and accuracy with this method. This ability is established as described in Section 9.2.
9.1.2 In recognition of advances that are occurring in analytical technology and to allow the analyst to overcome sample matrix interferences, the analyst is permitted certain options to improve performance or lower the costs of measurements. Alternate determinative techniques, such as the substitution of spectroscopic or other techniques, and changes that degrade method performance are
13

Method OIA-1677: Available Cyanide
not allowed. If an analytical technique other than the techniques specified in this method is used, that technique must have a specificity equal to or better than the specificity of the techniques in thismethod for the analyte(s) of interest.
9.1.2.1 Each time a modification is made to this method, the analyst is required to repeat the procedure in Section 9.2. If the detection limit of the method will be affected by the change, the laboratory is required to demonstrate that the MDL is lower than one-third the regulatory compliance level or as low as or lower than that listed in Section 1.2. If calibration will be affected by the change, the analyst must recalibrate the instrument per Section 10.4.
9.1.2.2 The laboratory is required to maintain records of modifications made to this method. These records include the information in this subsection, at a minimum.
9.1.2.2.1 The names, titles, addresses, and telephone numbers of the analyst(s) who performed the analyses and modification, and of the quality control officer who witnessed and will verify the analyses and modification.
9.1.2.2.2 A narrative stating the reason(s) for the modification.
9.1.2.2.3 Results from all quality control (QC) tests comparing the modified method to this method include the following:
a. Calibration (Section 10.4)
b. Calibration verification (Section 9.5)
c. Initial precision and recovery (Section 9.2.2)
d. Analysis of blanks (Section 9.4)
e. Ongoing precision and recovery (Section 9.6)
f. Matrix spike and matrix spike duplicate (Section 9.3)
9.1.2.2.4 Data that will allow an independent reviewer to validate each determination by tracing the instrument output (peak height, area, or other signal) to the final result. These data include the following:
a. Sample numbers and other identifiers
b. Analysis dates and times
c. Analysis sequence/run chronology
d. Sample weight or volume
e. Sample volume prior to each cleanup step, if applicable
14

Method OIA-1677: Available Cyanide
f. Sample volume after each cleanup step, if applicable
g. Final sample volume prior to injection
h. Injection volume
i. Dilution data, differentiating between dilution of a sample or modified sample
j. Instrument and operating conditions
k. Other operating conditions
l. Detector
m. Printer tapes, disks, and other recording of raw data
n. Quantitation reports, data system outputs, and other data necessary to link raw data to the results reported
9.1.3 Analyses of MS/MSD samples are required to demonstrate method accuracy and precision and to monitor matrix interferences (interferences caused by the sample matrix). The procedure and QC criteria for spiking are described in Section 9.3.
9.1.4 Analyses of laboratory reagent blanks (LRB) are required to demonstrate freedom from contamination and that the compounds of interest and interfering compounds have not been carried over from a previous analysis. The procedures and criteria for analysis of an LRB are described in Section 9.4.
9.1.5 The laboratory shall, on an ongoing basis, demonstrate through the analysis of the LCS that the analytical system is in control. This procedure is described in Section 9.6.
9.1.6 The laboratory should maintain records to define the quality of data that is generated. Developmentof accuracy statements is described in Sections 9.3.8 and 9.6.3.
9.1.7 Accompanying QC for the determining cyanide is required per analytical batch. An analytical batch is a set of samples analyzed at the same time to a maximum of 10 samples. Each analytical batch of 10 or fewer samples must be accompanied by a laboratory reagent blank (LRB, Section 9.4), a laboratory control sample (LCS, Section 9.6), and a matrix spike and matrix spike duplicate (MS/MSD, Section 9.3), resulting in a minimum of five analyses (one sample, one LRB, one LCS, one MS, and one MSD) and a maximum of 14 analyses (10 samples, one LRB, one LCS, one MS, and one MSD) in the batch. If more than 10 samples are analyzed at one time, the samples must be separated into analytical batches of 10 or fewer samples.
15

Method OIA-1677: Available Cyanide
9.2 Initial demonstration of laboratory capability
9.2.1 Method Detection Limit (MDL)—To establish the ability to detect cyanide at low levels, the analyst shall determine the MDL per the procedure in CFR Title 40 Part 136 (40 CFR 136), Appendix B (Reference 15.7) using the apparatus, reagents, and standards that will be used in the practice of this method. An MDL less than or equal to the MDL listed in Section 1.2 must be achieved prior to practice of this method.
9.2.2 Initial Precision and Recovery (IPR)—To establish the ability to generate acceptable precision and accuracy, the analyst shall perform the following operations:
9.2.2.1 Analyze four samples of the LCS (mercury(II) cyanide working solution, 2–mg/L cyanide, Section 7.2.4.5) according to the procedure beginning in Section 10.0.
NOTE: For OIA 1677-DW, use standard prepared from KCN as the LCS.
9.2.2.2 Using the results of the set of the four analyses, compute the average percent recovery (x)and the standard deviation of the percent recovery (s) for cyanide. Use Equation 3 for the calculating the standard deviation of the percent recovery (s).
EQUATION 3
2 (Σx)2
Σx – -------------ns = ---------------------------
n – 1
Where:
s = standard deviation of the percent recovery n = Number of samples x = Percent recovery in each sample
9.2.2.3 Compare s and x with the precision and percent recovery acceptance criteria specified in Section 13, Table 1. If the value of s exceeds the precision limit or the value of x falls outside the range for recovery, system performance is unacceptable and the problem must be found and corrected before the analysis may continue.
9.3 Matrix Spike/Matrix Spike Duplicate (MS/MSD)—The laboratory shall spike, in duplicate, a minimum of10% of all samples (one sample in duplicate in each batch of 10 samples) from a given sampling site.
9.3.1 Determine the spike concentration as follows:
9.3.1.1 If, as in compliance monitoring, the concentration of cyanide in the sample is being checked against a regulatory concentration limit, the spiking level shall be at that limit or at one to five times higher than the background concentration of the sample (determined in Section 9.3.2), whichever concentration is higher.
16

Method OIA-1677: Available Cyanide
9.3.1.2 If the cyanide concentration in a sample is not being checked against a limit, the spike shall be at the concentration of the LCS or at least four times greater than the MDL.
9.3.2 Analyze one sample aliquot out of each set of 10 samples from each site or discharge according to the procedure beginning in Section 10.0 to determine the background concentration of cyanide.
9.3.2.1 If necessary, prepare a stock solution appropriate to produce a concentration level in the sample at the regulatory compliance limit or at one to five times the background concentration of cyanide (Section 9.3.1).
9.3.2.2 Spike two additional sample aliquots with the spiking solution (Section 9.3.2.1) and analyze these aliquots to determine the concentration after spiking.
9.3.3 Calculate the percent recovery of cyanide in each aliquot using Equation 4.
EQUATION 4
P A B– = ------------- × 100T
Where:
P = Percent recovery A = Measured concentration of potassium cyanide after spiking (Section 9.3.2.2) B = Measured background concentration of potassium cyanide (Section 9.3.2) T = True concentration of the spike
9.3.4 Compare the recovery to the QC acceptance criteria in Section 13, Table 1. If percent recovery is outside of the acceptance criteria, and the recovery of the LCS in the ongoing precision and recoverytest (Section 9.6) for the analytical batch is within the acceptance criteria, an interference is present. In this case, the result may not be reported for regulatory compliance purposes.
9.3.5 If the results of both the MS/MSD and the LCS test fail the acceptance criteria, the analytical system is judged to be out of control. In this case, the problem shall be identified and corrected, and the analytical batch must be reanalyzed.
17

------------------------------
Method OIA-1677: Available Cyanide
9.3.6 Compute the relative percent difference (RPD) between the two spiked sample results (Section 9.3.2.2, not between the two percent recoveries) using Equation 5.
EQUATION 5
D1 – D2RPD = × 100(D1 + D2 ) ⁄ 2
Where:
RPD = Relative percent difference D1 = Concentration of potassium cyanide in the spiked sample D2 = Concentration of potassium cyanide in the spiked duplicate sample
9.3.7 If the RPD is greater than 11%, the analytical system is judged to be out of control, and the problem must be immediately identified and corrected. The analytical batch must be reanalyzed.
9.3.8 As part of the QC program for the laboratory, method precision and accuracy for samples should be assessed and records should be maintained. After the analysis of five spiked samples in which the recovery passes the test in Section 9.3.4, compute the average percent recovery (Pa) and the standard deviation of the percent recovery (sp). Express the accuracy assessment as a percent recovery interval from Pa–2sp to Pa+2sp. For example, if Pa = 90% and sp = 10% for five analyses, the accuracy interval is expressed as 70–110%. Update the accuracy assessment on a regular basis (e.g., after each 5–10 new accuracy measurements).
9.4 Laboratory Reagent Blanks (LRB) are analyzed to demonstrate freedom from contamination.
9.4.1 Analyze an LRB initially (i.e., with the tests in Section 9.2) and with each analytical batch. The LRB must be subjected to the exact same procedural steps as a sample.
9.4.2 If cyanide is detected in the LRB at a concentration greater than the ML, analysis of samples is halted until the source of contamination is eliminated and consequent analysis of another LRB shows no evidence of contamination.
9.5 Calibration verification—Verify calibration of the analytical equipment before and after each analytical batch of 14 or fewer measurements. (The 14 measurements will normally be 10 samples, one LRB, one LCS, one MS, and one MSD). This can be accomplished by analyzing the midrange calibration standard and verifying that it is within the QC acceptance criteria for recovery in Section 13, Table 1. The concentration of the calibration verification depends on the calibration range being used. Failure to attain recoveries withinthe acceptance criteria requires recalibration of the analytical system (Section 10.4).
9.6 Laboratory Control Sample (LCS)—To demonstrate that the analytical system is in control and acceptable precision and accuracy is being maintained with each analytical batch, the analyst shall perform the following operations:
9.6.1 Analyze an LCS with each analytical batch according to the procedure in Section 10.0.
18

Method OIA-1677: Available Cyanide
9.6.2 If the precision and recovery for the LCS are within the acceptance criteria specified in Section 13, Table 1, analysis of the batch may continue. If, however, the concentration is not within this range, the analytical process is not in control. In this event, correct the problem, repeat the LCS test, and reanalyze the batch.
9.6.3 The laboratory should add results that pass the specification in Section 9.6.2 to IPR and previous LCS data and update QC charts to form a graphic representation of continued laboratory performance. The laboratory should also develop a statement of laboratory data quality for cyanide by calculating the average percent recovery (R) and the standard deviation of the percent recovery (sr). Express the accuracy as a recovery interval from R–2sr to R+2sr. For example, if R = 95% and s = 5%, the accuracy is 85–105%. r
9.7 Reference sample—To demonstrate that the analytical system is in control, the laboratory may periodically test an external reference sample, such as a Standard Reference Material (SRM) available from the National Institute of Standards and Technology (NIST). Corrective action should be taken if the measured concentration significantly differs from the stated concentration.
10.0 Configuration and Startup
10.1 Instrument configuration
10.1.1 Configure the instrument according to the manufacturer’s Operator’s Manual and verify each module is properly powered on.
10.1.2 Verify the system is configured as illustrated in the manufacturer’s flow diagram shown in Section 17.0.
10.1.3 Connect the appropriate pump tubes to the cartridge and to their reagent containers according to the flow diagram.
10.2 Instrument stabilization
10.2.1 Start the pump and allow the reagents to flow through the entire system.
10.2.2 Verify the detector’s flowcell is purged of all bubbles and the flow is stable and free from surging.
10.2.3 Set the detector to zero and connect the leads to the flowcell.
10.2.4 Load a 5-mg/L cyanide calibrant into the sampling valve and inject it into the FIA system.
10.2.5 Continue to inject 5-mg/L cyanide calibrant until three successive peak heights or area results are within 2% RSD, indicating a stable electrode system.
10.3 Baseline verification
10.3.1 Create and save a method. See the manufacturer’s operator’s manual (Reference 15.14) for help creating a method.
19
Method OIA-1677: Available Cyanide
10.3.2 Create and save a sample table used to generate a calibration curve using at least three calibrants that cover the full range of expected concentrations in the samples to be analyzed. This sample table should also be used to analyze all necessary QC samples as well as the analytical batch of samples to be analyzed. For help on creating a sample table, see the manufacture’s operator’s manual.
10.3.3 Start collecting baseline data, monitoring for sharp fluctuations or drift Very sharp fluctuations in the baseline or consistent drifting typically indicate bubbles in the amperometric flowcell. The flowcellmust be free of bubbles prior to beginning analysis.
10.4 Calibration and Standardization
10.4.1 Prepare a series of at least three working calibrants using the stock solutions (Section 7.3.3)according to Equation 2, covering the desired analysis range. The concentration of one of the standards should be at the minimum level, unless measurements are made at higher levels. The other concentrations should correspond to the expected range of sample concentrations.
10.4.2 Place the calibrants in the autosampler in increasing concentration order. Analyze each calibrant according to the analytical procedures in Section 11.0.
10.4.3 Establish acceptance or control limits for the calibration results using the difference between the measured value of each calibrant and the corresponding “true” concentration.
10.4.4 Verify each calibration curve by analyzing a Laboratory Control Sample (LCS, Section 9.5). The software performs calibration, verification, and sample analysis in one continuous analysis.
11.0 Procedure
11.1 Ligand exchange reagent treatment
NOTE: When adding ligand exchange reagents to the cyanide-containing solution in the specifiedproportions, up to 5 mg/L cyanide ion becomes liberated from metal complexes of intermediate stability. If higher cyanide concentrations are present, increase the amount of ligand exchange reagent added, or dilute the cyanide-containing solution appropriately.
11.1.1 Add 50 μL of available cyanide reagent A (Section 7.2.5.6) and 100 μL of available cyanide regentB (Section 7.2.5.7) to 100 mL of each sample, standard, or blank. Mix well.
11.1.2 Unless using the sulfide removal acidification reagent (Section 7.2.5.2), analyze the treated samples within two hours of adding ligand exchange reagents.
11.2 Analysis
11.2.1 Place all reagents on-line and allow to pump at least 10–15 minutes. Verify no bubbles are in the flowcell. Obtain a stable baseline and autozero the baseline before beginning the analysis.
11.2.2 Load the sampler tray with calibrants, blanks, samples, and QC samples.
NOTE: The matrix of the working standards, blanks, and QC samples should match that of the samples being analyzed.
20

Method OIA-1677: Available Cyanide
11.2.3 Using the method and sample table created for the analytical batch to be analyzed and with the baseline verified to be stable, begin the analysis. This initiates the sequential sample analysis as defined in the sample table.
11.2.4 When analysis completes, do the following:
11.2.4.1 Disconnect the leads from the flowcell.
11.2.4.2 Pump reagents through the system for at least 10–15 minutes.
11.2.4.3 Stop the pump, and wait for flow to stop.
11.2.4.4 Release tension on all pump tubes.
11.2.4.5 Close the stopcock or pinch valve on the flowcell waste line to keep the sodium hydroxide solution inside the flowcell.
11.2.4.6 Power off the system.
12.0 Data Analysis and Calculations
12.1 The calibration curve allows accurate quantitation of each sample’s concentration.
12.2 Software reports each sample’s concentration relative to the calibration curve.
12.3 Reporting
12.3.1 Samples: report results to three significant figures for cyanide concentrations found above the ML inall samples. Report results below the ML as <2 μg/L, or as required by the permitting authority or permit.
12.3.2 Blanks: report results to three significant figures for cyanide concentrations found above the MDL. Do not report results below the MDL unless required by the permitting authority or in the permit.
21

Method OIA-1677: Available Cyanide
13.0 Method Performance
Table 1. QC acceptance criteria
Parameter Required RecoveryRange (%) Precision
Initial precision and recovery 92–122 <5.1% RSD
Ongoing precision and recovery 82–132 n/a
Matrix spike/matrix spike duplicate 82–130 <11% RSD
Calibration verification 86–118 n/a
14.0 Pollution Prevention and Waste Management
14.1 It is the laboratory’s responsibility to comply with all federal, state, and local regulations governing waste management, particularly the hazardous waste identification rules and land-disposal restrictions. In addition, it is the laboratory’s responsibility to protect air, water, and land resources by minimizing and controlling all releases from fume hoods and bench operations. Also, compliance is required with any sewage discharge permits and regulations.
14.2 Samples containing cyanide and certain metals and acids at a pH of less than two are hazardous and must betreated before being poured down a drain or must be handled as hazardous waste.
14.3 For further information on waste management, consult Section 13.6 of Less is Better: Laboratory Chemical Management for Waste Reduction (Reference 15.10).
15.0 References
15.1 Wilmont, J.C.; Solujic, L.; Milosavljevic, E. B.; Hendrix, J.L.; Rader, W.S. Formation of Thiocyanate During Removal of Sulfide as Lead Sulfide Prior to Cyanide Determination. Analyst 1996, 121, 799–801.
15.2 Standard Test Methods for Cyanides in Water. Annual Book of ASTM Standards Volume 11.02, ASTM International; ASTM D6888-04, and ASTM D7284-08.
15.3 CNSolution Operator’s Manual (PN 322801). Available from OI Analytical, P.O. Box 9010, College Station, TX, 77842-9010.
15.4 Milosavljevic, E.B.; Solujic, L. How to Analyze for Cyanide. Cyanide: Social Industrial and Economic Aspects. The Minerals, Metals, and Materials Society. 2001, 125–128.
15.5 Ingersol, D.; Harris, W.R.; Bomberger, D.C.; Coulson, D.M. Development and Evaluation Procedures for the Analysis of Simple Cyanides, Total Cyanides, and Thiocyanate in Water and Waste Water: 1983; EPA-600/483-054; U.S. Environmental Protection Agency, Environmental Monitoring Systems Laboratory, U.S. Government Printing Office: Washington, DC, 1983.
15.6 Milosavljevic, E.B.; Solujic, L.; Hendrix, J.L. Environ. Sci. Technol. 1995, 29 (No. 2), 426–430.
22

Method OIA-1677: Available Cyanide
15.7 Federal Register, CFR Title 40, Part 136, Appendix B, U.S. Government Printing Office: Washington, DC, 1994.
15.8 Guide to Method Flexibility and Approval of EPA Water Methods. Available from the National Technical Information Service (PB97-117766).
15.9 Handbook for Analytical Quality Control in Water and Wastewater Laboratories: 1979; EPA-600/4-79-019; U.S. Environmental Protection Agency, Environmental Monitoring Systems Laboratory, U.S. Government Printing Office: Washington, DC, 1979.
15.10 Less is Better: Laboratory Chemical Management for Waste Reduction. Available from the American Chemical Society, Department of Government Regulations and Science Policy, 1155 16th Street, NW, Washington, DC 20036.
15.11 Sample Preparation. Methods for the Chemical Analysis of Water and Wastes; EPA/600/4-79-020; Environmental Protection Agency, Environmental Monitoring Systems Laboratory, U.S. Government Printing Office: Washington, DC, 1983.
15.12 Report of the Draft Method OIA-1677 Interlaboratory Validation Study, March 1997. Available from OI Analytical, Box 9010, College Station, TX 77842-9010.
15.13 Report of the Draft Method OIA-1677 Single Laboratory Validation Study, November 1996. Available from OI Analytical, Box 9010, College Station, TX 77842-9010.
15.14 WinFLOW Software and Operator’s Manual (PN A002877). Available from OI Analytical, P.O. Box 9010, College Station, TX, 77842-9010.
16.0 Glossary of Definitions and Purposes
The definitions and purposes are specific to this method but have been conformed to common use as much as possible.
16.1 Units of weights and measures and their abbreviations
16.1.1 Symbols
° C degrees Celsius
% percent
± plus or minus
≥ greater than or equal to
≤ less than or equal to
23

Method OIA-1677: Available Cyanide
16.1.2 Alphabetical characters
g gram
L liter
mg milligram
mg/L milligram per liter
μg microgram
μg/L microgram per liter
mL milliliter
ppm parts per million
ppb parts per billion
M molar solution
N normal solution
24

Method OIA-1677: Available Cyanide
16.2 Definitions
16.2.1 Initial Precision and Recovery (IPR)—Four aliquots of the LRB spiked with the analytes of interest and used to establish the ability to generate acceptable precision and accuracy. An IPR is performed the first time this method is used and any time the method or instrumentation is modified.
16.2.2 Laboratory Control Sample (LCS)—An aliquot of LRB to which a quantity of the analyte of interest is added in the laboratory. The LCS is analyzed like a sample. Its purpose is to determine whether the methodology is in control and whether the laboratory is capable of making accurate and precise measurements.
16.2.3 Laboratory Reagent Blank (LRB)—An aliquot of reagent water and other blank matrix that is treated like a sample, including exposure to all glassware, equipment, and reagents that are used with other samples. The LRB is used to determine if the method analyte or other interferences are present in the laboratory environment, reagents, or apparatus.
16.2.4 Matrix Spike/Matrix Spike Duplicate (MS/MSD)—An aliquot of an environmental sample to which a quantity of the method analyte is added in the laboratory. The MS/MSD is analyzed like a sample. Its purpose is to determine whether the sample matrix contributes bias to the analytical results. The background concentration of the analyte in the sample matrix must be determined in a separate aliquot, and the measured values in the MS/MSD must be corrected for the background concentration.
16.2.5 Method Detection Limit (MDL)—The minimum concentration of a substance that can be measuredand reported with 99% confidence that the analyte concentration is greater than zero.
16.2.6 Minimum Level (ML)—The level at which the entire analytical system gives a recognizable signal and acceptable calibration point, taking into account method-specific sample and injection volumes.
16.2.7 Ongoing Precision and Recovery (OPR)—See Section 16.2.2, “Laboratory Control Sample.”
25

Method OIA-1677: Available Cyanide
17.0 Appendix
17.1 MDLs from nine laboratories were pooled to develop the MDL of 0.5 μg/L given in Section 1.3 (Reference 15.12).
17.2 Table 3 summarizes data obtained from single laboratory testing of the method. Recoveries and reproducibility for “free” forms of cyanide are shown, including the recovery and reproducibility of silver, nickel, mercurous, and mercuric cyanide species. Determining these species tends to be problematic with other methods for determining available cyanide. As is the case with other methods used for availablecyanide, iron cyanide species were not recovered and recoveries for gold and cobalt species were zero or very low. See the complete results from the single laboratory study in the Report of the Draft Method OIA-1677 Single Laboratory Validation Study (Reference 15.13).
17.3 Table 2 lists the QC acceptance criteria developed from an interlaboratory validation study of this method. This study was conducted following procedures specified in the Guide to Method Flexibility and Approval of USEPA Water Methods (Reference 15.8). A total of nine laboratories performed analyses for various water matrices. Table 4 shows a summary of the interlaboratory results, which include the accuracy and precision data as percent recoveries and relative standard deviations. In addition to spikes of easily dissociable cyanides, some samples contained known amounts of cyanides that are not recoverable (e.g., platinum and iron complexes), and thiocyanate was spiked to one sample to investigate the potential for interference. See the complete study results in the Report of the Draft Method OIA-1677 Interlaboratory Validation Study (Reference 15.12).
Table 2. Species-dependent cyanide recoveries using Method OIA-1677
Species
0.20 mg/L CN– 2.0 mg/L CN–
Recovery (%)
Precision (% RSD)
Recovery (%)
Precision (% RSD)
[Zn(CN)4]2– 97.4 (0.7) 98.5 (0.7)
[Cd(CN)4]2– 100.0 (0.8) 100.0 (0.2)
[Cu(CN)4]2– 100.9 (1.3) 99.0 (0.6)
[Ag(CN)4]3– 101.8 (0.9) 100.0 (0.5)
[Ni(CN)4]2– 104.3 (0.2) 103.0 (0.5)
[Hg(CN)4]2– 100.0 (0.6) 99.0 (0.3)
Hg(CN)2 103.4 (0.4) 98.0 (0.3)
[Fe(CN)6]4– 0.0 (n/a) 0.0 (n/a)
[Fe(CN)6]3– 0.0 (n/a) 0.0 (n/a)
26

Method OIA-1677: Available Cyanide
Table 3. QC acceptance criteria
Parameter Required RecoveryRange (%) Precision
Initial precision and recovery 92–122 <5.1% RSD
Ongoing precision and recovery 82–132 n/a
Matrix spike/matrix spike duplicate 82–130 <11% RSD
Calibration verification 86–118 n/a
Table 4. Cyanide recoveries from various aqueous matrices
Sample Description Sample CN–Concentration
Added CN– Concentration2
Average% Recovery
Relative Standard Deviation
Reagent water w/ 0.01 M sodiumhydroxide
0 μg/L 100 μg/L as KCN 108 4.0
POTW secondary effluent 3.0 μg/L 100 μg/L as KCN, 2 mg/L as [Pt(CN)6]
4– 102 7.0
Petroleum refinery secondary effluent
9.9 μg/L 2 mg/L as KCN, 5 mg/L as [Fe(CN)6]
4– 87 21
Coke plant secondary effluent 14.0 μg/L 50 μg/L as KCN 95 4.0
Rolling mill direct filter effluent 4.0 μg/L none 80 41
Metals finishing indirect primary effluent
1.0 μg/L 200 μg/L as KCN, 2 mg/L as KSCN
92 16
Reagent water w/ 0.01 M sodiumhydroxide
0 μg/L 200 μg/L as KCN 101 8.0
Reagent water w/ 0.01 M sodiumhydroxide
0 μg/L 10 mg/L as KCN, 10 mg/L as [Pt(CN)6]
4– 103 2.0
Mining tailing pond effluent 842 μg/L 4 mg/L as KCN 98 3.0
Cyano-complexes of platinum and iron were added to the POTW and petroleum refinery effluents, respectively.Thiocyanate was added to the metals finishing effluent to demonstrate that the FI/LE system does not determine these cyanide forms.
27