methodological guidelines kpi driving under the influence
TRANSCRIPT

Belgium | Austria | Bulgaria | Cyprus | Czech Republic | Finland | Germany | Greece | Ireland | Latvia | Lithuania | Luxembourg | Malta | Netherlands | Poland | Portugal | Slovakia | Spain | Sweden
baseline.vias.be
Methodological guidelines – KPI Driving under the Influence of Alcohol
Version 3.0, April 27, 2021

2/23
Belgium | Austria | Bulgaria | Cyprus | Czech Republic | Finland | Germany | Greece | Ireland | Latvia | Lithuania | Luxembourg | Malta | Netherlands | Poland | Portugal | Slovakia | Spain | Sweden
baseline.vias.be
Project: This document has been prepared in the framework of the BASELINE project, for which a grant has been awarded by the European Commission. Information on this project can be found on the website www.baseline.vias.be
References: (1) Grant agreement under the Connecting Europe Facility (CEF) No MOVE/C2/SUB/2019-558/CEF/PSA/SI2.835753 collection of Key Performance Indicators (KPIs) for road safety (2) Consortium agreement among the 19 partners of the Baseline project
Authors: Sofie Boets, Vias institute (Belgium), Peter Silverans, Vias institute (Belgium), Sjoerd Houwing, CBR (the Netherlands), Åsa Forsman, VTI (Sweden), Simone Klipp, BASt (Germany) and Katerina Folla, NTUA (Greece)
Publisher: Vias institute, Brussels, Belgium (www.vias.be)
Please refer to this document as follows: “Boets, S. et al. (2021). Methodological guidelines – KPI Driving under the Influence of Alcohol. Baseline project, Brussels: Vias institute”
Any comments or feedback regarding these guidelines should be sent to [email protected] .
Version history
Version Date Changes
1.0 December 11, 2020 First draft version - intended as a framework to discuss methodological issues in the technical committee
1.1 February 23, 2021 Second draft version including comments from the Technical Committee and experts of KPI Expert Group (KEG) Alcohol
1.2 March 03, 2021 Third draft for review by the Technical committee and the KEG
1.3 March 15th, 2021 Draft including all decisions from the Technical Committee and EC related to the questions from the KEG.
2.0 March 17th, 2021 Draft 1 for Baseline participants (clean version)
3.0 April 27th, 2022 Incorporation of feedback from Member States and finalisation of layout

3/23
Contents
Version history .................................................................................................................................... 2
Contents .............................................................................................................................................. 3
1 Introduction and aims ................................................................................................................. 4
2 Minimum requirements for roadside breath testing ............................................................... 4
2.1 Overall principles .............................................................................................................................................. 4 2.2 Vehicle types / drivers to be considered .......................................................................................................... 5 2.3 Road types to be included ................................................................................................................................ 6 2.4 Time period (time of day and day of week) .................................................................................................... 6 2.5 Optional elements ............................................................................................................................................ 7
2.5.1 Data on driver and trip characteristics ................................................................................................... 7 2.5.2 Blood alcohol concentration level .......................................................................................................... 7 2.5.3 Analysis by region ................................................................................................................................... 7
3 Measurement procedure for roadside breath testing ............................................................. 8
3.1 Sampling methods ............................................................................................................................................ 8 3.2 Minimum sample size for drivers ..................................................................................................................... 8 3.3 Sampling and selection of locations ................................................................................................................ 9 3.4 Measurement method ..................................................................................................................................... 11 3.5 Practical organisation of the control sessions ............................................................................................... 11 3.6 Counting of traffic at the control locations .................................................................................................... 11 3.7 Temporal considerations ................................................................................................................................. 12
4 Data analyses .............................................................................................................................. 12
4.1 Variables to be coded for roadside breath testing ........................................................................................ 12 4.2 Post stratification weights and statistical analysis......................................................................................... 13
5 Expected results ........................................................................................................................ 14
5.1 KPI values and confidence intervals ...............................................................................................................14 5.2 Data delivery ....................................................................................................................................................14 5.3 Methodological report .................................................................................................................................... 15
6 Requirements for self-reported data........................................................................................ 15
6.1 Introduction ..................................................................................................................................................... 15 6.2 Sample size....................................................................................................................................................... 15 6.3 Sampling methods .......................................................................................................................................... 16 6.4 Survey methods .............................................................................................................................................. 16 6.5 Recommendations for fieldwork .................................................................................................................... 17 6.6 Expected results .............................................................................................................................................. 17
7 Analysis of police enforcement data ....................................................................................... 18
References ........................................................................................................................................ 19
Annexes .............................................................................................................................................. 21
Annex 1. SWD minimal requirements ...................................................................................................................... 21 Annex 2. Rationale behind the minimum sample requirements for roadside breath testing ............................. 22 Annex 3. Summary overview of roadside breath testing requirements and recommendations ........................ 23

4/23
1 Introduction and aims
The Communication of the European Commission “Europe on the Move – Sustainable Mobility for Europe: safe, connected and clean” of the 13th May 2018 confirmed the EU's long-term goal of moving close to zero fatalities in road transport by 2050 and added that the same should be achieved for serious injuries. It also proposed new interim targets of reducing the number of road deaths by 50% between 2020 and 2030 as well as reducing the number of serious injuries by 50% in the same period. To measure progress, the most basic – and important – indicators are of course the result indicators on deaths and serious injuries.
In order to gain a much clearer understanding of the different issues that influence overall safety performance, the Commission has elaborated, in cooperation with Member State experts, a first set of key performance indicators (KPIs). The KPIs relate to main road safety challenges to be tackled, namely: (1) infrastructure safety, (2) vehicle safety, (3) safe road use including speed, alcohol, distraction and the use of protective equipment, and (4) emergency response. The aim of the KPIs is connected to EC target outcomes.
The aim of the BASELINE project, funded partially by the European Commission, is to assist participating Member States’ authorities in the collection and harmonized reporting of these KPIs and to contribute to building the capacity of Member States which have not yet collected and calculated the relevant data for the KPIs. The outcomes of this project will be used to set future European targets and goals based on the KPIs.
The purpose of this document is to further describe the minimal methodological requirements to qualify for the BASELINE KPIs for driving under the influence of alcohol, defined as:
Percentage of drivers driving within the legal limit for blood alcohol concentration (BAC)
The target audience of this document are the persons in the participating Member States that will collect and/or analyse the data to deliver the KPIs.
The minimum requirements set by the EC for this KPI are described in the Commission Staff Working Document SWD (2019) 283 (referred to as ‘SWD’) (see annex 1). These requirements are quantified and specified in this document. This is mainly based on expert consultation (BASELINE Key Expert Group), on Hakkart et al. (2007) (DRUID EC project) and Assum et al. (2007) (SafetyNet EC project).
Next to the specification of the minimum requirements (always marked bold) to deliver the main KPI and the disaggregated indicators, this document also includes recommendations for optional additional activities. Member States can decide whether to follow the minimum requirements only or to extend (part of) their methodology, depending on available means and their own research questions.
SWD allows three measurement methods, based on:
• Random breath testing, i.e. roadside breath testing of randomly selected drivers
• Breath testing results from enforcement actions (even if not random)
• Self-reported behaviour through anonymous surveys
The EC expresses a clear preference for a KPI based on random breath testing, as this is generally considered to deliver an accurate picture of the situation. However, as random testing is costly and not allowed in some Member States, breath testing results from enforcement actions is considered the second best option. If neither of these two options is feasible for objective reasons, data from self-reported behaviour based on anonymous surveys may also be accepted. It is up to the Member States to determine which method is realistic and feasible for them.
KPIs calculated from different methodologies cannot be mixed. They have to be delivered and presented separately. It is not acceptable to compare police data based on non-selective screening with police data based on selective screening with self-reported survey data.
2 Minimum requirements for roadside breath testing
2.1 Overall principles
Information by random breath testing is gathered by means of roadside surveys. During a roadside survey, drivers are randomly selected and stopped. The alcohol level of each of these drivers is assessed by means of alcohol breath

5/23
testing. Some basic information about the driver (e.g. age, gender) and the trip (e.g. length, motive) can optionally be observed or asked.
The objective of roadside surveys is to estimate the percentage of drivers respecting the legal limit for drink driving. The theoretical population (100%) refers to the total of all journeys (at least from the vehicle types being surveyed) over the national territory. In other words, this reflects the total number of kilometres driven. Hence, by weighting the results by number of kilometres driven on the different stratification variables employed, the percentage of drivers respecting the legal limit will also reflect the percentage of kilometres driven with an alcohol concentration below the legal limit.
For drink driving the main strata that are known to contribute to prevalence are time of day (day vs. night) and day of week (week vs. weekend), and interactions of both. Furthermore, different road types also need to be taken into account. Road type and time period are the minimum required stratifications for this KPI.
Since the overall KPI estimate is expected to be representative for the total of all kilometres driven in a country, the theoretically optimal strategy to estimate the overall prevalence is to sample all strata according to traffic volume of each combination of the different strata. This overall strategy would, however, be detrimental for the accuracy of specific low-volume strata that are of interest. For drink driving, for instance, night-time drivers, and more particularly weekend night drivers, are at a significantly higher risk for drink driving than weekday daytime drivers. Since traffic volumes during weekend nights are generally very low, strictly proportionate sampling according to traffic volume data would lead to much wider confidence intervals (less accurate estimates) for weekend night drivers than for higher volume time periods.
The recommendations included in Section 3.1 take this into account by specifying minimum sample sizes for particular strata and sub-populations. These recommendations are mainly arbitrary. Since the required minima are set at deliberately minimal levels, they are considered to be acceptable. Depending on what a country wants to use its own data for, it should collect more or less characteristics and higher or lower sample numbers per stratum.
2.2 Vehicle types / drivers to be considered
The minimum requirement for vehicle types is the inclusion of passenger cars. Passenger cars are defined as a motor vehicle with 3 or 4 wheels, mainly used to transport people, seating for no more than 9 occupants (including the driver). Motor vehicles with these characteristics used as taxis as well as motor caravans are also included (CARE (2018)).
Goods vehicles, buses and motorcycles are optional supplementary vehicle categories1, which can be included, if this is possible for the Member State. However, this should only be done if the results can be disaggregated by vehicle type in the analysis. In such cases, the data collection should include a variable “vehicle type” with the different categories included. If different vehicle types are included, these should be clearly defined (cf. CARE definitions). For instance, some passenger cars and light goods vehicles share the same brand/model such as
1 CARE definitions (CARE, 2018):
• [Bus/coach] Bus: passenger-carrying vehicle, most commonly used for public transport, having more than 16 seats for passengers. Coach: passenger-carrying vehicle, having more than 16 seats for passengers. Most commonly used for interurban movements and touristic trips. To differentiate from other types of bus, a coach has a luggage hold separate from the passenger cabin.
• [Heavy goods vehicle] Includes road tractors, goods vehicle over 3.5 tonnes maximum gross weight, and “goods vehicles”. Road tractor: road motor vehicle designed, exclusively or primarily, to haul other road vehicles which are not power-driven (mainly semi-trailers). Goods vehicle over 3.5 tonnes mgw: larger motor vehicle used only for the transport of goods. Goods vehicle: motor vehicles used only for the transport of goods (irrespectively from vehicle weight). Includes road tractors and road tractors with semi-trailers. Type C driving licence required.
• [Light goods vehicle] Goods vehicle under 3.5 tonnes maximum gross weight: Lorry: goods vehicle under 3,5t. Smaller motor vehicle used only for the transport of goods. (= also van for transport of equipment by workers such as electricians, plumbers…)
• [Motorcycle]: Motor vehicle with two or three wheels, with an engine size of more than 50 cc. A motorcycle can also have an electric motor. With a trailer possible. With a sidecar possible. Type A driving license required.

6/23
Renault Kangoo. A ‘passenger car’ is a vehicle with backseat windows and passenger seats, while a ‘light goods vehicle’ has no backseat windows or rear passenger seats.
In practice, including other vehicle types in the survey is only useful if the sample sizes of the different vehicle categories are large enough to provide meaningful results for the specific subgroups (see Section 3.1). If goods vehicles are included, a further differentiation can be made between light goods vehicles (e.g. vans) and heavy goods vehicles (e.g. trucks).
2.3 Road types to be included
The roadside survey should provide a representative sample of all traffic in the study region. This covers in most countries three main road types: motorways2, rural non-motorway roads (defined as roads outside built-up areas), and urban roads (defined as roads inside built-up areas). These are the minimum required road types for the roadside surveys. A deviation from this minimum requirement is only possible in exceptional cases: if a specific road type is non-existent in a country (e.g. Latvia) or if it is not feasible for the police (researchers) to organise control sessions on a road type (e.g. in some countries this can be the case for motorways). This should be fully explained in the methodological report.
The road types considered should be generally defined in the methodological report (general characteristics like traffic signs to define inside/outside built-up area, different speed regimes and number of lanes…).
2.4 Time period (time of day and day of week)
Separate results are required for night hours and daytime hours as well as for weekdays and weekend days. As a minimum requirement weekdays, week nights, weekend days and weekend nights are covered in the survey (cf. DRUID D2.1.2 Guidelines for roadside surveys).
For the sake of comparability it is recommended to classify week/weekend x day/night periods based on DRUID’s classification (see Figure): Period 1, 2 and 3 can be merged and represent weekday, Period 4 is week night, Period 5, 6 and 7 are weekend days and Period 8 is weekend night.
When observations are limited to specific days of the week or hours of the day (or a combination of those), this should be clearly explained in the methodological report.
2 Motorways are defined by CARE (2018) as: Public road with dual carriageways, and at least two lanes each way. Entrance and exit signposted. Road with grade separated interchanges. Road with a central barrier or central reservation. No crossing permitted. No stopping permitted unless in an emergency. Entry prohibited for pedestrians, animals, bicycles, mopeds, agricultural vehicles.

7/23
2.5 Optional elements
2.5.1 Data on driver and trip characteristics
With a view to gathering information on risk factors or predictors of driving under the influence (DUI) of alcohol, it is recommended to record some additional driver characteristics, such as:
• driver gender
• driver age (or age category, e.g. FERSI recommendation: young (18-24 years), medium (25 to 65 years), older (> 65 years) (Vollrath et al., 2019))
• private vs. professional driver (e.g. taxi; from a company)
• applicable legal BAC limit
• novice drivers or not (which is useful if lower BAC limits apply to them)
Depending on the specific research interests of Member States, it might be valuable to include even more driver and trip characteristics for further analysis, such as:
• number of persons in vehicle
• number of minor persons in vehicle (age < 18 year)
• number of young persons in vehicle (18 < age < 25)
• driver licensing status (licensed/not)
• clinical/external signs of impairment
• self-reported expected/intended total duration of the trip
• motives for taking the trip (work/leisure/shopping/visiting family-friends...).
Such variables provide additional information on risk factors or predictors for driving under the influence of alcohol, which can be valuable input for evidence-based countermeasures (e.g. awareness campaigns).
2.5.2 Blood alcohol concentration level
Ideally and if possible, results on compliance with BAC levels are differentiated for specific driver groups for which specific legal thresholds apply (e.g. novice or professional drivers).
Another recommended option is to provide the exact BAC level of drivers testing positive. As the legal blood alcohol limit differs between 0.0 g/l and 0.8 g/l in Europe, the general KPI for alcohol (‘below the legal limit’) is not comparable between countries. Some countries also have separate legal limits for novice drivers or professional drivers. Furthermore, all legal limits can vary over time due to legal changes, which also influences the comparability of the results within a country. Therefore, ideally, other indicators such as the mean BAC or the percentage of drivers in different BAC categories should also be provided (for example: 0, 0-0.2, 0.2-0.5, 0.5-0.8, 0.8-1.2, 1.2 or more). Such BAC categories reflect the risk that they pose for crashes and injuries based on, for example, the DRUID project (Schulze et al., 2012) and studies by Borkenstein et al. (1964) and Blomberg et al. (2005). Such indicators are not subject to legal changes and differences within and between countries.
2.5.3 Analysis by region
Disaggregation of results by region is not a requirement. Member States are free to choose supplementary stratifications according to country regions (e.g. NUTS 1 regions). In such cases countries can consider collecting data from each region or from a representative selection of regions. Member States aiming at having meaningful KPIs at regional level, including stratifications according to road type and time period per region, will need to multiply the required minimum location and driver sample. The minimum location and driver sample requirements in that case apply for each region (see Sections 3.2 and 3.3).
If stratification in regions is used, results should be weighted according to traffic volumes (by road type and time period) by region (see Section 4.2).

8/23
3 Measurement procedure for roadside breath testing
3.1 Sampling methods
Drivers need to be sampled randomly. This means that the selection of drivers should be undertaken irrespective of possible suspicion for driving under the influence. Any selectivity, either in the locations chosen (e.g. problematic areas for DUI) or in who is being checked and who is not (e.g. based on suspicion), leads to a bias and decreases the representativeness of the data.
Random roadside breath testing is generally done in collaboration with police forces, as in many countries they (and perhaps they alone) have a legal basis for stopping drivers and testing all drivers stopped. Collaboration in a roadside survey makes it necessary for many police forces to adapt their normal way of carrying out alcohol checks, since often alcohol controls are conducted in a selective way, e.g. based on suspicion of DUI of alcohol, taking characteristics of the vehicle or driver into account, or setting up controls near places with a higher prevalence of DUI.
For roadside surveys to be representative, it is important that police forces stop drivers non-selectively or randomly and take a breath test from each driver stopped. Typically, drivers are sampled in police checks at a particular location where several drivers are checked for the duration of the control session. The police controls forming part of a roadside survey to deliver the alcohol KPI will generally follow the normal legal procedures of police enforcement (including legal actions in case of DUI). The required data for the KPI will be coded as an additional task by the police or by a research worker assisting the control session. Theoretically, in most countries, police officers can check drivers one by one at different locations randomly, although random testing is not allowed in some European countries. In Member States where the police can only stop drivers in the case of certain suspicious signs, the method of random police checks cannot be used.
Researchers generally do not have nor can acquire the legal right to stop drivers randomly on the road and test all drivers stopped. Researchers would therefore generally have to rely on voluntary participation of drivers, which leads to a self-selection or participation bias. In order to avoid a participant/response bias, it is therefore highly recommended to collaborate with police forces to stop and check drivers. If collaboration with police forces is not feasible, researchers can ask drivers to take a voluntary breath test for research purposes. This can be done at places where drivers have already stopped, such as parking places and gas stations. However, participation rates and response bias (e.g. drunk drivers may not agree to participate) would be methodological challenges where drivers are not stopped by the police. Breath testing based on voluntary participation should be avoided, but if it is employed, non-response characteristics should be included and analysed (participation rates by location, gender, age, etc...) in order to evaluate if there are systematic differences between participants and non-participants.
Results from random and voluntary breath testing cannot be mixed and should be presented separately. The methodological report should clearly define the procedure used.
3.2 Minimum sample size for drivers
Defining a minimum required sample size is by definition arbitrary since it depends on the level of accuracy that is considered adequate. With typical overall prevalence percentages in the range of 1 to 2 percent (cf. DRUID prevalence studies: Houwing et al., 2011 A, B), accuracy (width of the 95% confidence interval) in the order of range of 0.5 percent points for the general KPI for DUI of alcohol can be considered acceptable (see Table 1 next page).
The lower and upper bounds of the 95% CI using a sample of n=2,000 are in the range of 0.5% (1% ±0.44 to 2% ±0.61), so 2,000 observations should be sufficient to provide frequency estimations (percentages) with sufficient accuracy. Therefore, an absolute minimum of 2,000 tests of drivers of passenger car drivers is required. This minimum refers to required valid datapoints in the survey dataset in order to be considered for the national KPIs. Annex 2 gives an overview of the argumentation behind the minimum driver sample.
It is impossible to guarantee the minimum number of observations for all possible combinations of all levels of stratification. For the combination of road types and time periods, this would lead to 3 x 4 = 12 levels for passenger cars only. If Member States optionally want to have disaggregated results by vehicle type, then the minimum sample size of 2,000 drivers should be applied for each additional vehicle type. If, optionally, Member States aim at having regional KPIs (e.g. NUTS 1), including the required stratifications per region, then all minimum sample requirements should be applied for each region.
9/23
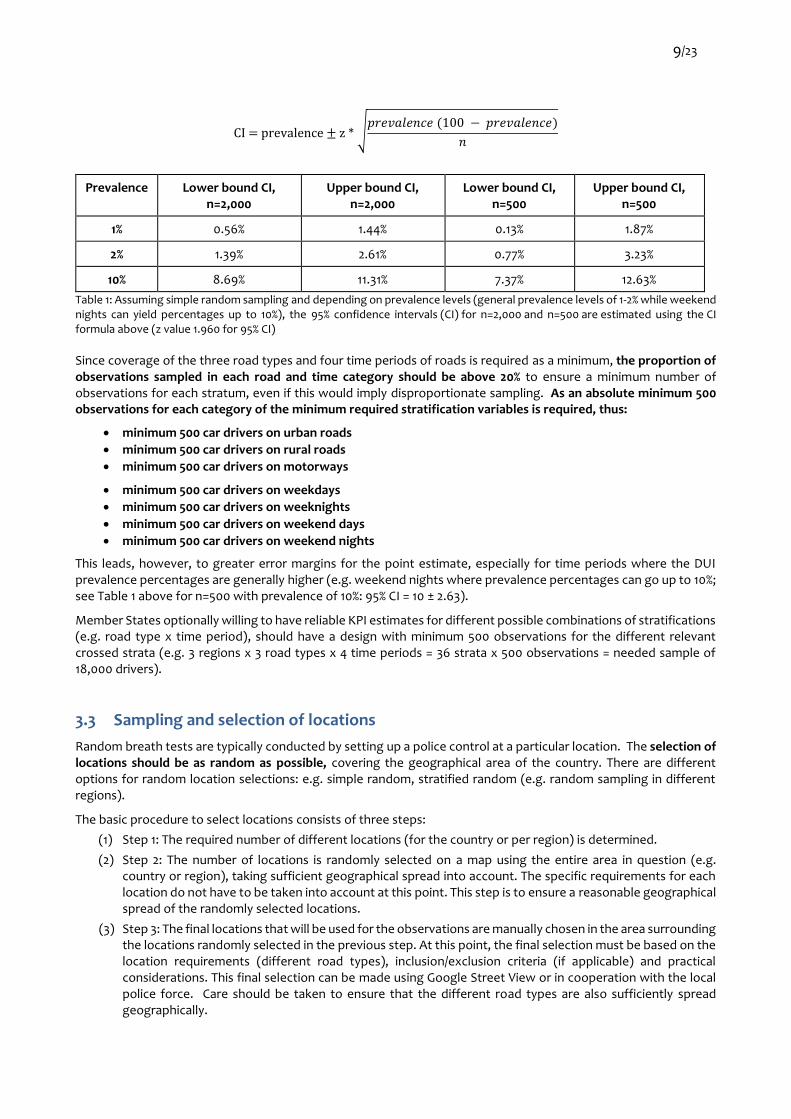
CI = prevalence ± z * √𝑝𝑟𝑒𝑣𝑎𝑙𝑒𝑛𝑐𝑒 (100 − 𝑝𝑟𝑒𝑣𝑎𝑙𝑒𝑛𝑐𝑒)
𝑛
Prevalence Lower bound CI, n=2,000
Upper bound CI, n=2,000
Lower bound CI, n=500
Upper bound CI, n=500
1% 0.56% 1.44% 0.13% 1.87%
2% 1.39% 2.61% 0.77% 3.23%
10% 8.69% 11.31% 7.37% 12.63%
Table 1: Assuming simple random sampling and depending on prevalence levels (general prevalence levels of 1-2% while weekend nights can yield percentages up to 10%), the 95% confidence intervals (CI) for n=2,000 and n=500 are estimated using the CI formula above (z value 1.960 for 95% CI)
Since coverage of the three road types and four time periods of roads is required as a minimum, the proportion of observations sampled in each road and time category should be above 20% to ensure a minimum number of observations for each stratum, even if this would imply disproportionate sampling. As an absolute minimum 500 observations for each category of the minimum required stratification variables is required, thus:
• minimum 500 car drivers on urban roads
• minimum 500 car drivers on rural roads
• minimum 500 car drivers on motorways
• minimum 500 car drivers on weekdays
• minimum 500 car drivers on weeknights
• minimum 500 car drivers on weekend days
• minimum 500 car drivers on weekend nights
This leads, however, to greater error margins for the point estimate, especially for time periods where the DUI prevalence percentages are generally higher (e.g. weekend nights where prevalence percentages can go up to 10%; see Table 1 above for n=500 with prevalence of 10%: 95% CI = 10 ± 2.63).
Member States optionally willing to have reliable KPI estimates for different possible combinations of stratifications (e.g. road type x time period), should have a design with minimum 500 observations for the different relevant crossed strata (e.g. 3 regions x 3 road types x 4 time periods = 36 strata x 500 observations = needed sample of 18,000 drivers).
3.3 Sampling and selection of locations
Random breath tests are typically conducted by setting up a police control at a particular location. The selection of locations should be as random as possible, covering the geographical area of the country. There are different options for random location selections: e.g. simple random, stratified random (e.g. random sampling in different regions).
The basic procedure to select locations consists of three steps:
(1) Step 1: The required number of different locations (for the country or per region) is determined.
(2) Step 2: The number of locations is randomly selected on a map using the entire area in question (e.g. country or region), taking sufficient geographical spread into account. The specific requirements for each location do not have to be taken into account at this point. This step is to ensure a reasonable geographical spread of the randomly selected locations.
(3) Step 3: The final locations that will be used for the observations are manually chosen in the area surrounding the locations randomly selected in the previous step. At this point, the final selection must be based on the location requirements (different road types), inclusion/exclusion criteria (if applicable) and practical considerations. This final selection can be made using Google Street View or in cooperation with the local police force. Care should be taken to ensure that the different road types are also sufficiently spread geographically.

10/23
A convenient way of selecting locations randomly (step 2) is to use a GIS system (e.g. cartographic software like ARCView/ARCGIS) as such software automatically selects location points within defined areas randomly (e.g. https://desktop.arcgis.com/en/arcmap/latest/extensions/geostatistical-analyst/an-introduction-to-sampling-monitoring-networks.htm). If Member States have no GIS software, step 2 can also be done manually using a national geographic map, e.g. Google Maps/Google Earth.
For the selection of locations (step 3) practical arguments related to conducting alcohol controls should be considered: minimum traffic volume, the ability to stop vehicles in a safe way, and the ability to park the vehicles of the police and researchers and drivers who have been drinking above the legal limit. On motorways, controls can be set up at entrances and exits, or transfer of drivers to rest and parking areas can be considered for safety reasons. Control sessions on high speed roads should always be carried out in accordance with applicable (road) safety regulations. Location bias must be avoided: no specific selection of locations based on proximity to places known for a higher DUI prevalence (e.g. near bars, discotheques…). Since random selection of locations will also include lower volume roads, it is expected that several low volume locations will be available for each stratum. If however traffic flow is too low (less than 10 cars passing per hour), it is acceptable not to include them.
It is recommended to sample the locations for the three road types proportionally to traffic volume (and therefore proportionally to the kilometres driven on each road type in the country or region), assuming that each of the three road types represent a share of traffic volume above 20% of the total traffic volume, based on available national traffic data (e.g. nationally representative traffic/mobility surveys). It is also recommended to carry out location sampling proportional to traffic volumes by time period, and ideally crossed with road types (combinations). If traffic volume by time period is considered, it is recommended to oversample the nighttime periods, in order to guarantee sufficient numbers of observations.
For more information on random sampling of locations and for determination of the minimum sample size, reference should be made to the SafetyNet general recommendations for SPI (safety performance indicators): http://www.dacota-project.eu/Links/erso/safetynet/fixed/WP3/sn_wp3_d3p8_spi_manual.pdf
As an absolute minimum 10 different locations per level of stratification variable are required in order to ensure representative results for the entire road network and all time periods. The minimum required number of different locations for one stratification level is (see Annex 2 for the argumentation behind the minimum location sample of 10 locations per stratification variable):
• Minimum 10 locations on urban roads
• Minimum 10 locations on rural roads
• Minimum 10 locations on motorways
• Minimum 10 locations on weekdays
• Minimum 10 locations on week nights
• Minimum 10 locations on weekend days
• Minimum 10 locations on weekend nights
Member States can distribute the different locations (within road types) freely over different combinations of strata. It is allowed to re-use the same location for different control sessions (e.g. different times of day or days of week). Where such a crossed design is used, this should be indicated in the methodological report. To ensure a balanced sampling for road types and time periods, a minimum of 2 different locations for each combination of road type (3) and time period (4) (i.e. 12 crossed strata) should be used:
• Urban roads x weekdays: min. 2 locations
• Urban roads x weeknights: min. 2 locations
• Urban roads x weekend days: min. 2 locations
• Urban roads x weekend nights: min. 2 locations
• Rural roads x weekdays: min. 2 locations
• Rural roads x weeknights: min. 2 locations
• Rural roads x weekend days: min. 2 locations
• Rural roads x weekend nights: min. 2 locations
• Motorways x weekdays: min. 2 locations
• Motorways x weeknights: min. 2 locations
• Motorways x weekend days: min. 2 locations
• Motorways x weekend nights: min. 2 locations

11/23
If, optionally, Member States aim at having regional KPIs (e.g. NUTS 1), including the required stratifications per region, then determined minimum sample requirements should be applied for each region.
3.4 Measurement method
Alcohol concentrations are mostly measured by breathalyzer tests. This is the recommended instrument for data collection. Partners should provide references for the type and brand of the tests used for each datapoint (i.e. tested driver) (cf. infra).
It is also acceptable to use pre-screening (or pre-sampling) using passive alcohol testers (e.g. Fell et al., 2008; Solomon & Domschat, 2016) or so-called ‘sampling’ devices, not requiring exhalation into a device but detection of alcohol in the ambient air close to the driver (also called “sniffer”). Negative pre-sampling results can be recorded as final results of the test procedure. Positive pre-sampling results should be coded based on the result of a breathalyzer test following the positive pre-sampling test.
Measurement instrument tolerance and error should be described. If a technical reliability margin is used by either the device or in the legal procedures following the reading of the result, the margins should be clearly described in the methodological report. When conversion formulas are used to translate breath into blood (or vice versa) these should also be described. If several measurement methods are used for the same driver, the classification is made according to the national legislation.
Binary breath test results (pass vs. fail, i.e. ≤ legal limit (safe) vs. > legal limit (e.g. alarm/positive) according to the applied legislation) are the key dependent variable. If different groups of drivers are subject to different intoxication thresholds, the threshold according to national legislation should be used to classify drivers. The methodological report should specify the applicable thresholds for all groups of drivers included in the study. It is optional but recommended to code also the actual BAC level (see Section 2.5.2).
During the COVID-19 pandemic police procedures may be different from normal, e.g. pre-sampling may be used less, but breath tests will normally still be used because there is no alternative. Many police forces will probably use extra sanitary procedures during alcohol controls (see also Section 3.7).
3.5 Practical organisation of the control sessions
A uniform fieldwork procedure should be chosen. Each location corresponds to a minimum of one control session and should last a minimum of 30 minutes (traffic count not included, see Section 3.6). Control sessions can last longer, but it is recommended to work with sessions of 30 minutes to 1 hour, because the longer a location is in use, the greater the possibility that drivers become aware of the control location (e.g. through alerts on social media) and subsequently avoid it. Controls on high speed roads should always be carried out in accordance with applicable (road) safety regulations.
The minimum sample requirements relate to the number of drivers (see Section 3.2) and locations (see Section 3.3) Member States can estimate how many sessions and control hours will be needed in order to reach the driver sample size required (or aimed for), taking the minimum location sample requirements into account.
Several control sessions can take place at the same location (at different time periods). When planning the control sessions in this way, it should always be ensured that the different combinations of road types and time periods are balanced in number so as to avoid a sampling bias.
In order to keep non-response to additional questions (see Section 2.5.1 ) as low as possible, it is suggested to let the police ask these questions, have the police breath test after the questions, provide small incentives, and limit the number of questions.
3.6 Counting of traffic at the control locations
Traffic volumes should be counted during each control session, even when national traffic volume statistics are available. This information is needed for the calculation of the percentage of drivers respecting the legal BAC limit for each control session and for correct calculation of the confidence intervals (weighting).
The counting of passing traffic during a session is ideally done by counting all passing (including stopped) relevant vehicles (i.e. the types – separately – that are considered in the study), on the same lane(s) and in the same direction

12/23
as the control session. In the ideal situation that each passing relevant vehicle (driver) can be stopped (and tested), the number of observed vehicles corresponds to the total traffic count of a session. As a minimum requirement manual traffic counts are made by counting all the passing relevant vehicles on the control session lane(s) and direction(s), during a 10 minute break in the middle of the session, or 5 minutes before and 5 minutes after the session. This break is in addition to the minimum 30 minutes control session.
If disaggregated results for different vehicle types are aimed at (optionally), the vehicle types should be counted separately. Additional counting may be carried out with an automatic counter (e.g., loop on the road) during the whole session to have an indication of the general traffic volume (optional).
3.7 Temporal considerations
Ideally measurements should be conducted in late Spring or early Autumn. In practice, all months are allowed except December, January, July and August. Holiday periods (bank / school holidays) and hard winter conditions should be avoided, as these disturb normal traffic patterns. When Member States have historical series of measurements it is recommended to use the same period(s) of the year as for the earlier measurements.
Member States willing to organise more than one roadside survey to deliver the KPIs (e.g. one in Spring and one in Autumn) need to comply with the minimum sample size requirements for both measurements combined. The data from both measures can be combined to deliver the overall and disaggregated indicators.
The COVID-19 pandemic has implications on DUI of alcohol behaviour. Therefore, it is recommended not to plan data collection for as long as certain health-related measures are in force such as a lock-down, a night curfew, closed bars/restaurants, limitations of social contacts etc., because these relate to typical risk factors for DUI of alcohol. This restriction also applies to the other methods in these guidelines (see Sections 6 and 7). The time span of the enforcement data and for self-report surveys should be based on traffic situations as close to normality as possible.
In order to have representative KPIs, it is important to collect data in/from a sufficiently representative context. Countries that have already started with measurements are advised to continue with them. For other countries, the advice is to wait until the traffic situation is as normal as possible again.
4 Data analyses
4.1 Variables to be coded for roadside breath testing
Detailed specifications for the data delivery and data matrix for the Baseline dataset will be provided at a later stage.
As a first guideline, it is suggested to include at a minimum for each datapoint (each tested driver) in the dataset, the following variables:
• binary alcohol test result (2) (below or above legal limit)
• road type (3)
• time period (4)
• date
• start hour
• end hour
• total control session duration
• unique location code (to know which breath test results belong to a same session) (e.g. GPS coordinate of the location, or a qualitative code referring to the location)
• unique session code (only needed if a same location is used for different sessions)
• traffic count duration,
• traffic count total (minimum=cars) Variables such as road type, time period, location code, session code, day and time of a session, and traffic counts can be coded once per control session by a person from the police or a researcher. These variables should then be added in the dataset to each datapoint from a same control session.
The following list gives the most typical variables which can optionally be coded and included in the dataset:
• Coded per driver (see Section 2.5.1):

13/23
o exact BAC level or BAC category o driver age o driver gender o driver type: novice, professional o vehicle type (if others are considered) o other self-reported or observed variables.
• Coded per control session (once per session) and included in the dataset for each datapoint (driver) from one session:
o region of control session o police zone o weather condition o flow of traffic o number of lanes o control lane(s) o control direction(s).
Recent types of alcohol testers can automatically store the data on the breath test outcomes which can be exported later. This allows automatic recording of date and time for each breath test result and this could also be used for setting up the dataset, as long as the additionally required control session variables are also collected and combined with this data. If Member States optionally wish to collect additional driver characteristics, then automatically stored data is not sufficient because the breath test result should be coded in combination with the additional variables so as to ensure the data link.
4.2 Post stratification weights and statistical analysis
For each country, a general estimate of the percentage of drivers with a blood/breath alcohol concentration below the legal limit (if need be the legal limit that applies in case of novice or professional drivers) should be provided. Since the total population of drivers to which this estimate refers (main KPI) consists of the total of all vehicle movements (min. of passenger cars) over an entire territory over the entire period of the measurement, the overall estimate reflects the percentage of vehicle kilometres driven below the legal limit for drink driving.
Considering the minimum requirements and optional recommendations above, sampling is stratified according to several parameters:
• Road type (3 levels: motorways, rural roads, urban roads)
• Time period or Day of week and time of day (4 levels: weekdays, weeknights, weekend days, weekend nights)
• Vehicle type (minimally one: passenger cars; possibly more categories)
• (optional) Region (Member State to decide)
For each level of stratification considered, results should be weighted according to traffic volumes. For this KPI it means that the results should at a minimum be weighted according to traffic volume data by road type and time period for car drivers. If other stratifications have also been used, then the weighting should be done according to traffic volume data by the stratifications in question (e.g. by region).
It is recommended to use the exact values for each combination of stratification levels considered (e.g. traffic volume for motorways on weekend nights for personal cars in a certain region). If these combined data are not available, the second-best option is to assume independence of all levels of stratification and use combinations of marginal totals to estimate specific combinations (e.g. traffic volume for motorways, traffic volume on weekend nights etc.).
Traffic volumes are ideally obtained/estimated from national statistical mobility data (e.g. mobility surveys) (recommended option – cf. Druid p. 21: "For most countries traffic data by time period was derived from national traffic surveys"), and otherwise should at minimum be estimated by using traffic counts during the control sessions. The use of traffic volume data (either officially available data or traffic counts) is required to ensure comparability. The results of the Member States should be weighted in a similar way.
Even when national traffic volume statistics are available, traffic volumes should be counted during each control session. Since selection probabilities of tested drivers included in the sample depend on the amount of passing traffic during each control session (traffic density), this information is also necessary to allow correct calculation of

14/23
the confidence intervals (weighting). When traffic counts are used to infer traffic volumes per stratum, the (estimated) road network length by road type should be also considered for calculating the weights. If no official data on road lengths are available, it is recommended to request estimates from experts from the relevant administration services.
Statistical analysis techniques and tools should be determined by each Member State, and these should be clearly described in the methodological report. Since driver sampling will typically be nested in locations, it is recommended to use appropriate models for two-stage stratified sampling (1st stage= random location selection and 2nd stage= random driver selection within locations). Approximations assuming simple random sampling can be used as long as results are weighted according to traffic volumes.
Input on calculating weights (depending on available data) will be provided at a later stage.
5 Expected results
5.1 KPI values and confidence intervals
For each indicator defined below, a point estimate as well as a 95% confidence interval is expected. Results should also include the unweighted number of drivers the result is based on.
The main indicator is the percentage of drivers observing the legal BAC limit across all time periods and road types (locations). This KPI is based on the limit applied in a country and can thus vary. This percentage should therefore always be interpreted against the background of the legislative information provided in the Member States’ metadata.
At a minimum, the percentage of personal car drivers that observe the legal limit should be provided. The equivalent percentage for other vehicle types is supplementary. An estimate is expected for each level of the following stratification variables:
• Time period (4 levels)
• Road type (3 levels)
Specific estimates for combinations of time period and road type (e.g. motorways on weekend-nights) are recommended but not required since some countries will not have sufficient sample sizes for each combination.
Optionally, it is recommended to also provide estimates of the KPIs for specific categories of road users and other possible stratification variables:
• By age
• By gender
• By type of driver (professional drivers, novice drivers)
• By type of vehicle (passenger car; possibly also for goods vehicles (vans, trucks), motorcycles, buses or other)
• Region (if applicable)
It is also recommended to provide specific estimates for combinations of these, if sample sizes allow this.
Interesting additional (optional) indicators are (see Section 2.5.2):
• The mean BAC level
• The mean BAC level of drivers with a BAC above the legal limit
• The % of drivers per BAC level group: 0, 0-0.2, 0.2-0.5, 0.5-0.8, 0.8-1.2, 1.2 or more.
Results from random, voluntary, selective breath testing (Section 7) and from self-reports (Section 6) can be used to produce an alcohol KPI, but they cannot be mixed and should be presented separately.
5.2 Data delivery
For the data delivery to the Baseline consortium (inclusion in the Baseline database), three possible levels of aggregation are possible: (further instructions on dataset structure and variables will be provided later)
(1) Minimum level requirement: point estimates (%) for all categories of the minimum required levels of disaggregation (passenger cars; 3 road types; 4 time periods), and for any optional additionally

15/23
considered level of disaggregation, including confidence interval (CI) estimates. The minimum output includes the main effects of specific variables. Interactions are not mandatory.
(2) Medium level: crossed-level matrix of all considered levels of disaggregation (crossed point estimates) and Confidence Intervals.
(3) Ideal level: delivery also of the raw cleaned data. Cleaned data refers to correcting data (if possible) when improperly formatted or incorrectly recorded or to removing any incorrect or incomplete data that cannot be corrected or that are irrelevant or that are duplicated. This data is usually not necessary or helpful when it comes to analysing data because it may hinder the process or provide inaccurate results. Note: datapoints (i.e. tested driver) with incomplete data should only be removed if one or more of the minimally required variables is missing. The minimal driver sample sizes refer to “valid” datapoints in the dataset after data cleaning.
5.3 Methodological report
Together with the data a methodological report should be submitted that describes (for the roadside breath testing):
• the specificities of the sampling, study design, and vehicles included
• the method used and rationale for choosing the locations (sampling method, inclusion/exclusion criteria, minimal traffic flow)
• the uniform fieldwork procedure
• metadata on the fieldwork (data collection method, random/selective checks, timing, locations…)
• the statistical techniques used to weight the data, to calculate the CIs and to analyse the results
• metadata on the applicable regulations and procedures related to this KPI (e.g. legal BAC limits, for different road user groups, types and tolerance margins of alcohol tests…)
6 Requirements for self-reported data
6.1 Introduction
Self-reported data can either refer to prevalence of DUI of alcohol over a specific time period (e.g. last 30 days, last 12 months) or to prevalence of use during a specific recent trip (trip-based prevalence). These methods will be referred to as ‘period prevalence’ and ‘trip-based prevalence’ respectively.
Whereas random roadside breath testing aims at measuring ‘point prevalence’, or the proportion of the population being under the legal blood alcohol level at any point in time, ‘trip-based prevalence’ aims at measuring the proportion of the population under the legal BAC limit during one of their last journeys, from which point prevalence estimates can be deduced (possible methods for that are telephone interviews or online surveys). The distinction is clear with ‘period prevalence’ measurements in which self-reported frequencies of DUI of alcohol in traffic are gathered over a longer time frame (e.g. last month, last year) by using rating scales (e.g. never, sometimes, always).
The trip-based prevalence survey method is closest to the aim of a roadside survey since the DUI state during a specific point in time (a past recent ride) is questioned and information on road type can be collected.
Member States are free to choose either of these options. However, given the smaller effort involved in survey period prevalence, it is recommended that surveys for trip-based prevalence also include a basic question on period prevalence and road type. For general guidelines on survey research, one can consult handbooks like Gideon (2012) or Wolf et al. (2016).
6.2 Sample size
Sample size considerations depend on the type of prevalence:
• For estimates of period prevalence, the minimal sample size is 1,000 respondents.

16/23
• For estimates of trip-based prevalence, Member States should define the required sample size. The minimum sample will have to be a multiple of 1,000 in that case, 2,500 is considered to be sufficient (cf. Diependaele, 2015 for an example).
Survey research is generally known to have low response rates. Therefore, oversampling is needed. When online panels are used, the required number of completed surveys, in total and for relevant (crossed) population strata (e.g. by age, gender, domicile/region…and combinations) to ensure the representativeness of the sample, can be programmed during the survey set-up. With this method, the survey is sent out to a bigger sample than the required minimal numbers in order to take non-response into account. As soon as the sample requirements are met, which can be separately followed-up for the different crossed strata, the survey stops.
6.3 Sampling methods
Random sampling is required. Random sampling from available online research panels is allowed (e.g. from market research agencies like iVOX, GfK). Convenience samples are considered to be too biased to generate a representative estimate.
Stratification according to age, gender, educational level and other population characteristics can be used to ensure proportionality of the sample compared to the population.
6.4 Survey methods
Surveying can be self-administered (on paper, online) or with an interviewer (face-to-face, telephone) (or any combination of these).
For estimation of period prevalence, it is highly recommended to use the method and questions on drink driving used in the ESRA survey series (https://www.esranet.eu/) (Meesmann et al., 2021) in order to ensure comparability with earlier research (see box below). A complete overview of the ESRA methodology can be found at: https://www.esranet.eu/storage/minisites/esra2-methodology-report-updatewave2-def.pdf
ESRA 2 questionnaire: Self-declared safe and unsafe behaviour in traffic :
Q12_1a) Over the last 12 months, how often did you as a CAR DRIVER …? You can indicate your answer on a scale from 1 to 5, where 1 is “never” and 5 is “(almost) always”. The numbers in between can be used to refine your response. Binary variable for all items: at least once (2-5) - never (1) Items (random): • drive after drinking alcohol Q12_1b) Over the last 30 days, how often did you as a CAR DRIVER …? You can indicate your answer on a scale from 1 to 5, where 1 is “never” and 5 is “(almost) always”. The numbers in between can be used to refine your response. Binary variable for all items: at least once (2-5) - never (1) Items (random): • drive when you may have been over the legal limit for drinking and driving • drive after drinking alcohol
For estimation of trip-based prevalence, different methods can be used, such as ‘roadside interviews’ (drivers are approached directly after a trip or during a trip and asked about DUI of alcohol during that trip), ‘telephone interviews’ (participants are asked about their last trip and then about their DUI of alcohol state during that trip), or online survey (participants are asked about their last trip or about all their trips made in the last 24 hours and then about their DUI state during one (randomly selected) specific trip).
For these methods, reference can be made to the methodological guidelines described by Vollrath et al. (2019) and the study from Diependaele (2015), even though both references are aimed at assessing the prevalence of other driver behaviour (mobile phone use in traffic; sleepiness in traffic). The basic principles are clear though and can be used for different types of driver behaviour:
Vollrath et al. (2019): https://fersi.org/wp-content/uploads/2019/11/Guidelines-prevalence-mobile-phone-use.pdf

17/23
“In order to get prevalence estimations that are comparable to those derived from observational studies, they must be based on trips. To obtain this point prevalence estimate, the frequency of DUI of alcohol (or of driving after having drunk alcohol) must be assessed with respect to an actual driving, episode (e.g., a trip from A to B) instead of a certain longer time interval like with period prevalence measures.”
Therefore, participants should be asked to reflect on a single trip they made within a limited time period (e.g. 24 hours). Such trip-based prevalence estimations can be compared with the results of roadside measurements if the estimated total trip duration and kilometres driven is questioned too. By combining information on the target state DUI of alcohol (or behaviour: driving after drinking alcohol) with the amount of driving, point-prevalence estimates can be obtained.”
In Diependaele (2015) online panel participants who indicated they had driven a car in the last 24 hours are invited to a survey where they are asked to bring one of their journeys (in the last 24h) to mind and answer questions about that journey as accurately as possible. The journey of interest was determined randomly, taking a balance between different time periods into account. (https://www.vias.be/publications/Slaperig%20achter%20het%20stuur%202017/Sleepy_at_the_wheel.pdf )
The proposal is at minimum to ask these KPI related questions:
• Did you drink alcohol in the period before this journey?
• May you have been over the legal limit for drinking and driving during this journey?
These are in line with the proposed ESRA questions for period prevalence. In addition to these trip-based questions it is recommended to also include the ESRA period prevalence questions in the survey.
6.5 Recommendations for fieldwork
Some tips to increase the response rate are (Smith & Albaum, 2012):
• Make the survey as short as possible by removing marginal questions
• Make the survey as interesting as possible to the respondents
• Offer an incentive or reward
• Make an appeal to altruism: “I need your help”
• Pre-contact participants to inform them about the survey
• Send reminders to people who did not respond within a certain time. Multiple follow-ups may be needed.
• Be wise in the timing: avoid sending questionnaires or arranging interviews during Christmas, Easter, and other holidays.
Some general advice for formulating multiple choice questions (Krosnick & Presser, 2010):
• Use simple, familiar words (avoid technical terms, jargon, and slang)
• Use simple syntax
• Avoid words with ambiguous meanings, i.e. aim for wording that all respondents will interpret in the same way
• Strive for wording that is specific and concrete (as opposed to general and abstract)
• Make response options exhaustive and mutually exclusive
• Avoid leading or loaded questions that push respondents toward an answer
• Ask about one thing at a time (avoid double-barreled questions)
• Avoid questions with single or double negatives.
6.6 Expected results
Prevalence estimates should be provided with a 95% confidence interval (upper and lower border) and standard error. The representativeness of the survey should be indicated in the methodological report, by including a thorough explanation of the sampling, weighting, data processing and analysis procedures. A full overview should also be given of the other methodological sections: type of survey, timing and duration, actual question(s), moments/periods used in the questions, total sample size, sample descriptive data (socio-demographical, mobility related variables), non-response.

18/23
It is recommended to weigh results of trip-based prevalence surveys according to traffic volumes by time period and type of road - if these parameters are considered in the survey procedure and questions - according to the same methodology as for the roadside surveys.
7 Analysis of police enforcement data
In theory, the minimum requirements for random roadside breath testing (Sections 2 and 3) also apply for Member States aiming at delivering a KPI based on analysis of enforcement data. Enforcement data can only give a realistic indication of the ‘general prevalence’ of drink driving when drivers are tested or checked randomly, independent from suspicion of impairment. If not, results will reflect the selectivity in checking drivers. While enforcement data based on random alcohol checks at random locations/moments is useable in calculating behavioural indicators for DUI of alcohol, selective alcohol checks are useful for enforcement indicators.
When police enforcement data are used, it is recommended that data from random checks and data from specific checks on suspicious drivers or from locations known to have a high prevalence of drink driving are clearly separated, analysed and reported separately. Where the analysis is based on a database with selective police checks, one could nevertheless attempt to clean the data by selecting only records at times when large sets of tests were conducted.
If it is possible to select data from random police checks, it is recommended to weight the results according to traffic volumes by time period and type of road - if these parameters are available in the enforcement database - according to the same methodology as for random roadside breath testing by police officers specified in Section 4.2.
It may not be possible to have enforcement data from random checks, since police often select drivers based on certain characteristics (e.g. the appearance of a car or driver) or organises controls at specific risk locations. Such data can still be used for the indicator, bearing in mind that it does not give the true level of drink driving prevalence. KPIs based on selective (suspicion-based) police checks deliver enforcement indicators for drink driving rather than behavioural indicators, and therefore cannot be mixed with KPIs based on random checks. Both types of KPI should be analysed and presented separately.

19/23
References
Achermann Stürmer, Y.,Meesmann, U.& Berbatovci, H. (2019) Driving under the influence of alcohol and drugs. ESRA2 Thematic report Nr. 5. ESRA project (E-Survey of Road users’ Attitudes). Bern, Switzerland: Swiss Council for Accident Prevention. https://www.vias.be/publications/ESRA%202018%20Thematic%20Report%20No%205%20DUI/ESRA_2018_Thematic_Report_No_5_DUI.pdf
Albaum G., Smith S.M. (2012) Why People Agree to Participate in Surveys. In: Gideon L. (2012) Handbook of Survey Methodology for the Social Sciences. Springer, New York, NY. https://doi.org/10.1007/978-1-4614-3876-2_11
Assum, T. et al. (2007) Druid Working paper “Uniform design and protocols for carrying out case-control studies”. Deliverable D 2.1.2 https://www.bast.de/Druid/EN/deliverales-list/downloads/deliverable_2_1_2.pdf;jsessionid=2F12FF52575D8C1057FCCCE0FFA509A9.live21304?__blob=publicationFile&v=1
Blomberg, R., Peck, R.C., Moskowitz, H., Burns, M. & Fiorentino, D. (2005) Crash Risk of Alcohol Driving: A Case-Control Study. Stamford, CT: Dunlap & Associates.
Borkenstein, R.F., Crowther, R.F., Shumate, R.P., Zeil, W.W. & Zylman, R. (1964) The role of the drinking driver in traffic accidents. Bloomington, IN: Department of Police Administration, Indiana University.
Diependaele, K. (2015) Slaperig achter het stuur. Analyse van de omvang en de kenmerken van slaperigheid bij Belgische automobilisten. Brussel, België: Belgisch Instituut voor de Verkeersveiligheid – Kenniscentrum. https://www.vias.be/publications/Slaperig%20achter%20het%20stuur/Slaperig%20achter%20het%20stuur%20-%20Analyse%20van%20de%20omvang%20en%20de%20kenmerken%20van%20slaperigheid%20bij%20Belgische%20automobilisten.pdf
Diependaele, K. (2015) Sleepy at the wheel. Analysis of the extent and characteristics of sleepiness among Belgian car drivers. Brussels, Belgium : Belgian Road Safety Institute – Knowledge Centre Road Safety. https://www.vias.be/publications/Slaperig%20achter%20het%20stuur%202017/Sleepy_at_the_wheel.pdf
Diependaele, K. (2015) Somnolence au volant. Analyse de l’ampleur et des caractéristiques de la somnolence chez les conducteurs Belges. Bruxelles, Belgique : Institut Belge pour la Sécurité Routière – Centre de Connaissance Sécurité Routière. https://www.vias.be/publications/Slaperig%20achter%20het%20stuur/Somnolence%20au%20volant%20-%20Analyse%20de%20l%E2%80%99ampleur%20et%20des%20caract%C3%A9ristiques%20de%20la%20somnolence%20chez%20les%20conducteurs%20Belges.pdf
European Commission (2018) CARE DATABASE. CaDaS Common Accident Data Set. Version 3.7 – November 2018. https://ec.europa.eu/transport/road_safety/sites/roadsafety/files/cadas_glossary_v_3_7.pdf
European Commission (2019) Commission staff working document EU road Safety Policy Framework 2021-2030 - Next steps towards "Vision Zero". SWD (2019) 283 final. Retrieved from https://ec.europa.eu/transport/sites/transport/files/legislation/swd20190283-roadsafety-vision-zero.pdf
European Commission (2017) Monitoring Road Safety in the EU: towards a comprehensive set of Safety Performance Indicators. European Commission, Directorate General for Transport https://ec.europa.eu/transport/road_safety/sites/roadsafety/files/pdf/ersosynthesis2017-detail-performanceindicators15_en.pdf
Fell, J.C., Compton, C. & Voas, R.B. (2008) A Note on the Use of Passive Alcohol Sensors during Routine Traffic Stops, Traffic Injury Prevention, 9:6, 534-538, DOI: https://doi.org/10.1080/15389580802282566
Gideon L. (Eds) (2012) Handbook of Survey Methodology for the Social Sciences. Springer, New York, NY. https://doi.org/10.1007/978-1-4614-3876-2_11
Hakkert, A.S & Gitelman, V. (Eds.) (2007) Road Safety Performance Indicators: Manual. Deliverable D3.8 of the EU FP6 project SafetyNet. https://www.dacota-project.eu/Links/erso/safetynet/fixed/WP3/sn_wp3_d3p8_spi_manual.pdf
Hakkert, A.S, Gitelman, V. & Vis, M.A. (Eds.) (2007) Road Safety Performance Indicators: Theory. Deliverable D3.6 of the EU FP6 project SafetyNet. https://www.dacota-project.eu/Links/erso/safetynet/fixed/WP3/sn_wp3_d3p6_spi_theory.pdf See also https://www.dacota-project.eu/Links/erso/safetynet/content/wp_3_safety_performance_indicators_1.html

20/23
Houwing, S., Hagenzieker, M., Mathijssen, R., Bernhoft, I.M. Hels, T., van der Linden, T., Legrand, S.-A. & Verstraete, A. (2011) Prevalence of alcohol and other psychoactive substances in drivers in general traffic; Part I: General results. Deliverable D2.2.3 Part 1 of the EU FP6 project DRUID. https://www.bast.de/Druid/EN/deliverales-list/downloads/Deliverable_2_2_3_Part1.pdf?__blob=publicationFile&v=1
Houwing, S., Hagenzieker, M., Mathijssen, R., Bernhoft, I.M., Hels, T., Janstrup, K., van der Linden, T., Legrand, S.-A. & Verstraete, A. (2011) Prevalence of alcohol and other psychoactive substances in drivers in general traffic; Part II: Country reports. Deliverable D2.2.3 Part 2 of the EU FP6 project DRUID. https://www.bast.de/Druid/EN/deliverales-list/downloads/Deliverable_2_2_3_Part2.pdf?__blob=publicationFile&v=1
Krosnick, J.A. & Stanley, P. (2010) Questionnaire Design. pp. 263-314 In: Handbook of Survey Research, edited by J. D. Wright and P. V. Marsden. West Yorkshire, UK: Emerald Group.
Meesmann, U., Torfs, K., Wardenier, N. & Van den Berghe, W. (2021) ESRA2 methodology. ESRA2 report Nr. 1 (updated version). ESRA project (E-Survey of Road users’ Attitudes). Brussels, Belgium: Vias institute. file:///C:/Users/Sofie/Downloads/esra2-methodology-report-updatewave2-def%20(2).pdf
Pelssers, B. & Diependaele, K. (2017) Sleepy at the wheel. Analysis of the extent and characteristics of sleepiness among Belgian car drivers in 2017. Bruxelles, Belgique: l’Institut Vias –Centre de Connaissance Sécurité Routière. https://www.vias.be/publications/Slaperig%20achter%20het%20stuur%202017/Sleepy_at_the_wheel.pdf
Schulze, H., Schumacher, M., Urmeew, R. & Auerbach, K. (2012) DRUID Final Report: Work performed, main results and recommendations. DRUID - Driving under the influence of alcohol, illicit drugs and medicines - Project co-funded by the European Commission within the Sixth Framework Programme (2002-2006). Retrieved from: https://www.bast.de/Druid/EN/Dissemination/downloads_and_links/Final_Report.pdf?__blob=publicationFile&v=1
Solomon, R. & Domschat, E. (2016) Passive Alcohol Sensors: A Reasonable Canadian Compromise. Faculty of Law, Western University. Retrieved from https://madd.ca/media/docs/Passive_Alcohol_Sensors_MADD_Canada_2015.pdf.
Vollrath, M., Schumacher, M., Boets, S. & Meesmann, U. (2019) Guidelines for assessing the prevalence of mobile phone use in traffic. FERSI technical paper. Retrieved from https://fersi.org/wp-content/uploads/2019/11/Guidelines-prevalence-mobile-phone-use.pdf
Wolf, C., Joye, D., Smith, T.W. & Fu, Y. (Eds) (2016) The SAGE Handbook of Survey Methodology. SAGE Publications Ltd. DOI: http://dx.doi.org/10.4135/9781473957893

21/23
Belgium | Austria | Bulgaria | Cyprus | Czech Republic | Finland | Germany | Greece | Ireland | Latvia | Lithuania | Luxembourg | Malta | Netherlands | Poland | Portugal | Slovakia | Spain | Sweden
baseline.vias.be
Annexes
Annex 1. SWD minimal requirements
Source: Commission Staff working document SWD 283 (European Commission, 2019)
Rationale: Driving under the effect of alcohol is frequently cited as a major collision causation factor.
Definition of the KPI: Percentage of drivers driving within the legal limit for blood alcohol content (BAC).
Minimum methodological requirements:
Data collection method Random breath testing.
If random testing is not possible:
Breath testing results from enforcement actions (even if not random) and / or
Self-reported behaviour through anonymous surveys.
Road type coverage Motorways, rural non-motorway roads, and urban roads to be covered.
Vehicle type Passenger cars as a minimum; goods vehicles, buses and motorcycle if possible (results disaggregated by vehicle type).
Location Random sample (methodology for Member States to decide).
Time of day Any time for testing (not relevant for self-reporting).
Day of week Separate results for weekdays and weekends.
Month Late spring, early autumn.
Tolerance Measurement instrument error.
Sampling methods Random (methodology for Member States to decide).
Sample size Member States to decide.

22/23
Belgium | Austria | Bulgaria | Cyprus | Czech Republic | Finland | Germany | Greece | Ireland | Latvia | Lithuania | Luxembourg | Malta | Netherlands | Poland | Portugal | Slovakia | Spain | Sweden
baseline.vias.be
Annex 2. Rationale behind the minimum sample requirements for roadside breath testing
The methodological guidelines for all KPIs are designed to ensure international comparability between KPI values while taking into account feasibility and affordability. To that end the methodological guidelines have been defined in such a way that accurate and representative results can be obtained for all parameters of interest at a reasonable cost.
Obviously, the larger the sample of observations and locations for observation, the more accurate the KPI estimates for the different strata will be (e.g. a KPI value for a particular type of road, or a particular part of the week). Increasing the number of observations and locations however implies increasing field work costs. Statistically, the required minimum sample size depends mainly on the desired accuracy of the final estimates, for which no absolute value can be determined a priori. Therefore, for the main KPI estimates a pragmatic evaluation was made of the expected confidence intervals at different sample sizes and population parameters. Giving priority to feasibility and affordability, as a rule of thumb the minimum total number of observations was set at 2,000, the minimum number of observations for different strata at 500. It was agreed that this should allow to identify statistically meaningful differences between countries at an affordable price. For some countries, this will imply disproportionate sampling of certain strata compared to the distribution of traffic volumes over different strata. This is however required to allow statistically meaningful international comparisons at the level of each of the strata at interest.
The same pragmatic logic was followed for determining the minimum number of 10 locations for observation for each of the required road types of interest. Once again, there is no statistical rationale for determining the required minimum number of locations to ensure representativeness of the observations for the entire country. This mainly depends on the amount of variance between locations and within a country. Giving priority to affordability, a rule of thumb was also used to define the minimum number of locations at 10 per stratum. In order to ensure representativeness for the entire country larger numbers of locations might be required for larger countries. Taking field work costs into account, it was however decided to only identify the minimum requirements and leave decisions on the final number of locations to the discretion of the member states. Equally importantly, in order to ensure representativeness of the measurement locations these should be randomly selected as far as possible.
The main objective in defining the minimum methodological requirements is to keep a balance between affordability of the field work and the requirements to make meaningful international and historical comparisons. Therefore, the emphasis is placed on the minimum requirements that can also be taken into account by smaller countries. It is however of interest to any member state to increase the accuracy of the KPI estimates by boosting the number of locations and the number of observations.

23/23
Belgium | Austria | Bulgaria | Cyprus | Czech Republic | Finland | Germany | Greece | Ireland | Latvia | Lithuania | Luxembourg | Malta | Netherlands | Poland | Portugal | Slovakia | Spain | Sweden
baseline.vias.be
Annex 3. Summary overview of roadside breath testing requirements and recommendations
SWD minimum requirements Baseline minimum requirements for roadside breath testing
Baseline recommended options for roadside breath testing
KPI: % within legal BAC limit - Method: roadside survey with breath testing of randomly selected drivers - Road type: rural, urban, motorway - Vehicle type: min. cars, other if possible - Location: random - Time: any - Day: week, weekend - Tolerance: instrument error - Month: late spring, early autumn
- % ≤ legal BAC limit + CI aggregated - % ≤ legal BAC limit + CI per road type - % ≤ legal BAC limit + CI per time period - 4 time periods: night/day x week/weekend - Allow exclusion of motorways if not available or feasible for police forces - Min. sample size: 2,000 tested car drivers - Min 500 drivers/road type (3) AND /time period (4) - 1 location = min. 1 control session of min. 30 minutes - Min. 10 different locations/road type (3) AND /time period (4) - Min. 2 different locations/road type x time period (12 crossed strata) - Free month choice but not during holidays or heavy winter period - Traffic counts during sessions (10 min) + estimates of road network length (3 types) for weighing data
- Boost sample size for more accurate estimates and further (crossed) stratifications - Geographical coverage - Exact/mean BAC - Complete disaggregated data - Other vehicle types (goods vehicles, buses, motorcycle) - Driver/ride characteristics - Exclusion of locations with <10 cars/hour is allowed - Region stratification (e.g. NUTS1; all min. sample sizes per region) - Collaboration with police - Use official traffic volume data to sample locations and to weigh data according to considered stratifications - Postpone until COVID-19 restrictions back to normal