methodology for reporting commercial office plug load ... · methodology for reporting commercial...
TRANSCRIPT

Methodology for Reporting Commercial Office Plug Load Energy Use
Establishing common reporting metrics for the energy use of plug load equipment and aggregated office spaces to support energy modeling, benchmarking, and the evaluation of plug load measures
March 2013
Prepared by:
New Buildings Institute:
Dan Harris, Project Manager, [email protected],
Cathy Higgins, Research Director, [email protected],
PECI:
Eliot Crowe, Senior Technical Manager, [email protected],
Joan Effinger, Engineering Manager, [email protected],
Lia Webster, Senior Engineer, [email protected],
Supported by:
California Energy Commission Public Interest Energy Research Program (PIER)

NBI: Plug Load Metrics and Reporting 1 March 2013
INTRODUCTION
Plug loads are becoming the biggest energy end use in commercial office buildings. This is in part because plug loads are growing in absolute terms with greater Information Technology (IT) power demand, and also because design approaches, codes and efficiency programs typically address other end uses, e.g. lighting and HVAC. This results in plug loads having an increasingly higher percentage of the whole building energy use. This is particularly the case in Net Zero or Very Low Energy Buildings where designers use aggressive design strategies to reduce non-plug load energy usage.
Traditionally, plug loads have been difficult to reach with efficiency programs, and for good reasons. In many cases office tenants do not pay electric bills directly and therefore have no direct incentive to reduce plug load usage. They also use plug loads for business reasons which vastly outweigh the financial impact of a few dollars saved through energy efficiency. Also, plug loads are small and distributed; while they add up to a lot of energy, they are difficult to influence easily.
There are three primary approaches to mitigating plug load usage. One approach improves device efficiency standards (for example, the EPA’s Energy Star certification program or California’s Appliance Efficiency Regulations) so that equipment purchased for any office uses less energy than ‘typical’ equipment. Another approach seeks to implement measures and controls that mitigate plug load energy use in a particular office, such as plug load control strip incentives or proposed language in the Title 24-2013 Building Energy Efficiency standards requiring the use of switchable plug load outlets. Lastly, some programs have focused on behavioral methodologies such as competitions and energy use dashboard feedback to encourage reductions of plug load use through the voluntary use of controls or behavioral changes.
As building designers, real estate personnel and utilities seek new ways to reduce plug loads there is a need for data and information to support their decisions. Research data addressing current plug load trends and plug load performance data is not comprehensive. The data and results are often presented through different metrics, the level of detail can be quite specific (i.e. minute-by-minute) or only annual, and the perspective of how individual plug loads contribute to the total office or whole-building usage is usually not included.
NBI has conducted research on the energy use characteristics of plug loads in office spaces and other commercial buildings to provide a greater level of information to those seeking methods and programs for reducing plug loads. In analyzing the data NBI used a standardized set of metrics. The intention is that by utilizing a consistent analysis method the body of data on plug load usage and the impact of measures might be greatly expanded. Further, sufficient data at the office aggregated level might be collected to use in a benchmarking approach to provide a target for offices to achieve as part of a LEED-type rating system.
As described in this guide, the outcome of NBI’s research provides building designers, real estate personnel and utilities with two fundamental ways for expressing energy use characteristics for commercial plug loads: (1) Plug Load Equipment Power Density (EPD) and Schedule and (2) Plug Load Summary Metrics. Each of these is described in general below:
Using data from past projects, this guide includes preliminary ranges for high, median, and low calculations of the metrics and EPD and Schedule. Lastly, the guide includes a summary of references for metering and monitoring equipment and project management.
NBI: Plug Load Metrics and Reporting 2 March 2013
Plug Load EPD and Schedule
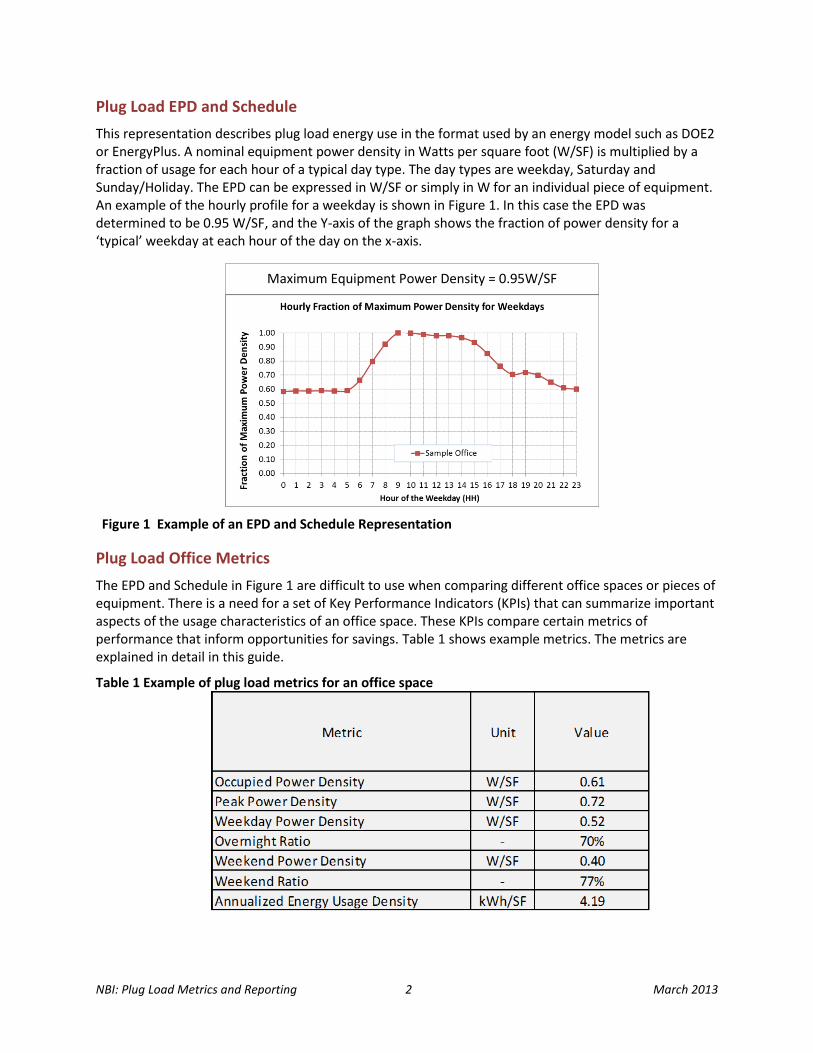
This representation describes plug load energy use in the format used by an energy model such as DOE2 or EnergyPlus. A nominal equipment power density in Watts per square foot (W/SF) is multiplied by a fraction of usage for each hour of a typical day type. The day types are weekday, Saturday and Sunday/Holiday. The EPD can be expressed in W/SF or simply in W for an individual piece of equipment. An example of the hourly profile for a weekday is shown in Figure 1. In this case the EPD was determined to be 0.95 W/SF, and the Y-axis of the graph shows the fraction of power density for a ‘typical’ weekday at each hour of the day on the x-axis.
Plug Load Office Metrics
The EPD and Schedule in Figure 1 are difficult to use when comparing different office spaces or pieces of equipment. There is a need for a set of Key Performance Indicators (KPIs) that can summarize important aspects of the usage characteristics of an office space. These KPIs compare certain metrics of performance that inform opportunities for savings. Table 1 shows example metrics. The metrics are explained in detail in this guide.
Table 1 Example of plug load metrics for an office space
Figure 1 Example of an EPD and Schedule Representation
Maximum Equipment Power Density = 0.95W/SF
NBI: Plug Load Metrics and Reporting 3 March 2013
Intended Audience
This guide is primarily intended to be used by practitioners conducting research into electrical energy usage by plug loads or assessing savings due to plug load measures for office and miscellaneous equipment. The guide lays out the calculations for ensuring the results from a particular project can be merged with those in the greater body of plug load research; an approach that may be useful to a variety of audiences. These include:
Plug Load Efficiency Researchers: The guide is intended to drive the use of standardized metrics when measured studies of plug load usage or measure impacts are undertaken. Efficiency consulting companies, engineering firms and utility pilot program managers are examples of practitioners that may have research projects that resulted in measured data of plug load equipment or office spaces.
Rating System Administrators: Rating systems such as USGBC LEED for Commercial Interiors can use the metrics to establish a measured performance approach to high performance commercial office Tenant Improvement.
Dashboard or EMIS Vendors: Dashboard vendors or metering companies that work with measured data of office plug load usage.
Plug Load Measure Vendors: Companies that design and sell equipment that can be used to track, reduce or impact plug loads.
Energy Modelers: Critical to energy modeling is the accurate assumption of internal gains including the plug load magnitude and its schedule. These assumptions can greatly influence the design of other systems leading to oversized HVAC equipment and inefficient zoning.
Codes and Policy Authors: The developers of new codes, standards and policies addressing plug loads need data in order to define realistic specifications and allow for measurement against those specifications
Utility Analysts: Utility analysts need data that can be used to project the contribution of plug loads as part of a resource planning process.
Office Tenants or Facility Managers: Occupants need simple messages to identify plug load strategies to reduce usage. Facility managers are in a position to use existing or temporary metering to provide feedback to office tenants. The Plug Load Metrics are simple and informative.

NBI: Plug Load Metrics and Reporting 4 March 2013
TWO PLUG LOAD REPORTING METHODS
This section provides details on the calculation of the EPD and Schedule and Plug Load Metrics for office equipment and office spaces.
NBI recommends using an analysis period, i.e. the data range used to calculate metrics of performance, of at least 56 days (8 complete weeks) at intervals of 15-minutes. ‘Before and after’ analysis periods can be chosen in regular 56-day increments to assess the impact of measures or behavioral programs; a trailing 56-day period can be used regularly to track general office usage patterns. Longer periods of data will provide more statistically significant results.
Analysis periods should avoid weeks that contain major holidays (such as Christmas, Thanksgiving, July 4th, Memorial Day and Labor Day) as well as periods where occupancy was known to be deviated from what could be considered ‘normal’.
Individual Plug Load Equipment versus Office Aggregated Plug Load Usage
NBI recommends that meter data from individual equipment be treated differently from meter data for office aggregated usage. The issue is whether to normalize the results by square footage of the office space or to leave the results as a metric of power.
Individual Equipment Meter Data
Individual pieces of equipment should be studied using the EPD and Schedule and Plug Load Metrics approaches using hourly power only, i.e. without normalizing for the square footage of the office space. The relatively low power of the device and the high office square footage divisor will result in very small numbers that will not translate well to aggregation or comparison.
Using the power without normalization will make aggregation of individual equipment easier. The data can be used to mock up any office space and to compare more directly with other, better designed, individual devices without the square footage confusion.
Aggregated Office Space Plug Load Meter data
Aggregated office spaces should use hourly power normalized by square footage for both reporting methods. The aggregated use of all equipment in the office space is unique to that office and normalizing by square footage establishes a useful metric that can be compared and applied as an example to other office spaces or modeled buildings.
Aggregated Whole Building Plug Load Meter Data
This guide does not cover situations where the whole-building aggregated plug load usage is metered. Whole-building plug load data should be calculated with the EPD and Schedule method with the whole-building square footage to normalize the results.
Plug Load EPD and Schedule
The purpose of the Plug Load EPD and Schedule (EPD&S) representation is to report plug load findings in a format that is used by building energy models. The availability of this data will improve the ability of modelers to make accurate assessments of equipment power expectations in office spaces and office buildings.
NBI: Plug Load Metrics and Reporting 5 March 2013
The input is a 56-day or longer, hourly-interval, energy use data series of an individual plug load piece of equipment. Data series of other intervals should be rolled up into hourly points.
As an example, the time stamp 12/1/2013 9:00AM contains the average power between 9:00 and 10:00.
1. Convert data at other intervals into an hourly power series with an hourly date/time stamp
2. Separate the data into three hourly series:
a. Non-holiday Weekdays
b. Saturdays
c. Sundays and Holidays
3. For each series, calculate the average power at each hour of the day across the entire monitoring period. For example, the average power at 9:00AM on each of the weekdays in the weekday series. The result is three data series of 24-points with time stamps from 0:00 to 23:00.
4. Find the single maximum power from all three 24-point series.
5. The fraction at each hourly time stamp for all three series is found by dividing the power at that point by the maximum power. Each fraction shall be rounded to two decimal places.
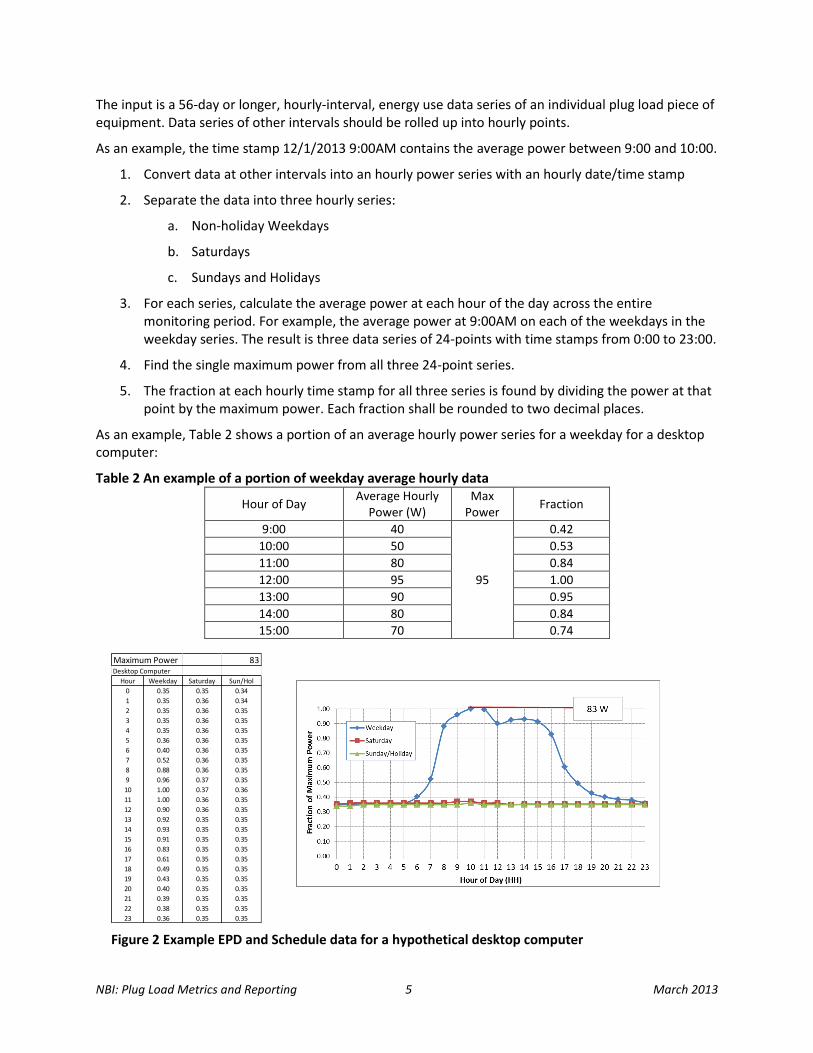
As an example, Table 2 shows a portion of an average hourly power series for a weekday for a desktop computer:
Table 2 An example of a portion of weekday average hourly data
Hour of Day Average Hourly
Power (W) Max
Power Fraction
9:00 40
95
0.42
10:00 50 0.53
11:00 80 0.84
12:00 95 1.00
13:00 90 0.95
14:00 80 0.84
15:00 70 0.74
Maximum Power 83Desktop Computer
Hour Weekday Saturday Sun/Hol
0 0.35 0.35 0.34
1 0.35 0.36 0.34
2 0.35 0.36 0.35
3 0.35 0.36 0.35
4 0.35 0.36 0.35
5 0.36 0.36 0.35
6 0.40 0.36 0.35
7 0.52 0.36 0.35
8 0.88 0.36 0.35
9 0.96 0.37 0.35
10 1.00 0.37 0.36
11 1.00 0.36 0.35
12 0.90 0.36 0.35
13 0.92 0.35 0.35
14 0.93 0.35 0.35
15 0.91 0.35 0.35
16 0.83 0.35 0.35
17 0.61 0.35 0.35
18 0.49 0.35 0.35
19 0.43 0.35 0.35
20 0.40 0.35 0.35
21 0.39 0.35 0.35
22 0.38 0.35 0.35
23 0.36 0.35 0.35
Figure 2 Example EPD and Schedule data for a hypothetical desktop computer
NBI: Plug Load Metrics and Reporting 6 March 2013
An example final result in graphical and tabular form for a desktop computer is shown in Figure 2. The table on the left shows the fraction data for each day type and the maximum power of 83 Watts. The illustration at right displays the data graphically showing the clear use of the computer on the weekdays and the base load of the weekends and holidays.
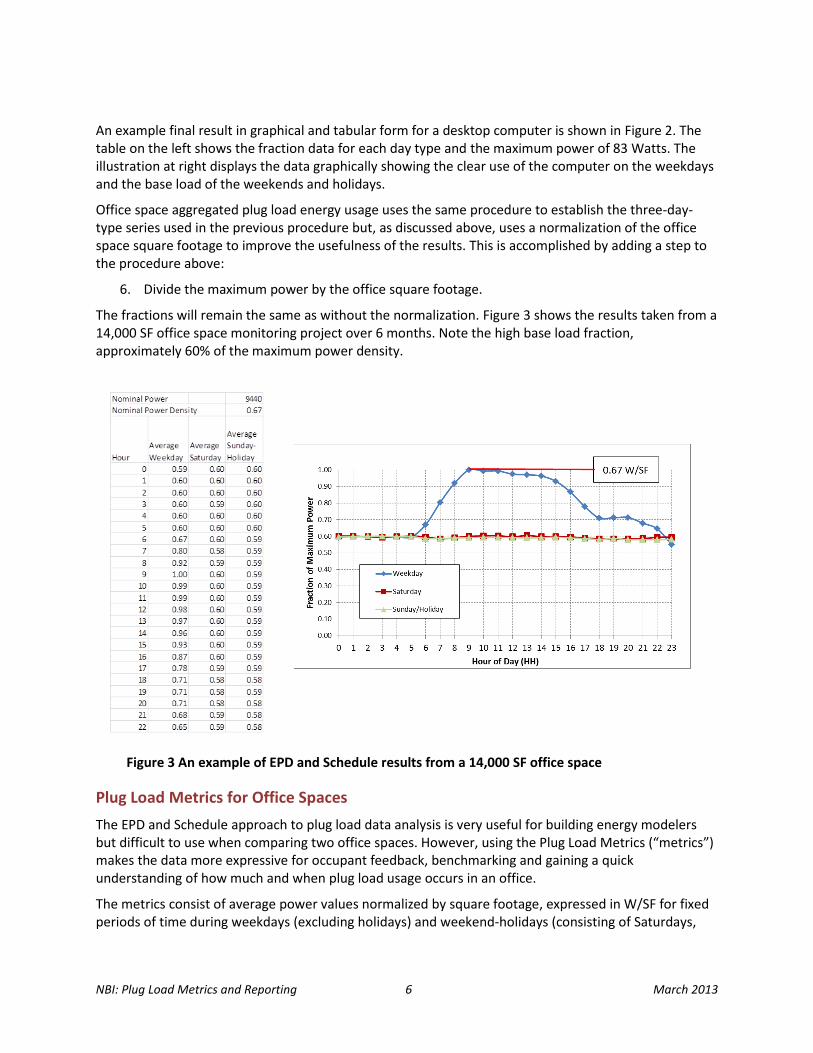
Office space aggregated plug load energy usage uses the same procedure to establish the three-day-type series used in the previous procedure but, as discussed above, uses a normalization of the office space square footage to improve the usefulness of the results. This is accomplished by adding a step to the procedure above:
6. Divide the maximum power by the office square footage.
The fractions will remain the same as without the normalization. Figure 3 shows the results taken from a 14,000 SF office space monitoring project over 6 months. Note the high base load fraction, approximately 60% of the maximum power density.
Plug Load Metrics for Office Spaces
The EPD and Schedule approach to plug load data analysis is very useful for building energy modelers but difficult to use when comparing two office spaces. However, using the Plug Load Metrics (“metrics”) makes the data more expressive for occupant feedback, benchmarking and gaining a quick understanding of how much and when plug load usage occurs in an office.
The metrics consist of average power values normalized by square footage, expressed in W/SF for fixed periods of time during weekdays (excluding holidays) and weekend-holidays (consisting of Saturdays,
Figure 3 An example of EPD and Schedule results from a 14,000 SF office space

NBI: Plug Load Metrics and Reporting 7 March 2013
Sundays and holidays)1. The metrics also include two ratios intended to highlight nighttime usage and weekend usage. The square footage of the office is calculated using the guidelines found in Section Normalizing Office Characteristics. The metrics and descriptions are shown in Table 3.
Table 3 Plug Load Metrics for Office Spaces Metric Description Unit
Occupied Power Density The average power density between 6:00AM and 6:00PM on non-holiday weekdays
W/SF
Peak Power Density The highest 15-minute power density observed in the monitoring period
W/SF
Weekday Power Density The average 24-hour power density on non-holiday weekdays
W/SF
Overnight Ratio The ratio of the average power density in the nighttime on non-holiday weekdays (i.e. 6:00PM to 6:00AM) and the daytime (i.e. the Occupied Power Density).
%
Weekend Power Density The average 24-hour power density for non-workdays including all Saturdays, Sundays, and Holidays.
W/SF
Weekend Ratio The ratio of the Weekend Power Density (numerator) and the Weekday Power Density (denominator). Expressed as a percentage.
%
Annualized Energy Density The projected annual energy usage per square foot for the office space using the annual projection methodology.
W/SF
Occupied Power Density
This metric averages across the busiest part of the day and indicates average demand per SF on a typical workday between 6:00 and 18:00 in the measurement period. A particular office may have a different schedule of occupancy which will impact the metric, but the consistent definition of ‘Occupied’ makes it easier to compare across offices. The office characteristics include an estimate of weekly occupancy hours to make a more accurate comparison between two offices.
Peak Power Density
This metric provides a sense of the installed capacity of the plug load equipment in the office and the potential for permanent demand reduction for measures. The Peak Power Density is the highest 15-minute power demand density measurement in the monitoring period.
Weekday Power Density
This metric tells researchers what a normal workday is like and is used to calculate the annual energy usage for the office. The weekday power density is the average power density across all non-holiday weekdays in the monitoring period.
Overnight Ratio
This metric assesses how much equipment is left on at night. When office personnel undertake measures to switch things off at night, the efficacy of their actions can be established through a change in the Overnight Ratio. One of NBI’s notable findings in plug load research is that very few offices have
1 The metrics currently use the combination of Saturdays, Sundays, and Holidays unlike the EPD & Schedule
method which separates Weekdays, Saturdays, and Sunday/Holidays. The intent was to keep the number of metrics small. NBI may expand this in the future to separate Saturdays from Sunday/Holidays and create better alignment between the two methods.
NBI: Plug Load Metrics and Reporting 8 March 2013
an overnight ratio less than 50%. This demonstrates that there is significant opportunity to reduce plug loads at night.
Weekend Power Density
This metric assess the average power density on non-workdays when the office is unoccupied. The metric serves to project annual energy consumption and compare to the Weekday Power Density. There may be offices that are open more days per week and NBI recommends using the office characteristics to improve comparisons. It is possible that Saturdays can be calculated separately from Sunday/Holiday days to better reflect conditions and align with the EPD and Schedule categorization but this is not included in this revision.
Weekend Ratio
This metric is a ratio of the average weekend power density over the average weekday power density. Similar to the Overnight Ratio, the Weekend Ratio tries to give a sense of how much equipment is running on days with low occupancy.
Annualized Energy Density
Annualized Energy Density is a projection of the annual kWh per year that the office space will use based on the shorter monitoring period used to calculate the metrics. The metric provides a simple analysis of before and after savings for measures or behavioral programs implemented in an office.
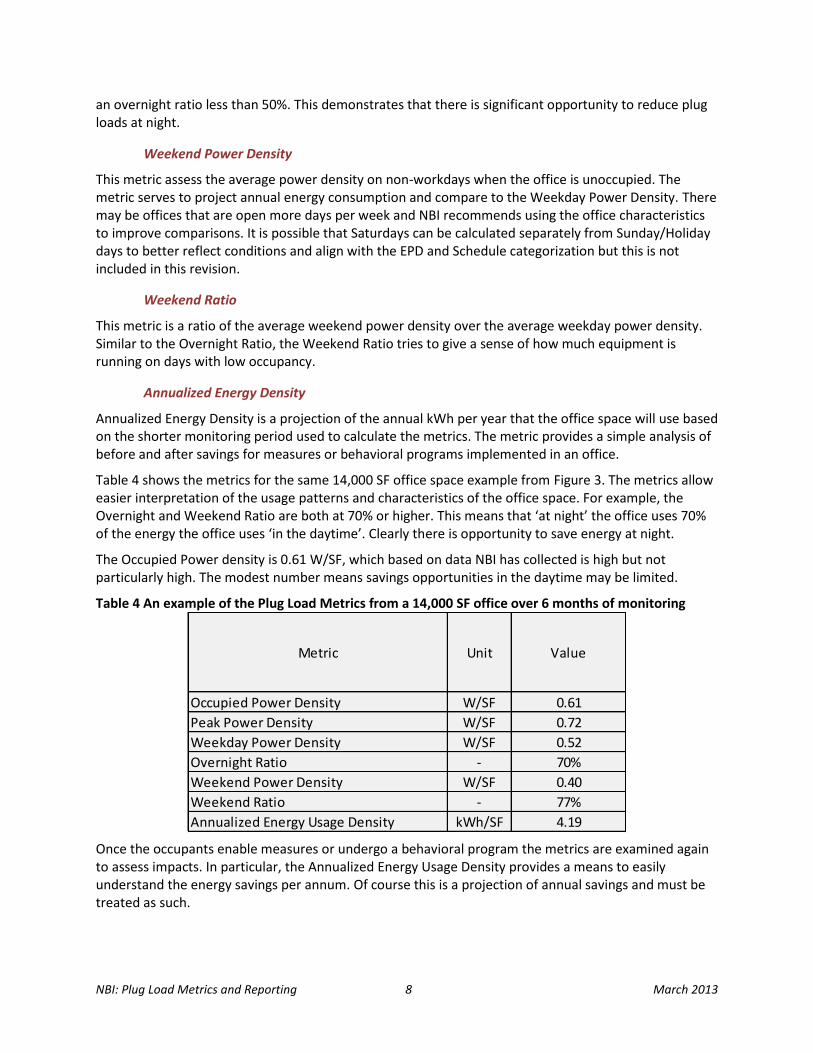
Table 4 shows the metrics for the same 14,000 SF office space example from Figure 3. The metrics allow easier interpretation of the usage patterns and characteristics of the office space. For example, the Overnight and Weekend Ratio are both at 70% or higher. This means that ‘at night’ the office uses 70% of the energy the office uses ‘in the daytime’. Clearly there is opportunity to save energy at night.
The Occupied Power density is 0.61 W/SF, which based on data NBI has collected is high but not particularly high. The modest number means savings opportunities in the daytime may be limited.
Table 4 An example of the Plug Load Metrics from a 14,000 SF office over 6 months of monitoring
Once the occupants enable measures or undergo a behavioral program the metrics are examined again to assess impacts. In particular, the Annualized Energy Usage Density provides a means to easily understand the energy savings per annum. Of course this is a projection of annual savings and must be treated as such.
Metric Unit Value
Occupied Power Density W/SF 0.61
Peak Power Density W/SF 0.72
Weekday Power Density W/SF 0.52
Overnight Ratio - 70%
Weekend Power Density W/SF 0.40
Weekend Ratio - 77%
Annualized Energy Usage Density kWh/SF 4.19
NBI: Plug Load Metrics and Reporting 9 March 2013
NORMALIZING OFFICE CHARACTERISTICS
Normalizing results by characteristics of the office space helps to make more accurate ‘apples-to-apples’ comparisons for the purpose of benchmarking. Plug loads may vary in number and type depending on the size, density and use of the office space so it’s important to use characteristics to increase the usefulness of the results.
For example, if there are two offices of equal square footage but one has twice the number of employees is it useful to compare them without taking into account the differences? Some aspects will still be useful like the EPD and schedule data since this goes into a larger data set that drives the expectations of the modelers, and the Overnight Ratio or the Weekend Ratio which provide feedback about what loads are left on, but direct comparison of the W/SF numbers may not be useful.
This guide recommends certain normalizing characteristics.
Normalizing Characteristics
Office Square Footage – ANSI/BOMA Standard Z65.1-2010
The published standard ANSI/BOMA Standard Z65.1 provides detailed guidelines for the calculation of office square footage and serves as a serviceable guide for calculating the square footage for energy comparisons. The choice of square footage should acknowledge that the intended audience is the office tenant and should not include any energy usage of the core and shell spaces that are the responsibility of the owner or manager.
Hours of Occupancy
An assessment of the hours of weekly occupancy is useful to assess how much the office is used. This is an estimate of the number of days per week that the office is open and the average hours per day. For example, Office X is occupied 5 days per week (M-F) for 8 hours each day. This is a rough estimate that may vary depending on the week but helps to narrow the range of comparison office spaces.
This is not a perfect way of normalizing for hours of occupancy as the result is an estimate. In the future the plug load data itself will use an algorithm that separates base load hours from active hours to determine the hours of occupancy.
Occupant Density
This is accomplished by making a one-time assessment of the equivalent FTE of workers typically in the office space on a regular basis. For example, Office X that is 14,000 SF has 70 FTE that work out of the office. Ideally the occupancy is relatively stable and the monitoring period does not include weeks with major holidays (e.g. Christmas, July 4th or Thanksgiving) where significant deviations from normal occupancy can occur.
Employees working remotely are not considered in the FTE. This is a potential problem with benchmarking office spaces, but again it’s important that the range of comparisons be reduced, not made exact.

NBI: Plug Load Metrics and Reporting 10 March 2013
Server Closets and Data Centers
The presence of a large data center or server closet results in significantly higher overall energy usage and base load energy usage at the office level. The server closet may or may not have dedicated cooling that is separate from the building HVAC system. The presence of a server closets or data center should be noted. Also, the dedicated HVAC must be excluded from a measurement of the office aggregated usage. For example, does Office X have a server closet: Yes or No.

NBI: Plug Load Metrics and Reporting 11 March 2013
A BRIEF TAXONOMY OF OFFICE AND MISCELLANEOUS PLUG LOAD EQUIPMENT
As noted earlier, one of the biggest challenges in understanding and reducing plug loads is that they tend to be highly diverse and distributed; even a modestly-sized office can include over 1,000 plug loads (see the PECI Office Case Study in the Appendix as an example).
Given their quantity and diversity, it is important to have a method for classifying and grouping plug loads. A good taxonomy will enable meaningful analysis of the plug loads and also support efforts to hone in on areas for improvement. Overall, a plug load taxonomy helps in two primary ways:
Understanding building energy use: A plug load inventory is helpful for interpreting plug load metrics. For example, if an office has a relatively high Overnight Ratio, the inventory can be used to highlight essential 24-7 loads such as data servers and refrigerators. All other loads may be considered within scope for a project to reduce the Overnight Ratio, helping to hone in on the equipment with greatest potential.
Evaluating energy savings strategies: Once a tenant, owner or property manager decides to address plug loads they will be presented with many potential options, such as upgrading to higher efficiency equipment, installing plug load controls and behavior-based approaches. A plug load inventory can help in determining the relative magnitude of costs and savings from each of the options, e.g. Occupancy sensors might impact 19 conference/meeting rooms, while smart power strips might cover 178 cubicles.
Table 5 below provides a recommended structure for grouping plug load equipment for offices. Once one defines equipment categories, further separation into sub-categories will help to illustrate the bigger picture and hone in on areas of energy saving opportunity. The PECI case study gives an example of this.
Table 5 Recommended highest-level plug load equipment groups
Highest-Level Equipment Grouping
1 Personal workstations/cubicles (open offices) and private office equipment
2 Conference/meeting room equipment
3 Shared office equipment
4 Kitchen and hospitality equipment
5 IT equipment
6 Miscellaneous equipment
Following the standard grouping approach in Table 5 will allow for easier comparison with peers as industry-wide statistical data grows. While this is recommended as the primary approach, some situations may warrant a different approach or additional grouping schemes (such as splitting plug loads by floor, department or other criteria).
While it is possible to develop energy use totals for each category and sub-category of the plug load equipment (through actual measurements or equipment specifications), this is unlikely to occur other than for in-depth research projects.
The first step in establishing a plug load inventory is to define distinct equipment types which are sub-categories of the highest-level groups in Table 5. We recommend three general rules of thumb:
NBI: Plug Load Metrics and Reporting 12 March 2013
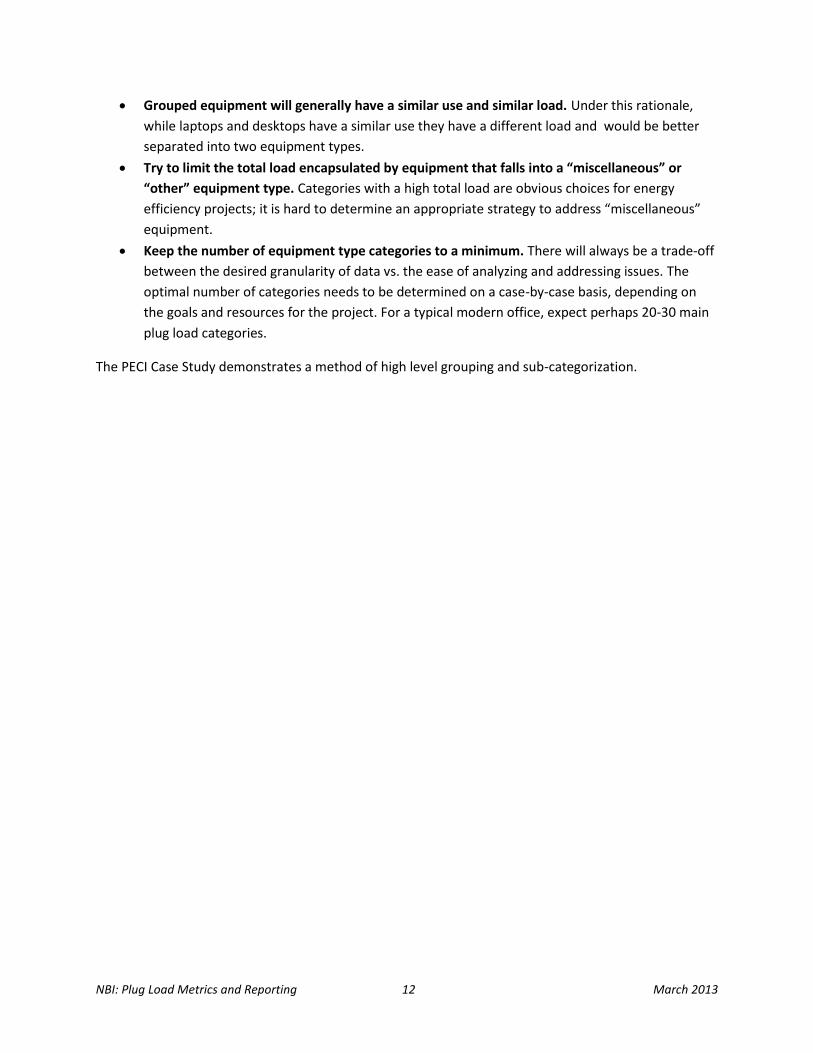
Grouped equipment will generally have a similar use and similar load. Under this rationale,
while laptops and desktops have a similar use they have a different load and would be better
separated into two equipment types.
Try to limit the total load encapsulated by equipment that falls into a “miscellaneous” or
“other” equipment type. Categories with a high total load are obvious choices for energy
efficiency projects; it is hard to determine an appropriate strategy to address “miscellaneous”
equipment.
Keep the number of equipment type categories to a minimum. There will always be a trade-off
between the desired granularity of data vs. the ease of analyzing and addressing issues. The
optimal number of categories needs to be determined on a case-by-case basis, depending on
the goals and resources for the project. For a typical modern office, expect perhaps 20-30 main
plug load categories.
The PECI Case Study demonstrates a method of high level grouping and sub-categorization.
NBI: Plug Load Metrics and Reporting 13 March 2013
RANGES OF PERFORMANCE
The two methods described above enable ‘before and after’ comparisons of results that provide valuable information and feedback. Benchmarking the metrics, by comparing one office’s metrics against another, also serves as a valuable method for tracking progress but requires sufficient comparison data.
In the course of research on several projects NBI has collected data from offices that provide a modest start to a comparison set of data. This data set is taken from 17 office spaces with a monitoring period of at least three months per office. There are no normalizing characteristics other than office square footage.
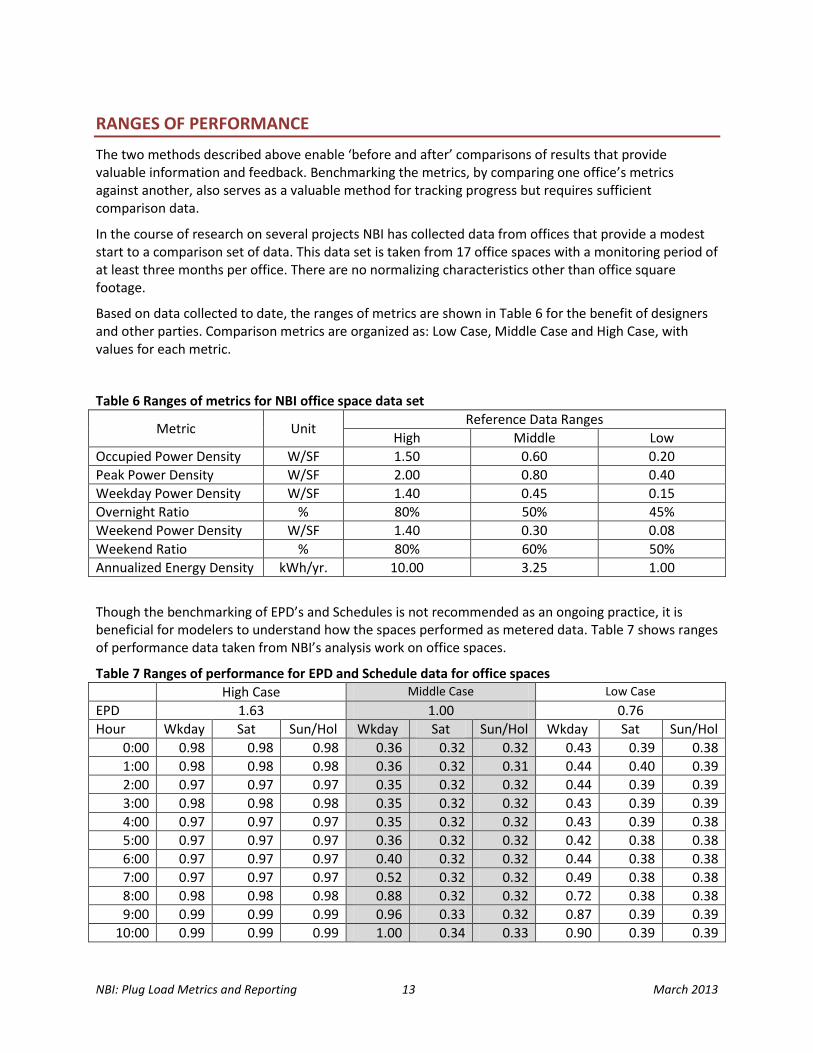
Based on data collected to date, the ranges of metrics are shown in Table 6 for the benefit of designers and other parties. Comparison metrics are organized as: Low Case, Middle Case and High Case, with values for each metric.
Table 6 Ranges of metrics for NBI office space data set
Metric Unit Reference Data Ranges
High Middle Low
Occupied Power Density W/SF 1.50 0.60 0.20
Peak Power Density W/SF 2.00 0.80 0.40
Weekday Power Density W/SF 1.40 0.45 0.15
Overnight Ratio % 80% 50% 45%
Weekend Power Density W/SF 1.40 0.30 0.08
Weekend Ratio % 80% 60% 50%
Annualized Energy Density kWh/yr. 10.00 3.25 1.00
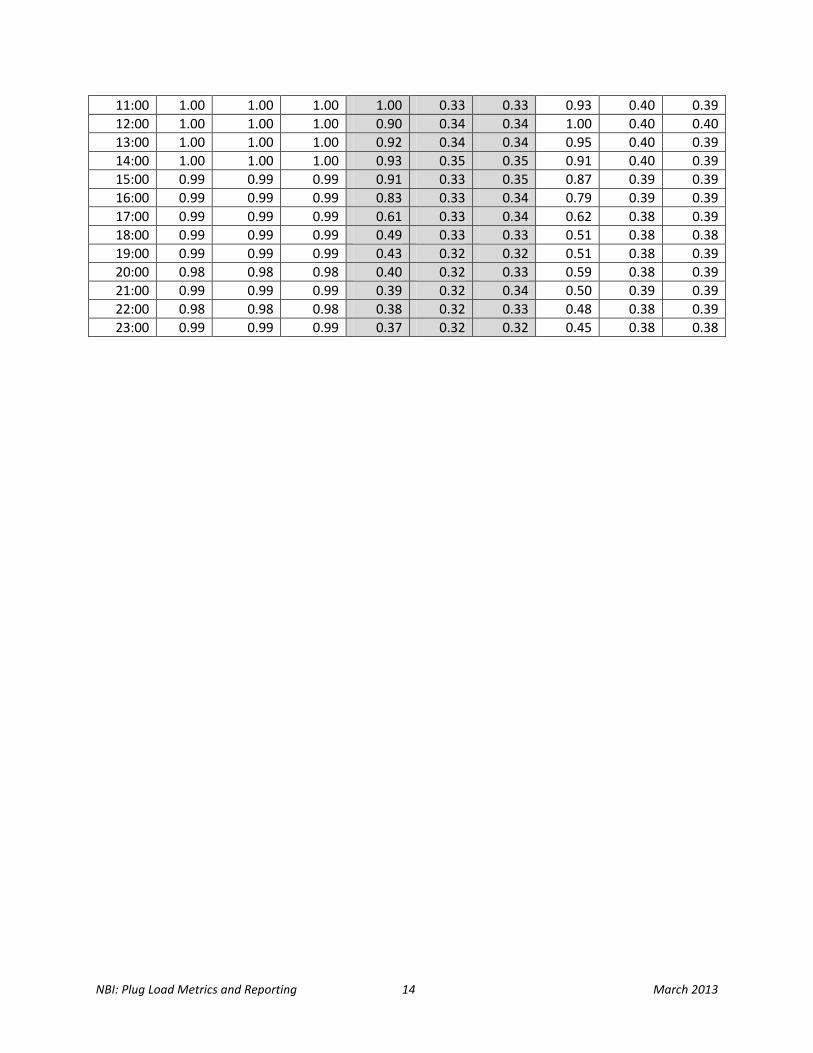
Though the benchmarking of EPD’s and Schedules is not recommended as an ongoing practice, it is beneficial for modelers to understand how the spaces performed as metered data. Table 7 shows ranges of performance data taken from NBI’s analysis work on office spaces.
Table 7 Ranges of performance for EPD and Schedule data for office spaces
High Case Middle Case Low Case
EPD 1.63 1.00 0.76
Hour Wkday Sat Sun/Hol Wkday Sat Sun/Hol Wkday Sat Sun/Hol
0:00 0.98 0.98 0.98 0.36 0.32 0.32 0.43 0.39 0.38
1:00 0.98 0.98 0.98 0.36 0.32 0.31 0.44 0.40 0.39
2:00 0.97 0.97 0.97 0.35 0.32 0.32 0.44 0.39 0.39
3:00 0.98 0.98 0.98 0.35 0.32 0.32 0.43 0.39 0.39
4:00 0.97 0.97 0.97 0.35 0.32 0.32 0.43 0.39 0.38
5:00 0.97 0.97 0.97 0.36 0.32 0.32 0.42 0.38 0.38
6:00 0.97 0.97 0.97 0.40 0.32 0.32 0.44 0.38 0.38
7:00 0.97 0.97 0.97 0.52 0.32 0.32 0.49 0.38 0.38
8:00 0.98 0.98 0.98 0.88 0.32 0.32 0.72 0.38 0.38
9:00 0.99 0.99 0.99 0.96 0.33 0.32 0.87 0.39 0.39
10:00 0.99 0.99 0.99 1.00 0.34 0.33 0.90 0.39 0.39
NBI: Plug Load Metrics and Reporting 14 March 2013
11:00 1.00 1.00 1.00 1.00 0.33 0.33 0.93 0.40 0.39
12:00 1.00 1.00 1.00 0.90 0.34 0.34 1.00 0.40 0.40
13:00 1.00 1.00 1.00 0.92 0.34 0.34 0.95 0.40 0.39
14:00 1.00 1.00 1.00 0.93 0.35 0.35 0.91 0.40 0.39
15:00 0.99 0.99 0.99 0.91 0.33 0.35 0.87 0.39 0.39
16:00 0.99 0.99 0.99 0.83 0.33 0.34 0.79 0.39 0.39
17:00 0.99 0.99 0.99 0.61 0.33 0.34 0.62 0.38 0.39
18:00 0.99 0.99 0.99 0.49 0.33 0.33 0.51 0.38 0.38
19:00 0.99 0.99 0.99 0.43 0.32 0.32 0.51 0.38 0.39
20:00 0.98 0.98 0.98 0.40 0.32 0.33 0.59 0.38 0.39
21:00 0.99 0.99 0.99 0.39 0.32 0.34 0.50 0.39 0.39
22:00 0.98 0.98 0.98 0.38 0.32 0.33 0.48 0.38 0.39
23:00 0.99 0.99 0.99 0.37 0.32 0.32 0.45 0.38 0.38
NBI: Plug Load Metrics and Reporting 15 March 2013
MONITORING RECOMMENDATIONS AND REFERENCES
Metering individual equipment and office-level aggregated plug loads requires the installation of metering equipment and analysis of the data. This guide serves as a set of recommendations for a base set of data analysis but does not address the issues around the installation and gathering of meter data.
This section includes a few resources for meters, data acquisition and software tools for data analysis.
Metering and EMIS Equipment and Advice
PECI Guide on Energy Tracking http://www.cacx.org/PIER/documents/bpt-handbook.pdf
NBI Guide on Advanced Metering and Energy Information Systems http://newbuildings.org/sites/default/files/metering-EPA%2083378201.pdf
Metering Best Practices Guide – Federal Energy Management Program http://www1.eere.energy.gov/femp/pdfs/mbpg.pdf
Meter and Data Acquisition Equipment Vendors
Data Acquisition Vendors
Obvius – www.obvius.com
Onset – www.onsetcomp.com
Metering Vendors
Veris – www.veris.com
Dent Instruments - www.dentinstruments.com
Wattnode - www.ccontrolsys.com
Power Meter Store – www.powermeterstore.com
Watt’s Up Individual Outlet Metering – www.powerwerx.com
Web-Based Software Vendors
A few software vendors that work with office aggregate data.
Lucid – www.lucidenergy.com
Pulse – www.pulseenergy.com
Deck Monitoring – www.deckmonitoring.com

Plug Load Case Study | 1
Case Study: Analyzing Plug Loads Applying a New Methodology for Reporting Plug Load Energy Use
Background and Objectives
PECI’s headquarters occupy three floors of a LEED® Platinum office building in Portland, Oregon. To help
understand how we use energy, we have installed state-of-the-art energy monitoring down to the circuit level.
Energy use metrics and benchmarks for lighting and HVAC are well-established, allowing us to evaluate our
performance in those areas. Plug loads are another matter, however. While we have green purchasing policies
that drive us to purchase efficient office equipment, there are no industry-accepted metrics or benchmarks to
show how our plug load energy use compares to our peers or to best practice. In 2012 PECI ran a company
competition pitting floors against each other to reduce plug loads through behavioral changes. The results were
encouraging, and it got us thinking about how we could really attack
our plug load energy use. To achieve deeper savings, we needed to
get a deeper understanding of what made up our plug loads.
Recent research by New Buildings Institute (NBI) on behalf of the
California Energy Commission led to the development of plug load
energy use metrics, featured in A Methodology for Reporting
Commercial Office Plug Load Energy Use1. As a part of this
research NBI worked with PECI to apply the new metrics and the
associated field data to assess our own plug load energy use.
In addition to calculating office-level energy use metrics we
developed an inventory of our plug load equipment and analyzed
equipment-level data to examine what was contributing to high
overnight energy use. Though this depth of research is not necessary
for the average office energy user, there were many lessons learned
that could be applied to any building.
PECI Office Plug Load Summary Metrics
PECI’s headquarters has office-level end use metering installed and connected to an Energy Management
Information system (EMIS) to record and display energy use data in near-realtime. HVAC, lighting, and plug loads
are grouped and reported separately, giving us the ability to track each end use. Because we have submetered
plug load energy data, calculating plug load summary metrics based on the NBI methodology was a very
straightforward exercise, taking about two hours of engineer time (metrics are shown in Table 1 below). The main
consideration was choosing the appropriate time period for the calculations. PECI had almost 12 months of plug
load data available but occupancy had changed during that time, so the calculations used 7 months of data, from
the July 2012- February 2013 period when occupancy was relatively stable.
1 www.newbuildings.org/PIER-research

Plug Load Case Study | 2
Table 1. Plug Load Summary Metrics for PECI Headquarters
Comparing PECI’s metrics with reference values published by NBI, the PECI office showed good performance
with most values approximately halfway between the median and lowest reference values. The main area of
concern appears to be the Overnight Ratio of 59%, which is higher than the median reference value of 55%.
Knowing that the reference values were established based on a relatively small
sample set (16 offices), comparison is somewhat subjective. It is also noted that
the metrics are typically normalized by square foot, but do not take account of
other factors, such as occupant density which can impact plug loads. However,
developing the office-level summary metrics has helped in prioritizing areas for
action. In PECI’s case this means looking to reduce the Overnight Ratio by
identifying what consumes energy at night and reducing it through controls or
other measures.
Using the NBI guide, PECI’s engineers also calculated the Energy Power Density
and Schedule (EPD&S) metrics. This approach identifies the maximum plug load
demand and then determines a fraction of that maximum for each of hour of the
day – this is shown in Figure 1 below.
2 Reference values from Methodology for Reporting Commercial Office Plug Load Energy Use, NBI 2013
Plug Load Metric Description PECI
values
Reference Values2
Highest Median Lowest
Weekday Power Density (W/SF) Summarizes performance for a typical workday over 24 hours
0.36 1.60 0.45 0.10
Occupied Power Density (W/SF) Summarizes performance during the day (6AM to 6PM)
0.44 1.50 0.55 0.20
Peak Demand Density (W/SF) Reflects the maximum plug load
0.62 2.00 0.90 0.40
Overnight Ratio A percent comparison of ‘night time’ performance versus ‘daytime’
59% 75% 55% 40%
Weekend Power Density (W/SF) Summarizes performance for a typical weekend day or holiday over 24 hours
0.23 1.50 0.30 0.08
Weekend Ratio Percent comparison of ‘weekday’ versus ‘weekend’
66% 100% 70% 50%
Annualized Energy Usage Density (kWh/SF)
A projection of the annual energy usage per square foot based on the analysis period data
2.81 14.00 3.00 1.00
Plug Load Energy Use
Office and kitchen equipment account for 23% of commercial office energy use in California
Source: CEUS (2006)
Plug Load Case Study | 3
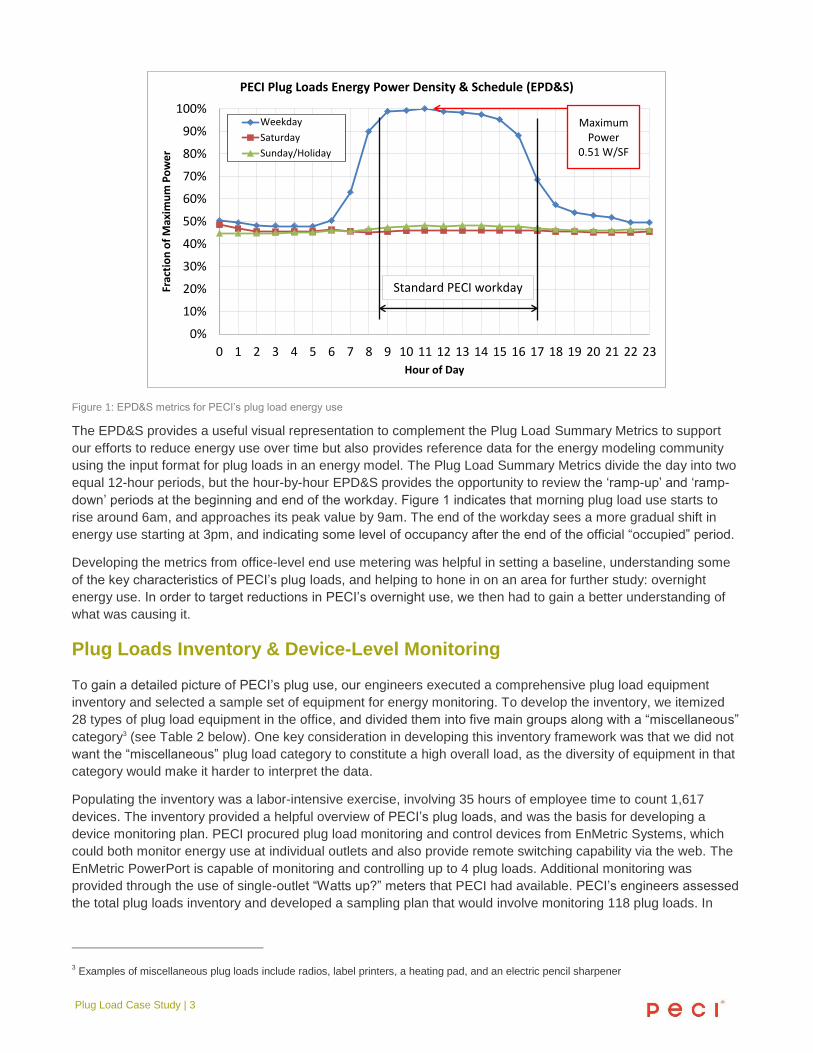
Figure 1: EPD&S metrics for PECI’s plug load energy use
The EPD&S provides a useful visual representation to complement the Plug Load Summary Metrics to support
our efforts to reduce energy use over time but also provides reference data for the energy modeling community
using the input format for plug loads in an energy model. The Plug Load Summary Metrics divide the day into two
equal 12-hour periods, but the hour-by-hour EPD&S provides the opportunity to review the ‘ramp-up’ and ‘ramp-
down’ periods at the beginning and end of the workday. Figure 1 indicates that morning plug load use starts to
rise around 6am, and approaches its peak value by 9am. The end of the workday sees a more gradual shift in
energy use starting at 3pm, and indicating some level of occupancy after the end of the official “occupied” period.
Developing the metrics from office-level end use metering was helpful in setting a baseline, understanding some
of the key characteristics of PECI’s plug loads, and helping to hone in on an area for further study: overnight
energy use. In order to target reductions in PECI’s overnight use, we then had to gain a better understanding of
what was causing it.
Plug Loads Inventory & Device-Level Monitoring
To gain a detailed picture of PECI’s plug use, our engineers executed a comprehensive plug load equipment
inventory and selected a sample set of equipment for energy monitoring. To develop the inventory, we itemized
28 types of plug load equipment in the office, and divided them into five main groups along with a “miscellaneous”
category3 (see Table 2 below). One key consideration in developing this inventory framework was that we did not
want the “miscellaneous” plug load category to constitute a high overall load, as the diversity of equipment in that
category would make it harder to interpret the data.
Populating the inventory was a labor-intensive exercise, involving 35 hours of employee time to count 1,617
devices. The inventory provided a helpful overview of PECI’s plug loads, and was the basis for developing a
device monitoring plan. PECI procured plug load monitoring and control devices from EnMetric Systems, which
could both monitor energy use at individual outlets and also provide remote switching capability via the web. The
EnMetric PowerPort is capable of monitoring and controlling up to 4 plug loads. Additional monitoring was
provided through the use of single-outlet “Watts up?” meters that PECI had available. PECI’s engineers assessed
the total plug loads inventory and developed a sampling plan that would involve monitoring 118 plug loads. In
3 Examples of miscellaneous plug loads include radios, label printers, a heating pad, and an electric pencil sharpener
0%
10%
20%
30%
40%
50%
60%
70%
80%
90%
100%
0 1 2 3 4 5 6 7 8 9 10 11 12 13 14 15 16 17 18 19 20 21 22 23
Frac
tio
n o
f M
axim
um
Po
we
r
Hour of Day
PECI Plug Loads Energy Power Density & Schedule (EPD&S)
Weekday
Saturday
Sunday/Holiday
MaximumPower
0.51 W/SF
Standard PECI workday
Plug Load Case Study | 4
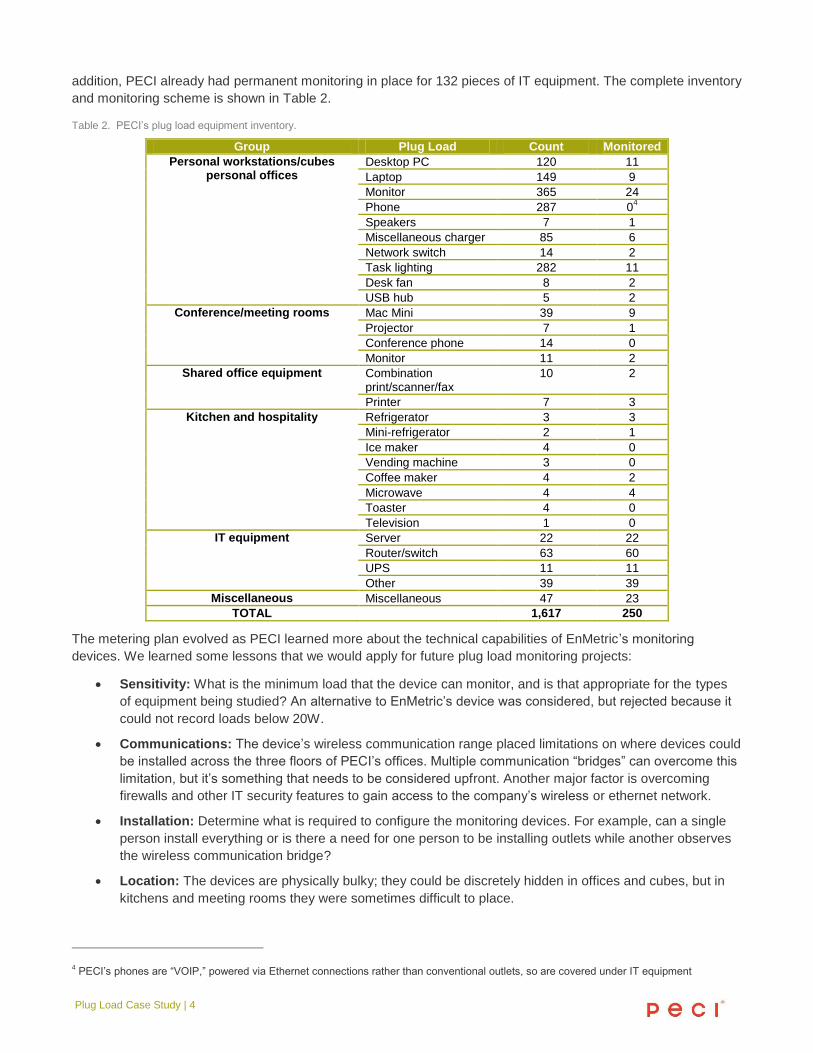
addition, PECI already had permanent monitoring in place for 132 pieces of IT equipment. The complete inventory
and monitoring scheme is shown in Table 2.
Table 2. PECI’s plug load equipment inventory.
Group Plug Load Count Monitored
Personal workstations/cubes personal offices
Desktop PC 120 11
Laptop 149 9
Monitor 365 24
Phone 287 04
Speakers 7 1
Miscellaneous charger 85 6
Network switch 14 2
Task lighting 282 11
Desk fan 8 2
USB hub 5 2
Conference/meeting rooms Mac Mini 39 9
Projector 7 1
Conference phone 14 0
Monitor 11 2
Shared office equipment Combination print/scanner/fax
10 2
Printer 7 3
Kitchen and hospitality Refrigerator 3 3
Mini-refrigerator 2 1
Ice maker 4 0
Vending machine 3 0
Coffee maker 4 2
Microwave 4 4
Toaster 4 0
Television 1 0
IT equipment Server 22 22
Router/switch 63 60
UPS 11 11
Other 39 39
Miscellaneous Miscellaneous 47 23
TOTAL 1,617 250
The metering plan evolved as PECI learned more about the technical capabilities of EnMetric’s monitoring
devices. We learned some lessons that we would apply for future plug load monitoring projects:
Sensitivity: What is the minimum load that the device can monitor, and is that appropriate for the types
of equipment being studied? An alternative to EnMetric’s device was considered, but rejected because it
could not record loads below 20W.
Communications: The device’s wireless communication range placed limitations on where devices could
be installed across the three floors of PECI’s offices. Multiple communication “bridges” can overcome this
limitation, but it’s something that needs to be considered upfront. Another major factor is overcoming
firewalls and other IT security features to gain access to the company’s wireless or ethernet network.
Installation: Determine what is required to configure the monitoring devices. For example, can a single
person install everything or is there a need for one person to be installing outlets while another observes
the wireless communication bridge?
Location: The devices are physically bulky; they could be discretely hidden in offices and cubes, but in
kitchens and meeting rooms they were sometimes difficult to place.
4 PECI’s phones are “VOIP,” powered via Ethernet connections rather than conventional outlets, so are covered under IT equipment
Plug Load Case Study | 5
Time stamps: Check if data time stamp can be configured to suit various time zones, or is hard-
programmed to a single time zone such as GMT. If the latter is true, data will have to be edited after
download.
Once IT-related and other issues were addressed, the monitoring devices were straightforward to use, and were
able to collect the data as per PECI’s monitoring plan. The initial phase of PECI’s study involved collecting seven
days’ worth of data to validate the monitoring capability and to get an overall picture of plug load energy use.
Some data ‘cleaning’ was required, to address anomalous zero values, but this was relatively minor.
Device-Level Monitoring Results
In order to use the device-level monitoring data effectively, the data collected for the sampled equipment needed
to be extrapolated to represent the full equipment inventory. PECI’s engineers then estimated total plug load
usage for the monitoring period by hour and daytype, and re-calculated the Plug Load Metrics listed in Table 1 in
order to determine if the data extrapolation was approximately accurate. The metrics derived from the device-level
monitoring were then compared to those derived from office-level metering5. The results are shown in Table 3.
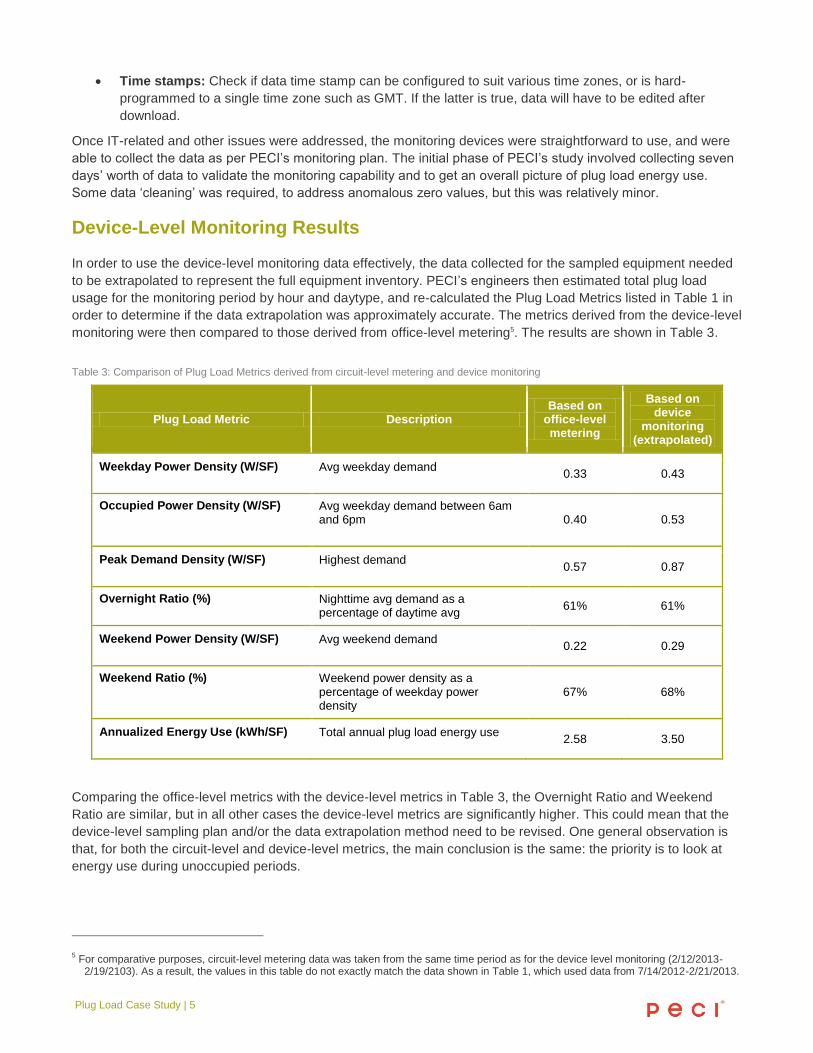
Table 3: Comparison of Plug Load Metrics derived from circuit-level metering and device monitoring
Plug Load Metric Description Based on
office-level metering
Based on device
monitoring (extrapolated)
Weekday Power Density (W/SF) Avg weekday demand
0.33 0.43
Occupied Power Density (W/SF) Avg weekday demand between 6am and 6pm
0.40 0.53
Peak Demand Density (W/SF) Highest demand
0.57 0.87
Overnight Ratio (%) Nighttime avg demand as a percentage of daytime avg
61% 61%
Weekend Power Density (W/SF) Avg weekend demand
0.22 0.29
Weekend Ratio (%) Weekend power density as a percentage of weekday power density
67% 68%
Annualized Energy Use (kWh/SF) Total annual plug load energy use
2.58 3.50
Comparing the office-level metrics with the device-level metrics in Table 3, the Overnight Ratio and Weekend
Ratio are similar, but in all other cases the device-level metrics are significantly higher. This could mean that the
device-level sampling plan and/or the data extrapolation method need to be revised. One general observation is
that, for both the circuit-level and device-level metrics, the main conclusion is the same: the priority is to look at
energy use during unoccupied periods.
5 For comparative purposes, circuit-level metering data was taken from the same time period as for the device level monitoring (2/12/2013-
2/19/2103). As a result, the values in this table do not exactly match the data shown in Table 1, which used data from 7/14/2012-2/21/2013.

Plug Load Case Study | 6
With just one week of device-level data, measuring energy usage at 15-minute intervals, we learned a great deal
about our plug load usage breakdown. Figure 2 illustrates the overall breakdown of loads by end use for daytime
and nighttime periods on weekdays.
Figure 2: Energy use breakdown, daytime and nighttime periods on weekdays
In reviewing the charts above, our initial question was: why is so much equipment operating at nighttime, beyond
the IT equipment, refrigerators, and freezers? Desktop PCs, laptops, monitors, conference room equipment, and
printers constitute 33% of energy use between 6pm and 6am. It is likely that some people are working in the office
beyond 6pm, but it appears there is high potential to reduce the overnight plug loads by targeting these
equipment types.
Another initial observation was that, during the daytime, desktop
PCs and laptops account for 17% and 7% of overall energy use
respectively. Based on the inventory, PECI’s offices have 120 PCs
and 149 laptops, so the data shows that laptops were using less
than half as much energy even though there are 25% more of them.
Figure 2 provides a valuable overall comparison between
equipment categories. To get a deeper understanding of the hour-
by-hour dynamics of energy use, a load profile chart was created.
Figure 3 below captures a single weekday within the monitoring
period.
Desktop PCs17%
Laptops7%
Monitors17%
Task Lighting1%
Misc1%
Printers13%
Conf Rm Equip5%
Refrigerator & Freezer
7%
Other Kitchen Equip
3%
IT Equip29%
PECI Plug Load Breakdown by End Use - Weekdays (6AM-6PM)
Desktop PCs12%
Laptops6%
Monitors2%
Task Lighting1%
Misc1%
Printers8%
Conf Rm Equip5%
Refrigerator & Freezer
12%Other Kitchen Equip
0%
IT Equip53%
PECI Plug Load Breakdown by End Use - Weeknights (6PM-6AM)
Office-Level End Use Metering: Using panel- or circuit-level metering to collect the end-use energy (lights, plugs, HVAC) for a whole office space.
Device-Level Monitoring: Installing
monitoring on individual pieces of
plug load equipment

Plug Load Case Study | 7
Figure 3: Monitored plug load data for a single weekday
The time series chart reinforces some of the observations from the charts in Figure 2, showing the amount of
equipment that continues to draw power long after it is needed (PCs, laptops, and monitors for example). The
general downward trend between 6pm and 8pm might indicate employees working late, but later in the evening
and into the early hours of the day there is still considerable energy use occurring.
Conclusions
The Plug Load Summary Metrics provided a valuable comparison to highlight the overall performance of the office
space and identify areas to study for our more detailed metering and analysis. With just over one week of device-
level data, the plug loads monitoring has provided a highly detailed view of PECI’s hour-by-hour energy use,
broken down by equipment type. Data collection and analysis are continuing, but for now this data serves as a
useful snapshot for future comparisons, helped hone in on unnecessary overnight energy use, and can be used
as the basis for some rough energy savings estimates.
We also learned much about the approach to developing a monitoring plan, and to deploying plug load equipment
monitoring. Integrating device-level monitoring with PECI’s IT network was the most significant hurdle that had to
be overcome during this study. Beyond that, many of the planning and
deployment elements were relatively straightforward, although in some
cases time-consuming (for example the equipment inventory).
Based on the data from our study, the initial priority is to target
nighttime energy use of non-critical equipment. The Overnight Ratio of
59% is above NBI’s median reference value of 55%. The device-level
monitoring clearly indicates unnecessary energy use by Desktop PCs,
laptops, monitors, conference room equipment, and printers during
unoccupied hours. We will use this data to drive overnight energy
reductions through controls and behavior-based strategies. The data
will also be valuable as a baseline against which we can measure our
progress in reducing energy use.
0
5
10
15
20
25
30
35
40
45
50
0 1 2 3 4 5 6 7 8 9 10 11 12 13 14 15 16 17 18 19 20 21 22 23
De
man
d (
kW)
Hour of Day
PECI Plug Loads by Equipment Type, Wednesday 2/13/2013
Other Kitchen Eq.
Refrigerator/Freezer
Conf Rm Equip
Printers
Monitors
Laptops
Desktops
Misc
Task Lighting
IT Equip
Standard PECIWorkday
Author: Eliot Crowe, PECI Engineers: Joan Effinger, Lia Webster, Phil Jordan, Jason Ochs, PECI
Support: Dan Harris, NBI
This work funded by the California Energy commission’s PIER Research Program
www.peci.org