pacific gas and electric company retail plug load
TRANSCRIPT

PG&E’s Emerging Technologies Program ET13PGE8052
Pacific Gas and Electric Company Retail Plug-Load Portfolio (RPP) Trial: Evaluation Report ET Project Number: ET13PGE8052
Project Manager: Julie Colvin Senior Program Manager – Residential Programs Pacific Gas and Electric Company 245 Market St. San Francisco, CA 94105 Prepared By: Todd Malinick, PhD EMI Consulting 83 Columbia St., Ste. 400 Seattle, WA 98104 & Richard Ridge, PhD Ridge and Associates 2018 Broadway St. San Francisco, CA 94115 Issued: April 24, 2015
© Copyright, 2015, Pacific Gas and Electric Company. All rights reserved.

i
PG&E’s Emerging Technologies Program ET13PGE8052
ACKNOWLEDGEMENTS
Pacific Gas and Electric Company’s Emerging Technologies Program is responsible for this project. It was developed as part of Pacific Gas and Electric Company’s Emerging Technology – Retail Plug-Load Portfolio (RPP) Program under internal project ET13PGE8052. EMI Consulting and Ridge and Associates conducted this evaluation for Pacific Gas and Electric Company with overall guidance and management from Julie Colvin and Brian Smith. For more information on this project, contact Julie Colvin at [email protected] or Brian Smith at mailto:[email protected].
LEGAL NOTICE
This report was prepared for Pacific Gas and Electric Company for use by its employees and agents. Neither Pacific Gas and Electric Company nor any of its employees and agents:
(1) makes any written or oral warranty, expressed or implied, including, but not limited to those concerning merchantability or fitness for a particular purpose;
(2) assumes any legal liability or responsibility for the accuracy, completeness, or usefulness of any information, apparatus, product, process, method, or policy contained herein; or
(3) represents that its use would not infringe any privately owned rights, including, but not limited to, patents, trademarks, or copyrights.

ii
PG&E’s Emerging Technologies Program ET13PGE8052
ABBREVIATIONS AND ACRONYMS
AHAM Association of Home Appliance Manufacturers
BTU British thermal units
CADR Clean air delivery rate
CF Coincident factor
CPUC California Public Utility Commission
CPUC-ED California Public Utility Commission-Energy Division
DEER Database for Energy Efficiency Resources
DID Difference-in-differences
DVD Digital video disc
EM&V Evaluation, measurement and verification
EO Evaluation objective
HTiB Home theater-in-a-box
Int Intervention
IOU Independently-owned utility
kW Kilowatt
kWh Kilowatt-hour
NEEA Northwest Energy Efficiency Alliance
NEEP Northeast Energy Efficiency Partnership
Non-PQ Non-program-qualified
NTGR Net-to-gross ratio
OO Operational objective
PG&E Pacific Gas and Electric Company
PO Performance objective
PQ Program-qualified
PQS Program-qualified share

iii
PG&E’s Emerging Technologies Program ET13PGE8052
QA/QC Quality assurance/quality control
RPP Retail Plug Load Portfolio
SMUD Sacramento Municipal Utility District
UND Unit demand reductions
UEC Unit energy consumption
UES Unit energy savings

iv
PG&E’s Emerging Technologies Program ET13PGE8052
FIGURES Figure 1: Retail Plug Load Portfolio Program Logic Model ................. 10 Figure 2: Participating Retailer Stores ........................................... 15 Figure 3: Research Methods Used for the RPP Trial Evaluation .......... 19 Figure 4: Generalized Unit Energy Consumption (UEC) Estimation
Methodology ............................................................. 30 Figure 5: Illustration of Quasi-Experimental Participant-Only Pre-
Post Forecasted PQS Baseline to Recorded Data ............. 36 Figure 6: Illustration of Idealized Quasi-Experimental Participant-
Only PQS Regression .................................................. 38 Figure 7: Illustration of Segmented Regression Approach with
Treatment and Control Groups ..................................... 40 Figure 8: Shelf Survey Results: Models on Sale and Models with
Promotion ................................................................. 67 Figure 9: Participating and Nonparticipating Store PQS for Historical
and Trial Periods ........................................................ 74 Figure 10: Forecasted PQS Baseline – Air Cleaners (<100 CADR) ..... 76 Figure 11: Participant-Only PQS Regression (Modified Step) – Air
Cleaners (<100 CADR) ............................................... 77 Figure 12: Participant-Only PQS Regression (Segmented) – Air
Cleaners (<100 CADR) ............................................... 78 Figure 13: Comparison-Based PQS Regression (Modified Step) – Air
Cleaners (<100 CADR) ............................................... 79 Figure 14: Comparison-Based PQS Regression (Segmented) – Air
Cleaners (<100 CADR) ............................................... 80 Figure 15: Hypothesized Pattern in PQS Over Several Years of the
RPP Program ............................................................. 98 Figure 16: PG&E and Nonparticipating Store PQS for Historical and
Trial Periods ............................................................ 139 Figure 17: SMUD and Nonparticipating Store PQS for Historical and
Trial Periods ............................................................ 140 Figure 18: Forecasted PQS Baseline – Air Cleaners (<100 CADR) ... 142 Figure 19: Forecasted PQS Baseline – DVD/Blu-Ray Players (DVD) . 142 Figure 20: Forecasted PQS Baseline – DVD/Blu-Ray Players (Blu-
Ray) ....................................................................... 143 Figure 21: Forecasted PQS Baseline – Home Theaters-in-a-Box
(Sound Bars) ........................................................... 143 Figure 22: Forecasted PQS Baseline – Freezers (Chest) ................. 144

v
PG&E’s Emerging Technologies Program ET13PGE8052
Figure 23: Forecasted PQS Baseline – Refrigerators (Compact) ...... 144 Figure 24: Forecasted PQS Baseline: Refrigerators (Medium) ......... 145 Figure 25: Forecasted PQS Baseline – Refrigerators (Very Large) ... 145 Figure 26: Forecasted PQS Baseline – Room Air Conditioners
(<12,000 BTU) ........................................................ 146 Figure 27: Participant-Only PQS Regression (Modified Step) – Air
Cleaners (<100 CADR) ............................................. 148 Figure 28: Participant-Only PQS Regression (Modified Step) –
DVD/Blu-Ray Players (DVD) ...................................... 149 Figure 29: Participant-Only PQS Regression (Modified Step) –
DVD/Blu-Ray Players (Blu-Ray) .................................. 150 Figure 30: Participant-Only PQS Regression (Modified Step) –
Home-Theaters-in-a-box (Sound Bars) ....................... 151 Figure 31: Participant-Only PQS Regression (Modified Step) –
Freezers (Chest) ...................................................... 152 Figure 32: Participant-Only PQS Regression (Modified Step) –
Refrigerators (Compact) ........................................... 153 Figure 33: Participant-Only PQS Regression (Modified Step) –
Refrigerators (Medium) ............................................. 154 Figure 34: Participant-Only PQS Regression (Modified Step) –
Refrigerators (Very Large) ......................................... 155 Figure 35: Participant-Only PQS Regression (Modified Step) –
Room Air Conditioners (<12,000 BTU) ........................ 156 Figure 36: Participant-Only PQS Regression (Segmented) – Air
Cleaners (<100 CADR) ............................................. 158 Figure 37: Participant-Only PQS Regression (Segmented) –
DVD/Blu-Ray Players (DVD) ...................................... 159 Figure 38: Participant-Only PQS Regression (Segmented) –
DVD/Blu-Ray Players (Blu-Ray) .................................. 160 Figure 39: Participant-Only PQS Regression (Segmented) – Home-
Theaters-in-a-box (Sound Bars) ................................. 161 Figure 40: Participant-Only PQS Regression (Segmented) –
Freezers (Chest) ...................................................... 162 Figure 41: Participant-Only PQS Regression (Segmented) –
Refrigerators (Compact) ........................................... 163 Figure 42: Participant-Only PQS Regression (Segmented) –
Refrigerators (Medium) ............................................. 164 Figure 43: Participant-Only PQS Regression (Segmented) –
Refrigerators (Very Large) ......................................... 165 Figure 44: Participant-Only PQS Regression (Segmented) – Room
Air Conditioners (<12,000 BTU) ................................. 166
vi
PG&E’s Emerging Technologies Program ET13PGE8052
Figure 45: Comparison-Based PQS Regression (Modified Step) – Air Cleaners (<100 CADR) ............................................. 168
Figure 46: Comparison-Based PQS Regression (Modified Step) – DVD/Blu-Ray Players (DVD) ...................................... 169
Figure 47: Comparison-Based PQS Regression (Modified Step) – DVD/Blu-Ray Players (Blu-Ray) .................................. 170
Figure 48: Comparison-Based PQS Regression (Modified Step) – Home-Theaters-in-a-box (Sound Bars) ....................... 171
Figure 49: Comparison-Based PQS Regression (Modified Step) – Freezers (Chest) ...................................................... 172
Figure 50: Comparison-Based PQS Regression (Modified Step) – Refrigerators (Compact) ........................................... 173
Figure 51: Comparison-Based PQS Regression (Modified Step) – Refrigerators (Medium) ............................................. 174
Figure 52: Comparison-Based PQS Regression (Modified Step) – Refrigerators (Very Large) ......................................... 175
Figure 53: Comparison-Based PQS Regression (Modified Step) – Room Air Conditioners (<12,000 BTU) ........................ 176
Figure 54: Comparison-Based PQS Regression (Segmented) – Air Cleaners (<100 CADR) ............................................. 178
Figure 55: Comparison-Based PQS Regression (Segmented) – DVD/Blu-Ray Players (DVD) ...................................... 179
Figure 56: Comparison-Based PQS Regression (Segmented) – DVD/Blu-Ray Players (Blu-Ray) .................................. 180
Figure 57: Comparison-Based PQS Regression (Segmented) – Home-Theaters-in-a-box (Sound Bars) ....................... 181
Figure 58: Comparison-Based PQS Regression (Segmented) – Freezers (Chest) ...................................................... 182
Figure 59: Comparison-Based PQS Regression (Segmented) – Refrigerators (Compact) ........................................... 183
Figure 60: Comparison-Based PQS Regression (Segmented) – Refrigerators (Medium) ............................................. 184
Figure 61: Comparison-Based PQS Regression (Segmented) – Refrigerators (Very Large) ......................................... 185
Figure 62: Comparison-Based PQS Regression (Segmented) – Room Air Conditioners (<12,000 BTU) ........................ 186

vii
PG&E’s Emerging Technologies Program ET13PGE8052
TABLES Table 1: Research Approaches Used for the RPP Trial Evaluation ....... 1 Table 2: Estimated Net Program Effects on Program-Qualified
Share ........................................................................ 4 Table 3: Preliminary First-Year Ex Post Gross Savings ...................... 4 Table 4: Preliminary First-Year Ex Post Net Savings ......................... 4 Table 5: Participating and Nonparticipating Stores by Service
Territory ................................................................... 14 Table 6: RPP Trial Product Categories, Efficiency Standards, and
Per-Unit Incentives .................................................... 15 Table 7: Interviews Conducted as Part of the RPP Trial Evaluation .... 20 Table 8: Data Processing Counts – Unmatched Models by Product
Category ................................................................... 27 Table 9: Model Attributes Tracked in the RPP Products Translation
File .......................................................................... 27 Table 10: RPP Trial Product Categories and Classes ........................ 28 Table 11: UES Values for RPP Trial Products .................................. 32 Table 12: Did the Program Increase Sales for…? Store Manager
Survey Responses ...................................................... 53 Table 13: By What Percent Do You Think Sales Increased for…?
Store Manager Survey Responses ................................. 54 Table 14: Did the Program Increase Sales for…? Store Manager
Survey Responses ...................................................... 54 Table 15: Participating Retailer Bulk Stack Events (Nov. 2013 Dec.
2014) ....................................................................... 61 Table 16: Air Cleaner Promotions ................................................. 63 Table 17: DVD/Blu-Ray Player Promotions ..................................... 63 Table 18: Home Theater-in-a-Box/Sound bar Promotions ................ 63 Table 19: Freezer Promotions ...................................................... 64 Table 20: Refrigerator Promotions ................................................ 64 Table 21: Room Air Conditioner Promotions ................................... 64 Table 22: Shelf Survey Results .................................................... 65 Table 23: Air Cleaner Shelf Survey Results by Store ....................... 68 Table 24: Salesforce Data Review Results ..................................... 70 Table 25: Comparing Unit Sales Volumes and Program-Qualified
Share for Historical and Trial Periods for Participating and Nonparticipating Stores ........................................ 74

viii
PG&E’s Emerging Technologies Program ET13PGE8052
Table 26: Difference-in-Differences Table Comparing PQS of PARTICIPATING AND Nonparticipating Stores ................. 74
Table 27: Net Effects Using Forecasted PQS Baseline – Air Cleaners (<100 CADR) ............................................................ 76
Table 28: ANOVA Table for Participant-Only PQS Regression (Modified Step) – Air Cleaners (<100 CADR) ................. 77
Table 29: Coefficients Table for Participant-Only PQS Regression (Modified Step) – Air Cleaners (<100 CADR) ................. 77
Table 30: Net Effects Using Participant-Only PQS Regression (Modified Step) – Air Cleaners (<100 CADR) .................. 77
Table 31: ANOVA Table for Participant-Only PQS Regression (Segmented) – Air Cleaners (<100 CADR) .................... 78
Table 32: Coefficients Table for Participant-Only PQS Regression (Segmented) – Air Cleaners (<100 CADR) .................... 78
Table 33: Net Effects Using Participant-Only PQS Regression (Segmented) – Air Cleaners (<100 CADR) ..................... 78
Table 34: ANOVA Table for Comparison-Based PQS Regression (Modified Step) – Air Cleaners (<100 CADR) ................. 79
Table 35: Coefficients Table for Comparison-Based PQS Regression (Modified Step) – Air Cleaners (<100 CADR) ................. 79
Table 36: Net Effects Using Comparison-Based PQS Regression (Modified Step) – Air Cleaners (<100 CADR) .................. 79
Table 37: ANOVA Table for Comparison-Based PQS Regression (Segmented) – Air Cleaners (<100 CADR) .................... 80
Table 38: Coefficients Table for Comparison-Based PQS Regression (Segmented) – Air Cleaners (<100 CADR) .................... 80
Table 39: Net Effects Using Comparison-Based PQS Regression (Segmented) – Air Cleaners (<100 CADR) ..................... 80
Table 40: Mean Monthly PQS Values During the RPP Trial Period ...... 83 Table 41: Estimated Net Program Effects on PQS ........................... 83 Table 42: Preliminary First-Year Ex Post Gross Program Savings ...... 86 Table 43: Preliminary Lifetime Ex Post Gross Program Savings ......... 86 Table 44: Preliminary First-Year Ex Post Net Program Savings ......... 87 Table 45: Preliminary First-Year Ex Post Net Program Savings ......... 87 Table 46: Proposed Key Proximate (Short- and Mid-Term)
Indicators of Program Performance ............................. 100 Table 47: Proposed Performance Indicators for Measuring Longer-
term Effects and/or Benefits ...................................... 101 Table 48: DVD/Blu-Ray Player Shelf Survey Results by Store ......... 134 Table 49: Home Theater-in-a-Box Shelf Survey Results by Store .... 135

ix
PG&E’s Emerging Technologies Program ET13PGE8052
Table 50: Freezer Shelf Survey Results by Store .......................... 136 Table 51: Refrigerator Shelf Survey Results by Store .................... 137 Table 52: Room Air Conditioner Shelf Survey Results by Store ....... 138 Table 53: Comparing Unit Sales Volumes and Program-Qualified
Share for Historical and Trial Periods for PG&E and Nonparticipating Stores ............................................ 139
Table 54: Difference-in-Differences Table Comparing PQS of PG&E and Nonparticipating Stores ...................................... 139
Table 55: Comparing Unit Sales Volumes and Program-Qualified Share for Historical and Trial Periods for SMUD and Nonparticipating Stores ............................................ 140
Table 56: Difference-in-Differences Table Comparing PQS of SMUD AND Nonparticipating Stores ..................................... 140
Table 57: Net Effects Using Forecasted PQS Baseline – Air Cleaners (<100 CADR) .......................................................... 142
Table 58: Net Effects Using Forecasted PQS Baseline – DVD/Blu-Ray Players (DVD) ................................................... 142
Table 59: Net Effects Using Forecasted PQS Baseline – DVD/Blu-Ray Players (Blu-Ray) ............................................... 143
Table 60: Net Effects Using Forecasted PQS Baseline – Home Theaters-in-a-Box (Sound Bars) ................................. 143
Table 61: Net Effects Using Forecasted PQS Baseline – Freezers (Chest) ................................................................... 144
Table 62: Net Effects Using Forecasted PQS Baseline – Refrigerators (Compact) ........................................... 144
Table 63: Net Effects Using Forecasted PQS Baseline – Refrigerators (Medium) ............................................. 145
Table 64: Net Effects Using Forecasted PQS Baseline – Refrigerators (Very Large) ......................................... 145
Table 65: Net Effects Using Forecasted PQS Baseline – Room Air Conditioners (<12,000 BTU) ...................................... 146
Table 66: ANOVA Table for Participant-Only PQS Regression (Modified Step) – Air Cleaners (<100 CADR) ............... 148
Table 67: Coefficients Table for Participant-Only PQS Regression (Modified Step) – Air Cleaners (<100 CADR) ............... 148
Table 68: Net Effects Using Participant-Only PQS Regression (Modified Step) – Air Cleaners (<100 CADR) ................ 148
Table 69: ANOVA Table for Participant-Only PQS Regression (Modified Step) – DVD/Blu-Ray Players DVD) .............. 149
Table 70: Coefficients Table for Participant-Only PQS Regression (Modified Step) – DVD/Blu-Ray Players (DVD) ............ 149

x
PG&E’s Emerging Technologies Program ET13PGE8052
Table 71: Net Effects Using Participant-Only PQS Regression (Modified Step) – DVD/Blu-Ray Players (DVD) ............. 149
Table 72: ANOVA Table for Participant-Only PQS Regression (Modified Step) – DVD/Blu-Ray Players (Blu-Ray) ........ 150
Table 73: Coefficients Table for Participant-Only PQS Regression (Modified Step) – DVD/Blu-Ray Players (Blu-Ray) ........ 150
Table 74: Net Effects Using Participant-Only PQS Regression (Modified Step) – DVD/Blu-Ray Players (Blu-Ray) ......... 150
Table 75: ANOVA Table for Participant-Only PQS Regression (Modified Step) – Home-Theaters-in-a-box (Sound Bars) ...................................................................... 151
Table 76: Coefficients Table for Participant-Only PQS Regression (Modified Step) – Home-Theaters-in-a-box (Sound Bars) ...................................................................... 151
Table 77: Net Effects Using Participant-Only PQS Regression (Modified Step) – Home-Theaters-in-a-box (Sound Bars) ...................................................................... 151
Table 78: ANOVA Table for Participant-Only PQS Regression (Modified Step) – Freezers (Chest) ............................ 152
Table 79: Coefficients Table for Participant-Only PQS Regression (Modified Step) – Freezers (Chest) ............................ 152
Table 80: Net Effects Using Participant-Only PQS Regression (Modified Step) – Freezers (Chest) ............................. 152
Table 81: ANOVA Table for Participant-Only PQS Regression (Modified Step) – Refrigerators (Compact) ................. 153
Table 82: Coefficients Table for Participant-Only PQS Regression (Modified Step) – Refrigerators (Compact) ................. 153
Table 83: Net Effects Using Participant-Only PQS Regression (Modified Step) – Refrigerators (Compact) .................. 153
Table 84: ANOVA Table for Participant-Only PQS Regression (Modified Step) – Refrigerators (Medium) ................... 154
Table 85: Coefficients Table for Participant-Only PQS Regression (Modified Step) – Refrigerators (Medium) ................... 154
Table 86: Net Effects Using Participant-Only PQS Regression (Modified Step) – Refrigerators (Medium) .................... 154
Table 87: ANOVA Table for Participant-Only PQS Regression (Modified Step) – Refrigerators (Very Large) ............... 155
Table 88: Coefficients Table for Participant-Only PQS Regression (Modified Step) – Refrigerators (Very Large) ............... 155
Table 89: Net Effects Using Participant-Only PQS Regression (Modified Step) – Refrigerators (Very Large) ................ 155

xi
PG&E’s Emerging Technologies Program ET13PGE8052
Table 90: ANOVA Table for Participant-Only PQS Regression (Modified Step) – Room Air Conditioners (<12,000 BTU) ...................................................................... 156
Table 91: Coefficients Table for Participant-Only PQS Regression (Modified Step) – Room Air Conditioners (<12,000 BTU) ...................................................................... 156
Table 92: Net Effects Using Participant-Only PQS Regression (Modified Step) – Room Air Conditioners (<12,000 BTU)156
Table 93: ANOVA Table for Participant-Only PQS Regression (Segmented) – Air Cleaners (<100 CADR) .................. 158
Table 94: Coefficients Table for Participant-Only PQS Regression (Segmented) – Air Cleaners (<100 CADR) .................. 158
Table 95: Net Effects Using Participant-Only PQS Regression (Segmented) – Air Cleaners (<100 CADR) ................... 158
Table 96: ANOVA Table for Participant-Only PQS Regression (Segmented) – DVD/Blu-Ray Players (DVD) ............... 159
Table 97: Coefficients Table for Participant-Only PQS Regression (Segmented) – DVD/Blu-Ray Players (DVD) ............... 159
Table 98: Net Effects Using Participant-Only PQS Regression (Segmented) – DVD/Blu-Ray Players (DVD) ................ 159
Table 99: ANOVA Table for Participant-Only PQS Regression (Segmented) – DVD/Blu-Ray Players (Blu-Ray) ........... 160
Table 100: Coefficients Table for Participant-Only PQS Regression (Segmented) – DVD/Blu-Ray Players (Blu-Ray) ........... 160
Table 101: Net Effects Using Participant-Only PQS Regression (Segmented) – DVD/Blu-Ray Players (Blu-Ray) ............ 160
Table 102: ANOVA Table for Participant-Only PQS Regression (Segmented) – Home-Theaters-in-a-box (Sound Bars) . 161
Table 103: Coefficients Table for Participant-Only PQS Regression (Segmented) – Home-Theaters-in-a-box (Sound Bars) . 161
Table 104: Net Effects Using Participant-Only PQS Regression (Segmented) – Home-Theaters-in-a-box (Sound Bars) .. 161
Table 105: ANOVA Table for Participant-Only PQS Regression (Segmented) – Freezers (Chest) ............................... 162
Table 106: Coefficients Table for Participant-Only PQS Regression (Segmented) – Freezers (Chest) ............................... 162
Table 107: Net Effects Using Participant-Only PQS Regression (Segmented) – Freezers (Chest) ................................ 162
Table 108: ANOVA Table for Participant-Only PQS Regression (Segmented) – Refrigerators (Compact) ..................... 163
Table 109: Coefficients Table for Participant-Only PQS Regression (Segmented) – Refrigerators (Compact) ..................... 163

xii
PG&E’s Emerging Technologies Program ET13PGE8052
Table 110: Net Effects Using Participant-Only PQS Regression (Segmented) – Refrigerators (Compact) ...................... 163
Table 111: ANOVA Table for Participant-Only PQS Regression (Segmented) – Refrigerators (Medium) ...................... 164
Table 112: Coefficients Table for Participant-Only PQS Regression (Segmented) – Refrigerators (Medium) ...................... 164
Table 113: Net Effects Using Participant-Only PQS Regression (Segmented) – Refrigerators (Medium) ....................... 164
Table 114: ANOVA Table for Participant-Only PQS Regression (Segmented) – Refrigerators (Very Large) .................. 165
Table 115: Coefficients Table for Participant-Only PQS Regression (Segmented) – Refrigerators (Very Large) .................. 165
Table 116: Net Effects Using Participant-Only PQS Regression (Segmented) – Refrigerators (Very Large) ................... 165
Table 117: ANOVA Table for Participant-Only PQS Regression (Segmented) – Room Air Conditioners (<12,000 BTU) . 166
Table 118: Coefficients Table for Participant-Only PQS Regression (Segmented) – Room Air Conditioners (<12,000 BTU) . 166
Table 119: Net Effects Using Participant-Only PQS Regression (Segmented) – Room Air Conditioners (<12,000 BTU) .. 166
Table 120: ANOVA Table for Comparison-Based PQS Regression (Modified Step) – Air Cleaners (<100 CADR) ............... 168
Table 121: Coefficients Table for Comparison-Based PQS Regression (Modified Step) – Air Cleaners (<100 CADR) .................................................................... 168
Table 122: Net Effects Using Comparison-Based PQS Regression (Modified Step) – Air Cleaners (<100 CADR) ................ 168
Table 123: ANOVA Table for Comparison-Based PQS Regression (Modified Step) – DVD/Blu-Ray Players (DVD) ............ 169
Table 124: Coefficients Table for Comparison-Based PQS Regression (Modified Step) – DVD/Blu-Ray Players (DVD) .................................................................... 169
Table 125: Net Effects Using Comparison-Based PQS Regression (Modified Step) – DVD/Blu-Ray Players (DVD) ............. 169
Table 126: ANOVA Table for Comparison-Based PQS Regression (Modified Step) – DVD/Blu-Ray Players (Blu-Ray) ........ 170
Table 127: Coefficients Table for Comparison-Based PQS Regression (Modified Step) – DVD/Blu-Ray Players (Blu-Ray) ................................................................ 170
Table 128: Net Effects Using Comparison-Based PQS Regression (Modified Step) – DVD/Blu-Ray Players (Blu-Ray) ......... 170
xiii
PG&E’s Emerging Technologies Program ET13PGE8052
Table 129: ANOVA Table for Comparison-Based PQS Regression (Modified Step) – Home-Theaters-in-a-box (Sound Bars) ...................................................................... 171
Table 130: Coefficients Table for Comparison-Based PQS Regression (Modified Step) – Home-Theaters-in-a-box (Sound Bars) ........................................................... 171
Table 131: Net Effects Using Comparison-Based PQS Regression (Modified Step) – Home-Theaters-in-a-box (Sound Bars) ...................................................................... 171
Table 132: ANOVA Table for Comparison-Based PQS Regression (Modified Step) – Freezers (Chest) ............................ 172
Table 133: Coefficients Table for Comparison-Based PQS Regression (Modified Step) – Freezers (Chest) ............ 172
Table 134: Net Effects Using Comparison-Based PQS Regression (Modified Step) – Freezers (Chest) ............................. 172
Table 135: ANOVA Table for Comparison-Based PQS Regression (Modified Step) – Refrigerators (Compact) ................. 173
Table 136: Coefficients Table for Comparison-Based PQS Regression (Modified Step) – Refrigerators (Compact) . 173
Table 137: Net Effects Using Comparison-Based PQS Regression (Modified Step) – Refrigerators (Compact) .................. 173
Table 138: ANOVA Table for Comparison-Based PQS Regression (Modified Step) – Refrigerators (Medium) ................... 174
Table 139: Coefficients Table for Comparison-Based PQS Regression (Modified Step) – Refrigerators (Medium) ... 174
Table 140: Net Effects Using Comparison-Based PQS Regression (Modified Step) – Refrigerators (Medium) .................... 174
Table 141: ANOVA Table for Comparison-Based PQS Regression (Modified Step) – Refrigerators (Very Large) ............... 175
Table 142: Coefficients Table for Comparison-Based PQS Regression (Modified Step) – Refrigerators (Very Large) .................................................................... 175
Table 143: Net Effects Using Comparison-Based PQS Regression (Modified Step) – Refrigerators (Very Large) ................ 175
Table 144: ANOVA Table for Comparison-Based PQS Regression (Modified Step) – Room Air Conditioners (<12,000 BTU) ...................................................................... 176
Table 145: Coefficients Table for Comparison-Based PQS Regression (Modified Step) – Room Air Conditioners (<12,000 BTU) ........................................................ 176
Table 146: Net Effects Using Comparison-Based PQS Regression (Modified Step) – Room Air Conditioners (<12,000 BTU)176

xiv
PG&E’s Emerging Technologies Program ET13PGE8052
Table 147: ANOVA Table for Comparison-Based PQS Regression (Segmented) – Air Cleaners (<100 CADR) .................. 178
Table 148: Coefficients Table for Comparison-Based PQS Regression (Segmented) – Air Cleaners (<100 CADR) .. 178
Table 149: Net Effects Using Comparison-Based PQS Regression (Segmented) – Air Cleaners (<100 CADR) ................... 178
Table 150: ANOVA Table for Comparison-Based PQS Regression (Segmented) – DVD/Blu-Ray Players (DVD) ............... 179
Table 151: Coefficients Table for Comparison-Based PQS Regression (Segmented) – DVD/Blu-Ray Players (DVD) 179
Table 152: Net Effects Using Comparison-Based PQS Regression (Segmented) – DVD/Blu-Ray Players (DVD) ................ 179
Table 153: ANOVA Table for Comparison-Based PQS Regression (Segmented) – DVD/Blu-Ray Players (Blu-Ray) ........... 180
Table 154: Coefficients Table for Comparison-Based PQS Regression (Segmented) – DVD/Blu-Ray Players (Blu-Ray) ....................................................................... 180
Table 155: Net Effects Using Comparison-Based PQS Regression (Segmented) – DVD/Blu-Ray Players (Blu-Ray) ............ 180
Table 156: ANOVA Table for Comparison-Based PQS Regression (Segmented) – Home-Theaters-in-a-box (Sound Bars) . 181
Table 157: Coefficients Table for Comparison-Based PQS Regression (Segmented) – Home-Theaters-in-a-box (Sound Bars) ........................................................... 181
Table 158: Net Effects Using Comparison-Based PQS Regression (Segmented) – Home-Theaters-in-a-box (Sound Bars) .. 181
Table 159: ANOVA Table for Comparison-Based PQS Regression (Segmented) – Freezers (Chest) ............................... 182
Table 160: Coefficients Table for Comparison-Based PQS Regression (Segmented) – Freezers (Chest) ............... 182
Table 161: Net Effects Using Comparison-Based PQS Regression (Segmented) – Freezers (Chest) ................................ 182
Table 162: ANOVA Table for Comparison-Based PQS Regression (Segmented) – Refrigerators (Compact) ..................... 183
Table 163: Coefficients Table for Comparison-Based PQS Regression (Segmented) – Refrigerators (Compact) ..... 183
Table 164: Net Effects Using Comparison-Based PQS Regression (Segmented) – Refrigerators (Compact) ...................... 183
Table 165: ANOVA Table for Comparison-Based PQS Regression (Segmented) – Refrigerators (Medium) ...................... 184
Table 166: Coefficients Table for Comparison-Based PQS Regression (Segmented) – Refrigerators (Medium) ...... 184

xv
PG&E’s Emerging Technologies Program ET13PGE8052
Table 167: Net Effects Using Comparison-Based PQS Regression (Segmented) – Refrigerators (Medium) ....................... 184
Table 168: ANOVA Table for Comparison-Based PQS Regression (Segmented) – Refrigerators (Very Large) .................. 185
Table 169: Coefficients Table for Comparison-Based PQS Regression (Segmented) – Refrigerators (Very Large) .. 185
Table 170: Net Effects Using Comparison-Based PQS Regression (Segmented) – Refrigerators (Very Large) ................... 185
Table 171: ANOVA Table for Comparison-Based PQS Regression (Segmented) – Room Air Conditioners (<12,000 BTU) . 186
Table 172: Coefficients Table for Comparison-Based PQS Regression (Segmented) – Room Air Conditioners (<12,000 BTU) ........................................................ 186
Table 173: Net Effects Using Comparison-Based PQS Regression (Segmented) – Room Air Conditioners (<12,000 BTU) .. 186
EQUATIONS Equation 1: Program Qualified Share (PQS) ................................... 29 Equation 2: Unit Energy Consumption (UES) ................................. 30 Equation 3: Preliminary Ex Post Gross Program Savings .................. 31 Equation 4: Unit Demand Reduction (UDR) .................................... 31 Equation 5: Preliminary Ex Post Gross Program Demand Reduction .. 31 Equation 6: Difference-in-Differences Calculation ........................... 35 Equation 7: Forecasted PQS Baseline ............................................ 36 Equation 8: Quasi-Experimental Participant-Only PQS Modified Step
Regression ................................................................ 38 Equation 9: Quasi-Experimental Participant-Only Pre-Post PQS
Modified Step Regression – Without Program ................. 39 Equation 10: Quasi-Experimental Participant-Only PQS Segmented
Regression ................................................................ 39 Equation 11: Quasi-Experimental Participant-Only PQS Segmented
Regression – Without Program ..................................... 39 Equation 12: Quasi-Experimental PQS Modified Step Regression
With Comparison Group .............................................. 40 Equation 13: Quasi-Experimental PQS Segmented Regression With
Comparison Group ..................................................... 41

xvi
PG&E’s Emerging Technologies Program ET13PGE8052
CONTENTS ABBREVIATIONS AND ACRONYMS ____________________________________________ II
FIGURES _______________________________________________________________ IV
TABLES ________________________________________________________________ VII
EQUATIONS ___________________________________________________________ XV
CONTENTS ____________________________________________________________ XVI
EXECUTIVE SUMMARY ______________________________________________________ 1
OVERVIEW: RETAIL PLUG LOAD PORTFOLIO (RPP) PROGRAM _______________________ 8 RPP Program Logic Model ........................................................ 9
THE RPP TRIAL _________________________________________________________ 14
STUDY OBJECTIVES ______________________________________________________ 17 Performance Objectives ......................................................... 17 Operational Objectives ........................................................... 17 Evaluation Objectives ............................................................ 18
RESEARCH METHODS/APPROACHES _________________________________________ 19 Process Evaluation Methods .................................................... 20
Retailer Interviews ........................................................... 20 PG&E Program Staff and Implementation Team Staff
Interviews/Debriefs ..................................................... 22 Salesforce Data Review .................................................... 22 Retailer Marketing Activities Review ................................... 23 Retailer Shelf Surveys ...................................................... 23
RPP Program Data ................................................................. 24 Retailer Sales Data ........................................................... 24 Data Processing and Management ...................................... 25 Metrics Development ........................................................ 29
Impact Evaluation Methods .................................................... 32 Difference-in-Differences Analysis ...................................... 35 Quasi-Experimental Participant-Only Pre-Post Forecasted
PQS Baseline to Actual Data ......................................... 35 Quasi-Experimental Interrupted Time-Series Analyses .......... 37
RESULTS ______________________________________________________________ 43 Process Evaluation Results ..................................................... 43
Interviews/Surveys .......................................................... 43 Retailer Marketing Plans and Implementation ...................... 61 Shelf Surveys .................................................................. 65 Salesforce Data Review .................................................... 68
xvii
PG&E’s Emerging Technologies Program ET13PGE8052
Impact Evaluation Results ...................................................... 71 Difference-in-Differences (DID) Analysis of Program
Qualified Share (PQS) .................................................. 71 Modelling Approaches ....................................................... 75 Preliminary First-Year and Lifetime Ex Post Gross and Net
Savings ..................................................................... 84
SYNTHESIS AND DISCUSSION OF EVALUATION OBJECTIVES ________________________ 88 Study Objectives .................................................................. 88
Performance Objectives .................................................... 88 Operational Objectives ...................................................... 89 Evaluation Objectives ....................................................... 94
RECOMMENDATIONS ___________________________________________________ 103 Program Design and Implementation ..................................... 103 Evaluation ......................................................................... 104
APPENDICES __________________________________________________________ 106
APPENDIX A: INTERVIEW GUIDES AND SURVEY INSTRUMENTS ______________________ 107
APPENDIX B: RETAILER ENERGY STAR SIGNAGE _____________________________ 133
APPENDIX C: SHELF SURVEY RESULTS BY STORE ________________________________ 134
APPENDIX D: PQS VALUES AND DIFFERENCE-IN-DIFFERENCE ANALYSES FOR PG&E AND SMUD ___________________________________________________________________ 139
APPENDIX E: RESULTS OF FORECASTED PQS BASELINE APPROACH _________________ 141
APPENDIX F: RESULTS OF PARTICIPANT-ONLY PQS MODIFIED STEP REGRESSIONS ______ 147
APPENDIX G: RESULTS OF PARTICIPANT-ONLY PQS SEGMENTED REGRESSIONS _______ 157
APPENDIX H: RESULTS OF COMPARISON-BASED PQS MODIFIED STEP REGRESSIONS ___ 167
APPENDIX I: RESULTS OF COMPARISON-BASED PQS SEGMENTED REGRESSIONS _______ 177
REFERENCES __________________________________________________________ 187

1
PG&E’s Emerging Technologies Program ET13PGE8052
EXECUTIVE SUMMARY In an innovative attempt to address the growing issue of residential plug-load in the State of California, the Pacific Gas and Electric Company (PG&E) and the Sacramento Municipal Utility District (SMUD) launched the Retail Plug-Load Portfolio (RPP) Trial in 2013 and 2014. The RPP Program uses a mid-stream design to influence retailers to demand, stock, and sell a greater proportion of energy efficient models of home appliances and consumer electronics in targeted product categories, which will ultimately result in residential customer energy and demand savings. Retailers are paid per-unit incentives for every program-qualified model that they sell during the program period. Program-qualified models are typically models that meet or exceed the minimum ENERGY STAR specification in each product category. The RPP Trial was conducted with a single participating retailer, in 26 participating stores, over the 14-month period of November 2013 through December 2014.
PROJECT GOAL This innovative program is the first program relying on a mid-stream design that is a true market transformation program launched in California. As such, questions remain about how to evaluate the program over the short-, mid-, and long-terms, as well as how to best implement and administer it in a cost-effective manner. This evaluation focused on assessing the initial operationalization of this new and novel program, as well as applying and testing an array of different evaluation methods that can be used to evaluate it.
PROJECT DESCRIPTION The evaluation team used an array of different approaches to evaluate the RPP Trial (see Table 1).
TABLE 1: RESEARCH APPROACHES USED FOR THE RPP TRIAL EVALUATION
Process Evaluation Methods Impact Evaluation Methods
• Retailer Interviews - Merchants - Marketers - Store Managers
• Leadership Team PG&E Program Staff Interviews • Implementation Team Interviews • Salesforce Data Review • Retailer Marketing Activities Review • Retailer Shelf Surveys • Program Document Review
• Difference-in-Differences • Regression Analysis Using Program-Tracking Data - Participant-Only Pre-Post
Forecasted Baseline to Actual Data
- Participant-Only Regression (modified step and segmented)
- Comparison Group-Based Regression (modified step and segmented)
• Review of qualitative data

2
PG&E’s Emerging Technologies Program ET13PGE8052
PROJECT FINDINGS/RESULTS Process Evaluation Findings/Results Merchant & Marketer Interviews • Buyers were very well informed about the RPP Trial and activities. • Price is absolutely the most important consideration when deciding to assort a product. • The program has little chance of affecting the retailer’s decisions and behaviors over the longer
term unless it is scaled up. • Energy use or energy efficiency of a model has traditionally been unimportant as a buying
criteria. However, one of the two buyers indicated that she will weight these attributes more heavily in the future.
• The home appliance buyer indicated that a new model of ENERGY STAR refrigerator was added to their inventory as part of the RPP Trial and that he “absolutely would not” have added it in the absence of the trial.
• Both at baseline and follow-up, all buyers indicated that they would not have done anything related to promoting energy efficiency without the RPP Trial.
Corporate Leadership Team Interviews • The corporate leadership team is motivated and interested in making the retailer’s participation
in the trial successful. They were genuinely excited about the trial and its potential. • One of the biggest challenges in implementing the trial was the fact that the retailer had
shifting corporate staff and staff on-leave. • Due to its small scale, the cost and time to manage the trial exceeded the benefits. • Fulfilling the data requests was also challenging. • Much of what they learned throughout the trial helped them quickly develop an effective
marketing strategy and plan for the last quarter. Store Manager Interviews/Surveys • Store managers have limited input in to store promotions. Promotional plans come from the
retailer’s corporate offices in the form of planograms, detailing how specific products should be displayed in order to increase customer purchases.
• Five of six store managers surveyed at follow-up were aware of the RPP Trial and indicated that the trial resulted in some lift for certain product categories, though their estimates of the lift varied.
• The store managers indicated their customers are generally aware of ENERGY STAR—and many ask for these products specifically. However, they are a price-point focused retailer, so most customers are only oriented to the lowest price.
Implementation Team Debrief • They see this role and their communications as both important and effective. Their staff has
decades of experience working in the retail environment and recognize and understand the retailer’s needs and perspectives and are able to translate the utility’s desires in a manner that is amenable to the retailer, and vice versa. They feel this was key to gaining participation and engagement from the retailer during the trial period.
• There is often a disconnect between the program team’s perceived importance of the program and the actual importance to the retailer.
• The program was able to engage this retailer to participate in the program that provided a relatively small financial gain due to the small scale of the trial.
• While the costs to the retailer to implement the trial were not negligible, the retailer remained engaged and motivated throughout the trial period.
• The greatest implementation hurdle was the small scale of the trial. The RPP Program is a market transformation program and “26 participating stores are not going to transform any market.”

3
PG&E’s Emerging Technologies Program ET13PGE8052
• The participating retailers will likely need additional support in implementing the program for it to recognize its fullest potential.
• There is a need to recognize that many aspects of the retail market will need to be transformed for the program to reach its full potential.
• There is a notable risk to this program if regulators, utilities, and evaluators do not adequately grasp the implications tied to the program being a market transformation program.
PG&E Program Staff Interviews and Debrief • Simply launching this innovative program and recruiting a retailer were viewed as major
accomplishments. • Everything was new and processes and procedures needed to be developed and implemented
for all aspects of the program. • Lessons learned:
- The process for determining which models were program-qualified and which were not was not as straightforward as expected.
- A key to successful implementation was understanding the data needs and the procedures for processing it.
- This particular participating retailer selected for testing the program concept, may not represent the typical retailer. Nevertheless, the degree of engagement and participation they did receive was positive.
- The Trial has helped clarify who should be responsible for what, what the processes and protocols should be, and how to improve collaboration. These clarifications have also provided greater insights into how and where costs may be cut, and areas of potential concerns.
• Areas needing attention moving ahead: - Data management will continue to be a challenge as the amount of data that is needed to
support this program is large. - Obtaining reliable data representing the nonparticipating retailers and the overall regional
and national markets are big concerns. - PG&E needs to better support their “product,” which is the program—they are like any
other vendor working in the retail environment. This will likely be reflected as the IOU, and more specifically the field team, providing greater on-site support.
- They may need to revise some of their expectations. - The product selection process will be refined and will continue to focus on ensuring the
program is targeting the appropriate product categories.
Retailer Marketing Plans and Implementation • The retailer implemented a wide range of promotional activities during the trial, including price
reductions, preferential product placement, development of promotional flyers, product-specific and ENERGY STAR signage, and in-store broadcasts.
• Promotions were slow to begin, with significant promotional activity not starting until March 2014.
• Shelf surveys—as well as interviews with the retailer staff—indicated the implementation of the promotions was not always consistent across stores.
Impact Evaluation Findings/Results Table 2 shows the estimated percentage point increases in PQS for each product class. Table 3 shows the preliminary first-year ex post gross energy and demand savings for each product class. Table 4 shows the preliminary first-year ex post net energy and demand savings for each product class.

4
PG&E’s Emerging Technologies Program ET13PGE8052
TABLE 2: ESTIMATED NET PROGRAM EFFECTS ON PROGRAM-QUALIFIED SHARE
Product Class
Net Program Effects
Air Cleaner <100 CADR 11% DVD/Blu-Ray Blu-Ray -1% DVD/Blu-Ray DVD 1% Freezer Chest 1% Refrigerator Compact 8% Refrigerator Medium 3% Refrigerator Very Large 6% HTiB Sound Bars 1% Room Air Conditioners <12,000 BTU 14%
TABLE 3: PRELIMINARY FIRST-YEAR EX POST GROSS SAVINGS
Product Class UES Quantity
Sold
Preliminary First-Year Ex Post Gross Savings
kWh kW kWh kW Air Cleaner <100 CADR 114.439 0.01293 183 20,942.36 2.3660 DVD/Blu-Ray Blu-Ray 4.800 0.00005 2,171 10,420.80 0.1077 DVD/Blu-Ray DVD 5.900 0.00013 1,350 7,965.00 0.1758 HTiB Sound bar 52.600 0.00065 933 49,075.80 0.6074 Freezer Frzr-Chest-ManDef_Large 18.600 0.00330 70 1,302.00 0.2310 Refrigerator Refg-All_CmpMini 20.800 0.00380 336 6,988.80 1.2768 Refrigerator RefgFrz-BM_VLarge 52.900 0.00950 4 211.60 0.0380 Refrigerator RefgFrz-BM-Ice_VLarge 59.900 0.01080 10 599.00 0.1080 Refrigerator RefgFrz-SM-TTD_VLarge 62.500 0.01130 105 6,562.50 1.1865 Refrigerator RefgFrz-TM_CmpMini 33.000 0.00590 2 66.00 0.0118 Refrigerator RefgFrz-TM_Med 35.900 0.00670 45 1,615.50 0.3015 Refrigerator RefgFrz-TM_VLarge 41.000 0.00760 10 410.00 0.0760 Room AC <12,000 BTU 69.975 0.03296 286 20,012.83 9.4260 TOTAL 5,505 126,172.2 15.9124
TABLE 4: PRELIMINARY FIRST-YEAR EX POST NET SAVINGS
Product Class Net
Effect
Preliminary First-Year Ex Post Net Savings
kWh kW Air Cleaner <100 CADR 0.11 2,303.66 0.2603 DVD/Blu-Ray Blu-Ray -0.01 -104.21 -0.0011 DVD/Blu-Ray DVD 0.01 79.65 0.0018 HTiB Sound bar 0.01 490.76 0.0061 Freezer Frzr-Chest-ManDef_Large 0.01 13.02 0.0023 Refrigerator Refg-All_CmpMini 0.08 559.10 0.1021 Refrigerator RefgFrz-BM_VLarge 0.06 12.70 0.0023 Refrigerator RefgFrz-BM-Ice_VLarge 0.06 35.94 0.0065 Refrigerator RefgFrz-SM-TTD_VLarge 0.06 393.75 0.0712 Refrigerator RefgFrz-TM_CmpMini 0.08 5.28 0.0009 Refrigerator RefgFrz-TM_Med 0.03 48.47 0.0090 Refrigerator RefgFrz-TM_VLarge 0.06 24.60 0.0046 Room AC <12,000 BTU 0.14 2,801.80 1.3196 TOTAL 6,664.5 1.8

5
PG&E’s Emerging Technologies Program ET13PGE8052
Taking: 6,664.5 kWh/ 126,172.2 kWh= 0.0528. Thus, 5.28% lift in sales due almost exclusively to promotional interventions. The evaluation team argues it is premature to draw any firm conclusions regarding low gross and net impacts and a true program net-to-gross ratio (as such, we refer to the computed value as the partial leading indicator net-to-gross ratio). These are first-year savings from this small-scale trial of a new market transformation program, and savings and the NTGR were never expected to be substantial. Factors influencing these results are: (1) use of minimum ENERGY STAR specification, (2) very limited opportunity for the retailer make notable changes to their product assortment, and (3) net effects are almost entirely due to marketing and promotional activities.
PROJECT RECOMMENDATIONS Based on the preponderance of evidence, the evaluation team has concluded the RPP Trial was reasonably successful at meeting its performance and operational objectives. The evaluation team also feels that the following recommendations should be considered in order to improve the design, delivery, and evaluation of the RPP Program. Program Design and Implementation Recommendations • Launching a program in the last quarter of the year should be avoided if possible.
Retailers have a lot of activities underway during the holiday season, and gaining access to staff to conduct the necessary baseline research is a challenge. Also, unless there is adequate notice given to the retailers, it is likely many if not most of their marketing and promotional activities are planned several months in advance of the holiday sales period.
• Include a contractual commitment from the participating retailers to provide access to the staff needed to conduct evaluation tasks. The evaluation team had difficulty gaining access to retailer staff at key points in time (or at all) in order to conduct evaluation activities in a timely manner.
• Once the contract is signed, the participating retailers should develop retailer implementation plans as soon as possible to ensure that interventions occur early. Delays in getting retailer implementation plans in place is a risk to the program as PG&E will be paying incentives for “business as usual” sales (represented by the store’s pre-program market share of program-qualified products) until interventions are in place to increase sales. In the trial, most product categories did not begin interventions until March 2014, five months into the program. It is likely that these five months of relatively little activity contributed significantly to the low net-to-gross ratio of 5% for the portfolio.
• Require the retailer’s to develop detailed retailer implementation plans that outline strategies, time of implementation, and ideally, sales goals. In order to help bolster net-to-gross ratios, it may be worth considering adding a clause to contracts that states if the retailer does not do anything to promote a certain targeted product category for a certain period of time (e.g., a quarter), incentives will be withheld for that product category until some effort by the retailer to promote qualified models within a product category is observed. This would be most applicable to the first year or two of participation, when promotions are expected to play the key—if not only role—in increasing the sales of program-qualified products.
• Ensure the program data has a clear chain of ownership and control that is transparent, defendable, and absent of any potential conflicts of interest. This should minimize concerns regarding the accuracy of the data and the ensuing results. Ideally, the data should go directly from the retailer to the data service provider.

6
PG&E’s Emerging Technologies Program ET13PGE8052
• At least in the short term, more attention should be focused on promoting and incenting program-qualifying specifications that exceed the minimum ENERGY STAR specification. For many retailers for many product categories, a significant proportion of their product assortment is already ENERGY STAR. Even the retailer that participated in the trial—though energy efficiency never entered into their product purchasing decisions—had some high PQS values for some product categories before the trial even began. For example, the PQS for Blu-Ray players in the month before the program began (October 2013) was 71%; 36% for sound bars; 33% for air cleaners. Thus, incenting these product categories at the minimum ENERGY STAR specification will translate to relatively low net-to-gross ratios, and will likely have a limited effect on transforming the market. While in the future, the RPP Program theory suggests program-induced influence on voluntary specifications (e.g., ENERGY STAR) and/or mandatory standards (e.g., state or federal codes and standards) will occur and may negate the need for more stringent qualifying specifications, until these expected effects actually occur and are validated, efforts should be incorporated to help bolster net program savings.
• Retailers will likely need support to effectively and consistently implement the RPP Program. Inconsistent implementation across stores arose in the shelf survey data as well as the retailer buyer interviews. Support for implementation may consist of assisting store staff in deploying promotional materials such as signage or helping build promotional displays; it could also consist of assisting corporate staff to develop effective marketing and promotional strategies.
Evaluation Recommendations • In terms of evaluation, the array of different modeling approaches should be retained until
there is greater clarity around which impact approach(es) work best. While the comparison-based approaches provided, what the evaluation team feels are, the most reasonable estimates of net PQS, we also recognize that the participant-only designs may be the only feasible approach in the future, once the program effects begin to dissipate into other regions. More needs to be learned about how the participant-only models might perform with a larger-scale implementation of the program. Also, evaluators need to consider how the more quantitative impact evaluation methods might be coupled with self-report methods to derive impact results that are more widely informed and based on a preponderance of evidence.
• The shelf surveys, as they were conducted for the trial, provided information that was ultimately of limited use. However, a method for assessing retailers’ implementation of the program interventions in their stores is still needed. A better approach might be to develop a schedule for in-store verification of marketing activities based on the retailers’ implementation plans. These visits could also be leveraged to allow the field team to help support the retailers if gaps in implementation are found.
• The use of Salesforce needs substantive revision if it is to be a useful evaluation tool. Processing the Salesforce data was extremely resource intensive, and the contents of Salesforce only allows for limited validation of program activities, because only the implementation team uses it. The evaluation team feels other approaches might be more useful for assessing whether certain logic model components are occurring. For example, a periodic (e.g., quarterly) web-based survey of stakeholders would allow the evaluation team to collect more robust data in a manner that allows for easier and more systematic analysis.
• The role of the retailer store manager interviews need to be carefully considered and weighed in the context of the overall evaluation objectives. From a process evaluation perspective, the store research can provide informative insights into how the program
7
PG&E’s Emerging Technologies Program ET13PGE8052
implementation may be refined or improved. However, it will be critical that the evaluator target the people in the stores that are most knowledgeable about the program and/or product categories. This may vary from retailer to retailer and will not likely be the store managers.
• Future evaluation efforts should be based on a theory-driven evaluation framework in order to provide robust support for future claims of attribution. As the RPP Program scales-up and becomes more complex, ascertaining impacts and effects of the program will become more complicated as many of these will occur outside of the participating retailers. We recommend focusing greater attention on evaluating the specific components of the logic model with a focus on validating that the activities, outputs, and short-, mid-, and long-term outcomes are occurring as expected, as well as validating that the hypothesized causal mechanisms. Within a theory-driven framework, the assessment of program performance through the use of multiple research designs and analyses of key leading indicators of program performance is the best way to manage risks faced by each stakeholder.
• In collaboration with the ED, identify key program performance metrics and market transformation indicators so that appropriate baselines can be constructed during the next phase of the RPP Program. Table 46 of this report outlines the key proximate or short- to mid-term indicators program progress and performance recommended by the evaluation team; Table 47 showed the proposed indicators of long-term effects and/or benefits.

8
PG&E’s Emerging Technologies Program ET13PGE8052
OVERVIEW: RETAIL PLUG LOAD PORTFOLIO (RPP) PROGRAM Because plug loads represent a significant proportion of residential electricity consumption, reducing plug load energy consumption is a critical step on the path towards achieving California’s residential Zero Net Energy (ZNE) goals. The 2012 ZNE Technical Feasibility Report stated, “…minimizing plug loads will be critical to meeting ZNE goals” (Arup et al., 2012), and recommended that utilities “continue equipment efficiency incentive programs” and “aggressively promote equipment efficiency regulations at the state and federal level.” In response, the Pacific Gas and Electric Company (PG&E) has teamed with the Sacramento Municipal Utility District (SMUD) to develop and launch the Retail Plug-Load Portfolio (RPP) Program.1 The RPP Program uses a mid-stream design to influence retailers to demand, stock, and sell a greater proportion of energy efficient models of home appliances and consumer electronics in targeted product categories. Retailers are paid per-unit incentives for every program-qualified model that they sell during the program period. Program-qualified models are typically models that meet or exceed the minimum ENERGY STAR specification in each product category. By increasing the proportion of sales of energy efficient, program-qualified models over less efficient models, the RPP Program is expected to generate gross and net energy and demand savings in the short- and mid-term through participating retailers, while transforming the overall market towards higher efficiency—and greater energy and demand savings—in the long-term. The broader RPP Program strategy is discussed in detail in the PG&E document Retail Plug-Load Portfolio Trial Plan (Navitas, 2013).
Importantly, the RPP Program concept is one of the first programs of its type aimed at longer-term market transformation in the State of California through an intervention strategy with a mid-stream emphasis. More specifically, the RPP Program is inherently a targeted market transformation program:
“[Targeted] market transformation interventions are designed to induce sustained increases in the adoption and penetration of energy efficient technologies and practices through structural changes in the market and in behaviors of market actors.” (Prahl and Keating, 2014)
As a result, outcomes of the program are expected to occur over different time frames. In the short-term, the RPP Program is intended to motivate participating retailers to promote and sell more efficient models. However, over the longer-term, other retailers, utilities, and program administrators outside of PG&E’s service territory (e.g., municipal utilities such as SMUD, and regional bodies, such as the Northwest Energy Efficiency Alliance (NEEA) and the Northeast Energy Efficiency Partnerships (NEEP)) will collaborate in this effort to get retailers to regularly demand, assort, and promote the most efficient models available. At the same time, the IOUs and utility partners will be working with ENERGY STAR and others to advance voluntary and mandatory standards in order to propel the broader marketplace towards greater efficiency. This broader scale will be necessary because the markets for consumer electronics and home appliances are complex and world-wide and it may be 1 Throughout this evaluation report we refer to the “RPP Program” as the more holistic program that is being planned for broader launch. We use “RPP Trial” to refer specifically to the trial that was evaluated

9
PG&E’s Emerging Technologies Program ET13PGE8052
difficult for a single utility or state to significantly influence the market forces to affect how manufacturers and mid-stream players act.
RPP PROGRAM LOGIC MODEL Logic models go hand-in-hand with program theory in the market transformation literature. Rosenberg and Hoefgen (2009) state: “Program logic models are graphic representations of the causal links between program activities, short-term responses to those activities among market actors, and longer-term market effects.” The elements used to describe or represent a logic model include inputs, activities, and outputs, which in combination loosely form a program process theory, short-term outcomes (sometimes called initial, proximal, or immediate outcomes), mid-term outcomes (sometimes called intermediate or proximal outcomes), and long-term outcomes (sometimes called distal outcomes or impacts), which are intended to represent a program impact theory (Donaldson, 2007; Donaldson & Lipsey, 2006; Lipsey, Rossi & Freemen, 2004; Patton, 2008). In these logic models, activities are the actions undertaken to bring about a desired end, outputs are the immediate results of an action, and outcomes are the anticipated changes that occur directly or indirectly as a result of inputs, activities, and outputs. The RPP Program concept is built upon a series of hypothesized causal linkages between program activities, outputs, and intended program outcomes that are depicted in the program logic model as illustrated in Figure 1. The development of this logic model evolved over the 14-month period of the trial and is not exactly the same logic model that was included in the initial evaluation plan. The changes to the logic model were not based on the results of the evaluation of the trial itself, but were based on conversations among PG&E program staff, the program implementation team, and the evaluation team. Any revisions to the model were relatively minor. For example, the original requirement that retailers have an approved implementation plan before signing a contract was deemed unreasonable, and the logic model was revised to show that the approved plan is necessary once the contract is signed. Also, wording was changed to reflect changes in program metrics that are tracked for the program. The current logic model is based on three main sources of information:
• Prior theory and research (e.g., economics of the firm, retailer behavior, consumer behavior, etc.)
• Implicit theories of those close to the program (e.g., PG&E program managers, the experience of experts in the retail industry, experience of CPUC-ED and its consultants, and PG&E EM&V staff and its consultants), and
• Observations of the program in operation during the trial.

10
PG&E’s Emerging Technologies Program ET13PGE8052
FIGURE 1: RETAIL PLUG LOAD PORTFOLIO PROGRAM LOGIC MODEL
Activities
Outputs
Short-‐Term Outcomes(1-‐2 Years)
Mid-‐Term Outcomes(3-‐6 Years)
Long-‐Term Outcomes(7-‐10 Years)
Sample of External Influences: Broad econom
ic conditions, market events, cost of energy, federal standards, Energy Star, perceived need for conservation, etc. Factors
can influence program at all levels and tim
e frames.
G. PG&E and partner utilities approve retailer marketing plans including sales forecasts of program-‐qualified models within each product category.
G. PG&E and partner utilities approve retailer marketing plans including sales forecasts of program-‐qualified models within each product category.
B. PG&E contacts utility partners regarding collaboration in Program delivery
E. PG&E, utility partners and identified retailers target product categories with energy savings potential
E. PG&E, utility partners and identified retailers target product categories with energy savings potential
I. Reduction in customer market barriers to purchase products that are more energy efficient
C. Utility partners recruited
U. PG&E and utility partners participate in meetings with and provide market data to staff of Energy Star and Code and Standards Programs regarding targeted product categories
S. Permanent change in the availability of efficient models in targeted product categories among participating and nonparticipating retailers
S. Permanent change in the availability of efficient models in targeted product categories among participating and nonparticipating retailers
Q. Increased demand experienced by manufacturers for more efficient models in targeted product categories.
Q. Increased demand experienced by manufacturers for more efficient models in targeted product categories.
P. Short-‐, mid-‐, and long-‐term energy and demand savings and other environmental and non-‐energy impacts.
W. In the mid-‐term and/or long-‐term, more stringent mandatory and voluntary standards are adopted
W. In the mid-‐term and/or long-‐term, more stringent mandatory and voluntary standards are adopted
29
22
J. Increased sales of energy efficient models within targeted product categories
N. Increased share of efficient models sold in targeted product categories among participating retailers
N. Increased share of efficient models sold in targeted product categories among participating retailers
20
27
R. Manufacturers increase production of the efficient models in targeted product categories
R. Manufacturers increase production of the efficient models in targeted product categories
23
10
V. PG&E and utility partners provide input on proposed energy efficient model specifications to staff of Energy Star and Code and Standards Programs
28
D. PG&E and utility partners determine which retailers to recruit
D. PG&E and utility partners determine which retailers to recruit
9
2
4
5
3
T. Increase in market share of efficient models in targeted product categories
T. Increase in market share of efficient models in targeted product categories
24
25
K. Retailers receive incentives from PG&E and utility partners
K. Retailers receive incentives from PG&E and utility partners
11
26
F. PG&E and utility partners determine incentive levels for program-‐qualified models within each product category, present them to retailers, and sign contracts.
F. PG&E and utility partners determine incentive levels for program-‐qualified models within each product category, present them to retailers, and sign contracts.
6
8
L. Increased retailer engagement
O. Increased share of efficient models sold in targeted product categories among nonparticipating retailers.
21
12
17
1516
M. Additional retailers join program
14
13
19
18
H. Retailers implement plans employing various strategies and update as necessary.
7
A. PG&E characterizes markets and estimate savings potential for candidate products
1

11
PG&E’s Emerging Technologies Program ET13PGE8052
The fundamental program theory is that, with the right combination of incentives and engagement, market barriers for both retailers and consumers – and eventually manufacturers – can be reduced or overcome.2 A number of market barriers, faced by the retailers, the manufacturers, and customers, are addressed by the RPP Program theory. We begin by noting that a market is determined by both supply and demand characteristics. Retailers can offer products that are not demanded at the price, quality, or other associated characteristics offered. Demanders can seek, or more passively hope for, products and services that they cannot find, or cannot find at the price, quality, etc., they require. Thus, some of these barriers affect the demand for energy efficient measures while others affect the supply of these measures. To the extent that these barriers are present, the supply of and demand for these products will be suboptimal. Supply-side market barriers (manufacturers, distributors, and suppliers of residential energy-using equipment) include:
• Manufacturers may be uncertain about the response of customers to their new products or retailers might be reluctant to promote products for which their performance is uncertain. To the extent that this is a problem, the supply of these products at reasonable prices will be suboptimal.
• Products and services may be unavailable because manufacturers, distributors, and service providers have difficulty accurately predicting customer demand for their products/services, and may respond to this uncertainty in a risk-adverse manner, thereby limiting the availability of their products/services. Often this unavailability is associated with new products/services and the uncertainty of market response. Or, they might not perceive sufficient demand for energy efficiency and new energy technologies in multifamily buildings.
• Lack of information and awareness among upstream market actors regarding the benefits of energy efficient equipment.
2 Note that the RPP is not a lift program, which pays an incentive only for the number of units sold that is greater than the forecasted number of units that would have been sold normally. That is, incentives are paid only for the incremental, or net, units above this baseline forecast. Rather, with the RPP Program, an incentive will be paid for every program-qualified unit sold by the participating retailers. This is no different than any other standard utility rebate program, which pays an incentive for every qualified measure (e.g., a refrigerator). Some portion of program participants are always freeriders, something determined as part of an ex post evaluation. To mitigate the risk of high freeridership, program designers must decide to promote those energy efficient measures that have relatively low sales and market shares within a given retailer.

12
PG&E’s Emerging Technologies Program ET13PGE8052
Market infrastructure barriers include:
• Low levels of awareness and knowledge regarding product specifications or differentiation regarding efficiency levels among retail merchandizers.
• Limited experience with energy efficient equipment
• Perception of risk with stocking or installing efficient appliances when customer demand or product quality has yet to be proven (uncertainty about product performance and profit potential)
• Undervaluing energy efficiency and sustainability and their impact on economic development, denial of climate change, and low sense of urgency regarding adoption of energy efficient technologies
• Information or search costs. Specifically, the lack of expertise among equipment sales staff due to the lack of energy efficiency training opportunities
• Institutional policies and practices might prevent some retailers from shifting their assortment to the more energy efficient products simply because they never have. Energy use is not always an attribute that retail merchandizers consider when buying products from manufacturers.
• Lack of differentiated product marketing by retailers to motivate customers to make more efficient purchasing choices.
• Market lacks experience in determining the best way to create a profitable long-term business model
Demand-side market barriers include:
• Customers often unaware and lack knowledge and understanding of energy-efficient products and services
• Information costs associated with understanding the energy related features and associated benefits of energy-efficient technologies and services.
• Because energy efficiency is rarely valued by the customer more than the requested functionality, efficient models do not always receive consumer attention.
• Sometimes the energy-efficiency attributes of a product or service may not be packaged with other features customers desire. For example, some energy-efficient options may only be available on high-end products, such as on high-end or large refrigerators.
• Many customers and some businesses in the distribution chain are uncertain about the performance of energy-efficient products and services, and may not trust the performance claims made by manufacturers and vendors. Many customers also have difficulty assessing the value of energy efficiency as an investment, because the costs are paid upfront but the less certain benefits accrue over time.
• High incremental costs for the more efficient models.
• Resistance to new or innovative technologies
As a result of overcoming these market barriers, it is hypothesized that retailers will increase their sales of more energy efficient models (models that meet and/or exceed ENERGY STAR specifications) to more informed customers than they would have absent the program, thereby generating energy savings, and with sustained engagement,

13
PG&E’s Emerging Technologies Program ET13PGE8052
transforming the retail channel market in delivering energy efficient plug load products and appliances.
In terms of the logic model, initial program activities are aimed at characterizing the market and savings potential for candidate product categories (A), contacting utility partners (B), recruiting utility partners (C), determining which retailers to recruit (D), and determining which product categories to target (E). Next, the utility partners and program/implementation team determine incentive levels and sign contracts with the recruited retailers (F). Once contracts are signed, the retailers develop marketing plans for selling a greater proportion of energy efficient products (G), and begin implementing these plans (H). The retailers’ efforts reduce customer market barriers (I), resulting in increased sales of efficient products in the targeted product categories (J). Incentives for the sale of energy efficient products are paid to retailers (K), which are expected to increase the engagement of participating retailers (L), and perhaps non-participating retailers may also sense market signals suggesting that more efficient products are profitable and decide to join the program (M). The reduction of customer market barriers and the increased sale of efficient products also will, in the short-term, result in energy, demand, and other environmental and non-environmental impacts (P). In the mid-term, success of the program will be evidenced by participating retailers selling an increased share of efficient products (N). If the benefits seem great enough, nonparticipating retailers might simply begin stocking more efficient products without joining the program (O), which also will, in the mid-term, result in energy, demand, and other environmental and non-environmental impacts (P). In the long-term, both demand pressures experienced by manufacturers (Q) as well as policy-related effects on standards (U, V and-W) are expected to alter manufacturer supply of efficient products (R), which ultimately will result in permanent changes in the availability and sales of efficient models in the marketplace (S and T), which also will, in the long-term, result in energy, demand, and other environmental and non-environmental impacts (P). Because the duration of the RPP Trial was 14 months, this evaluation focuses mainly on analyzing the initial activities, outputs, and short-term outcomes. However, the evaluation team also assesses and makes recommendations with regards to establishing metrics and baselines for mid- to long-term program performance and market effects metrics as well.

14
PG&E’s Emerging Technologies Program ET13PGE8052
THE RPP TRIAL The RPP Trial ran from November 2013 to December 20143 with a single participating retailer in a total of 24 participating stores4 in the PG&E and SMUD service territories (22 participating stores located in the PG&E service territory; two stores in the SMUD service territory). In addition to the participating stores, the participating retailer also provided product sales data for all of their other stores in California (the “nonparticipating” stores) to serve as comparison stores. There were a total of 66 nonparticipating stores (17 in the PG&E service territory; 49 located elsewhere throughout the state).5 Table 5 provides the counts of participating and nonparticipating stores by service territory.
TABLE 5: PARTICIPATING AND NONPARTICIPATING STORES BY SERVICE TERRITORY
Service Territory Store Type
TOTAL Participating Nonparticipating
PG&E 22 17 39
SMUD 2 0 2
Other 0 49 49
TOTAL 24 66 90
Figure 2 shows the locations of the participating and nonparticipating stores that remained open during the trial throughout the state by service territory.
3 Initially, the RPP Trial was expected to run for 12 months, from November 2013 through October 2014. However, because the retailer was unable to modify their holiday promotion plans to accommodate the Program on such short notice, sales of program-qualified products were very low. As a result of this slow start (see Lessons Learned and Recommendations section of this report), by advice of the CPUC-ED and the PG&E program staff, and in consultation with the participating retailer, it was decided to extend the trial period through the end of December 2014 in order to plan more effectively for the 2014 holiday season. 4 Originally, there were a total of 26 participating stores (24 PG&E; two SMUD). However, two of the participating stores in the PG&E service territory terminated participation in the trial due to unforeseen business circumstances and are excluded from our analyses. 5 Originally, there were a total of 77 nonparticipating stores, but due to closures or other circumstances, 11 stores are excluded from analyses.

15
PG&E’s Emerging Technologies Program ET13PGE8052
FIGURE 2: PARTICIPATING RETAILER STORES
The RPP Trial targeted and paid incentives on six product categories.6 Table 6 shows the product categories included in the Trial along with the qualifying efficiency levels and incentives paid to the retailer for each unit sold.
TABLE 6: RPP TRIAL PRODUCT CATEGORIES, EFFICIENCY STANDARDS, AND PER-UNIT INCENTIVES
Product Category Efficiency Standard Per-Unit Incentive
Air Cleaners ENERGY STAR v1.0 $25
DVD/Blu-Ray Players ENERGY STAR v3.0 $4
Home Theaters-in-a-Box/Sound bars ENERGY STAR v3.0 $15
Freezers ENERGY STAR v4.0 $25
Refrigerators ENERGY STAR v4.0 $40
Room Air Conditioners ENERGY STAR v2.0 $40
6 Initial plans for the RPP Trial also included targeting docking stations and compact audio. However, because the participating retailer ultimately did not stock any program-qualified models in either of these categories, these product categories were ultimately excluded from the trial.

16
PG&E’s Emerging Technologies Program ET13PGE8052
For the trial of the RPP Program, a model was considered program-qualified if the model met the minimum ENERGY STAR specification that was in effect at the start of the program (November 2013) for the given targeted product category.7 The one exception to this was the room air conditioner category. Because the summer of 2013 was cooler than expected nationwide and store sales did not meet expectations, the participating retailer had no plans to purchase additional room air conditioners to stock for the 2014 season. However, they did have an abundant inventory of a specific model of room air conditioner that met the prior, ENERGY STAR 2.0 specification, which exceeded the efficiency of all other models the retailer stocked, though this inventory was stockpiled in a distribution center outside of the State. The project team, in consultation with the retailer, agreed to incent that model of room air conditioner and the retailer committed to shipping extra units from their Midwestwern distribution center and implementing bulk-stack displays of these units along with additional signage and promotion to sell more of the relatively more-efficient model.8 During the Trial, any new models within the targeted product categories that were added to the retailer’s assortment were referenced against the online ENERGY STAR qualified products database to determine if they were program-qualified. This was done because new models may not have been in production when the ENERGY STAR specifications from November 2013 were in effect (and thus, would not appear in the original ENERGY STAR Qualified Product List), because the online database incorporates some models that were deemed to meet the ENERGY STAR specification but were added after the original specification was released, or because some models may have met a new specification that was more stringent than the initial specification.
7 While models were considered to be program-qualified if they met the minimum ENERGY STAR specification for the trial, there are plans for the program to focus on efficiency levels for some product categories that exceed the minimum ENERGY STAR specification (e.g., ENERGY STAR +X% or ENERGY STAR Most Efficient). 8 The retailer had no plans to assort and promote this particular model of air conditioner in the participating stores at the level they ultimately did without the program. Thus, though they decided to promote a model that already possessed, the increased inventory shipped to the participating stores along with the targeted promotional activities allowed the retailer to sell a greater proportion of more efficient units than they would have in the absence of the program.
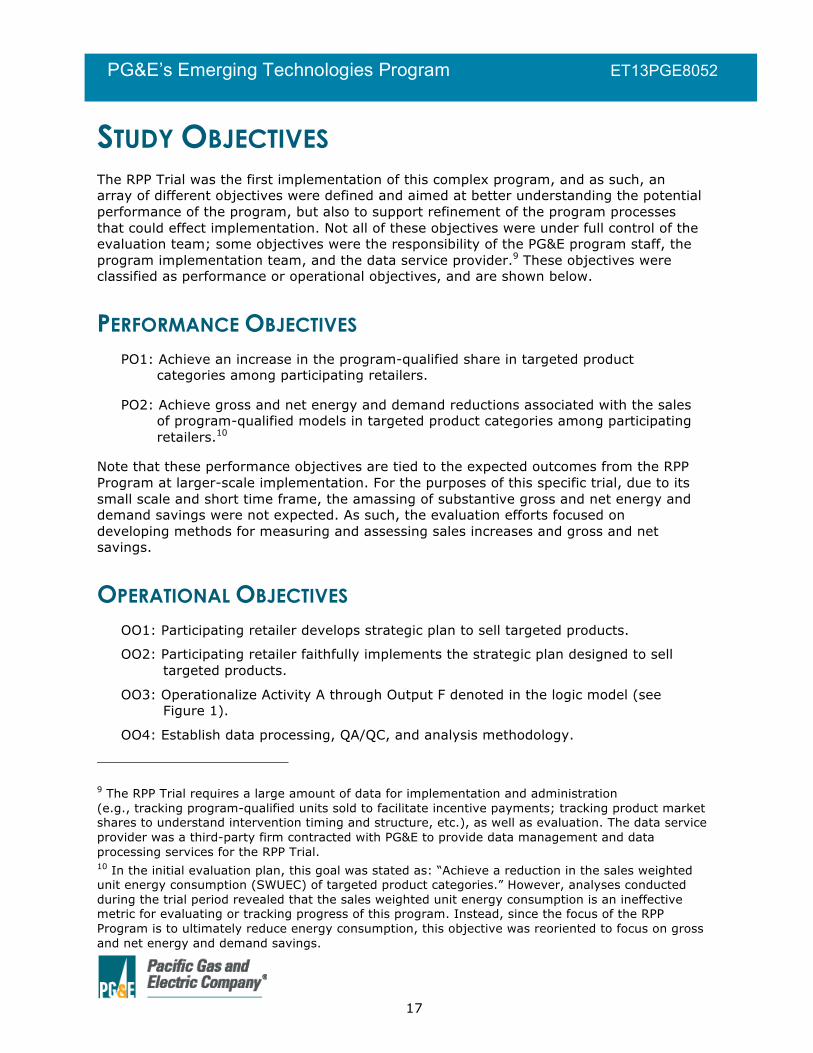
17
PG&E’s Emerging Technologies Program ET13PGE8052
STUDY OBJECTIVES The RPP Trial was the first implementation of this complex program, and as such, an array of different objectives were defined and aimed at better understanding the potential performance of the program, but also to support refinement of the program processes that could effect implementation. Not all of these objectives were under full control of the evaluation team; some objectives were the responsibility of the PG&E program staff, the program implementation team, and the data service provider.9 These objectives were classified as performance or operational objectives, and are shown below.
PERFORMANCE OBJECTIVES PO1: Achieve an increase in the program-qualified share in targeted product
categories among participating retailers.
PO2: Achieve gross and net energy and demand reductions associated with the sales of program-qualified models in targeted product categories among participating retailers.10
Note that these performance objectives are tied to the expected outcomes from the RPP Program at larger-scale implementation. For the purposes of this specific trial, due to its small scale and short time frame, the amassing of substantive gross and net energy and demand savings were not expected. As such, the evaluation efforts focused on developing methods for measuring and assessing sales increases and gross and net savings.
OPERATIONAL OBJECTIVES OO1: Participating retailer develops strategic plan to sell targeted products.
OO2: Participating retailer faithfully implements the strategic plan designed to sell targeted products.
OO3: Operationalize Activity A through Output F denoted in the logic model (see Figure 1).
OO4: Establish data processing, QA/QC, and analysis methodology.
9 The RPP Trial requires a large amount of data for implementation and administration (e.g., tracking program-qualified units sold to facilitate incentive payments; tracking product market shares to understand intervention timing and structure, etc.), as well as evaluation. The data service provider was a third-party firm contracted with PG&E to provide data management and data processing services for the RPP Trial. 10 In the initial evaluation plan, this goal was stated as: “Achieve a reduction in the sales weighted unit energy consumption (SWUEC) of targeted product categories.” However, analyses conducted during the trial period revealed that the sales weighted unit energy consumption is an ineffective metric for evaluating or tracking progress of this program. Instead, since the focus of the RPP Program is to ultimately reduce energy consumption, this objective was reoriented to focus on gross and net energy and demand savings.

18
PG&E’s Emerging Technologies Program ET13PGE8052
OO5: Identify variables that should be tracked by the RPP Program.
OO6: Continue building relationships with other program partners such as SMUD, NEEA, and other utilities and organizations for future partnerships.
OO7: Increase retailer awareness of promoting, selling, and/or stocking products based on energy efficiency criteria.
While achieving these operational objectives were mostly the responsibility of the PG&E program staff, the program implementation team, and the data service provider, the evaluation team participated in and provided input on most of them in order to improve the evaluability of the RPP Program.
In addition to the performance and operational objectives shown above, additional objectives were also defined specifically to support evaluation of the RPP Trial, and because of the complexity of the program design, to provide input into future evaluation efforts for the RPP Program.
EVALUATION OBJECTIVES EO1: Test various methods to evaluate the RPP Trial.
EO2: Identify, operationalize, track, and analyze key proximate (short and mid-term) indicators of performance.
EO3: Propose performance indicators for measuring longer-term effects and/or benefits.
EO4: Identify data collection and analysis responsibilities (retailer, utility staff, evaluators).
EO5: Measure the extent to which trial RPP Program objectives were achieved.
EO6: Assess potential program trial spillover effects on non-participating stores within the PG&E and utility partner service territories.
It is important to note that no single methodology is suitable for assessing all objectives. Some objectives are more qualitative in nature and involve assessing and evaluating operational activities and processes to ensure that the program trial was implemented as planned and is functioning as expected—more inline with a typical process evaluation. Other objectives are more quantitative in nature and involve defining, measuring, and analyzing specific metrics that serve as indicators of program progress, attribution, and/or success—more analogous to a traditional impact evaluation. Also, since this is a relatively new and novel program concept aimed at market transformation via a mid-stream model, as noted under the evaluation objectives, an additional goal of this evaluation involves assessing an array of potential approaches to evaluating the program in order to identify those that are most effective, feasible, scalable, and cost-effective to employ in the future. To the extent possible, this evaluation of the RPP Trial complies with the California Energy Efficiency Evaluation Protocols: Technical, Methodological, and Reporting Requirements for Evaluation Professionals (TecMarket Works Team, 2005) and The Program Evaluation Standards: A Guide for Evaluators and Evaluation Users (Yarbrough et al., 2011).

19
PG&E’s Emerging Technologies Program ET13PGE8052
RESEARCH METHODS/APPROACHES Because of the dynamic and complex nature of the RPP Program, and the added complexity resulting from non-program-related factors interacting with program-related effects, this evaluation relies on multiple approaches and analyses to support conclusions regarding program performance and impacts. The evaluation team used an array of different methods to evaluate the RPP Trial. The evaluation of the operational objectives relied mainly on a traditional process evaluation, while the evaluation of performance objectives relied on an impact evaluation that employed a variety of quasi-experimental methods.
Figure 3 summarizes the collection of research tasks conducted for the RPP Trial evaluation.
FIGURE 3: RESEARCH METHODS USED FOR THE RPP TRIAL EVALUATION
Process Evaluation Methods Impact Evaluation Methods
• Retailer Interviews - Merchants - Marketers - Store Managers
• Leadership Team PG&E Program Staff Interviews • Implementation Team Interviews • Salesforce Data Review • Retailer Marketing Activities Review • Retailer Shelf Surveys • Program Document Review
• Difference-in-Differences • Regression Analysis Using Program-Tracking Data - Participant-Only Pre-Post
Forecasted Baseline to Actual Data
- Participant-Only Regression (modified step and segmented)
- Comparison Group-Based Regression (modified step and segmented)
• Review of qualitative data
Also, though not presented as a specific impact evaluation method, one should not discount the value of visual inspection of charts and figures to discern trends in variables of interest (e.g., program-qualified share for participating and nonparticipating stores). The sales data series used for this evaluation contain significant month-to-month variability, and sometimes relatively low sales volumes, which result in forecasts and regressions that are also variable and somewhat imprecise. This makes significant, program-induced differences difficult to detect form a purely statistical perspective. This is especially the case in the shorter-term (i.e., with only 14-months of trial-period data available). However, from a practical and longer-term perspective, graphical representations are quite helpful for detecting early trends that may not be significant now, but could become statistically significant in the future. Through visual inspection, one often obtains an immediate and strong impression of the trend just by noting whether the series seems flat or moves generally up or down over time. Also, visual inspection allows the researcher to detect anomalies in the data or issues that can detrimentally affect certain analyses. As such, when conducting the more rigorous quantitative analyses, as a first step, the evaluation team also examined plots of the data to assess trends or highlight issues.

20
PG&E’s Emerging Technologies Program ET13PGE8052
This section of the report presents the methods and approaches used for evaluating the RPP Trial. It begins by discussing the process evaluation methods, proceeds to a discussion of the retailer data used for conducting the quantitative analyses, and concludes by introducing the impact evaluation methods.
PROCESS EVALUATION METHODS The evaluation team conducted up to two waves of interviews with a range of actors associated with the RPP Trial. In order to capture the retailer’s perspectives and experiences with the program, the evaluation team conducted primary research with merchants (buyers), marketers, store managers, and corporate leadership team members. In order to capture other stakeholders’ perspectives and experiences, the evaluation team conducted primary research with PG&E program staff and program implementation team members. The number of interviews conducted across the different interviewees is shown in Table 7. All of the interview guides/surveys are provided in Appendix A.
TABLE 7: INTERVIEWS CONDUCTED AS PART OF THE RPP TRIAL EVALUATION
GROUP
WAVE 1 INTERVIEWS CONDUCTED
(FEB. & MAR.
2014)
WAVE 2 INTERVIEWS AND SURVEYS CONDUCTED
(FEB. & MAR. 2015) DETAILS
Retailer Merchants 1 2 At start-up, the merchants and the marketers were
both participating in the planning for the RPP Trial; by Wave 2, only the merchants were responsible for planning and implementing RPP. For Wave 1, the evaluation team was only able to complete interviews with the home appliance merchant and marketer; for Wave 2 we were able to complete interviews with both the home appliance and consumer electronics merchants.
Retailer Marketers 1 NA
Retailer Store Managers 5 6
Wave 1 consisted of in-depth interviews with a small sample of store managers. For Wave 2, a web survey was conducted, with email invitations sent to the entire population of participating store managers.
Retailer Leadership Team
2 1 Only one staff member was operating as the RPP representative of the Retailer Leadership Team in Wave 2.
PG&E Program Staff 2 2
A project debrief telephone call was conducted with two members of the PG&E program team at start-up and at the close of the trial.
Implementation Team NA 3
A project debrief telephone conference was conducted with three members of the implementation team, Navitas Partners, at the close of the trial.
RETAILER INTERVIEWS Consistent with the design of the RPP Program, and because of the mid-stream focus of the design, the retailers play the central—and most important—role. Without retailers willing to participate in the program, the program would not exist. Retailers also design

21
PG&E’s Emerging Technologies Program ET13PGE8052
and implement the marketing strategies designed to increase sales of targeted products. Additionally, retailers are the final conduit to the consumers, who ultimately decide to purchase—or not purchase—the energy efficient products. As such, gaining an in-depth understanding of the retailer staff perspectives, experiences, and expectations was a significant component of this evaluation.
The evaluation team conducted two waves of interviews with key retailer staff. The first wave of interviews was conducted in February and March of 2014 and the second wave of interviews was conducted in February and March of 2015.11 The general topics covered in the retailer interviews included:
RETAILER MERCHANT AND MARKETER INTERVIEW TOPICS • Awareness and knowledge regarding energy efficiency in general • Knowledge about energy efficiency initiatives underway at the retailer, and
whether there is any collaboration/communication between various departments of the retailer regarding energy efficiency initiatives
• Knowledge about energy efficiency as it relates to the qualified product categories in the RPP Trial
• Product promotion processes • Awareness of the RPP Trial • Influence of the RPP Trial on their promotion and purchasing decisions • Possible increase in efficient product sales due to RPP Trial in participating and
nonparticipating stores • Distribution of products (i.e., do any program-qualified products go to non-
participating stores in addition to participating stores) • Perceptions regarding the appropriate timing and level of incentives • The likelihood that they would have designed and implemented the agreed-upon
retailer implementation plan absent the RPP Trial (to inform NTGRs) • Experiences with and feedback on the RPP program trial
RETAILER STORE MANAGER INTERVIEW/SURVEY TOPICS • General awareness of in-store promotional activities • Awareness of the RPP Trial • Awareness of RPP-specific promotional activities • Possible increase in efficient product sales due to RPP Trial in participating stores • Awareness and knowledge regarding their customers’ demands for energy efficient
products • Influence of the RPP Trial on their promotion, pricing, placement, assortment, and
stocking decisions • Activities implemented to promote program-qualified products (staff training,
pricing, placement, promotion, assortment, etc.) • Experiences with and feedback on the RPP Trial
11 Though the evaluation team aimed to conduct the first wave of interviews closer to the start of the program in November 2013—and the final wave of interviews closer to the actual end of the trial period in December 2014—this was ultimately not possible. Because of concerns over disrupting business operations during the busy holiday season (roughly the second week of November through the beginning of January), the participating retailer asked that the evaluation team wait until after the New Year to conduct our interviews/surveys.

22
PG&E’s Emerging Technologies Program ET13PGE8052
RETAILER LEADERSHIP TEAM INTERVIEW TOPICS • Decisions and input regarding products included in the RPP Trial • Participation in retailer’s retailer implementation plan development • Involvement with the RPP Trial implementation • Experiences with the RPP Trial
During the data collection phase of this evaluation, PG&E program staff, the implementer, and the evaluation team discussed the applicability and usefulness of the retailer store manager interviews/surveys. Questions arose regarding: (1) the ability of the store managers to answer questions about specific RPP-related promotions when they are exposed to a wide array of promotions throughout the year, and (2) whether or not the store staff actually have a role in implementing the program when the program theory suggests that these decisions are mostly made at a corporate level (i.e., purchasing and stocking behaviors, development of promotional activities and events, etc.). Nevertheless, the team decided to include the retailer store manager interviews/surveys, but with the additional goal of assessing whether or not store mangers have adequate insight to effectively answer questions related to RPP promotions and effects. A discussion of this additional assessment is included in the results chapter.
PG&E PROGRAM STAFF AND IMPLEMENTATION TEAM STAFF
INTERVIEWS/DEBRIEFS The evaluation team conducted in-depth interviews with relevant PG&E program staff at the beginning of the Trial in January 2014, and conducted a debrief with staff after the Trial in March 2015. The interviews and debrief focused primarily on the operational aspects of the RPP Trial and include topics such as:
• Lessons learned about the development and implementation of the program (e.g., what has worked, what has not? What have been the greatest hurdles? What have been the greatest successes?)
• Recommendations for change and improvement of the program • Administrative processes and protocols: are they appropriate and scalable? • Frequency and effectiveness of the communication between the utility,
implementers, and retailer • Identify information that needs to be tracked by the RPP Trial
SALESFORCE DATA REVIEW Salesforce is a database platform that supports logging, storing, categorizing, and reporting an array of qualitative and quantitative information. Key email-based communications and interactions between the implementation team and PG&E, SMUD, other utilities, utility partners, and other stakeholders (e.g., ENERGY STAR, codes & standards program staff, retailers, product manufactures, etc.), including meeting (in-person and via phone/web conference), agendas, notes, and presentations were logged and tracked by the implementation team in a Salesforce database on a regular basis.
The evaluation team systematically coded, classified, and summarized this qualitative and quantitative information in a manner aimed at describing the communications and interactions. The objective was to better understand the flow and content of communications and to validate that key components of the program logic model were occurring.

23
PG&E’s Emerging Technologies Program ET13PGE8052
RETAILER MARKETING ACTIVITIES REVIEW Per the RPP Program design, participating retailers are expected to develop strategies for marketing and assorting targeted products incented through the program during their period of participation. While these plans are intended to be flexible and can be revised over time in accordance with retailers’ operational and business needs, it is expected that they will include clear descriptions of the specific marketing activities that are planned for targeted product categories. Typical retailer implementation plans might include plans for:
• Product assortment changes (e.g., stocking and displaying additional qualified models)
• Product pricing strategies (e.g., price promotions for the most efficient model in a product category)
• Product promotion strategies (e.g., promoting energy efficient models over standard efficiency models)
• Product placement strategies (e.g. devoting “prime” shelf and/or store locations to energy efficient models)
• Staff training (e.g., educating sales associates and managers on the benefits of energy efficiency products)
Retailers do not need to commit to all of these activities, and may plan additional activities not mentioned in the list above. Further, the planned activities can, and likely will, vary across different product categories, as the retailers see fit. This flexibility is fundamental to the RPP Program concept. That is, the program is intended to allow retailers—those who know the most about selling products—the flexibility to do whatever they see fit to best promote and sell these products. As part of this evaluation, the evaluation team reviewed the marketing strategies and inventoried the specific marketing activities conducted by the retailer during the trial, including the type of activity (e.g., sale price, signage, unique placement, etc.) and the implementation period.
RETAILER SHELF SURVEYS Comprehensive retailer shelf surveys were conducted twice in each of the participating stores (i.e., a census) by a field team directed by PG&E. Wave I of shelf surveys was conducted in February and March 2014; Wave II was conducted in November 2014.12
For the shelf surveys, field team members were asked to conduct a comprehensive inventory of all RPP targeted product categories present in each of the stores. Specific tasks included: 12 Though the evaluation team aimed to conduct the first wave of shelf surveys closer to the start of the program in November 2013, this was ultimately not possible. Because of concerns over disrupting business operations during the busy holiday season (roughly the second week of November through the beginning of January), the participating retailer asked that the evaluation team wait until after the New Year to conduct our initial shelf surveys. The second wave of shelf surveys was planned for early November 2014 because the retailer had special promotions planned for this time and we wanted to be able to assess the consistency of implementation and we did not want to disturb operations closer the holidays.
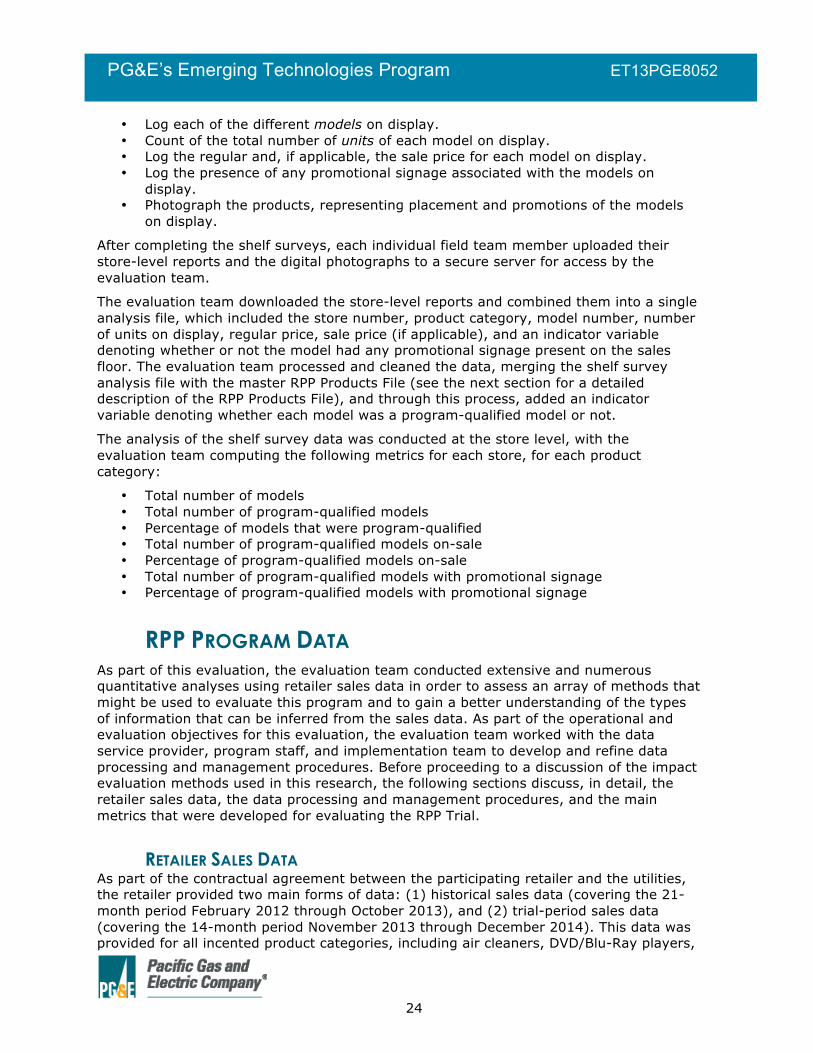
24
PG&E’s Emerging Technologies Program ET13PGE8052
• Log each of the different models on display. • Count of the total number of units of each model on display. • Log the regular and, if applicable, the sale price for each model on display. • Log the presence of any promotional signage associated with the models on
display. • Photograph the products, representing placement and promotions of the models
on display.
After completing the shelf surveys, each individual field team member uploaded their store-level reports and the digital photographs to a secure server for access by the evaluation team.
The evaluation team downloaded the store-level reports and combined them into a single analysis file, which included the store number, product category, model number, number of units on display, regular price, sale price (if applicable), and an indicator variable denoting whether or not the model had any promotional signage present on the sales floor. The evaluation team processed and cleaned the data, merging the shelf survey analysis file with the master RPP Products File (see the next section for a detailed description of the RPP Products File), and through this process, added an indicator variable denoting whether each model was a program-qualified model or not.
The analysis of the shelf survey data was conducted at the store level, with the evaluation team computing the following metrics for each store, for each product category:
• Total number of models • Total number of program-qualified models • Percentage of models that were program-qualified • Total number of program-qualified models on-sale • Percentage of program-qualified models on-sale • Total number of program-qualified models with promotional signage • Percentage of program-qualified models with promotional signage
RPP PROGRAM DATA As part of this evaluation, the evaluation team conducted extensive and numerous quantitative analyses using retailer sales data in order to assess an array of methods that might be used to evaluate this program and to gain a better understanding of the types of information that can be inferred from the sales data. As part of the operational and evaluation objectives for this evaluation, the evaluation team worked with the data service provider, program staff, and implementation team to develop and refine data processing and management procedures. Before proceeding to a discussion of the impact evaluation methods used in this research, the following sections discuss, in detail, the retailer sales data, the data processing and management procedures, and the main metrics that were developed for evaluating the RPP Trial.
RETAILER SALES DATA As part of the contractual agreement between the participating retailer and the utilities, the retailer provided two main forms of data: (1) historical sales data (covering the 21-month period February 2012 through October 2013), and (2) trial-period sales data (covering the 14-month period November 2013 through December 2014). This data was provided for all incented product categories, including air cleaners, DVD/Blu-Ray players,

25
PG&E’s Emerging Technologies Program ET13PGE8052
home theaters-in-a-box, freezers, refrigerators, and room air conditioners. These data files included all models sold within each targeted product category regardless of whether it was program-qualified or not. Comprehensive sales data were provided for all participating stores in the PG&E (N=24) and SMUD (N=2) service territories. Also, to support the comparative analyses, the retailer also provided the same data (historical and trial-period) for all nonparticipating stores throughout the state (N=66). It is worth emphasizing that while these comparison stores are part of this evaluation, it is unclear if such comparison data will be available from retailers for a larger-scale implementation of this program.
DATA PROCESSING AND MANAGEMENT Significant effort was made by the evaluation team, PG&E program staff, the implementation team, and the services provider to develop efficient and effective data management and processing protocols as part of the RPP Trial. The amount of data needed to evaluate this program—both from planning and evaluation perspectives—is rather large. Because the RPP Program is expected to be scaled up to include more retailers and a much greater number of stores (and targeted product models), it is expected that data management and processing will become more complicated as the program grows. This growth in data needs will also cause administrative costs to grow and, unless effectively managed, can quickly reach impractical levels. Failing to manage these costs will compromise the cost-effectiveness of the RPP Program.
The following section discusses the details of processing the retailer sales data and the protocols that were used by the evaluation team, data service provider, implementation staff, and PG&E staff to construct analysis data sets.
HISTORICAL AND TRIAL-PERIOD RAW DATA PROCESSING The raw historical and trial-period data files were first provided to the program implementer who reviewed the data to ensure it captured the relevant time periods, product categories, and models. If any errors or issues were found, the implementer worked with the retailer to resolve issues and get an updated file. Once the implementer conducted their QA/QC, the data files were then provided to the data service provider who developed a system for processing the data in order to facilitate the recording and payment of rebates to the retailer. The evaluation team was provided the raw sales data files from the data service provider. Two main complications resulted from the fact that the historical sales data and the trial-period sales data came from the retailer’s two different data warehousing systems. First, because the different data resided in different systems that were structured differently, the retailer needed to develop two different queries to extract the needed information. The historical data was structured in a way that allowed the retailer to query entire product categories. In contrast, the trial-period data resided in a system that was structured in a way that required the retailer to specify the particular models to include in the extract. Because of these differences, it is possible that the historical data was more comprehensive (i.e., that some models may have been inadvertently left out of the trial-period data queries). Second, the historical data was provided in a format where each row contained the monthly net unit sales for a particular model at a particular store (sales minus returns). The unique model identifier in the historical sales data series was a retailer inventory ID (no manufacturer model ID was included), and the file also included

26
PG&E’s Emerging Technologies Program ET13PGE8052
textual model descriptions. The trial-period sales data was provided in a format where each row of the file contained daily net unit sales (sales minus returns) for a particular model at a particular store. However, the unique model identifier in the trial-period sales data was the manufacturer model number (no retailer inventory ID was included), and the file did not contain model descriptions. Due to these issues, the matching of models across the two data sets was challenging. As noted above, the historical data series only included the retailer inventory ID and textual model descriptions. In many cases the textual model descriptions actually contained the manufacturer model number, so matching models for these cases was possible, but needed to be conducted in a time-consuming, model-by-model basis. Many other models in the historical data, however, did not contain product descriptions or the descriptions did not contain a model number and the retailer inventory ID numbers had to be looked up on a case-by-case basis through the retailer’s website. However, the retailer inventory IDs did not always produce an ID when we queried the website. The retailer staff indicated this was likely due to some models no longer being stocked, so the IDs were retired. However, there were also some IDs that pointed to totally unrelated products (e.g., clothing, kitchen utensils, etc.), suggesting that the retailer inventory IDs are not necessarily unique or not actually “retired” if a product is no longer in inventory, but instead, assigned to a new product. Ultimately, there were some models that could not be matched between the historical data series and the trial-period data based on the available information. In many cases, this is to be expected, as some older models are no longer stocked—especially for the consumer electronics categories, which typically have relatively short shelf lives. Nevertheless, since the sales volumes of the models in question were relatively small (see Table 8), the evaluation team does not feel the unmatched models compromise our ability to meaningfully analyze the historical and trial-period data series. Throughout this report the evaluation team highlights specific results that may be impacted by the potential data matching issues.
DEVELOPMENT OF THE “RPP PRODUCTS” FILE As part of the matching process, the evaluation team, data service provider, and PG&E program staff worked together to develop a separate file that translated the retailer inventory IDs to the manufacturer model numbers. We populated this “RPP Products” file with an array of additional information as well, including brand, product description, and the model attributes that affect energy consumption (see Table 9).

27
PG&E’s Emerging Technologies Program ET13PGE8052
TABLE 8: DATA PROCESSING COUNTS – UNMATCHED MODELS BY PRODUCT CATEGORY
Product Category
Models in Historical
Data
Models in Trial-period
Data Unmatched
Models
Percent of Total Historical Sales
Volume Unmatched
Air Cleaners 12 4 2 0.4%
DVD/Blu-Ray Players 44 4 4 1.5%
Home Theaters-in-a-Box/Sound bars 37 24 9 1.6%
Freezers 14 12 3 0.2%
Refrigerators 66 27 30 4.5%
Room Air Conditioners 46 12 7 3.4%
TABLE 9: MODEL ATTRIBUTES TRACKED IN THE RPP PRODUCTS TRANSLATION FILE
Product Category Model Parameters
Air Cleaners Clean air delivery rate (CADR), efficiency (CADR/Watts), standby power consumption, estimated annual hours-of-use
DVD/Blu-Ray Players On mode power consumption, idle mode power consumption, standby mode power consumption, estimated annual hours-of-use
Home Theaters-in-a-Box/Sound bars
On mode power consumption, idle mode power consumption, standby mode power consumption, estimated annual hours-of-use, and if applicable parameters for secondary components (e.g., DVD or Blu-Ray player)
Freezers Volume, adjusted volume, type (chest or upright), defrost mode (auto or manual)
Refrigerators
Refrigerator volume, freezer volume, total volume, adjusted volume, type (top-freezer, bottom-freezer, side-by-side, single-door), defrost mode (auto or manual), presence or absence of through-the-door icemaker, presence or absence of internal ice maker
Room Air Conditioners
Cooling capacity (in BTU), type (window or portable), presence or absence of reverse cycle, presence or absence of louvered sides, energy efficiency rating (EER), power consumption (in Watts), estimated annual hours-of-use
Each model appearing in the RPP Products file was also coded as qualified or non-qualified based on the relevant qualifying efficiency specification that defined payment of incentives that was in effect at the start of the retailer’s participation in the program (see Table 6). Also, unit energy consumption (UEC) and, for qualified models, unit energy savings (UES) and unit demand reduction (UDR) estimates were assigned to each model appearing in the sales data based on the methods described in the white paper, Calculation Methodology for Unit Energy Consumption (UEC) and Unit Energy Savings (UES) for the Retail Plug-Load Portfolio (RPP) Program (Malinick et al., 2015). In general, the approach consisted of:
• Using UEC and UES values from the California Database for Energy Efficient Resources (DEER) for the product categories present in DEER (i.e., freezers and refrigerators),

28
PG&E’s Emerging Technologies Program ET13PGE8052
• Using measure-level UEC values from secondary data or sources when this information was available, or
• Using model-level UEC values and developing sales-weighted UES values for remaining product categories.
In order to facilitate fair comparisons and derive meaningful energy consumption and savings estimates, the evaluation team divided the six broad RPP targeted product categories into product classes. Within a product category, different features, characteristics, and/or sizes can affect energy consumption—and ultimately energy savings estimates—across models. For example, for air cleaners, models with a higher clean air delivery rate (CADR) use more energy than models with lower CADRs. Table 10 shows the product classification scheme for the products included in the RPP Trial.
TABLE 10: RPP TRIAL PRODUCT CATEGORIES AND CLASSES
PRODUCT CATEGORY RPP PRODUCT CLASS
Air Cleaners 1. <100 CADR 2. >=100 CADR
DVD/Blu-Ray Players 1. Standard DVD players 2. Blu-Ray players
Home Theaters-in-a-Box
1. Home theater-in-a-box 2. Home theater-in-a-box w/ DVD player 3. Home theater-in-a-box w/Blu-Ray player 4. Sound bar
Freezers A 1. Chest 2. Upright
Refrigerators B
1. Compact Mini (<5 cu. ft.) 2. Compact (5-7 cu. ft. 3. Very Small (<13 cu. ft.) 4. Small (13-16 cu. ft.) 5. Medium (17-20 cu. ft.) 6. Large (21+23 cu. ft.) 7. Very Large (>23 cu. ft.)
Room Air Conditioners
1. <12,000 BTU (<1.00 ton) 2. 12,000-17,999 BTU (1.00-1.49 ton) 3. 18,000-23,999 BTU (1.50-1.99 ton) 4. 24,000-29,999 BTU (2.00-2.49 ton) 5. >=30,000 BTU (>=2.50 ton)
A Note that for the purposes of assigning UEC and UES values, the 12 DEER classes for freezers were used. However, the participating retailer sold relatively few models of program-qualified freezers. In order to ensure there were an adequate number of models present in the classes to facilitate analyses, the evaluation team grouped the freezers by type, as this characteristic drove savings more than size.
B Note that for the purposes of assigning UEC and UES values, the 55 DEER classes for refrigerators were used. However, the participating retailer sold relatively few models of program-qualified refrigerators. In order to ensure there were an adequate number of models present in the classes to facilitate analyses, the evaluation team grouped the refrigerators by DEER size class instead of DEER product class.
It is worth noting that not all of the classes shown in Table 10 will appear in the results section of this report. In some cases, the participating retailer sold no models in individual product classes; in some other cases, the retailer may have sold models in a product class, but they did not sell any program-qualified models. In cases where a product class has no models sold or no program-qualified models sold, there is nothing to analyze and the classes are excluded from analyses.

29
PG&E’s Emerging Technologies Program ET13PGE8052
FINAL HISTORICAL AND TRIAL-PERIOD DATA PROCESSING The RPP Products file was used as a translation file allowing the evaluation team to synch the historical data files and the trial-period data in order to ensure the correct models were matched. Ultimately, the evaluation team developed an analysis data file that indicated how many units of each specific product model were sold in each of the participating retailer stores (both participating and nonparticipating stores) each month from February 2012 through December 2014. Each store was coded as participating or nonparticipating; each model was assigned to its associated product category and class; each model was coded as program-qualified or nonqualified; UEC values were assigned to all models; program-qualified models were assigned the associated UES value. In addition to including the model-related information, the evaluation team also coded the program activities that the participating retailer implemented throughout the trial (for more details on this coding, see the Sales Data Analytic Methods section of the report). The evaluation team used this analysis data file for analyses conducted for the evaluation. However, none of the metrics assessed and computed in this report are reported at the store level. Instead, to ensure the confidentiality of the participating retailer’s sales information, all results are aggregated to various levels to obscure actual sales volumes of specific models to the extent possible, while still providing the necessary resolution to draw informed and well-grounded conclusions (e.g., at the participating versus nonparticipating store level, or at the program-qualified versus non-qualified product level).
METRICS DEVELOPMENT This section of this report provides details regarding the quantitative metrics that the evaluation team constructed and analyzed as part of this evaluation.
PROGRAM-QUALIFIED SHARE (PQS) In addition to total units sales volumes of program-qualified and non-qualified models, the evaluation team computed and tracked the program-qualified share (PQS), define as the proportion of total unit sales volumes within targeted product classes (p), over a specific time period (t), that are program-qualified, as shown in Equation 1:
EQUATION 1: PROGRAM QUALIFIED SHARE (PQS)
𝑃𝑄𝑆!,! = 𝑇𝑜𝑡𝑎𝑙 𝑄𝑢𝑎𝑙𝑖𝑓𝑖𝑒𝑑 𝑈𝑛𝑖𝑡𝑠 𝑆𝑜𝑙𝑑!,! / 𝑇𝑜𝑡𝑎𝑙 𝑈𝑛𝑖𝑡𝑠 𝑆𝑜𝑙𝑑!,! Notably, and as discussed elsewhere in this plan, the evaluation team does not expect substantial changes in the PQS in the short-term (one to two years). Retail seasonal buying patterns mean that in the first year of participation, retailers will likely have already made their stocking decisions. Thus, the first-year effects will likely be very limited since sales were almost completely driven by promotional activities, with such small effects being much harder to detect statistically. However, the expectation is that the PQS values will increase over time as the participating retailers increase their assortment of program-qualified models. The time period (t) is incorporated to account for the different time periods that may be assessed as part of the evaluation. For example, with regards to the PQS, a monthly PQS may be computed reflecting the proportion or program-qualified units sold within a given month, a historical PQS may be computed based only on the sales volume-weighted

30
PG&E’s Emerging Technologies Program ET13PGE8052
average of 21 months of historical data, or a trial-period PQS may be computed to reflect a sales volume-weighted average of the PQS over the 14 months of the trial.
UNIT ENERGY CONSUMPTION (UEC) Unit energy consumption (UEC) is the average estimated annual electricity usage, in kilowatt-hours (kWh), for a specific product or device. Figure 4 shows the generalized method for computing UEC estimates. The estimate for annual hours of usage is multiplied by the measured power (in Watts) to derive the estimate for annual UEC in each of a device’s operating modes. The UEC estimates for each mode are then summed to arrive at the estimate for total device UEC (Roth & McKenney, 2007).13 For products with a single operating mode, the estimate for total UEC is simply the annual hours of usage multiplied by the device’s measured power.
FIGURE 4: GENERALIZED UNIT ENERGY CONSUMPTION (UEC) ESTIMATION METHODOLOGY
UNIT ENERGY SAVINGS (UES) Though some details vary with regards to the final computation of UES estimates depending on the availability of data and the approach taken,14 the basic premise is that the unit energy savings (UES), in kilowatt-hours (kWh), for an energy efficient model within a particular product class (p) for a particular period of time (t) is the difference between the average UEC for the non-qualified models and the average UEC for qualified models. This calculation is shown in Equation 2:
EQUATION 2: UNIT ENERGY CONSUMPTION (UES)
𝑈𝐸𝑆!,! = 𝑈𝐸𝐶!"#!!"#$%&%'(!,! − 𝑈𝐸𝐶!"#$%&%'(!,!
13 In the example shown, active mode also includes when a product is no longer being used but
remains in a high-powered state, often referred to as idle mode. 14 For a complete description of details, see Malinick et al., 2015.

31
PG&E’s Emerging Technologies Program ET13PGE8052
The time subscript (t) is included to account for the fact that: (1) UEC and UES values can be computed for a range of different time periods (e.g., monthly, quarterly, yearly, etc.), and (2) in the scaled up RPP Program, UES estimates will need to be recomputed periodically. UES values are likely to change over time as either retailers’ product assortments change (for products where the UES values estimated at the model-level), or the other sources of data such as DEER or secondary information is updated (for products where the UES is computed at the measure-level). As a result periodic re-computation of the UEC and UES values will be warranted. In general, we recommend that they be computed at the beginning of the Trial period based on the historical sales data that will be provided by the participating retailers, and held constant for a one-year period. For this evaluation, however, since the trial ran for a total of 14 months, we hold the UES values constant for all 14 months.
PRELIMINARY EX POST GROSS PROGRAM ENERGY SAVINGS Preliminary ex post gross program energy savings15 are derived by multiplying the UES, in kilowatt-hours (kWh), for a product subcategory (p) and time period (t) by the total number of units sold (Q) for that product subcategory and time period and then summing across all subcategories across all products, as shown in Equation 3.
EQUATION 3: PRELIMINARY EX POST GROSS PROGRAM SAVINGS
𝑃𝑟𝑒𝑙𝑖𝑚𝑖𝑛𝑎𝑟𝑦 𝐸𝑥 𝑃𝑜𝑠𝑡 𝐺𝑟𝑜𝑠𝑠 𝑃𝑟𝑜𝑔𝑟𝑎𝑚 𝐸𝑛𝑒𝑟𝑔𝑦 𝑆𝑎𝑣𝑖𝑛𝑔𝑠 = (𝑈𝐸𝑆!,! × 𝑄!,!)
UNIT DEMAND REDUCTION (UDR) In addition to energy savings, the RPP Program will also result in demand reductions that will be claimed by PG&E. In order to estimate unit demand reduction (UDR), peak coincident factors (CF) will be derived for each product subcategory (p) as well as the average kilowatt (kW) peak demand for non-qualified models and the average kilowatt (kW) peak demand for qualified models for the product subcategory for a specific time period (t). This calculation is shown in Equation 4.
EQUATION 4: UNIT DEMAND REDUCTION (UDR)
𝑈𝐷𝑅!,! = (𝐶𝐹! 𝑥 𝑘𝑊!"#!!"#$%&%'(!,!) − (𝐶𝐹! 𝑥 𝑘𝑊!"#$%&%'(!,!)
PRELIMINARY EX POST GROSS PROGRAM DEMAND SAVINGS Preliminary ex post gross program demand savings will be derived by multiplying the UDR, in kilowatts (kW), for a product subcategory (p) and time period (t) by the total number of units sold (Q) for that product subcategory and time period and then summing across all subcategories, as shown in Equation 5.
EQUATION 5: PRELIMINARY EX POST GROSS PROGRAM DEMAND REDUCTION
𝑃𝑟𝑒𝑙𝑖𝑚𝑖𝑛𝑎𝑟𝑦 𝐸𝑥 𝑃𝑜𝑠𝑡 𝐺𝑟𝑜𝑠𝑠 𝑃𝑟𝑜𝑔𝑟𝑎𝑚 𝐷𝑒𝑚𝑎𝑛𝑑 𝑅𝑒𝑑𝑢𝑐𝑡𝑖𝑜𝑛 = (𝑈𝐷𝑅!,! × 𝑄!,!)
15 Note that for the purposes of this evaluation, we refer to this as “preliminary ex post” savings because this report does not represent the official CPUC-ED ex post evaluation of the program.

32
PG&E’s Emerging Technologies Program ET13PGE8052
Table 11 shows the UES and UDR values for the products included in the RPP Trial, indicating what UES method was used to develop the UES values. The table also distinguishes between UEC product class and RPP product class. For products contained in the DEER database, the UEC product class is analogous to the DEER product class. Gross energy and demand savings are computed at the UEC product class levels. However, the UEC product classes are quite numerous and rather specific for the home appliances, and sales volumes in some UEC classes were quite sparse. The RPP product classes were developed to facilitate other analyses that do not rely on energy or demand savings (e.g., PQS analyses), by aggregating similar sizes (for refrigerators) or types (for freezers) of products to ensure their were an adequate number of sales in each class to conduct meaningful analyses.
TABLE 11: UES VALUES FOR RPP TRIAL PRODUCTS
Product Category UEC Product Class
RPP Product Class
UES UEC/UES METHOD kWh kW
Air Cleaner <100 CADR <100 CADR 114.43910 0.01293 Model-Level
DVD/Blu-Ray Blu-Ray Blu-Ray 4.80000 0.00005 Measure-Level
DVD/Blu-Ray DVD DVD 5.90000 0.00013 Measure-Level
HTiB Sound bar Sound bar 52.60000 0.00065 Measure-Level
Freezer Frzr-Chest-ManDef_Large Chest 18.60000 0.00330 DEER
Refrigerator Refg-All_CmpMini Compact 20.80000 0.00380 DEER
Refrigerator RefgFrz-BM_VLarge Very Large 52.90000 0.00950 DEER
Refrigerator RefgFrz-BM-Ice_VLarge Very Large 59.90000 0.01080 DEER
Refrigerator RefgFrz-SM-TTD_VLarge Very Large 62.50000 0.01130 DEER
Refrigerator RefgFrz-TM_CmpMini Compact 33.00000 0.00590 DEER
Refrigerator RefgFrz-TM_Med Medium 35.90000 0.00670 DEER
Refrigerator RefgFrz-TM_VLarge Very Large 41.00000 0.00760 DEER
Room AC <12,000 BTU <12,000 BTU 69.97494 0.03296 Model-Level
IMPACT EVALUATION METHODS Recall that one of the main evaluation objectives of this study was to assess different methods and approaches for conducting the evaluation to make recommendations regarding those methods that have promise for evaluating a larger-scale implementation of the RPP Program in the future, especially in terms of assessing program effects and energy and demand impacts. As such, in addition to the various process evaluation methods already discussed, an array of different quasi-experimental approaches were also used to assess the sales data and conduct the impact evaluation. A true experimental design is often considered the most rigorous of all research designs. A well-designed and correctly implemented experiment allows researchers to control for factors potentially affecting the outcomes of interest (i.e., PQS) by randomly assigning subjects to a treatment group (or in this case, the RPP Program) and to a control group that does not receive the treatment (i.e., nonparticipating retailers or nonparticipating

33
PG&E’s Emerging Technologies Program ET13PGE8052
stores for participating retailers). If designed well and certain constraints are upheld, any statistically significant differences in the PQS between the participating and nonparticipating retailers/stores at the end of the program should be attributable to the program. However, the strength and validity of an experiment is highly dependent on certain design-related factors, the most important being the ability to randomly assign retailers/stores to treatment and control groups. In the case of the RPP Trial, there was no way to randomly assign retailers to treatment and control groups since there was only one retailer. Random assignment of the stores for this one retailer to treatment and control groups was considered, but was ultimately deemed impractical by the retailer. That said, given it was not possible to implement a true controlled experimental design for the trial, a variety of quasi-experimental designs were assessed in an attempt to control for the effects of history. The main distinction between a true experimental design and a quasi-experimental design is that under a quasi-experimental design the treatment and control cases are not randomly assigned. Instead, the control or comparison group is composed of a set of cases that are deemed comparable to the treatment cases by the researchers. For the purposes of this evaluation, two types of comparison groups were defined: (1) a quasi-experimental pre-post participant-only design where the pre, or historical, period served as the control, and (2) a quasi-experimental comparison group design where the all of the participating retailer’s nonparticipating stores throughout the State of California served as the control.16 More specifically, as part of this trial evaluation, the evaluation team included four types of quasi-experimental designs (each discussed in more detail in the following sections) aimed at estimating net program effects on PQS. The first, and simplest approach was a standard difference-in-differences analysis that compared both participating and nonparticipating stores historical PQS values to their trial-period PQS values. The difference between the two groups differences were the estimated net program effects. The second, and simplest modeling approach was a participant-only pre-post forecasted PQS baseline approach, where the historical period was used to forecast a PQS baseline, which was then compared to the actual PQS values during the trial period. The difference between the forecasted baseline and the actual PQS values over the trial period were the net program effects on the PQS. The third, more sophisticated approach was a quasi-experimental participant-only regression with the PQS as the dependent variable, where the entire series (both historical and trial period) was used to develop a regression model predicting the PQS, and the predicted PQS values were then computed with two versions of the model: (1) with the program, and (2) without the program. The predicted PQS estimates from both versions of the model were then compared in order to estimate net program effects on PQS. The final approach, a comparison-based PQS regression approach, was added at the request of the CPUC-ED. This latter approach involved developing PQS regression models incorporating the entire series, with the models including a variable that distinguished between participating and nonparticipating stores. 16 The evaluation team also looked at nonparticipating stores only in the PG&E service territory as an additional basis for comparison. However, preliminary analysis revealed the nonparticipating stores within the service territory were not substantively different from all the nonparticipating stores in the state. Since the comparisons using the statewide nonparticipating stores provides a much larger number of stores for our analyses, and thus more robust analyses, the results from the within service territory comparisons have been excluded but can be provided upon request.

34
PG&E’s Emerging Technologies Program ET13PGE8052
The predicted PQS values were then estimated using the model with the participation variable “on” to derive participating store estimated PQS values, and again with the participation variable turned “off” to derive nonparticipating store estimated PQS values. The difference between these predicted values was the net program effects on PQS. It is important to emphasize that in future years, such a comparative design using participating retailers’ nonparticipating stores will likely be impossible since most—if not all—of the participating retailers’ stores in the state will likely be participating in the program. Further, as the RPP Program is expected to have influence on nonparticipating stores outside of California as well, participating retailers’ nonparticipating store data from outside the state might also be of questionable value in assessing program impacts. The evaluation team is assessing other potential comparison group designs for future year’s evaluations of the RPP Program, but these are outside of the scope of this evaluation report.17 Before proceeding to a detailed discussion of each of the quasi-experimental approaches, it is also worth emphasizing that the descriptions of the approaches as they are presented herein represent “idealized” examples intended to best illustrate and describe the methods. In all the examples shown, the PQS regressions and/or depictions of actual plotted sales data are presented as increasing steadily and continuously over time. In reality, this consistently increasing trend is not the case with the retailer sales data or the findings presented in the Results chapter. In general, in the short-term (i.e., retailers’ first year or two in the program), retailers will not yet have had the opportunity to make significant alterations to their product assortment, and the main types of interventions at play will be three of the Marketing 4Ps – price, placement, and promotion (the fourth being product, which represents assortment changes). “Price” will be reflected in sale pricing (or possibly reward point programs); “placement” will be reflected in improved product displays on the sales floor; “promotion” will reflect signage or other actions aimed at increasing customers’ awareness of the program-qualified products. Notably, all three of these activities can be “turned on” and “turned off” at different times, which result in increases and decreases in the underlying PQS. For example, a special promotional price may be offered in January and February and, as a result, the plot of the PQS values may increase over this two-month period. However, if the sale pricing concludes at the end of February and another marketing or promotional strategy is not implemented to replace it, the PQS is likely to decrease in March. In addition, since PQS represents the proportion of all units sold that were program-qualified, this metric is also sensitive to other promotions the retailer may implement aimed at selling non-qualified products during the same time period. For example, the retailer may offer sale pricing on a particular model of energy efficient air cleaner for a month, which, other things being equal or held constant, should cause the PQS for air cleaners to increase. However, they may also offer similar sale pricing on a non-qualified 17 Other possible comparison groups could include nonparticipating retailer sales data (either within the state or outside the state), but obtaining the needed sales data from nonparticipating retailers is unlikely to happen. Other sources of data such as the NPD Group and/or the Association of Home Appliance Manufacturers (AHAM) are also being considered, but it is not clear if these will be available at the level of granularity needed to facilitate useful comparisons or at a cost that is feasible.

35
PG&E’s Emerging Technologies Program ET13PGE8052
air cleaner model during the same period, which could dampen or even entirely offset the PQS gains for that month. That all said, even though there are challenges to assessing program effects and impacts in the short-term, the value of the regression modeling approaches as a tool for evaluating the RPP Program over the mid- to longer-term should not be discounted. Keep in mind that the RPP Program is a market transformation program that needs to be considered over a several-year time frame. Substantial and statistically detectable impacts are more likely as the retailers increase their assortment of program-qualified models each year. For example, a retailer’s assortment of program-qualified might be 5% in year one, 10% in year two, 15% in year three, and so on. In the short-run, because specific pricing, placement, or promotional activities aimed at both program-qualified and non-qualified models will begin and end at different times throughout the year, both the PQS and overall sales of program-qualified products will be highly variable. However in the mid- and long-term, as the assortment of program-qualified models increases (at the expense of non-qualified models), these metrics are expected to manifest a general upward trend. The remainder of the section presents the different approaches that the evaluation team used to analyze the retailer sales data.
DIFFERENCE-IN-DIFFERENCES ANALYSIS The first analysis conducted was a simple difference-in-differences (DID) analysis of the PQS for each of the targeted product categories, comparing the historical PQS values to the trial-period PQS values. The DID equation is shown in Equation 6.
EQUATION 6: DIFFERENCE-IN-DIFFERENCES CALCULATION
𝐷𝐼𝐷 = 𝑃𝑄𝑆! ,!"#$ − 𝑃𝑄𝑆!,!"# − (𝑃𝑄𝑆!" ,!"#$ − 𝑃𝑄𝑆!",!"#) For the participating stores, the mean PQS in the pre-program (historical) period was subtracted from the mean PQS in the post-trial period. The same calculation was done for the nonparticipating stores. The difference between these two PQS differences equals the net impact of the RPP Program. Since under this approach the PQS values were based on aggregate sales volumes for each of the time periods, they do not account for the notable month-to-month variability that occurred throughout the series, and they do not capture the unique effects of each marketing intervention. Nevertheless, they provide a coarse indication of change that is useful for providing insights into program effects.
QUASI-EXPERIMENTAL PARTICIPANT-ONLY PRE-POST FORECASTED PQS
BASELINE TO ACTUAL DATA The simplest quasi-experimental modeling approach to assessing program effects involves using only the participating stores and their historical data series to forecast a counterfactual PQS baseline for each targeted product category class over the trial period. These forecasted baselines are then compared to the actual, recorded trial-period sales data. Figure 5 illustrates this approach.

36
PG&E’s Emerging Technologies Program ET13PGE8052
FIGURE 5: ILLUSTRATION OF QUASI-EXPERIMENTAL PARTICIPANT-ONLY PRE-POST FORECASTED PQS BASELINE TO RECORDED DATA
The difference between the sales-weighted average actual trial-period PQS over the 14-month trial period and the forecasted PQS over the same period is an estimate of the net effect of the program. Note that the sales weighting facilitates the computation of a single mean trial-period PQS across the 14 months of the trial period, which is used to compare against the forecasted PQS baseline to estimate net effects. For each product class, the general functional form of the model that was used to forecast the baseline over the 14-month trial period as a function of time was an exponential smoothing technique, which is a procedure for continually revising a forecast in the light of more recent experience, as shown in Equation 7.
EQUATION 7: FORECASTED PQS BASELINE
F!!! = AX! + (1 − A)F! Where:
FT+1 = Forecasted value for the next period A = Smoothing constant (0 ≤ A ≤ 1) XT = Actual value of series in period T FT = Average experience of series smoothed to period T or
forecasted value for last period The evaluation team used the software package Forecast Pro to develop the forecasts. Because of the extensive variability in the historical data series, Forecast Pro was unable to detect any seasonal or trend effects in any of the targeted product class data sets. As such, the best forecasts possible using the exponential smoothing technique essentially predict the forecasted PQS baseline as the value of the last month’s PQS prior to the trial period.
Net Effects
Forecasted PQS
Actual PQS
Program Intervention
PQS
Historical Period Program Period

37
PG&E’s Emerging Technologies Program ET13PGE8052
QUASI-EXPERIMENTAL INTERRUPTED TIME-SERIES ANALYSES The other more sophisticated approach that is used to assess the influence of the program on PQS is a quasi-experimental design using interrupted time-series regressions. This approach involved coding the retailer’s program-related promotional activities (e.g., price reductions, promotional activities, etc.), into the comprehensive sales data files (including both the historical and trial periods) to be able to assess, through regression techniques, the incremental effect of the various interventions periods. Recall that the sales data was first processed so that each row represented the total sales volume of a particular model sold at a particular store in a particular month. Separate files were developed for each targeted product class. The files also contained variables indicating whether the store was participating or nonparticipating, and whether the model was program-qualified or non-qualified. For modeling purposes, the files were further processed so that each row of the analysis files represented the PQS for a particular month for participating and nonparticipating stores. As such, each file contained 70 cases – two cases (one for participating stores; one for nonparticipating stores) per month (ranging from February 2012 to December 2014). The only exceptions to this were the final compact refrigerator file, which had only 66 cases (33 months of historical data; 33 months of trial-period data), because in two months participating stores recorded no sales, and the same months in the historical period were removed to facilitate modeling. Also, the room air conditioner file contained 64 cases (32 months of historical data; 32 months of trial-period data), because in three months participating stores recorded no sales, and the same months in the historical period were removed In terms of coding the program activities, the evaluation team assessed several different approaches. Our first approach to coding the activities was aimed at including variables denoting each and every activity and when it occurred in order to provide the greatest degree of insight into the differential effects of the individual marketing strategies. However, many of the marketing activities implemented by the retailer occurred in conjunction with each other, which introduced collinearity into the models. For example, a promotional flyer (an activity in itself) would typically promote a certain product at a sale price (another activity) and offer promotional signage (yet another activity) for the product while it was on sale. Further, a product was never promoted via a flyer without a sale price (or rewards points) and signage; bulk stacks were never conducted without sale pricing and signage. In order to avoid introducing collinearity into the models, the evaluation team revised the coding scheme to focus on coding periods of promotions. For example, if a flyer (with its associated sale pricing and signage) was implemented for a product in March 2014, the month was coded as 1, or 0 otherwise. Using these analysis files, the evaluation team conducted two types of interrupted time-series regression analyses with the RPP Trial data. The first was a participant-only design, which only included data from the retailer’s participating stores; the second was a comparison group design, which contrasted the retailer’s participating stores against all their nonparticipating stores statewide.
QUASI-EXPERIMENTAL PARTICIPANT-ONLY INTERRUPTED TIME-SERIES Figure 6 illustrates an idealized example of the participant-only approach, showing how the slope of the regression might change once the intervention begins and certain promotional activities are implemented (the vertical line labeled Intervention 1), and

38
PG&E’s Emerging Technologies Program ET13PGE8052
again once an additional intervention activity is implemented (labeled Intervention 2). For example, depending on the retailer’s implementation strategy, the slope of segment B may be different than the slope of segment A due to in-store advertising associated with the program; the slope of segment C might be different than the slopes of segments A or B due to the addition of new program-qualified models into the assortment.
FIGURE 6: ILLUSTRATION OF IDEALIZED QUASI-EXPERIMENTAL PARTICIPANT-ONLY PQS REGRESSION
Two model forms were tested, including a modified step regression18 and a full segmented regression. For this evaluation, separate models were developed for each targeted product class incorporating the specific intervention activities that took place during the RPP Trial. The general form of the participant-only modified step regression model used for this evaluation is illustrated in Equation 8:
EQUATION 8: QUASI-EXPERIMENTAL PARTICIPANT-ONLY PQS MODIFIED STEP REGRESSION
𝑌! = 𝛽! + 𝛽!𝑇𝑖𝑚𝑒! + β!𝐼𝑛𝑡𝑒𝑟𝑣𝑒𝑛𝑡𝑖𝑜𝑛!,! + ε! Where:
𝑌t= PQS in month t 𝑇𝑖𝑚𝑒t = Continuous variable indicating the number of months from the start of the historical
series 𝐼𝑛𝑡𝑒𝑟𝑣𝑒𝑛𝑡𝑖𝑜𝑛t,i = Indicator variable that takes the value 0 in the pre-intervention period and
1 in the months the intervention(s) was/were in effect 𝛽0 = Intercept 𝛽1 = Estimate of the change in the monthly PQS due to the passage of time 𝛽! = Estimates the change in level of the PQS due to the intervention
18 The term “modified step regression” used throughout this report signifies a regression model of the traditional step form (i.e., a basic staircase form), but which also incorporates an additional variable that captures trend in the overall data series, so that the fitted regression is not entirely flat, or parallel to the x-axis (for example, see Figure 11 and Figure 13).
Intervention 1
PQS A
B
CParticipating
Stores
Intervention 2
Historical Period Program Period

39
PG&E’s Emerging Technologies Program ET13PGE8052
ε! = Estimates the error
The general model form can be extended to add more interventions, as depicted in Figure 6. The evaluation team estimated separate models for each of the targeted product classes. Once the models were estimated, they were evaluated with and without the program. The model with the program was shown in Equation 8. The model used to estimate the without-program condition is shown in Equation 9:
EQUATION 9: QUASI-EXPERIMENTAL PARTICIPANT-ONLY PRE-POST PQS MODIFIED STEP REGRESSION – WITHOUT PROGRAM
𝑌! = 𝛽! + 𝛽!Time! The difference between Equation 8 and Equation 9 represents the net reduction in the PQS. The general form of the participant-only segmented regression model used for this evaluation is illustrated in Equation 10:
EQUATION 10: QUASI-EXPERIMENTAL PARTICIPANT-ONLY PQS SEGMENTED REGRESSION
𝑌! = 𝛽! + 𝛽!𝑇𝑖𝑚𝑒! + 𝛽!𝐼𝑛𝑡𝑒𝑟𝑣𝑒𝑛𝑡𝑖𝑜𝑛!,! + β!Time_After_ 𝐼𝑛𝑡𝑒𝑟𝑣𝑛𝑒𝑡𝑖𝑜𝑛!,! + ε! Where:
𝑌t= PQS in month t 𝑇𝑖𝑚𝑒t = Continuous variable indicating the number of months from the start of the historical
series 𝐼𝑛𝑡𝑒𝑟𝑣𝑒𝑛𝑡𝑖𝑜𝑛t,i = Indicator variable that takes the value 0 in the pre-intervention period and
1 in the months the intervention(s) was/were in effect 𝑇𝑖𝑚𝑒_𝐴𝑓𝑡𝑒𝑟_𝐼𝑛𝑡𝑒𝑟𝑣𝑒𝑛𝑡𝑖𝑜𝑛t,i = Continuous variable indicating the number of months from the
start of an intervention period 𝛽0 = Intercept 𝛽1 = Estimate of the change in the monthly PQS due to the passage of time 𝛽!= Estimates the change in level of the PQS due to the intervention β! = Estimates the change in trend of the PQS due to the intervention ε! = Estimates the error
Like with the modified step regression, the basic model form for the segmented regression shown above can be extended to add more intervention variables (with their associated interactions) to assess incremental change due to interventions in effect at different time periods during the trial. Once the models were estimated, they were evaluated with and without the program. The model with the program was shown in Equation 10; the model used to estimate the without-program condition is shown in Equation 11:
EQUATION 11: QUASI-EXPERIMENTAL PARTICIPANT-ONLY PQS SEGMENTED REGRESSION – WITHOUT PROGRAM
𝑌! = 𝛽! + 𝛽!Time!

40
PG&E’s Emerging Technologies Program ET13PGE8052
The difference between Equation 8 and Equation 9 represents the net reduction in the PQS.
QUASI-EXPERIMENTAL INTERRUPTED TIME-SERIES WITH COMPARISON GROUP Any non-equivalent control group design will have compositional differences between the control and treatment groups. Evaluators have tried to control for these differences in two basic ways: (1) matching control cases to intervention cases on key variables, and (2) introducing covariates into the models to control statistically for these differences. Both approaches were carefully considered, but ultimately found to be infeasible for this evaluation. The stores across the state are all quite similar in terms of store characteristics (e.g., size, number of employees, etc.), so matching on store type was unnecessary. The evaluation team was unable to get zip codes representing the individual store catchment areas, so the use of census information (e.g., household income, educational attainment, home ownership rate, etc.) was not possible. As such, we did not conduct any matching and did not introduce any covariates into the comparison group models. An idealized depiction of the comparison group approach is represented in Figure 7. This figure shows how, similar to the participant-only approach, interrupted time-series are used to detect changes in the slopes of different segments of the regression. However, this approach distinguishes between the participating and nonparticipating stores by incorporating additional variables into the models.
FIGURE 7: ILLUSTRATION OF SEGMENTED REGRESSION APPROACH WITH TREATMENT AND CONTROL GROUPS
The general form of the modified step regression model with the comparison group used for this evaluation is illustrated in Equation 12:
EQUATION 12: QUASI-EXPERIMENTAL PQS MODIFIED STEP REGRESSION WITH COMPARISON GROUP
𝑌! = 𝛽! + 𝛽!𝑇𝑖𝑚𝑒! + 𝛽!𝑃𝑎𝑟𝑡 + 𝛽!𝐼𝑛𝑡𝑒𝑟𝑣𝑒𝑛𝑡𝑖𝑜𝑛!,! + β!𝑃𝑎𝑟𝑡 𝑥 𝐼𝑛𝑡𝑒𝑟𝑣𝑒𝑛𝑡𝑖𝑜𝑛 + ε! Where:
Intervention 1
Historical Period
PQS A
B
C
Nonparticipating Stores
Participating Stores
D
E
Intervention 2
Program Period
Net Effects

41
PG&E’s Emerging Technologies Program ET13PGE8052
𝑌t= PQS in month t 𝑇𝑖𝑚𝑒t = Continuous variable indicating the number of months from the start of the historical
series 𝑃𝑎𝑟𝑡 = Indicator variable that takes the value 1 for participating stores and 0 for
nonparticipating stores. Represents the historical difference between participating and nonparticipating stores
𝐼𝑛𝑡𝑒𝑟𝑣𝑒𝑛𝑡𝑖𝑜𝑛t,i = Indicator variable that takes the value 0 in the pre-intervention period and 1 in the months the intervention(s) was/were in effect
𝑃𝑎𝑟𝑡 𝑥 𝐼𝑛𝑡𝑒𝑟𝑣𝑒𝑛𝑡𝑖𝑜𝑛t,i = Interaction of group membership and intervention 𝛽0 = Intercept 𝛽1 = The change in the PQS per month due to the passage of time 𝛽2 = Estimates the inherent difference between the participant and nonparticipant groups
that is not a function of the program19 𝛽!= The change in level of the PQS at time t for intervention i only at the time of the
intervention 𝛽! = The incremental change in level of the PQS at time t for intervention i due to being in
the treatment group (i.e., a participating store) ε! = Estimates the error
As with the other models, the general form of the model can be extended to add additional intervention periods. The net effects are computed as the difference in the average predicted values for the 14-month trial period between participating and nonparticipating stores. The general form of the segmented regression model with comparison group used for this evaluation is illustrated in Equation 13:
EQUATION 13: QUASI-EXPERIMENTAL PQS SEGMENTED REGRESSION WITH COMPARISON GROUP
𝑌! = 𝛽! + 𝛽!𝑇𝑖𝑚𝑒! + 𝛽!𝑃𝑎𝑟𝑡 + 𝛽!𝐼𝑛𝑡𝑒𝑟𝑣𝑒𝑛𝑡𝑖𝑜𝑛!,!+ 𝛽!𝑇𝑖𝑚𝑒_𝐴𝑓𝑡𝑒𝑟_𝐼𝑛𝑡𝑒𝑟𝑣𝑒𝑛𝑡𝑖𝑜𝑛!,! + 𝛽!𝑃𝑎𝑟𝑡 x 𝐼𝑛𝑡𝑒𝑟𝑣𝑒𝑛𝑡𝑖𝑜𝑛!,! + 𝛽!𝑃𝑎𝑟𝑡 𝑥 𝑇𝑖𝑚𝑒! + ε!
Where:
𝑌t= PQS in month t 𝑇𝑖𝑚𝑒t = Continuous variable indicating the number of months from the start of the historical
series 𝑃𝑎𝑟𝑡 = Indicator variable that takes the value 1 for participating stores and 0 for
nonparticipating stores. Represents the historical difference between participating and nonparticipating stores
𝐼𝑛𝑡𝑒𝑟𝑣𝑒𝑛𝑡𝑖𝑜𝑛t,i = Indicator variable that takes the value 0 in the pre-intervention period and 1 in the months the intervention(s) was/were in effect
𝑇𝑖𝑚𝑒_𝐴𝑓𝑡𝑒𝑟_𝐼𝑛𝑡𝑒𝑟𝑣𝑒𝑛𝑡𝑖𝑜𝑛t,i = Continuous variable indicating the number of months from the start of an intervention period, which captures the lingering effects of an intervention
𝑃𝑎𝑟𝑡 𝑥 𝐼𝑛𝑡𝑒𝑟𝑣𝑒𝑛𝑡𝑖𝑜𝑛t,i = Interaction of group membership and intervention
19 The values of the β2 coefficients in the models are also informative as they illustrate the potential self-selection bias due to non-randomly assigning the stores to the participant and nonparticipant groups. In many cases the PQS values for the participating stores exceed those for the nonparticipating stores throughout the historical periods, suggesting that at least some participating stores were already selling a greater proportion of energy efficient products before the program began.

42
PG&E’s Emerging Technologies Program ET13PGE8052
𝑃𝑎𝑟𝑡 𝑥 𝑇𝑖𝑚𝑒! = Interaction of month and intervention 𝛽0 = Intercept 𝛽1 = The change in the PQS per month due to the passage of time 𝛽2 = Estimates the inherent difference between the participant and nonparticipant groups
that is not a function of the program 𝛽! = The change in level of the PQS at time t for intervention i only at the time of the
intervention 𝛽! = The change in trend of the PQS in the post-intervention segment 𝛽! = The incremental change in level of the PQS at time t for intervention i due to being in
the treatment group (i.e., a participating store) 𝛽! = Estimates the change in trend of the PQS in the post-intervention segment due to
being in the treatment group (i.e., a participating store) ε! = Estimates the error
The net effects are computed as the difference in the average predicted values for the 14-month trial period between participating and nonparticipating stores.
A NOTE ON CONFIDENCE INTERVALS AND STATISTICAL SIGNIFICANCE
When conducting the modeling, it is important to emphasize that we were working with the full census of the participating retailer’s stores in the State of California. That is, no sampling was conducted; we worked with the population. As such, results from the models (other than the forecasted baseline) do not have confidence intervals around them and any coefficients are what they are (i.e., no statistical testing is applicable to assess whether the values are different from some other hypothesized value).

43
PG&E’s Emerging Technologies Program ET13PGE8052
RESULTS This chapter of the report presents the main evaluation findings. It begins by discussing the process evaluation results, and concludes with the impact evaluation results.
PROCESS EVALUATION RESULTS
INTERVIEWS/SURVEYS This section of the RPP Trial evaluation report summarizes findings from the interviews and surveys conducted with program stakeholders, including retailer merchants (buyers) and marketers, the retailer corporate leadership team, retailer store managers, the program implementation team, and PG&E RPP Program staff.
RETAILER MERCHANTS/MARKETING MANAGER INTERVIEWS In February 2014 (baseline), the evaluation team conducted a telephone-based in-depth team interview with the retailer’s home appliance buyer and marketing planning manager. Of the RPP Trial product categories, these staff members were responsible for refrigerators, freezers, room air conditioners, and air cleaners. Both of these staff members were interviewed at the same time. At baseline, we were unable to gain access to the buyer or marketing manager of the consumer electronics categories that included DVD/Blu-Ray players and sound bars. In March 2015 (follow-up), we conducted a telephone-based in-depth interview with the home appliance buyer. This was not the same buyer that was interviewed at baseline as the retailer experienced some staff changes during the trial period. The home appliance buyer interviewed at follow-up was the senior buyer for appliances and was responsible for refrigerators and freezers (a different buyer was responsible for air cleaners and room air conditioners, but this person was new and had little to no knowledge of the program, so was not interviewed). In March 2015, we also conducted a telephone-based in-depth interview with the current consumer electronics buyer. Due to staffing changes at the retailer, this buyer was only involved with the RPP Trial for the second half of the trial period. When preparing for the follow-up interviews, the evaluation team was informed that the marketing manager(s) had little on-going responsibility with the program, so they were not interviewed at follow-up.
Interviewee Roles and Responsibilities
The marketing planning manager described her role as focused on deciding the best way to spend marketing dollars. More specifically related to the RPP Trial, the marketing planning manager reported they work with the appliance buyer, the consumer electronics staff, and the retailer’s corporate Green Leadership Team to decide how to best spend the allotted funds for the trial. Their focus is on finding “the best way to get the word out about ENERGY STAR and what makes sense to the customer. Not just throw money around; try to make sure it’s more impactful than just talking to associates once in a awhile.” For example, they were interested in making sure the flyers are something that could help the associates talk to the customer, but also something the customers could use on their own.

44
PG&E’s Emerging Technologies Program ET13PGE8052
The buyers all indicated they were responsible for determining which products to stock and how to price them. More specific to the RPP Trial, the buyers worked with corporate leadership by focusing on the products. However, the buyers noted that the leadership team probably drove them more than they drove the leadership team. “They’ll let me know about rebates or offers coming from utilities, and then I’ll try to understand how that impacts my products and how I can leverage those funds.”
RPP Trial Awareness
At baseline, both the home appliance buyer and marketing manager were aware of the RPP Program by name. When asked to describe the program, the buyer stated: “I know that there is some sort of rebate to [the retailer] given as long as they’re participating and promoting some sort of ENERGY STAR appliances. Doesn’t have to be price, but that’s what they’re working towards at the moment.” When asked if there were any aspects of the program that were not clear, the buyer replied: “Probably, but “I don’t know what I don’t know.” At follow-up, both the home appliance and the consumer electronics buyers we spoke with were very well informed about the RPP Program. The appliance buyer was able to provide significant detail about how the program was designed and implemented, and was able to provide model-specific information about promotions and sales. The consumer electronics buyer also understood the program design and product promotions, but commented that in the beginning “she was not aware of which product lines and models were energy efficient.”
Product Purchasing Logistics
At baseline, we asked the home appliance buyer to walk us through the purchasing process. She responded that the individual product buyers put together purchasing plans and pitch them the buying manager. The individual buyers are the ones responsible for interacting with manufacturers, and once their plans are approved, are the ones that submit the final order. In general, orders are filled and shipped to the retailer’s distribution centers, which are spread throughout the country, with each center serving a particular region.20 The appliance buyer indicated they can distribute products at a pretty granular level. For example, they can distribute different models to inner-city locations as compared to suburban locations. To determine how products are to be distributed, they predominantly focus on historical sales. The consumer electronics buyer confirmed that the amount of units distributed to each store depends on the historical store purchasing traffic. However, there are often other considerations, such as regional demographics, and when a store is located close to a larger competitor who stocks more products, they may go with a smaller assortment because they know they cannot likely compete based on selection. On the flip side, if they have a location where there is not a nearby competitor, they might go with a larger assortment of products in a category.
Product Purchasing Decisions
The evaluation team also asked the corporate buyers about the factors that drive their product purchase decisions. They responded that price is absolutely the most 20 This can actually be a bit more complicated for larger appliances as they often go to direct delivery centers, which then ship to the regional distribution centers.

45
PG&E’s Emerging Technologies Program ET13PGE8052
important consideration when deciding to assort a product. According to the appliance buyer, this is not just a corporate concern in terms of profits, but it is also their particular target customer population: “All they want is the cheapest thing.” The consumer electronics buyer agreed that it is “price that drives everything.” The buyers felt there are certain times they can get customers to buy up, but it’s few and far between. They indicated they have a few places where they have commissioned sales associates, so they can leverage these staff to talk to the consumer. While brand may be a significant factor at many retailers, the buyer indicated that in terms of home appliances, they focus most of their efforts on one particular brand. When asked how much the energy efficiency or energy consumption of the products they sell affects their buying decisions, the buyer responded “not very.”
Product Promotion Decisions
The evaluation team asked the marketing manager how they decide which products to promote. They stated that the buyer typically determines the promotions decisions. However, the marketing manager then works with the buyer to execute the promotion (except for pricing—which is driven by the buyer). If it’s something in a flyer or an email, the marketing manager might work with the other marketing people to get something out. Nevertheless, the buyer makes the final call on all of it. During the follow-up interviews, the home appliance buyer indicated he drove the entire fall promotion. The corporate leadership team provided input into what they generally wanted to do and when, but the buyer made the final decisions. Here, however, he suggested that the small scale of the trial made promotional decisions and planning somewhat of an onerous task. Typically, the retailer conducts most of their promotions at the national level and much of the marketing efforts are conducted by marketing staff – and these are by far the most successful promotions. He had to manage the logistics of putting together specific promotional materials for a small set of stores in a limited geographic location, which was an added and time-consuming task for the buyer. The consumer electronics buyer reported very similar experiences and challenges. She explained that because of how marketing efforts are typically handled, it would have been easier to implement a national level program where expectations are consistent across all stores. She noted that two major challenges experienced with implementing the trial were inconsistent store executions of product pricing and that some promotional products did not arrive at stores until the beginning of the fourth quarter. At baseline, we also asked the home appliance buyer and marketing manager what types of promotional activities were used by the retailer, and which are generally most effective. They emphasized pricing, signage, and rewards points. They responded that any time they change the price of a product it will generate new signage. They’ve got key price points that work with different items. They also said that leveraging their rewards points system seems to work well with their customer population. At follow-up, the home appliance buyer reiterated that price mattered the most. However, he also stated he felt the bulk stack events and additional signage were quite effective at driving sales. The buyer also indicated he felt that in-store broadcasts were probably effective. Though he could not provide substantive evidence of the effect of the in-store broadcasts tied to the RPP Trial, he did provide some anecdotal

46
PG&E’s Emerging Technologies Program ET13PGE8052
evidence regarding some independent in-store broadcast he had developed for other promotions that he felt really provided a sales lift. When asked about the timing of promotional activities, they indicated that they typically set the promotion decisions/retailer implementation plan 4-5 months out – it is not something that happens all at once during the year. According to the consumer electronics buyer, having more communication out to the stores earlier in the pilot would have helped with their execution.
Energy Efficiency Awareness
The evaluation team asked a series of questions to probe the buyers’ awareness of the energy efficiency of the products they purchase and sell. At baseline, when asked if they were familiar with any energy efficiency metrics for the products you manage (e.g., UEC, kWh, BTUs, etc.), they said they were not. This did not change at follow-up. However, they indicated they were very familiar with Department of Energy standards, even being aware at baseline, unprompted, that a new standard was coming in 2014 for refrigerators and freezers. They also indicated they were aware of ENERGY STAR. That said, when asked if energy efficiency or energy consumption has been a consideration in purchasing or promotional decisions, both the appliance buyers and marketing manager responded that energy has not affected their decisions in the past. The consumer electronics buyer, who previously was in involved with TV purchases, also reported that energy efficiency did not impact purchasing decisions prior to the program. At follow-up, when asked how much the home appliance buyer now factors in the energy use or energy efficiency of a model into his buying decisions, he replied that it would likely factor in very little as they are still a price-point focused retailer. However, the consumer electronics buyer had an opposing view stating that now, since she is much more conscientious of ENERGY STAR and energy efficiency, she will be incorporating these both into future purchasing decisions. She indicated that there will not be any formal changes related to internal purchasing processes across the retailer, but she will be more aware of the availability of energy efficient products and options. The consumer electronics buyer also explained that the energy use of products is occasionally available, but not always. For example, the last time energy use was not available she had to reach out to someone at ENERGY STAR to check on several sound bars to see if they qualified.
Expected Impact of the Trial
When asked at baseline if the RPP Trial had caused them to make any changes in their plans to promote/purchase/assort/stock products for the coming year (2014), the home appliance buyer and marketing manager indicated it had not affected any purchasing decisions. However, they were offering a special discount of qualified refrigerators and freezers throughout the year (only in participating stores). However, they also stated they were working on additional promotional activities for the year and some decisions were still pending. At follow-up, the home appliance buyer indicated that a new model of ENERGY STAR refrigerator was added to their inventory as part of the RPP Trial. When

47
PG&E’s Emerging Technologies Program ET13PGE8052
asked if they would have added that product in the absence of the program, he responded “absolutely not.” The consumer electronics buyer did not mention the addition of any particular models due solely to the trial. Importantly, both at baseline and follow-up all buyers indicated that they would not have done anything related to promoting energy efficiency without the RPP Program. When asked if they expected the trial would affect their promotion, purchasing, assortment, stocking, and/or placement plans for next year (i.e., in the absence of the program), at baseline they said they would need to track how sales perform during the trial period and see how it’s doing. If they see some impact, they indicated they definitely will make some changes in purchasing/assorting, but otherwise they probably will not make any changes. Ultimately, they just have to make sure the customer is seeing the value. If energy usage is resonating, then that’s great, but if it’s not, they have to go back to price. On this point, the buyer also noted that it was very good that this is a relatively long trial and not something that is being implemented for just two weeks or a month. The longer duration is going to help them decide if the program is actually worthwhile. However, the buyer also indicated they would like it to be more stores. At follow-up, the home appliance buyer was a bit more direct about the issue of scale and reiterated several time during the interview that he felt the RPP Program had little chance of affecting the retailers decisions and behaviors over the longer term unless it was scaled up to national level. He emphasized that even though specific stocking decisions may vary from store to store, most of their purchasing decisions are made at the national level. Trying to purchase products for sale only in a small number of participating stores is not a simple task as their inventory and sales systems are not designed for this type of granularity. This is a perspective that the consumer electronics buyer wholly supported: purchasing for a single region instead of nationally is a challenge because it means that there are different store execution expectations. Also, since purchasing decisions are made based on profitability concerns, at a small scale, the effect of incentives can be “lost” in the bigger picture. An example offered by the appliance buyer was that while the retailer may gain incentives that can help rebalance the profitability equation and decision towards purchasing and stocking a more efficient model, if these incentives are only available for a small number of participating stores in a certain region, the incentives are unlikely to weigh very heavily in their final decision when making purchasing decisions at the national level.
Spillover of Program Interventions into Nonparticipating Stores
In order to understand possible spillover effects of promotional activities from participating to non-participating stores, we asked if any program-related activities were conducted in nonparticipating stores. The consumer electronics buyer reported that since promotions were solely focused on in-store methods (e.g., promotional flyers, in-store radio, etc.), there was likely not any promotional spillover. Likewise, the home appliance buyer at follow-up also indicated that none of the program-related promotions had occurred outside of the participating stores, with one exception. In mid-2014 a specific model of room air conditioner was sale-priced and promoted in participating stores through the program. A staff member committed a pricing error and inadvertently assigned the sale price nationally. The buyer was not certain on the details of when this happened or for how long the incorrect pricing persisted, but felt it was only a “few weeks at most.” Nevertheless, the retailer lost a

48
PG&E’s Emerging Technologies Program ET13PGE8052
substantial amount of money due to this mishap. He exemplified the fact that these are the types of errors they risk when the program is not occurring nationally.
Assessment of the RPP Trial
The evaluation team asked the buyers and marketing manager if they were involved with the development of the official retailer implementation plan that was part of the RPP Trial implementation at the retailer. At baseline, the buyer and marketing manager indicated that they were not. They believed the corporate leadership team developed the plan and told the buyer what prices to use. However, the marketing manager stated that she had met with the leadership team a few times to talk about the plan. At baseline, both the buyer and marketing manager were aware of some of the planned activities and promotions. However, they indicated that they did not think $5,000 of Marketing Development Funds (MDF) per store was a whole lot of money. It is not enough to cover something like radio advertising, so they were going with a strategy of making the buying process easier for customers: flyers, multiple flyers throughout the year for customers and associates, discount pricing, etc. At follow-up, the home appliance buyer indicated he was much more engaged with the retailer implementation plans and activities than the baseline interviewees indicated. He stated that he drove the whole fall promotion. He stated that while the corporate leadership team stated what they would like to do and when, the buyer made the final decisions. He put together the signage and directed marketing staff to put together other materials. The consumer electronics buyer expressed similar experiences and engagement with the retailer implementation plans and activities at follow-up. We also asked the interviewees if they thought there were additional activities or actions that could be implemented to drive the sales of qualified models that were not currently part of the program. At baseline, the interviewees mentioned that they felt that the more they could do to call attention to the products when customers walk by, the better. This can be done with effective signage. They also emphasized they felt additional associate training could help. “Call out the value to customer with on-product material and then get the sales associates to reinforce that message.” If they are doing this as a joint effort with consumer electronics, they could have a specified sales person, so they could give them some training about why ENERGY STAR is a good thing, what it does for the customers. They also felt that messaging around how much money the energy efficient models might save the customer would be useful: “Make it less of a guessing game.” At follow-up, both the home appliance and the consumer electronics buyers again emphasized the need for scale as means of better promoting the program, as they felt that national promotions are by far the most effective marketing strategy they use. They also suggested that web-based geo-targeting with emails or banners and other digital marketing could be useful, but again emphasized that it would need to be a big program to initiate these efforts.
Incentive Amounts/Timing
Both the buyers and marketing manager were aware of the incentive levels being paid to the retailer. At baseline, when asked if they felt the incentive levels were adequate to affect purchasing decisions, they said it was currently hard to say if the amounts are right until they can tell if sales are increasing. If it’s working, they need to

49
PG&E’s Emerging Technologies Program ET13PGE8052
dig down and figure out why. When asked if they felt the program design (i.e., paying the incentives to the retailer) was an effective motivator they agreed that it was.
RETAILER CORPORATE LEADERSHIP TEAM INTERVIEWS The evaluation team conducted telephone-based interviews with representatives of the retailer corporate leadership team at the beginning of the Trial (February 2014) and again after the Trial in March 2015.
Corporate Leadership Team Purpose
The retailer corporate leadership team is referred to as the “Green Leadership Team,” and is responsible for implementing environmental initiatives throughout the retailer’s business operations. These efforts are focused in two main areas: (1) sustainability, and (2) green leadership. The sustainability area has focused on making business operations more energy efficient and reducing the organizations environmental impacts (e.g., reducing energy consumption in facilities, recycling, waste management, etc.). The green leadership area has focused primarily on programs and products. It started roughly five years ago and until recently was mainly focused on managing rebate programs associated with federal or state governments (presumably as part of the American Recovery and Reinvestment Act of 2009) and utilities, but now this area’s core focus is managing relationships with utilities. The retailer is dedicated to its pro-environmental mission, and is an ENERGY STAR partner and has received the partner of the year award for the last four years in a row, and has recently received the titled of “Sustained Excellence”. That said, the team (across both areas) is very small. The exact number of staff is constantly in flux, but each area typically only has a couple staff, under the overall leadership a Vice President that oversees both area teams.
Corporate Leadership Team Role in RPP
Overall, the retailer’s corporate leadership team was responsible for developing, implementing, and overseeing their organization’s participation in the RPP Trial. They participated in the selection of product categories for targeting through the trial, helped lead the development of the retailer implementation plans and strategies in consultation with the merchants and marketing staff, initiated or facilitated communications with various external parties (e.g., the program implementer, ENERGY STAR, manufacturers, etc.) as needed, implemented the historical and trial-period data extracts provided for incentive tracking and evaluation purposes, and conducted other day-to-day program operations activities. During both the baseline and follow-up interviews the corporate leadership team members revealed a significant degree of motivation and personal interest in making the retailer’s participation in the trial succeed. They were genuinely excited about the program and its potential. They emphasized how they enjoyed identifying the internal key players and getting them all involved and in the same room to help make decisions—they considered this a key lesson-learned that will help aid future efforts. They also emphasized how much they have enjoyed working with the program implementation team, and their efforts to support the retailer and help them get the program launched.
Challenges in Implementing the RPP Program

50
PG&E’s Emerging Technologies Program ET13PGE8052
That all said, they also highlighted some of the challenges they have faced in implementing the trial. One of the biggest challenges they discussed was the fact the retailer had shifting corporate staff and staff on-leave. The consumer electronics merchant and one of the key marketing staff went on leave, and the home appliance merchant position shift to a new staff person (which happened by the end of the Trial). This made planning and making consistent and continued progress difficult. Another area that came up as a challenge was that because the trial only included 26 participating stores, it was costly and time consuming to manage in relation to their potential return. They did not have existing processes and protocols developed to support implementation of a program like this, and much of the activities were created on an as-needed basis to meet immediate needs. They emphasized both at baseline and follow-up that they had spent a lot of time on making sure this trial was operating, and the costs of doing so were not likely in their favor. However, they understood that this was a trial and that an expanded scale would likely help alleviate this issue – at east to some degree as they also recognized that other issues would likely arise with increased scale. The third area that they mentioned was a significant challenge was fulfilling the data requests. Due to the small scale of the trial, they conducted the data extracts (in contrast to and IT Department staff), and these were very time consuming. They were not aware of all the data needs up-front, and though they tried to accommodate all the request as best they could, these were time consuming and difficult because of the structure of their data warehousing systems. The suggested that it would have been nice to know what requests were going to arise ahead of time, so they could plan and prepare accordingly.
Perceptions of Program Efficacy
During the follow-up interview the evaluation team asked the interviewee about their perceptions of trial’s efficacy. She admitted that while she felt the trial was a little slow getting traction, she felt there was some significant movement in the second half of the trial. Though she could not provide specific numbers, she highlighted the success the retailer saw in promoting the compact refrigerators and the air cleaners during the 2014 holiday season, and mentioned that much of what they learned throughout the trial helped them quickly develop an effective marketing strategy and plan for these products.
RETAILER STORE MANAGER INTERVIEWS/SURVEYS The baseline interviews with store managers were conducted in February and March of 2014 over the telephone. Notably, at the time of the interviews, because of challenges in getting the program launched during the holiday seasons, the retailer had yet to implement significant promotional activities associated with the RPP Trial. Thus, though these the initial interviews were conducted several months after the November 2013 trial launch, they serve as useful baselines. For the baseline interviews, retailer corporate staff sent out an email announcement to all the participating store managers (N=26) asking if they would be willing to participate in the phone interview. Interested mangers were put in contact with the evaluation team to conduct the interviews. EMI Consulting ended up completing interviews with five participating store managers. These interviewees reported having been managers with the retailer from 5 to 20 years. They all reported similar responsibilities, indicating they

51
PG&E’s Emerging Technologies Program ET13PGE8052
were generally accountable for the day-to-day operations of the stores, including sales, inventory management, merchandise presentation, and back-office operations (e.g., staffing, invoicing, reporting, etc.). The follow-up survey was conducted with the store managers in March and April 2015. As noted in the methods section of this report, there was some discussion amongst PG&E program staff, the implementation team, and the evaluation team as to the usefulness of the store manager interviews/surveys given that the design of the RPP Program is predominantly top down. That is, the retailer’s corporate staff makes the product assortment and promotion decisions, and these are prescribed to store staff to implement. Some felt that given this arrangement, the store mangers would be unlikely to provide useful information. Nevertheless, the stakeholders agreed that this notion needed to be formally tested, and a web survey was developed with the additional goal of attempting to assess store managers’ relative awareness and familiarity with promotions conducted in their stores. For the follow-up surveys, retailer corporate staff sent out an email announcement to all the participating store managers (N=24)21 containing a link to the web survey. A total of six store managers responded to the web survey (response rate of 25%). Five of the six completed the entire survey, with one respondent quitting about halfway through.
Awareness of in-store promotional activities in general
During the baseline interviews and follow-up surveys, the participating store managers indicated they generally have limited input in to store promotions. Promotional plans typically come from the retailer’s corporate offices in the form of “plan-o-grams,” detailing how specific products should be displayed throughout the store. That said, the managers also stated they do have some autonomy around displays and sometimes create additional displays for products they have extra inventory of, or to promote complementary products. During the follow-up survey, the evaluation team also asked the store managers about whom promotional events get communicated to at their individual stores from the corporate offices. In all cases, the responding managers indicated that they were the ones that directly receive the promotional announcements. However, while three of the six managers indicated they were the person in their store most familiar with promotional activities, the other three pointed to other staff, including assistant store managers, or the electronics leads. Thus, the store managers may not always be the best person to talk to about specific promotions. During the follow-up surveys, when asked how aware they generally were about the various promotions conducted in their stores, five of the six respondents indicated they were “very aware” (83%); the one remaining respondent indicated they were “somewhat aware” (16%). When asked how many promotional events run in their store in a typical week, a wide range of responses were provided by the six responding store managers: one store manager responded that there were “less
21 Note that the total number of participating stores was 26 at the start of the trial, but two of these stores terminated participation in the trial due to unforeseen business circumstances, leaving a total of 24 participating stores at follow-up.

52
PG&E’s Emerging Technologies Program ET13PGE8052
than five” (17%); three of three managers indicated “5 to 10 promotions” (50%); two indicated “More than 10” (33%). During the follow-up surveys, the evaluation team wanted to get a better sense as to whether the store managers could reliably answer questions regarding specific promotions. To probe this issue, the evaluation team asked the responding managers to briefly describe the details around any promotional event run in their store in the past year. Three of the six responding store managers provided responses, including:
“June 27-29th we featured a sidewalk sale fully staffed, promoting the upcoming Fourth of July weekend. We featured camping essentials i.e. cases of water 2/$7 and Pepsi product that was featured in the weekly ad. In addition we had ice chests, propane, a display of easy ups that were feature for $69.99, and an associate set up outside to assist members with [Retailer] credit card applications.” “We have [promotional flyers] to promote generally seasonal merchandise. At times we will be given additional signing as well as signs to be carried by our associates to promote the event on busy traffic areas.” “[Program name] ran periodically throughout year with counter, end cap, and standee signs.”
While ultimately only the first of these responses included any notable level of detail, it should also be noted that this was presented as an open-ended question in a web survey; if it had been an in-depth interview, an interviewer could have probed further to see if any additional details could have been drawn out from the respondents. At baseline, three of the five store managers indicated they were aware of energy efficient products being promoted through store sale flyers in the past (note that at the time the baseline interviews were conducted, RPP Trial-related flyers had not been used yet, so these reflect awareness of other promotions). These typically involved appliances being promoted through rebates and/or discounts. However, four of the five store managers were not aware of any recent promotions tied to energy efficiency.
Awareness of the RPP Trial
At baseline, none of the five store managers were aware of the RPP Program either by name, or as a general marketing initiative. However, this should not be surprising, as little had been done to implement the program in the stores yet. All were aware of rebates offered for certain appliances, but these were not tied to the RPP Trial. At follow-up, there was a higher degree of familiarity with the program. To probe whether the store managers had any familiarity with the name of the program, we asked: “Are you aware of the Retail Plug Load Portfolio (RPP) Program trial, sponsored by Pacific Gas & Electric Company (PG&E) and the Sacramento Municipal Utility District (SMUD) that was conducted in your store in 2014?” Two of the six managers responded “Yes,” three responded “Don’t Know”, and only one of the six store managers stated “No.” Of the two that stated they were aware of the program, when asked to describe it in open-ended format, they provided the following responses:
“Energy savings program.”

53
PG&E’s Emerging Technologies Program ET13PGE8052
“If this is the program I am thinking it had numerous pieces of POP on ENERGY STAR appliances, light bulbs, and other energy efficient products sold within the store.”
Again, these responses need to be considered in the context that this was an open-ended question in a web survey; if it had been an in-depth interview, the interviewer could have probed further to elicit greater detail. Nevertheless, it seems that both respondents were likely referring to the correct program. For the respondents that said they were not familiar with the program or didn’t know, a follow-up question was asked that provided additional detail about the program to see if they recalled the program with some prompting. The questions posed was:
“The Retail Plug Load Portfolio Program is a program focused on promoting and selling certain categories of energy-efficient consumer electronics and home appliances in [Retailer] stores. The focus is on ENERGY STAR products, some of which have been promoted in your store over the past year. Does this program sound familiar to you?”
Providing the description of the program helped the respondents—all but one respondent indicated that it did sound familiar. Thus, in sum, while none of the five store managers interviewed at baseline were aware of the RPP Trial, all but one of the six managers surveyed at follow-up indicated they were familiar with the trial.
Effects of the RPP Trial on Product Sales
During the follow-up surveys, the evaluation team then asked the five store managers that revealed any awareness of the RPP Trial to indicate, for each specific product category, whether they felt the program was able to increase sales. In general, based on the number of “Don’t Know” responses, the store managers seemed more aware of the potential program effects on appliances than on home electronics. Responses are shown in Table 12.
TABLE 12: DID THE PROGRAM INCREASE SALES FOR…? STORE MANAGER SURVEY RESPONSES
PRODUCT CATEGORY YES NO DON’T KNOW
Refrigerators 5 0 0 Freezers 5 0 0 Room Air Conditioners 1 1 3 Air Cleaners 0 2 3 Sound bars 0 1 4 DVD/Blu-Ray players 0 1 4
For each of the products for which they felt sales increases occurred, the responding store managers were then asked to provide their best estimates of by what percent they thought sales increased. In general, the store manager self-report impact estimates seem quite a bit higher than the results derived by the evaluation team

54
PG&E’s Emerging Technologies Program ET13PGE8052
presented later in the Impact Evaluation Results section. The minimum, maximum, and mean values for the three product categories are shown in Table 13.
TABLE 13: BY WHAT PERCENT DO YOU THINK SALES INCREASED FOR…? STORE MANAGER SURVEY RESPONSES
PRODUCT CATEGORY MIN. MAX. MEAN DID NOT PROVIDE
ANSWER Refrigerators 11% 20% 17% 2 Freezers 6% 20% 14% 1 Room Air Conditioners NA NA NA 1
Awareness of RPP-Specific Promotional Activities
At baseline, the store mangers were asked if they were aware of the in-store broadcasts;22 only one of the five store managers recalled hearing anything about energy efficiency through the in-store broadcasts. However, it is worth noting that there are a large number of announcements occurring in these stores and some sore managers indicated staff that spends many hours each day working in these locations have become accustomed to “tuning-out” these announcements. During the follow-up surveys the evaluation team also asked the store managers to indicate which promotional strategies were used to promote the different products. In general, the responding store managers were familiar with the use of the different promotional strategies, with the only “Not Used” responses associated with the promotional flyers (two managers), store associate training (one manager), and in-store broadcasts (one manager).23
TABLE 14: DID THE PROGRAM INCREASE SALES FOR…? STORE MANAGER SURVEY RESPONSES
PRODUCT CATEGORY USED NOT USED
DON’T KNOW
DID NOT RESPOND
Discounted pricing on: air cleaners, freezers, refrigerators, DVD/Blue-Ray players, home theaters-in-a-box, room air conditioners
3 0 1 1
Promotional flyer emphasizing energy-efficient products 2 2 0 1 ENERGY STAR signage 4 0 0 1 Reward points 3 0 1 1 Store associate training on energy-efficient products 3 1 0 1 In-store radio announcement informing shoppers about benefits of energy-efficient products 2 1 1 1
Awareness and knowledge regarding their customers’ demands for energy efficient products
Three of the five store managers interviewed at baseline indicated that the retailer’s customers are fairly to moderately aware of energy efficiency; two specifically mentioned ENERGY STAR. One stated that “roughly 50% of 22 At baseline, the in-store announcements were the only promotions the evaluation team was aware of that was supposed to have been implemented across all participating stores. 23 Note that all of these strategies actually were used in the stores. However, due to the inconsistent implementation of the program across stores, some of these may not have actually been used in all stores.

55
PG&E’s Emerging Technologies Program ET13PGE8052
customers that shop appliances know that they want an ENERGY STAR product (including those that just want the rebate and those that really do care); the other half are just concerned with which ever product is the least expensive.” All of the store managers mentioned that their particular customer population is generally very sensitive to sale price: “It is a case of money now versus savings later and they don’t have the money now.” Another manager stated: “Customers are not as aware as you may think. Customers are most concerned about value – what is the customer getting for the extra price.” Similar results were seen at follow-up: two of the six managers said their customers were “Very Aware,” while three felt they were only “Somewhat Aware.” Nevertheless, all five of the store managers that answered this question responded “Yes” when asked if their customers ever ask for ENERGY STAR products. When asked about what proportion of their customers ask for ENERGY STAR products, the responses were generally consistent at about 22% (min: 15%; max: 29%). Finally, when asked how influential they thought the ENERGY STÅR label was in their customers’ buying decisions, two store managers responded “Very Influential,” two said “Somewhat Influential,” and only one indicated “Slightly Influential.”
Experiences with and feedback on the RPP Trial
During the baseline interviews, the evaluation team also asked the store managers what they thought could be done to better promote energy efficient products at the retailer’s stores. The following were recommendations or statements provided by the five store managers:
• Fact sheets would help staff answer questions about energy efficiency. • The ENERGY STAR label provides customers with useful information. • Signage is sometimes helpful, but does not work if customers do not understand
energy efficiency. • It is more effective to have someone actively selling the products—there is a
better chance of selling the more efficient models. • 1:1 touch with the customers is the most effective strategy for selling energy
efficient products to customers. • More training for associates on energy efficiency–they really need more
information so they can better educate consumers. Could include workshops or flyers that summarize the benefits.
• Having a utility staff member on site helps. • In the past, when the state was running more energy efficiency promotions and
offering rebates, there was more general interest among customers. Customers were asking about energy efficiency then.
• “When there is significant [point-of-purchase] rebates, there is a big push–customers really like the initial gratification of knowing they just saved money by purchasing a particular product model.”
Ordering and Stocking
Some additional questions were included in the baseline interviews to better understand ordering and stocking practices at the retailer’s stores. All of the store managers indicated that ordering is determined automatically through the point-of-sale system. Orders are created based on “order up-to” or “trigger numbers”. The system knows, based on a general history, how many items of a particular product a store should

56
PG&E’s Emerging Technologies Program ET13PGE8052
generally have and when the sales numbers for a product approaches a trigger number an order is created. The managers reported that inventory comes to them from the regional distribution center and trucks arrive roughly every 3 days, though they can come more frequently. The stores do review the orders to ensure that the requested items and counts appear correct and stores do have the ability to override orders when needed. However, orders are not regularly adjusted, and when they are adjusted it is to meet needs of weekly ads or specialty events. Occasionally they will “stock balance,” which usually happens for seasonal goods or during the holiday time. For example, if the weather has been really poor in the Sacramento area and they have experienced unusually low summer temperatures, pallets of items may be transferred to stores in Southern California that could sell the product. Such products could include air conditioners and/or fans, but such transfers are infrequent. Also, for new items or when a product is selling really well and they feel they could move the item to an end cap and sell considerably more than the recommended amount, the manager may adjust the ordering rate. Customers can also order from the retailer’s website and shipped directly to a customer’s house or directly to the store for free shipping. However, this is not generally the case for home appliances, which need to be picked up at the retail store locations.24 Very rarely are store-to-store transfers completed for individual items. One manager who has been in their role for many years indicated this has greatly reduced in the last 10 ten years because it is so expensive. When transfers are conducted, it is to replace a broken item or satisfy customer need or request tied to a relatively higher-priced item. However, this rarely happens with larger appliances due to the costs.
IMPLEMENTATION TEAM DEBRIEF
In March 2015 the evaluation team conducted a conference call with three members of the implementation team, Navitas Partners, to better understand their experiences, perceptions, and recommendations related to the RPP Trial. We discussed several topics during this conference call including the implementer’s communications with the retailer and the project team, and their experiences and feedback regarding the trial.
Communication
The evaluation team first inquired about the implementation team’s role as the primary conduit of communication between the PG&E program staff and the retailer. The implementation team sees this role and their communication as both important and effective. They argue that since their staff has decades of experience working in the retail environment and recognize and understand the retailer’s needs and perspectives, they are able to translate the utility’s desires in a manner that is amenable to the retailer, and vice versa. They felt this was key to gaining participation and engagement from the retailer during the trial period. They also emphasized that this role is important to engaging retailers as there is often a disconnect between the program team’s perceived importance of the program
24 Other than the home appliances, where the sale gets recorded at the store where the customer picks up the product, the products sold through the retailer website do not appear in the program sales data for this trial.

57
PG&E’s Emerging Technologies Program ET13PGE8052
and the actual importance to the retailer. The program team lives and breathes energy efficiency – this is our business. However, the implementation team pointed out that retailers business is selling products, and energy efficiency will always be an ancillary concern. They noted that recognizing this fact and accommodating this notion is important because too many requests, requirements, or “asks” in support of the program can become an obstacle to retailers and turn them off from agreeing to participate, or continuing participation. Ultimately, they stated, from the retailer’s perspective it is about “what can we do for retailers to minimize costs?” They also recognize similar needs from the utility’s perspective and feel they play a key role in bridging the two perspectives.
Fulfilling the role as the conduit between the utility and the retailer also takes a significant investment of time. When asked how frequently the implementation team communicated with the retailer staff during the trial, they indicated it varied from multiple times a day to no less than once a week. The communications varied from phone calls, to emails, to many onsite face-to-face meetings with retailer staff.
Successes of the Trial
The evaluation team also asked the implementation team for examples of what they felt worked well during the trial. First and foremost, the implementers emphasized the fact that the trial was able to engage a retailer to participate in the program when they only had an opportunity for a relatively small financial gain due to the relatively small scale of the trial (i.e., 26 participating stores). Notably, the participating retailer had not historically targeted energy efficiency and getting them to do so through the trial was perceived as a major success. They clarified this point further by highlighting that the participating retailer is a struggling retailer with a price-point focused clientele, which raised additional challenges in getting the retailer to participate in the program—and remain engaged—and target energy efficient products, as they generally cost more and are not necessarily demanded by their customers. Also, the requirements of the retailer were considered rather large given the scale of the trial. While the retailer was provided Marketing Development Funds (MDF) to support the development of specific marketing materials like flyers and signage, the cost of other obligations (e.g., querying and providing historical and monthly sales data, tracking the trial’s progress, meetings associated with the trial, etc.) were not covered by the MDFs. The costs to the retailer of conducting these additional activities are not negligible, yet they remained engaged and motivated throughout the trial period.
Challenges in Implementing the Trial and Lessons-Learned
When asked what they felt did not work well, the implementation team provided a few examples. Most notably, the implementer felt the greatest hurdle to implementing the RPP Trial was the issue of scale. The RPP Program is a market transformation program and “26 participating stores are not going to transform any market.” The issue of scale has several implications. First, from a task-related perspective, were the hurdles faced with getting the correct data from the retailer. Because of the small scale of the program, the retailer did not develop an automated or systematic approach to facilitate data extracts, and instead, extracts were conducted on a month-to-month basis by a retailer staff member whose main job was not data management. As such, there were frequent issues with the data files that required frequent interactions with the retailer to correct. However, the implementer felt strongly that if there were sufficient scale, the retailer would be able to develop a more efficient

58
PG&E’s Emerging Technologies Program ET13PGE8052
data management system and assign trained staff to this important task. The retailer staff in their interviews mentioned this same notion when they noted that there are significant inefficiencies in trying to implement and manage a program in a small locale with a limited number of stores. The implementers felt this was further evidenced by the fact that they often had difficulties “pinning-down” merchants to do things—if the financial reward for the retailer was greater, more retailer resources would be available to focus on the delivery of the program.
Another notable lesson learned from the trial was that the participating retailers would likely need support in implementing the program for it to recognize its maximum potential. A fundamental principle underlying the RPP Program is that retailers should be allowed to design the retailer implementation plan since they know how best to sell their products, i.e., “let retailers be retailers.” The implementation team indicated that while they still feel that general principle is sound, it is also likely that support from the utilities and implementers will be needed as the MDFs available to the retailers are not likely to drive self-implemented activities (though this too may change with increased scale). A specific example provided by the implementation team was the retailer’s development of their strategic retailer implementation plans. At the start of the program, the retailer provided a plan, but in some ways it lacked specificity and aggressive promotions that could have been used to drive increased sales. This is not to say that the plan was not carefully thought out, but rather that the implementer thought more could have been done. The implementation team described how they began to more actively work with the retailer to help develop some more focused promotional activities to better target specific products. An example of better targeting was the 2015 holiday season refrigerator and air cleaner promotions, which they felt were very effective. While the implementation team feels they were key in helping develop and launch these specific promotions, they described the ideal process as one of “collaborative participation.” That is, increased support form the utilities is not intended to transform the RPP Program design into a prescriptive design, but instead, should be aimed at leveraging the knowledge, experience, and resources of multiple parties to maximize potential.
The implementation team also mentioned the unique challenges associated with delivering a market transformation program such as the RPP Program. They emphasized the need to recognize that many aspects of the retail market will need to be transformed for the RPP Program to reach its full potential. They described this transformation as a paradigm shift. Retailers themselves will need to transform at many levels. Not only will they need to start to see the value, benefits, and advantages of focusing on energy efficiency as a legitimate and marketable business objective, but they will also need to transform and fine tune their protocols and processes to account for the regional or multi-regional implementation of the program.
Program Risks
The implementation team also felt that there is a notable risk to this program if regulators, utilities, and evaluators do not adequately grasp the implications tied to the RPP Program being a market transformation program. Unlike resource acquisition programs where impacts are typically seen in relatively short timeframes, the implementation team is concerned that relatively small short-term results will make key stakeholders unwilling to wait until the program can affect the plug load market. As they noted, “it is not so much that a retailer sold a total of X units one month and a total of Y units some other month. The issue is really whether or not the market is changing. Are retailers engaging? Are actions being taken?” They feel that this will require a much

59
PG&E’s Emerging Technologies Program ET13PGE8052
longer outlook and evaluation techniques to assess the efficacy of a market transformation program.
PG&E PROGRAM STAFF INTERVIEWS/DEBRIEF The evaluation team conducted a telephone-based interview with two members of the PG&E program staff in January 2014, and a debrief call with two staff members after the Trial in March 2015. The discussions focused on the topics of successes, hurdles, trial operations, and lessons-learned.
Program Successes
In terms of successes, at baseline (and to some degree at follow-up) the PG&E staff highlighted that simply getting this new, novel program off the ground and recruiting a retailer were accomplishments. Everything was new and processes and procedures needed to be developed and implemented for all aspects of the trial. They felt that there was an array of specific evidence supporting this, including: the recruitment and successful contracting with the retailer, the retailer’s development of an acceptable (both to the retailer and PG&E) retailer implementation plan, getting a contract in place with the data services provider, developing an EM&V plan and getting buy-in from the CPUC-ED. Also, the program staff felt like PG&E has established itself as a leader in the difficult arena of plug load by launching this program and driving collaboration across the country with various stakeholders (e.g., PG&E, the implementation team, retailers, ENERGY STAR, other utilities and utility partners, etc.). Other successes mentioned at follow-up illustrated the significant amount of “learning” that came from the overall process of implementing the trial. Examples included:
• The process for determining which models were program-qualified and which were not was not quite as straightforward as expected. Nevertheless, the task provided a significant amount of insight into ENERGY STAR’s processes for developing specifications and formulating the Qualified Products Lists. Learnings tied to this effort also helped the program team, the retailer, and the implementation team work together with ENERGY STAR to get additional efficient products stocked by the retailer listed.
• This particular participating retailer may not have been the ideal retailer for testing the program concept. While the participating retailer was quite engaged and was able to successfully implement the program in their stores, their market segment is the price-focused consumer. Because of the price focus, it is more difficult to market energy efficiency to this population.
• Building out an understanding of the data needs and the procedures for processing it was seen as a key learning. Not only has this helped facilitate the implementation of the program in terms of tasks like tracking and paying incentives and supporting evaluation, it has provided great insights into some of the administrative costs that are associated with this program.
• Overall program processes and procedures were another area of significant learning. For example, implementing the trial has helped PG&E determine what the necessary roles are, who should be responsible for what, what the processes and protocols should be, and how to improve collaboration. This refinement has also provided greater insights into how and where costs may be cut, and areas of potential concerns.

60
PG&E’s Emerging Technologies Program ET13PGE8052
AREAS NEEDING ATTENTION MOVING AHEAD In addition to the successes and learnings, the program staff also provided some insights into areas that warrant attention moving forward with the program. First, data will continue to be a challenge as the amount of data that is needed to support this program is large. Also, it is still unclear what types of additional data is available, and what its total costs might be, to support a large implementation of the program. Data representing the nonparticipating retailers and the overall regional and national markets are the biggest concerns. The program staff is eager to understand how cost-sharing agreements might be developed and implemented to ensure the expenses associated with obtaining the necessary data are spread out among the various interested parties and that those who need it will have access to it. Another area the program team wanted to ensure gets attention is how to better work with the retailers. They realize that PG&E needs to better support their “product,” which is the program. They feel like they are like any other vendor operating in a retail store, and they want to develop improved processes for working with the retailers via the PG&E field team to not only ensure that retailer implementation plans are being implemented, but also to be able to provide timely feedback and support for improving implementation. In addition, through the trial the program staff has gained a better understanding of the contrast between what the utility wants, versus what the retailers are willing and able to do. While some of this has been managed through an improved contracting process with the retailers, where expectations are clearly stated, they still feel that the utility may need to revise some of their expectations. Product selection is also seen as a challenge from several perspectives. The program staff recognizes the need to better define a process that targets key opportunities. But this process needs to be more aligned with the retail buying cycles to maximize efficiency and effectiveness. This process also needs to be developed in a way that aligns with retailers overall prioritization process. They suggested a roadmap or prioritization list might be helpful. However, they also recognize the need to get buy-in from the ex ante team on the products the program targets, which poses some timing challenges. This all factors into one of the biggest desires mentioned during the debrief, which was to develop and refine processes in order to be more timely and responsive to drive more real-time decision-making. They recognize that the RPP Program design is targeted at affecting a fast moving market, but engineering, evaluation, and CPUC processes and actions tend to be slow, which pose challenges. Overall, they felt that decisions need to be made more efficiently to increase the opportunity to maximize the potential from the RPP Program. A final area that the program team expects to allocate significant focus to in the future is collaboration and communication with ENERGY STAR. The program staff mentioned that they did not have much opportunity to participate in or contribute to discussions regarding specification setting, because of the small scale of the trial. However, when the program expands to include more retailers, more regions, and more products, they expect the influence of the program to grow and are eager to begin to develop a process for working with ENERGY STAR to help move the market towards greater energy efficiency.

61
PG&E’s Emerging Technologies Program ET13PGE8052
RETAILER MARKETING PLANS AND IMPLEMENTATION As part of the RPP Program, retailers are expected to commit to creating and implementing a retailer implementation plan for increasing the sales of energy efficient models in the targeted product categories. The retailer that participated in the RPP Trial included several strategies in their retailer implementation plan aimed at increasing sales of targeted product categories. These activities are discussed below.
BULK STACKS
The participating retailer conducted several “bulk stack” events for certain products at certain times, which consisted of center-aisle or special placement of multiple units of a specific program-qualified model, typically with promotional pricing and signage. The bulk stack events conducted by the participating retailer as part of the RPP Trial are shown in Table 15.
TABLE 15: PARTICIPATING RETAILER BULK STACK EVENTS (NOV. 2013 DEC. 2014)
NEW MODEL PRODUCT TYPE SIZE RPP SIZE CLASS
PRICE DISCOUNT
BULK STACK PERIOD
No Room Air Conditioner
5,200 BTU <12,000 BTU $50.00 Jun.-Aug.
2014
No HTiB/Sound bar NA Sound bar $50.00 Jun.-Jul. 2014
Yes HTiB/Sound bar NA Sound bar $15.00 Jun.-Jul. 2014
No Refrigerator 1.6 cu.ft.
Compact Mini (<5 cu. ft.) $40.00 Oct.-Dec.
2014
No Air Cleaner 55 CADR <100 CADR $50.00 Oct.-Dec.
2014 Additionally, two of the items shown in Table 15 – the refrigerator and air cleaner – were denoted as “hero” items for October through December 2014, and were offered at their “lowest price ever” through the retailer.
PROMOTIONAL FLYERS
The participating retailer developed two-sided, full-color sale flyers for different time periods during the trial. The front page advertised home appliances; the back page advertised consumer electronics. These were displayed and available at the front of the stores as customers walked in and promoted a selection of program-qualified products. While most of the models included in the flyers were promoted with special sale pricing, some products were instead promoted with reward points25–in one case a model was promoted with both sale pricing and reward points.
Table 16 through Table 21 on the following pages show the participating retailer’s model-specific promotions conducted during the November 2013 through December 2014 trial
25 The participating retailer has a rewards system, where customers receive points for certain product purchases that can be used towards future purchases.

62
PG&E’s Emerging Technologies Program ET13PGE8052
period. For confidentiality reasons, the actual brand and model numbers are not shown, and different models are designated as Model A, B, C, etc.
FREEZER AND REFRIGERATOR PRICE DISCOUNTS In addition to the price discounts associated with the bulk stacks and promotional flyers, all program-qualified freezers and refrigerators were offered at reduced prices from December 2014 through September 2015. The retailer discounted freezers by $20 and refrigerators by $30 during this period.
IN-STORE BROADCASTS
In addition to the product- or model-specific promotions, the participating retailer also aired various in-store broadcasts throughout the trial period to promote targeted product categories. The broadcasts (along with the periods they were aired) were:
Announcement #1 (November 2013-January 2014 and June 2014-September 2014): “In an effort to reduce energy consumption we are offering an assortment of ENERGY STAR qualified products in our Electronics and Home Appliances departments. When you purchase an item in one of these departments look for the ENERGY STAR logo, you will not only save energy, but also money on your monthly utility bill!”
Announcement #2 (February 2014-May 2014): “Looking to save money on your utility bills? We are now offering $30 off all ENERGY STAR certified refrigerators and freezers. In an effort to reduce energy consumption in our region we are offering an assortment of ENERGY STAR qualified products in our Electronics and Home Appliances departments. When you purchase an item in one of these departments look for the ENERGY STAR logo and start saving energy and money today.”
Announcement #3 (October 2014-December 2014): “Please be sure to stop by your Appliance Department to see our Lowest Prices Ever on our [Brand] Compact Refrigerator, and our [Brand] Electronic Air Purifier, your choice only $49.99. Your local utility is helping sponsor this event for a limited time. At these low prices they make great gifts. Stop by our Appliance Department today for these outstanding values!”
PROMOTIONAL POSTERS
The retailer also worked with PG&E, SMUD and ENERGY STAR to develop ENERGY STAR promotional posters. These full-color posters were displayed in retail stores and informed customers and sales associates about ENERGY STAR products and the ENERGY STAR label. The poster graphic is presented in Appendix B.

63
PG&E’s Emerging Technologies Program ET13PGE8052
TABLE 16: AIR CLEANER PROMOTIONS
NEW MODEL MODEL
PRODUCT CLASS
PRICE DISCOUNT
REWARD POINTS
PROMOTIONAL FLYER OCT.-DEC. 2014
No Model A < 100 CADR $50.00 NA X
TABLE 17: DVD/BLU-RAY PLAYER PROMOTIONS
NEW MODEL MODEL PRODUCT CLASS
PRICE DISCOUNT
REWARD POINTS
PROMOTIONAL FLYER MAR. 2014 JUN. 2014 OCT.-DEC. 2014
No Model A Std. DVD $5.00 NA X No Model A Std. DVD $10.00 NA X No Model B Blu-Ray $10.00 NA X No Model B Blu-Ray $10.00 NA X No Model C Blu-Ray $15.00 NA X Yes Model D Blu-Ray $10.00 NA X Yes Model E Blu-Ray $20.00 NA X No Model F Blu-Ray NA $20.00 X
TABLE 18: HOME THEATER-IN-A-BOX/SOUND BAR PROMOTIONS
NEW MODEL MODEL
PRODUCT CLASS
PRICE DISCOUNT
REWARD POINTS
PROMOTIONAL FLYER MAR. 2014
JUN. 2014
OCT.-DEC. 2014
No Model A Sound bar NA $30.00 X No Model A Sound bar $40.00 NA X No Model B Sound bar $30.00 NA X No Model C Sound bar NA $50.00 X No Model C Sound bar $100.00 $50.00 X Yes Model D Sound bar $15.00 NA X Yes Model E Sound bar NA $15.00 X No Model F Sound bar $40.00 NA X

64
PG&E’s Emerging Technologies Program ET13PGE8052
TABLE 19: FREEZER PROMOTIONS
NEW MODEL MODEL
SIZE (CU.FT.) SIZE CLASS
PRODUCT CLASS
PRICE DISCOUNT
REWARD POINTS
PROMOTIONAL FLYER MAR. 2014 JUN. 2014
No Model A 15.0 Medium (13-16 cu.ft.) Chest $20.00
NA X
No Model A 15.0 Medium (13-16 cu.ft.) Chest $70.00
NA X
TABLE 20: REFRIGERATOR PROMOTIONS
NEW MODEL MODEL
SIZE (CU.FT.) SIZE CLASS
PRICE DISCOUNT
REWARD POINTS
PROMOTIONAL FLYER MAR. 2014
JUN. 2014
OCT.-DEC. 2014
No Model A 25.4 Very large (>23 cu. ft.) $30.00 NA X No Model B 25.4 Very large (>23 cu. ft.) $30.00 NA X No Model C 25.4 Very large (>23 cu. ft.) $30.00 NA X No Model D 21 Very large (>23 cu. ft.) $30.00 NA X No Model D 21 Very large (>23 cu. ft.) $50.00 NA X No Model E 18 Medium (17–20 cu. ft.) $30.00 NA X No Model E 18 Medium (17–20 cu. ft.) $70.00 NA X No Model F 20 Very large (>23 cu. ft.) $30.00 NA X No Model G 23 Very large (over 23 cu. ft.) $30.00 NA X Yes Model H 1.6 Compact Mini (<5 cu. ft.) $40.00 NA X No Model I 3.1 Compact Mini (<5 cu. ft.) $30.00 NA X
TABLE 21: ROOM AIR CONDITIONER PROMOTIONS
NEW MODEL MODEL
SIZE CLASS
PRODUCT CLASS
PRICE DISCOUNT
REWARD POINTS
PROMOTIONAL FLYER
JUN. 2014 No Model A 5,200 BTU <12,000 BTU $50.00 NA X

65
PG&E’s Emerging Technologies Program ET13PGE8052
SHELF SURVEYS Comprehensive shelf surveys were conducted at all participating stores by the PG&E field services team twice during the RPP Trial: (1) Wave 1 was conducted in February and March 2014, and (2) Wave 2 was conducted in November 2014. The main purposes of the shelf surveys were to gain an understanding into stock assortment changes and program-related promotions.
The field team inventoried all models (both program-qualified and non-qualified) present on the sales floor in each of the targeted product category departments.26 Additionally, the field team recorded whether or not the program-qualified models were on sale, or had any promotional materials associated with it such as promotional signage. The shelf survey data were first aggregated to the store level (24 total stores), and then to the product category level.
Table 22 shows the some of the results of the shelf surveys, presenting the mean number of program-qualified models per store (with standard deviations in parentheses) and the percent of models within each targeted product category that were program-qualified, by shelf survey wave.
TABLE 22: SHELF SURVEY RESULTS
Product Category
MEAN (S.D). NUMBER OF PROGRAM-QUALIFIED
MODELS PERCENT OF MODELS PROGRAM-QUALIFIED
Wave 1 Wave 2 Wave 1 Wave 2 Air Cleaner 1.0 (0.3) 1.2 (0.4) 25% 46% DVD/Blu-Ray 4.9 (0.8) 7.5 (1.3) 49% 63% HTiB 1.1 (0.7) 2.7 (1.0) 14% 26% Freezer 0.7 (0.5) 0.5 (0.5) 14% 11% Refrigerator 3.0 (2.7) 1.8 (2.0) 36% 18% Room AC 0.8 (0.4) 0.2 (0.4) 26% 4%
Table 22 suggests that there was some evidence of assortment changes, but these were limited to the consumer electronics product categories. At the start of the program, the participating retailer only stocked an average of one model of qualified air cleaner per
26 In addition to inventorying the total number of models, the evaluation team also directed the field team to inventory the total number of units on the sales for each of the models. However, subsequent analysis of the unit counts indicated this was not a very useful or informative metric due to the relatively long time lapse between waves. For example, consider the a situation where Store A had 20 units of a qualified model on the shelf at Wave 1, and 10 units on the shelf of the same model at Wave 2. One interpretation could be that the store is putting less effort into implementing their retailer implementation plans because they are not stocking the model as intensively at Wave 2 as they did at Wave 1. However, equally reasonable interpretation is that the store is actually doing a commendable job because they sold half of their inventory between Wave 1 and Wave 2. An analogous problem exists with trying to compare different stocking levels across stores within a wave. Thus, the evaluation team excluded the analyses of the unit counts from this report and does not recommend collecting that type of data in future evaluations. Also, more reliable unit information can be gathered from the retailer sales data than the shelf survey results.

66
PG&E’s Emerging Technologies Program ET13PGE8052
store, but at the follow-up this value increased to 1.2 (one new model of air cleaner appeared in the follow-up shelf survey data, but not at all stores). More notable increases appeared with the DVD/Blu-Ray category, where the mean number of program-qualified models at baseline was 4.9, but increased to 7.5 by the follow-up (this was also evidenced in Table 17, where we see that two new models of Blu-Ray player were promoted through the flyers). Likewise, for home theaters-in-a-box, the mean number of program-qualified models was 1.1 at baseline, and increased to 2.7 by the follow-up (Table 18 shows two new models of sound bars were added to the retailer’s assortment). However, it is important to point out that we also saw notable increases in the number of models in the nonparticipating stores in subsequent quasi-experimental analyses, so it is difficult to say that these increases were entirely attributable to the trial. Instead, it appears that at least some of these increases reflect new models that were added to the product assortment irrespective of the trial (more is said with regards to the limitations of the shelf survey approach in the Synthesis and Research Objectives chapter under the subsection EO1: Test various methods to evaluate the RPP Program).
In contrast, all of the home appliance categories saw declines from the baseline to the follow-up: freezers went from 0.7 qualified models per store to 0.5; refrigerators from 3.0 qualified models per store to 1.8; room air conditioners from 0.8 qualified models per store to 0.2. However, it is important to note several factors when interpreting these latter results. First, notice the relatively larger sizes of the standard deviations in respect to the means for the home appliances as compared to the consumer electronics. Overall, there is more variability in the stock assortment for appliances across both waves than for the consumer electronics product categories. This means that the stocking assortment for each of the home appliance categories varies across stores much more than the assortment of consumer electronics categories. This was apparent in detailed shelf survey results, where by the end of the year, some stores had a notable number of “clearance” appliances on sale that were not present in all stores. Second, the participating retailer – like most appliance retailers – generally stocks fewer individual units for each of the models of larger home appliances because floor space in retail establishments is at a premium. Thus, if the retailer sells out of a particular model, they may not have had the opportunity to restock that particular model, and this may be compounded with the retailer’s need to sell out of this year’s models to make way for next year’s inventory. Third, the room air conditioner category results are likely not very robust as neither wave of the shelf survey were conducted in peak cooling months – the retailer’s assortment of room air conditioners in February, March and November are not likely representative of their stocking assortment during the prime summer sales months.
Figure 8 shows other results of the shelf surveys, charting the percent of program-qualified models that were on sale (in the left-hand panel) and appearing with associated promotional materials (e.g., signage) (in the right-hand panel), by product category and wave. Without exception, the number of program qualified models on sale and with promotion increased from Wave 1 to Wave 2. In general, there was relatively little promotion of program-qualified products during the baseline period, but during the follow-up period most (i.e., greater than 50%) of the qualified models were on sale for every product category, while four of the six categories had the majority of models promoted with some type of signage.

67
PG&E’s Emerging Technologies Program ET13PGE8052
FIGURE 8: SHELF SURVEY RESULTS: MODELS ON SALE AND MODELS WITH PROMOTION
However, the values in Figure 8 are mean values derived across all the participating stores, and there was a great deal of variability in how the individual stores implemented promotions and marketing strategies during the trial. For example, Table 23 shows the Wave 2 store-level values for the air cleaner product category, including the total number of models, number of program-qualified models, number of program-qualified models on sale, and number of program-qualified models with promotions. The Wave 2 shelf surveys were conducted in November 2014, during which time the program-qualified air cleaner was considered a “hero” item, promoted heavily through the retailer’s promotional flyer as well as being a designated bulk stack item. However, as shown in Table 23, while all 23 of the stores that stocked air cleaners stocked the program-qualified model, six stores did not have the model on sale, and 15 of the stores had no promotional signage associated with the model. Thus, there appears to be a degree of inconsistency in how the individual stores implemented the marketing activities (the same tables for all of the other targeted product categories are included in Appendix C).
67%
91%
92%
75%
78%
72%
0%
21%
12%
58%
49%
18%
0% 20% 40% 60% 80% 100%
Room AC
Refrigerator
Freezer
HTIB
DVD / Blu Ray
Air Cleaner
Percent of Program-Qualified Models On Sale
Wave 1 Wave 2
33%
73%
92%
59%
75%
30%
0%
29%
29%
26%
31%
14%
0% 20% 40% 60% 80% 100%
Room AC
Refrigerator
Freezer
HTIB
DVD / Blu Ray
Air Cleaner
Percent of Program-Qualified Models with Promo
Wave 1 Wave 2
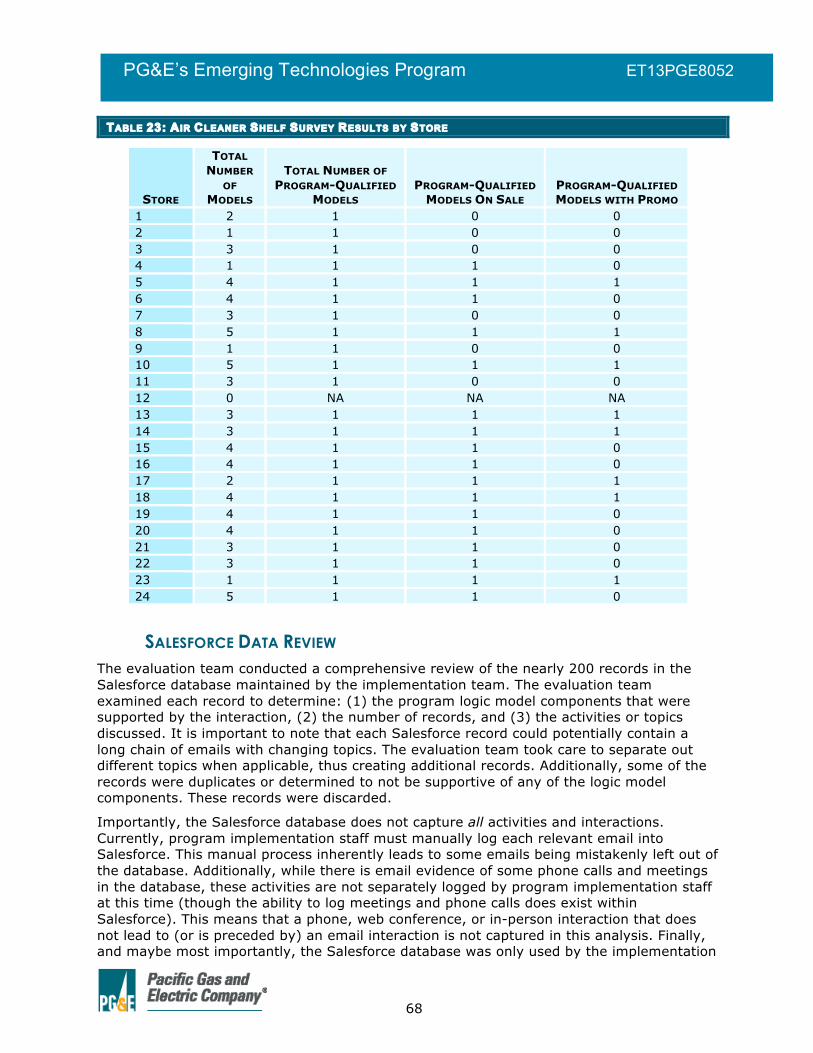
68
PG&E’s Emerging Technologies Program ET13PGE8052
TABLE 23: AIR CLEANER SHELF SURVEY RESULTS BY STORE
STORE
TOTAL NUMBER
OF MODELS
TOTAL NUMBER OF PROGRAM-QUALIFIED
MODELS PROGRAM-QUALIFIED
MODELS ON SALE PROGRAM-QUALIFIED MODELS WITH PROMO
1 2 1 0 0 2 1 1 0 0 3 3 1 0 0 4 1 1 1 0 5 4 1 1 1 6 4 1 1 0 7 3 1 0 0 8 5 1 1 1 9 1 1 0 0 10 5 1 1 1 11 3 1 0 0 12 0 NA NA NA 13 3 1 1 1 14 3 1 1 1 15 4 1 1 0 16 4 1 1 0 17 2 1 1 1 18 4 1 1 1 19 4 1 1 0 20 4 1 1 0 21 3 1 1 0 22 3 1 1 0 23 1 1 1 1 24 5 1 1 0
SALESFORCE DATA REVIEW The evaluation team conducted a comprehensive review of the nearly 200 records in the Salesforce database maintained by the implementation team. The evaluation team examined each record to determine: (1) the program logic model components that were supported by the interaction, (2) the number of records, and (3) the activities or topics discussed. It is important to note that each Salesforce record could potentially contain a long chain of emails with changing topics. The evaluation team took care to separate out different topics when applicable, thus creating additional records. Additionally, some of the records were duplicates or determined to not be supportive of any of the logic model components. These records were discarded.
Importantly, the Salesforce database does not capture all activities and interactions. Currently, program implementation staff must manually log each relevant email into Salesforce. This manual process inherently leads to some emails being mistakenly left out of the database. Additionally, while there is email evidence of some phone calls and meetings in the database, these activities are not separately logged by program implementation staff at this time (though the ability to log meetings and phone calls does exist within Salesforce). This means that a phone, web conference, or in-person interaction that does not lead to (or is preceded by) an email interaction is not captured in this analysis. Finally, and maybe most importantly, the Salesforce database was only used by the implementation

69
PG&E’s Emerging Technologies Program ET13PGE8052
and not other stakeholders involved with the RPP Program (e.g., PG&E staff, ENERGY STAR staff, utility partners, etc.). These gaps in the Salesforce data mean that our data review does not tell the whole story regarding the activities that have taken place to implement the RPP Program. That said, we feel that the data, while incomplete, do indicate that the key administrative activities in the logic model are well supported.
Table 24 shows the results of the Salesforce data review. For each of the applicable logic model components the number of relevant records is shown, as are high-level summaries of the activities or topics discussed.
Given that the Salesforce data is not meant to be a comprehensive record of all interactions and activities, the evaluation team feels the evidence indicates that logic model components A – H are well supported. The evaluation team found significant evidence of implementation staff (and PG&E) reaching out to potential utility partners (B) and collaborating with the retailer to implement retailer implementation plans (H). There was also evidence of activities supporting logic model components A, C, D, E, F, and G, though with fewer records. However, this does not mean that these latter logic model components were any less supported. The nature of many of these logic model components does not lend itself to email interactions. For example, logic model component A: PG&E characterizes markets and estimate savings potential for candidate products, likely included a significant amount of Internet research and secondary data review. Further, because the Salesforce data predominantly captures email exchanges, it does not capture the full extent of communication and collaboration that occurred with regards to all these topics. More is said with regards to the limitations of the Salesforce data review in the Synthesis and Research Objectives chapter under the EO1: Test various methods to evaluate the RPP Program subsection.
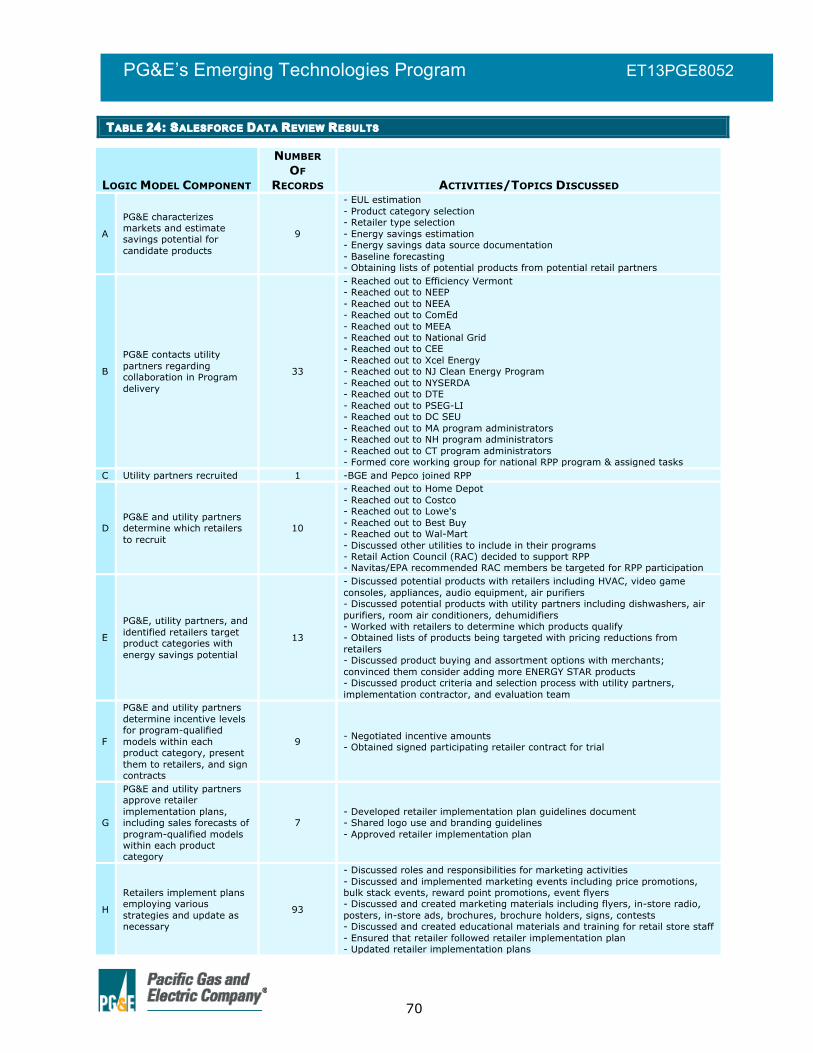
70
PG&E’s Emerging Technologies Program ET13PGE8052
TABLE 24: SALESFORCE DATA REVIEW RESULTS
LOGIC MODEL COMPONENT
NUMBER OF
RECORDS ACTIVITIES/TOPICS DISCUSSED
A
PG&E characterizes markets and estimate savings potential for candidate products
9
- EUL estimation - Product category selection - Retailer type selection - Energy savings estimation - Energy savings data source documentation - Baseline forecasting - Obtaining lists of potential products from potential retail partners
B
PG&E contacts utility partners regarding collaboration in Program delivery
33
- Reached out to Efficiency Vermont - Reached out to NEEP - Reached out to NEEA - Reached out to ComEd - Reached out to MEEA - Reached out to National Grid - Reached out to CEE - Reached out to Xcel Energy - Reached out to NJ Clean Energy Program - Reached out to NYSERDA - Reached out to DTE - Reached out to PSEG-LI - Reached out to DC SEU - Reached out to MA program administrators - Reached out to NH program administrators - Reached out to CT program administrators - Formed core working group for national RPP program & assigned tasks
C Utility partners recruited 1 -BGE and Pepco joined RPP
D PG&E and utility partners determine which retailers to recruit
10
- Reached out to Home Depot - Reached out to Costco - Reached out to Lowe's - Reached out to Best Buy - Reached out to Wal-Mart - Discussed other utilities to include in their programs - Retail Action Council (RAC) decided to support RPP - Navitas/EPA recommended RAC members be targeted for RPP participation
E
PG&E, utility partners, and identified retailers target product categories with energy savings potential
13
- Discussed potential products with retailers including HVAC, video game consoles, appliances, audio equipment, air purifiers - Discussed potential products with utility partners including dishwashers, air purifiers, room air conditioners, dehumidifiers - Worked with retailers to determine which products qualify - Obtained lists of products being targeted with pricing reductions from retailers - Discussed product buying and assortment options with merchants; convinced them consider adding more ENERGY STAR products - Discussed product criteria and selection process with utility partners, implementation contractor, and evaluation team
F
PG&E and utility partners determine incentive levels for program-qualified models within each product category, present them to retailers, and sign contracts
9 - Negotiated incentive amounts - Obtained signed participating retailer contract for trial
G
PG&E and utility partners approve retailer implementation plans, including sales forecasts of program-qualified models within each product category
7 - Developed retailer implementation plan guidelines document - Shared logo use and branding guidelines - Approved retailer implementation plan
H
Retailers implement plans employing various strategies and update as necessary
93
- Discussed roles and responsibilities for marketing activities - Discussed and implemented marketing events including price promotions, bulk stack events, reward point promotions, event flyers - Discussed and created marketing materials including flyers, in-store radio, posters, in-store ads, brochures, brochure holders, signs, contests - Discussed and created educational materials and training for retail store staff - Ensured that retailer followed retailer implementation plan - Updated retailer implementation plans

71
PG&E’s Emerging Technologies Program ET13PGE8052
IMPACT EVALUATION RESULTS The evaluation team conducted several analyses with the retailer sales data relying on multiple methods. One objective of using multiple methods was to assess the different approaches to better understand their usefulness and potential as evaluation techniques for this complicated program moving forward. Another objective was to draw from the different approaches in order to find multiple forms of support for drawing robust conclusions with regards to the efficacy and impacts of the program.
Where possible, the evaluation team leveraged the fact that we had sales data for all the participating retailer’s nonparticipating stores within the State of California to use as a comparison group. While the comparison group provided the evaluation team with the ability to apply more rigorous analytic approaches, the exact same design will not likely be possible in the future. As noted elsewhere in this report, within-state comparisons will probably not be possible because in a scaled-up implementation of the program, participating retailers will require that all their California stores participate in the program. Obtaining nonparticipating retailer sales data is also unlikely as this is viewed as sensitive, confidential information that nonparticipating retailers would have no incentive to share. State-to-state comparisons using participating retailers nonparticipating store data is also a questionable approach for two reasons. First, retailers have indicated that most of their purchasing and promotional decisions are made at the national level, which means that finding stores unaffected by the program would be difficult. Second, the RPP Program is being scaled-up to a national program, which means finding unaffected stores will become increasingly difficult. That all said, the comparison group approaches are inherently the strongest approaches and will be considered. However, alternative comparative approaches such as using secondary data from organizations such as NPD or AHAM, will also be pursued for future evaluations.
The remainder of this chapter presents the results of each of the different analyses conducted using the retailer sales data. Each section starts with a brief description of how the analysis was conducted, followed by a description of the results.
DIFFERENCE-IN-DIFFERENCES (DID) ANALYSIS OF PROGRAM QUALIFIED SHARE
(PQS) The first analysis conducted was a simple difference-in-differences (DID) analysis of the PQS for each of the targeted product categories, comparing the historical PQS values to the trial-period PQS values for the participating and nonparticipating stores. For participating stores, the mean PQS in the pre-trial (historical) period was subtracted from the mean PQS in the trial period. The same calculation was done for the nonparticipating stores. The difference between these two PQS differences equals the net impact of the RPP Trial. The results shown here in the body of this report present the aggregate results, pooling PG&E and SMUD together; Appendix D provides the same tables and figures, but reported separately for PG&E and SMUD. Table 25 shows the total number of program-qualified (PQ) and non-program-qualified (Non-PQ) units sold, as well as the PQS values, over both the 21-month historical time

72
PG&E’s Emerging Technologies Program ET13PGE8052
period and the 14-month trial period for participating and nonparticipating stores.27 Table 26 presents the difference-in-differences calculations based on the PQS values. Figure 9 charts the PQS values for the different time periods for the participating and nonparticipating stores. There are several findings from these results worth highlighting. First, the final column in Table 26 shows the final difference scores for all the product classes. In all cases except for the chest freezers, the final differences are positive, suggesting that the PQS values for the participating stores increased from the historical period after accounting for any contemporaneous change in the nonparticipating stores. That is, there appears to be a program effect for all the product categories other than the chest freezers. The net effects range from 14% for the room air conditioner and compact refrigerator categories to about 2% for the Blu-Ray player and medium refrigerator categories. Another thing to notice from Table 25 is that in many cases the sales volumes were rather small. For example, looking just at the program-qualified sales for the participating stores during the trial period, the table shows that a total of 45 medium refrigerators, 70 chest freezers, 129 very large refrigerators, and 170 air cleaners were sold. When we consider that this was a 14-month trial that ran in a total of 24 participating stores (excluding the two stores that terminated participation due to unforeseen business circumstances), this means that roughly 0.124 medium refrigerators were sold per store per month, 0.192 chest freezers per store per month, 0.354 very large refrigerators per store per month, and 0.467 air cleaners per store per month. Such low sales volumes make the PQS values very sensitive to small variations in monthly sales. For example, if only two total units were sold in one month and one of the units was program-qualified, we would have a PQS of 50%. Then, if in the next month only one unit was sold and it was not qualified, the PQS would be 0%. Then maybe in the next month one unit was sold again, but this unit was program-qualified; then the PQS would be 100%. While this issue should be kept in mind when reviewing the results of this particular evaluation, it should also be noted that such small sales volumes are unlikely to be such and an issue in a larger, scaled-up version of the program. Once all of a retailer's stores are participating in California, sales volumes would presumably be significantly larger. Another thing to note form these results is that in some cases very large differences were detected between the historical and trial periods among the participating stores. For example, there was a 44% increase in PQS from the historical to the trial period for sound bars. Similarly, there was a 39% increase in PQS for Blu-Ray players. While alone these results would appear quite impressive, we also have to consider the fact that the nonparticipating stores also exhibited similar PQS increases for these product categories (40% and 37% respectively). Thus, the net effects of the program for these products are rather meager at 4% for sound bars and 2% for Blu-Ray players, because these assortment changes appear to have taken place in both the participating and nonparticipating stores.28
27 The 17 nonparticipating stores in the PG&E service territory were pooled with the other 49 nonparticipating stores throughout the state. There were no nonparticipating stores in the SMUD service territory. 28 While the retailer did add a new refrigerator to their assortment as part of the trial, this was limited to a single model and stock was only provided to participating stores. Other new models did appear in the product sales data from time to time, but these appeared in both participating and nonparticipating stores. The retailer merchant interviews suggested no substantive product assortment changes were due to the trial other than the refrigerator category.

73
PG&E’s Emerging Technologies Program ET13PGE8052
These are also important findings because they suggest that these two product categories may not need the support of the program. The historical PQS for Blu-Ray players was roughly 28% and jumped to 67% during the trial period; the historical PQs for sound bars was about 11% and jumped to roughly 53% in one year. In the future, it will be difficult to achieve additional lift. However, if the RPP Program wished to continue incenting these product categories, it should consider incenting models that are more efficient than just meeting the ENERGY STAR specification.29
29 Actually, the plans for the program are to incent sound bars at the ENERGY STAR +50% level instead of just meeting the ENERGY STAR specification. Blu-Ray players are not currently expected to be part of the next iteration of the program.

74
PG&E’s Emerging Technologies Program ET13PGE8052
TABLE 25: COMPARING UNIT SALES VOLUMES AND PROGRAM-QUALIFIED SHARE FOR HISTORICAL AND TRIAL PERIODS FOR PARTICIPATING AND NONPARTICIPATING STORES
Product Category Class
PARTICIPATING STORES (N=24) NONPARTICIPATING STORES (N=66) HISTORICAL TRIAL PERIOD HISTORICAL TRIAL PERIOD
Non-PQ PQ PQS Non-PQ PQ PQS Non-PQ PQ PQS Non-PQ PQ PQS Air Cleaner <100 CADR 404 216 35% 174 170 49% 1,112 459 29% 474 255 35% DVD/Blu-Ray Blu-Ray 2,494 952 28% 1,017 2,046 67% 7,444 3,105 29% 3,254 6,525 67% DVD/Blu-Ray DVD 13,991 3,482 20% 5,789 1,300 18% 37,050 10,098 21% 19,254 3,971 17% HTiB Sound bar 834 92 10% 738 872 54% 2,289 314 12% 2,349 2,524 52% Freezer Chest 2,613 70 3% 1,998 70 3% 5,021 68 1% 3,862 104 3% Refrigerator Compact Mini 1,332 217 14% 1,083 332 23% 3,136 664 17% 2,910 416 13% Refrigerator Medium 1,096 49 4% 775 45 5% 2,304 84 4% 1,801 51 3% Refrigerator Very Large 127 67 35% 166 129 44% 247 110 31% 405 229 36% Room AC <12,000 BTU 2,279 659 22% 1,047 272 21% 7,686 2,203 22% 4,731 308 6% TOTAL 25,170 5,804 19% 12,787 5,236 29% 66,289 17,105 21% 39,040 14,383 27%
TABLE 26: DIFFERENCE-IN-DIFFERENCES TABLE COMPARING PQS OF PARTICIPATING AND NONPARTICIPATING STORES
Product Category Class
Part Difference
NonPart Difference DID
Air Cleaner <100 CADR 15% 6% 9% DVD/Blu-Ray Blu-Ray 39% 37% 2% DVD/Blu-Ray DVD -2% -4% 3% HTiB Sound bar 44% 40% 4% Freezer Chest 1% 1% -1% Refrigerator Compact Mini 9% -5% 14% Refrigerator Medium 1% -1% 2% Refrigerator Very Large 9% 5% 4% Room AC <12,000 BTU -2% -16% 14% TOTAL 10% 6% 4%
FIGURE 9: PARTICIPATING AND NONPARTICIPATING STORE PQS FOR HISTORICAL AND TRIAL PERIODS
0%
10%
20%
30%
40%
50%
60%
70%
80%
<100 CADR
Blu-Ray DVD Sound bar
Chest Compact Mini
Medium Very Large
<12,000 BTU
Historical - Nonparticipating Stores Historical - Participating Stores
Program Period - Nonparticipating Stores Program Period - Participating

75
PG&E’s Emerging Technologies Program ET13PGE8052
MODELLING APPROACHES
This section of the report presents a discussion of the results from the various modeling efforts aimed at predicting PQS using the historical and trial-period retailer sales data. The approaches used in this evaluation included: (1) forecasted baseline, (2) participant-only modified step regression, (3) participant-only segmented regression, (4) comparison-based modified step regression, and (5) comparison-based segmented regression (see the Methods chapter for a detailed discussion of each of these approaches). Note that an objective of the modeling efforts was not to estimate net program energy and demand savings and a net-to-gross ratio, since as we show with the results, doing so is a complicated task and will vary, at least in the short term, based on the approach used. Further, we also argue that, for any market transformation program, estimates of these parameters need to be based on program performance over a much longer timeframe or we run the risk of drawing misleading conclusions regarding the overall efficacy, impacts, and potential of the program (more on this later). Rather, the discussion is centered on assessing the various approaches as tools for evaluating the RPP Program moving forward and comparing and contrasting the approaches in terms of their potential usefulness and issues to consider when applying them. To frame this discussion a single product category—Air Cleaners (<100 CADR)—was selected for illustrative purpose. Appendix E through Appendix I contain the modeling results for all the other product categories.
• The results for the forecasted baseline are shown in Figure 10, with the computation of net program effects on PQS shown in Table 27.
• The results of the participant-only modified step regression are in Figure 11, with the ANOVA results presented in Table 28, the coefficients results in Table 29, and the computation of net program effects in Table 30.
• The results of the participant-only segmented regression are in Figure 12, with the ANOVA results presented in Figure 28, the coefficients results in Table 32, and the computation of net program effects in Table 33.
• The results of the comparison-based modified step regression are in Figure 13, with the ANOVA results presented in Table 34, the coefficients results in Table 35, and the computation of net program effects in Table 36.
• The results of the comparison-based segmented regression are in Figure 14, with the ANOVA results presented in Table 37, the coefficients results in Table 38, and the computation of net program effects in Table 39.
The air cleaners are a useful product category to frame this discussion for several reasons. First, very little was done to specifically promote the air cleaner category during the trial until the 2014 holiday season (the last three months of the Trial). The only interventions introduced outside of the holiday season were the introduction of the general in-store broadcasts highlighting energy efficient products in November of 2013, the first month of the Trial and the 22nd month of the data series (denoted as Int22—the lightest-blue shaded areas in the figures), and the introduction of a general consumer electronics brochure and store signage emphasizing ENERGY STAR in June 2014, the 29th month of the series (denoted as Int29—the second blue-shaded areas in the figures). However, when the air cleaner was more aggressively promoted in October through December 2014, a very
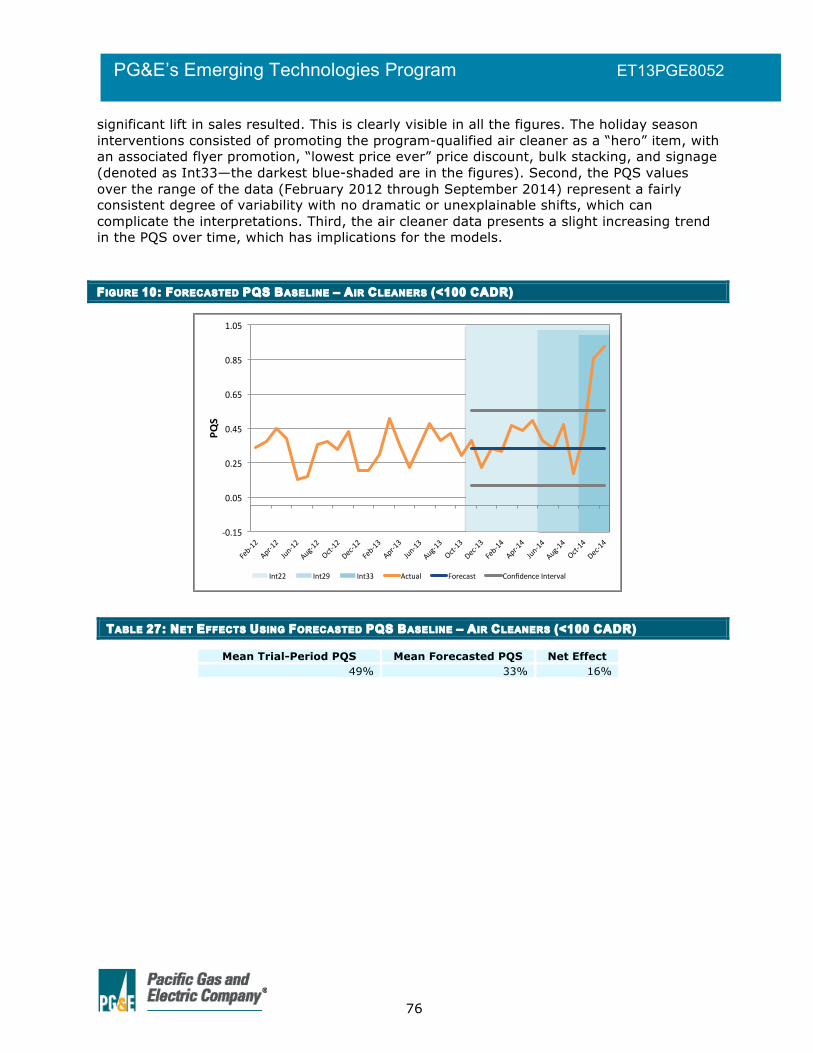
76
PG&E’s Emerging Technologies Program ET13PGE8052
significant lift in sales resulted. This is clearly visible in all the figures. The holiday season interventions consisted of promoting the program-qualified air cleaner as a “hero” item, with an associated flyer promotion, “lowest price ever” price discount, bulk stacking, and signage (denoted as Int33—the darkest blue-shaded are in the figures). Second, the PQS values over the range of the data (February 2012 through September 2014) represent a fairly consistent degree of variability with no dramatic or unexplainable shifts, which can complicate the interpretations. Third, the air cleaner data presents a slight increasing trend in the PQS over time, which has implications for the models.
FIGURE 10: FORECASTED PQS BASELINE – AIR CLEANERS (<100 CADR)
TABLE 27: NET EFFECTS USING FORECASTED PQS BASELINE – AIR CLEANERS (<100 CADR)
Mean Trial-Period PQS Mean Forecasted PQS Net Effect 49% 33% 16%
!0.15&
0.05&
0.25&
0.45&
0.65&
0.85&
1.05&
Feb!12&
Apr!12&
Jun!12&
Aug!12&
Oct!12&
Dec!12&
Feb!13&
Apr!13&
Jun!13&
Aug!13&
Oct!13&
Dec!13&
Feb!14&
Apr!14&
Jun!14&
Aug!14&
Oct!14&
Dec!14&
PQS$
Int22& Int29& Int33& Actual& Forecast& Confidence&Interval&

77
PG&E’s Emerging Technologies Program ET13PGE8052
FIGURE 11: PARTICIPANT-ONLY PQS REGRESSION (MODIFIED STEP) – AIR CLEANERS (<100 CADR)
TABLE 28: ANOVA TABLE FOR PARTICIPANT-ONLY PQS REGRESSION (MODIFIED STEP) – AIR CLEANERS (<100 CADR)
Sum of Square df Mean Square F Sig. Regression 0.737 4.000 0.184 10.771 0.000 Residual 0.513 30.000 0.017 Total 1.249 34.000 R-Square 0.590 Adjusted R-Square 0.535
TABLE 29: COEFFICIENTS TABLE FOR PARTICIPANT-ONLY PQS REGRESSION (MODIFIED STEP) – AIR CLEANERS (<100 CADR)
Coefficient Estimate Std. Error T Value Sig. (Constant) 0.310 0.050 6.165 0.000 MoNo 0.004 0.004 0.897 0.377 Int22 -0.024 0.086 -0.280 0.782 Int29 -0.062 0.091 -0.681 0.501 int33 0.431 0.097 4.441 0.000
TABLE 30: NET EFFECTS USING PARTICIPANT-ONLY PQS REGRESSION (MODIFIED STEP) – AIR CLEANERS (<100 CADR)
Mean With-Program Mean Without-Program Net Effect 46% 42% 4%
0.00#
0.10#
0.20#
0.30#
0.40#
0.50#
0.60#
0.70#
0.80#
0.90#
1.00#
Feb012#
Mar012#
Apr01
2#
May012#
Jun012#
Jul01
2#
Aug01
2#
Sep012#
Oct01
2#
Nov01
2#
Dec01
2#
Jan013#
Feb013#
Mar013#
Apr01
3#
May013#
Jun013#
Jul01
3#
Aug01
3#
Sep013#
Oct01
3#
Nov01
3#
Dec01
3#
Jan014#
Feb014#
Mar014#
Apr01
4#
May014#
Jun014#
Jul01
4#
Aug01
4#
Sep014#
Oct01
4#
Nov01
4#
Dec01
4#
PQS$
Int22# Int29# Int33# PQS# With#Program# Without#Program#

78
PG&E’s Emerging Technologies Program ET13PGE8052
FIGURE 12: PARTICIPANT-ONLY PQS REGRESSION (SEGMENTED) – AIR CLEANERS (<100 CADR)
TABLE 31: ANOVA TABLE FOR PARTICIPANT-ONLY PQS REGRESSION (SEGMENTED) – AIR CLEANERS (<100 CADR)
Sum of Square df Mean Square F Sig. Regression 0.909 7.000 0.130 10.315 0.000 Residual 0.340 27.000 0.013 Total 1.249 34.000 R-Square 0.728 Adjusted R-Square 0.657
TABLE 32: COEFFICIENTS TABLE FOR PARTICIPANT-ONLY PQS REGRESSION (SEGMENTED) – AIR CLEANERS (<100 CADR)
Coefficient Estimate Std. Error T Value Sig. (Constant) 0.325 0.044 7.426 0.000 MoNo 0.002 0.004 0.633 0.532 Int22 -0.156 0.111 -1.405 0.171 Time22 0.037 0.022 1.673 0.106 Int29 -0.039 0.177 -0.223 0.825 Time29 -0.083 0.061 -1.361 0.185 Int33 -0.001 0.194 -0.006 0.995 Time33 0.278 0.092 3.025 0.005
TABLE 33: NET EFFECTS USING PARTICIPANT-ONLY PQS REGRESSION (SEGMENTED) – AIR CLEANERS (<100 CADR)
Mean With-Program Mean Without-Program Net Effect 45% 39% 5%
0.00#
0.10#
0.20#
0.30#
0.40#
0.50#
0.60#
0.70#
0.80#
0.90#
1.00#
0.10#
0.20#
0.30#
0.40#
0.50#
0.60#
0.70#
0.80#
0.90#
1.00#
Feb01
2#Ma
r012#
Apr01
2#Ma
y012#
Jun012
#Jul
012#
Aug01
2#Sep01
2#Oc
t012#
Nov01
2#De
c012#
Jan013
#Feb01
3#Ma
r013#
Apr01
3#Ma
y013#
Jun013
#Jul
013#
Aug01
3#Sep01
3#Oc
t013#
Nov01
3#De
c013#
Jan014
#Feb01
4#Ma
r014#
Apr01
4#Ma
y014#
Jun014
#Jul
014#
Aug01
4#Sep01
4#Oc
t014#
Nov01
4#De
c014#
PQS$
Int22# Int29# Int33# PQS# With#Program# Without#Program#

79
PG&E’s Emerging Technologies Program ET13PGE8052
FIGURE 13: COMPARISON-BASED PQS REGRESSION (MODIFIED STEP) – AIR CLEANERS (<100 CADR)
TABLE 34: ANOVA TABLE FOR COMPARISON-BASED PQS REGRESSION (MODIFIED STEP) – AIR CLEANERS (<100 CADR)
Sum of Square df Mean Square F Sig. Regression 0.935 8.000 0.117 12.478 0.000 Residual 0.571 61.000 0.009 Total 1.506 69.000 R-Square 0.788 Adjusted R-Square 0.571
TABLE 35: COEFFICIENTS TABLE FOR COMPARISON-BASED PQS REGRESSION (MODIFIED STEP) – AIR CLEANERS (<100 CADR)
Coefficient Estimate Std. Error T Value Sig. (Constant) 0.250 0.031 8.132 0.000 MoNo 0.004 0.002 1.799 0.077 isPart 0.057 0.027 2.087 0.041 Int22 0.008 0.055 0.141 0.889 PartInt22 -0.035 0.061 -0.583 0.562 Int29 -0.021 0.068 -0.310 0.758 PartInt29 -0.042 0.094 -0.448 0.655 Int33 -0.074 0.089 -0.829 0.410 PartInt33 0.504 0.114 4.437 0.000
TABLE 36: NET EFFECTS USING COMPARISON-BASED PQS REGRESSION (MODIFIED STEP) – AIR CLEANERS (<100 CADR)
Mean Participating Store PQS Mean Nonparticipating Store PQS Net Effect 46% 35% 11%
0.00#
0.10#
0.20#
0.30#
0.40#
0.50#
0.60#
0.70#
0.80#
0.90#
1.00#
Feb01
2#
Mar01
2#
Apr01
2#
May01
2#
Jun012
#
Jul012
#
Aug01
2#
Sep01
2#
Oct01
2#
Nov01
2#
Dec01
2#
Jan013
#
Feb01
3#
Mar01
3#
Apr01
3#
May01
3#
Jun013
#
Jul013
#
Aug01
3#
Sep01
3#
Oct01
3#
Nov01
3#
Dec01
3#
Jan014
#
Feb01
4#
Mar01
4#
Apr01
4#
May01
4#
Jun014
#
Jul014
#
Aug01
4#
Sep01
4#
Oct01
4#
Nov01
4#
Dec01
4#
PQS$
Int22# Int29# Int33# NonparEcipaEng#0#FiGed#
NonparEcipaEng#0#Actual# ParEcipaEng#0#FiGed# ParEcipaEng#0#Actual#

80
PG&E’s Emerging Technologies Program ET13PGE8052
FIGURE 14: COMPARISON-BASED PQS REGRESSION (SEGMENTED) – AIR CLEANERS (<100 CADR)
TABLE 37: ANOVA TABLE FOR COMPARISON-BASED PQS REGRESSION (SEGMENTED) – AIR CLEANERS (<100 CADR)
Sum of Square df Mean Square F Sig. Regression 1.120 14.000 0.080 11.400 0.000 Residual 0.386 55.000 0.007 Total 1.506 69.000 R-Square 0.744 Adjusted R-Square 0.678
TABLE 38: COEFFICIENTS TABLE FOR COMPARISON-BASED PQS REGRESSION (SEGMENTED) – AIR CLEANERS (<100 CADR)
Coefficient Estimate Std. Error T Value Sig. (Constant) 0.256 0.027 9.521 0.000 MoNo 0.004 0.002 1.752 0.085 isPart 0.057 0.024 2.404 0.020 Int22 0.018 0.079 0.223 0.825 Time22 0.000 0.017 -0.021 0.984 PartInt22 -0.186 0.108 -1.720 0.091 PartTime22 0.036 0.024 1.535 0.131 Int29 0.097 0.124 0.781 0.438 Time29 -0.050 0.045 -1.097 0.277 PartInt29 -0.137 0.182 -0.753 0.455 PartTime29 -0.033 0.064 -0.521 0.604 Int33 0.126 0.182 0.694 0.490 Time33 -0.008 0.088 -0.094 0.925 PartInt33 -0.127 0.232 -0.548 0.586 PartTime33 0.286 0.111 2.573 0.013
TABLE 39: NET EFFECTS USING COMPARISON-BASED PQS REGRESSION (SEGMENTED) – AIR CLEANERS (<100 CADR)
Mean Participating Store PQS Mean Nonparticipating Store PQS Net Effect 45% 34% 10%
0.00#
0.10#
0.20#
0.30#
0.40#
0.50#
0.60#
0.70#
0.80#
0.90#
1.00#
Feb01
2#
Mar01
2#
Apr01
2#
May01
2#
Jun012
#
Jul012
#
Aug01
2#
Sep01
2#
Oct01
2#
Nov01
2#
Dec01
2#
Jan013
#
Feb01
3#
Mar01
3#
Apr01
3#
May01
3#
Jun013
#
Jul013
#
Aug01
3#
Sep01
3#
Oct01
3#
Nov01
3#
Dec01
3#
Jan014
#
Feb01
4#
Mar01
4#
Apr01
4#
May01
4#
Jun014
#
Jul014
#
Aug01
4#
Sep01
4#
Oct01
4#
Nov01
4#
Dec01
4#
PQS$
Int22# Int29# Int33# NonparEcipaEng#0#FiGed#
NonparEcipaEng#0#Actual# ParEcipaEng#0#FiGed# ParEcipaEng#0#Actual#

81
PG&E’s Emerging Technologies Program ET13PGE8052
Under the forecasted baseline approach, the forecasted baseline appears reasonable. However, it is important to emphasize that because of the variability in the historical time-series, the forecast model for all forecast of PQS is, as noted earlier, exponential smoothing. Such a model essentially derives the forecast as the last data point before the beginning of the intervention period in November 2013. That is, because of the “noise” in the data, the forecasting approach was unable to detect seasonality or trend for any product category—it only detected a level. Thus, while the forecast seems reasonable for the air cleaner category, it is because the last non-trial-period data point happens to occupy a point near the middle of the overall range of variability. For other product categories presented in the Appendix E, this is not the case and the forecasts result in some extreme predictions (e.g., see Blu-Ray players: Figure 20, compact refrigerators: Figure 23, and very large refrigerators Figure 25). With regards to the forecasted baseline approach it is also notable that the actual plotted PQS values for the 2014 holiday season interventions lie outside the 95% confidence interval for the forecast, indicating that the difference between the PQS during November and December 2014 and the forecasted baseline is statistically significantly different than the forecast. Under the forecasted baseline approach, taking the difference between the mean actual monthly PQS values during the trial period and the forecasted counterfactual baseline results in a positive net program effect of 16% for the air cleaner (<100 CADR) category. Under the participant-only modified step regression approach (see Figure 11), we see that the model fits the data reasonably well (the dark blue line in the figure denoted “With-Program”), capturing general level shifts in the trial-period series. Overall, the with-program regression has an adjusted R-square of 0.535. In addition, the coefficients table shows that the coefficient for Int33 is highly significant, suggesting the interventions implemented after the 33rd month of the series (October 2014) have effects that are statistically significantly associated with increases in the PQS. Likewise, the regression depicting the “Without-Program” condition (the light blue plotted line that was derived by computing predicted values only using the intercept and slope terms) also fits the data reasonably well. Under the participant-only modified step regression approach, taking the difference between the mean monthly predicted PQS values over the trial period for the with-program and without-program conditions results in a positive net program effect of 4% for the air cleaner (<100 CADR) category. Under the participant-only segmented regression approach (see Figure 12), we also see that the model fits the data well (adjusted R-square of 0.657). The model also detected the significant positive association between PQS and the interventions starting in October 2014. Under the participant-only segmented regression approach, taking the difference between the mean monthly predicted PQS values over the trial period for the with-program and without-program conditions results in a positive net program effect of 5% for the air cleaner (<100 CADR) category. Using the more robust comparison-based modified step regression (see Figure 13), we see that both the participating (orange lines) and nonparticipating (blue lines) sales data series are fitted well to the actual data (solid lines represent actual PQS values; dashed lines represent fitted values). The adjusted R-square is 0.571 and the model detects a highly statistically significant association between the PQS and the PartInt33 coefficient (the coefficient represents the incremental effect of the interventions that began in the 33rd month of the series that are attributable to being a participating store). Under the comparison-based modified step regression approach, taking the difference between

82
PG&E’s Emerging Technologies Program ET13PGE8052
the mean monthly predicted PQS values over the trial period for the with-program and without-program conditions results in a positive net program effect of 11% for the air cleaner (<100 CADR) category. Finally, the comparison-based segmented regression also fits the data quite well (see Figure 14), with an adjusted R-Square of 0.678. This model also detects a statically significant positive association between the PQS and the interventions that began in the 33rd month (PartTime33 coefficient p=0.013). Under the comparison-based segmented regression approach, taking the difference between the mean monthly predicted PQS values over the trial period for the with-program and without-program conditions results in a positive net program effect of 10% for the air cleaner (<100 CADR) category. In all cases the predicted models fit the actual data reasonably well. Also, under all of the approaches the models showed a significant association between PQS and the interventions implemented during the 2014 holiday season. This suggests that the models considered are doing what we generally want them to do—predicting the patterns of sales and detecting any significant program effects.30 However, the estimates of net effects of the program varied quite a bit across the different approaches, ranging from 4% with the participant-only modified step regression to 16% using the forecasted baseline approach (this includes the difference-in-differences approach presented in the previous section of this report). Results vary even more dramatically across the approaches for other product categories. Table 40 presents the mean monthly PQS values (for the trial period) for all the product categories under all the approaches; Table 41 shows the estimated net effects computed under each modeling approach including the difference-in-differences approach. Evident from these tables is the overall variability across the different approaches. The greatest variability is associated with the compact refrigerator category, where the difference-in-differences approach resulted in a net effect of +14% and the forecasted baseline approach resulted in a net effect of -57%, for a total range of 71%. The medium refrigerator category revealed the least variability, with a total range of 5% (7% using the participant-only segmented regression approach; 1% using the forecasted baseline approach).
30 With regards to “detecting program effects,” it is worth emphasizing that the evaluation team admittedly selected a product category with a rather large known effect for this illustration. While all the air cleaner models were able to detect an effect of the particular intervention, this is not necessarily the case for all interventions or all the models for all the product types. Nevertheless, the overall evidence suggests these general approaches are suitable for detecting at least some interventions.

83
PG&E’s Emerging Technologies Program ET13PGE8052
TABLE 40: MEAN MONTHLY PQS VALUES DURING THE RPP TRIAL PERIOD
Product Class
Participant-Only Comparison-Based Forecasted Baseline Modified Step Segmented Modified Step Segmented
Actual Forecast With
Program Without Program
With Program
Without Program Part NonPart Part NonPart
Air Cleaner <100 CADR 49% 33% 46% 42% 45% 39% 46% 35% 45% 34% DVD/Blu-Ray Blu-Ray 67% 71% 66% 89% 68% 101% 66% 66% 68% 66% DVD/Blu-Ray DVD 18% 14% 18% 11% 19% 9% 18% 18% 19% 19% Freezer Chest 3% 3% 3% 1% 3% 0% 3% 3% 3% 3% Refrigerator Compact 23% 80% 14% 51% 13% 50% 14% 6% 13% 6% Refrigerator Medium 5% 4% 6% 0% 6% -1% 6% 3% 6% 3% Refrigerator Very Large 44% 100% 47% 60% 50% 80% 47% 41% 50% 47% HTiB Sound Bars 54% 36% 52% 33% 49% 46% 52% 51% 49% 47% Room ACs <12,000 BTU 21% 26% 29% 28% 28% 28% 29% 15% 28% 11%
TABLE 41: ESTIMATED NET PROGRAM EFFECTS ON PQS
Product Class
Participant-Only Comparison-Based Forecasted
Baseline Modified
Step Segmented Modified
Step Segmented DID Air Cleaner <100 CADR 16% 4% 5% 11% 10% 9% DVD/Blu-Ray Blu-Ray -4% -24% -33% -1% 1% 2% DVD/Blu-Ray DVD 4% 7% 10% 1% 1% 3% Freezer Chest 1% 3% 3% 1% 1% -1% Refrigerator Compact -57% -38% -37% 8% 7% 14% Refrigerator Medium 1% 6% 7% 3% 3% 2% Refrigerator Very Large -56% -13% -30% 6% 3% 4% HTiB Sound Bars 18% 18% 3% 1% 1% 4% Room Air Conditioners <12,000 BTU -5% 1% -1% 14% 17% 14%

84
PG&E’s Emerging Technologies Program ET13PGE8052
That all said, the comparison-group-based approaches are certainly the strongest and most robust approaches, even though there are questions as to whether these options will be available in the future. Looking only at the comparison-based results we see a much greater level of consistency, with the general pattern indicating there were likely positive program-related effects in all but the chest freezer product category (and possibly the standard DVD player category). Ultimately, however, if we had to select a single approach for this particular evaluation, the evaluation team would select the comparison-based modified step regression results. These models fit the data reasonably well, but are also the most parsimonious of the modeling approaches. The comparison-based segmented regression models are far more complex and have fewer degrees of freedom due to the number of variables in the models. The difference-in-differences is a relatively coarse approach because it does not incorporate the month-to-month variability inherent in the sales data nor any of the program interventions. This is not to say, however, that any of these models should be abandoned for future evaluations; we believe they all—including the participant-only designs—could be useful in the future as the program scales up.
PRELIMINARY FIRST-YEAR AND LIFETIME EX POST GROSS AND NET SAVINGS As part of this overall evaluation effort, the evaluation team also estimated the preliminary ex post gross energy and demand savings resulting from the RPP Trial. These values are considered “preliminary ex post savings” because the evaluation team recognizes that the CPUC-ED is responsible for conducting the ex post impact evaluations for energy efficiency programs in the State of California. Note that while achieving energy and demand savings from this program were noted earlier as performance objectives, these savings were never expected to be substantial given that the trial was small (only 26 participating stores), the retailer was going through a challenging period financially, and the retailer has a price-point focused target customer base that is not notably driven by energy efficiency. Also, even though the Trial occurred over a 14-month period, results presented elsewhere in this report indicated that the Trial took a while to gain momentum, and major promotional activities did not occur for the first several months, and substantial changes in product assortment were not possible. Table 42 presents the preliminary first-year ex post gross energy (kWh) and demand (kW) program savings resulting from the 14-month RPP Trial with the single participating retailer. The results are presented for PG&E, SMUD, and combined. The first-year gross savings values were derived by taking the per-unit UES values derived for each product class as described in the Methods chapter of this report, and multiplying the values times the quantity sold for each product class. As such, the RPP Trial resulted in total first-year gross energy savings of 126,172.2 kWh (119,389.5 kWh for PG&E; 6,782.7 kWh for SMUD). First-year gross demand savings totaled 15.9 kW (15.2 kW for PG&E; 0.7 kW for SMUD). Table 43 presents the preliminary lifetime ex post gross energy (kWh) and demand (kW) program savings resulting from the 14-month RPP Trial. The lifetime savings were derived by taking UES values and multiplying them by the effective useful life (EUL) values for each of the product classes and multiplying this product by the total number of units sold for each product class. The RPP Trial resulted in lifetime gross energy savings total of 1,030,340.1 kWh (981,257.1 kWh for PG&E; 49,083.0 kWh for SMUD). Lifetime gross demand savings totaled 156.0 kW (149.7 kW for PG&E; 6.3 kW for SMUD).

85
PG&E’s Emerging Technologies Program ET13PGE8052
Table 44 presents the preliminary first-year ex post net energy (kWh) and demand (kW) program savings resulting from the 14-month RPP Trial. The net savings were estimated using the net program effects based on the comparison-based modified step regressions. Total preliminary first-year ex post net energy savings from the trial were 6,664.5 kWh (6,400.1 kWh for PG&E; 264.4 kWh for SMUD). Preliminary first-year ex post demand savings were 1.8 kW (1.7 kW for PG&E; 0.01 kW for SMUD). Table 45 presents the preliminary lifetime ex post net energy (kWh) and demand (kW) program savings resulting from the 14-month RPP Trial. The net savings were estimated using the net program effects based on the comparison-based modified step regressions. Total preliminary lifetime ex post net energy savings from the trial was 64,547.1 kWh (62,123.9 kWh for PG&E; 2,423.2 kWh for SMUD). Preliminary lifetime ex post demand savings was 17.0 kW (16.3 kW for PG&E; 0.8 kW for SMUD). Taking the total portfolio net kWh from Table 44 and the total portfolio gross kWh from Table 42, the evaluation team estimates the partial leading indicator net-to-gross ratio (PLI-NTGR)31 is:
6,664.5 kWh/ 126,172.2 kWh= 0.0528 For PG&E the PLI-NTGR is:
6,400.1 kWh/ 119,389.5 kWh= 0.0536
For SMUD the PLI-NTGR ratio is:
264.45 kWh/ 6,782.7 kWh= 0.0390
Readers should not misinterpret the net savings values and the PLI-NTGR of 5%. As discussed numerous times throughout this evaluation report, first-year savings from this trial for this market transformation program were not expected to be substantial. The retailer did not have the opportunity to make notable changes to their product assortment and all the net effects are essentially due to marketing and promotional activities. As such, one way to view the PLI-NTGR is that a 5% lift was achieved solely through promotions. The main point to emphasize, however, is that with a longer-term implementation of a larger-scale RPP Program, the net-to-gross ratio is expected to increase substantially once retailers do have the opportunity to assort a greater proportion of energy efficient models. In addition, in conjunction with the RPP Program theory, effects upon the greater market are expected to filter down to nonparticipating retailers (i.e., through spillover), which will also contribute to increases in the net-to-gross ratio over time. Finally, it is important to also recognize that for the purposes of the trial, the qualification criteria for program-qualified products was simply set to meeting the minimum ENERGY STAR specification, which also contributed to free ridership as the retailer was already stocking some ENERGY STAR products. Future plans for the program include setting higher efficiency standards to target certain product categories (e.g., ENERGY STAR +X%), which will lead to higher net-to-gross ratios.
31 The evaluation team refers to the computed value as the “partial leading indicator net-to-gross-ratio” (PLI-NTGR) because we do not want the reader to misinterpret this value as the overall program NTGR.

86
PG&E’s Emerging Technologies Program ET13PGE8052
TABLE 42: PRELIMINARY FIRST-YEAR EX POST GROSS PROGRAM SAVINGS
Product Category Class EUL
UES Quantity Sold Preliminary First-Year Ex Post Gross Savings
kWh kW PG&E SMUD Total PG&E SMUD TOTAL
kWh kW kWh kW kWh kW Air Cleaner <100 CADR 9 114.44 0.01293 179 4 183 20,484.6 2.31 457.8 0.05 20,942.4 2.37 DVD/Blu-Ray Blu-Ray 4 4.80 0.00005 2,029 142 2,171 9,739.2 0.10 681.6 0.01 10,420.8 0.11 DVD/Blu-Ray DVD 4 5.90 0.00013 1,271 79 1,350 7,498.9 0.17 466.1 0.01 7,965.0 0.18 HTiB Sound bar 7 52.60 0.00065 861 72 933 45,288.6 0.56 3,787.2 0.05 49,075.8 0.61 Freezer Frzr-Chest-ManDef_Large 11 18.60 0.00330 70 0 70 1,302.0 0.23 0.0 0.00 1,302.0 0.23 Refrigerator Refg-All_CmpMini 14 20.80 0.00380 323 13 336 6,718.4 1.23 270.4 0.05 6,988.8 1.28 Refrigerator RefgFrz-BM_VLarge 14 52.90 0.00950 4 0 4 211.6 0.04 0.0 0.00 211.6 0.04 Refrigerator RefgFrz-BM-Ice_VLarge 14 59.90 0.01080 10 0 10 599.0 0.11 0.0 0.00 599.0 0.11 Refrigerator RefgFrz-SM-TTD_VLarge 14 62.50 0.01130 105 0 105 6,562.5 1.19 0.0 0.00 6,562.5 1.19 Refrigerator RefgFrz-TM_CmpMini 14 33.00 0.00590 2 0 2 66.0 0.01 0.0 0.00 66.0 0.01 Refrigerator RefgFrz-TM_Med 14 35.90 0.00670 45 0 45 1,615.5 0.30 0.0 0.00 1,615.5 0.30 Refrigerator RefgFrz-TM_VLarge 14 41.00 0.00760 10 0 10 410.0 0.08 0.0 0.00 410.0 0.08 Room AC <12,000 BTU 9 69.98 0.03296 270 16 286 18,893.2 8.90 1,119.6 0.53 20,012.8 9.43 TOTAL 5,179 326 5,505 119,389.5 15.2 6,782.7 0.7 126,172.2 15.9 Note that the total sales volumes shown in this table include the two participating stores that terminated participation in the trial due to unforessen business circumstances. Some program-qualified units were sold in these stores before they ceased participating and contribute to the gross savings.
TABLE 43: PRELIMINARY LIFETIME EX POST GROSS PROGRAM SAVINGS
Product Category Class EUL
UES Quantity Sold Preliminary Lifetime Ex Post Gross Savings
kWh kW PG&E SMUD Total PG&E SMUD TOTAL
kWh kW kWh kW kWh kW Air Cleaner <100 CADR 9 114.44 179 4 183 184,361.39 20.83 4,119.81 0.47 188,481.20 21.29 DVD/Blu-Ray Blu-Ray 4 4.80 0.00005 2,029 142 2,171 38,956.80 0.40 2,726.40 0.03 41,683.20 0.43 DVD/Blu-Ray DVD 4 5.90 0.00013 1,271 79 1,350 29,995.60 0.66 1,864.40 0.04 31,860.00 0.70 HTiB Sound bar 7 52.60 0.00065 861 72 933 317,020.20 3.92 26,510.40 0.33 343,530.60 4.25 Freezer Frzr-Chest-ManDef_Large 11 18.60 0.00330 70 0 70 14,322.00 2.54 0.00 0.00 14,322.00 2.54 Refrigerator Refg-All_CmpMini 14 20.80 0.00380 323 13 336 94,057.60 17.18 3,785.60 0.69 97,843.20 17.88 Refrigerator RefgFrz-BM_VLarge 14 52.90 0.00950 4 0 4 2,962.40 0.53 0.00 0.00 2,962.40 0.53 Refrigerator RefgFrz-BM-Ice_VLarge 14 59.90 0.01080 10 0 10 8,386.00 1.51 0.00 0.00 8,386.00 1.51 Refrigerator RefgFrz-SM-TTD_VLarge 14 62.50 0.01130 105 0 105 91,875.00 16.61 0.00 0.00 91,875.00 16.61 Refrigerator RefgFrz-TM_CmpMini 14 33.00 0.00590 2 0 2 924.00 0.17 0.00 0.00 924.00 0.17 Refrigerator RefgFrz-TM_Med 14 35.90 0.00670 45 0 45 22,617.00 4.22 0.00 0.00 22,617.00 4.22 Refrigerator RefgFrz-TM_VLarge 14 41.00 0.00760 10 0 10 5,740.00 1.06 0.00 0.00 5,740.00 1.06 Room AC <12,000 BTU 9 69.98 270 16 286 170,039.09 80.09 10,076.39 4.75 180,115.48 84.83 TOTAL 5,179 326 5,505 981,257.1 149.7 49,083.0 6.3 1,030,340.1 156.0 Note that the total sales volumes shown in this table include the two participating stores that terminated participation in the trial due to unforessen business circumstances. Some program-qualified units were sold in these stores before they ceased participating and contribute to the gross savings.

87
PG&E’s Emerging Technologies Program ET13PGE8052
TABLE 44: PRELIMINARY FIRST-YEAR EX POST NET PROGRAM SAVINGS
Product Category Class Net Effect
Preliminary First-Year Ex Post Net Savings
PG&E SMUD TOTAL kWh kW kWh kW kWh kW
Air Cleaner <100 CADR 0.11 2,253.31 0.2546 50.35 0.0057 2,303.66 0.2603 DVD/Blu-Ray Blu-Ray -0.01 -97.39 -0.0010 -6.82 -0.0001 -104.21 -0.0011 DVD/Blu-Ray DVD 0.01 74.99 0.0017 4.66 0.0001 79.65 0.0018 HTiB Sound bar 0.01 452.89 0.0056 37.87 0.0005 490.76 0.0061 Freezer Frzr-Chest-ManDef_Large 0.01 13.02 0.0023 0.00 0.0000 13.02 0.0023 Refrigerator Refg-All_CmpMini 0.08 537.47 0.0982 21.63 0.0040 559.10 0.1021 Refrigerator RefgFrz-BM_VLarge 0.06 12.70 0.0023 0.00 0.0000 12.70 0.0023 Refrigerator RefgFrz-BM-Ice_VLarge 0.06 35.94 0.0065 0.00 0.0000 35.94 0.0065 Refrigerator RefgFrz-SM-TTD_VLarge 0.06 393.75 0.0712 0.00 0.0000 393.75 0.0712 Refrigerator RefgFrz-TM_CmpMini 0.08 5.28 0.0009 0.00 0.0000 5.28 0.0009 Refrigerator RefgFrz-TM_Med 0.03 48.47 0.0090 0.00 0.0000 48.47 0.0090 Refrigerator RefgFrz-TM_VLarge 0.06 24.60 0.0046 0.00 0.0000 24.60 0.0046 Room AC <12,000 BTU 0.14 2,645.05 1.2458 156.74 0.0738 2,801.80 1.3196 TOTAL 6,400.1 1.7 264.4 0.1 6,664.5 1.8
TABLE 45: PRELIMINARY FIRST-YEAR EX POST NET PROGRAM SAVINGS
Product Category Class Net Effect
Preliminary First-Year Ex Post Net Savings
PG&E SMUD TOTAL kWh kW kWh kW kWh kW
Air Cleaner <100 CADR 0.11 20,279.75 2.2911 453.18 0.0512 20,732.93 2.3423 DVD/Blu-Ray Blu-Ray -0.01 -389.57 -0.0040 -27.26 -0.0003 -416.83 -0.0043 DVD/Blu-Ray DVD 0.01 299.96 0.0066 18.64 0.0004 318.60 0.0070 HTiB Sound bar 0.01 3,170.20 0.0392 265.10 0.0033 3,435.31 0.0425 Freezer Frzr-Chest-ManDef_Large 0.01 143.22 0.0254 0.00 0.0000 143.22 0.0254 Refrigerator Refg-All_CmpMini 0.08 7,524.61 1.3747 302.85 0.0553 7,827.46 1.4300 Refrigerator RefgFrz-BM_VLarge 0.06 177.74 0.0319 0.00 0.0000 177.74 0.0319 Refrigerator RefgFrz-BM-Ice_VLarge 0.06 503.16 0.0907 0.00 0.0000 503.16 0.0907 Refrigerator RefgFrz-SM-TTD_VLarge 0.06 5,512.50 0.9967 0.00 0.0000 5,512.50 0.9967 Refrigerator RefgFrz-TM_CmpMini 0.08 73.92 0.0132 0.00 0.0000 73.92 0.0132 Refrigerator RefgFrz-TM_Med 0.03 678.51 0.1266 0.00 0.0000 678.51 0.1266 Refrigerator RefgFrz-TM_VLarge 0.06 344.40 0.0638 0.00 0.0000 344.40 0.0638 Room AC <12,000 BTU 0.14 23,805.47 11.2124 1,410.69 0.6644 25,216.17 11.8768 TOTAL 62,123.9 16.3 2,423.2 0.8 64,547.1 17.0

88
PG&E’s Emerging Technologies Program ET13PGE8052
SYNTHESIS AND DISCUSSION OF EVALUATION
OBJECTIVES This chapter of the evaluation report synthesizes the key findings of the evaluation in the context of responding to each of the study’s performance, operational, and evaluation objectives.
STUDY OBJECTIVES
PERFORMANCE OBJECTIVES
PO1: ACHIEVE AN INCREASE IN THE PROGRAM-QUALIFIED SHARE IN TARGETED PRODUCT CATEGORIES AMONG
PARTICIPATING RETAILERS. The primary performance metric used for this evaluation was the program-qualified share (PQS), which is computed as the total number of program-qualified units sold within a product class divided by the total number of units sold (both qualified and nonqualified) in the product class.
The PQS values were assessed using an array of quasi-experimental approaches and most of the approaches resulted in positive net effects for the product categories targeted in the trial. However, for some products, the participant-only approaches (i.e., forecasted baseline and participant-only regressions) resulted in negative effects. The evaluation team, however, feels historical data patterns or data quality issues that cannot easily be captured with the participant-only designs drove these negative results (also see the discussion about Evaluation Objective 1 later in this chapter). That said, the strongest and most robust approaches are the quasi-experimental comparison-based designs, and the results from these approaches were generally consistent with each other (see Table 41). Ultimately, the evaluation team chose the comparison-based modified step regression results as estimates of the net program effects. Overall, based on the comparison-based modified step regression results, the evidence suggests the trial resulted in increased PQS for all but one of the targeted product categories (Blu-Ray players excepted) within the participating retailer.
PO2: ACHIEVE GROSS AND NET ENERGY AND DEMAND REDUCTIONS ASSOCIATED WITH THE SALES OF
PROGRAM-QUALIFIED MODELS IN TARGETED PRODUCT CATEGORIES AMONG PARTICIPATING RETAILERS. Though achieving energy and demand savings is a key performance goal for the RPP Program, achieving substantial energy and demand savings was not a primary goal of this trial; the focus was more on operationalizing and refining the implementation of the program. With regards to energy and demand savings, the main goal of the evaluation efforts was to develop a systematic, transparent, valid, and cost-effective manner of estimating savings. That all said, this small-scale trial did result in some energy and demand savings.
Table 42 presented the preliminary first-year ex post gross energy (kWh) and demand (kW) program savings resulting from the 14-month RPP Trial. The RPP Trial resulted in total first-

89
PG&E’s Emerging Technologies Program ET13PGE8052
year gross energy savings of 126,172.2 kWh (119,389.5 kWh for PG&E; 6,782.7 kWh for SMUD). First-year gross demand savings totaled 15.9 kW (15.2 kW for PG&E; 0.7 kW for SMUD). Table 43 presented the preliminary lifetime ex post gross energy (MWh) and demand (MW) program savings resulting from the 14-month RPP Trial. The RPP Trial resulted in lifetime gross energy savings total of 1,030,340.1 kWh (981,257.1 kWh for PG&E; 49,083.0 kWh for SMUD). Lifetime gross demand savings totaled 156.0 kW (149.7 kW for PG&E; 6.3 kW for SMUD). Table 44 presented the preliminary first-year ex post net energy (kWh) and demand (kW) program savings resulting from the 14-month RPP Trial. Total preliminary first-year ex post net energy savings from the trial were 6,664.5 kWh (6,400.1 kWh for PG&E; 264.4 kWh for SMUD). Preliminary first-year ex post demand savings were 1.8 kW (1.7 kW for PG&E; 0.01 kW for SMUD). Table 45 presents the preliminary lifetime ex post net energy (kWh) and demand (kW) program savings resulting from the 14-month RPP Trial. Total preliminary lifetime ex post net energy savings from the trial was 64,547.1 kWh (62,123.9 kWh for PG&E; 2,423.2 kWh for SMUD). Preliminary lifetime ex post demand savings was 17.0 kW (16.3 kW for PG&E; 0.8 kW for SMUD). To prevent readers from miss-interpreting the net savings values and the net-to-gross ratio of 5%, some discussion is warranted. As discussed numerous times throughout this evaluation report, first-year savings from this trial for this market transformation program were not expected to be substantial. The retailer did not have the opportunity to make notable changes to their product assortment due to retailer buying cycles, and all the net effects are essentially due to marketing and promotional activities implemented during the trial. As such, one way to view the net-to-gross ratio is that a 5% lift was achieved solely through promotions. The main point to emphasize, however, is that with a longer-term implementation of the scaled-up RPP Program, over time the net-to-gross ratio is expected to increase substantially once retailers do have the opportunity to assort a greater proportion of energy efficient models and the program begins to affect nonparticipating retailer sales. Additionally, for the purposes of the trial, the qualification criteria for program-qualified products was simply set to meeting the minimum ENERGY STAR specification, which also contributed to high levels of free ridership and low net-to-gross ratios. As the program advances, higher efficiency standards will be used to target certain product categories (e.g., ENERGY STAR +X%), which should lead to higher net-to-gross ratios.
OPERATIONAL OBJECTIVES
OO1: PARTICIPATING RETAILER DEVELOPS STRATEGIC PLAN TO SELL TARGETED PRODUCTS. The participating retailer did develop plans and strategies to sell promote and increase sales of the targeted product categories. However, there were significant delays in getting these plans developed and in place. Other than a price reduction for freezers and refrigerators (which began in December 2013) and the development of an in-store broadcast (which began in November 2013), not much was done to promote products in stores until March 2014, when the first promotional flyer (with its associated price reduction and signage) was implemented. After that, additional plans for promotions were introduced and implemented periodically through the end of December 2014, when the Trial ended.

90
PG&E’s Emerging Technologies Program ET13PGE8052
As the Retailer Marketing Activity Review section of this report showed, the retailer’s promotions included a broad mix of price reductions, reward points, promotional flyers, product-specific signage, and ENERGY STAR signage to promote program-qualified models. During the debrief with the implementation team, it became apparent that the implementation team helped drive the development of some of the more successful interventions that occurred later in the year. They also suggested that moving ahead, retailers might need more support for such activities than was originally expected when the program was originally conceived and launched. However, it remains to be seen if this is true—or to what degree it may apply—once the program is scaled up and retailers have the opportunity to reap greater rewards from the program. The overall size of the incentives for a full-scale implementation may provide enough motivation for retailers to allocate adequate resources to develop promotional strategies. However, if this is not the case the program should be prepared to help support retailers in these efforts. In the future, it will be in the program’s best interest to have retailers develop and begin implementing them—as soon as possible after joining the program. Months of inactivity will negatively impact net-to-gross ratios, as the utility will be paying incentives on “business as usual” sales of program-qualified models (i.e., freeriders).
OO2: PARTICIPATING RETAILER FAITHFULLY IMPLEMENTS THE STRATEGIC PLAN DESIGNED TO SELL TARGETED
PRODUCTS. There was evidence to conclude that the retailer implemented the plans they developed (i.e., promotional flyers, signage, photos provided by the in-store shelf survey field team, etc.). However, there is also evidence from the shelf surveys and the retailer buyer interviews to suggest the plans were not always implemented consistently across all the participating stores. The second wave of shelf surveys were conducted in November 2014 when the retailer implementation plans suggested the room air cleaners were supposed to be promoted as a “hero” item. The room air cleaners were supposed to be displayed in bulk stack manner, with promotional signage and price promotions (“the lowest price ever”). However, the shelf survey results revealed that of the 23 stores that stocked air cleaners, all had the hero item in stock, but six stores did not have the model on sale, and 15 of the stores had no promotional signage associated with the model. The retailer buyer interviews also alluded to this same issue when the consumer electronics buyer indicated that getting the stores to implement the promotions consistently was one of the greatest challenges to implementing the program, along with ensuring they had the right inventory in a timely manner. All of this, however, is not a new finding. Both the implementation team and the program team recognize that more will need to be done moving ahead to help support the retailers in implementing their marketing activities to realize the full potential of the program. During the program staff debrief, the PG&E program manager underscored this point, stating that the utilities need to recognize that they are like any other vendor working in the retail environment, and need to provide the needed support to the retailer to help sell their “product”. In this case, the product is energy efficiency and the RPP Program.

91
PG&E’s Emerging Technologies Program ET13PGE8052
OO3: OPERATIONALIZE ACTIVITY A THROUGH OUTPUT F DENOTED IN THE LOGIC MODEL. Activity A through Output F of the RPP Program logic model focus on administrative tasks conducted mainly by PG&E staff and the implementation team, though other stakeholders such as other retailers, utilities, and utility partners play a part. Activity A through Output F of the RPP Program logic model include:
• Activity A: PG&E characterizes markets and estimate savings potential for candidate product
• Activity B: PG&E contacts utility partners regarding collaboration in Program delivery • Output C: Utility partners recruited • Activity D: PG&E and utility partners determine which retailers to recruit • Activity E: PG&E, utility partners, and identified retailers target product categories
with energy savings potential • Output F: PG&E and utility partners determine incentive levels for program-qualified
models within each product category, present them to retailers, and sign contracts
The evaluations team feels the Salesforce data review provided evidence that these activities and outputs were operationalized. The evaluation team found significant evidence of PG&E and implementation staff reaching out to potential utility partners and collaborating with the retailer to implement retailer implementation plans. There was also evidence of activities supporting logic model components A, C, D, E, and F, but with relatively fewer records. This does not mean, however, that these latter logic model components were supported any less. The nature of many of these logic model components does not lend itself to email interactions. For example, logic model component Activity A likely included a significant amount of Internet research and secondary data review. The Salesforce database also focused only on email exchanges, and the wide range of other communications and collaborative efforts (e.g., meetings, phone calls, web conferences, presentations, etc.) were not always captured.
OO4: ESTABLISH DATA PROCESSING, QA/QC, AND ANALYSIS METHODOLOGY
OO5: IDENTIFY VARIABLES THAT SHOULD BE TRACKED BY THE RPP PROGRAM. Operational Objectives 4 and 5 are inherently related. The RPP Program staff worked closely with the implementation team, evaluation team, and the data service provider to develop data processing, QA/QC procedures, and analysis methodologies for the RPP Program (see the Data Management and Processing section of the Methods chapter of this report). While some of this effort was targeted at refining the processing and conducting QA/QC of the raw data files provided by the retailer, other efforts were targeted at implementing QA/QC of the processed data files, and yet other efforts were targeted at defining methodologies for incorporating energy consumption and energy savings estimates into the processed data. In the process of implementing all these efforts, a good understanding has been developed regarding the array of variables and information that needs to be tracked to facilitate implementation and evaluation of the RPP Program. Our current understanding of the variables and information that are needed to implement and evaluate this program were discussed throughout this report. Some of the more important variables are UECs, UESs, and effective useful lives. PG&E and the contractors worked closely with the California Technical Forum (CalTF) in developing the white paper “Calculation Methodology for Unit Energy Consumption (UEC) and Unit Energy Savings (UES) for the Retail Plug-Load Portfolio (RPP) Program” (Malinick et. al., 2015). The team gave several presentations to the CalTF covering these approaches, methods, and

92
PG&E’s Emerging Technologies Program ET13PGE8052
procedures, and whitepaper was revised based on the CalTF input. The workpaper for the RPP Program, which relied on the whitepaper, is currently under development and has received preliminary approval from the CalTF, pending the addition of some final. The plan is to present the final workpaper to the CalTF for approval in May 2015. With respect to program administration, PG&E staff has worked closely with the data service provider to refine the process for developing the reports upon which incentive payments are based. Communications with PG&E staff have suggested this has been a time consuming process, but significant improvements have been made and errors that occurred early on in the Trial have been resolved. That said, the process needs to be monitored as the program scales up to ensure it operates accurately and efficiently. The program team is also gaining a better understanding of the array of different secondary data and information that is needed to assess the overall market for home appliances and consumer electronics. While some useful information is available from ENERGY STAR with regards to information such as efficiency standards and market share, obtaining regional and national market share data at the level of granularity needed to support planning and evaluation remains one of the biggest hurdles. However, PG&E is currently working with the NPD Group to obtain a bid for market level data for the product categories they can supply (consumer electronics). PG&E is also reaching out to other organizations such as the Association of Home Appliance Manufacturers (AHAM) to explore data availability for other product categories. In addition to the issue of secondary data availability, PG&E program staff indicated there are also some concerns regarding the cost of this data. The RPP Program is built on the notion that this program can be delivered, administered, and evaluated in a cost-effective manner. However, data from the NPD Group is likely to be extremely expensive. Knowing that multiple stakeholders—including the CPUC-ED for their official ex post impact evaluations and other utilities or utility partners who may implement the program in other jurisdictions—will need this data, PG&E staff are eager to understand how cost-sharing agreements might be developed to overcome the logistical and legal hurdles. This is an area that will likely receive significant attention in the near future.
OO6: CONTINUE BUILDING RELATIONSHIPS WITH OTHER PROGRAM PARTNERS SUCH AS SMUD, NEEA, AND
OTHER UTILITIES AND ORGANIZATIONS FOR FUTURE PARTNERSHIPS. PG&E staff and the implementation team have made significant strides in building and fostering relationships with other stakeholders and organizations. PG&E and the implementation team are currently teaming with ENERGY STAR to launch an ENERGY STAR-sponsored multi-regional RPP Program in 2015 across the nation. To-date, numerous utilities and utility partners have indicated interest in participating in the 2015 ENERGY STAR-sponsored program, including the Northwest Energy Efficiency Alliance (NEEA), the Northeast Energy Efficiency Partnership (NEEP), Southern California Edison (SCE), Sacramento Municipal Utility District (SMUD), Southern California Gas (SoCal Gas), San Diego Gas & Electric (SDG&E), DC Sustainable Energy Utility (DC SEU), and Efficiency Vermont. Others have indicated interest in developing filings for participation in 2016, including Baltimore Gas & Electric (BGE), DTE Energy, PEPCO Holdings, New Jersey’s Clean Energy Program (NJCEP), the Southern Maryland Electric Cooperative (SMECO), Eversource, UIL Holdings, and Xcel Energy. Task forces have also been developed around the ENERGY STAR initiative to facilitate collaboration and communication among the various stakeholders. Additionally, the program and implementation team continue to reach out to enlist other potential partners and stakeholders.

93
PG&E’s Emerging Technologies Program ET13PGE8052
OO7: INCREASE RETAILER AWARENESS OF PROMOTING, SELLING, AND/OR STOCKING PRODUCTS BASED ON
ENERGY EFFICIENCY CRITERIA. From the baseline interview with the retailer’s home appliance buyer, it was clear that they were very aware of energy efficiency. They were familiar with ENERGY STAR specifications and were also aware, unprompted, that the Department of Energy federal standards for refrigerators and freezers was going to be changing soon. Though they were aware of general energy efficiency, none of the buyers during the baseline interview or at the follow-up interview were familiar with the energy consumption of specific models. At follow-up, both the home appliance and consumer electronics buyers indicated that energy efficiency had not been a factor in any of their purchasing decisions prior to the program. However, because of the program they were more aware of energy efficiency and it has been incorporated into some buying decisions during the trial. The appliance buyer gave an example of a specific model of ENERGY STAR refrigerator that he added to their assortment specifically for the trial. When asked if he would have added the new model of refrigerator to their product assortment in the absence of the program, he responded “absolutely not.” At follow-up, when asked how much the energy efficiency of a model would factor into their buying decisions moving ahead, in the absence of the program, the home appliance buyer replied that it would likely factor in “very little,” as they are still a price-point focused retailer. In contrast, the consumer electronics buyer indicated now that because she is more conscientious about ENERGY STAR and energy efficiency in general, she will be incorporating these both into her future buying decisions. She indicated that while the purchasing criteria would not be formally modified to include ENERGY STAR and energy efficiency, she would personally be more alert to opportunities. This difference in attitudes toward energy efficiency is possibly due to the different characteristics for these two product categories. Home appliances are generally more costly than consumer electronics. The incremental cost of ENERGY STAR appliances are likely higher than ENERGY STAR electronics, and while the appliance buyer feels this cost difference affects a buyers decision, it is less of a hurdle for the consumer electronics buyer. It was reiterated in all of the retailer interviews (including the buyers, marketer, corporate leadership team, and store managers) that the retailer target population is primarily driven by cost. As such, incorporating energy efficiency into this particular retailer’s future buying decisions absent the program will be a challenge as energy efficient products typically cost more. The baseline interviews with store managers suggested that while they feel that a significant proportion of their customers are aware of energy efficiency and ENERGY STAR, most are still focused on the less expensive models. However, this may be a little different with home appliances, where one store manager indicated, “roughly 50% of customers that shop appliances know that they want an ENERGY STAR product.” To some degree they felt this might be driven by the past availability of rebates for appliances, but it might also reflect the fact that appliances generally consume significantly more energy than smaller electronic devices. In some ways this may represent the bigger problem with plug load—that is, many people in the general population do not recognize the aggregate effect on residential energy consumption of all the smaller electronic devices they have in their home. Educating customers on the growing energy use of all plug loads, rather than the energy use of any one device, might be a better way to change customer attitudes and could possibly be leveraged as a marketing message to incorporate into RPP Program promotions.
94
PG&E’s Emerging Technologies Program ET13PGE8052
Overall, this particular retailer may be in a unique situation, due to their price-focused target population, that limits their ability to factor energy efficiency into their product purchasing decisions. Nevertheless, when considering a scaled-up RPP Program, these findings may actually point to significant opportunity to affect the plug load market by raising greater awareness around the energy efficiency of products, not just among the actors in the retail population who are responsible for purchasing and assorting the products, but also among the general population who ultimately purchase them.
EVALUATION OBJECTIVES
EO1: TEST VARIOUS METHODS TO EVALUATE THE RPP TRIAL. The evaluation team applied an array of different approaches and methods to the evaluation of the RPP Trial. Some of these approaches were non-experimental and focused on the process evaluation (i.e., assessing various aspects of the program implementation and operations as well as validating certain components of the program logic model). Other approaches were quasi-experimental and focused on the impact evaluation (i.e., assessing the program effects and impacts). Several important lessons were learned through this evaluation.
Process Evaluation Methods
First, though the Salesforce data review helped to understand communications that the implementation team initiated or participated in, it reflects only one limited aspect of the communications that are needed to support the program. By focusing just on the implementation team’s communications, we run the risk of failing to capture a wide range of other interactions that can prove useful for assessing the communication network of the various stakeholders and other parties. Additionally, the processing and analysis of the Salesforce data is very time and resource intensive, as it requires extensive review of large numbers of textual entries. To make the Salesforce data review more meaningful and efficient, it would require some changes. First, a greater number of stakeholders would need access to Salesforce in order to log entries so we could capture communications along a broader range of actors. This, in itself, may be problematic due to cost-prohibitive licensing requirements for gaining access to the Salesforce software. Second, the email logging process should be automated to ensure that relevant emails are not accidentally left out. Finally, Salesforce reporting should be optimized so that key pieces of data are automatically pulled out of the email records. This would reduce the time needed to review each record. If Salesforce continues to be used as a source of information for evaluation purposes, taking these steps would lead to a more refined and systematic process for logging entries that would facilitate less resource-intensive review and analysis and ensure a more holistic and comprehensive data set. That all said, the evaluation team feels there are probably better ways to get at similar information in a more systematic, cost-effective, and timely manner. One recommendation would be to develop and implement a brief, quarterly web-based survey to actors engaged in RPP-related communications. This survey could ask the actors who they have communicated with about the RPP Program and/or shared resources, how frequently, what did they discuss/share, and how these communications helped to accomplish the goals of the program. Such an approach would provide much better information on RPP-related communications and would also facilitate a network analysis that could be used to describe, in much richer detail, how RPP is being implemented throughout the marketplace. A web-based survey would also facilitate much easier and less costly analysis as response options
95
PG&E’s Emerging Technologies Program ET13PGE8052
could be used to capture key concepts and analysis would then be predominantly quantitative. The evaluation team also recommends eliminating the shelf surveys and implementing a different approach of in-store data collection that focuses exclusively on validating that the planned promotional activities are actually taking place. On the plus side, the shelf surveys as implemented for this evaluation did provide useful information regarding the inconsistent implementation of planned marketing across stores during the key promotional event in November 2014. Recall that during November and December 2014 all participating stores were supposed to promote a model of air cleaner as a “hero” item, which consisted of the “lowest price ever,” special promotional signing, and unique placement on the sales floor. However, the field team found that about 26% of the stores did not even have the model on sale, and roughly 58% of the stores had no promotional signage. The issue of inconsistent store implementation also surfaced in the retailer buyer interviews, when the consumer electronics buyer indicated that one of the greatest challenges faced in implementing the program was getting the stores to do so consistently (along with getting the needed inventory into the stores at the right time). The remainder of the information gathered through the shelf surveys was of limited value. For example, while the shelf surveys provided some initial insights into some changes that seemed to take place between the baseline and the follow-up, these conclusions were misleading. For example, the shelf survey results showed that between baseline and follow-up the proportion of program-qualified models on the sales floor increased for all the consumer electronics categories. However, subsequent analysis of the sales data showed that while indeed the proportion of program-qualified models in inventory went up, it did so in the nonparticipating stores as well for all these categories. Thus, the net increases observed in the shelf survey data were not entirely (or in some cases not at all) attributable to the program. Also, because they were only conducted at two points in time, the usefulness of the information garnered through the shelf surveys was further limited (i.e., it only provided two snapshots in time). The evaluation team asked that the field team conduct comprehensive inventories of all the products on the shelves. But because we only had information from two points in time it was hard to draw conclusions from this data. For example, if we found that one store had 10 units of a program-qualified model on the shelf at baseline, and only five units at follow-up, is this a positive or negative finding? On the one hand, it could reflect that the retailer decided to start stocking less of the qualified model, which could be viewed as a negative finding. However, on the other hand, they may only have five units on the shelf at follow-up because the retailer managed to promote and sell most of their inventory, which would be a positive finding. Without knowing what happened in between, and without being able to tie the findings to specific promotional activities, we determined that conducting comprehensive inventories is not very useful. Further, the evaluation team conducted an ancillary analysis that showed that the proportions of models and units on the sales floor did not differ dramatically from the proportions of models and units that appeared in the sales data, so spending resources to count inventory probably not cost effective. Moving ahead, the evaluation team recommends a different approach to conducting in-store research. Our proposed approach is to inventory the promotional activities provided in the retailers’ implementation plans, and then develop a schedule for conducting field team visits that coincides with the promotions. The in-store visits would be limited to verifying that the expected promotions are taking place (i.e., no counting of inventory as this information is

96
PG&E’s Emerging Technologies Program ET13PGE8052
essentially available in the sales data), and if not, the field team can work with store staff to help ensure promotions are taking place as planned. This approach is more in-line with the evolving perspective that the retailers are going to need more support in implementing the RPP Program than originally envisioned. As the RPP Program manager said in the Trial debrief, the utilities need to start looking at themselves as any other “vendor” operating in the retail environment, and they need to provide support to sell their product, which in this case is the program. The evaluation team feels the usefulness of the store manager surveys is still not entirely resolved. On the one hand, since the decision-making for this program is very much centered on the retailers’ corporate staff (i.e., purchasing decisions; promotional decisions), one might argue that surveying store managers may not be appropriate or, in some cases, may actually provide misleading evidence of program implementation. However, on the other hand, one could also argue that regardless of what level decisions are made at, what really matters is that customers buy the energy efficient models, so knowing as much as possible about what goes on in the stores will provide valuable information. The results from the store manager interviews and surveys were somewhat split. On the one hand, nearly all the managers surveyed at follow-up indicated they were familiar with the RPP Program (either in unprompted or prompted form), and all of the managers surveyed indicated they were either very or somewhat familiar with the promotions that occur in their stores. However, the level of detail they were able to provide with regards to perceived program effects and the RPP-related promotions that were conducted varied widely. That all said, a couple things should be kept under consideration when drawing conclusions from the store manager research conducted as part of this study. First, because the retailer only provided the team with limited access to the store managers, we were unable to probe and search to find the individuals in the stores that were most familiar with in-store promotions. This is important because during the follow-up surveys, several managers indicated they were not the person in their store most familiar with the activities. A second thing to consider is that this retailer may not be like all other retailers. The retailer that participated in the trial has price-point focused customer segment, and as such, tries to minimize its operational costs by not having specialized or departmental store staff. Other retailers are much more likely to have staff trained and focused on selling specific product categories (e.g., departmental staff), who may be able to provide much more robust and accurate information. Third, the evaluation team feels understanding the in-store implementation of the program will be key for providing a richer understanding of how the program is being implemented—and how it may be altered or improved in the future to maximize the programs potential. Fourth, the follow-ups were conducted as surveys and not as interviews. It is now apparent that is not likely the best approach for gathering the rich information that is likely needed to capture the in-store activities. In the future, the evaluation team recommends the store managers/store staff research be conducted as in-depth interviews. In conclusion, the evaluation team does not recommend eliminating the store manager interviews from the suite of future research methods, though we do recommend some adjustments.
Impact Evaluation Methods
As far as the quasi-experimental approaches aimed at assessing program effects and impacts, it appears they all have some strengths and weaknesses and various reasons for being considered as evaluations focus on the larger-scale program.

97
PG&E’s Emerging Technologies Program ET13PGE8052
The participant-only approaches resulted in some questionable estimates of net program effects for some product categories, but the reasons for these anomalies appear to be tied to the quality of the historical data, or when a product category that experienced relatively large increases in PQS in the late historical period were included in the program. In some cases, this might be resolved by having a better understanding of the retailers product assortment and PQS values before or immediately after a retailer enters the program, though early insight into this is admittedly hindered by data availability, as the retailers are not expected to provide their historical data until after they sign the contract. Nevertheless, the program staff may need to decide not to incent certain product categories through the program if PQS values are at an unexpectedly high level and contribute to low net-to-gross ratios. Alternatively, program staff may decide to raise the qualifying standard to some level above simply meeting the minimum ENERGY STAR specification. This latter approach could also help to increase the net-to-gross ratio while increasing the market share of some product categories. Other studies of similar programs have recommended the same thing. For example, a recent evaluation of the New York Products Program—a program with many similarities to the RPP Program being conducted in New York by NYSERDA—estimated a relatively low net-to-gross ratio of about 10% for the 2010-2012 program cycle and cited the fact that this program that has been running for roughly 15 years (since 1999) and has likely transformed the market (Dimetrosky et. al., 2014). The report goes on to suggest that a reasonable path forward for the program is to pursue higher efficiency standards as the criteria for paying incentives. Without a doubt, comparison-based approaches are the strongest and most robust methods for assessing program effects. However, for these approaches to be appropriate, of course there needs to be some group that did not receive the intervention, or the control. In a statewide implementation of the RPP Program, a within state control group will likely not be possible. Participating retailers will likely be unwilling to withhold any of their stores to act as controls, and nonparticipating retailers will have no incentive to provide their sensitive sales data. Developing a comparison group based on participating retailers’ stores outside the state may be possible, but since retailers typically conduct their purchasing at the national level, it may be difficult to find stores that are totally unaffected by the program interventions. The only remaining option for implementing a comparison group is likely to be secondary market-level data purchased from various third-party sources such as the NPD Group or AHAM, but the costs and availability of the data needed to effectively evaluate this program have not yet been resolved. This remains one of the biggest concerns with regards to effectively evaluating this program in the future, and possibly one of the biggest program risks. As such, even with the issues mentioned above, the participant-only designs should not be discarded as they may represent the only feasible path forward if reliable comparison group designs are infeasible. That all said, the evaluation team feels the participant-only designs may also prove fruitful when one considers that the RPP Program is a market transformation program that needs to be evaluated over the longer term. As discussed several times in the report, detecting program effects in the first year or two of a retailer’s participation in the program is going to be difficult no matter what approach is used, as the net effects are expected to be relatively small and sporadic. Retail buying cycles mean product assortment decisions for any given year are typically made several months in advance, and retailers will not have the opportunity to make dramatic changes to their product assortment in the very short-term. Thus, because first-year effects from the program are going to result predominantly from marketing and promotional efforts that start and stop at various times throughout the year, we expect to see a significant amount of variability over the short-term, or the periods

98
PG&E’s Emerging Technologies Program ET13PGE8052
between assortment changes—much like the variability we currently see in the trial-period data due to specific interventions beginning and ending, and competing efforts aimed at contemporaneously selling non-qualified products mediating or negating program effects. However, over the mid-to long-term, the product assortment changes are expected to produce detectable increases in the PQS. Such a hypothesized pattern is shown in Figure 15.
FIGURE 15: HYPOTHESIZED PATTERN IN PQS OVER SEVERAL YEARS OF THE RPP PROGRAM
In this example, though it would be difficult to detect significant program effects in any year-to-year comparison due to the general variability over any two adjacent years, over the longer term a detectable pattern is evident that suggests the program may be having its intended effects. This hypothesis could be formally tested by coding the specific timing of assortment changes into the sales data, and using the modeling approaches discussed herein to assess their influence on the PQS. Over the mid- to longer-term the participant-only approaches should be able to detect these effects. One additional factor needs to be considered when weighing the results presented in this report and assessing the usefulness of the modeling approaches for the future. When applying these—or any—modeling efforts, the quality of the data is critical to ensuring reliable, accurate, and meaningful results. Though significant effort was committed to trying to resolve data issues with the retailer, it appears that there may still be some data issues that put some of the results into question, or at least weaken the models’ ability to detect program effects. In two cases—compact refrigerators and room air conditioners—there were a couple of months of missing data. For the comparison-based analyses, these months were omitted to ensure a consistent time-series for participating and nonparticipating stores, but the missing data results in some holes in the models (see Figure 50 and Figure 53). While we do not feel these missing data compromise the modeling efforts overall, as the remaining data points are well fitted, they may affect the accuracy of the net effects estimates.
0"
5"
10"
15"
20"
25"
30"
35"
40"
Jan+14"
Mar+14"
May+14"
Jul+1
4"
Sep+14"
Nov+14"
Jan+15"
Mar+15"
May+15"
Jul+1
5"
Sep+15"
Nov+15"
Jan+16"
Mar+16"
May+16"
Jul+1
6"
Sep+16"
Nov+16"
Jan+17"
Mar+17"
May+17"
Jul+1
7"
Sep+17"
Nov+17"
Jan+18"
Mar+18"
May+18"
Jul+1
8"
Sep+18"
Nov+18"
Jan+19"
Mar+19"
May+19"
Jul+1
9"
Sep+19"
Nov+19"
PQS$
2014" 2015" 2016" 2017" 2018" 2019" PQS"

99
PG&E’s Emerging Technologies Program ET13PGE8052
EO2: IDENTIFY, OPERATIONALIZE, TRACK, AND ANALYZE KEY PROXIMATE (SHORT AND MID-TERM) INDICATORS
OF PERFORMANCE.
EO3: PROPOSE PERFORMANCE INDICATORS FOR MEASURING LONGER-TERM EFFECTS AND/OR BENEFITS.
EO4: IDENTIFY DATA COLLECTION AND ANALYSIS RESPONSIBILITIES (RETAILER, UTILITY STAFF, EVALUATORS). Because they are all closely related, the evaluation team combined Evaluation Objectives 2, 3 and 4. The evaluation team collected a significant amount of data and conducted and array of analyses using a wide range of approaches in conducting this evaluation. While we argue that future evaluation efforts need to be targeted at assessing and validating the full suite of logic model components (activities, outputs, and short-, mid-, and long-term outcomes) to support robust claims of attribution, several specific metrics will be key for assessing program progress and performance moving ahead. Table 46 shows the concepts, constructs, data needs, data sources, data collectors, and data analyst for the proposed key proximate (short- and mid-term) indicators of program progress and performance. All of the concepts included are meant to ensure key aspects of the RPP Program logic model are occurring and can be validated. Also, each of them will serve as key metrics to closely monitor and track to ensure the program will meet goals and expectations. Also, without each of these showing some detectable change, it is unlikely the longer-term indicators of market transformation will be positively affected. As such, they can serve as “early warning” metrics (i.e., leading indicators of program success) to indicate if mid-course corrections might be needed. Table 47 shows the concepts, constructs, data needs, data sources, data collectors, and data analyst for the proposed indicators of long-term effects and/or benefits. Note that two of these (namely PQS and gross and net energy and demand savings) are also denoted as key proximate indicators, and are included in both tables because they should be tracked in the short-, mid- and long-term. The additional indicators are those that align with the longer-term outcomes as described in the RPP Program logic model.
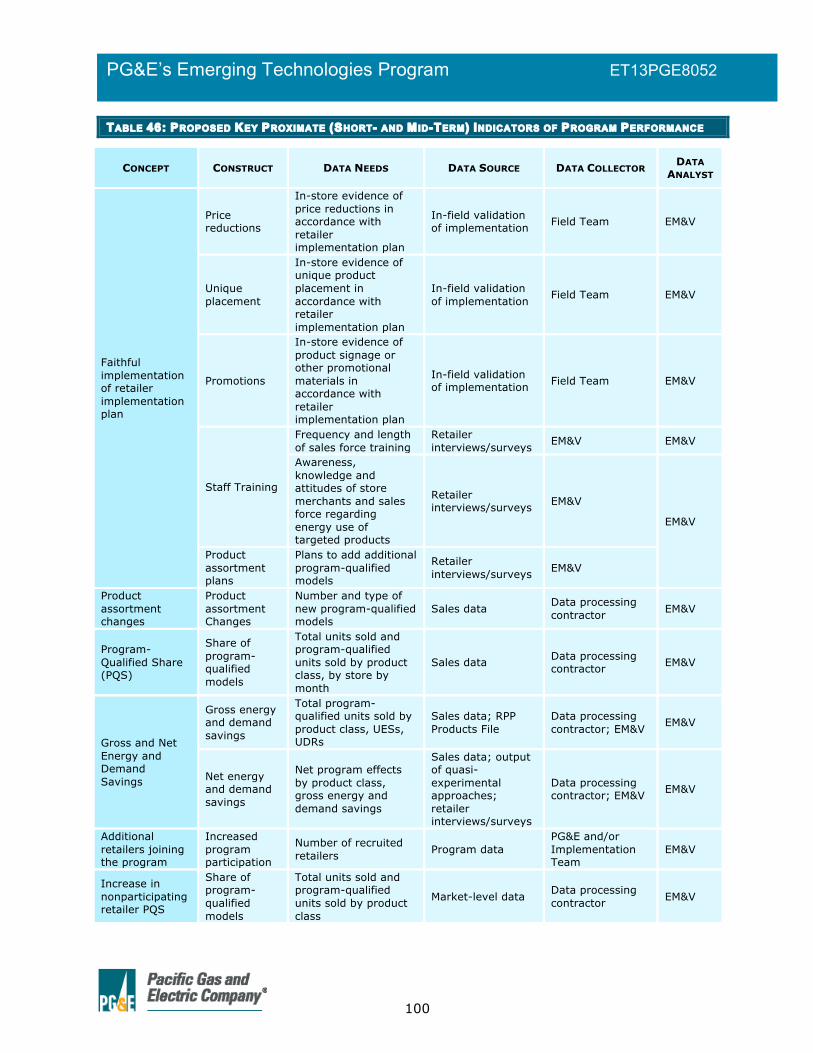
100
PG&E’s Emerging Technologies Program ET13PGE8052
TABLE 46: PROPOSED KEY PROXIMATE (SHORT- AND MID-TERM) INDICATORS OF PROGRAM PERFORMANCE
CONCEPT CONSTRUCT DATA NEEDS DATA SOURCE DATA COLLECTOR DATA ANALYST
Faithful implementation of retailer implementation plan
Price reductions
In-store evidence of price reductions in accordance with retailer implementation plan
In-field validation of implementation Field Team EM&V
Unique placement
In-store evidence of unique product placement in accordance with retailer implementation plan
In-field validation of implementation Field Team EM&V
Promotions
In-store evidence of product signage or other promotional materials in accordance with retailer implementation plan
In-field validation of implementation Field Team EM&V
Staff Training
Frequency and length of sales force training
Retailer interviews/surveys EM&V EM&V
Awareness, knowledge and attitudes of store merchants and sales force regarding energy use of targeted products
Retailer interviews/surveys EM&V
EM&V
Product assortment plans
Plans to add additional program-qualified models
Retailer interviews/surveys EM&V
Product assortment changes
Product assortment Changes
Number and type of new program-qualified models
Sales data Data processing contractor EM&V
Program-Qualified Share (PQS)
Share of program-qualified models
Total units sold and program-qualified units sold by product class, by store by month
Sales data Data processing contractor EM&V
Gross and Net Energy and Demand Savings
Gross energy and demand savings
Total program-qualified units sold by product class, UESs, UDRs
Sales data; RPP Products File
Data processing contractor; EM&V EM&V
Net energy and demand savings
Net program effects by product class, gross energy and demand savings
Sales data; output of quasi-experimental approaches; retailer interviews/surveys
Data processing contractor; EM&V EM&V
Additional retailers joining the program
Increased program participation
Number of recruited retailers Program data
PG&E and/or Implementation Team
EM&V
Increase in nonparticipating retailer PQS
Share of program-qualified models
Total units sold and program-qualified units sold by product class
Market-level data Data processing contractor EM&V

101
PG&E’s Emerging Technologies Program ET13PGE8052
TABLE 47: PROPOSED PERFORMANCE INDICATORS FOR MEASURING LONGER-TERM EFFECTS AND/OR BENEFITS
CONCEPT CONSTRUCT DATA NEEDS DATA SOURCE DATA COLLECTOR DATA ANALYST
Program-Qualified Share (PQS)
Share of program-qualified models
Total units sold and program-qualified units sold by product class, by store by month
Sales data Data processing contractor EM&V
Gross and Net Energy and Demand Savings
Gross energy and demand savings
Total program-qualified units sold by product class, UESs, UDRs
Sales data; RPP Products File
Data processing contractor; EM&V EM&V
Net energy and demand savings
Net program effects by product class, gross energy and demand savings
Sales data; output of quasi-experimental approaches; retailer interviews/surveys
Data processing contractor; EM&V EM&V
Changes in efficient product demand
Energy efficient product requests
Manufacturer self-report of the proportion of product orders that are for energy efficient models
Manufacturer interviews EM&V EM&V
Increase in nonparticipating retailer PQS
Share of program-qualified models
Total units sold and program-qualified units sold by product class
Market-level data Data processing contractor EM&V
EO5: MEASURE THE EXTENT TO WHICH TRIAL RPP PROGRAM OBJECTIVES WERE ACHIEVED.
Overall, the evaluation team concludes the RPP Trial was as successful as one would expect for a trial of a complicated program design. As reiterated several times throughout this report, this was a small-scale trial, with a single and somewhat struggling participating retailer, in a relatively small number of stores, implemented over only a 14-month period. As such, being that this is a market transformation program, only certain aspects of program performance and efficacy could be assessed. The quasi-experimental approaches—especially the stronger, more reliable comparison group designs—consistently detected small but positive net differences in PQS across the majority of the targeted product categories (the only clear exception was the Blu-Ray player category). Though modest, the RPP Trial also resulted in gross and net program savings.
The participating retailer staff was engaged and was able to successfully develop and launch promotional initiatives that were associated with increases in program-qualified share (though some of the interventions seemed to have little to no effect). Implementation and program staff members effectively conducted each of the early activities associated with the RPP Program logic model and have worked to promote the program and recruit additional retailers and additional utilities and utility partners into the upcoming national ENERGY STAR-sponsored RPP Program beginning in 2015.
We also learned a great deal about program processes, operation, and administration. An array of parties put significant effort into developing and refining data processing and management procedures, protocols, and QA/QC methods—though there is likely more to do in this area. Significant effort was also put into refining the incentive payment and reporting system. The program staff learned a lot about how to bridge the gap between utility wants
102
PG&E’s Emerging Technologies Program ET13PGE8052
and needs, and what retailers are willing and able to provide. The program staff and implementation team are ready and willing to adapt their early expectations, and now recognize that effective implantation of the RPP Program will likely require more utility support than was first envisioned. But this is manageable and should probably not be unexpected. As the RPP program manager stated, the utilities need to view themselves like any other vendor working in the retail environment, and provide their support to sell their product, which in this case is the RPP Program, or more specifically, energy efficiency.
From the evaluation perspective, much was learned as well about evaluating this complex market transformation program. The evaluation team incorporated a wide range of non-experimental and quasi-experimental approaches into the overall research design. Some worked well; others did not. With yet others it is still unclear as to their potential usefulness, but they still seem to offer promise if we recognize this program needs to be run and evaluated over an extended time period.
EO6: ASSESS POTENTIAL PROGRAM TRIAL SPILLOVER EFFECTS ON NON-PARTICIPATING STORES WITHIN THE
PG&E AND UTILITY PARTNER SERVICE TERRITORIES. During the follow-up retailer interviews the home appliance and consumer electronics buyers indicated that none of the promotional activities associated with the program spilled over into nonparticipating stores. As mentioned in that section of the report, the only exception to this was a system-wide pricing error that occurred when the one promoted model of room air conditioner was put on sale nationwide. By the time this error was caught and corrected, the buyer stated that it cost the retailer a substantial amount of money. This pricing error may have served to reduce the estimated net effects on the PQS for this product category, but it is hard to know for sure based on the modeling results. The models were developed by coding the intervention periods into both the participating and nonparticipating stores to account for any activities that may have spilled over, but the model results for air conditioners did not provide any additional information on this issue. It is worth noting that there were substantial increases in some product category PQS values from the historical to the trial period (e.g., Blu-Ray players and standard DVD players), which subsequent analysis revealed was due to the addition of some new program qualified models. However, these effects were seen in both the participating and nonparticipating stores. That is, some assortment changes did occur, but they are not all attributable to the program.

103
PG&E’s Emerging Technologies Program ET13PGE8052
RECOMMENDATIONS Based on the preponderance of evidence, the evaluation team has concluded the RPP Trial was reasonably successful at meeting its performance and operational objectives. The evaluation team also feels that the following recommendations should be considered in order to improve the design, delivery, and evaluation of the RPP Program.
PROGRAM DESIGN AND IMPLEMENTATION • Launching a program in the last quarter of the year should be avoided if possible.
Retailers have a lot of activities underway during the holiday season, and gaining access to staff to conduct the necessary baseline research is a challenge. Also, unless there is adequate notice given to the retailers, it is likely many if not most of their marketing and promotional activities are planned several months in advance of the holiday sales period, giving the program little chance to affect meaningful changes during this period.
• Include a contractual commitment from the participating retailers to provide access to the staff needed to conduct evaluation interviews/surveys. The evaluation team had difficulty gaining access to retailer staff at key points in time (or at all) in order to conduct evaluation activities in a timely manner.
• Once the contract is signed, the participating retailers should develop retailer implementation plans as soon as possible to ensure that interventions occur as soon as possible. Significant delays in getting retailer implementation plans in place is a risk to the program as PG&E will be paying incentives for “business as usual” sales (represented by the store’s pre-program market share of program-qualified products) until interventions are in place to increase sales. In the trial, most product categories did not begin interventions until March 2014, five months into the program. That is five months of potential sales lift that was missed. It is likely that these five months of relatively little activity contributed significantly to the low net-to-gross ratio of 5% for the portfolio.
• Require the retailer’s to develop detailed retailer implementation plans that outline strategies, time of implementation, and ideally, sales goals. In order to help bolster net-to-gross ratios, it may be worth considering adding a clause to contracts that states if the retailer does not do anything to promote a certain targeted product category for a certain period of time (e.g., a quarter), incentives will be withheld for that product category until some effort by the retailer to promote qualified models within a product category is observed. This would be most applicable to the first year or two of participation, when promotions are expected to play the key—if not only role—in increasing the sales of program-qualified products.
• Ensure the program data has a clear chain of ownership and control that is transparent, defendable, and absent of any potential conflicts of interest. This should minimize concerns regarding the accuracy of the data and the ensuing results. Currently, the retailer provides the raw sales data to the implementation team, who helps the retailer ensure their data queries are extracting the correct products. The implementation team sends the data to the data service provider after any issues are

104
PG&E’s Emerging Technologies Program ET13PGE8052
resolved. Ideally, the data should go directly from the retailer to the data service provider.
• At least in the short term, more attention should be focused on promoting and incenting program-qualifying specifications that exceed the minimum ENERGY STAR specification. For many retailers for many product categories, a significant proportion of their product assortment is already ENERGY STAR. Even the retailer that participated in the trial—though energy efficiency never entered into their product purchasing decisions—had some high PQS values for some product categories before the trial even began. For example, the PQS for Blu-Ray players in the month before the program began (October 2013) was 71%; 36% for sound bars; 33% for air cleaners. Thus, incenting these product categories at the minimum ENERGY STAR specification will translate to relatively low net-to-gross ratios, and will likely have a limited effect on transforming the market. While in the future, the RPP Program theory suggests program-induced influence on voluntary specifications (e.g., ENERGY STAR) and/or mandatory standards (e.g., state or federal codes and standards) will occur and may negate the need for more stringent qualifying specifications, until these expected effects actually occur and are validated, efforts should be incorporated to help bolster net program savings.
• Retailers will likely need support to effectively and consistently implement the RPP Program. Inconsistent implementation across stores arose in the shelf survey data as well as the retailer buyer interviews. PG&E program staff and the implementation team both recognize the need for this, as evidenced through both of their project debriefs. Support for implementation may consist of assisting store staff in deploying promotional materials such as signage or helping build promotional displays; it could also consist of assisting corporate staff to develop effective marketing and promotional strategies.
EVALUATION • In terms of evaluation, the array of different modeling approaches should be retained
until there is greater clarity around which impact approach(es) work best. While the comparison-based approaches provided, what the evaluation team feels are, the most reasonable estimates of net PQS, we also recognize that the participant-only designs may be the only feasible approach in the future, once the program effects begin to dissipate into other regions. More needs to be learned about how the participant-only models might perform with a larger-scale implementation of the program. Also, evaluators need to consider how the more quantitative impact evaluation methods might be coupled with self-report methods to derive impact results that are more widely informed and based on a preponderance of evidence.
• The shelf surveys, as they were conducted for the trial, provided information that was ultimately of limited use. However, a method for assessing retailers’ implementation of the program interventions in their stores is still needed. A better approach might be to develop a schedule for in-store verification of marketing activities based on the retailers’ implementation plans. These visits could also be leveraged to allow the field team to help support the retailers if gaps in implementation are found.
• The use of Salesforce needs substantive revision if it is to be a useful evaluation tool. Processing the Salesforce data was extremely resource intensive, and the contents of Salesforce only allows for limited validation of program activities, because only the

105
PG&E’s Emerging Technologies Program ET13PGE8052
implementation team uses it. The evaluation team feels other approaches might be more useful for assessing whether certain logic model components are occurring. For example, a periodic (e.g., quarterly) web-based survey of stakeholders would allow the evaluation team to collect more robust data in a manner that allows for easier and more systematic analysis.
• The role of the retailer store manager interviews need to be carefully considered and weighed in the context of the overall evaluation objectives. From a process evaluation perspective, the store research can provide informative insights into how the program implementation may be refined or improved. However, it will be critical that the evaluator target the people in the stores that are most knowledgeable about the program and/or product categories. This may vary from retailer to retailer and will not likely be the store managers.
• Future evaluation efforts should be based on a theory-driven evaluation framework in order to provide robust support for future claims of attribution. As the RPP Program scales-up and becomes more complex, ascertaining impacts and effects of the program will become more complicated as many of these will occur outside of the participating retailers. We recommend focusing greater attention on evaluating the specific components of the logic model with a focus on validating that the activities, outputs, and short-, mid-, and long-term outcomes are occurring as expected, as well as validating that the hypothesized causal mechanisms. Within a theory-driven framework, the assessment of program performance through the use of multiple research designs and analyses of key leading indicators of program performance is the best way to manage risks faced by each stakeholder.
• In collaboration with the ED, identify key program performance metrics and market transformation indicators so that appropriate baselines can be constructed during the next phase of the RPP Program. Table 46 of this report outlines the key proximate or short- to mid-term indicators program progress and performance recommended by the evaluation team; Table 47 showed the proposed indicators of long-term effects and/or benefits.

106
PG&E’s Emerging Technologies Program ET13PGE8052
APPENDICES Appendix A: Interview Guides and Survey Instruments
Appendix B: Retailer ENERGY STAR Signage
Appendix C: Shelf Survey Results by Store
Appendix D: PQS Values and Difference-in-Difference Analyses for PG&E and SMUD
Appendix E: Results of Forecasted PQS Baseline Approach
Appendix F: Results of Participant-Only PQS Modified Step Regressions
Appendix G: Results of Participant-Only PQS Segmented Regressions
Appendix H: Results of Comparison-Based PQS Modified Step Regressions

107
PG&E’s Emerging Technologies Program ET13PGE8052
APPENDIX A: INTERVIEW GUIDES AND SURVEY
INSTRUMENTS

108
PG&E’s Emerging Technologies Program ET13PGE8052
RPP TRIAL IN-DEPTH INTERVIEW GUIDE: CORPORATE MERCHANTS
1
RPP TRIAL IN-DEPTH INTERVIEW GUIDE (CORPORATE BUYERS)
This interview guide details the key areas that the evaluation team will focus on during in-depth interviews with [Retailer] corporate staff.
Key Areas of Questioning
• Awareness and knowledge regarding energy efficiency in general • Knowledge about energy efficiency initiatives underway at [Retailer], and whether
there is any collaboration/communication regarding energy efficiency initiatives • Knowledge about energy efficiency as it relates to the qualified seven product
categories part of the RPP Trial • Distribution of products purchased (i.e., do any program-qualified products go to non-
participating stores in addition to participating stores) • Awareness of the RPP Program Trial • Influence of the RPP Program Trial on their promotion and purchasing decisions • A battery of questions regarding the likelihood that they would have designed and
implemented the agreed-upon marketing plan absent the RPP Program Trial (to inform NTG).
• Experiences with and feedback on the RPP program trial • Perceptions regarding the appropriate timing and level of incentives
Introduction
We are part of the team working in California with PG&E, SMUD and [Retailer] on the Retail Plug Load Portfolio (RPP) Program Trial that is currently being tested in 26 [Retailer] stores in PG&E’s and SMUD’s service territories. As part of the trial, my company, EMI is working with PG&E, SMUD, and [Retailer] to understand how the trial is going and any potential improvements that could be made. We are talking to buyers like yourself to get your perspectives. Although we will share your responses, you will remain anonymous.
Background Questions
1. Can you please tell me your job title and walk me through your job responsibilities to me?
2. How long have you held this position?

109
PG&E’s Emerging Technologies Program ET13PGE8052
RPP TRIAL IN-DEPTH INTERVIEW GUIDE: CORPORATE MERCHANTS
2
INTERVIEW GUIDE
RPP Program Trial Awareness
3. Are you familiar with the retail plug load product (RPP) trial that is a partnership between [Retailer] and PG&E/SMUD?
4. Can you describe your understanding of the how the trial works?
a. Do you know what the goal of this trial is?
5. Are there any aspects of the RPP trial that are unclear to you?
Product Purchasing Logistics
6. Which product categories (e.g., refrigerators) are you responsible for purchasing? (If it’s unclear) Does that include any of the following?
a. Refrigerators, b. Freezers, c. RACs, d. Air cleaners, e. Compact audio (including docking stations), f. HTIB, or g. DVD/Blu-Ray
7. Can you walk me through the purchasing process for the products you are responsible
for? h. Who places the order with manufacturers? i. Where do the manufacturers ship products (distribution centers, direct to stores)? j. Where are the distribution centers that serve the trial stores located?? k. Does a single distribution center serve all of the trial stores? If no, how many serve
the trial stores? l. How much input do individual stores have in your decisions? m. For each product category, when are the purchase decisions made in the year? n. For each product category, when are products typically shipped to distribution
centers? o. For each product category, when are products shipped to stores?
8. On a scale of 0 to 10 where 0 is not at all important and 10 is the most important, can you
rate the importance of the following factors on your decision to buy products: p. Price/profit potential q. Previous year sales r. Features s. Brand t. Market/industry trends u. Energy efficiency/energy consumption v. Other factors? w. Inventory turns x. Product quality/rates of return y. Competitive pricing (relative to the greater marketplace)

110
PG&E’s Emerging Technologies Program ET13PGE8052
RPP TRIAL IN-DEPTH INTERVIEW GUIDE: CORPORATE MERCHANTS
3
9. Now I want to get a better understanding of how products you purchase are distributed to stores.
z. Within each product category, does the same assortment of models that you purchase go to every [Retailer] store or just certain stores?
aa. How do you/someone else determine which models within each product category are shipped to certain stores but not others?
bb. How do you/someone else ensure that products intended only for certain stores are actually shipped to only those stores and not others?
cc. Do products that have already been shipped to stores ever get transferred to other stores?
i. Under what circumstances? ii. Who makes these decisions? Are these decisions made by individual
stores or by corporate headquarters?
Product Promotion Decisions
10. How do you determine which products to promote? a. What are the most important factors in your decision? b. Do you work with manufacturers to develop promotion for products? c. Do the [Retailer] stores have any input into your promotion decisions?
11. What types of promotional activities do you typically utilize to promote a product (e.g. sales, in-store displays, flyers, media advertising, etc.)?
d. Are reduced pricing, rewards points, event flyers, in-store signage, and in-store radio announcements promotional activities that you typically use?
e. For each product category, when are the promotion strategies developed in the year?
Energy Efficiency Awareness
12. In general, are you familiar with any energy efficiency metrics for the products you manage? (UEC, kWh, BTUs, etc.)
13. Are you familiar with: a. Department of Energy (DOE) standards for energy use? b. How about the ENERGY STAR specification? c. Any other specs or standards? d. Prior to this trial, had you incorporated these standards into planning decisions for
the products you are responsible for?
14. Is the energy efficiency/energy use of these products a factor in your promotion or purchasing decisions?
e. (Probe whether it is promotion only, purchasing only, or both) f. On a scale of 0 to 10 where 0 means absolutely no influence and 10 means total
influence, Prior to the start of this trial, how much influence did the energy efficiency or energy usage of a product have on your decision to promote/purchase it?
Expected RPP Program Trial Influence on Behavior
Expected Impact of the Trial
15. Did the trial cause you to make any changes in the way you promoted/purchased/assorted/stocked products this year?

111
PG&E’s Emerging Technologies Program ET13PGE8052
RPP TRIAL IN-DEPTH INTERVIEW GUIDE: CORPORATE MERCHANTS
4
a. Which changes? (Be sure to differentiate promotion, purchasing, and assortment) i. Communications with vendors to identify and possibly assort product
moving forward? b. Did the changes you made in promotion/purchasing/stocking/assorting/placement
affect: i. Participating [Retailer] stores ii. Stores in the same area but not participating stores iii. Regional stores iv. National stores
c. (If no changes) Why did it not cause you to make any changes?
16. Do you expect that the trial will affect your promotion/purchasing/assortment/stocking/placement plans for next year?
d. How? (Interviewer: Be sure to differentiate promotion, purchasing, and assortment)
e. Do you think that the changes you plan to make in promotion/purchasing/stocking/assorting/placement will affect:
i. Participating [Retailer] stores ii. Stores in the same area but not participating stores iii. Regional stores iv. National stores
f. What are you planning to do differently?
17. Do you think that this trial might cause you to change your behavior in regards to promoting and/or purchasing products in the future (beyond the trial)? (Interviewer: Be sure to differentiate promotion and purchasing)
Assessment of the RPP Program Trial
Intervention Strategy
18. Are you familiar with the RPP Trial Marketing Plan? 19. Were you involved in creating the marketing plan?
a. How?
20. Can you tell me what input you provided specifically into the marketing plan?
21. Do you think the activities associated with this plan will lead to increased sales of program-qualified products?
a. Why or why not?
22. Are there other actions that you think would drive sales of program-qualified units that are not currently part of the program?
b. What are they? c. Were these considered for inclusion in the program? d. Why or why not?
Incentive Amounts/Timing
23. Are you aware that [Retailer] is a receiving an incentive for each program-qualified unit sold?
24. Do you know what the incentive values are?

112
PG&E’s Emerging Technologies Program ET13PGE8052
RPP TRIAL IN-DEPTH INTERVIEW GUIDE: CORPORATE MERCHANTS
5
25. If they don’t know, read:
Air Cleaner: $25 RAC: $20-$40 Freezers and Refrigerators: $40 HTIB and Stereos: $15 DVD/Blu Ray and Docking Stations: $4
26. Do you think the trial incentive amounts are adequate to affect [Retailer] purchasing decisions?
a. (If not) What do you think appropriate incentive amounts should be? b. What are you basing these values on?
27. Is the timing of the incentives effective in driving your
purchasing/assortment/stocking/placement decisions? (Interviewer: Be sure to differentiate promotion, purchasing, and assortment)
28. Is the basic program design ($ incentives to [Retailer] from PG&E/SMUD for each
program-qualified unit sold) an effective motivation for you to sell more energy efficient products?
c. Are there other ways besides per-unit incentives that you believe could drive sales of energy efficient models?

113
PG&E’s Emerging Technologies Program ET13PGE8052
RPP TRIAL IN-DEPTH INTERVIEW GUIDE: STORE MANAGERS
1
RPP TRIAL IN-DEPTH INTERVIEW GUIDE (STORE MANAGERS)
This interview guide details the key areas that the evaluation team will focus on during in-depth interviews with [Retailer] store managers.
1.1 Key Areas of Questioning
• Awareness and knowledge regarding energy efficiency in general • Awareness and knowledge regarding their customers’ demands for energy efficient
products • Knowledge about energy efficiency as it relates to the seven qualified product
categories that are part of the RPP Program trial. • Awareness of the RPP Program Trial • Influence of the RPP Program Trial on their promotion, pricing, placement, assortment,
and stocking decisions • Perceived influence of the program on customer purchasing decisions • Activities implemented to promote program-qualified products (staff training, pricing,
placement, promotion, assortment, etc.) • A battery of questions regarding the likelihood that they would have designed and
implemented the agreed-upon marketing plan absent the RPP Program Trial (to inform NTG)
• Experiences with and feedback on the RPP Program Trial • Product placement and assortment
1.2 Intro
We are part of the team working with PG&E and [Retailer] on the Retail Plug Load Portfolio (RPP) Trial that is currently being tested in 26 [Retailer] stores in PG&E and SMUD service territory. As part of the trial, my company, EMI is working with PG&E and [Retailer] to understand how the trial is going and any potential improvements that could be made. We are talking to store managers like yourself to get your perspectives. Although we will share your responses, you will remain anonymous.
1.3 Background Questions
1. Can you please tell me your job title and walk me through your job responsibilities? 2. How long have you held this position?

114
PG&E’s Emerging Technologies Program ET13PGE8052
RPP TRIAL IN-DEPTH INTERVIEW GUIDE: STORE MANAGERS
2
2. INTERVIEW GUIDE
2.1 RPP Program Trial Awareness
3. Are you familiar with the retail plug load portfolio (RPP/PG&E) Trial/program?
4. Can you describe your understanding of your role and responsibilities regarding the Trial/PG&E partnership?
2.2 RPP Program Trial Influence
Previous promotion, pricing, placement, assorting, and stocking activities
5. Were there efforts in your store to drive the sales of energy efficient products before this trial?
a. This could include discounted pricing on EE models, assortment of EE models, stocking of EE models, promotion (via placement, advertising, SYW points, flyers, staff training), or something else designed to drive sales of more energy efficient products
b. If so, what were these efforts? What did you do?
6. Were any of these efforts focused on the following products: c. Refrigerators d. Freezers e. Room air conditioners (RACs) f. Air cleaners g. Compact Audio products (stereos, MP3 docks, etc.) h. Home theater in a box (HTIB, sound bars, etc.) i. DVD/Blu-Ray players
Activities implemented to promote program-qualified products/models (product pricing, signage, staff training, etc.)
7. Since November of last year, did you implement any of the following activities in Q4 of 2013? And if so, when?
a. Discounted pricing on: air cleaners ($25), freezers ($40), and refrigerators ($40) b. Event Flyer emphasizing energy-efficient products c. ENERGY STAR signage d. Store associate training on energy-efficiency products e. In-store radio announcement informing shoppers about benefits of energy
efficient products f. Any others?
8. How did you receive instructions to implement these activities?
9. Are you aware of any plans to drive the sales of energy efficient products at your store in
the future?

115
PG&E’s Emerging Technologies Program ET13PGE8052
RPP TRIAL IN-DEPTH INTERVIEW GUIDE: STORE MANAGERS
3
Actions absent the trial
10. Were you planning to implement any kind of promotion or strategy to sell more energy-efficient appliances or consumer electronics before the trial began?
11. Which promotional strategies for which product categories?
Product(Categories( Promotional(Strategies(Refrigerators !!Freezers !!Room air conditioners (RACs) !!Air cleaners !!Compact Audio products (stereos, MP3 docks, etc.) !!Home theater in a box (HTIB, sound bars, etc.) !!
DVD/Blu-Ray players !!
a. For each one, why?
Perceived influence of the program on customer purchasing decisions
12. Do you think that the changes implemented as part of the trial will have an impact on sales in the targeted product categories at your store?
a. Which products? b. What kind of an impact; greater sales of energy-efficient models?
13. What actions/strategies do you think have been/will be the most successful at driving
sales of energy-efficient products?
14. Are there any actions/strategies that you think are less effective than others? c. Which ones? d. Why?
15. Do you have any suggestions about additional changes that could be made to increase the sales of energy-efficient models?
2.3 Assortment and Placement
16. Can you talk me through the process used by [Retailer] to keep shelves stocked with product?
a. Is there an automated system for maintaining inventory levels or do people make the
decisions? i. If people: Who makes the decisions (i.e. store managers, other managers,
corporate?) b. Does product ever get transferred from store-to-store, or does it come from a
centralized warehouse?
17. If needed to meet demand, are you able to specifically order additional program-qualifying products? c. Where do these units come from (other stores or warehouse)?

116
PG&E’s Emerging Technologies Program ET13PGE8052
RPP TRIAL IN-DEPTH INTERVIEW GUIDE: STORE MANAGERS
4
d. About how often does this happen? (i.e., about how many units have been requested at what frequency)?
e. Once ordered, how long does it normally take for these products to arrive at your store?
18. How much flexibility do you have to promote products by placing them in different
locations within your store or shelf, lowering prices, or any other store-specific promotional efforts to increase the sale of qualified products? (Are your options constrained by existing contracts or decisions from others for product placement or other promotional efforts?)
2.4 Assessment of the RPP Program Trial
19. Do you think the promotional strategies used in this trial are the most effective ways to drive sales of energy-efficient models in the target product categories?
a. Do you think customers are open to purchasing energy-efficient options?
20. Are there other ways to drive sales of energy-efficient models that you think would be more effective than the current proposed methods?
b. What are they? c. Is there anything that would prevent these strategies from being implemented?
21. Are there any aspects of this program that you think will be a challenge to implement or be burdensome?
2.5 Energy Efficiency Awareness
22. Are you generally familiar with: a. Department of Energy (DOE) standards for energy use? b. How about the ENERGY STAR specification? c. Any other specs or standards? d. Prior to this trial, have you incorporated these standards into promotional in your
store? 23. Are there specific products that you associate energy efficiency with?
e. Which ones? f. Why?
24. Do your customers ever ask for ENERGY STAR products? g. How aware are customers of energy efficiency?
2.6 Closing Question
• If we conduct interviews in August at the completion of the program, would you be interested in participating in a follow-up interview for an additional $50 incentive?

117
PG&E’s Emerging Technologies Program ET13PGE8052
RPP TRIAL IN-DEPTH INTERVIEW GUIDE: CORPORATE GREEN TEAM
1
RPP TRIAL IN-DEPTH INTERVIEW GUIDE: CORPORATE GREEN TEAM
This interview guide details the key areas that the evaluation team will focus on during in-depth interviews with [Retailer] corporate green team staff.
1.1 Key Areas of Questioning
• Decisions on product for the RPP Program Trial • Involvement with the RPP Program Implementation • Experiences with the RPP program trial
1.2 Introduction
We are part of the team working in California with PG&E, SMUD and [Retailer] on the Retail Plug Load Portfolio (RPP) Program Trial that is currently being tested in 26 [Retailer] stores in PG&E’s and SMUD’s service territories. As part of the trial, my company, EMI is working with PG&E, SMUD, and [Retailer] to understand how the trial is going and any potential improvements that could be made. We are talking to corporate staff like yourself to get your perspectives. Although we will share your responses, you will remain anonymous as much as possible.
1.3 Involvement with RPP Program Implementation
Intervention Strategy
1. Have you participated in the development of market strategies or plan 2. How? Explain. [since we last spoke] 3. What was your involvement
4. Are there certain activities that have so far proven easier to implement? What are they
and why were they easy? 5. Are there certain activities that have proven more difficult to implement? What are they
and why were they more difficult?
6. Do you think the activities associated with this plan will lead to increased sales of program-qualified products? [probe different products]
a. Why or why not?
7. Are there other actions that you think would drive sales of program-qualified units that are not currently part of the program?
b. What are they? c. Were these considered for inclusion in the program? d. Why or why not?

118
PG&E’s Emerging Technologies Program ET13PGE8052
RPP TRIAL IN-DEPTH INTERVIEW GUIDE: CORPORATE GREEN TEAM
2
1.4 Experience with the RPP Program Trial
Expected Impact of the Trial
1. What changes do you expect the program to have to promoted products this year? a. Which changes are occurring? b. Do you expect the changes to last beyond the promotion period? Why/Why not?
2. Once completed, do you expect that the trial will affect future promotion plans or
partnerships? a. How? b. What are you planning to do differently?
3. What aspects of the program worked well? a. Why? b. What should future programs do more of?
4. What were the key challenges to the program?
a. Why did they occur? b. Where you able to address any of them during the trial period? c. What adjustments were made? d. Were there any particularly difficult hurdles? e. What can be done better?
If we have any additional questions is it okay if we email or call you?

119
PG&E’s Emerging Technologies Program ET13PGE8052
RPP TRIAL INTERVIEW TOPIC GUIDE: PG&E/IMPLEMENTATION STAFF
1
RPP TRIAL INTERVIEW TOPIC GUIDE: PG&E/IMPLEMENTATION STAFF
This interview guide details the key areas that the evaluation team will focus on during in-depth interviews with PG&E Program Staff.
1.1 Key Areas of Questioning
• Lessons learned about the development and implementation of the program (e.g., what has worked, what has not? what have been the greatest hurdles? what have been the greatest successes?)
• Recommendations for change and improvement of the program • Administrative processes and protocols – Are they appropriate and scalable? • Frequency and effectiveness of the communication between the utility, implementers, and
retailer • Identify information that needs to be tracked by the RPP Program Trial
1.2 Background Questions
• Job title • Time in current position
1.3 Program Trial Communication
1. Do you think that the overall communication between PG&E/SMUD program staff, Energy Solutions, Navitas, and the retailer regarding the Trial has been effective?
2. Do you feel like you are able to get your questions answered quickly and easily?
3. Do you communicate directly with anyone at [Retailer]? Who? How often?
1.4 Data Tracking & Model Matching
1. Are you/PG&E/SMUD currently getting the data you need from the retailer? a. If not, what data are you not getting that you need
2. Are you getting the data that you need from Energy Solutions? a. Is the model-matching process working? b. Is the turn around time reasonable? c. Is the model-matching process scalable to a larger program with multiple retailers
and more products? 3. Outside of the data currently tracked by PG&E/EMI ([Retailer] sales data, shelf survey data,
email communications from Navitas) Is there any additional information you feel should be tracked by the program?
a. What information do you feel needs to be tracked by the program?

120
PG&E’s Emerging Technologies Program ET13PGE8052
RPP TRIAL INTERVIEW TOPIC GUIDE: PG&E/IMPLEMENTATION STAFF
2
1.5 Assessment of the RPP Program Trial/Program
Retailer Engagement
1. Is [Retailer] engaged with the RPP Trial? a. Does it seem like [Retailer]’s engagement is increasing or decreasing as the Trial
moves forward?
RPP Trial
1. What is working well for the RPP Trial? 2. Is there anything that is not working well for the RPP Trial? 3. What have been the largest hurdles for the RPP Trial? 4. What have been the most significant challenges for you in regards to the Trial?
5. Are there changes that you would like to see made to the RPP Trial?
6. If so, what’s preventing those changes from being made?
Full-scale RPP Program
1. Are there any changes that you think would need to be made to any aspects of the current trial to scale it up into a full program?
1. Do you believe the current administrative processes and protocols will be scalable for a potential full program?
a. Why? b. Why not?

121
PG&E’s Emerging Technologies Program ET13PGE8052
RPP TRIAL IN-DEPTH INTERVIEW GUIDE: CORPORATE MERCHANTS – WAVE 2
1
RPP Trial In-Depth Interview Guide: Corporate Buyers – Wave 2
Introduction
This interview guide details the key areas that the evaluation team will focus on during in-depth interviews with [Retailer] corporate staff.
Research Questions or Objectives
• Awareness and knowledge regarding energy efficiency in general • Knowledge about energy efficiency initiatives underway at [Retailer], and whether
there is any collaboration/communication regarding energy efficiency initiatives • Knowledge about energy efficiency as it relates to the qualified six product categories
part of the RPP Trial • Distribution of products purchased (i.e., do any program-qualified products go to non-
participating stores in addition to participating stores) • Awareness of the RPP Program Trial • Influence of the RPP Program Trial on their promotion and purchasing decisions • Experiences with and feedback on the RPP program trial
Purpose
We are part of the team working in California with PG&E, SMUD and [Retailer]on the Retail Plug Load Portfolio (RPP) Program Trial that is currently being tested in 26 [Retailer] stores in PG&E’s and SMUD’s service territories. As part of the trial, my company, EMI is working with PG&E, SMUD, and [Retailer] to understand how the trial is going and any potential improvements that could be made. We are talking to buyers like yourself to get your perspectives. Although we will share your responses, you will remain anonymous.
Interview
Section A: Background [Only for new interviewees]
A1. Can you please tell me your job title and walk me through your job responsibilities to me?
A2. How long have you held this position?

122
PG&E’s Emerging Technologies Program ET13PGE8052
RPP TRIAL IN-DEPTH INTERVIEW GUIDE: CORPORATE MERCHANTS – WAVE 2
2
Section B: RPP Program Trial Awareness [Only for new interviewees]
B1. What is your understanding of the retail plug load product (RPP) trial that is a partnership between [Retailer] and PG&E/SMUD?
B2. How were you made aware of the RPP Trial program?
a. What information was provided? b. Is there ongoing communication among [Retailer] staff about this program? If
so, what type?
Section C: Product Purchasing
C1. My understanding is that the products associated with the program that you are responsible for purchasing are the [PLUG IN: home appliances, including refrigerators, freezers, room air conditioners, and air cleaners or consumer electronics, including home-theatres-in-a-box, soundbars, and DVD/Blu-ray players]. Is this correct?
Section D: Energy Efficiency Awareness
D1. On a scale of 0 to 10 where 0 means absolutely no influence and 10 means total influence, today, how much influence does the energy efficiency or energy usage of a product have on your decision to purchase it?
D2. Has the program impacted your awareness or knowledge of energy usage for the
products you are responsible for?
a. If so, how? b. What are you planning to do differently?
D3. Is the energy use of products that you are responsible for readily available?
a. Do you check to see if the products are ENERGY STAR rated? b. If you had a question about the energy use of a product, where or from whom
would you try and get that information?
Section E: Expected RPP Program Trial Influence on Behavior
E1. Has the program caused you to make any changes in the way you purchase products or the assortment and stocking of products? If so, what are those changes (Be sure to specify what behavior has changed)

123
PG&E’s Emerging Technologies Program ET13PGE8052
RPP TRIAL IN-DEPTH INTERVIEW GUIDE: CORPORATE MERCHANTS – WAVE 2
3
a. Did the changes in purchasing/ stocking/ placement have any other affect on following:
i. Participating [Retailer] stores ii. Stores in the same area but not participating stores iii. Regional stores iv. National stores
b. (If no changes) Why did it not cause you to make any changes?
E2. By what percentage do you estimate sales of ENERGY STAR (refrigerators, freezers, RAC’s, air cleaners) would be lower if the RPP trial promotional incentives for (refrigerators, freezers, RAC’s, air cleaners) were not available?
a. Is the percentage different fro each product type? b. (If yes, probe for each responsible product). c. How do you track this impact?
E3. Do you expect that the trial will affect your promotion/ purchasing/ stocking/ placement plans for next year??
a. How? (Probe specifically for each of the four behavior types) b. Do you think that the changes you plan to make in in promotion/ purchasing/
stocking/ placement will affect: i. Participating [Retailer] stores ii. Stores in the same area but not participating stores iii. Regional stores iv. National stores
c. What are you planning to do differently?
E4. Do you think that this trial might cause you to change your behavior in regards to promoting and/or purchasing products in the future (beyond the trial)?
a. (Probe specifically for each of the four behavior types)
Section F: Marketing Plan and Activities
F1. Are you familiar with the marketing plan or activities of the RPP trial?
a. If so, can you explain your understanding of the marketing activities?
Section G: RPP Program Trial Process
G1. From your perspective, what aspects of the RPP trial program are working well?
a. Why do you think that aspect has been successful?
G2. Where do you see opportunities for improvements in the RPP trial promotion?

124
PG&E’s Emerging Technologies Program ET13PGE8052
RPP TRIAL IN-DEPTH INTERVIEW GUIDE: CORPORATE MERCHANTS – WAVE 2
4
a. What is challenging about that aspect? b. What recommendations or changes would you suggest?
Section H: Closing
Thank you. Those are all the questions we have for you today. If we have any additional follow-up questions, is it okay if we email or call you

125
PG&E’s Emerging Technologies Program ET13PGE8052
RPP PROGRAM: STORE MANAGER SURVEY GUIDE: WAVE 2
1
RPP Program: Store Manager Survey Guide: Wave 2
Introduction
This document details the key areas that the evaluation team will focus on for the online survey with participating [Retailer] store managers.
Research Questions or Objectives
• Awareness of in-store promotional activities in general • Awareness of the RPP Program Trial • Awareness of RPP-specific promotional activities • Possible increase in efficient product sales due to RPP Program Trial in participating
stores • Awareness and knowledge regarding their customers’ demands for energy efficient
products
Fielding Instructions
EMI Consulting will conduct the web survey via the online survey site Qualtrics. Once the final survey instrument is developed and approved, [Retailer] corporate staff will distribute the survey link to the managers of all participating [Retailer] stores. We anticipate that the survey will take 5-10 minutes to complete. Respondents will initially be given a 2-week window to complete the survey. At the end of the first week, we will have [Retailer] corporate staff send a reminder email to managers who have not yet completed the survey. If necessary, we may also send a 2nd email reminder closer to the completion deadline.
Email Invite
[Retailer] has been working with Pacific Gas & Electric Company (PG&E) and the Sacramento Municipal Utility District (SMUD) in California as part of the Retail Plug Load Portfolio (RPP) Program. Your store participated in the RPP Program in 2014. We are asking that you provide some very valuable insight by completing a short online survey that should only take 10-15 minutes. Please be assured we will protect your confidentiality by not tying your responses back to you or your store. The survey link is provided below:

126
PG&E’s Emerging Technologies Program ET13PGE8052
RPP PROGRAM: STORE MANAGER SURVEY GUIDE: WAVE 2
2
Survey
Introduction
We are part of the team working with Pacific Gas & Electric (PG&E), the Sacramento Municipal Utility District (SMUD), and [Retailer] on a pilot program called the Retail Plug Load Portfolio Trial was tested last year in 24 [Retailer] stores in the PG&E and SMUD service territories. Your store was one of the 24 participating stores. As part of the trial, my company, EMI Consulting is working to gain a better understanding of how the trial was implemented in the stores and how it may have impacted sales of energy efficient products. Please be assured we will protect your confidentiality by not tying your responses back to you or your store. We thank you for providing feedback. Your insight is extremely valuable. The survey should only take 10-15 minutes to complete.
Section A: Background Questions
A1. What is your [Retailer] store number?
A2. What month and year did you start working as a store manager at this location?
1. Month ____ 2. Year ____
Section B: Manager Involvement
We recognize that as a store manager, you have a lot of different responsibilities associated with running your store. In this section of the survey, we ask some questions to gain an understanding about your level of involvement specifically with in-store merchandising and promotional activities. Promotional activities can include particular events or programs targeting specific products, discount or sales pricing, signage, advertising, staff training, in-store announcements, etc. B1. In general, how aware are you about the various promotions conducted in your store?
1. Very aware 2. Somewhat aware 3. Not aware [SKIP TO B5]
B2. Approximately how many promotional events are running in your store in a typical week?
[ENTER NUMERIC RESPONSE]

127
PG&E’s Emerging Technologies Program ET13PGE8052
RPP PROGRAM: STORE MANAGER SURVEY GUIDE: WAVE 2
3
B3. We want to gauge the type of details you are aware of with regards to promotions. Please briefly describe one promotional event from 2014 in terms of the featured brand(s), dates, and the merchandising strategies that were used (e.g., discount pricing, signage, advertising, staff training, in-store announcements, etc.).
[ENTER VERBATIM RESPONSE]
B4. Briefly describe the influence you think this promotional event had on product sales, customer traffic, etc.
[ENTER VERBATIM RESPONSE]
B5. Our understanding is that corporate staff directs most of the merchandising/promotional
activities that are implemented in your store by informing your store of what to implement and when.
Are promotional activities communicated from corporate staff directly to you or some
other staff?
1. Directly to me 2. To some other store staff (Please describe this persons role or title: _____)
B6. At your store, whom has the most familiarity with the various promotional activities
associated with:
Home appliances? (e.g., freezers, refrigerators, room air conditioners, room air cleaners, etc.) 1. Myself 2. Some other staff (Please describe this persons role or title: _______)
Consumer electronics? (e.g., DVD/Blu-Ray players, soundbars, home theaters-in-a-box, etc.) 1. Myself 2. Some other staff (Please describe this persons role or title: _______)
Section C: RPP Program Trial Awareness
C1. Are you aware of the Retail Plug Load Portfolio (RPP) Program trial, sponsored by Pacific Gas & Electric (PG&E) that was conducted in your store in 2014?
1. Yes 2. No [SKIP TO C3] -8. Don’t know [SKIP TO C3]
C2. Please describe briefly your understanding of the program?
[ENTER VERBATIM RESPONSE] [SKIP TO D1] C3. The Retail Plug Load Program is a program focused on promoting and selling certain
categories of energy-efficient consumer electronics and home appliances in [Retailer]
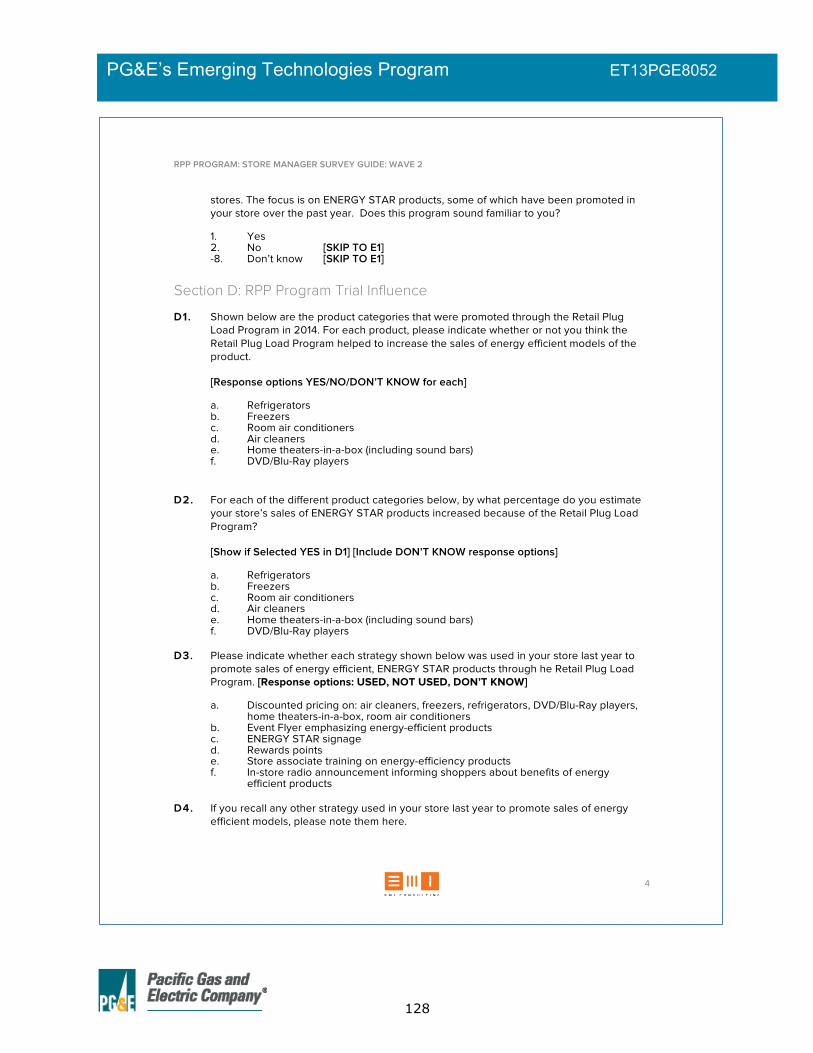
128
PG&E’s Emerging Technologies Program ET13PGE8052
RPP PROGRAM: STORE MANAGER SURVEY GUIDE: WAVE 2
4
stores. The focus is on ENERGY STAR products, some of which have been promoted in your store over the past year. Does this program sound familiar to you?
1. Yes 2. No [SKIP TO E1] -8. Don’t know [SKIP TO E1]
Section D: RPP Program Trial Influence
D1. Shown below are the product categories that were promoted through the Retail Plug Load Program in 2014. For each product, please indicate whether or not you think the Retail Plug Load Program helped to increase the sales of energy efficient models of the product.
[Response options YES/NO/DON’T KNOW for each]
a. Refrigerators b. Freezers c. Room air conditioners d. Air cleaners e. Home theaters-in-a-box (including sound bars) f. DVD/Blu-Ray players
D2. For each of the different product categories below, by what percentage do you estimate your store’s sales of ENERGY STAR products increased because of the Retail Plug Load Program?
[Show if Selected YES in D1] [Include DON’T KNOW response options]
a. Refrigerators b. Freezers c. Room air conditioners d. Air cleaners e. Home theaters-in-a-box (including sound bars) f. DVD/Blu-Ray players
D3. Please indicate whether each strategy shown below was used in your store last year to
promote sales of energy efficient, ENERGY STAR products through he Retail Plug Load Program. [Response options: USED, NOT USED, DON’T KNOW]
a. Discounted pricing on: air cleaners, freezers, refrigerators, DVD/Blu-Ray players, home theaters-in-a-box, room air conditioners
b. Event Flyer emphasizing energy-efficient products c. ENERGY STAR signage d. Rewards points e. Store associate training on energy-efficiency products f. In-store radio announcement informing shoppers about benefits of energy
efficient products D4. If you recall any other strategy used in your store last year to promote sales of energy
efficient models, please note them here.

129
PG&E’s Emerging Technologies Program ET13PGE8052
RPP PROGRAM: STORE MANAGER SURVEY GUIDE: WAVE 2
5
[ENTER VERBATIM RESPONSE] D5. What actions or strategies do you think have been the most successful at driving sales of
energy-efficient products?
[SHOW ONLY ITEMS SELECTED IN D3] a. Discounted pricing on: air cleaners, freezers, and refrigerators b. Event Flyer emphasizing energy-efficient products c. ENERGY STAR signage d. Rewards points e. Store associate training on energy-efficiency products f. In-store radio announcement informing shoppers about benefits of energy
efficient products g. Any others?
[RATE EACH ON FIVE POINT SCALE] 1. Not at all effective 2. Slightly effective 3. Somewhat effective 4. Very effective 5. Extremely effective
D6. Do you have any suggestions about what activities would help increase the sales of energy-efficient models?
[ENTER VERBATIM RESPONSE]
Section D: Energy Efficiency Awareness
E1. Are you familiar with ENERGY STAR?
1. Yes 2. No [SKIP TO F1] -8. Don’t know [SKIP TO F1]
E2. Generally, how aware do you think your customers are of ENERGY STAR?
1. Not at all aware [SKIP TO F1] 2. Slightly aware 3. Somewhat aware 4. Moderately aware 5. Extremely aware
E3. Do your customers ever ask for ENERGY STAR products?
1. Yes 2. No [SKIP TO F1] -8. Don’t know [SKIP TO F1]
E4. About what proportion of your customers ask for ENERGY STAR products?

130
PG&E’s Emerging Technologies Program ET13PGE8052
RPP PROGRAM: STORE MANAGER SURVEY GUIDE: WAVE 2
6
1. Scale 0% to 100% -8. Don’t know
E5. In general, how influential do you think the ENERGY STAR label is in customer buying
decisions?
1. Not at all influential 2. Slightly influential 3. Somewhat influential 4. Very influential 5. Extremely influential
Section E: Closing
F1. Thank you for taking the time to complete this survey, that wraps up all of our questions. Your input is greatly appreciated and will be used to help assess the program effectiveness.

131
PG&E’s Emerging Technologies Program ET13PGE8052
RPP TRIAL IN-DEPTH INTERVIEW GUIDE: CORPORATE GREEN TEAM – WAVE 2
1
RPP Trial In-Depth Interview Guide: Corporate Green Team – Wave 2
Introduction
This interview guide details the key areas that the evaluation team will focus on during follow-up in-depth interviews with [Retailer] corporate green team staff.
Research Questions or Objectives
• Participation in RPP Program Marketing • Involvement with the RPP Program Implementation • Experiences with the RPP program trial
Purpose
We are talking to corporate staff like yourself to better understand the RPP Trial progress from your perspectives. Although we will share your responses, you will remain anonymous as much as possible.
Interview
Section A: Participation in RPP Program Marketing
A1. Have you participated in the development of new market strategies or plans since we last spoke?
a. If so, how? Explain. b. How were you involved? What was your contribution?
Section B: Involvement with RPP Program Implementation
B1. Are there certain program activities that have so far proven easier to implement?
a. Which activities? Why were they easier?
B2. Are there certain program activities that have proven more difficult to implement?
a. Which activities? Why were they more difficult?
B3. Do you think the activities associated with this plan will lead to increased sales of program-qualified products?

132
PG&E’s Emerging Technologies Program ET13PGE8052
RPP TRIAL IN-DEPTH INTERVIEW GUIDE: CORPORATE GREEN TEAM – WAVE 2
2
a. Why or why not? b. Have you seen any evidence so far that would support that? c. [Probe for impacts for each of the different products]
B4. Are there other actions that you think would drive sales of program-qualified units that are not currently part of the program?
a. What are they? b. Were these considered for inclusion in the program? c. Why were they not included in the original plans?
Section C: Experience with the RPP Program Trial
C1. What changes did you expect the program to have promoted for products this year?
d. What changes are occurring? e. Do you expect the changes to last beyond the promotion period? Why or why
not?
C2. Once completed, do you expect that the trial will affect future promotion plans or partnerships?
a. If so, how? b. What are you planning to do differently?
C3. What aspects of the program worked well?
a. Why? b. What should future programs do more of?
C4. What were the key challenges to the program?
a. Why did they occur? b. Were you able to address any of them during the trial period? c. What adjustments were made? d. Were there any particularly difficult hurdles? e. What can be done better?
Section D: Closing
Thank you. Those are all the questions we have for you today. If we have any additional follow-up questions, is it okay if we email or call you

133
PG&E’s Emerging Technologies Program ET13PGE8052
APPENDIX B: RETAILER ENERGY STAR SIGNAGE

134
PG&E’s Emerging Technologies Program ET13PGE8052
APPENDIX C: SHELF SURVEY RESULTS BY STORE
TABLE 48: DVD/BLU-RAY PLAYER SHELF SURVEY RESULTS BY STORE
STORE
TOTAL NUMBER
OF MODELS
TOTAL NUMBER OF PROGRAM-QUALIFIED
MODELS PROGRAM-QUALIFIED
MODELS ON SALE PROGRAM-QUALIFIED MODELS WITH PROMO
1 13 8 7 7 2 13 8 6 6 3 7 4 3 3 4 12 8 6 4 5 13 8 5 5 6 12 8 6 6 7 13 8 6 6 8 12 8 6 5 9 13 8 5 5 10 13 8 6 6 11 11 8 6 6 12 13 8 7 5 13 13 8 6 7 14 12 8 6 6 15 5 3 2 2 16 9 6 6 6 17 13 8 6 6 18 13 8 5 5 19 13 8 7 7 20 12 8 7 7 21 13 8 7 7 22 13 8 7 7 23 12 8 7 6 24 13 8 6 6
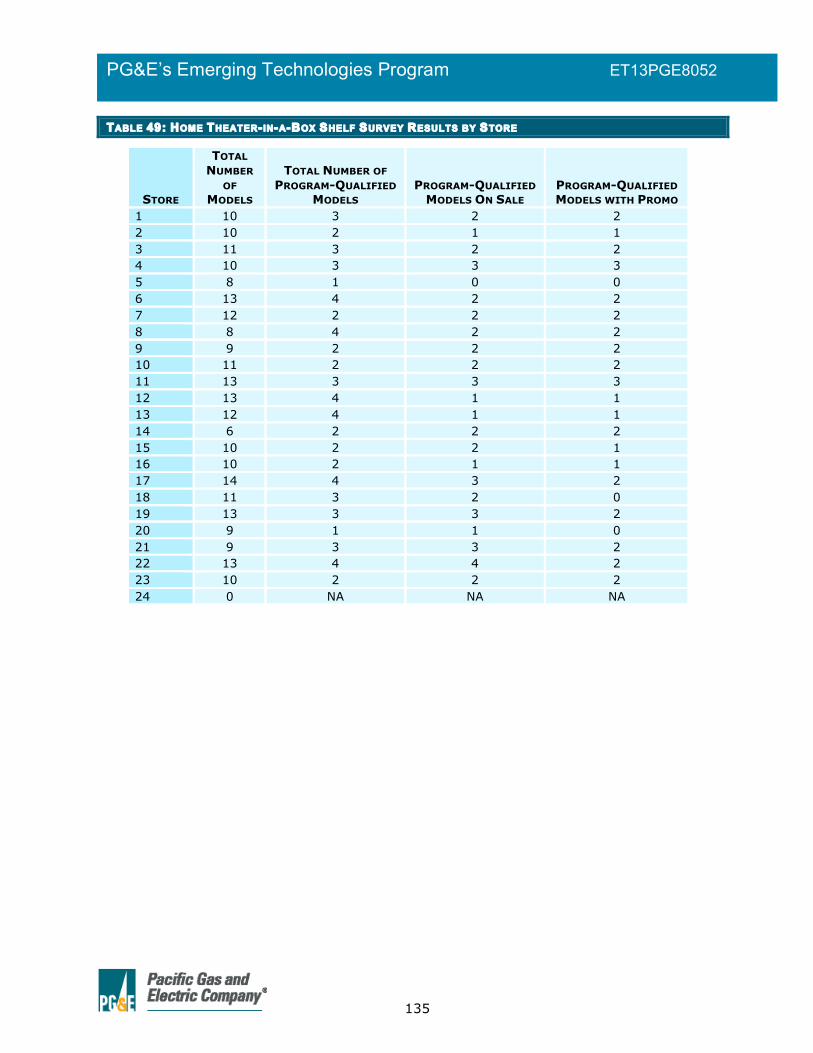
135
PG&E’s Emerging Technologies Program ET13PGE8052
TABLE 49: HOME THEATER-IN-A-BOX SHELF SURVEY RESULTS BY STORE
STORE
TOTAL NUMBER
OF MODELS
TOTAL NUMBER OF PROGRAM-QUALIFIED
MODELS PROGRAM-QUALIFIED
MODELS ON SALE PROGRAM-QUALIFIED MODELS WITH PROMO
1 10 3 2 2 2 10 2 1 1 3 11 3 2 2 4 10 3 3 3 5 8 1 0 0 6 13 4 2 2 7 12 2 2 2 8 8 4 2 2 9 9 2 2 2 10 11 2 2 2 11 13 3 3 3 12 13 4 1 1 13 12 4 1 1 14 6 2 2 2 15 10 2 2 1 16 10 2 1 1 17 14 4 3 2 18 11 3 2 0 19 13 3 3 2 20 9 1 1 0 21 9 3 3 2 22 13 4 4 2 23 10 2 2 2 24 0 NA NA NA

136
PG&E’s Emerging Technologies Program ET13PGE8052
TABLE 50: FREEZER SHELF SURVEY RESULTS BY STORE
STORE
TOTAL NUMBER
OF MODELS
TOTAL NUMBER OF PROGRAM-QUALIFIED
MODELS PROGRAM-QUALIFIED
MODELS ON SALE PROGRAM-QUALIFIED MODELS WITH PROMO
1 4 1 1 1 2 6 0 NA NA 3 4 0 NA NA 4 4 1 1 1 5 6 0 NA NA 6 4 1 1 1 7 3 0 NA NA 8 5 0 NA NA 9 5 1 1 1 10 5 0 NA NA 11 9 1 NA NA 12 5 0 NA NA 13 3 0 NA NA 14 5 0 NA NA 15 6 1 1 1 16 5 1 1 1 17 3 0 NA NA 18 4 1 1 1 19 4 1 1 1 20 5 1 1 1 21 5 1 1 1 22 5 1 1 1 23 2 0 NA NA 24 5 0 NA NA

137
PG&E’s Emerging Technologies Program ET13PGE8052
TABLE 51: REFRIGERATOR SHELF SURVEY RESULTS BY STORE
STORE
TOTAL NUMBER
OF MODELS
TOTAL NUMBER OF PROGRAM-QUALIFIED
MODELS PROGRAM-QUALIFIED
MODELS ON SALE PROGRAM-QUALIFIED MODELS WITH PROMO
1 10 2 2 2 2 9 1 1 1 3 3 1 1 1 4 5 1 1 1 5 17 6 6 2 6 5 1 1 1 7 2 0 NA NA 8 14 4 3 0 9 5 1 1 1 10 9 1 1 1 11 19 8 3 3 12 3 0 NA NA 13 5 1 1 1 14 17 5 2 1 15 8 1 1 0 16 8 1 1 0 17 4 1 1 1 18 6 1 1 1 19 12 3 2 1 20 9 1 1 1 21 11 1 1 1 22 9 1 1 1 23 2 0 NA NA 24 5 1 1 1

138
PG&E’s Emerging Technologies Program ET13PGE8052
TABLE 52: ROOM AIR CONDITIONER SHELF SURVEY RESULTS BY STORE
STORE
TOTAL NUMBER
OF MODELS
TOTAL NUMBER OF PROGRAM-QUALIFIED
MODELS PROGRAM-QUALIFIED
MODELS ON SALE PROGRAM-QUALIFIED MODELS WITH PROMO
1 2 0 NA NA 2 0 NA NA NA 3 0 NA NA NA 4 2 0 NA NA 5 6 1 1 1 6 4 0 NA NA 7 3 0 NA NA 8 6 1 1 0 9 1 0 NA NA 10 4 1 0 0 11 0 NA NA NA 12 0 NA NA NA 13 0 NA NA NA 14 1 0 NA NA 15 0 NA NA NA 16 0 NA NA NA 17 0 NA NA NA 18 3 0 0 0 19 0 NA NA NA 20 0 NA NA NA 21 3 0 0 0 22 6 0 0 0 23 7 0 0 0 24 0 NA NA NA

140
PG&E’s Emerging Technologies Program ET13PGE8052
TABLE 55: COMPARING UNIT SALES VOLUMES AND PROGRAM-QUALIFIED SHARE FOR HISTORICAL AND TRIAL PERIODS FOR SMUD AND NONPARTICIPATING STORES
Product Category Class
SMUD (N=2) NONPARTICIPATING STORES (N=66) HISTORICAL TRIAL PERIOD HISTORICAL TRIAL PERIOD
Non-PQ PQ PQS Non-PQ PQ PQS Non-PQ PQ PQS Non-PQ PQ PQS Air Cleaner <100 CADR 23 8 26% 4 4 50% 1,112 459 29% 474 255 35% DVD/Blu-Ray Blu-Ray 122 49 29% 77 142 65% 7,444 3,105 29% 3,254 6,525 67% DVD/Blu-Ray DVD 912 184 17% 535 79 13% 37,050 10,098 21% 19,254 3,971 17% HTiB Sound bar 55 10 15% 90 72 44% 2,289 314 12% 2,349 2,524 52% Freezer Chest 252 3 1% 213 0 0% 5,021 68 1% 3,862 104 3% Refrigerator Compact Mini 49 5 9% 48 13 21% 3,136 664 17% 2,910 416 13% Refrigerator Medium 49 1 2% 53 0 0% 2,304 84 4% 1,801 51 3% Refrigerator Very Large 7 0 0% 17 0 0% 247 110 31% 405 229 36% Room AC <12,000 BTU 161 28 15% 61 16 21% 7,686 2,203 22% 4,731 308 6% TOTAL 1,630 288 15% 1,098 326 23% 66,289 17,105 21% 39,040 14,383 27%
TABLE 56: DIFFERENCE-IN-DIFFERENCES TABLE COMPARING PQS OF SMUD AND NONPARTICIPATING STORES
Product Category Class
SMUD Difference
NonPart Difference Difference
Air Cleaner <100 CADR 24% 6% 18% DVD/Blu-Ray Blu-Ray 36% 37% -1% DVD/Blu-Ray DVD -4% -4% 0% HTiB Sound bar 29% 40% -11% Freezer Chest -1% 1% -2% Refrigerator Compact Mini 12% -5% 17% Refrigerator Medium -2% -1% -1% Refrigerator Very Large 0% 5% -5% Room AC <12,000 BTU 6% -16% 22% TOTAL 8% 6% 1%
FIGURE 17: SMUD AND NONPARTICIPATING STORE PQS FOR HISTORICAL AND TRIAL PERIODS
0%
10%
20%
30%
40%
50%
60%
70%
80%
<100 CADR
Blu-Ray DVD Sound bar
Chest Compact Mini
Medium Very Large
<12,000 BTU
Historical - Nonparticipating Stores Historical - SMUD
Program Period - Nonparticipating Stores Program Period - SMUD

141
PG&E’s Emerging Technologies Program ET13PGE8052
APPENDIX E: RESULTS OF FORECASTED PQS
BASELINE APPROACH

142
PG&E’s Emerging Technologies Program ET13PGE8052
FIGURE 18: FORECASTED PQS BASELINE – AIR CLEANERS (<100 CADR)
TABLE 57: NET EFFECTS USING FORECASTED PQS BASELINE – AIR CLEANERS (<100 CADR)
Mean Trial-period PQS Mean Forecasted PQS Net Effect 49% 33% 16%
FIGURE 19: FORECASTED PQS BASELINE – DVD/BLU-RAY PLAYERS (DVD)
TABLE 58: NET EFFECTS USING FORECASTED PQS BASELINE – DVD/BLU-RAY PLAYERS (DVD)
Mean Trial-period PQS Mean Forecasted PQS Net Effect 18% 14% 4%
!0.15&
0.05&
0.25&
0.45&
0.65&
0.85&
1.05&
Feb!12&
Apr!12&
Jun!12&
Aug!12&
Oct!12&
Dec!12&
Feb!13&
Apr!13&
Jun!13&
Aug!13&
Oct!13&
Dec!13&
Feb!14&
Apr!14&
Jun!14&
Aug!14&
Oct!14&
Dec!14&
PQS$
Int22& Int29& Int33& Actual& Forecast& Confidence&Interval&
!0.15&
0.05&
0.25&
0.45&
0.65&
0.85&
1.05&
Feb!12&
Apr!12&
Jun!12&
Aug!12&
Oct!12&
Dec!12&
Feb!13&
Apr!13&
Jun!13&
Aug!13&
Oct!13&
Dec!13&
Feb!14&
Apr!14&
Jun!14&
Aug!14&
Oct!14&
Dec!14&
PQS$
Int22& Int26& Int29& Int34& Actual& Forecast& Confidence&Interval&
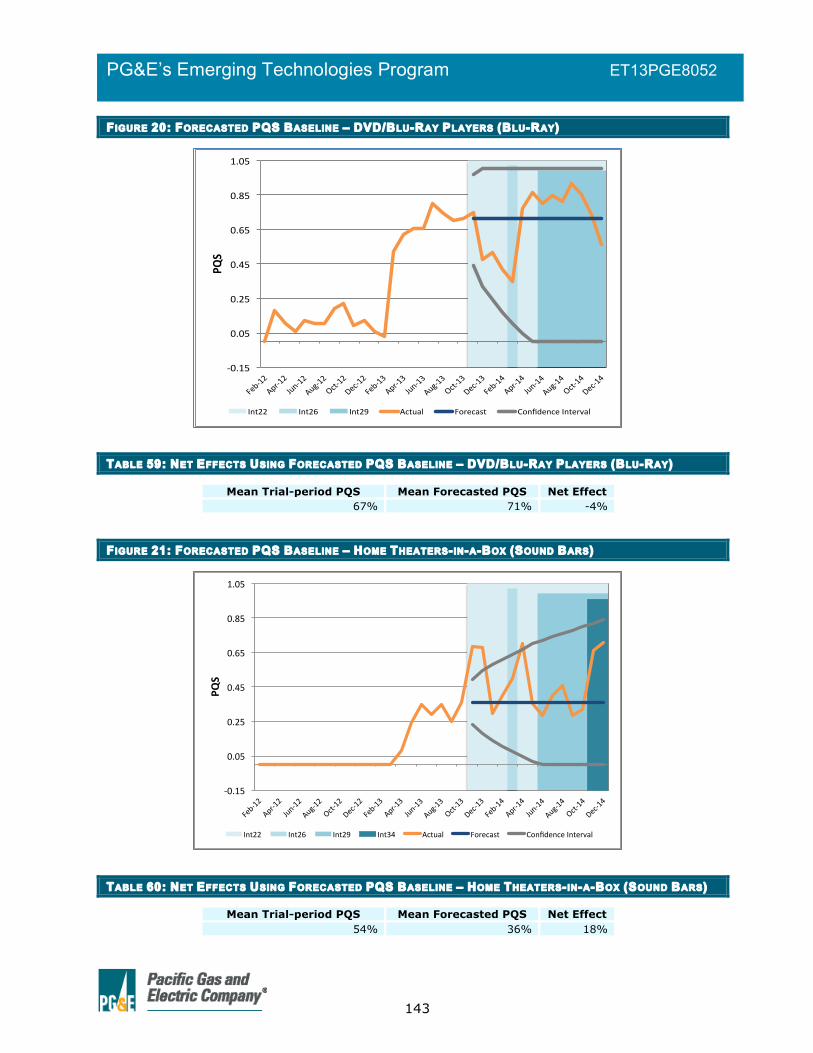
143
PG&E’s Emerging Technologies Program ET13PGE8052
FIGURE 20: FORECASTED PQS BASELINE – DVD/BLU-RAY PLAYERS (BLU-RAY)
TABLE 59: NET EFFECTS USING FORECASTED PQS BASELINE – DVD/BLU-RAY PLAYERS (BLU-RAY)
Mean Trial-period PQS Mean Forecasted PQS Net Effect 67% 71% -4%
FIGURE 21: FORECASTED PQS BASELINE – HOME THEATERS-IN-A-BOX (SOUND BARS)
TABLE 60: NET EFFECTS USING FORECASTED PQS BASELINE – HOME THEATERS-IN-A-BOX (SOUND BARS)
Mean Trial-period PQS Mean Forecasted PQS Net Effect 54% 36% 18%
!0.15&
0.05&
0.25&
0.45&
0.65&
0.85&
1.05&
Feb!12&
Apr!12&
Jun!12&
Aug!12&
Oct!12&
Dec!12&
Feb!13&
Apr!13&
Jun!13&
Aug!13&
Oct!13&
Dec!13&
Feb!14&
Apr!14&
Jun!14&
Aug!14&
Oct!14&
Dec!14&
PQS$
Int22& Int26& Int29& Actual& Forecast& Confidence&Interval&
!0.15&
0.05&
0.25&
0.45&
0.65&
0.85&
1.05&
Feb!12&
Apr!12&
Jun!12&
Aug!12&
Oct!12&
Dec!12&
Feb!13&
Apr!13&
Jun!13&
Aug!13&
Oct!13&
Dec!13&
Feb!14&
Apr!14&
Jun!14&
Aug!14&
Oct!14&
Dec!14&
PQS$
Int22& Int26& Int29& Int34& Actual& Forecast& Confidence&Interval&

144
PG&E’s Emerging Technologies Program ET13PGE8052
FIGURE 22: FORECASTED PQS BASELINE – FREEZERS (CHEST)
TABLE 61: NET EFFECTS USING FORECASTED PQS BASELINE – FREEZERS (CHEST)
Mean Trial-period PQS Mean Forecasted PQS Net Effect 3% 3% 1%
FIGURE 23: FORECASTED PQS BASELINE – REFRIGERATORS (COMPACT)
TABLE 62: NET EFFECTS USING FORECASTED PQS BASELINE – REFRIGERATORS (COMPACT)
Mean Trial-period PQS Mean Forecasted PQS Net Effect 23% 80% -57%
!0.01%
0.01%
0.03%
0.05%
0.07%
0.09%
Feb!12%
Apr!12%
Jun!12%
Aug!12%
Oct!12%
Dec!12%
Feb!13%
Apr!13%
Jun!13%
Aug!13%
Oct!13%
Dec!13%
Feb!14%
Apr!14%
Jun!14%
Aug!14%
Oct!14%
Dec!14%
PQS$
Int22% Int23% Int26% Int29% Actual% Forecast% Confidence%Interval%
!0.15&
0.05&
0.25&
0.45&
0.65&
0.85&
1.05&
Feb!12&
Apr!12&
Jun!12&
Aug!12&
Oct!12&
Dec!12&
Feb!13&
Apr!13&
Jun!13&
Aug!13&
Oct!13&
Dec!13&
Feb!14&
Apr!14&
Jun!14&
Aug!14&
Oct!14&
Dec!14&
PQS$
Int22& Int26& Int29& Int33& Actual& Forecast& Confidence&Interval&

145
PG&E’s Emerging Technologies Program ET13PGE8052
FIGURE 24: FORECASTED PQS BASELINE: REFRIGERATORS (MEDIUM)
TABLE 63: NET EFFECTS USING FORECASTED PQS BASELINE – REFRIGERATORS (MEDIUM)
Mean Trial-period PQS Mean Forecasted PQS Net Effect 5% 4% 1%
FIGURE 25: FORECASTED PQS BASELINE – REFRIGERATORS (VERY LARGE)
TABLE 64: NET EFFECTS USING FORECASTED PQS BASELINE – REFRIGERATORS (VERY LARGE)
Mean Trial-period PQS Mean Forecasted PQS Net Effect 44% 100% -56%
!0.01%
0.04%
0.09%
0.14%
0.19%
Feb!12%
Apr!12%
Jun!12%
Aug!12%
Oct!12%
Dec!12%
Feb!13%
Apr!13%
Jun!13%
Aug!13%
Oct!13%
Dec!13%
Feb!14%
Apr!14%
Jun!14%
Aug!14%
Oct!14%
Dec!14%
PQS$
Int22% Int23% Int26% Int29% Actual% Forecast% Confidence%Interval%
!0.15&
0.05&
0.25&
0.45&
0.65&
0.85&
1.05&
Feb!12&
Apr!12&
Jun!12&
Aug!12&
Oct!12&
Dec!12&
Feb!13&
Apr!13&
Jun!13&
Aug!13&
Oct!13&
Dec!13&
Feb!14&
Apr!14&
Jun!14&
Aug!14&
Oct!14&
Dec!14&
PQS$
Int22& Int23& Int26& Int29& Actual& Forecast& Confidence&Interval&

146
PG&E’s Emerging Technologies Program ET13PGE8052
FIGURE 26: FORECASTED PQS BASELINE – ROOM AIR CONDITIONERS (<12,000 BTU)
TABLE 65: NET EFFECTS USING FORECASTED PQS BASELINE – ROOM AIR CONDITIONERS (<12,000 BTU)
Mean Trial-period PQS Mean Forecasted PQS Net Effect 21% 26% -5%
!0.15&
0.05&
0.25&
0.45&
0.65&
0.85&
1.05&
Feb!12&
Apr!12&
Jun!12&
Aug!12&
Oct!12&
Dec!12&
Feb!13&
Apr!13&
Jun!13&
Aug!13&
Oct!13&
Dec!13&
Feb!14&
Apr!14&
Jun!14&
Aug!14&
Oct!14&
Dec!14&
PQS$
Int22& Int27& Int29& Actual& Forecast& Confidence&Interval&

147
PG&E’s Emerging Technologies Program ET13PGE8052
APPENDIX F: RESULTS OF PARTICIPANT-ONLY PQS
MODIFIED STEP REGRESSIONS

148
PG&E’s Emerging Technologies Program ET13PGE8052
FIGURE 27: PARTICIPANT-ONLY PQS REGRESSION (MODIFIED STEP) – AIR CLEANERS (<100 CADR)
TABLE 66: ANOVA TABLE FOR PARTICIPANT-ONLY PQS REGRESSION (MODIFIED STEP) – AIR CLEANERS (<100 CADR)
Sum of Square df Mean Square F Sig. Regression 0.737 4.000 0.184 10.771 0.000 Residual 0.513 30.000 0.017 Total 1.249 34.000 R-Square 0.590 Adjusted R-Square 0.535
TABLE 67: COEFFICIENTS TABLE FOR PARTICIPANT-ONLY PQS REGRESSION (MODIFIED STEP) – AIR CLEANERS (<100 CADR)
Coefficient Estimate Std. Error T Value Sig. (Constant) 0.310 0.050 6.165 0.000 MoNo 0.004 0.004 0.897 0.377 Int22 -0.024 0.086 -0.280 0.782 Int29 -0.062 0.091 -0.681 0.501 int33 0.431 0.097 4.441 0.000
TABLE 68: NET EFFECTS USING PARTICIPANT-ONLY PQS REGRESSION (MODIFIED STEP) – AIR CLEANERS (<100 CADR)
Mean With Program Mean Without Program Net Effect 46% 42% 4%
0.00#
0.10#
0.20#
0.30#
0.40#
0.50#
0.60#
0.70#
0.80#
0.90#
1.00#
Feb012#
Mar012#
Apr01
2#
May012#
Jun012#
Jul01
2#
Aug01
2#
Sep012#
Oct01
2#
Nov01
2#
Dec01
2#
Jan013#
Feb013#
Mar013#
Apr01
3#
May013#
Jun013#
Jul01
3#
Aug01
3#
Sep013#
Oct01
3#
Nov01
3#
Dec01
3#
Jan014#
Feb014#
Mar014#
Apr01
4#
May014#
Jun014#
Jul01
4#
Aug01
4#
Sep014#
Oct01
4#
Nov01
4#
Dec01
4#
PQS$
Int22# Int29# Int33# PQS# With#Program# Without#Program#

149
PG&E’s Emerging Technologies Program ET13PGE8052
FIGURE 28: PARTICIPANT-ONLY PQS REGRESSION (MODIFIED STEP) – DVD/BLU-RAY PLAYERS (DVD)
TABLE 69: ANOVA TABLE FOR PARTICIPANT-ONLY PQS REGRESSION (MODIFIED STEP) – DVD/BLU-RAY PLAYERS DVD)
Sum of Square df Mean Square F Sig. Regression 1.448 5.000 0.290 0.734 0.604 Residual 11.452 29.000 0.395 Total 12.900 34.000 R-Square 0.112 Adjusted R-Square -0.041
TABLE 70: COEFFICIENTS TABLE FOR PARTICIPANT-ONLY PQS REGRESSION (MODIFIED STEP) – DVD/BLU-RAY PLAYERS (DVD)
Coefficient Estimate Std. Error T Value Sig. (Constant) 0.249 0.048 5.158 0.000 MoNo -0.005 0.004 -1.177 0.249 Int22 0.006 0.083 0.072 0.943 Int26 -0.015 0.152 -0.100 0.921 Int29 0.131 0.089 1.465 0.154 Int34 0.030 0.113 0.268 0.790
TABLE 71: NET EFFECTS USING PARTICIPANT-ONLY PQS REGRESSION (MODIFIED STEP) – DVD/BLU-RAY PLAYERS (DVD)
Mean With Program
Mean Without Program
Net Effect
18% 11% 7%
0.00#
0.10#
0.20#
0.30#
0.40#
0.50#
0.60#
0.70#
0.80#
0.90#
1.00#
0.00#
0.05#
0.10#
0.15#
0.20#
0.25#
0.30#
0.35#
0.40#
0.45#
Feb012#
Mar012#
Apr012#
May012#
Jun012#
Jul012#
Aug012#
Sep012#
Oct012#
Nov012#
Dec012#
Jan013#
Feb013#
Mar013#
Apr013#
May013#
Jun013#
Jul013#
Aug013#
Sep013#
Oct013#
Nov013#
Dec013#
Jan014#
Feb014#
Mar014#
Apr014#
May014#
Jun014#
Jul014#
Aug014#
Sep014#
Oct014#
Nov014#
Dec014#
PQS$
Int22# Int26# Int29# Int34# PQS# With#Program# Without#Program#

150
PG&E’s Emerging Technologies Program ET13PGE8052
FIGURE 29: PARTICIPANT-ONLY PQS REGRESSION (MODIFIED STEP) – DVD/BLU-RAY PLAYERS (BLU-RAY)
TABLE 72: ANOVA TABLE FOR PARTICIPANT-ONLY PQS REGRESSION (MODIFIED STEP) – DVD/BLU-RAY PLAYERS (BLU-RAY)
Sum of Square df Mean Square F Sig. Regression 16.488 4.000 4.122 17.128 0.000 Residual 7.220 30.000 0.241 Total 23.708 34.000 R-Square 0.695 Adjusted R-Square 0.655
TABLE 73: COEFFICIENTS TABLE FOR PARTICIPANT-ONLY PQS REGRESSION (MODIFIED STEP) – DVD/BLU-RAY PLAYERS (BLU-RAY)
Coefficient Estimate Std. Error T Value Sig. (Constant) -0.115 0.094 -1.226 0.230 MoNo 0.035 0.008 4.620 0.000 Int22 -0.120 0.125 -0.962 0.344 Int26 -0.336 0.237 -1.420 0.166 Int29 -0.185 0.111 -1.662 0.107
TABLE 74: NET EFFECTS USING PARTICIPANT-ONLY PQS REGRESSION (MODIFIED STEP) – DVD/BLU-RAY PLAYERS (BLU-RAY)
Mean With Program
Mean Without Program
Net Effect
66% 89% -24%
!0.10%
0.10%
0.30%
0.50%
0.70%
0.90%
1.10%Feb!12%
Mar!12%
Apr!1
2%
May!12%
Jun!12
%
Jul!1
2%
Aug!12%
Sep!12%
Oct!1
2%
Nov!1
2%
Dec!1
2%
Jan!13
%
Feb!13%
Mar!13%
Apr!1
3%
May!13%
Jun!13
%
Jul!1
3%
Aug!13%
Sep!13%
Oct!1
3%
Nov!1
3%
Dec!1
3%
Jan!14
%
Feb!14%
Mar!14%
Apr!1
4%
May!14%
Jun!14
%
Jul!1
4%
Aug!14%
Sep!14%
Oct!1
4%
Nov!1
4%
Dec!1
4%
PQS$
Int22% Int26% Int29% PQS% With%Program% Without%Program%
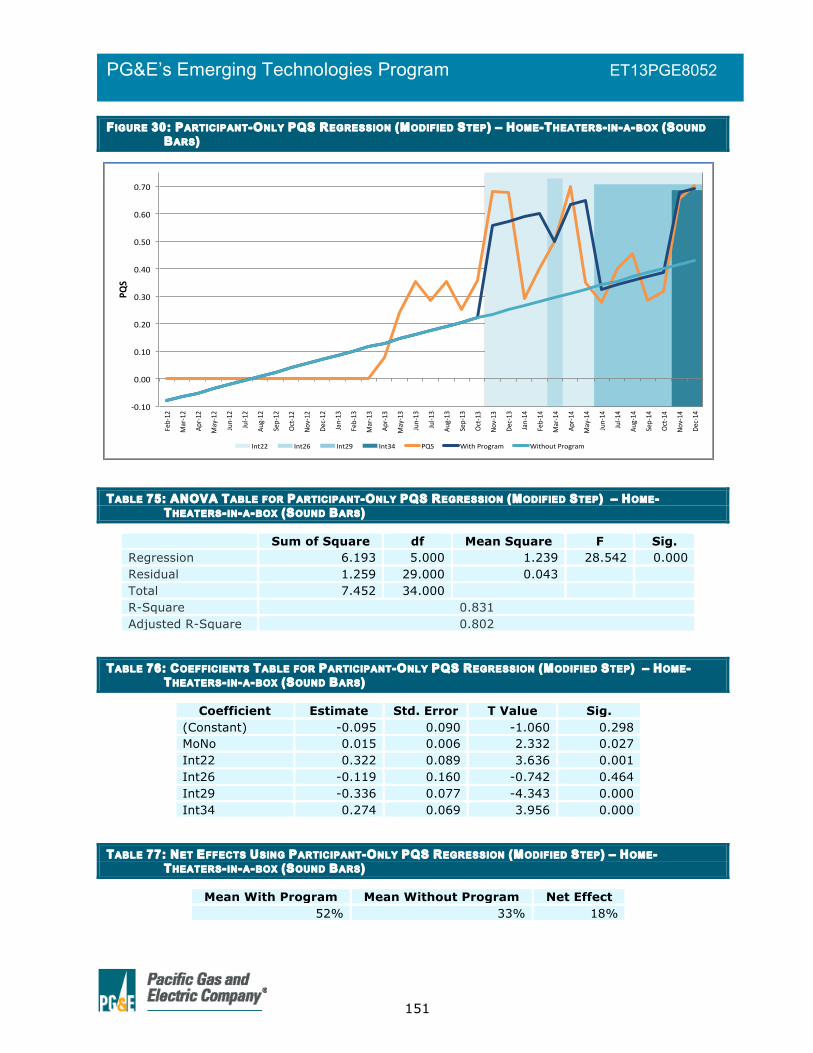
151
PG&E’s Emerging Technologies Program ET13PGE8052
FIGURE 30: PARTICIPANT-ONLY PQS REGRESSION (MODIFIED STEP) – HOME-THEATERS-IN-A-BOX (SOUND BARS)
TABLE 75: ANOVA TABLE FOR PARTICIPANT-ONLY PQS REGRESSION (MODIFIED STEP) – HOME-THEATERS-IN-A-BOX (SOUND BARS)
Sum of Square df Mean Square F Sig. Regression 6.193 5.000 1.239 28.542 0.000 Residual 1.259 29.000 0.043 Total 7.452 34.000 R-Square 0.831 Adjusted R-Square 0.802
TABLE 76: COEFFICIENTS TABLE FOR PARTICIPANT-ONLY PQS REGRESSION (MODIFIED STEP) – HOME-THEATERS-IN-A-BOX (SOUND BARS)
Coefficient Estimate Std. Error T Value Sig. (Constant) -0.095 0.090 -1.060 0.298 MoNo 0.015 0.006 2.332 0.027 Int22 0.322 0.089 3.636 0.001 Int26 -0.119 0.160 -0.742 0.464 Int29 -0.336 0.077 -4.343 0.000 Int34 0.274 0.069 3.956 0.000
TABLE 77: NET EFFECTS USING PARTICIPANT-ONLY PQS REGRESSION (MODIFIED STEP) – HOME-THEATERS-IN-A-BOX (SOUND BARS)
Mean With Program Mean Without Program Net Effect 52% 33% 18%
!0.10%
0.00%
0.10%
0.20%
0.30%
0.40%
0.50%
0.60%
0.70%
Feb!12%
Mar!12%
Apr!1
2%
May!12%
Jun!12%
Jul!1
2%
Aug!12%
Sep!12%
Oct!1
2%
Nov!12%
Dec!12
%
Jan!13%
Feb!13%
Mar!13%
Apr!1
3%
May!13%
Jun!13%
Jul!1
3%
Aug!13%
Sep!13%
Oct!1
3%
Nov!13%
Dec!13
%
Jan!14%
Feb!14%
Mar!14%
Apr!1
4%
May!14%
Jun!14%
Jul!1
4%
Aug!14%
Sep!14%
Oct!1
4%
Nov!14%
Dec!14
%
PQS$
Int22% Int26% Int29% Int34% PQS% With%Program% Without%Program%

152
PG&E’s Emerging Technologies Program ET13PGE8052
FIGURE 31: PARTICIPANT-ONLY PQS REGRESSION (MODIFIED STEP) – FREEZERS (CHEST)
TABLE 78: ANOVA TABLE FOR PARTICIPANT-ONLY PQS REGRESSION (MODIFIED STEP) – FREEZERS (CHEST)
Sum of Square df Mean Square F Sig. Regression 0.015 5.000 0.003 2.914 0.030 Residual 0.030 29.000 0.001 Total 0.045 34.000 R-Square 0.334 Adjusted R-Square 0.220
TABLE 79: COEFFICIENTS TABLE FOR PARTICIPANT-ONLY PQS REGRESSION (MODIFIED STEP) – FREEZERS (CHEST)
Coefficient Estimate Std. Error T Value Sig. (Constant) 0.043 0.007 6.017 0.000 MoNo -0.001 0.001 -2.620 0.014 Int22 0.015 0.011 1.329 0.194 Int23 0.010 0.008 1.312 0.200 Int26 -0.019 0.015 -1.249 0.222 Int29 0.016 0.008 1.889 0.069
TABLE 80: NET EFFECTS USING PARTICIPANT-ONLY PQS REGRESSION (MODIFIED STEP) – FREEZERS (CHEST)
Mean With Program Mean Without Program Net Effect 3% 1% 3%
!0.02%
0.00%
0.02%
0.04%
0.06%
0.08%
0.10%
Feb!12%
Mar!12%
Apr!1
2%
May!12%
Jun!12%
Jul!1
2%
Aug!1
2%
Sep!12%
Oct!1
2%
Nov!1
2%
Dec!1
2%
Jan!13%
Feb!13%
Mar!13%
Apr!1
3%
May!13%
Jun!13%
Jul!1
3%
Aug!1
3%
Sep!13%
Oct!1
3%
Nov!1
3%
Dec!1
3%
Jan!14%
Feb!14%
Mar!14%
Apr!1
4%
May!14%
Jun!14%
Jul!1
4%
Aug!1
4%
Sep!14%
Oct!1
4%
Nov!1
4%
Dec!1
4%
PQS$
Int22% Int23% Int26% Int29% PQS% With%Program% Without%Program%

153
PG&E’s Emerging Technologies Program ET13PGE8052
FIGURE 32: PARTICIPANT-ONLY PQS REGRESSION (MODIFIED STEP) – REFRIGERATORS (COMPACT)
TABLE 81: ANOVA TABLE FOR PARTICIPANT-ONLY PQS REGRESSION (MODIFIED STEP) – REFRIGERATORS (COMPACT)
Sum of Square df Mean Square F Sig. Regression 3.784 5.000 0.757 30.939 0.000 Residual 0.661 27.000 0.024 Total 4.445 32.000 R-Square 0.851 Adjusted R-Square 0.824
TABLE 82: COEFFICIENTS TABLE FOR PARTICIPANT-ONLY PQS REGRESSION (MODIFIED STEP) – REFRIGERATORS (COMPACT)
Coefficient Estimate Std. Error T Value Sig. (Constant) -0.152 0.045 -3.341 0.002 MoNo 0.023 0.003 7.118 0.000 Int22 -0.436 0.075 -5.840 0.000 Int26 0.017 0.116 0.147 0.884 Int29 -0.031 0.068 -0.451 0.656 Int33 0.296 0.046 6.454 0.000
TABLE 83: NET EFFECTS USING PARTICIPANT-ONLY PQS REGRESSION (MODIFIED STEP) – REFRIGERATORS (COMPACT)
Mean With Program Mean Without Program Net Effect 14% 51% -38%
!0.20%
0.00%
0.20%
0.40%
0.60%
0.80%
1.00%Feb!12%
Mar!12%
Apr!12%
May!12%
Jun!12%
Jul!1
2%
Aug!12%
Sep!12%
Oct!12%
Nov!12%
Dec!12
%
Jan!13%
Feb!13%
Mar!13%
Apr!13%
May!13%
Jun!13%
Jul!1
3%
Aug!13%
Sep!13%
Oct!13%
Nov!13%
Dec!13
%
Jan!14%
Feb!14%
Mar!14%
Apr!14%
May!14%
Jun!14%
Jul!1
4%
Aug!14%
Sep!14%
Oct!14%
Nov!14%
Dec!14
%
PQS$
Int22% Int26% Int29% Int33% PQS% With%Program% Without%Program%

154
PG&E’s Emerging Technologies Program ET13PGE8052
FIGURE 33: PARTICIPANT-ONLY PQS REGRESSION (MODIFIED STEP) – REFRIGERATORS (MEDIUM)
TABLE 84: ANOVA TABLE FOR PARTICIPANT-ONLY PQS REGRESSION (MODIFIED STEP) – REFRIGERATORS (MEDIUM)
Sum of Square df Mean Square F Sig. Regression 0.065 5.000 0.013 5.199 0.002 Residual 0.073 29.000 0.003 Total 0.138 34.000 R-Square 0.473 Adjusted R-Square 0.382
TABLE 85: COEFFICIENTS TABLE FOR PARTICIPANT-ONLY PQS REGRESSION (MODIFIED STEP) – REFRIGERATORS (MEDIUM)
Coefficient Estimate Std. Error T Value Sig. (Constant) 0.081 0.016 5.031 0.000 MoNo -0.003 0.001 -2.604 0.014 Int22 0.126 0.037 3.377 0.002 Int23 -0.057 0.039 -1.464 0.154 Int26 0.029 0.030 0.969 0.341 Int29 -0.029 0.020 -1.425 0.165
TABLE 86: NET EFFECTS USING PARTICIPANT-ONLY PQS REGRESSION (MODIFIED STEP) – REFRIGERATORS (MEDIUM)
Mean With Program Mean Without Program Net Effect 6% 0% 6%
!0.05%
0.00%
0.05%
0.10%
0.15%
0.20%
Feb!12%
Mar!12%
Apr!12%
May!12%
Jun!12%
Jul!12%
Aug!12%
Sep!12%
Oct!12%
Nov!12%
Dec!12%
Jan!13%
Feb!13%
Mar!13%
Apr!13%
May!13%
Jun!13%
Jul!13%
Aug!13%
Sep!13%
Oct!13%
Nov!13%
Dec!13%
Jan!14%
Feb!14%
Mar!14%
Apr!14%
May!14%
Jun!14%
Jul!14%
Aug!14%
Sep!14%
Oct!14%
Nov!14%
Dec!14%
PQS$
Int22% Int23% Int26% Int29% PQS% With%Program% Without%Program%

155
PG&E’s Emerging Technologies Program ET13PGE8052
FIGURE 34: PARTICIPANT-ONLY PQS REGRESSION (MODIFIED STEP) – REFRIGERATORS (VERY LARGE)
TABLE 87: ANOVA TABLE FOR PARTICIPANT-ONLY PQS REGRESSION (MODIFIED STEP) – REFRIGERATORS (VERY LARGE)
Sum of Square df Mean Square F Sig. Regression 1.042 5.000 0.208 4.989 0.002 Residual 1.212 29.000 0.042 Total 2.254 34.000 R-Square 0.462 Adjusted R-Square 0.370
TABLE 88: COEFFICIENTS TABLE FOR PARTICIPANT-ONLY PQS REGRESSION (MODIFIED STEP) – REFRIGERATORS (VERY LARGE)
Coefficient Estimate Std. Error T Value Sig. (Constant) 0.158 0.144 1.092 0.284 MoNo 0.015 0.011 1.458 0.156 Int22 0.503 0.658 0.764 0.451 Int23 -0.418 0.655 -0.638 0.529 Int26 0.174 0.183 0.949 0.351 Int29 -0.512 0.127 -4.048 0.000
TABLE 89: NET EFFECTS USING PARTICIPANT-ONLY PQS REGRESSION (MODIFIED STEP) – REFRIGERATORS (VERY LARGE)
Mean With Program Mean Without Program Net Effect 47% 60% -13%
0.00#
0.10#
0.20#
0.30#
0.40#
0.50#
0.60#
0.70#
0.80#
0.90#
1.00#
Feb01
2#
Mar01
2#
Apr01
2#
May01
2#
Jun012
#
Jul012
#
Aug01
2#
Sep01
2#
Oct01
2#
Nov01
2#
Dec01
2#
Jan013
#
Feb01
3#
Mar01
3#
Apr01
3#
May01
3#
Jun013
#
Jul013
#
Aug01
3#
Sep01
3#
Oct01
3#
Nov01
3#
Dec01
3#
Jan014
#
Feb01
4#
Mar01
4#
Apr01
4#
May01
4#
Jun014
#
Jul014
#
Aug01
4#
Sep01
4#
Oct01
4#
Nov01
4#
Dec01
4#
PQS$
Int22# Int23# Int26# Int29# PQS# With#Program# Without#Program##

156
PG&E’s Emerging Technologies Program ET13PGE8052
FIGURE 35: PARTICIPANT-ONLY PQS REGRESSION (MODIFIED STEP) – ROOM AIR CONDITIONERS (<12,000 BTU)
TABLE 90: ANOVA TABLE FOR PARTICIPANT-ONLY PQS REGRESSION (MODIFIED STEP) – ROOM AIR CONDITIONERS (<12,000 BTU)
Sum of Square df Mean Square F Sig. Regression 0.207 4.000 0.052 2.491 0.067 Residual 0.561 27.000 0.021 Total 0.767 31.000 R-Square 0.270 Adjusted R-Square 0.161
TABLE 91: COEFFICIENTS TABLE FOR PARTICIPANT-ONLY PQS REGRESSION (MODIFIED STEP) – ROOM AIR CONDITIONERS (<12,000 BTU)
Coefficient Estimate Std. Error T Value Sig. (Constant) 0.180 0.031 5.782 0.000 MoNo 0.003 0.002 1.548 0.133 Int22 0.138 0.116 1.193 0.243 Int27 -0.144 0.107 -1.341 0.191 Int29 -0.104 0.044 -2.375 0.025
TABLE 92: NET EFFECTS USING PARTICIPANT-ONLY PQS REGRESSION (MODIFIED STEP) – ROOM AIR CONDITIONERS (<12,000 BTU)
Mean With Program Mean Without Program Net Effect 29% 28% 1%
!0.01%
0.19%
0.39%
0.59%
0.79%
0.99%
Feb!12%
Mar!12%
Apr!1
2%
May!12%
Jun!12%
Jul!1
2%
Aug!12%
Sep!12%
Oct!1
2%
Nov!1
2%
Dec!1
2%
Jan!13%
Feb!13%
Mar!13%
Apr!1
3%
May!13%
Jun!13%
Jul!1
3%
Aug!13%
Sep!13%
Oct!1
3%
Nov!1
3%
Dec!1
3%
Jan!14%
Feb!14%
Mar!14%
Apr!1
4%
May!14%
Jun!14%
Jul!1
4%
Aug!14%
Sep!14%
Oct!1
4%
Nov!1
4%
Dec!1
4%
PQS$
Int22% Int27% Int29% PQS% With%Program% Without%Program%

157
PG&E’s Emerging Technologies Program ET13PGE8052
APPENDIX G: RESULTS OF PARTICIPANT-ONLY
PQS SEGMENTED REGRESSIONS

158
PG&E’s Emerging Technologies Program ET13PGE8052
FIGURE 36: PARTICIPANT-ONLY PQS REGRESSION (SEGMENTED) – AIR CLEANERS (<100 CADR)
TABLE 93: ANOVA TABLE FOR PARTICIPANT-ONLY PQS REGRESSION (SEGMENTED) – AIR CLEANERS (<100 CADR)
Sum of Square df Mean Square F Sig. Regression 0.909 7.000 0.130 10.315 0.000 Residual 0.340 27.000 0.013 Total 1.249 34.000 R-Square 0.728 Adjusted R-Square 0.657
TABLE 94: COEFFICIENTS TABLE FOR PARTICIPANT-ONLY PQS REGRESSION (SEGMENTED) – AIR CLEANERS (<100 CADR)
Coefficient Estimate Std. Error T Value Sig. (Constant) 0.325 0.044 7.426 0.000 MoNo 0.002 0.004 0.633 0.532 Int22 -0.156 0.111 -1.405 0.171 Time22 0.037 0.022 1.673 0.106 Int29 -0.039 0.177 -0.223 0.825 Time29 -0.083 0.061 -1.361 0.185 Int33 -0.001 0.194 -0.006 0.995 Time33 0.278 0.092 3.025 0.005
TABLE 95: NET EFFECTS USING PARTICIPANT-ONLY PQS REGRESSION (SEGMENTED) – AIR CLEANERS (<100 CADR)
Mean With Program Mean Without Program Net Effect 45% 39% 5%
0.00#
0.10#
0.20#
0.30#
0.40#
0.50#
0.60#
0.70#
0.80#
0.90#
1.00#
0.10#
0.20#
0.30#
0.40#
0.50#
0.60#
0.70#
0.80#
0.90#
1.00#
Feb01
2#Ma
r012#
Apr01
2#Ma
y012#
Jun012
#Jul
012#
Aug01
2#Sep01
2#Oc
t012#
Nov01
2#De
c012#
Jan013
#Feb01
3#Ma
r013#
Apr01
3#Ma
y013#
Jun013
#Jul
013#
Aug01
3#Sep01
3#Oc
t013#
Nov01
3#De
c013#
Jan014
#Feb01
4#Ma
r014#
Apr01
4#Ma
y014#
Jun014
#Jul
014#
Aug01
4#Sep01
4#Oc
t014#
Nov01
4#De
c014#
PQS$
Int22# Int29# Int33# PQS# With#Program# Without#Program#
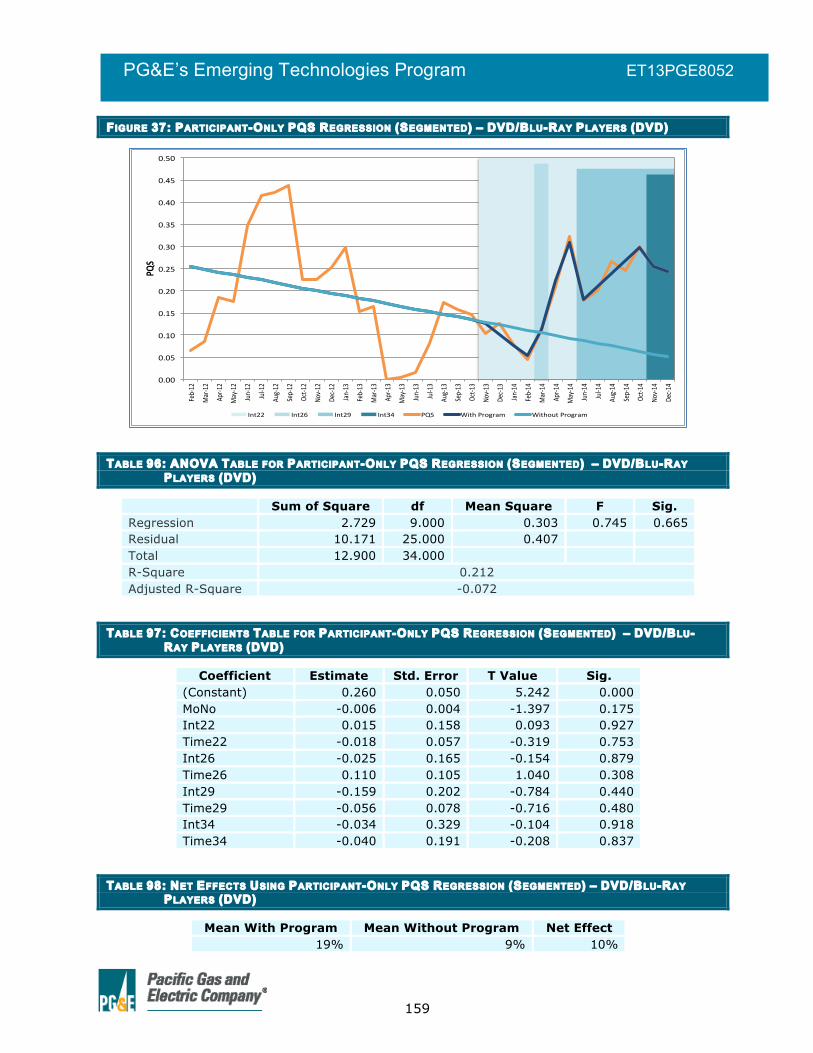
159
PG&E’s Emerging Technologies Program ET13PGE8052
FIGURE 37: PARTICIPANT-ONLY PQS REGRESSION (SEGMENTED) – DVD/BLU-RAY PLAYERS (DVD)
TABLE 96: ANOVA TABLE FOR PARTICIPANT-ONLY PQS REGRESSION (SEGMENTED) – DVD/BLU-RAY PLAYERS (DVD)
Sum of Square df Mean Square F Sig. Regression 2.729 9.000 0.303 0.745 0.665 Residual 10.171 25.000 0.407 Total 12.900 34.000 R-Square 0.212 Adjusted R-Square -0.072
TABLE 97: COEFFICIENTS TABLE FOR PARTICIPANT-ONLY PQS REGRESSION (SEGMENTED) – DVD/BLU-RAY PLAYERS (DVD)
Coefficient Estimate Std. Error T Value Sig. (Constant) 0.260 0.050 5.242 0.000 MoNo -0.006 0.004 -1.397 0.175 Int22 0.015 0.158 0.093 0.927 Time22 -0.018 0.057 -0.319 0.753 Int26 -0.025 0.165 -0.154 0.879 Time26 0.110 0.105 1.040 0.308 Int29 -0.159 0.202 -0.784 0.440 Time29 -0.056 0.078 -0.716 0.480 Int34 -0.034 0.329 -0.104 0.918 Time34 -0.040 0.191 -0.208 0.837
TABLE 98: NET EFFECTS USING PARTICIPANT-ONLY PQS REGRESSION (SEGMENTED) – DVD/BLU-RAY PLAYERS (DVD)
Mean With Program Mean Without Program Net Effect 19% 9% 10%
0.00#
0.05#
0.10#
0.15#
0.20#
0.25#
0.30#
0.35#
0.40#
0.45#
0.50#
Feb,12#
Mar,12#
Apr,1
2#
May,12#
Jun,12#
Jul,1
2#
Aug,1
2#
Sep,12#
Oct,1
2#
Nov,1
2#
Dec,1
2#
Jan,13#
Feb,13#
Mar,13#
Apr,1
3#
May,13#
Jun,13#
Jul,1
3#
Aug,1
3#
Sep,13#
Oct,1
3#
Nov,1
3#
Dec,1
3#
Jan,14#
Feb,14#
Mar,14#
Apr,1
4#
May,14#
Jun,14#
Jul,1
4#
Aug,1
4#
Sep,14#
Oct,1
4#
Nov,1
4#
Dec,1
4#
PQS$
Int22# Int26# Int29# Int34# PQS# With#Program# Without#Program#

160
PG&E’s Emerging Technologies Program ET13PGE8052
FIGURE 38: PARTICIPANT-ONLY PQS REGRESSION (SEGMENTED) – DVD/BLU-RAY PLAYERS (BLU-RAY)
TABLE 99: ANOVA TABLE FOR PARTICIPANT-ONLY PQS REGRESSION (SEGMENTED) – DVD/BLU-RAY PLAYERS (BLU-RAY)
Sum of Square df Mean Square F Sig. Regression 19.409 7.000 2.773 17.415 0.000 Residual 4.299 27.000 0.159 Total 23.708 34.000 R-Square 0.819 Adjusted R-Square 0.772
TABLE 100: COEFFICIENTS TABLE FOR PARTICIPANT-ONLY PQS REGRESSION (SEGMENTED) – DVD/BLU-RAY PLAYERS (BLU-RAY)
Coefficient Estimate Std. Error T Value Sig. (Constant) -0.189 0.081 -2.334 0.027 MoNo 0.042 0.007 6.308 0.000 Int22 0.088 0.156 0.567 0.576 Time22 -0.148 0.060 -2.492 0.019 Int26 -0.319 0.199 -1.603 0.121 Time26 0.209 0.083 2.525 0.018 Int29 0.076 0.180 0.424 0.675 Time29 -0.146 0.046 -3.167 0.004
TABLE 101: NET EFFECTS USING PARTICIPANT-ONLY PQS REGRESSION (SEGMENTED) – DVD/BLU-RAY PLAYERS (BLU-RAY)
Mean With Program Mean Without Program Net Effect 68% 101% -33%
!0.20%
0.00%
0.20%
0.40%
0.60%
0.80%
1.00%
1.20%Feb!12%
Mar!12%
Apr!1
2%
May!12%
Jun!12%
Jul!1
2%
Aug!12%
Sep!12%
Oct!1
2%
Nov!12%
Dec!12
%
Jan!13%
Feb!13%
Mar!13%
Apr!1
3%
May!13%
Jun!13%
Jul!1
3%
Aug!13%
Sep!13%
Oct!1
3%
Nov!13%
Dec!13
%
Jan!14%
Feb!14%
Mar!14%
Apr!1
4%
May!14%
Jun!14%
Jul!1
4%
Aug!14%
Sep!14%
Oct!1
4%
Nov!14%
Dec!14
%
PQS$
Int22% Int26% Int29% PQS% With%Program% Without%Program%

161
PG&E’s Emerging Technologies Program ET13PGE8052
FIGURE 39: PARTICIPANT-ONLY PQS REGRESSION (SEGMENTED) – HOME-THEATERS-IN-A-BOX (SOUND BARS)
TABLE 102: ANOVA TABLE FOR PARTICIPANT-ONLY PQS REGRESSION (SEGMENTED) – HOME-THEATERS-IN-A-BOX (SOUND BARS)
Sum of Square df Mean Square F Sig. Regression 6.737 9.000 0.749 26.198 0.000 Residual 0.714 25.000 0.029 Total 7.452 34.000 R-Square 0.904 Adjusted R-Square 0.870
TABLE 103: COEFFICIENTS TABLE FOR PARTICIPANT-ONLY PQS REGRESSION (SEGMENTED) – HOME-THEATERS-IN-A-BOX (SOUND BARS)
Coefficient Estimate Std. Error T Value Sig. (Constant) -0.200 0.078 -2.560 0.017 MoNo 0.023 0.006 4.091 0.000 Int22 0.512 0.098 5.249 0.000 Time22 -0.117 0.038 -3.053 0.005 Int26 0.068 0.140 0.490 0.628 Time26 0.100 0.074 1.361 0.186 Int29 -0.069 0.128 -0.536 0.596 Time29 -0.013 0.052 -0.256 0.800 Int34 0.266 0.142 1.873 0.073 Time34 0.053 0.082 0.651 0.521
TABLE 104: NET EFFECTS USING PARTICIPANT-ONLY PQS REGRESSION (SEGMENTED) – HOME-THEATERS-IN-A-BOX (SOUND BARS)
Mean With Program Mean Without Program Net Effect 49% 46% 3%
!0.20%
!0.10%
0.00%
0.10%
0.20%
0.30%
0.40%
0.50%
0.60%
0.70%
0.80%
Feb!1
2%Ma
r!12%
Apr!1
2%Ma
y!12%
Jun!12
%Jul
!12%
Aug!1
2%Sep!1
2%Oc
t!12%
Nov!1
2%De
c!12%
Jan!13
%Feb!1
3%Ma
r!13%
Apr!1
3%Ma
y!13%
Jun!13
%Jul
!13%
Aug!1
3%Sep!1
3%Oc
t!13%
Nov!1
3%De
c!13%
Jan!14
%Feb!1
4%Ma
r!14%
Apr!1
4%Ma
y!14%
Jun!14
%Jul
!14%
Aug!1
4%Sep!1
4%Oc
t!14%
Nov!1
4%De
c!14%
PQS$
Int22% Int26% Int29% Int34% With%Program% Without%Program% PQS%
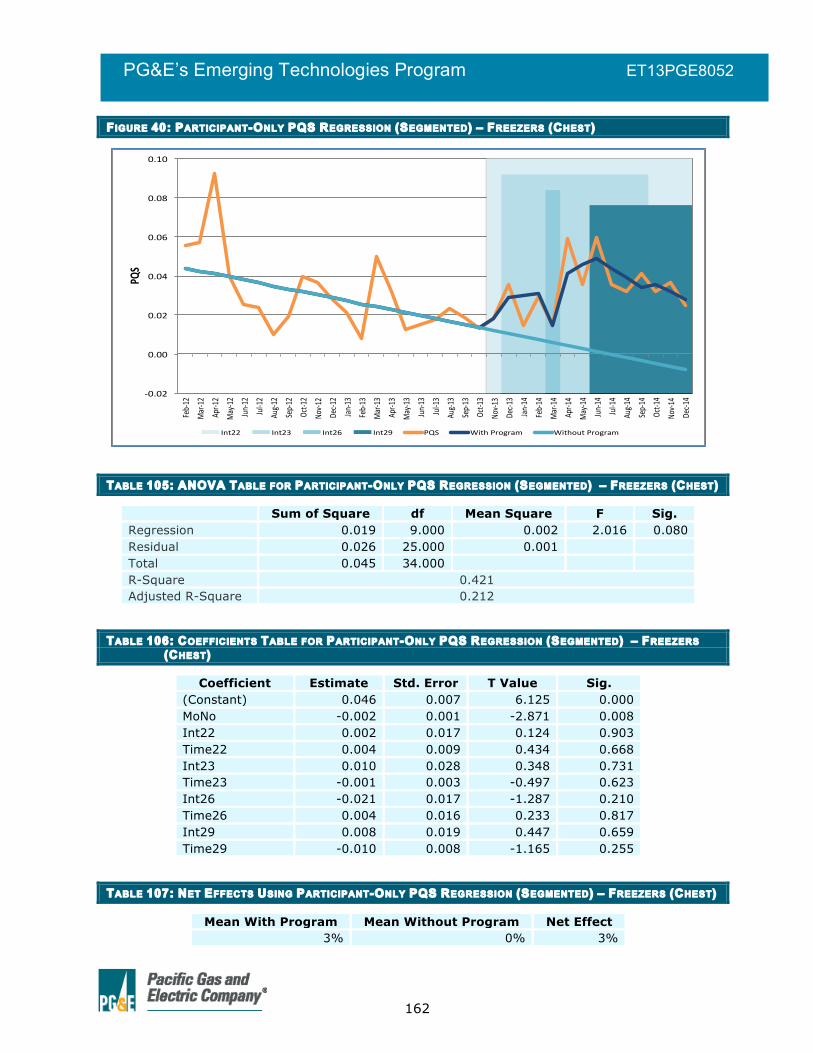
162
PG&E’s Emerging Technologies Program ET13PGE8052
FIGURE 40: PARTICIPANT-ONLY PQS REGRESSION (SEGMENTED) – FREEZERS (CHEST)
TABLE 105: ANOVA TABLE FOR PARTICIPANT-ONLY PQS REGRESSION (SEGMENTED) – FREEZERS (CHEST)
Sum of Square df Mean Square F Sig. Regression 0.019 9.000 0.002 2.016 0.080 Residual 0.026 25.000 0.001 Total 0.045 34.000 R-Square 0.421 Adjusted R-Square 0.212
TABLE 106: COEFFICIENTS TABLE FOR PARTICIPANT-ONLY PQS REGRESSION (SEGMENTED) – FREEZERS (CHEST)
Coefficient Estimate Std. Error T Value Sig. (Constant) 0.046 0.007 6.125 0.000 MoNo -0.002 0.001 -2.871 0.008 Int22 0.002 0.017 0.124 0.903 Time22 0.004 0.009 0.434 0.668 Int23 0.010 0.028 0.348 0.731 Time23 -0.001 0.003 -0.497 0.623 Int26 -0.021 0.017 -1.287 0.210 Time26 0.004 0.016 0.233 0.817 Int29 0.008 0.019 0.447 0.659 Time29 -0.010 0.008 -1.165 0.255
TABLE 107: NET EFFECTS USING PARTICIPANT-ONLY PQS REGRESSION (SEGMENTED) – FREEZERS (CHEST)
Mean With Program Mean Without Program Net Effect 3% 0% 3%
!0.02%
0.00%
0.02%
0.04%
0.06%
0.08%
0.10%
Feb!12%
Mar!12
%
Apr!1
2%
May!12
%
Jun!12%
Jul!1
2%
Aug!1
2%
Sep!12%
Oct!1
2%
Nov!1
2%
Dec!1
2%
Jan!13
%
Feb!13%
Mar!13
%
Apr!1
3%
May!13
%
Jun!13%
Jul!1
3%
Aug!1
3%
Sep!13%
Oct!1
3%
Nov!1
3%
Dec!1
3%
Jan!14
%
Feb!14%
Mar!14
%
Apr!1
4%
May!14
%
Jun!14%
Jul!1
4%
Aug!1
4%
Sep!14%
Oct!1
4%
Nov!1
4%
Dec!1
4%
PQS$
Int22% Int23% Int26% Int29% PQS% With%Program% Without%Program%

163
PG&E’s Emerging Technologies Program ET13PGE8052
FIGURE 41: PARTICIPANT-ONLY PQS REGRESSION (SEGMENTED) – REFRIGERATORS (COMPACT)
TABLE 108: ANOVA TABLE FOR PARTICIPANT-ONLY PQS REGRESSION (SEGMENTED) – REFRIGERATORS (COMPACT)
Sum of Square df Mean Square F Sig. Regression 4.040 9.000 0.449 25.524 0.000 Residual 0.405 23.000 0.018 Total 4.445 32.000 R-Square 0.909 Adjusted R-Square 0.873
TABLE 109: COEFFICIENTS TABLE FOR PARTICIPANT-ONLY PQS REGRESSION (SEGMENTED) – REFRIGERATORS (COMPACT)
Coefficient Estimate Std. Error T Value Sig. (Constant) -0.140 0.039 -3.604 0.001 MoNo 0.022 0.003 7.967 0.000 Int22 -0.307 0.520 -0.590 0.561 Time22 -0.025 0.147 -0.167 0.869 Int26 0.015 0.110 0.133 0.895 Time26 0.008 0.178 0.047 0.963 Int29 -0.080 0.117 -0.685 0.500 Time29 0.045 0.054 0.830 0.415 Int33 0.001 0.088 0.009 0.993 Time33 0.093 0.044 2.100 0.047
TABLE 110: NET EFFECTS USING PARTICIPANT-ONLY PQS REGRESSION (SEGMENTED) – REFRIGERATORS (COMPACT)
Mean With Program Mean Without Program Net Effect 13% 50% -37%
!0.15&
!0.05&
0.05&
0.15&
0.25&
0.35&
0.45&
0.55&
0.65&
0.75&
0.85&
Feb!12&
Mar!12&
Apr!1
2&May!12&
Jun!12&
Jul!1
2&Au
g!12&
Sep!12&
Oct!1
2&No
v!12&
Dec!1
2&Jan
!13&
Feb!13&
Mar!13&
Apr!1
3&May!13&
Jun!13&
Jul!1
3&Au
g!13&
Sep!13&
Oct!1
3&No
v!13&
Dec!1
3&Jan
!14&
Feb!14&
Mar!14&
Apr!1
4&May!14&
Jun!14&
Jul!1
4&Au
g!14&
Sep!14&
Oct!1
4&No
v!14&
Dec!1
4&
PQS$
Int22& Int26& Int29& Int33& PQS& With&Program& Without&Program&

164
PG&E’s Emerging Technologies Program ET13PGE8052
FIGURE 42: PARTICIPANT-ONLY PQS REGRESSION (SEGMENTED) – REFRIGERATORS (MEDIUM)
TABLE 111: ANOVA TABLE FOR PARTICIPANT-ONLY PQS REGRESSION (SEGMENTED) – REFRIGERATORS (MEDIUM)
Sum of Square df Mean Square F Sig. Regression 0.074 8.000 0.009 3.734 0.005 Residual 0.064 26.000 0.002 Total 0.138 34.000 R-Square 0.535 Adjusted R-Square 0.391
TABLE 112: COEFFICIENTS TABLE FOR PARTICIPANT-ONLY PQS REGRESSION (SEGMENTED) – REFRIGERATORS (MEDIUM)
Coefficient Estimate Std. Error T Value Sig. (Constant) 0.084 0.016 5.149 0.000 MoNo -0.003 0.001 -2.769 0.010 Int22 0.129 0.037 3.458 0.002 Int23 -0.104 0.061 -1.692 0.103 Time23 0.028 0.024 1.173 0.251 Int26 0.013 0.034 0.396 0.695 Time26 -0.049 0.036 -1.351 0.188 Int29 -0.028 0.040 -0.689 0.497 Time29 0.028 0.017 1.615 0.118
TABLE 113: NET EFFECTS USING PARTICIPANT-ONLY PQS REGRESSION (SEGMENTED) – REFRIGERATORS (MEDIUM)
Mean With Program Mean Without Program Net Effect 6% -1% 7%
0.00#
0.05#
0.10#
0.15#
0.20#
0.25#
'0.10#
'0.05#
0.00#
0.05#
0.10#
0.15#
0.20#
0.25#
Feb'12
#Ma
r'12#
Apr'1
2#Ma
y'12#
Jun'12
#Jul
'12#
Aug'1
2#Sep
'12#
Oct'1
2#No
v'12#
Dec'1
2#Jan
'13#
Feb'13
#Ma
r'13#
Apr'1
3#Ma
y'13#
Jun'13
#Jul
'13#
Aug'1
3#Sep
'13#
Oct'1
3#No
v'13#
Dec'1
3#Jan
'14#
Feb'14
#Ma
r'14#
Apr'1
4#Ma
y'14#
Jun'14
#Jul
'14#
Aug'1
4#Sep
'14#
Oct'1
4#No
v'14#
Dec'1
4#
PQS$
Int22# Int23# Int26# Int29# PQS# With#Program# Without#Program#

165
PG&E’s Emerging Technologies Program ET13PGE8052
FIGURE 43: PARTICIPANT-ONLY PQS REGRESSION (SEGMENTED) – REFRIGERATORS (VERY LARGE)
TABLE 114: ANOVA TABLE FOR PARTICIPANT-ONLY PQS REGRESSION (SEGMENTED) – REFRIGERATORS (VERY LARGE)
Sum of Square df Mean Square F Sig. Regression 1.628 8.000 0.203 8.448 0.000 Residual 0.626 26.000 0.024 Total 2.254 34.000 R-Square 0.722 Adjusted R-Square 0.637
TABLE 115: COEFFICIENTS TABLE FOR PARTICIPANT-ONLY PQS REGRESSION (SEGMENTED) – REFRIGERATORS (VERY LARGE)
Coefficient Estimate Std. Error T Value Sig. (Constant) 0.006 0.115 0.055 0.957 MoNo 0.028 0.008 3.289 0.003 Int22 0.380 0.500 0.761 0.454 Int23 -0.023 0.620 -0.037 0.971 Time23 -0.010 0.153 -0.068 0.947 Int26 -0.005 0.160 -0.029 0.977 Time26 -0.224 0.202 -1.114 0.276 Int29 0.040 0.153 0.263 0.795 Time29 0.136 0.078 1.755 0.091
TABLE 116: NET EFFECTS USING PARTICIPANT-ONLY PQS REGRESSION (SEGMENTED) – REFRIGERATORS (VERY LARGE)
Mean With Program Mean Without Program Net Effect 50% 80% -30%
0.00#
0.20#
0.40#
0.60#
0.80#
1.00#Feb,12#
Mar,12
#
Apr,1
2#
May,12
#
Jun,12
#
Jul,1
2#
Aug,1
2#
Sep,12#
Oct,1
2#
Nov,1
2#
Dec,1
2#
Jan,13
#
Feb,13#
Mar,13
#
Apr,1
3#
May,13
#
Jun,13
#
Jul,1
3#
Aug,1
3#
Sep,13#
Oct,1
3#
Nov,1
3#
Dec,1
3#
Jan,14
#
Feb,14#
Mar,14
#
Apr,1
4#
May,14
#
Jun,14
#
Jul,1
4#
Aug,1
4#
Sep,14#
Oct,1
4#
Nov,1
4#
Dec,1
4#
PQS$
Int22# Int23# Int26# Int29# PQS# With#Program# Without#Program#

166
PG&E’s Emerging Technologies Program ET13PGE8052
FIGURE 44: PARTICIPANT-ONLY PQS REGRESSION (SEGMENTED) – ROOM AIR CONDITIONERS (<12,000 BTU)
TABLE 117: ANOVA TABLE FOR PARTICIPANT-ONLY PQS REGRESSION (SEGMENTED) – ROOM AIR CONDITIONERS (<12,000 BTU)
Sum of Square df Mean Square F Sig. Regression 0.219 7.000 0.031 1.365 0.265 Residual 0.549 24.000 0.023 Total 0.767 31.000 R-Square 0.285 Adjusted R-Square 0.076
TABLE 118: COEFFICIENTS TABLE FOR PARTICIPANT-ONLY PQS REGRESSION (SEGMENTED) – ROOM AIR CONDITIONERS (<12,000 BTU)
Coefficient Estimate Std. Error T Value Sig. (Constant) 0.179 0.033 5.440 0.000 MoNo 0.004 0.002 1.517 0.142 Int22 0.125 0.712 0.175 0.863 Time22 0.006 0.152 0.040 0.968 Int27 -0.207 0.148 -1.394 0.176 Time27 0.018 0.187 0.098 0.923 Int29 -0.071 0.072 -0.987 0.334 Time29 -0.045 0.093 -0.480 0.635
TABLE 119: NET EFFECTS USING PARTICIPANT-ONLY PQS REGRESSION (SEGMENTED) – ROOM AIR CONDITIONERS (<12,000 BTU)
Mean With Program Mean Without Program Net Effect 28% 28% -1%
0.00#
0.10#
0.20#
0.30#
0.40#
0.50#
0.60#
0.70#
0.80#
0.90#
1.00#
Feb012
#
Mar01
2#
Apr01
2#
May01
2#
Jun012
#
Jul012
#
Aug01
2#
Sep012
#
Oct01
2#
Nov01
2#
Dec01
2#
Jan013
#
Feb013
#
Mar01
3#
Apr01
3#
May01
3#
Jun013
#
Jul013
#
Aug01
3#
Sep013
#
Oct01
3#
Nov01
3#
Dec01
3#
Jan014
#
Feb014
#
Mar01
4#
Apr01
4#
May01
4#
Jun014
#
Jul014
#
Aug01
4#
Sep014
#
Oct01
4#
Nov01
4#
Dec01
4#
PQS$
Int22# Int27# Int29# With#Program# Without#Program# PQS#
167
PG&E’s Emerging Technologies Program ET13PGE8052
APPENDIX H: RESULTS OF COMPARISON-BASED
PQS MODIFIED STEP REGRESSIONS

168
PG&E’s Emerging Technologies Program ET13PGE8052
FIGURE 45: COMPARISON-BASED PQS REGRESSION (MODIFIED STEP) – AIR CLEANERS (<100 CADR)
TABLE 120: ANOVA TABLE FOR COMPARISON-BASED PQS REGRESSION (MODIFIED STEP) – AIR CLEANERS (<100 CADR)
Sum of Square df Mean Square F Sig. Regression 0.935 8.000 0.117 12.478 0.000 Residual 0.571 61.000 0.009 Total 1.506 69.000 R-Square 0.788 Adjusted R-Square 0.571
TABLE 121: COEFFICIENTS TABLE FOR COMPARISON-BASED PQS REGRESSION (MODIFIED STEP) – AIR CLEANERS (<100 CADR)
Coefficient Estimate Std. Error T Value Sig. (Constant) 0.250 0.031 8.132 0.000 MoNo 0.004 0.002 1.799 0.077 isPart 0.057 0.027 2.087 0.041 Int22 0.008 0.055 0.141 0.889 PartInt22 -0.035 0.061 -0.583 0.562 Int29 -0.021 0.068 -0.310 0.758 PartInt29 -0.042 0.094 -0.448 0.655 Int33 -0.074 0.089 -0.829 0.410 PartInt33 0.504 0.114 4.437 0.000
TABLE 122: NET EFFECTS USING COMPARISON-BASED PQS REGRESSION (MODIFIED STEP) – AIR CLEANERS (<100 CADR)
Mean Participating Store PQS Mean Nonparticipating Store PQS Net Effect 46% 35% 11%
0.00#
0.10#
0.20#
0.30#
0.40#
0.50#
0.60#
0.70#
0.80#
0.90#
1.00#
Feb01
2#
Mar01
2#
Apr01
2#
May01
2#
Jun012
#
Jul012
#
Aug01
2#
Sep01
2#
Oct01
2#
Nov01
2#
Dec01
2#
Jan013
#
Feb01
3#
Mar01
3#
Apr01
3#
May01
3#
Jun013
#
Jul013
#
Aug01
3#
Sep01
3#
Oct01
3#
Nov01
3#
Dec01
3#
Jan014
#
Feb01
4#
Mar01
4#
Apr01
4#
May01
4#
Jun014
#
Jul014
#
Aug01
4#
Sep01
4#
Oct01
4#
Nov01
4#
Dec01
4#
PQS$
Int22# Int29# Int33# NonparEcipaEng#0#FiGed#
NonparEcipaEng#0#Actual# ParEcipaEng#0#FiGed# ParEcipaEng#0#Actual#

169
PG&E’s Emerging Technologies Program ET13PGE8052
FIGURE 46: COMPARISON-BASED PQS REGRESSION (MODIFIED STEP) – DVD/BLU-RAY PLAYERS (DVD)
TABLE 123: ANOVA TABLE FOR COMPARISON-BASED PQS REGRESSION (MODIFIED STEP) – DVD/BLU-RAY PLAYERS (DVD)
Sum of Square df Mean Square F Sig. Regression 4.010 10.000 0.401 0.925 0.517 Residual 25.571 59.000 0.433 Total 29.581 69.000 R-Square 0.136 Adjusted R-Square -0.011
TABLE 124: COEFFICIENTS TABLE FOR COMPARISON-BASED PQS REGRESSION (MODIFIED STEP) – DVD/BLU-RAY PLAYERS (DVD)
Coefficient Estimate Std. Error T Value Sig. (Constant) 0.266 0.040 6.667 0.000 MoNo -0.005 0.003 -1.654 0.103 isPart -0.015 0.035 -0.446 0.657 Int22 -0.023 0.069 -0.329 0.743 PartInt22 0.031 0.083 0.375 0.709 Int26 -0.040 0.142 -0.284 0.778 PartInt26 0.026 0.214 0.119 0.905 Int29 0.150 0.085 1.771 0.082 PartInt29 -0.019 0.121 -0.152 0.879 Int34 0.035 0.114 0.304 0.762 PartInt34 -0.004 0.163 -0.024 0.981
TABLE 125: NET EFFECTS USING COMPARISON-BASED PQS REGRESSION (MODIFIED STEP) – DVD/BLU-RAY PLAYERS (DVD)
Mean Participating Store PQS Mean Nonparticipating Store PQS Net Effect 18% 18% 1%
0.00#
0.05#
0.10#
0.15#
0.20#
0.25#
0.30#
0.35#
0.40#
0.45#
0.50#
Feb,1
2#
Mar,1
2#
Apr,1
2#
May,1
2#
Jun,12
#
Jul,12
#
Aug,1
2#
Sep,1
2#
Oct,1
2#
Nov,1
2#
Dec,1
2#
Jan,13
#
Feb,1
3#
Mar,1
3#
Apr,1
3#
May,1
3#
Jun,13
#
Jul,13
#
Aug,1
3#
Sep,1
3#
Oct,1
3#
Nov,1
3#
Dec,1
3#
Jan,14
#
Feb,1
4#
Mar,1
4#
Apr,1
4#
May,1
4#
Jun,14
#
Jul,14
#
Aug,1
4#
Sep,1
4#
Oct,1
4#
Nov,1
4#
Dec,1
4#
PQS$
Int22# Int26# Int29# Int34#
NonparCcipaCng#,#FiEed# NonparCcipaCng#,#Actual# ParCcipaCng#,#FiEed# ParCcipaCng#,#Actual#

170
PG&E’s Emerging Technologies Program ET13PGE8052
FIGURE 47: COMPARISON-BASED PQS REGRESSION (MODIFIED STEP) – DVD/BLU-RAY PLAYERS (BLU-RAY)
TABLE 126: ANOVA TABLE FOR COMPARISON-BASED PQS REGRESSION (MODIFIED STEP) – DVD/BLU-RAY PLAYERS (BLU-RAY)
Sum of Square df Mean Square F Sig. Regression 34.644 8.000 4.331 16.206 0.000 Residual 16.300 61.000 0.267 Total 50.944 69.000 R-Square 0.680 Adjusted R-Square 0.638
TABLE 127: COEFFICIENTS TABLE FOR COMPARISON-BASED PQS REGRESSION (MODIFIED STEP) – DVD/BLU-RAY PLAYERS (BLU-RAY)
Coefficient Estimate Std. Error T Value Sig. (Constant) -0.119 0.075 -1.598 0.115 MoNo 0.036 0.005 6.627 0.000 isPart -0.008 0.059 -0.137 0.892 Int22 -0.142 0.102 -1.393 0.169 PartInt22 0.008 0.110 0.068 0.946 Int26 -0.261 0.252 -1.035 0.305 PartInt26 -0.077 0.354 -0.217 0.829 Int29 -0.196 0.099 -1.976 0.053 PartInt29 0.001 0.127 0.012 0.991
TABLE 128: NET EFFECTS USING COMPARISON-BASED PQS REGRESSION (MODIFIED STEP) – DVD/BLU-RAY PLAYERS (BLU-RAY)
Mean Participating Store PQS Mean Nonparticipating Store PQS Net Effect 66% 66% -1%
!0.10%
0.10%
0.30%
0.50%
0.70%
0.90%
Feb!1
2%
Mar!1
2%
Apr!1
2%
May!1
2%
Jun!12
%
Jul!12
%
Aug!1
2%
Sep!1
2%
Oct!1
2%
Nov!1
2%
Dec!1
2%
Jan!13
%
Feb!1
3%
Mar!1
3%
Apr!1
3%
May!1
3%
Jun!13
%
Jul!13
%
Aug!1
3%
Sep!1
3%
Oct!1
3%
Nov!1
3%
Dec!1
3%
Jan!14
%
Feb!1
4%
Mar!1
4%
Apr!1
4%
May!1
4%
Jun!14
%
Jul!14
%
Aug!1
4%
Sep!1
4%
Oct!1
4%
Nov!1
4%
Dec!1
4%
PQS$
Int22% Int26% Int29% NonparDcipaDng%!%FiFed%
NonparDcipaDng%!%Actual% ParDcipaDng%!%FiFed% ParDcipaDng%!%Actual%

171
PG&E’s Emerging Technologies Program ET13PGE8052
FIGURE 48: COMPARISON-BASED PQS REGRESSION (MODIFIED STEP) – HOME-THEATERS-IN-A-BOX (SOUND BARS)
TABLE 129: ANOVA TABLE FOR COMPARISON-BASED PQS REGRESSION (MODIFIED STEP) – HOME-THEATERS-IN-A-BOX (SOUND BARS)
Sum of Square df Mean Square F Sig. Regression 11.929 10.000 1.193 30.710 0.000 Residual 2.292 59.000 0.039 Total 14.220 69.000 R-Square 0.839 Adjusted R-Square 0.812
TABLE 130: COEFFICIENTS TABLE FOR COMPARISON-BASED PQS REGRESSION (MODIFIED STEP) – HOME-THEATERS-IN-A-BOX (SOUND BARS)
Coefficient Estimate Std. Error T Value Sig. (Constant) -0.079 0.063 -1.263 0.212 MoNo 0.015 0.004 3.677 0.001 isPart -0.017 0.045 -0.385 0.702 Int22 0.300 0.065 4.640 0.000 PartInt22 0.022 0.070 0.311 0.757 Int26 -0.068 0.141 -0.480 0.633 PartInt26 -0.051 0.206 -0.249 0.804 Int29 -0.364 0.062 -5.845 0.000 PartInt29 0.027 0.080 0.341 0.735 Int34 0.284 0.063 4.533 0.000 PartInt34 -0.010 0.087 -0.119 0.906
TABLE 131: NET EFFECTS USING COMPARISON-BASED PQS REGRESSION (MODIFIED STEP) – HOME-THEATERS-IN-A-BOX (SOUND BARS)
Mean Participating Store PQS Mean Nonparticipating Store PQS Net Effect 52% 51% 1%
0.00#
0.10#
0.20#
0.30#
0.40#
0.50#
0.60#
0.70#
0.80#
0.90#
1.00#
-0.10#
0.00#
0.10#
0.20#
0.30#
0.40#
0.50#
0.60#
0.70#
Feb-1
2#Mar-
12#
Apr-1
2#May-12
#Jun-1
2#Jul-1
2#Au
g-12#
Sep-1
2#Oc
t-12#
Nov-1
2#De
c-12#
Jan-13
#Feb-1
3#Mar-
13#
Apr-1
3#May-13
#Jun-1
3#Jul-1
3#Au
g-13#
Sep-1
3#Oc
t-13#
Nov-1
3#De
c-13#
Jan-14
#Feb-1
4#Mar-
14#
Apr-1
4#May-14
#Jun-1
4#Jul-1
4#Au
g-14#
Sep-1
4#Oc
t-14#
Nov-1
4#De
c-14#
PQS$
Int22# Int26# Int29# Int34#
NonparEcipaEng#-#FiGed# NonparEcipaEng#-#Actual# ParEcipant#-#FiGed# ParEcipant#-#Actual#

172
PG&E’s Emerging Technologies Program ET13PGE8052
FIGURE 49: COMPARISON-BASED PQS REGRESSION (MODIFIED STEP) – FREEZERS (CHEST)
TABLE 132: ANOVA TABLE FOR COMPARISON-BASED PQS REGRESSION (MODIFIED STEP) – FREEZERS (CHEST)
Sum of Square df Mean Square F Sig. Regression 0.030 10.000 0.003 3.738 0.001 Residual 0.047 59.000 0.001 Total 0.077 69.000 R-Square 0.388 Adjusted R-Square 0.284
TABLE 133: COEFFICIENTS TABLE FOR COMPARISON-BASED PQS REGRESSION (MODIFIED STEP) – FREEZERS (CHEST)
Coefficient Estimate Std. Error T Value Sig. (Constant) 0.024 0.005 4.385 0.000 MoNo -0.001 0.000 -2.370 0.021 isPart 0.013 0.004 3.059 0.003 Int22 0.013 0.010 1.257 0.214 PartInt22 -0.005 0.012 -0.393 0.696 Int23 0.011 0.008 1.326 0.190 PartInt23 0.000 0.010 0.001 0.999 Int26 0.017 0.016 1.093 0.279 PartInt26 -0.036 0.020 -1.790 0.079 Int29 0.009 0.008 1.068 0.290 PartInt29 0.004 0.010 0.357 0.722
TABLE 134: NET EFFECTS USING COMPARISON-BASED PQS REGRESSION (MODIFIED STEP) – FREEZERS (CHEST)
Mean Participating Store PQS Mean Nonparticipating Store PQS Net Effect 3% 3% 1%
0.00#
0.01#
0.02#
0.03#
0.04#
0.05#
0.06#
0.07#
0.08#
0.09#
0.10#
Feb01
2#
Mar01
2#
Apr01
2#
May01
2#
Jun012
#
Jul012
#
Aug01
2#
Sep01
2#
Oct01
2#
Nov01
2#
Dec01
2#
Jan013
#
Feb01
3#
Mar01
3#
Apr01
3#
May01
3#
Jun013
#
Jul013
#
Aug01
3#
Sep01
3#
Oct01
3#
Nov01
3#
Dec01
3#
Jan014
#
Feb01
4#
Mar01
4#
Apr01
4#
May01
4#
Jun014
#
Jul014
#
Aug01
4#
Sep01
4#
Oct01
4#
Nov01
4#
Dec01
4#
PQS$
Int22# Int23# Int26# Int29#
NonparEcipaEng#0#FiGed# NonparEcipaEng#0#Actual# ParEcipaEng#0#FiGed# ParEcipaEng#0#Actual#

173
PG&E’s Emerging Technologies Program ET13PGE8052
FIGURE 50: COMPARISON-BASED PQS REGRESSION (MODIFIED STEP) – REFRIGERATORS (COMPACT)
TABLE 135: ANOVA TABLE FOR COMPARISON-BASED PQS REGRESSION (MODIFIED STEP) – REFRIGERATORS (COMPACT)
Sum of Square df Mean Square F Sig. Regression 5.532 10.000 0.553 28.832 0.000 Residual 1.055 55.000 0.019 Total 6.587 65.000 R-Square 0.840 Adjusted R-Square 0.811
TABLE 136: COEFFICIENTS TABLE FOR COMPARISON-BASED PQS REGRESSION (MODIFIED STEP) – REFRIGERATORS (COMPACT)
Coefficient Estimate Std. Error T Value Sig. (Constant) -0.134 0.032 -4.147 0.000 MoNo 0.023 0.002 11.564 0.000 isPart -0.029 0.025 -1.150 0.255 Int22 -0.475 0.066 -7.179 0.000 PartInt22 0.028 0.082 0.341 0.735 Int26 0.017 0.121 0.139 0.890 PartInt26 0.001 0.159 0.003 0.997 Int29 -0.044 0.066 -0.665 0.509 PartInt29 0.009 0.088 0.100 0.920 Int33 -0.004 0.046 -0.083 0.934 PartInt33 0.297 0.061 4.895 0.000
TABLE 137: NET EFFECTS USING COMPARISON-BASED PQS REGRESSION (MODIFIED STEP) – REFRIGERATORS (COMPACT)
Mean Participating Store PQS Mean Nonparticipating Store PQS Net Effect 14% 6% 8%
!0.15&
0.05&
0.25&
0.45&
0.65&
0.85&Feb!1
2&
Mar!1
2&
Apr!1
2&
May!1
2&
Jun!12
&
Jul!12
&
Aug!1
2&
Sep!1
2&
Oct!1
2&
Nov!1
2&
Dec!1
2&
Jan!13
&
Feb!1
3&
Mar!1
3&
Apr!1
3&
May!1
3&
Jun!13
&
Jul!13
&
Aug!1
3&
Sep!1
3&
Oct!1
3&
Nov!1
3&
Dec!1
3&
Jan!14
&
Feb!1
4&
Mar!1
4&
Apr!1
4&
May!1
4&
Jun!14
&
Jul!14
&
Aug!1
4&
Sep!1
4&
Oct!1
4&
Nov!1
4&
Dec!1
4&
PQS$
Int22& Int26& Int29& Int33&
NonparDcipaDng&!&FiFed& NonparDcipaDng&!&Actual& ParDcipaDng&!&FiFed& ParDcipaDng&!&Actual&

174
PG&E’s Emerging Technologies Program ET13PGE8052
FIGURE 51: COMPARISON-BASED PQS REGRESSION (MODIFIED STEP) – REFRIGERATORS (MEDIUM)
TABLE 138: ANOVA TABLE FOR COMPARISON-BASED PQS REGRESSION (MODIFIED STEP) – REFRIGERATORS (MEDIUM)
Sum of Square df Mean Square F Sig. Regression 0.092 10.000 0.009 5.011 0.000 Residual 0.109 59.000 0.002 Total 0.201 69.000 R-Square 0.459 Adjusted R-Square 0.368
TABLE 139: COEFFICIENTS TABLE FOR COMPARISON-BASED PQS REGRESSION (MODIFIED STEP) – REFRIGERATORS (MEDIUM)
Coefficient Estimate Std. Error T Value Sig. (Constant) 0.070 0.012 5.938 0.000 MoNo -0.003 0.001 -3.629 0.001 isPart 0.007 0.009 0.783 0.437 Int22 -0.002 0.034 -0.053 0.958 PartInt22 0.126 0.046 2.750 0.008 Int23 0.043 0.037 1.162 0.250 PartInt23 -0.100 0.049 -2.027 0.047 Int26 0.023 0.030 0.776 0.441 PartInt26 0.006 0.040 0.149 0.882 Int29 -0.010 0.019 -0.503 0.617 PartInt29 -0.021 0.024 -0.846 0.401
TABLE 140: NET EFFECTS USING COMPARISON-BASED PQS REGRESSION (MODIFIED STEP) – REFRIGERATORS (MEDIUM)
Mean Participating Store PQS Mean Nonparticipating Store PQS Net Effect 6% 3% 3%
0.00#
0.02#
0.04#
0.06#
0.08#
0.10#
0.12#
0.14#
0.16#
0.18#
0.20#
Feb,1
2#
Mar,1
2#
Apr,1
2#
May,1
2#
Jun,12
#
Jul,12
#
Aug,1
2#
Sep,1
2#
Oct,1
2#
Nov,1
2#
Dec,1
2#
Jan,13
#
Feb,1
3#
Mar,1
3#
Apr,1
3#
May,1
3#
Jun,13
#
Jul,13
#
Aug,1
3#
Sep,1
3#
Oct,1
3#
Nov,1
3#
Dec,1
3#
Jan,14
#
Feb,1
4#
Mar,1
4#
Apr,1
4#
May,1
4#
Jun,14
#
Jul,14
#
Aug,1
4#
Sep,1
4#
Oct,1
4#
Nov,1
4#
Dec,1
4#
PQS$
Int22# Int23# Int26# Int29#
NonparCcipaCng#,#FiEed# NonparCcipaCng#,#Actual# ParCcipaCng#,#FiEed# ParCcipaCng#,#Actual#
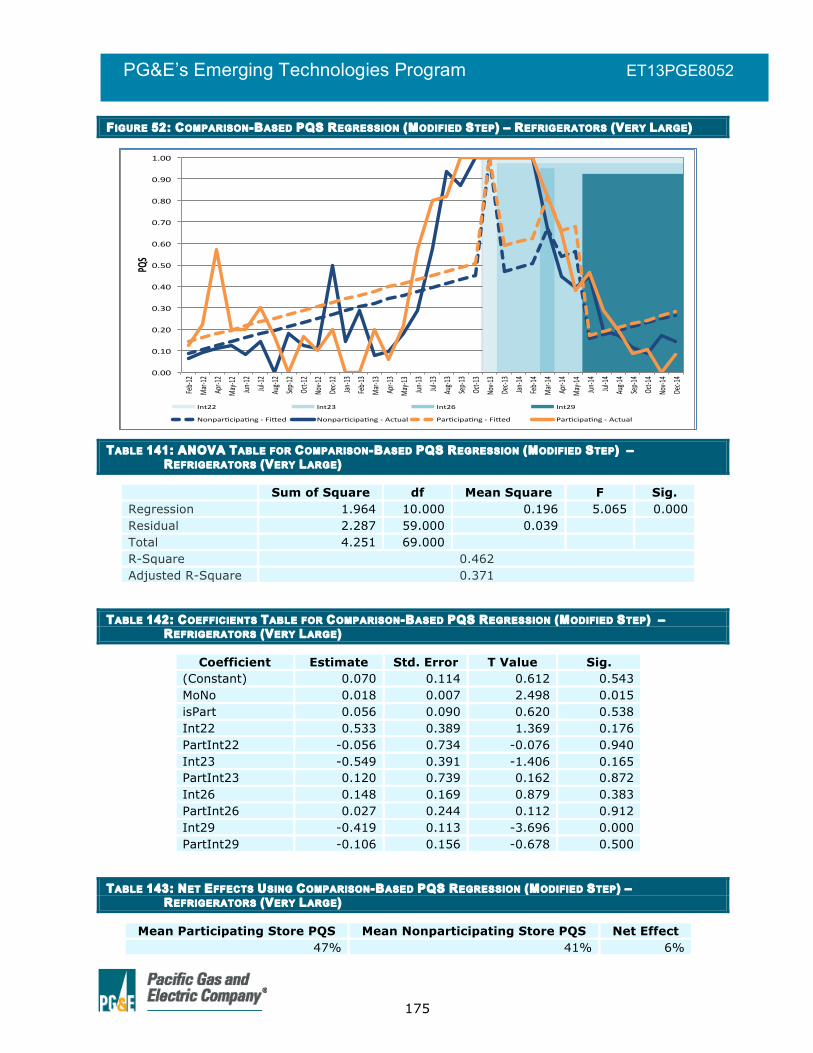
175
PG&E’s Emerging Technologies Program ET13PGE8052
FIGURE 52: COMPARISON-BASED PQS REGRESSION (MODIFIED STEP) – REFRIGERATORS (VERY LARGE)
TABLE 141: ANOVA TABLE FOR COMPARISON-BASED PQS REGRESSION (MODIFIED STEP) – REFRIGERATORS (VERY LARGE)
Sum of Square df Mean Square F Sig. Regression 1.964 10.000 0.196 5.065 0.000 Residual 2.287 59.000 0.039 Total 4.251 69.000 R-Square 0.462 Adjusted R-Square 0.371
TABLE 142: COEFFICIENTS TABLE FOR COMPARISON-BASED PQS REGRESSION (MODIFIED STEP) – REFRIGERATORS (VERY LARGE)
Coefficient Estimate Std. Error T Value Sig. (Constant) 0.070 0.114 0.612 0.543 MoNo 0.018 0.007 2.498 0.015 isPart 0.056 0.090 0.620 0.538 Int22 0.533 0.389 1.369 0.176 PartInt22 -0.056 0.734 -0.076 0.940 Int23 -0.549 0.391 -1.406 0.165 PartInt23 0.120 0.739 0.162 0.872 Int26 0.148 0.169 0.879 0.383 PartInt26 0.027 0.244 0.112 0.912 Int29 -0.419 0.113 -3.696 0.000 PartInt29 -0.106 0.156 -0.678 0.500
TABLE 143: NET EFFECTS USING COMPARISON-BASED PQS REGRESSION (MODIFIED STEP) – REFRIGERATORS (VERY LARGE)
Mean Participating Store PQS Mean Nonparticipating Store PQS Net Effect 47% 41% 6%
0.00#
0.10#
0.20#
0.30#
0.40#
0.50#
0.60#
0.70#
0.80#
0.90#
1.00#
Feb01
2#
Mar01
2#
Apr01
2#
May01
2#
Jun012
#
Jul012
#
Aug01
2#
Sep01
2#
Oct01
2#
Nov01
2#
Dec01
2#
Jan013
#
Feb01
3#
Mar01
3#
Apr01
3#
May01
3#
Jun013
#
Jul013
#
Aug01
3#
Sep01
3#
Oct01
3#
Nov01
3#
Dec01
3#
Jan014
#
Feb01
4#
Mar01
4#
Apr01
4#
May01
4#
Jun014
#
Jul014
#
Aug01
4#
Sep01
4#
Oct01
4#
Nov01
4#
Dec01
4#
PQS$
Int22# Int23# Int26# Int29#
NonparEcipaEng#0#FiGed# NonparEcipaEng#0#Actual# ParEcipaEng#0#FiGed# ParEcipaEng#0#Actual#

176
PG&E’s Emerging Technologies Program ET13PGE8052
FIGURE 53: COMPARISON-BASED PQS REGRESSION (MODIFIED STEP) – ROOM AIR CONDITIONERS (<12,000 BTU)
TABLE 144: ANOVA TABLE FOR COMPARISON-BASED PQS REGRESSION (MODIFIED STEP) – ROOM AIR CONDITIONERS (<12,000 BTU)
Sum of Square df Mean Square F Sig. Regression 2.022 8.000 0.253 12.529 0.000 Residual 1.110 55.000 0.020 Total 3.132 63.000 R-Square 0.646 Adjusted R-Square 0.594
TABLE 145: COEFFICIENTS TABLE FOR COMPARISON-BASED PQS REGRESSION (MODIFIED STEP) – ROOM AIR CONDITIONERS (<12,000 BTU)
Coefficient Estimate Std. Error T Value Sig. (Constant) 0.160 0.022 7.257 0.000 MoNo 0.005 0.001 3.306 0.002 isPart 0.002 0.017 0.109 0.914 Int22 -0.044 0.116 -0.378 0.707 PartInt22 0.159 0.157 1.010 0.317 Int27 -0.172 0.114 -1.500 0.139 PartInt27 0.030 0.156 0.193 0.847 Int29 -0.046 0.035 -1.323 0.191 PartInt29 -0.061 0.055 -1.111 0.271
TABLE 146: NET EFFECTS USING COMPARISON-BASED PQS REGRESSION (MODIFIED STEP) – ROOM AIR CONDITIONERS (<12,000 BTU)
Mean Participating Store PQS Mean Nonparticipating Store PQS Net Effect 29% 11% 14%
0.00#
0.10#
0.20#
0.30#
0.40#
0.50#
0.60#
0.70#
0.80#
0.90#
1.00#Feb01
2#
Mar01
2#
Apr01
2#
May01
2#
Jun012
#
Jul012
#
Aug01
2#
Sep01
2#
Oct01
2#
Nov01
2#
Dec01
2#
Jan013
#
Feb01
3#
Mar01
3#
Apr01
3#
May01
3#
Jun013
#
Jul013
#
Aug01
3#
Sep01
3#
Oct01
3#
Nov01
3#
Dec01
3#
Jan014
#
Feb01
4#
Mar01
4#
Apr01
4#
May01
4#
Jun014
#
Jul014
#
Aug01
4#
Sep01
4#
Oct01
4#
Nov01
4#
Dec01
4#
PQS$
Int22# Int27# Int29# NonparEcipaEng#0#FiGed#
NonparEcipaEng#0#Actual# ParEcipaEng#0#FiGed# ParEcipaEng#0#Actual#

177
PG&E’s Emerging Technologies Program ET13PGE8052
APPENDIX I: RESULTS OF COMPARISON-BASED
PQS SEGMENTED REGRESSIONS
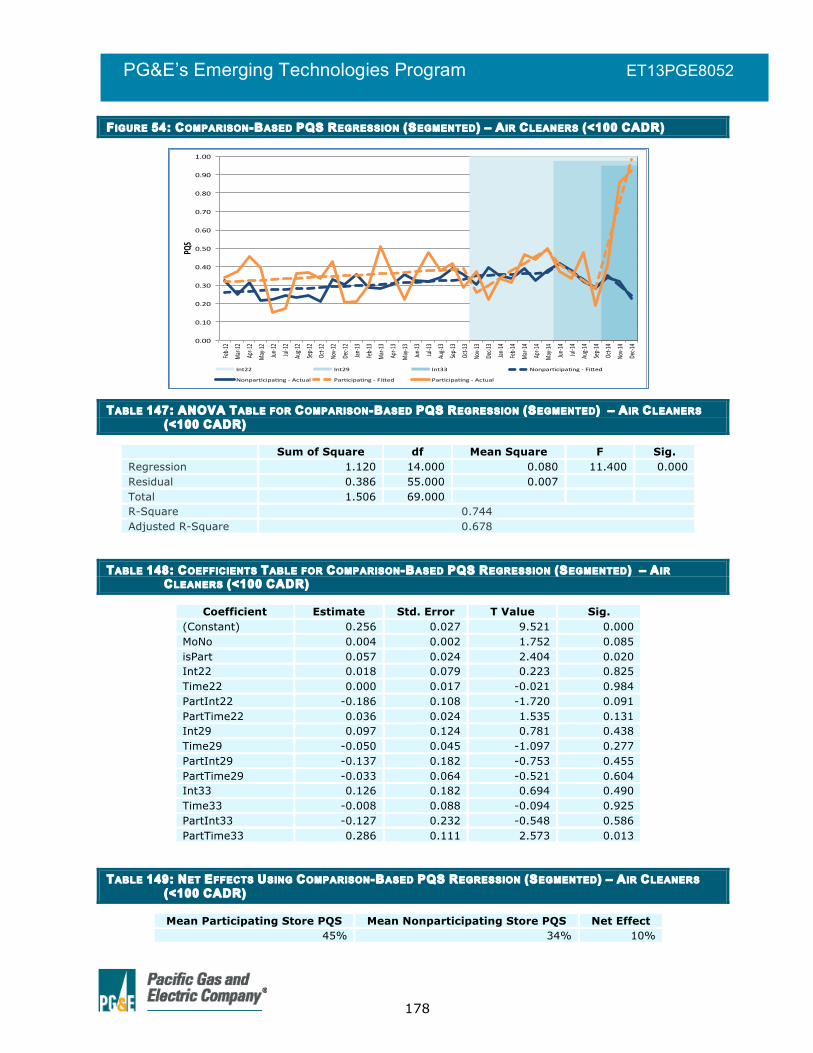
178
PG&E’s Emerging Technologies Program ET13PGE8052
FIGURE 54: COMPARISON-BASED PQS REGRESSION (SEGMENTED) – AIR CLEANERS (<100 CADR)
TABLE 147: ANOVA TABLE FOR COMPARISON-BASED PQS REGRESSION (SEGMENTED) – AIR CLEANERS (<100 CADR)
Sum of Square df Mean Square F Sig. Regression 1.120 14.000 0.080 11.400 0.000 Residual 0.386 55.000 0.007 Total 1.506 69.000 R-Square 0.744 Adjusted R-Square 0.678
TABLE 148: COEFFICIENTS TABLE FOR COMPARISON-BASED PQS REGRESSION (SEGMENTED) – AIR CLEANERS (<100 CADR)
Coefficient Estimate Std. Error T Value Sig. (Constant) 0.256 0.027 9.521 0.000 MoNo 0.004 0.002 1.752 0.085 isPart 0.057 0.024 2.404 0.020 Int22 0.018 0.079 0.223 0.825 Time22 0.000 0.017 -0.021 0.984 PartInt22 -0.186 0.108 -1.720 0.091 PartTime22 0.036 0.024 1.535 0.131 Int29 0.097 0.124 0.781 0.438 Time29 -0.050 0.045 -1.097 0.277 PartInt29 -0.137 0.182 -0.753 0.455 PartTime29 -0.033 0.064 -0.521 0.604 Int33 0.126 0.182 0.694 0.490 Time33 -0.008 0.088 -0.094 0.925 PartInt33 -0.127 0.232 -0.548 0.586 PartTime33 0.286 0.111 2.573 0.013
TABLE 149: NET EFFECTS USING COMPARISON-BASED PQS REGRESSION (SEGMENTED) – AIR CLEANERS (<100 CADR)
Mean Participating Store PQS Mean Nonparticipating Store PQS Net Effect 45% 34% 10%
0.00#
0.10#
0.20#
0.30#
0.40#
0.50#
0.60#
0.70#
0.80#
0.90#
1.00#
Feb01
2#
Mar01
2#
Apr01
2#
May01
2#
Jun012
#
Jul012
#
Aug01
2#
Sep01
2#
Oct01
2#
Nov01
2#
Dec01
2#
Jan013
#
Feb01
3#
Mar01
3#
Apr01
3#
May01
3#
Jun013
#
Jul013
#
Aug01
3#
Sep01
3#
Oct01
3#
Nov01
3#
Dec01
3#
Jan014
#
Feb01
4#
Mar01
4#
Apr01
4#
May01
4#
Jun014
#
Jul014
#
Aug01
4#
Sep01
4#
Oct01
4#
Nov01
4#
Dec01
4#
PQS$
Int22# Int29# Int33# NonparEcipaEng#0#FiGed#
NonparEcipaEng#0#Actual# ParEcipaEng#0#FiGed# ParEcipaEng#0#Actual#

179
PG&E’s Emerging Technologies Program ET13PGE8052
FIGURE 55: COMPARISON-BASED PQS REGRESSION (SEGMENTED) – DVD/BLU-RAY PLAYERS (DVD)
TABLE 150: ANOVA TABLE FOR COMPARISON-BASED PQS REGRESSION (SEGMENTED) – DVD/BLU-RAY PLAYERS (DVD)
Sum of Square df Mean Square F Sig. Regression 6.695 18.000 0.372 0.829 0.659 Residual 22.886 51.000 0.449 Total 29.581 69.000 R-Square 0.226 Adjusted R-Square -0.047
TABLE 151: COEFFICIENTS TABLE FOR COMPARISON-BASED PQS REGRESSION (SEGMENTED) – DVD/BLU-RAY PLAYERS (DVD)
Coefficient Estimate Std. Error T Value Sig. (Constant) 0.278 0.041 6.776 0.000 MoNo -0.006 0.003 -1.973 0.054 isPart -0.016 0.035 -0.442 0.660 Int22 -0.029 0.132 -0.223 0.825 Time22 -0.010 0.051 -0.189 0.851 PartInt22 0.047 0.204 0.229 0.820 PartTime22 -0.008 0.078 -0.106 0.916 Int26 -0.066 0.157 -0.420 0.676 Time26 0.099 0.100 0.991 0.326 PartInt26 0.040 0.234 0.173 0.863 PartTime26 0.011 0.149 0.073 0.942 Int29 -0.119 0.203 -0.589 0.559 Time29 -0.064 0.078 -0.826 0.412 PartInt29 -0.039 0.294 -0.134 0.894 PartTime29 0.008 0.113 0.072 0.943 Int34 -0.067 0.338 -0.198 0.844 Time34 0.009 0.196 0.043 0.966 PartInt34 0.032 0.483 0.067 0.947 PartTime34 -0.048 0.281 -0.172 0.864
TABLE 152: NET EFFECTS USING COMPARISON-BASED PQS REGRESSION (SEGMENTED) – DVD/BLU-RAY PLAYERS (DVD)
Mean Participating Store PQS Mean Nonparticipating Store PQS Net Effect 19% 19% 1%
0.00#
0.05#
0.10#
0.15#
0.20#
0.25#
0.30#
0.35#
0.40#
0.45#
0.50#
Feb,1
2#
Mar,1
2#
Apr,1
2#
May,1
2#
Jun,12
#
Jul,12
#
Aug,1
2#
Sep,1
2#
Oct,1
2#
Nov,1
2#
Dec,1
2#
Jan,13
#
Feb,1
3#
Mar,1
3#
Apr,1
3#
May,1
3#
Jun,13
#
Jul,13
#
Aug,1
3#
Sep,1
3#
Oct,1
3#
Nov,1
3#
Dec,1
3#
Jan,14
#
Feb,1
4#
Mar,1
4#
Apr,1
4#
May,1
4#
Jun,14
#
Jul,14
#
Aug,1
4#
Sep,1
4#
Oct,1
4#
Nov,1
4#
Dec,1
4#
PQS$
Int22# Int26# Int29# Int34#
NonparCcipaCng#,#FiEed# NonparCcipaCng#,#Actual# ParCcipaCng#,#FiEed# ParCcipaCng#,#Actual#
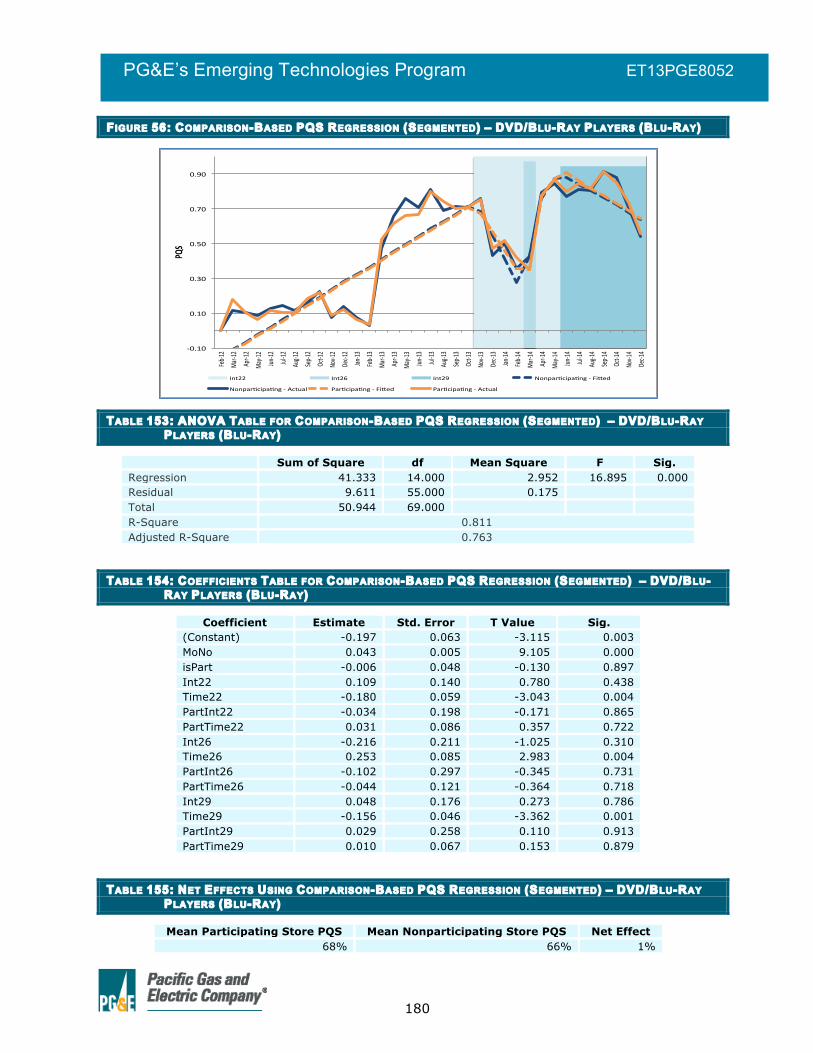
180
PG&E’s Emerging Technologies Program ET13PGE8052
FIGURE 56: COMPARISON-BASED PQS REGRESSION (SEGMENTED) – DVD/BLU-RAY PLAYERS (BLU-RAY)
TABLE 153: ANOVA TABLE FOR COMPARISON-BASED PQS REGRESSION (SEGMENTED) – DVD/BLU-RAY PLAYERS (BLU-RAY)
Sum of Square df Mean Square F Sig. Regression 41.333 14.000 2.952 16.895 0.000 Residual 9.611 55.000 0.175 Total 50.944 69.000 R-Square 0.811 Adjusted R-Square 0.763
TABLE 154: COEFFICIENTS TABLE FOR COMPARISON-BASED PQS REGRESSION (SEGMENTED) – DVD/BLU-RAY PLAYERS (BLU-RAY)
Coefficient Estimate Std. Error T Value Sig. (Constant) -0.197 0.063 -3.115 0.003 MoNo 0.043 0.005 9.105 0.000 isPart -0.006 0.048 -0.130 0.897 Int22 0.109 0.140 0.780 0.438 Time22 -0.180 0.059 -3.043 0.004 PartInt22 -0.034 0.198 -0.171 0.865 PartTime22 0.031 0.086 0.357 0.722 Int26 -0.216 0.211 -1.025 0.310 Time26 0.253 0.085 2.983 0.004 PartInt26 -0.102 0.297 -0.345 0.731 PartTime26 -0.044 0.121 -0.364 0.718 Int29 0.048 0.176 0.273 0.786 Time29 -0.156 0.046 -3.362 0.001 PartInt29 0.029 0.258 0.110 0.913 PartTime29 0.010 0.067 0.153 0.879
TABLE 155: NET EFFECTS USING COMPARISON-BASED PQS REGRESSION (SEGMENTED) – DVD/BLU-RAY PLAYERS (BLU-RAY)
Mean Participating Store PQS Mean Nonparticipating Store PQS Net Effect 68% 66% 1%
!0.10%
0.10%
0.30%
0.50%
0.70%
0.90%
Feb!1
2%
Mar!1
2%
Apr!1
2%
May!1
2%
Jun!12
%
Jul!12
%
Aug!1
2%
Sep!1
2%
Oct!1
2%
Nov!1
2%
Dec!1
2%
Jan!13
%
Feb!1
3%
Mar!1
3%
Apr!1
3%
May!1
3%
Jun!13
%
Jul!13
%
Aug!1
3%
Sep!1
3%
Oct!1
3%
Nov!1
3%
Dec!1
3%
Jan!14
%
Feb!1
4%
Mar!1
4%
Apr!1
4%
May!1
4%
Jun!14
%
Jul!14
%
Aug!1
4%
Sep!1
4%
Oct!1
4%
Nov!1
4%
Dec!1
4%
PQS$
Int22% Int26% Int29% NonparDcipaDng%!%FiFed%
NonparDcipaDng%!%Actual% ParDcipaDng%!%FiFed% ParDcipaDng%!%Actual%

181
PG&E’s Emerging Technologies Program ET13PGE8052
FIGURE 57: COMPARISON-BASED PQS REGRESSION (SEGMENTED) – HOME-THEATERS-IN-A-BOX (SOUND BARS)
TABLE 156: ANOVA TABLE FOR COMPARISON-BASED PQS REGRESSION (SEGMENTED) – HOME-THEATERS-IN-A-BOX (SOUND BARS)
Sum of Square df Mean Square F Sig. Regression 13.021 18.000 0.723 30.766 0.000 Residual 1.199 51.000 0.024 Total 14.220 69.000 R-Square 0.916 Adjusted R-Square 0.886
TABLE 157: COEFFICIENTS TABLE FOR COMPARISON-BASED PQS REGRESSION (SEGMENTED) – HOME-THEATERS-IN-A-BOX (SOUND BARS)
Coefficient Estimate Std. Error T Value Sig. (Constant) -0.184 0.052 -3.573 0.001 MoNo 0.023 0.003 6.710 0.000 isPart -0.015 0.035 -0.433 0.667 Int22 0.424 0.074 5.742 0.000 Time22 -0.086 0.030 -2.829 0.007 PartInt22 0.088 0.104 0.850 0.399 PartTime22 -0.031 0.046 -0.671 0.505 Int26 0.091 0.118 0.774 0.442 Time26 0.045 0.061 0.732 0.467 PartInt26 -0.023 0.173 -0.132 0.896 PartTime26 0.056 0.091 0.616 0.540 Int29 -0.024 0.112 -0.214 0.831 Time29 -0.005 0.045 -0.118 0.907 PartInt29 -0.045 0.162 -0.277 0.783 PartTime29 -0.008 0.065 -0.124 0.902 Int34 0.427 0.131 3.247 0.002 Time34 -0.003 0.075 -0.040 0.968 PartInt34 -0.160 0.184 -0.870 0.388 PartTime34 0.056 0.106 0.531 0.598
TABLE 158: NET EFFECTS USING COMPARISON-BASED PQS REGRESSION (SEGMENTED) – HOME-THEATERS-IN-A-BOX (SOUND BARS)
Mean Participating Store PQS Mean Nonparticipating Store PQS Net Effect 49% 47% 1%
!0.20%
!0.10%
0.00%
0.10%
0.20%
0.30%
0.40%
0.50%
0.60%
0.70%
Feb!12%
Mar!12%
Apr!1
2%
May!12%
Jun!12
%
Jul!1
2%
Aug!12%
Sep!12%
Oct!1
2%
Nov!12%
Dec!12
%
Jan!13
%
Feb!13%
Mar!13%
Apr!1
3%
May!13%
Jun!13
%
Jul!1
3%
Aug!13%
Sep!13%
Oct!1
3%
Nov!13%
Dec!13
%
Jan!14
%
Feb!14%
Mar!14%
Apr!1
4%
May!14%
Jun!14
%
Jul!1
4%
Aug!14%
Sep!14%
Oct!1
4%
Nov!14%
Dec!14
%
PQS$
Int22% Int26% Int29% Int34% NonparDcipaDng%!%FiFed% NonparDcipaDng%!%Actual% ParDcipaDng%!%FiFed% ParDcipaDng%!%Actual%

182
PG&E’s Emerging Technologies Program ET13PGE8052
FIGURE 58: COMPARISON-BASED PQS REGRESSION (SEGMENTED) – FREEZERS (CHEST)
TABLE 159: ANOVA TABLE FOR COMPARISON-BASED PQS REGRESSION (SEGMENTED) – FREEZERS (CHEST)
Sum of Square df Mean Square F Sig. Regression 0.040 18.000 0.002 2.976 0.001 Residual 0.038 51.000 0.001 Total 0.077 69.000 R-Square 0.512 Adjusted R-Square 0.340
TABLE 160: COEFFICIENTS TABLE FOR COMPARISON-BASED PQS REGRESSION (SEGMENTED) – FREEZERS (CHEST)
Coefficient Estimate Std. Error T Value Sig. (Constant) 0.027 0.005 5.055 0.000 MoNo -0.001 0.000 -3.117 0.003 isPart 0.013 0.004 3.190 0.002 Int22 0.002 0.016 0.150 0.882 Time22 0.003 0.009 0.374 0.710 PartInt22 -0.004 0.021 -0.192 0.849 PartTime22 0.000 0.012 0.032 0.974 Int23 -0.001 0.025 -0.041 0.968 Time23 0.002 0.003 0.719 0.476 PartInt23 0.011 0.034 0.316 0.753 PartTime23 -0.003 0.004 -0.931 0.356 Int26 0.013 0.017 0.810 0.422 Time26 0.005 0.015 0.327 0.745 PartInt26 -0.035 0.022 -1.608 0.114 PartTime26 -0.001 0.020 -0.057 0.955 Int29 -0.031 0.018 -1.697 0.096 Time29 -0.004 0.008 -0.541 0.591 PartInt29 0.039 0.024 1.632 0.109 PartTime29 -0.005 0.011 -0.490 0.626
TABLE 161: NET EFFECTS USING COMPARISON-BASED PQS REGRESSION (SEGMENTED) – FREEZERS (CHEST)
Mean Participating Store PQS Mean Nonparticipating Store PQS Net Effect 3% 3% 1%
0.00#
0.01#
0.02#
0.03#
0.04#
0.05#
0.06#
0.07#
0.08#
0.09#
0.10#
Feb01
2#
Mar01
2#
Apr01
2#
May01
2#
Jun012
#
Jul012
#
Aug01
2#
Sep01
2#
Oct01
2#
Nov01
2#
Dec01
2#
Jan013
#
Feb01
3#
Mar01
3#
Apr01
3#
May01
3#
Jun013
#
Jul013
#
Aug01
3#
Sep01
3#
Oct01
3#
Nov01
3#
Dec01
3#
Jan014
#
Feb01
4#
Mar01
4#
Apr01
4#
May01
4#
Jun014
#
Jul014
#
Aug01
4#
Sep01
4#
Oct01
4#
Nov01
4#
Dec01
4#
PQS$
Int22# Int23# Int26# Int29#
NonparEcipaEng#0#FiGed# NonparEcipaEng#0#Actual# ParEcipaEng#0#FiGed# ParEcipaEng#0#Actual#

183
PG&E’s Emerging Technologies Program ET13PGE8052
FIGURE 59: COMPARISON-BASED PQS REGRESSION (SEGMENTED) – REFRIGERATORS (COMPACT)
TABLE 162: ANOVA TABLE FOR COMPARISON-BASED PQS REGRESSION (SEGMENTED) – REFRIGERATORS (COMPACT)
Sum of Square df Mean Square F Sig. Regression 5.823 17.000 0.343 21.502 0.000 Residual 0.765 48.000 0.016 Total 6.587 65.000 R-Square 0.884 Adjusted R-Square 0.843
TABLE 163: COEFFICIENTS TABLE FOR COMPARISON-BASED PQS REGRESSION (SEGMENTED) – REFRIGERATORS (COMPACT)
Coefficient Estimate Std. Error T Value Sig. (Constant) -0.129 0.030 -4.342 0.000 MoNo 0.023 0.002 12.345 0.000 isPart -0.029 0.023 -1.267 0.211 Int22 -0.376 0.367 -1.025 0.310 Time22 -0.014 0.103 -0.135 0.893 PartInt22 0.016 0.106 0.152 0.880 Int26 0.008 0.117 0.066 0.947 Time26 -0.015 0.129 -0.116 0.908 PartInt26 0.003 0.147 0.022 0.983 PartTime26 0.009 0.052 0.174 0.863 Int29 -0.079 0.124 -0.638 0.526 Time29 0.058 0.053 1.088 0.282 PartInt29 0.000 0.166 0.002 0.999 PartTime29 -0.011 0.066 -0.158 0.875 Int33 0.050 0.100 0.504 0.617 Time33 -0.068 0.051 -1.335 0.188 PartInt33 -0.049 0.130 -0.379 0.706 PartTime33 0.161 0.066 2.433 0.019
TABLE 164: NET EFFECTS USING COMPARISON-BASED PQS REGRESSION (SEGMENTED) – REFRIGERATORS (COMPACT)
Mean Participating Store PQS Mean Nonparticipating Store PQS Net Effect 13% 6% 7%
!0.15&
0.05&
0.25&
0.45&
0.65&
0.85&
Feb!1
2&
Mar!1
2&
Apr!1
2&
May!1
2&
Jun!12
&
Jul!12
&
Aug!1
2&
Sep!1
2&
Oct!1
2&
Nov!1
2&
Dec!1
2&
Jan!13
&
Feb!1
3&
Mar!1
3&
Apr!1
3&
May!1
3&
Jun!13
&
Jul!13
&
Aug!1
3&
Sep!1
3&
Oct!1
3&
Nov!1
3&
Dec!1
3&
Jan!14
&
Feb!1
4&
Mar!1
4&
Apr!1
4&
May!1
4&
Jun!14
&
Jul!14
&
Aug!1
4&
Sep!1
4&
Oct!1
4&
Nov!1
4&
Dec!1
4&
PQS$
Int22& Int26& Int29& Int33&
NonparDcipaDng&!&FiFed& NonparDcipaDng&!&Actual& ParDcipaDng&!&FiFed& ParDcipaDng&!&Actual&

184
PG&E’s Emerging Technologies Program ET13PGE8052
FIGURE 60: COMPARISON-BASED PQS REGRESSION (SEGMENTED) – REFRIGERATORS (MEDIUM)
TABLE 165: ANOVA TABLE FOR COMPARISON-BASED PQS REGRESSION (SEGMENTED) – REFRIGERATORS (MEDIUM)
Sum of Square df Mean Square F Sig. Regression 0.105 16.000 0.007 3.645 0.000 Residual 0.096 53.000 0.002 Total 0.201 69.000 R-Square 0.524 Adjusted R-Square 0.380
TABLE 166: COEFFICIENTS TABLE FOR COMPARISON-BASED PQS REGRESSION (SEGMENTED) – REFRIGERATORS (MEDIUM)
Coefficient Estimate Std. Error T Value Sig. (Constant) 0.073 0.012 6.087 0.000 MoNo -0.003 0.001 -3.812 0.000 isPart 0.007 0.009 0.786 0.435 Int22 0.000 0.034 -0.004 0.997 PartInt22 0.126 0.045 2.779 0.008 Int23 -0.027 0.058 -0.472 0.639 Time23 0.035 0.022 1.617 0.112 PartInt23 -0.077 0.078 -0.982 0.331 PartTime23 -0.007 0.030 -0.239 0.812 Int26 0.002 0.033 0.068 0.946 Time26 -0.049 0.033 -1.490 0.142 PartInt26 0.011 0.044 0.258 0.798 PartTime26 0.000 0.045 -0.004 0.997 Int29 -0.005 0.039 -0.136 0.892 Time29 0.015 0.016 0.896 0.374 PartInt29 -0.022 0.052 -0.426 0.672 PartTime29 0.013 0.022 0.596 0.554
TABLE 167: NET EFFECTS USING COMPARISON-BASED PQS REGRESSION (SEGMENTED) – REFRIGERATORS (MEDIUM)
Mean Participating Store PQS Mean Nonparticipating Store PQS Net Effect 6% 3% 3%
0.00#
0.02#
0.04#
0.06#
0.08#
0.10#
0.12#
0.14#
0.16#
0.18#
0.20#
Feb,1
2#
Mar,
12#
Apr,1
2#
May,12
#
Jun,1
2#
Jul,1
2#
Aug,1
2#
Sep,1
2#
Oct,1
2#
Nov,1
2#
Dec,1
2#
Jan,13
#
Feb,1
3#
Mar,
13#
Apr,1
3#
May,13
#
Jun,1
3#
Jul,1
3#
Aug,1
3#
Sep,1
3#
Oct,1
3#
Nov,1
3#
Dec,1
3#
Jan,14
#
Feb,1
4#
Mar,
14#
Apr,1
4#
May,14
#
Jun,1
4#
Jul,1
4#
Aug,1
4#
Sep,1
4#
Oct,1
4#
Nov,1
4#
Dec,1
4#
PQS$
Int22# Int23# Int26# Int29#
NonparCcipaCng#,#FiEed# NonparCcipaCng#,#Actual# ParCcipaCng#,#FiEed# ParCcipaCng#,#Actual#

185
PG&E’s Emerging Technologies Program ET13PGE8052
FIGURE 61: COMPARISON-BASED PQS REGRESSION (SEGMENTED) – REFRIGERATORS (VERY LARGE)
TABLE 168: ANOVA TABLE FOR COMPARISON-BASED PQS REGRESSION (SEGMENTED) – REFRIGERATORS (VERY LARGE)
Sum of Square df Mean Square F Sig. Regression 3.074 16.000 0.192 8.646 0.000 Residual 1.177 53.000 0.022 Total 4.251 69.000 R-Square 0.723 Adjusted R-Square 0.639
TABLE 169: COEFFICIENTS TABLE FOR COMPARISON-BASED PQS REGRESSION (SEGMENTED) – REFRIGERATORS (VERY LARGE)
Coefficient Estimate Std. Error T Value Sig. (Constant) -0.092 0.090 -1.025 0.310 MoNo 0.030 0.006 5.244 0.000 isPart 0.068 0.068 1.004 0.320 Int22 0.424 0.295 1.437 0.157 PartInt22 -0.068 0.556 -0.123 0.903 Int23 0.080 0.500 0.159 0.874 Time23 -0.088 0.171 -0.516 0.608 PartInt23 -0.102 0.777 -0.132 0.896 PartTime23 0.075 0.225 0.335 0.739 Int26 -0.051 0.163 -0.312 0.756 Time26 -0.126 0.226 -0.555 0.581 PartInt26 0.046 0.224 0.206 0.837 PartTime26 -0.099 0.298 -0.332 0.741 Int29 0.004 0.135 0.030 0.977 Time29 0.136 0.080 1.696 0.096 PartInt29 0.036 0.199 0.182 0.857 PartTime29 0.000 0.109 0.000 1.000
TABLE 170: NET EFFECTS USING COMPARISON-BASED PQS REGRESSION (SEGMENTED) – REFRIGERATORS (VERY LARGE)
Mean Participating Store PQS Mean Nonparticipating Store PQS Net Effect 50% 47% 3%
!0.20%
0.00%
0.20%
0.40%
0.60%
0.80%
1.00%
Feb!1
2%Ma
r!12%
Apr!1
2%Ma
y!12%
Jun!12
%Jul
!12%
Aug!1
2%Sep!1
2%Oc
t!12%
Nov!1
2%De
c!12%
Jan!13
%Feb!1
3%Ma
r!13%
Apr!1
3%Ma
y!13%
Jun!13
%Jul
!13%
Aug!1
3%Sep!1
3%Oc
t!13%
Nov!1
3%De
c!13%
Jan!14
%Feb!1
4%Ma
r!14%
Apr!1
4%Ma
y!14%
Jun!14
%Jul
!14%
Aug!1
4%Sep!1
4%Oc
t!14%
Nov!1
4%De
c!14%
PQS$
Int22% Int23% Int26% Int29%
NonparCcipaCng%!%FiEed% NonparCcipaCng%!%Actual% ParCcipaCng%!%FiEed% ParCcipaCng%!%Actual%

186
PG&E’s Emerging Technologies Program ET13PGE8052
FIGURE 62: COMPARISON-BASED PQS REGRESSION (SEGMENTED) – ROOM AIR CONDITIONERS (<12,000 BTU)
TABLE 171: ANOVA TABLE FOR COMPARISON-BASED PQS REGRESSION (SEGMENTED) – ROOM AIR CONDITIONERS (<12,000 BTU)
Sum of Square df Mean Square F Sig. Regression 2.062 14.000 0.147 6.742 0.000 Residual 1.070 49.000 0.022 Total 3.132 63.000 R-Square 0.658 Adjusted R-Square 0.561
TABLE 172: COEFFICIENTS TABLE FOR COMPARISON-BASED PQS REGRESSION (SEGMENTED) – ROOM AIR CONDITIONERS (<12,000 BTU)
Coefficient Estimate Std. Error T Value Sig. (Constant) 0.158 0.023 6.864 0.000 MoNo 0.005 0.002 3.264 0.002 isPart 0.002 0.018 0.105 0.917 Int22 -0.274 0.644 -0.426 0.672 Time22 0.060 0.138 0.436 0.665 PartInt22 0.387 0.948 0.408 0.685 PartTime22 -0.055 0.203 -0.274 0.785 Int27 -0.165 0.158 -1.048 0.300 Time27 -0.104 0.165 -0.626 0.534 PartInt27 -0.042 0.214 -0.195 0.846 PartTime27 0.122 0.247 0.494 0.623 Int29 0.003 0.064 0.045 0.965 Time29 0.023 0.081 0.288 0.775 PartInt29 -0.074 0.095 -0.777 0.441 PartTime29 -0.068 0.122 -0.558 0.579
TABLE 173: NET EFFECTS USING COMPARISON-BASED PQS REGRESSION (SEGMENTED) – ROOM AIR CONDITIONERS (<12,000 BTU)
Mean Participating Store PQS Mean Nonparticipating Store PQS Net Effect 28% 11% 17%
0.00#
0.10#
0.20#
0.30#
0.40#
0.50#
0.60#
0.70#
0.80#
0.90#
1.00#
Feb01
2#
Mar01
2#
Apr01
2#
May01
2#
Jun012
#
Jul012
#
Aug01
2#
Sep01
2#
Oct01
2#
Nov01
2#
Dec01
2#
Jan013
#
Feb01
3#
Mar01
3#
Apr01
3#
May01
3#
Jun013
#
Jul013
#
Aug01
3#
Sep01
3#
Oct01
3#
Nov01
3#
Dec01
3#
Jan014
#
Feb01
4#
Mar01
4#
Apr01
4#
May01
4#
Jun014
#
Jul014
#
Aug01
4#
Sep01
4#
Oct01
4#
Nov01
4#
Dec01
4#
PQS$
Int22# Int27# Int29# NonparEcipaEng#0#FiGed#
NonparEcipaEng#0#Actual# ParEcipaEng#0#FiGed# ParEcipaEng#0#Actual#

187
PG&E’s Emerging Technologies Program ET13PGE8052
REFERENCES Arup, Davis Energy Group, Sun Light & Power, New Buildings Institute, Engineering 350,
and Sustainable Design + Behavior (2012), The Technical Feasibility of Zero Net Energy Buildings in California. Page 8. Developed on behalf of Pacific Gas & Electric Company. Retrieved from: http://www.energydataweb.com/cpucFiles/pdaDocs/904/California_ZNE_Technical_Feasibility_Report_Final.pdf
Biemer, P., R.M. Groves, L.E. Lyberg, N.A. Mathiowetz & S. Sudman (2004), Measurement Error in Surveys. Hoboken, New Jersey: John Wiley & Sons, Inc.
Chen, H.T. (1990), Theory-Driven Evaluations. Thousand Oaks, CA: Sage.
Coryn, C.L., L.A. Noakes, C.D. Westine & D.C. Schröter (2011), “A Systematic Review of Theory-Driven Evaluation Practice from 1990 to 2009," American Journal of Evaluation, 32(2).
Dimetrosky, S., N. Lieb, J. Rowberry, Peters, J.S. & R. Scholl (2014), New York Products Program: Market Characterization, Assessment, Process, and Market-Based Impact Evaluation. A final report prepared for New York State Energy Research and Development Authority (NYSERDA).
Donaldson, S.I. (2007), Program Theory-Driven Evaluation Science. New York, NY: Lawrence Erlbaum.
Donaldson, S.I. & M.W. Lipsey (2006), “Roles for Theory in Contemporary Evaluation Practice: Developing Practical Knowledge.” In: I. Shaw, J.C. Greene, & M.M. Mark (Eds.), The Handbook of Evaluation: Policies, Programs, and Practices (pp. 56-75). London, UK: Sage.
Groves, R.M (2004), Survey Errors and Survey Costs. Hoboken, New Jersey: John Wiley & Sons, Inc.
Lipsey, M.W., P.H. Rossi & H.E. Freeman (2004), Evaluation: A Systematic Approach (7th ed.). Thousand Oaks, CA: Sage.
Lyberg, L., P. Biemer, M. Collins, E. de Leeuw, C. Dippo, N. Schwarz & D. Trewin (1997), Survey Measurement and Process Quality. New York: John Wiley & Sons.
Malinick, T., A. Salazar, T. Kisch, and R. Ridge (2015), Calculation Methodology for Unit Energy Consumption (UEC) and Unit Energy Savings (UES) for the Retail Plug-Load Portfolio (RPP) Program. A white paper prepared for Pacific Gas and Electric Company, Engineering Services. January 30, 2015.
Patton, M.Q. (2008), Utilization-Focused Evaluation (4th ed.). Thousand Oaks, CA: Sage.
Prahl, R. & K. Keating (2014), Building a Policy Framework to Support Energy Efficiency Market Transformation in California. Final Review Draft. California Public Utilities Commission.
Navitas (2013), PG&E Retail Plug-Load Portfolio (RPP) Trial Plan. Prepared for PG&E by Navitas.
Rogers, P.J. (2000), “Program Theory Evaluation: Not whether programs work but how they work.” In: D.L. Stufflebeam, G.F. Madaus, and T. Kelleghan (Eds.), Evaluation Models:

188
PG&E’s Emerging Technologies Program ET13PGE8052
Viewpoints on Educational and Human Services Evaluation, (pp. 209-232). Boston, MA: Kluwer.
Rogers, P.J. (2008), “Using Program Theory to Evaluate Complicated and Complex Aspects of Interventions.” Evaluation. 14: 29-48.
Rogers, P.J., A. Petrosino, T.A. Huebner & T.A. Hacsi. (2000), “Program Theory Evaluation: Practice, Promise, and Problems.” In: P.J. Rogers, T.A. Hacsi, A. Petrosino, & T.A. Huebner (Eds.), Program Theory in Evaluation: Challenges and Opportunities (pp. 5–14). New Directions for Evaluation, No. 87. San Francisco, CA: Jossey-Bass.
Rosenberg, M. & L. Hoefgen (2009), Market Effects and Market Transformation: Their Role in Energy Efficiency Program Design and Evaluation. Prepared for the California Institute for Energy and Environment. p. 48. Available at: http://uc-ciee.org/downloads/mrkt_effts_wp.pdf
Roth, K. & K. McKenney. 2007. Energy Consumption by Consumer Electronics in U.S. Residences. Final Report to the Consumer Electronics Association (CEA) by TIAX, LLC. Retrieved from: http://www.ce.org/CorporateSite/media/Government-Media/Green/Energy-Consumption-by-Consumer-Electronics-in-U-S-Residences.pdf
TecMarket Works (2004), The California Evaluation Framework. Prepared for the Southern California Edison Company.
TecMarket Works Team (2006), California Energy Efficiency Evaluation Protocols: Technical, Methodological, and Reporting Requirements for Evaluation Professionals. Prepared for the California Public Utilities Commission.
Weiss, C.H. (1995), “Nothing as Practical as Good Theory: Exploring Theory-based Evaluation for Comprehensive Community Initiatives for Children and Families.” In: J. Connell, A. Kubisch, L.B. Schorr, & C.H. Weiss (Eds.), New Approaches to Evaluating Community Initiatives: Volume 1, Concepts, Methods, and Contexts (pp. 65-92). New York, NY: Aspen Institute.
Weiss, C.H. (1997a), “How Can Theory-based Evaluations Make Greater Headway?” Evaluation Review, 21: 501-524.
Weiss, C.H. (1997b), “Theory-based Evaluation: Past, Present and Future.” In: D.J. Rog & D. Fournier (Eds.), Progress and Future Directions in Evaluation: Perspectives on Theory, Practice and Methods (pp. 55-41). New Directions for Evaluation, No. 76. San Francisco, CA: Jossey-Bass.
Weiss, C.H. (2004), On Theory-based Evaluation: Winning Friends and Influencing People. The Evaluation Exchange, IX, 1-5.
Yarbrough, D.B., L.M. Shulha, R.K. Hopson & F.A. Caruthers (2011), The Program Evaluation Standards: A Guide for Evaluators and Evaluation Users. Los Angeles, CA: Sage Publications.