methods for p analysis, j.l. kovar and g.m. pierzynski (eds)€¦ · methods for p analysis, j.l....
TRANSCRIPT
Methods for P Analysis, J.L. Kovar and G.M. Pierzynski (eds)
ii
Methods of Phosphorus Analysis for Soils,
Sediments, Residuals, and Waters Second Edition
Southern Cooperative Series Bulletin No. #
June, 2009
URL: http://www.sera17.ext.vt.edu/Documents/P_Methods2ndEdition2009.pdf
Contact Information
Editors John L. Kovar
USDA-ARS National Soil Tilth Laboratory 2110 University Blvd. Ames, IA 50011-3120
Gary M. Pierzynski
Department of Agronomy 2004 Throckmorton Plant Sciences Ctr.
Kansas State University Manhattan, KS 66506-5501
ISBN:
This bulletin, from the joint Southern Extension/Research Activity - Information Exchange Group (SERA-IEG) 17, included extension specialists and research scientists. It is being published with the approval of the Southern Association of Agricultural Experiment Station Directors (SAAESD) and the Association of Southern Region Extension Directors (ASRED). Under the procedure of cooperative publications, it becomes in effect, a separate publication for each of the cooperating stations. Employment and program opportunities of cooperating institutions are offered to all people regardless of race, color, national origin, sex, age, or disability.
Electronic Document Prepared by: Steven C. Hodges Publishing Institution: Virginia Tech University
Methods for P Analysis, J.L. Kovar and G.M. Pierzynski (eds)
iii
ABSTRACT The relative contribution of phosphorus (P) from agricultural nonpoint sources to surface water quality problems has increased in recent years as point sources of P have been reduced significantly. Phosphorus contributes to eutrophication, a process characterized by increased growth of undesirable algae and aquatic weeds, followed by oxygen shortages as the biomass decomposes. Eutrophication restricts water use for fisheries, recreation, industry, and human consumption. The focus of attention on P has increased the demand for information on methods of analysis of soil, water, and residual materials for environmentally relevant forms of P. The purpose of this publication is to present these methods in a single document. Previously, the methods have appeared across a wide variety of documents or only in the scientific literature. It is not the intent of this publication to define a uniform set of recommended methods for agronomic soils tests or for testing water and residual materials. The methods presented in this manual are intended solely to provide a set of uniform testing methods for environmental scientists working across an enormous range of soil and climatic conditions, with the hope that comparable methods may lead to improved communication and understanding of this complex issue.
Methods for P Analysis, J.L. Kovar and G.M. Pierzynski (eds)
iv
FOREWORD As scientists focus on the fate of phosphorus applied to agricultural lands, it has become increasingly clear that a uniform set of testing methods is needed to enable comparison of results across county, state, regional, and even national boundaries. By contrast, soil testing developed with a high priority on meeting local needs. As a result, many local variations in extractants and laboratory procedures have been developed to achieve timely analysis and improved correlation of soil test results with plant responses within well-defined regions. Over time, enormous amounts of information on individual soils, crops, and extractants have been collected using these localized modifications and laboratory methods. Soil testing labs cannot easily change from one extractant to another. The cost of repeating the calibration experiments for many soils and crops is prohibitively expensive, and the changes would initially preclude users from comparing results across years. Even so, a set of standard reference methods can be useful for laboratories wishing to consider a new analysis for a particular element, and for comparing results across laboratories. In 1992, SERA-IEG-6 selected 15 reference procedures for soil testing laboratories in the southern region. Criteria for selection included the accuracy of the method in predicting crop responses, and general acceptability by workers in the soil testing field. This publication in no way attempts to define a uniform set of recommended methods for agronomic soil tests. The methods presented here are intended solely to provide a set of uniform testing methods for environmental scientists working across an enormous range of soil and climatic conditions, with the hope that comparable methods may lead to improved communication and understanding of this complex issue. For more information on agronomic soil testing methods, and the source of many of the procedures described here, the reader should refer to recent bulletins compiled by the various regional committees working on nutrient analysis of soils, plants, water, and waste materials (SERA-IEG-6, NCERA-13 and NEC-67). More detailed information on analysis of animal manures can be found in the publication “Recommended Methods for Manure Analysis – A3769” (www.sera17.ext.vt.edu/Documents/Recommended_Methods_Manure_Analysis.pdf).
FOREWORD FOR SECOND EDITION During the eight years since the original publication became available, the authors of many of the chapters in the manual learned that some editing, and in some cases clarification, was needed. The development of this 2nd Edition presented that opportunity. This publication now consists of 22 chapters, three of which are new.
Methods for P Analysis, J.L. Kovar and G.M. Pierzynski (eds)
v
CONTRIBUTORS Methods for Phosphorus Analysis for Soils, Sediments, Residuals, and Waters – 2nd Edition
M.R. Bender Department of Environmental and Technological Studies St. Cloud State University 720 4th Avenue South St. Cloud, MN 56301 W.J. Chardon ALTERRA, Wageningen UR Soil Science Centre PO Box 47, 6700 AA Wageningen, The Netherlands F.J. Coale Department of Environmental Science & Technology 1109 H. J. Patterson Hall University of Maryland College Park, MD 20742 D.A. Crouse Department of Soil Sciences Box 7619 North Carolina State University Raleigh, NC 27695-7619 T.C. Daniel Crop, Soil & Environmental Science 115 Plant Sciences Bldg. University of Arkansas Fayetteville, AR 72701-1201 T.H. Dao USDA-ARS BARC-East, Bldg. 306-102 Beltsville, MD 20705 M.L. Self-Davis Crop, Soil & Environmental Sciences 115 Plant Sciences Bldg. University of Arkansas Fayetteville, AR 72701-1201
A.C. Edwards Macaulay Land Use Research Institute Craigiebuckler, Aberdeen AB15 8QH, UK D.A. Graetz Soil and Water Science 106 Newell Hall University of Florida Gainesville, FL 32611-0510 S.C. Hodges Crop and Soil Environmental Sciences 330 Smyth Hall Virginia Polytechnic Institute and State University Blacksburg, VA 24061 P.M. Haygarth Institute of Grassland & Environmental Research North Wyke Research Station Okehampton, Devon EX20 2SB UK B.C. Joern Department of Agronomy 1150 Lilly Hall Purdue University West Lafayette, IN 47907-1150 P.J.A. Kleinman USDA-ARS Pasture Systems and Watershed Management Research Laboratory Curtin Road University Park, PA 16802-3702
Methods for P Analysis, J.L. Kovar and G.M. Pierzynski (eds)
vi
J.L. Kovar USDA-ARS National Soil Tilth Laboratory 2110 University Boulevard Ames, IA 50011-3120 K. Kpomblekou-A Department of Agricultural and Environmental Sciences Tuskegee University Tuskegee, AL 36088 A.B. Leytem USDA-ARS Northwest Irrigation and Soils Research Laboratory 3793 N. 3600 E. Kimberly, ID 83341 R.O. Maguire Crop and Soil Environmental Sciences Virginia Polytechnic Institute and State University Blacksburg, VA 24061 P.A. Moore, Jr. USDA-ARS 115 Plant Sciences Bldg. University of Arkansas Fayetteville, AR 72701-1201 V.D. Nair Soil and Water Science 106 Newell Hall University of Florida Gainesville, FL 32611-0510 G.M. Pierzynski Department of Agronomy 2004 Throckmorton Plant Sciences Ctr. Kansas State University Manhattan, KS 66506-5501
D.H. Pote USDA-ARS 6883 South State Highway 23 Booneville, AR 72927 O.F. Schoumans ALTERRA, Wageningen UR Centre for Water and Climate PO Box 47, 6700 AA Wageningen, The Netherlands A.N. Sharpley Crop, Soil & Environmental Sciences 115 Plant Sciences Bldg. University of Arkansas Fayetteville, AR 72701-1201 J. T. Sims Department of Plant & Soils 531 South College Ave. University of Delaware Newark, DE 19717-1303 D.M. Sullivan Department of Crop and Soil Science 3017 Agricultural and Life Science Building Oregon State University Corvallis, OR 97331
B.L. Turner Smithsonian Tropical Research Institute Apartado 0843-03092 Balboa, Ancon Republic of Panama A.M. Wolf Crop and Soil Sciences 111 Agricultural Analytical Services Laboratory Penn State University University Park, PA 16802

Methods for P Analysis, J.L. Kovar and G.M. Pierzynski (eds)
vii
C.W. Wood Department of Agronomy and Soils 202 Funchess Hall Auburn University Auburn University, AL 36849-5412
H. Zhang Department of Plant Sciences Oklahoma State University Stillwater, OK 74078
Methods for P Analysis, J.L. Kovar and G.M. Pierzynski (eds)
viii
TABLE OF CONTENTS Methods of Phosphorus Analysis for Soils, Sediments, Residuals, and Waters: Introduction.................................................................................... 1
Gary M. Pierzynski, Kansas State University Andrew N. Sharpley, University of Arkansas John L. Kovar, USDA-ARS, Ames, IA
SOIL ............................................................................................................... 5 Soil Sample Collection, Handling, Preparation, and Storage .................. 6
Frank J. Coale, University of Maryland Soil Test Phosphorus: Principles and Methods ........................................ 9
J. Thomas Sims, University of Delaware A Phosphorus Sorption Index.................................................................... 20
J. Thomas Sims, University of Delaware Water- or Dilute Salt-Extractable Phosphorus in Soil............................ 22
M.L. Self-Davis, University of Arkansas P.A. Moore, Jr., USDA-ARS, Fayetteville, AR B.C. Joern, Purdue University
Phosphorus Extraction with Iron Oxide-Impregnated Filter Paper (Pi test) ............................................................................................................... 25
W. J. Chardon, Alterra, Wageningen UR. Wageningen, The Netherlands Determination of the Degree of Phosphate Saturation in Noncalcareous Soils............................................................................................................... 29
O.F. Schoumans, Alterra, Wageningen UR. Wageningen, The Netherlands Phosphorus Sorption Isotherm Determination........................................ 33
D.A. Graetz, University of Florida V.D. Nair, University of Florida
Bioavailable Phosphorus in Soil ................................................................ 38 Andrew N. Sharpley, University of Arkansas
Total Phosphorus in Soil ............................................................................ 44 April Leytem, USDA-ARS, Northwest Irrigation and Soils Research Laboratory Kokoasse Kpomblekou-A, Tuskegee University
Fractionation of Soil Phosphorus .............................................................. 50 Hailin Zhang, Oklahoma State University John L. Kovar, USDA-ARS National Soil Tilth Laboratory Procedures (see flow chart, Fig.2)
Phosphorus Fractionation in Flooded Soils and Sediments ................... 61 Philip Moore, USDA-ARS, Fayetteville, AR Frank Coale, University of Maryland
RESIDUAL MATERIALS AND MANURES ......................................... 72 Sampling Techniques for Nutrient Analysis of Animal Manures.......... 73
R.O. Maguire and S.C. Hodges, Virginia Tech University D.A. Crouse, North Carolina State University
Methods for P Analysis, J.L. Kovar and G.M. Pierzynski (eds)
ix
Water-Extractable Phosphorus in Animal Manure and Biosolids ........ 76 Ann M. Wolf, Pennsylvania State University Philip A. Moore, Jr., USDA-ARS, Fayetteville, AR Peter J.A. Kleinman, USDA-ARS, University Park, PA Dan M. Sullivan, Oregon State University
Total Phosphorus in Residual Materials .................................................. 81 M.R. Bender, St. Cloud State University C.W. Wood, Auburn University
Bioactive Phosphorus Fractions in Animal Manure, Soil, and Extracts of Soils and Manures .................................................................................. 87 Phosphorus Speciation in Soils and Manures by Solution 31P NMR Spectroscopy................................................................................................ 95
Benjamin L. Turner, Smithsonian Tropical Research Institute, Republic of Panama April B. Leytem, USDA-ARS, Kimberly, ID
WATER ..................................................................................................... 101 Water Sample Collection, Handling, Preparation and Storage........... 102
P.M. Haygarth, North Wyke, Okehampton, England A.C. Edwards, Nether Backhill, Ardallie, By Peterhead, Scotland
Dissolved Phosphorus in Water Samples ............................................... 110 D.H. Pote, USDA-ARS, Booneville, AR T.C. Daniel, University of Arkansas
Total Phosphorus and Total Dissolved Phosphorus in Water Samples..................................................................................................................... 113
D.H. Pote, USDA-ARS, Booneville, AR T.C. Daniel and P.B. DeLaune, University of Arkansas
Using the Iron Oxide Method to Estimate Bioavailable Phosphorus in Runoff......................................................................................................... 118
R.G. Myers, Kansas State University G.M. Pierzynski, Kansas State University
Methods for P Analysis, J.L. Kovar and G.M. Pierzynski (eds)
1
Methods of Phosphorus Analysis for Soils, Sediments, Residuals, and Waters: Introduction Gary M. Pierzynski, Kansas State University Andrew N. Sharpley, University of Arkansas John L. Kovar, USDA-ARS, Ames, IA
Phosphorus (P) has long been recognized as an essential input for plant and animal
production. Dramatic improvements in the economic efficiency of grain and animal protein production during the last 50 years have been coupled with an increasing incidence and severity of freshwater eutrophication. Eutrophication is the process of increasing organic enrichment or biological productivity of a water body and is generally accelerated by greater inputs of P. In most cases, eutrophication restricts water use for fisheries, recreation, and industry due to the increased growth of undesirable algae and aquatic weeds followed by oxygen shortages resulting from their death and decomposition. Moreover, an increasing number of surface waters have experienced periodic and massive harmful algal blooms (e.g., cyanobacteria and Pfiesteria), which contribute to summer fish kills, unpalatability of drinking water, formation of carcinogens during water chlorination, and links to neurological impairment in humans.
As freshwater eutrophication is usually accelerated by P, much political and research attention has been directed to developing strategies to reduce the risk of P loss from agricultural nonpoint sources. To a large extent, these strategies depend on the accurate measurement of forms of P in soil, water, and residual materials, often seen as a source of surface water P. In comparison with point sources of P, such as wastewater treatment plants and industrial facilities, there has been less success in decreasing nonpoint sources of P, primarily because they are difficult to identify and thus control. Also, recent advances in analytical equipment used in soil P testing have improved recommendations for land application of P (as fertilizer and manure) and contributed to increased cost-effective grain and forage production. In the last decade, there has been increased use of soil test P as an indicator of potential environmental risk for P enrichment of runoff and possible acceleration of eutrophication.
The purpose of this manual is to present in a single document methods for analysis of soil, water, and residual materials for environmentally relevant P forms. This manual is a revision of the original SERA-17 Methods of Phosphorus Analysis for Soils, Sediments, Residuals, and Waters published in 2000 (Pierzynski, 2000). Most chapters have been revised to include new information. New chapters on determining bioactive P fractions in soil and manures and on P speciation by 31P Nuclear Magnetic Resonance (NMR) spectroscopy have been included. A chapter addressing water-extractable P in animal manures and biosolids was re-written.
Previously, the methods presented in this manual have appeared in separate publications for soil or water, or have only appeared in individual technical papers. In particular, the reader is referred to a series of position papers produced by the SERA-17 Information Exchange Group on matters related to sampling and analysis of soil, water, and residuals available at http://www.sera17.ext.vt.edu/SERA_17_Workgroups_Policy_Publications.htm). Commercial and research laboratories now must deal with the analysis of a wider range of sample types for more diverse agronomic and environmental uses. This has caused confusion over selection of the most appropriate method for a specific need and can lead to inappropriate recommendations for
Methods for P Analysis, J.L. Kovar and G.M. Pierzynski (eds)
2
P management. Thus, there is an urgent need for a comprehensive publication containing all of the currently available procedures for P analysis in soil, water, and residual materials.
The mainstay of P analysis for all solution types has been use of colorimetric procedures, most notably Murphy and Riley (1962). Colorimetric procedures are sensitive, reproducible, and lend themselves to automated analysis. In addition, the methods can accommodate water samples, digest solutions, and extracts. The basic Murphy and Riley procedure is presented by Sharpley (2008) in this bulletin. Variations in the procedure are incorporated into other sections, despite the appearance of redundancy. Modifications to the procedures are often method-specific.
Inductively coupled plasma (ICP) spectrophotometry is also now commonly used for P determination, particularly in routine soil P tests offered by public (Land Grant University) and commercial laboratories. The use of ICP has increased as the use of multi-element soil extractants becomes more popular. Results from colorimetric analyses are not always directly comparable to those from ICP, because ICP estimates the total amount of P in a solution, while the colorimetric procedures measure P that can react with the color developing reagent. Moreover, there are certain limitations that must be considered when data generated by ICP are compared (de Boer et al., 1998). For example, there are matrix effects, so that the type of extract has to be taken into account. Other elements in the water or extract can also interfere with the number generated. Even the type of instrument (axial versus radial view) and the wavelength (178 nm versus 213 nm) used for determination can cause variation in the data generated.
The use of solution 31P NMR spectroscopy of P in soil and residual materials has allowed identification of P forms in animal manures and confirmed P forms estimated by commonly used chemical extractants, such as sequential fractionation schemes. As previously mentioned, the use of solution 31P NMR is described by Turner and Leytem (2008) in one of the new chapters of this manual. Use of the procedure has enabled more accurate determination of organic forms of P in soil and residual materials. In addition, the use of synchrotron-based techniques has provided insight into both organic and inorganic forms of P in soil and residual materials. Descriptions of these approaches is beyond the scope of this bulletin and the reader is referred to Beauchemin et al. (2003), Toor et al. (2005), and Shober et al. (2006) as examples. Clearly, synchrotron-based techniques will play an increasing role in the study of P in natural systems. These analytical advances have been critical in gaining a more detailed understanding of soil P transformations and reaction products following land application of residual materials. This information has helped assess the fate, reactivity, and behavior of specific forms of P and the implications of land applying certain materials on environmental risk response.
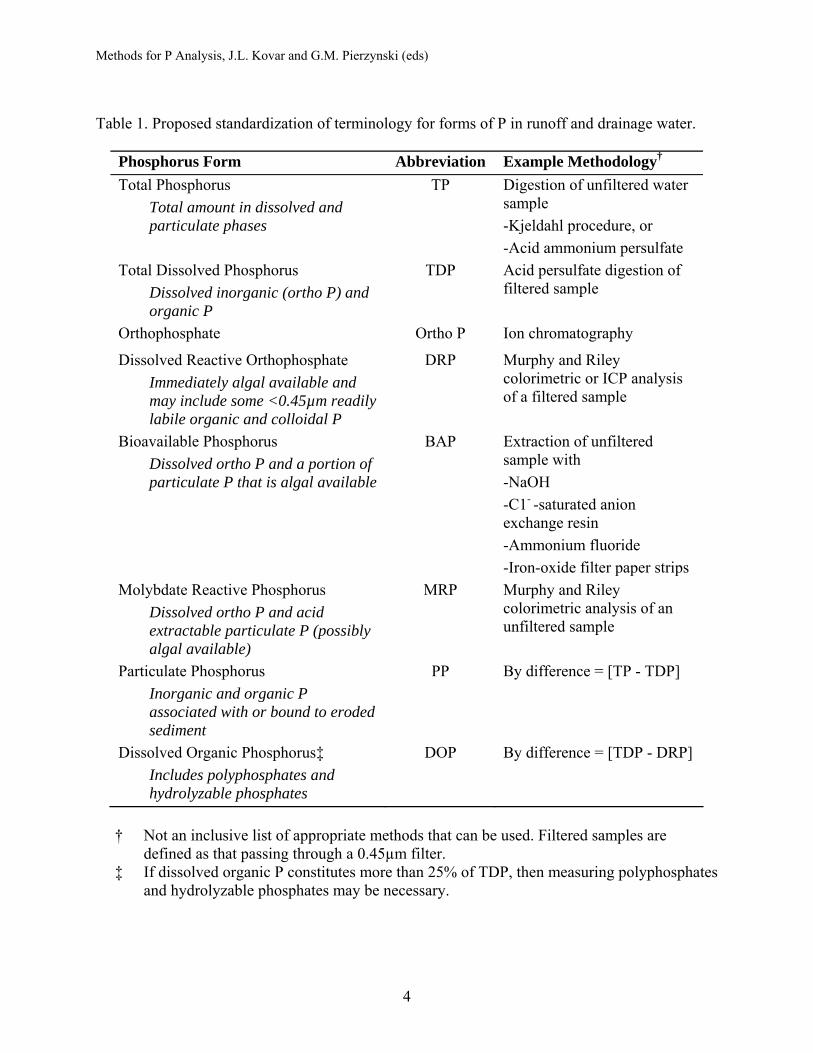
Nomenclature for forms of P in soil, water, or residual materials varies in the literature, particularly for operationally-defined forms of P in water samples. In a chapter on water sample collection, handling, preparation and storage, Haygarth and Edwards (2008) have provided a systematic classification scheme of operationally defined forms of P in water samples. In addition, Table 1 at the end of this chapter presents an abbreviated description of forms of P in runoff or drainage water that have been used in the literature and that we propose as a standardized terminology. Phosphorus forms in soils are also difficult to standardize with any reasonable consensus, due to the number of different disciplines involved (e.g., soil scientists, agronomists, ecologists, biologists, limnologists, hydrologists). Thus, beyond using total soil P, we strongly encourage the use of specific chemical terminology (e.g., water-extractable, CaCl2-extractable, 0.1 M NaOH-extractable, Mehlich-extractable P, etc.), which has been clearly
Methods for P Analysis, J.L. Kovar and G.M. Pierzynski (eds)
3
defined. Any other terminology, which may be used in conclusions and interpretations (e.g., desorbable, available, bioavailable, sorbed P etc.), must also be clearly defined.
Traditionally, extractable P has been used by soil testing laboratories to describe the amount of P in soil available for crop uptake and to determine the probability of crop response to added P, and thereby fertilizer P requirements. Bioavailable P is often used to describe P in soil or sediment that is available for uptake by algae or macrophytes in surface waters. To some extent, bioavailable P is also used to describe the availability of soil P to plants (Barber, 1995). There are also a large number of soil P extraction methods that have been designed to account for various soil types and mechanisms controlling the chemistry of soil P. For example, numerous soil extractants are available for acid soils, where Al and Fe dominate P chemistry, and basic or calcareous soils, where Ca dominates soil P reactions.
Clearly, there is a potential for confusion by the uninitiated. Hence, it is essential to accurately define how P was measured in soil, water, or residual material samples to avoid potential misinterpretations or inappropriate recommendations. This publication documents in detail the analytical methods available, their recommended uses, and some information on interpretation.
References: Barber, S.A. 1995. Soil nutrient bioavailability – A mechanistic Approach 2nd ed. John Wiley,
New York. Beauchemin, S., D. Hesterbeg, J. Chou, M. Beauchemin, R. R. Simard, and D.E. Sayers. 2003.
Speciation of phosphorus in phosphorus-enriched agricultural soils using x-ray absorption near-edge structure spectroscopy and chemical fractionation. J. Environ. Qual. 32:1809-1819.
de Boer, J.L.M., U. Kohlmeyer, P.M. Breugem, and T. van der Velde-Koerts. 1998. Determination of total dissolved phosphorus in water samples by axial inductively coupled plasma emission spectrometry. J. Anal. Chem. 360:132-136.
Haygarth, P.M., and A.C. Edwards. 2008. Water sample collection, handling, preparation, and storage. In J.L. Kovar and G.M. Pierzynski (eds.), Methods for Phosphorus Analysis for Soils, Sediments, Residuals, and Waters. 2nd Edition. Southern Cooperative Series Bulletin No.XXX, p. 102-109.
Murphy, J., and J.P. Riley. 1962. A modified single solution method for determination of phosphate in natural waters. Anal. Chim. Acta. 27:31-36.
Pierzynski, G.M. (ed.). 2000. Methods for phosphorus analysis for soils, sediments, residuals, and waters. Southern Cooperative Series Bulletin No. 396, 110 pages.
Sharpley, A.N. 2008. Bioavailable phosphorus in soil. In J.L. Kovar and G.M. Pierzynski (eds.), Methods for Phosphorus Analysis for Soils, Sediments, Residuals, and Waters. 2nd Edition. Southern Cooperative Series Bulletin No.XXX, p. 38-43.
Shober, A.L., D.L. Hesterberg, J.T. Sims, and S. Gardner. 2006. Characterization of phosphorus species in biosolids and manures using XANES spectroscopy. J. Environ. Qual. 35: 1983-1993.
Toor, G.S., J. D. Peak, and J.T. Sims. 2005. Phosphorus speciation in broiler litter and turkey manure from modified diets. J. Environ. Qual. 34: 687-697.
Turner, B.L., and A.B. Leytem. 2008. Phosphorus speciation in soils and manures by solution 31P NMR spectroscopy. In J.L. Kovar and G.M. Pierzynski (eds.), Methods for Phosphorus Analysis for Soils, Sediments, Residuals, and Waters. 2nd Edition. Southern Cooperative Series Bulletin No.XXX, p. 95-101.
Methods for P Analysis, J.L. Kovar and G.M. Pierzynski (eds)
4
Table 1. Proposed standardization of terminology for forms of P in runoff and drainage water.
Phosphorus Form Abbreviation Example Methodology† Total Phosphorus
Total amount in dissolved and particulate phases
TP Digestion of unfiltered water sample -Kjeldahl procedure, or -Acid ammonium persulfate
Total Dissolved Phosphorus Dissolved inorganic (ortho P) and organic P
TDP Acid persulfate digestion of filtered sample
Orthophosphate Ortho P Ion chromatography
Dissolved Reactive Orthophosphate Immediately algal available and may include some <0.45µm readily labile organic and colloidal P
DRP
Murphy and Riley colorimetric or ICP analysis of a filtered sample
Bioavailable Phosphorus Dissolved ortho P and a portion of particulate P that is algal available
BAP Extraction of unfiltered sample with -NaOH -C1- -saturated anion exchange resin -Ammonium fluoride -Iron-oxide filter paper strips
Molybdate Reactive Phosphorus Dissolved ortho P and acid extractable particulate P (possibly algal available)
MRP Murphy and Riley colorimetric analysis of an unfiltered sample
Particulate Phosphorus Inorganic and organic P associated with or bound to eroded sediment
PP By difference = [TP - TDP]
Dissolved Organic Phosphorus‡ Includes polyphosphates and hydrolyzable phosphates
DOP By difference = [TDP - DRP]
† Not an inclusive list of appropriate methods that can be used. Filtered samples are
defined as that passing through a 0.45µm filter. ‡ If dissolved organic P constitutes more than 25% of TDP, then measuring polyphosphates
and hydrolyzable phosphates may be necessary.
Methods for P Analysis, J.L. Kovar and G.M. Pierzynski (eds)
5
SOIL
Methods for P Analysis, J.L. Kovar and G.M. Pierzynski (eds)
6
Soil Sample Collection, Handling, Preparation, and Storage Frank J. Coale, University of Maryland
Sample Collection: The collection of a representative and reliable soil sample for phosphorus (P) analysis
requires predetermination of sampling depth, position relative to nutrient application patterns, and sampling intensity within the field. Greater detail on sample collection strategies and methods can be found in publications by Carter and Gregorich (2007), Tan (2005), and Petersen and Calvin (1996).
The appropriate soil sampling depth is dependent upon the planned interpretation of the analytical data. If investigation of P distribution or concentration with depth is a specified research objective, three factors must be considered when determining the appropriate sampling depth: 1) influence of changes in soil morphology with depth (i.e., horizonation); 2) influence of surface soil management (e.g., tillage); and 3) necessity to maintain sample collection depth uniformity across numerous sites.
Sample collection depth based on observed morphological horizon depths is quite useful when attempting to associate soil P measurements with soil physical properties. This technique may generate very reliable data for a particular, well-defined location, but this laborious task is not very practical when a research project focuses on more than a few soils or when the data will be subjected to broader, perhaps watershed-scale, interpretation.
Depth of tillage will dramatically impact soil P distribution with depth. Tillage depth is seldom constant across a given field. Sampling depths should include soil collected from a depth confidently within the tillage zone and excluding soil from below the tillage zone. A second transitional depth should be collected that is expected to be variably affected by tillage and includes the lower tillage boundary. Deeper sampling depths should not be directly impacted by physical tillage activity.
Relating soil physical and chemical properties to the potential for P transport with surface runoff water requires a different approach to soil sample collection. Sharpley (1985) studied five soils of varying physical and chemical properties and found that effective depth of interaction between surface soil and runoff ranged from 2 to 40 mm. The effective depth of interaction varied with soil type, surface slope, rainfall intensity, and crop residue. For most agricultural soils, samples collected to a depth of 20 mm would accurately define the effective depth of runoff interaction generated by moderate to high rainfall intensity (< 50 mm/h). For medium to coarse textured soils on steeper slopes (>12 %) that are subjected to high intensity rainfall (> 100 mm /h), soils should be sampled to a depth of 40 mm in order to more accurately relate the potential for P transport with surface runoff to soil physical and chemical properties. Recommended soil sampling intensity is usually between 10 and 30 subsamples per composite sample (Whitney et al., 1985; Kitchen et al., 1990; Coale, 1997). A single composite sample may represent a single research plot or an entire production field, but generally not more than 10 ha.
Discrete nutrient application patterns in a field can increase the complexity of appropriate soil sample collection procedures. In a review of positional P availability resulting from band application of fertilizer P, Sharpley and Halvorson (1994) stated that collection of 15 random samples (Ward and Leikam, 1986; Shapiro, 1988) to 30 random samples (Hooker, 1976) were adequate to reflect crop P availability in conventionally tilled fields where previous P fertilizer bands exist. For no-till or minimum-till soils containing residual P fertilizer bands in which the
Methods for P Analysis, J.L. Kovar and G.M. Pierzynski (eds)
7
location of the P bands is known, sampling to include one “in-the-band” soil sample for every 20 “between-the-band” samples for 76 cm band spacing, and one “in-the-band” sample for every 8 “between-the-band” samples for 30 cm band spacing, will accurately reflect the mean soil P status of the field (Kitchen et al., 1990). Twenty to 30 subsamples per composite are adequate. When the location of the P bands is not known, collection of 20 to 30 subsamples per composite is also adequate but paired subsamples should be collected where the location of the first subsample of the pair is completely random and the second subsample of the pair is located 50% of the band-spacing distance from the first, perpendicular to the band direction (Kitchen et al., 1990).
Sample Handling, Preparation, and Storage: Air-drying should be satisfactory for investigations into relative changes in soil P
concentrations in response to imposed treatments or for routine comparative P analyses. Soil samples should be air-dried (25 to 30oC) and crushed to pass a 2 mm sieve. Air-dried and crushed soil samples are stable at room temperature. Air-drying may not be suitable for determination of the absolute quantity of the various P fractions in soils. Air-drying may artificially elevate the quantity of soluble reactive P above in situ conditions. Bartlett and James (1980) studied P solubility in the surface soil of a loamy fine sand and found water-soluble P concentrations to be five times higher in air-dried samples (~30 mg P L-1) than in samples stored at field moisture (~5 mg P/ L). The effect of air-drying was only partially reversed by rewetting and incubating the air-dried soil for one month (~20 mg P L-1). Water-soluble P in rewetted soil samples that had previously been air-dried was shown to decrease during three months of storage at 20oC (Bartlett and James, 1980). For quantitative characterization studies, soil and sediment samples should be stored at field moisture content under refrigeration, between 0 and 4oC. Soil and sediment samples should not be stored frozen (<0oC), because the water-soluble proportion of total P increases after freezing (Mack and Barber, 1960). Mixing moist soil samples to achieve homogeneity is difficult, and careful attention should be paid to ensure thorough mixing prior to subsampling. Moist soils are also difficult to sieve, but large particles (> 2mm) should be removed from the sample prior to analysis.
References: Bartlett, R. and B. James. 1980. Studying dried, stored soil samples - some pitfalls. Soil Sci. Soc.
Am. J. 44:721-724. Carter, M.R., and E.G. Gregorich. 2007. Soil sampling and methods of analysis, second edition.
CRC Press, Boca Raton, FL. Coale, F. J. (ed.) 1997. Chesapeake Bay region nutrient management training manual. USEPA
Chesapeake Bay Program, Annapolis, MD. Hooker, M.L. 1976. Soil sampling intensities required to estimate available N and P in five
Nebraska soil types. MS Thesis, Univ. Nebraska, Lincoln, NE. Kitchen, N.R., J.L. Havlin, and D.G. Westfall. 1990 Soil sampling under no-till banded
phosphorus. Soil Sci. Soc. Am. J. 54:1661-1995. Mack, A.R. and S.A. Barber. 1960. Influence of temperature and moisture on soil phosphorus. I.
Effect on soil phosphorus fractions. Soil Sci. Soc. Am. Proc. 24:381-385. Petersen, R.G., and L.D. Calvin. 1996. Sampling. p. 1-18. In: D.L. Sparks (ed.) Methods of soil
analysis: Chemical methods. Part 3. SSSA No.5. ASA-CSSA-SSSA, Madison, WI.
Methods for P Analysis, J.L. Kovar and G.M. Pierzynski (eds)
8
Shapiro, C.A. 1988. Soil sampling fields with a history of fertilizer bands. Soil Sci. News, Nebraska Coop. Ext. Serv., Vol. 10, No. 5.
Sharpley, A.N. 1985. Depth of surface soil-runoff interaction as affected by rainfall, soil slope, and management. Soil Sci. Soc. Am. J. 49:1010-1015.
Sharpley, A.N. and A.D. Halvorson. 1994. The management of soil phosphorus availability and its impact on surface water quality. p. 7-90. In R. Lal and B. A. Stewart (ed.) Soil processes and water quality. Advances in Soil Science. Lewis Publishers, Boca Raton, FL.
Tan, K.H. 2005. Soil sampling, preparation, and analysis: Second edition. CRC Press, Boca Raton, FL.
Ward, R. and D.F. Leikman. 1986. Soil sampling techniques for reduced tillage and band fertilizer application. In Proc. Great Plains Soil Fertility Workshop. March 4-5, 1986. Denver, CO.
Whitney, D.A., J.T. Cope, and L.F. Welch. 1985. Prescribing soil and crop nutrient needs. p. 25-52. In O. P. Engelstad (ed.) Fertilizer technology and use. 3rd ed. SSSA, Madison, WI.
Methods for P Analysis, J.L. Kovar and G.M. Pierzynski (eds)
9
Soil Test Phosphorus: Principles and Methods J. Thomas Sims, University of Delaware
Principles of Soil Testing for Phosphorus: Soil testing for phosphorus (P) has been formally conducted in the United States since the
late 1940s and is now a well-established agronomic practice. The fundamental goal of soil P testing has always been to identify the “optimum” soil test P concentration required for plant growth. The need for additional fertilization or manuring, and the economic return on an investment in fertilizer P, could then be predicted. Sims et al. (1998) stated that other objectives of soil P testing have been to: (i) “index” the P supplying capacity of soils, thus estimating the time before fertilization would again be required; (ii) group soils, in terms of the likelihood of an economic response to P, based on their physical and chemical properties; and, (iii) most recently, to identify when soils are sufficiently excessive in P to contribute to nonpoint source pollution of surface waters. Bray (1948) proposed that an acceptable agronomic soil P test should have the following characteristics:
• The soil test should extract all or a proportionate amount of the plant-available P from soils with differing chemical and mineralogical properties.
• The soil test should be accurate and rapid. • The P extracted by the soil test should be well correlated with plant P concentration,
plant growth, and the response of the plant to added P in fertilizers or manures. • The soil test should accurately detect differences in soil P concentrations caused by
previous fertilization or manuring.
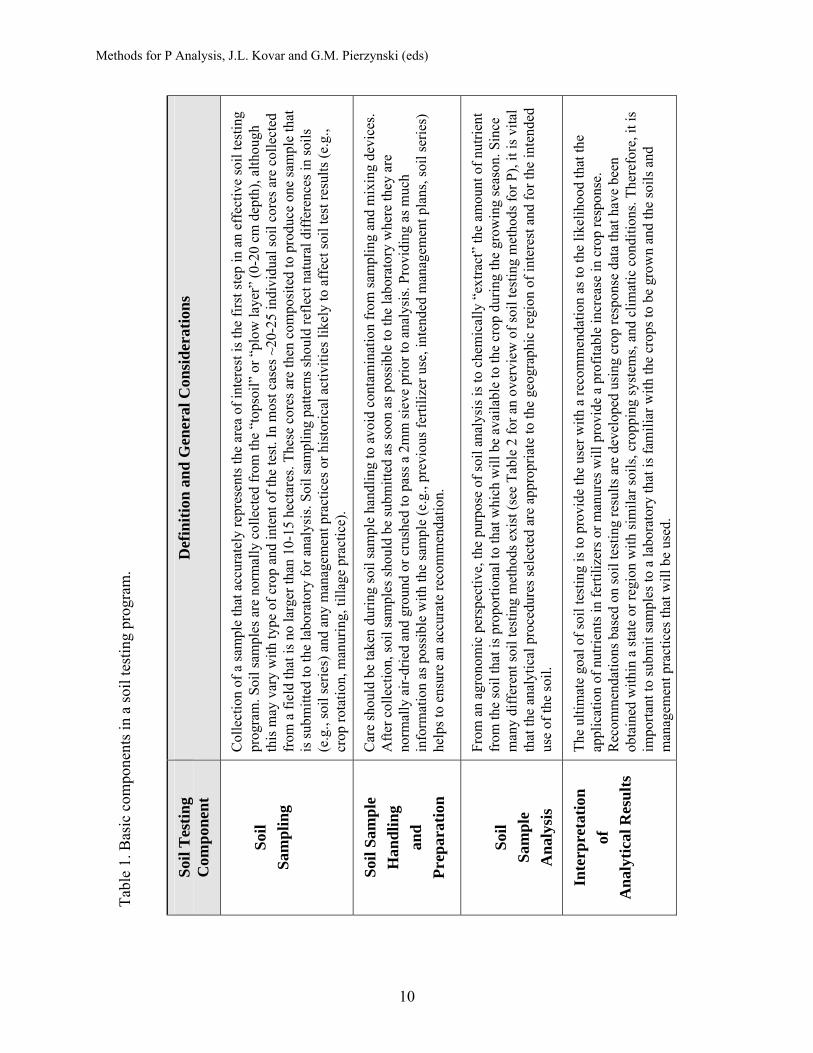
The major steps involved in a soil P testing program are outlined in Table 1 (from Sims et al., 1998). From an agronomic perspective, if these steps are followed, soil P management will be successful and economically beneficial. However, if the goal of soil P testing is to assess the potential environmental impact of soil P, a thorough re-analysis of each step in the soil testing process, from sample collection to interpretation of results should be conducted. Several recent reviews address the principles and practices involved in environmental soil testing for P (Sibbesen and Sharpley, 1997; Sims, 1993; Sims, 1997; Sims, 1998; Sims et al., 2000). Soil sampling was discussed in the previous chapter (Coale, 2008).
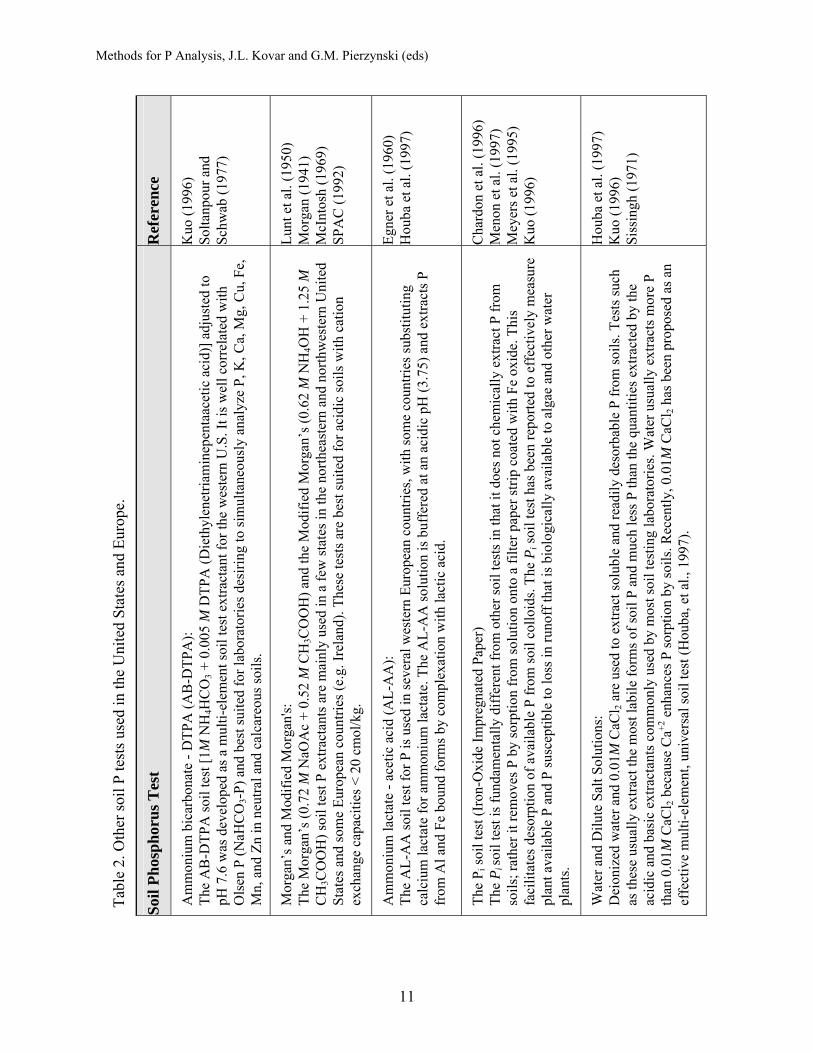
The purpose of the following sections is to provide an overview of the four soil test P methods most commonly used in the United States and Canada today (Bray and Kurtz P-1, Mehlich 1, Mehlich 3, and Olsen P). Detailed descriptions of the laboratory methods and analytical procedures used to determine P by these methods are provided in other references (Carter and Gregorich, 2007; Frank, et al., 1998; Kuo, 1996; SERA-IEG-6, 1992; Sims and Wolf, 1995; SPAC, 1992). Other soil test P methods now used domestically and in other countriesare listed in Table 2. The table also provides references for each method.
Methods for P Analysis, J.L. Kovar and G.M. Pierzynski (eds)
10
Def
initi
on a
nd G
ener
al C
onsi
dera
tions
Col
lect
ion
of a
sam
ple
that
acc
urat
ely
repr
esen
ts th
e ar
ea o
f int
eres
t is t
he fi
rst s
tep
in a
n ef
fect
ive
soil
test
ing
prog
ram
. Soi
l sam
ples
are
nor
mal
ly c
olle
cted
from
the
“top
soil”
or “
plow
laye
r” (0
-20
cm d
epth
), al
thou
gh
this
may
var
y w
ith ty
pe o
f cro
p an
d in
tent
of t
he te
st. I
n m
ost c
ases
~20
-25
indi
vidu
al so
il co
res a
re c
olle
cted
fr
om a
fiel
d th
at is
no
larg
er th
an 1
0-15
hec
tare
s. Th
ese
core
s are
then
com
posi
ted
to p
rodu
ce o
ne sa
mpl
e th
at
is su
bmitt
ed to
the
labo
rato
ry fo
r ana
lysi
s. So
il sa
mpl
ing
patte
rns s
houl
d re
flect
nat
ural
diff
eren
ces i
n so
ils
(e.g
., so
il se
ries)
and
any
man
agem
ent p
ract
ices
or h
isto
rical
act
iviti
es li
kely
to a
ffec
t soi
l tes
t res
ults
(e.g
., cr
op ro
tatio
n, m
anur
ing,
tilla
ge p
ract
ice)
.
Car
e sh
ould
be
take
n du
ring
soil
sam
ple
hand
ling
to a
void
con
tam
inat
ion
from
sam
plin
g an
d m
ixin
g de
vice
s. A
fter c
olle
ctio
n, so
il sa
mpl
es sh
ould
be
subm
itted
as s
oon
as p
ossi
ble
to th
e la
bora
tory
whe
re th
ey a
re
norm
ally
air-
drie
d an
d gr
ound
or c
rush
ed to
pas
s a 2
mm
siev
e pr
ior t
o an
alys
is. P
rovi
ding
as m
uch
info
rmat
ion
as p
ossi
ble
with
the
sam
ple
(e.g
., pr
evio
us fe
rtiliz
er u
se, i
nten
ded
man
agem
ent p
lans
, soi
l ser
ies)
he
lps t
o en
sure
an
accu
rate
reco
mm
enda
tion.
From
an
agro
nom
ic p
ersp
ectiv
e, th
e pu
rpos
e of
soil
anal
ysis
is to
che
mic
ally
“ex
tract
” th
e am
ount
of n
utrie
nt
from
the
soil
that
is p
ropo
rtion
al to
that
whi
ch w
ill b
e av
aila
ble
to th
e cr
op d
urin
g th
e gr
owin
g se
ason
. Sin
ce
man
y di
ffer
ent s
oil t
estin
g m
etho
ds e
xist
(see
Tab
le 2
for a
n ov
ervi
ew o
f soi
l tes
ting
met
hods
for P
), it
is v
ital
that
the
anal
ytic
al p
roce
dure
s sel
ecte
d ar
e ap
prop
riate
to th
e ge
ogra
phic
regi
on o
f int
eres
t and
for t
he in
tend
ed
use
of th
e so
il.
The
ultim
ate
goal
of s
oil t
estin
g is
to p
rovi
de th
e us
er w
ith a
reco
mm
enda
tion
as to
the
likel
ihoo
d th
at th
e ap
plic
atio
n of
nut
rient
s in
ferti
lizer
s or m
anur
es w
ill p
rovi
de a
pro
fitab
le in
crea
se in
cro
p re
spon
se.
Rec
omm
enda
tions
bas
ed o
n so
il te
stin
g re
sults
are
dev
elop
ed u
sing
cro
p re
spon
se d
ata
that
hav
e be
en
obta
ined
with
in a
stat
e or
regi
on w
ith si
mila
r soi
ls, c
ropp
ing
syst
ems,
and
clim
atic
con
ditio
ns. T
here
fore
, it i
s im
porta
nt to
subm
it sa
mpl
es to
a la
bora
tory
that
is fa
mili
ar w
ith th
e cr
ops t
o be
gro
wn
and
the
soils
and
m
anag
emen
t pra
ctic
es th
at w
ill b
e us
ed.
Tabl
e 1.
Bas
ic c
ompo
nent
s in
a so
il te
stin
g pr
ogra
m.
Soil
Tes
ting
Com
pone
nt
So
il Sa
mpl
ing
Soil
Sam
ple
Han
dlin
g an
d Pr
epar
atio
n
So
il Sa
mpl
e A
naly
sis
Inte
rpre
tatio
n of
A
naly
tical
Res
ults
Methods for P Analysis, J.L. Kovar and G.M. Pierzynski (eds)
11
Ref
eren
ce
Kuo
(199
6)
Solta
npou
r and
Sc
hwab
(197
7)
Lunt
et a
l. (1
950)
M
orga
n (1
941)
M
cInt
osh
(196
9)
SPA
C (1
992)
Egne
r et a
l. (1
960)
H
ouba
et a
l. (1
997)
Cha
rdon
et a
l. (1
996)
M
enon
et a
l. (1
997)
M
eyer
s et a
l. (1
995)
K
uo (1
996)
Hou
ba e
t al.
(199
7)
Kuo
(199
6)
Siss
ingh
(197
1)
Tabl
e 2.
Oth
er so
il P
test
s use
d in
the
Uni
ted
Stat
es a
nd E
urop
e.
Soil
Phos
phor
us T
est
Am
mon
ium
bic
arbo
nate
- D
TPA
(AB
-DTP
A):
The
AB
-DTP
A so
il te
st [1
M N
H4H
CO
3 + 0
.005
M D
TPA
(Die
thyl
enet
riam
inep
enta
acet
ic a
cid)
] adj
uste
d to
pH
7.6
was
dev
elop
ed a
s a m
ulti-
elem
ent s
oil t
est e
xtra
ctan
t for
the
wes
tern
U.S
. It i
s wel
l cor
rela
ted
with
O
lsen
P (N
aHC
O3-
P) a
nd b
est s
uite
d fo
r lab
orat
orie
s des
iring
to si
mul
tane
ousl
y an
alyz
e P,
K, C
a, M
g, C
u, F
e,
Mn,
and
Zn
in n
eutra
l and
cal
care
ous s
oils
.
Mor
gan’
s and
Mod
ified
Mor
gan'
s:
The
Mor
gan’
s (0.
72 M
NaO
Ac
+ 0.
52 M
CH
3CO
OH
) and
the
Mod
ified
Mor
gan’
s (0.
62 M
NH
4OH
+ 1
.25
M
CH
3CO
OH
) soi
l tes
t P e
xtra
ctan
ts a
re m
ainl
y us
ed in
a fe
w st
ates
in th
e no
rthea
ster
n an
d no
rthw
este
rn U
nite
d St
ates
and
som
e Eu
rope
an c
ount
ries (
e.g.
Irel
and)
. The
se te
sts a
re b
est s
uite
d fo
r aci
dic
soils
with
cat
ion
exch
ange
cap
aciti
es <
20
cmol
/kg.
Am
mon
ium
lact
ate
- ace
tic a
cid
(AL-
AA
):
The
AL-
AA
soil
test
for P
is u
sed
in se
vera
l wes
tern
Eur
opea
n co
untri
es, w
ith so
me
coun
tries
subs
titut
ing
calc
ium
lact
ate
for a
mm
oniu
m la
ctat
e. T
he A
L-A
A so
lutio
n is
buf
fere
d at
an
acid
ic p
H (3
.75)
and
ext
ract
s P
from
Al a
nd F
e bo
und
form
s by
com
plex
atio
n w
ith la
ctic
aci
d.
The
P i so
il te
st (I
ron-
Oxi
de Im
preg
nate
d Pa
per)
Th
e P i
soil
test
is fu
ndam
enta
lly d
iffer
ent f
rom
oth
er so
il te
sts i
n th
at it
doe
s not
che
mic
ally
ext
ract
P fr
om
soils
; rat
her i
t rem
oves
P b
y so
rptio
n fr
om so
lutio
n on
to a
filte
r pap
er st
rip c
oate
d w
ith F
e ox
ide.
Thi
s fa
cilit
ates
des
orpt
ion
of a
vaila
ble
P fr
om so
il co
lloid
s. Th
e P i
soil
test
has
bee
n re
porte
d to
eff
ectiv
ely
mea
sure
pl
ant a
vaila
ble
P an
d P
susc
eptib
le to
loss
in ru
noff
that
is b
iolo
gica
lly a
vaila
ble
to a
lgae
and
oth
er w
ater
pl
ants
.
Wat
er a
nd D
ilute
Sal
t Sol
utio
ns:
Dei
oniz
ed w
ater
and
0.0
1M C
aCl 2
are
used
to e
xtra
ct so
lubl
e an
d re
adily
des
orba
ble
P fr
om so
ils. T
ests
such
as
thes
e us
ually
ext
ract
the
mos
t lab
ile fo
rms o
f soi
l P a
nd m
uch
less
P th
an th
e qu
antit
ies e
xtra
cted
by
the
acid
ic a
nd b
asic
ext
ract
ants
com
mon
ly u
sed
by m
ost s
oil t
estin
g la
bora
torie
s. W
ater
usu
ally
ext
ract
s mor
e P
than
0.0
1M C
aCl 2
beca
use
Ca+2
enh
ance
s P so
rptio
n by
soils
. Rec
ently
, 0.0
1M C
aCl 2
has b
een
prop
osed
as a
n ef
fect
ive
mul
ti-el
emen
t, un
iver
sal s
oil t
est (
Hou
ba, e
t al.,
199
7).
Methods for P Analysis, J.L. Kovar and G.M. Pierzynski (eds)
12
Section References: Bray, R.H. 1948. Correlation of soil tests with crop response to fertilizers and with fertilizer
requirement. p. 53-86. In H.B. Kitchen (ed.) Diagnostic techniques for soils and crops. Am. Potash Inst., Washington, D. C.
Carter, M.R., and E.G. Gregorich. 2007. Soil sampling and methods of analysis, second edition. CRC Press, Boca Raton, FL.
Chardon, W.J., R.G. Menon, and S.H. Chien. 1996. Iron oxide impregnated filter paper (Pi test): A review of its development and methodological research. Nutr. Cycl. Agroecosystems 46:41-51.
Egnér, H., H. Riehm, and W.R. Domingo. 1960. Untersuchungen über die chemische Bodenanalyse als Grundlage für die Beurteilung des Nährstoffzustandes der Böden. II. Chemische Extraktionsmethoden zur Phosphor – and Kaliumbestimmung. Kungl. Lantbrukshoegsk. Ann. 26:199-215.
Houba, V.J.G., J.J. van der Lee, and I. Novozamski. 1997. Soil analysis procedures. Dep. of Soil Sci. Plant Nutr., Landbouwuniversiteit, Wageningen Agric. Univ., Wageningen, the Netherlands.
Frank, K., D. Beegle, and J. Denning. 1998. Phosphorus. p. 21-30. In J.R. Brown (ed.) Recommended Chemical Soil Test Procedures for the North Central Region. North Central Reg. Res. Publ. No. 221 (revised).
Kuo, S. 1996. Phosphorus. p. 869-919. In D. L. Sparks. (ed.) Methods of Soil Analysis: Part 3- Chemical Methods. SSSA, Madison, WI.
Lunt, H. A., C. L.W. Swanson, and H.G.M. Jacobson. 1950. The Morgan Soil Testing System. Bull. No. 541, Conn. Agr. Exp. Stn., New Haven, CT.
McIntosh, J. L. 1969. Bray and Morgan soil test extractants modified for testing acid soils from different parent materials. Agron. J. 61:259-265.
Menon, R.G., S.H. Chien, and W.J. Chardon. 1997. Iron oxide impregnated filter paper (Pi test): II. A review of its application. Nutr. Cycl. Agroecosystems 47:7-18.
Morgan, M.F. 1941. Chemical soil diagnosis by the universal soil testing system. Conn. Agric. Exp. Stn. Bull. No. 450.
Meyers, R.G., G.M. Pierzynski, and S.J. Thien. 1995. Improving the iron oxide sink method for extracting soil phosphorus. Soil Sci. Soc. Am. J. 59:853-857.
SERA-IEG-6 (Southern Extension Research Activity - Information Exchange Group) 1992. Donohue, S.J. (ed.) Reference Soil and Media Diagnostic procedure for the southern region of the United States. So. Coop. Series Bulletin 374. Va. Agric. Exp. Station, Blacksburg, VA.
Sibbesen, E., and A.N. Sharpley. 1997. Setting and justifying upper critical limits for phosphorus in soils. p. 151-176. In H. Tunney et al., (ed.) Phosphorus Loss from Soil to Water. CAB International, London.
Sims, J.T. 1993. Environmental soil testing for phosphorus. J. Prod. Agric. 6:501-507. Sims, J.T. 1997. Phosphorus soil testing: Innovations for water quality protection. p. 47-63. Proc.
5th Intl. Symp. Soil and Plant Analysis. Minneapolis, MN. Sims, J.T. (ed.) 1998. Soil testing for phosphorus: Environmental uses and implications. So.
Coop. Series Bull. No. 389. Univ. Delaware, Newark, DE. Sims, J.T., and A.M. Wolf. (ed.) 1995. Recommended soil testing procedures for the
Northeastern United States. (2nd ed.). Bull. No. 493. Univ. Delaware, Newark, DE.
Methods for P Analysis, J.L. Kovar and G.M. Pierzynski (eds)
13
Sims, J.T., A.C. Edwards, O.F. Schoumans, and R.R. Simard. 2000. Integrating soil phosphorus testing into environmentally based agricultural management practices. J. Environ. Qual. 29:60-71
Sims, J.T., S.C. Hodges, and J. Davis. 1998. Soil testing for phosphorus: Current status and uses in nutrient management programs. p.13-20. In Sims, J.T. (ed.) 1998. Soil testing for phosphorus: Environmental uses and implications. So. Coop. Series Bull. No. 389. Univ. Delaware, Newark, DE. (http://www.sera17.ext.vt.edu/Documents/Soil_Testing_Uses_Implications.pdf).
Sissingh, H.A. 1971. Analytical technique of the Pw method used for the assessment of the phosphate status of arable soils in the Netherlands. Plant Soil 34:438-446.
SPAC (Soil and Plant Analysis Council). 1992. Handbook on reference methods for soil analysis. Georgia Univ. Stn., Athens, GA.
Soltanpour, P.N. and A.P. Schwab. 1977. A new soil test for simultaneous determination of macro and micro-nutrients in alkaline soils. Commun. Soil Sci. Plant Anal. 8:195-207.
SOIL TEST PHOSPHORUS: BRAY AND KURTZ P-1 The Bray and Kurtz P-1 soil test P method was developed by Roger Bray and Touby
Kurtz of the Illinois Agricultural Experiment Station in 1945 and is now widely used in the Midwestern and North Central United States (Bray and Kurtz, 1945; Frank et al., 1998). Phosphorus extracted by the Bray and Kurtz P-1 method has been shown to be well-correlated with crop yield response on most acid and neutral soils in these regions. For acid soils, the fluoride in the Bray and Kurtz extractant enhances P release from aluminum phosphates by decreasing Al activity in solution through the formation of various Al-F complexes. Fluoride is also effective at suppressing the re-adsorption of solubilized P by soil colloids. The acidic nature of the extractant (pH 2.6) also contributes to dissolution of available P from Al, Ca, and Fe-bound forms in most soils. The Bray and Kurtz P-1 soil test is not suitable for:
• clay soils with a moderately high degree of base saturation, • silty clay loam or finer-textured soils that are calcareous or have a high pH value (pH
> 6.8) or have a high degree of base saturation, • soils with a calcium carbonate equivalent > 7% of the base saturation, or • soils with large amounts of lime (> 2% CaCO3).
In soils such as these, the acidity of the extracting solution can be neutralized unless the
ratio of extractant:soil is increased considerably. Additionally, CaF2, formed from the reaction of soluble Ca+2 in the soil with F- added in the extractant, can react with and immobilize soil P. Both types of reactions reduce the efficiency of P extraction and result in low soil test P values. Finally, the Bray and Kurtz extractant can dissolve P from rock phosphates. Therefore, it should not be used in soils recently amended with these materials, as it will overestimate available P. A Bray and Kurtz P-1 value of 25 to 30 mg P/kg soil is often considered optimum for plant growth, although Holford (1980) reported lower critical values for highly buffered soils.
Equipment: 1. No. 10 (2 mm opening) sieve 2. Standard 1 g and 2 g stainless steel soil scoops 3. Automatic extractant dispenser, 25 mL capacity
Methods for P Analysis, J.L. Kovar and G.M. Pierzynski (eds)
14
4. Extraction vessels, such as 50 mL Erlenmeyer flasks, and filter funnels (9 and 11 cm) and racks
5. Rotating or reciprocating shaker with a capability of 200 excursions per minute (epm) 6. Whatman No. 42 or No. 2 (or equivalent) filter paper, 9 to 11 cm. (Acid resistant filter
paper may be needed if using an automated method for determining P concentration by intensity of color. Bits of filter paper may cause an obstruction in the injection valves.)
Reagents: Bray and Kurtz P-1 Extracting Solution (0.025 M HCl in 0.03 M NH4F): Dissolve 11.11 g of reagent-grade ammonium fluoride (NH4F) in about 9 L of distilled water. Add 250 mL of previously standardized 1M HCl and make to 10 L volume with distilled water. Mix thoroughly. The pH of the resulting solution should be pH 2.6 ± 0.05. The adjustments to pH are made using HCl or ammonium hydroxide (NH4OH). Store in polyethylene carboys until use.
Procedure: 1. Scoop or weigh 2 g of soil into a 50 mL Erlenmeyer flask, tapping the scoop on the
funnel or flask to remove all of the soil from the scoop. 2. Add 20 mL of extracting solution to each flask and shake at 200 or more epm for five
minutes at a room temperature at 24 to 27oC 3. If it is necessary to obtain a colorless filtrate, add 1 cm3 (~200 mg) of charcoal (DARCO
G60, J. T. Baker, Phillipburg, NJ) to each flask. 4. Filter extracts through Whatman No. 42 filter paper or through a similar grade of paper.
Refilter if extracts are not clear. 5. Analyze for P by colorimetry or inductively coupled plasma emission spectroscopy using
a blank and standards prepared in the Bray P-1 extracting solution.
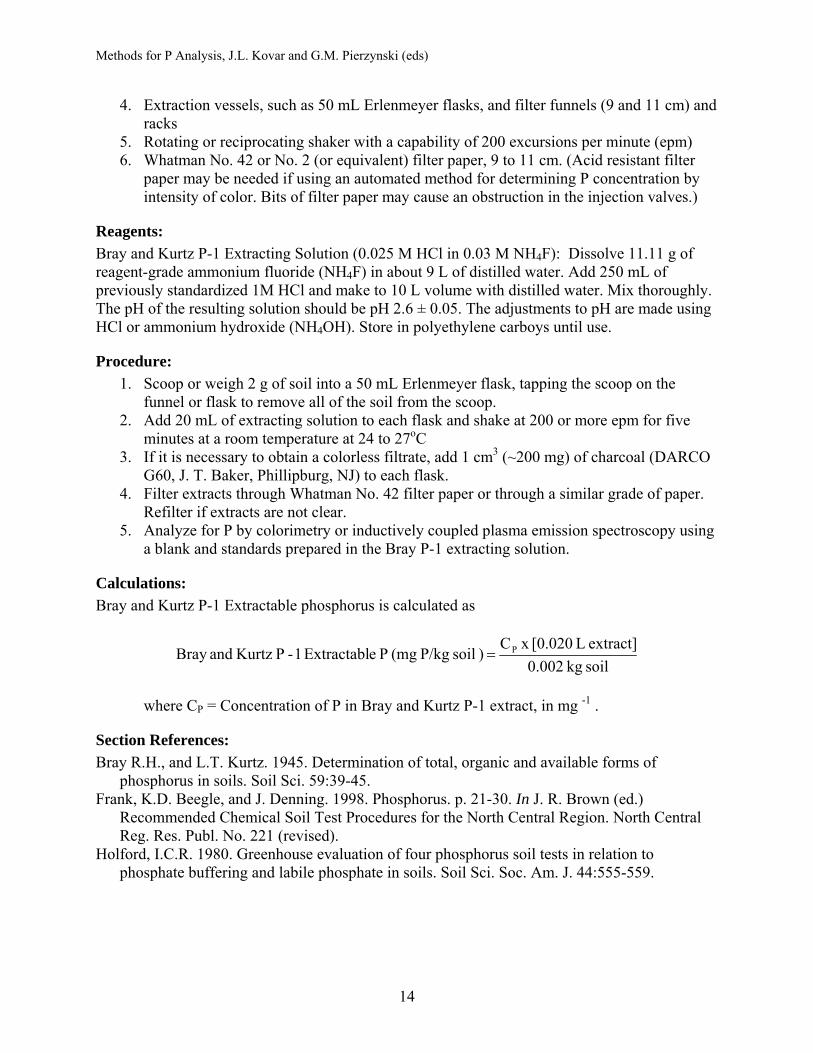
Calculations: Bray and Kurtz P-1 Extractable phosphorus is calculated as
soil kg 0.002extract] L [0.020x C
) soil P/kg (mg P eExtractabl 1-P Kurtz andBray P=
where CP = Concentration of P in Bray and Kurtz P-1 extract, in mg -1 .
Section References: Bray R.H., and L.T. Kurtz. 1945. Determination of total, organic and available forms of
phosphorus in soils. Soil Sci. 59:39-45. Frank, K.D. Beegle, and J. Denning. 1998. Phosphorus. p. 21-30. In J. R. Brown (ed.)
Recommended Chemical Soil Test Procedures for the North Central Region. North Central Reg. Res. Publ. No. 221 (revised).
Holford, I.C.R. 1980. Greenhouse evaluation of four phosphorus soil tests in relation to phosphate buffering and labile phosphate in soils. Soil Sci. Soc. Am. J. 44:555-559.

Methods for P Analysis, J.L. Kovar and G.M. Pierzynski (eds)
15
SOIL TEST PHOSPHORUS: MEHLICH 1 The Mehlich 1 soil test for P, also known as the dilute double acid or North Carolina
extractant, was developed in the early 1950s by Mehlich and his co-workers (Mehlich, 1953; Nelson et al. 1953). In the United States, the Mehlich 1 procedure is primarily used in the southeastern and mid-Atlantic states as a multi-element extractant for P, K, Ca, Mg, Cu, Fe, Mn, and Zn. The Mehlich 1 extracts P from aluminum, iron, and calcium phosphates and is best suited to acid soils (pH < 6.5) with low cation exchange capacities (< 10 cmol/kg) and organic matter contents (< 5%). Kuo (1996) reported that the Mehlich 1 soil test was unreliable for calcareous or alkaline soils because it extracts large amounts of nonlabile P in soils with pH > 6.5, soils that have been recently amended with rock phosphate, and soils with high cation exchange capacity (CEC) or high base saturation. In soils such as these, the acidity of the Mehlich 1 solution is neutralized, reducing the capability of the dilute acid to extract P. Similar reductions in P extraction efficiency have been attributed to clay and hydrous aluminum and iron oxides (Nelson et al., 1953; Lins & Cox, 1989).
A value of 20 to 25 mg P/kg soil for the Mehlich-1 test is generally considered to be optimum for plant growth, although this may vary slightly between soil types and cropping systems. For instance, Kamprath and Watson (1980) stated that a Mehlich-1 P of 20 to 25 mg P/kg soil is adequate for plants grown in sandy soils, but only 10 mg P/kg soil is required for fine-textured soils, a point supported by the work of Lins and Cox (1989).
Equipment: 1. No. 10 (2 mm opening) sieve 2. Automatic extractant dispenser, 25 mL capacity (If preferred, pipettes are acceptable.) 3. Standard 5 cm3 and 1 cm3 stainless steel soil scoops 4. Extraction vessels, such as 50 mL Erlenmeyer flasks, and filter funnels (9 and 11 cm) and
racks 5. Reciprocating or rotary shaker, capable of at least 180 epm (excursions per minute) 6. Whatman No. 42 or No. 2 (or equivalent) filter paper, 9 to 11 cm. (Acid resistant filter
paper may be needed if using an automated method for determining P concentration by intensity of color. Bits of filter paper may cause an obstruction in the injection valves.)
Reagents: Mehlich 1 Extracting Solution (0.0125 M H2SO4 + 0.05 M HCl). Also referred to as dilute double acid or the North Carolina Extractant. Using a graduated cylinder, add 167 mL of concentrated HCl (12M) and 28 mL of concentrated H2SO4 (18M) to ~35 L of deionized water in a large polypropylene carboy. Make to a final volume of 40 L by adding deionized water. Mix well by bubbling air through the solution for 3 hours.
Procedure: 1. Weigh 5.0 g (or scoop 4 cm3) of sieved (< 2 mm), air-dried soil into a 50 mL extraction
flask. 2. If it is necessary to obtain a colorless filtrate, add 1 cm3 (~200 mg) of charcoal (DARCO
G60, J. T. Baker, Phillipburg, NJ) to each flask. 3. Add 20 mL of the Mehlich 1 extracting solution and shake for five minutes on a
reciprocating shaker set at a minimum of 180 epm at a room temperature at 24 to 27oC. 4. Filter through a medium-porosity filter paper (Whatman No. 2 or equivalent).
Methods for P Analysis, J.L. Kovar and G.M. Pierzynski (eds)
16
5. Analyze for P by colorimetry or inductively coupled plasma emission spectroscopy using a blank and standards prepared in the Mehlich 1 extracting solution.
Calculations: Mehlich 1 Extractable P (mg P/kg soil) = [Concentration of P in Mehlich 1 extract, mg -1 ] x [ 0.020 L extract ÷ 0.005 kg soil]
Section References: Kamprath, E.J. and M.E. Watson. 1980. Conventional soil and tissue tests for assessing the
phosphorus status of soils. p. 433-469. In F. E. Khasawneh et al. (ed.) The role of phosphorus in agriculture. ASA, CSSA, and SSSA, Madison, WI.
Kuo, S. 1996. Phosphorus. p. 869-919. In D. L. Sparks. (ed.) Methods of Soil Analysis: Part 3- Chemical Methods. SSSA, Madison, WI.
Lins, I.D.G. and F.R. Cox. 1989. Effects of extractant and selected soil properties on predicting the optimum phosphorus fertilizer rate for growing soybeans under field conditions. Commun. Soil Sci. Plant Anal. 20:310-333.
Mehlich, A. 1953. Determination of P, Ca, Mg, K, Na, and NH4. North Carolina Soil Test Division (Mimeo). Raleigh, NC.
Nelson, W. L., A. Mehlich, and E. Winters. 1953. The development, evaluation, and use of soil tests for phosphorus availability. Agronomy 4:153-158.
SOIL TEST PHOSPHORUS: MEHLICH 3 The Mehlich 3 soil test was developed by Mehlich in 1984 as an improved multi-element
extractant for P, K, Ca, Mn, Cu, Fe, Mn, and Zn (Mehlich, 1984). Today, the Mehlich 3 test is used throughout the United States and Canada because it is well suited to a wide range of soils, both acidic and basic in reaction. The Mehlich 3 extractant was selected by workers in the southern region as the standard reference procedure for soil test P determination (Tucker, 1992). The Mehlich 3 soil test is similar in principle to the Bray and Kurtz P-1 test because it is an acidic solution that contains ammonium fluoride. Acetic acid in the extractant also contributes to the release of available P in most soils. It is more effective than the Mehlich 1 soil test for predicting crop response to P on neutral and alkaline soils because the acidity of the extractant is neutralized less by soil carbonates (Tran and Simard, 1993). Several studies showed that the Mehlich 3 soil test is highly correlated with P extracted from soils by the Bray and Kurtz P-1, Mehlich 1, and Olsen P methods (Sims, 1989; Tran et al., 1990; Wolf and Baker, 1985). A Mehlich 3 value of 45-50 mg P/kg soil is generally considered to be optimum for plant growth and crop yields, and is higher than the critical values used for other standard soil P tests, such as the Bray and Kurtz P-1, Mehlich 1, and Olsen P.
Equipment: 1. No. 10 (2 mm opening) sieve 2. Standard 1 cm3 , 2 cm3 (or 2.5 cm3) stainless steel soil scoops 3. Automatic extractant dispenser, 25 mL capacity 4. Extraction vessels, such as 50 mL Erlenmeyer flasks, and filter funnels (9 and 11 cm) and
racks 5. Rotating or reciprocating shaker with a capability of 200 excursions per minute (epm)
Methods for P Analysis, J.L. Kovar and G.M. Pierzynski (eds)
17
6. Whatman No. 42 or No. 2 (or equivalent) filter paper, 9 to 11 cm. (Acid resistant filter paper may be needed if using an automated method for determining P concentration by intensity of color. Bits of filter paper may cause an obstruction in the injection valves.)
Reagents: Mehlich 3 Extracting Solution: (0.2 M CH3COOH, 0.25 M NH4NO3, 0.015 M NH4F, 0.013 M HNO3, 0.001 M EDTA [(HOOCCH2)2NCH2CH2N (CH2COOH)2]. Prepare as follows: Ammonium fluoride (NH4F) and EDTA stock solution (3.75 M NH4F:0.25 M EDTA)
1. Add 1200 mL of distilled water to a 2 L volumetric flask. 2. Add 277.8 g of NH4F and mix well. 3. Add 146.1 g EDTA to the solution. 4. Make solution to 2 L, mix well and store in plastic (stock solution for 10,000 samples).
Mehlich 3 extractant
1. Add 8 L of distilled water to a 10 L carboy. 2. Dissolve 200 g of ammonium nitrate (NH4NO3) in the distilled water. 3. Add 40 mL NH4F-EDTA stock solution and mix well. 4. Add 115 mL glacial acetic acid (99.5%, 17.4 M). 5. Add 8.2 mL of concentrated nitric acid (HNO3, 68 to 70 %, 15.5 M). 6. Add distilled water to 10 L final volume and mix well (enough extractant for 400
samples), final pH should be 2.5 ± 0.1.
Procedure: 1. Scoop or weigh 2.0 g of soil into a 50 mL Erlenmeyer flask, tapping the scoop on the
funnel or flask to remove all of the soil from the scoop. Where disturbed bulk density of soil varies significantly from 1.0 g cm3, record both weight and volume of samples. (Standard 2.5 cm3 scoops may also be used, but a 1:10 soil:extractant volumetric ratio should be maintained)
2. Add 20 mL of extracting solution to each flask and shake at 200 or more epm for five minutes at a room temperature at 24 to 27oC.
3. If it is necessary to obtain a colorless filtrate, add 1 cm3 (~200 mg) of charcoal (DARCO G60, J. T. Baker, Phillipburg, NJ) to each flask.
4. Filter extracts through Whatman No. 42 filter paper or through a similar grade of paper. Refilter if extracts are not clear.
5. Analyze for P by colorimetry or inductively coupled plasma emission spectroscopy using a blank and standards prepared in the Mehlich 3 extracting solution.
Calculations: Mehlich 3 Extractable P (mg P/kg) = [Concentration of P in Mehlich 3 extract, mg P L-1] x [ 0.020 L extract ÷ 0.002 kg soil]
Section References: Mehlich, A. 1984. Mehlich 3 soil test extractant: A modification of the Mehlich 2 extractant.
Commun. Soil Sci. Plant Anal. 15:1409-1416.
Methods for P Analysis, J.L. Kovar and G.M. Pierzynski (eds)
18
Tucker, M.R., 1992. Determination of phosphorus by Mehlich 3 extractant. In Donohue, S.J. (ed.) Reference Soil and Media Diagnostic procedure for the southern region of the United States. So. Coop. Series Bulletin 374. Va. Agric. Exp. Station, Blacksburg, VA. p. 9-12.
Sims, J. T. 1989. Comparison of Mehlich 1 and Mehlich 3 extractants for P, K, Ca, Mg, Mn, Cu, and Zn in Atlantic Coastal Plain soils. Commun. Soil Sci. Plant Anal. 20:1707-1726.
Tran, T. Sen and R.R. Simard. 1993. Mehlich 3 extractable elements. p. 43-49. In M.R. Carter (ed.) Soil Sampling and Methods of Analysis. Can. Soc. Soil Sci., Ottawa, Ontario.
Tran, T. Sen, M. Giroux, J. Guilbeault, and P. Audesse. 1990. Evaluation of Mehlich 3 extractant to estimate available P in Quebec soils. Commun. Soil Sci. Plant Anal. 21:1-28.
Wolf, A.M. and D.E. Baker. 1985. Comparison of soil test phosphorus by the Olsen, Bray P1, Mehlich 1 and Mehlich 3 methods. Commun. Soil Sci. Plant Anal. 16:467-484.
SOIL TEST PHOSPHORUS: OLSEN P The “Olsen P” or sodium bicarbonate soil test P method was developed by Sterling R.
Olsen and co-workers in 1954 (Olsen et al., 1954) to predict crop response to fertilizer P inputs on calcareous soils. It is primarily used in the North Central and western United States. The Olsen P method is best suited for calcareous soils, particularly those with > 2% calcium carbonate, but has been shown in some research to be reasonably effective for acidic soils (Fixen and Grove, 1990). The method is based on the use of the HCO3
-, CO3-3 and OH- in the pH 8.5,
0.5M NaHCO3 solution to decrease the solution concentrations of soluble Ca2 by precipitation as CaCO3 and soluble Al3+ and Fe+3 by formation of Al and Fe oxyhydroxides, thus increasing P solubility. The increased surface negative charges and/or decreased number of sorption sites on Fe and Al oxide surfaces at high pH levels also enhance desorption of available P into solution.
An Olsen P value of 10 mg P/kg is generally considered to be optimum for plant growth. This is lower than the critical values used for the Bray and Kurtz P-1, Mehlich 1 and Mehlich 3 soil tests because the Olsen extractant removes less P from most soils than the acidic extractants. Kuo (1996) stated that proper interpretation of Olsen P results for soils with diverse properties requires some information on soil P sorption capacity. Similarly, Schoenau and Karamanos (1993) cautioned against use of the Olsen test to compare P availability in soils with large differences in P chemistry.
Equipment: 1. No. 10 (2 mm opening) sieve 2. Standard 1 g and 2 g stainless steel soil scoops 3. Automatic extractant dispenser, 25 mL capacity 4. Extraction vessels, such as 50 mL Erlenmeyer flasks, and filter funnels (9 and 11 cm) and
racks 5. Rotating or reciprocating shaker with a capability of 200 excursions per minute (epm) 6. Whatman No. 42 or No. 2 (or equivalent) filter paper, 9 to 11 cm. (Acid resistant filter
paper may be needed if using an automated method for determining P concentration by intensity of color. Bits of filter paper may cause an obstruction in the injection valves.)
Reagents: Olsen P Extracting Solution (0.5M NaHCO3, pH 8.5): Dissolve 420 g commercial-grade sodium bicarbonate (NaHCO3) in distilled water and make to a final volume of 10 L. Note that a
Methods for P Analysis, J.L. Kovar and G.M. Pierzynski (eds)
19
magnetic stirrer or electric mixer is needed to dissolve the NaHCO3. Adjust extracting solution pH to 8.5 with 50% sodium hydroxide.
Procedure: 1. Scoop or weigh 1 g of soil into a 50 mL Erlenmeyer flask, tapping the scoop on the funnel
or flask to remove all of the soil from the scoop. 2. Add 20 mL of extracting solution to each flask and shake at 200 or more epm for 30
minutes at a room temperature at 24 to 27°C 3. If it is necessary to obtain a colorless filtrate, add 1 cm3 (~200 mg) of charcoal (DARCO
G60, J. T. Baker, Phillipburg, NJ) to each flask. 4. Filter extracts through Whatman No. 42 filter paper or through a similar grade of paper.
Refilter if extracts are not clear. 5. Analyze for P by colorimetry or inductively coupled plasma emission spectroscopy using
a blank and standards prepared in the Olsen P extracting solution.
Calculations: Olsen Extractable P (mg P/kg soil) = [Concentration of P in Olsen extract, mg L-1 ] x [ 0.020 L extract ÷ 0.001 kg soil]
Section References: Fixen, P.E. and J.H. Grove. 1990. Testing soils for phosphorus. p. 141-180. In R.L. Westerman
(ed.) Soil Testing and Plant Analysis. SSSA, Madison, WI. Kuo, S. 1996. Phosphorus. p. 869-919. In D.L. Sparks. (ed.). Methods of Soil Analysis: Part 3-
Chemical Methods. SSSA, Madison, WI. Olsen, S.R., C.V. Cole, F.S. Watanabe, and L.A. Dean. 1954. Estimation of available phosphorus
in soils by extraction with sodium bicarbonate. USDA Circular 939. U.S. Government Printing Office, Washington D.C.
Schoenau, J.J. and R.E. Karamanos. 1993. Sodium bicarbonate extractable P, K, and N. p. 51-58. In M. R. Carter (ed.) Soil Sampling and Methods of Analysis. Can. Soc. Soil Sci., Ottawa, Ontario.
Methods for P Analysis, J.L. Kovar and G.M. Pierzynski (eds)
20
A Phosphorus Sorption Index J. Thomas Sims, University of Delaware
Introduction: The phosphorus (P) sorption capacity of soils is typically determined by the use of batch
equilibrium experiments that are used to generate sorption isotherms. These isotherms are plots of the amount of P adsorbed from several solutions of known initial concentration vs. the P concentration at equilibrium for each solution. For example, Nair et al.(1984) proposed, based on an interlaboratory comparison study, a standard approach to construct P sorption isotherms, using a soil:solution ratio of 1:25 (w:v), six initial P concentrations (as KH2PO4 in a 0.01M CaCl2 matrix), and a 24 h equilibration period Results from sorption isotherms can be used to calculate P sorption maxima and P bonding energies for soils with different properties and/or as influenced by cultural practices, such as crop rotation, tillage, and manure addition.
While useful for agronomic and environmental characterization of the P sorption capacity of soils, P sorption isotherms are too time-consuming, complicated, and expensive for routine use. To overcome these obstacles Bache and Williams (1971) developed a “P Sorption Index” (PSI) that could rapidly determine soil P sorption capacity. They evaluated 12 approaches and found that a PSI derived from a single-point isotherm (P sorbed from a single solution containing 50 µmol P/g soil) was easy to use and well correlated with the P sorption capacity of 42 acid and calcareous soils from Scotland (r=0.97***). Other researchers have used the PSI, or modified versions, and shown it to be well correlated with soil P sorption capacity determined from complete sorption isotherms for soils of widely varying chemical and physical properties (Mozaffari and Sims, 1994; Sharpley et al., 1984; Simard et al., 1994). In most cases these researchers have maintained the original ratio of added P to soil (1.5 g/kg), but have slightly changed the soil:solution ratio, background electrolyte, and/or shaking time. Most of these modifications have not affected the correlations between P sorption capacity estimated from the PSI and that determined by a full sorption isotherm. The procedure described below is based on Bache and Williams (1971). Details on other approaches are available in the references cited above.
Equipment: 1. Centrifuge and 50 mL polyethylene centrifuge tubes. 2. Shaker (end-over-end shaker preferred to ensure thorough mixing of soil and sorption
solution). 3. Millipore filtration apparatus (0.45-µm pore size filters) and vacuum flasks. 4. 50 mL screw-top test tubes.
Reagents: 1. Phosphorus Sorption Solution (75 mg P L-1): Dissolve 0.3295 g of monobasic potassium
phosphate (KH2PO4) in 1 L of deionized H2O. Store in refrigerator until use. 2. Toluene or chloroform.
Procedure: 1. Weigh 1.00 g of air-dried, sieved (2 mm) soil into a 50 mL centrifuge tube.
Methods for P Analysis, J.L. Kovar and G.M. Pierzynski (eds)
21
2. Add 20 mL of the 75 mg P L-1 sorption solution to the centrifuge tube. (Note: This provides a ratio of 1.5 g P /kg soil). Add two drops of toluene or chloroform to inhibit microbial activity.
3. Place the tubes in the end-over-end shaker and shake for 18 h at 25±2o C. 4. Centrifuge the samples at 2000 rpm for 30 minutes. 5. Using the Millipore filtration apparatus, 0.45-μm filters, and large vacuum flasks, filter
the centrifugate into 50 mL screw-top test tubes within the flask. 6. Measure P concentration in the centrifugate colorimetrically or by inductively coupled
plasma emission spectroscopy.
Calculations: The PSI has usually been calculated as follows, although some studies have shown that expressing PSI directly in mg/kg is acceptable.
where:
( ) ( )( )soil kg 0.001
L 0.020 x P- P/L mg 75 (mgP/kg) sorbed PX f==
C = P concentration at equilibrium (mg L-1),
and
Pf = Final P concentration after 18 h equilibration (in mg L-1).
References: Bache, B.W., and E.G. Williams. 1971. A phosphate sorption index for soils. J. Soil Sci. 22:289-
301. Mozaffari, P.M., and J.T. Sims. 1994. Phosphorus availability and sorption in an Atlantic Coastal
Plain watershed dominated by intensive, animal-based agriculture. Soil Sci. 157:97-107. Nair, P.S., T.J. Logan, A.N. Sharpley, L.E. Sommers, M.A. Tabatabai, and T.L. Yuan. 1984.
Interlaboratory comparison of a standardized phosphorus adsorption procedure. J. Environ. Qual. 13:591-595.
Sharpley, A.N., S.J. Smith, B.A. Stewart, and A.C. Mathers. 1984. Forms of phosphorus in soils receiving cattle feedlot waste. J. Environ. Qual. 13:211-215.
Simard, R.R., D. Cluis, G. Gangbazo, and A. Pesant. 1994. Phosphorus sorption and desorption indices for soils. Commun. Soil Sci. Plant Anal. 25:1483-1494.
C logX ) kg (L PSI 1- =
Methods for P Analysis, J.L. Kovar and G.M. Pierzynski (eds)
22
Water- or Dilute Salt-Extractable Phosphorus in Soil M.L. Self-Davis, University of Arkansas P.A. Moore, Jr., USDA-ARS, Fayetteville, AR B.C. Joern, Purdue University
Introduction: Many methods exist to determine the various forms of soil phosphorus (P). Early interests
in examining soil P were primarily based on determining the quantity of supplemental P needed to adequately meet the needs of crops. The method for using distilled water as an extractant to determine P needs of plants was examined in a paper by Luscombe et al. (1979). They found a good correlation between the concentration of water-extractable P and dry matter yield responses in ryegrass.
There is now a national focus on examining excessive P buildup in the soil and consequent excessive P concentrations in runoff from agricultural land. Many studies have examined methods that best correlate soil P levels to concentrations of P in runoff (Sharpley, 1995; Pote et al., 1996). The study conducted by Pote et al. (1996) found an excellent correlation between water extractable soil test P and dissolved reactive P concentrations in runoff.
One criticism of other extractants is that they are either more acid or alkaline than the soil solution. Therefore, a portion of P extracted is actually of low availability. For example, extractants such as Mehlich 3, which contain strong acids, would be expected to dissolve calcium phosphates. Also, due to the specific chemical nature of many extractants, their use is limited to specific soil types. Use of distilled water or 0.01 M CaCl2 overcomes these criticisms (Pote et al., 1995).
The following methods are variations of the method described by Olsen and Sommers (1982) for determination of water-soluble P in soils.
Equipment: 1. Shaker (reciprocating or end-over-end). 2. Centrifuge. 3. Centrifuge tubes (40 mL). 4. Filtration apparatus (0.45 μm pore diameter membrane filter, or Whatman No. 42). 5. Spectrophotometer with infrared phototube for use at 880 nm. 6. Acid washed glassware and plastic bottles: graduated cylinders (5 mL to 100 mL),
volumetric flasks (100 mL, 500 mL, and 1000 mL), storage bottles, pipets, dropper bottles, and test tubes or flasks for reading sample absorbance.
Reagents: 1. Concentrated hydrochloric acid (HCl). 2. Reagents used for ascorbic acid technique for P determination, Murphy and Riley (1962). 3. Calcium chloride (CaCl2). 4. Chloroform.
Methods for P Analysis, J.L. Kovar and G.M. Pierzynski (eds)
23
Extraction Procedure - Deionized Water: 1. Weigh 2 g of soil (dried in a forced-draft oven at 60°C for 48 hours, sieved through a 2-
mm mesh sieve) into a 40 mL centrifuge tube. 2. Add 20 mL of distilled water and shake for one hour. 3. Centrifuge at 6,000 rpm for 10 minutes. 4. Filter the solution through a 0.45 μm membrane filter. 5. Acidify to pH 2.0 with HCl to prevent precipitation of phosphate compounds
(approximately 2 days of concentrated HC1). 6. Freeze the sample if it is not going to be analyzed that day.
Previous articles have noted that hydrolysis of condensed phosphates can occur when the solution is acidified (Lee et al., 1965). Also, at this pH level, there is the possibility of flocculation of organics. However, it is vital to ensure that the P remains in solution; therefore, we consider the negative effects of acidification minimal.
Extraction Procedure - 0.01M CaCl2: 1. Weigh 1 g of dry soil into a 40 mL centrifuge tube. 2. Add 25 mL of 0.01 M CaCl2 (you can add 2 drops of chloroform to inhibit microbial
growth if desired) and shake for one hour on a reciprocating shaker. 3. Centrifuge at 4000 rpm for 10 minutes. 4. Filter solution through Whatman No. 42 filter paper.
Analysis: For determining water or dilute salt extractable P in soil, any spectrophotometer with an infrared phototube for use at 660 or 882 nm can be used. Also, samples can be analyzed by inductively coupled plasma-atomic emission spectrometry (ICP-AES), which will measure total dissolved P.
Calculations: Water- or Dilute salt-extractable P (mg P/kg soil) = [Concentration of P in extract, mg L-1] x [Volume of extractant, L ÷ mass of soil, kg]
Comments: It should be mentioned that some studies have shown that concentrations of P in CaCl2
extracts can be one-third to one-half that of water extracts (Olsen and Watanabe, 1970; Soltanpour et al., 1974). Concentrations of Ca were less in the water extracts, as compared with the CaCl2 extracts, which resulted in higher P concentrations in the water extracts. Higher concentrations of Ca in the extracting solution may precipitate calcium phosphate, lowering the P levels in solution.
References: Lee, G.R., N.L. Clesceri, and G.P. Fitzgerald. 1965. Studies on the analysis of phosphates in
algal cultures. Internat. J. Air Water Poll. 9:715-722. Luscombe, P.C., J.K. Syers, and P.E.H. Gregg. 1979. Water extraction as a soil testing procedure
for phosphate. Commun. Soil Sci. Plant Anal. 10:1361-1369. Murphy, J., and J.P. Riley. 1962. A modified single solution method for the determination of
phosphate in natural waters. Anal. Chem. Acta 27:31-36.
Methods for P Analysis, J.L. Kovar and G.M. Pierzynski (eds)
24
Olsen, S.R., and L.E. Sommers. 1982. Phosphorus. P. 403-430 In A.L. Page et al. (ed.) Methods of soil analysis. Part 2. 2nd ed. Agronomy Monogr. 9. ASA and SSSA, Madison, WI.
Olsen, S.R., and F.S. Watanabe. 1970. Diffusive supply of phosphorus in relation to soil textural variations. Soil Sci. 110:318-327.
Pote, D.H., T.C. Daniel, P.A. Moore, Jr., A.N. Sharpley, D.R. Edwards, and D.J. Nichols. 1995. Phosphorus: relating soil tests to runoff concentrations across five soil series. Agronomy Abstracts, p. 294, Am. Soc. Agron., Madison, WI.
Pote, D.H., T.C. Daniel, A.N. Sharpley, P.A. Moore, Jr., D.R. Edwards, and D.J. Nichols. 1996. Relating extractable soil phosphorus to phosphorus losses in runoff. Soil Sci. Soc. Am J. 60:855-59.
Sharpley, A.N. 1995. Dependence of runoff phosphorus on extractable soil phosphorus. J. Environ. Qual. 24:920-926.
Soltanpour, P.N., F. Adams, and A.C. Bennett. 1974. Soil phosphorus availability as measured by displaced soil solutions, calcium chloride extracts, dilute-acid extracts, and labile phosphorus. Soil Sci. Soc. Am. Proc. 38:225-228.
Methods for P Analysis, J.L. Kovar and G.M. Pierzynski (eds)
25
Phosphorus Extraction with Iron Oxide-Impregnated Filter Paper (Pi test) W. J. Chardon, Alterra, Wageningen UR. Wageningen, The Netherlands
Introduction: The availability of phosphorus (P) in soil or surface water for biota (e.g. plants or algae)
has been studied extensively, and numerous tests for available P have been developed and used. These tests can roughly be divided into four categories: (1) shaking with acid solutions which dissolve P compounds or with (buffered) alkaline solutions which displace P from the soil; (2) measuring exchangeable P, using 32P; (3) shaking with dilute salt solutions or water, which simulate the soil solution, and (4) as (3), with a sink added, acting more or less analogous to the withdrawing behavior of a plant root.
The use of resin beads as a sink for P was introduced by Amer et al. (1955). Stronger sinks for P were developed by Hsu and Rich (1960) and by Robarge and Corey (1979) who affixed hydroxy-Al to a cation exchange resin. Since the use of these resins is laborious, it has not developed into a practical method (T.C. Daniel, pers. commun.). Iron (hydr)oxide impregnated filter paper (FeO paper, also known as Pi paper or HFO paper) was initially developed for soil chemical studies in the late 1970s. Later, it was introduced for plant availability studies as a simpler alternative for resin beads. A water extraction procedure is used for fertilizer recommendations in the Netherlands. In tropical soils this method often results in very low amounts of extracted P, causing analytical problems. Therefore, FeO paper was added as a sink during the extraction. However, since the use of water as an extractant allowed soil dispersion with resulting contamination of the FeO paper with soil particles, 0.01 M CaCl2 was chosen as an alternative for water. Although the description of the preparation of the FeO paper and its application was only published in an internal report (Sissingh, 1983), its use became widespread. The application for plant availability studies was reviewed by Menon et al. (1990, 1997), and the use for water-quality studies was described by Sharpley et al. (1995). For long-term desorption studies, an alternative method was developed using a FeO-suspension in a dialysis bag (Lookman et al., 1995). The present paper is mainly based on Chardon et al. (1996), in which studies on the various aspects of both preparation and use of the FeO paper are reviewed in a historical perspective.
Principle of the method: Filter paper is covered with a precipitate of amorphous iron (hydr)oxides (FeO). When a
soil is shaken in CaCl2 to which a strip of this FeO paper is added, P will first desorb from the soil, then adsorb onto the FeO-strip and new P will desorb from the soil. During shaking, the desorbable fraction of soil P will thus be (partly) depleted. During shaking the strip is protected against erosion by soil particles via a polyethylene screen. After shaking the strip is taken out and adhering soil particles are removed by rinsing with distilled water using an air-brush. The FeO on the paper with the P adsorbed onto it is dissolved in H2SO4 and P is determined in the acidic solution.
Equipment: 1. 15-cm discs of ash-free, hard filter paper (e.g. Schleicher & Schuell 589 red ribon or
Whatman No. 50) 2. Tweezers
Methods for P Analysis, J.L. Kovar and G.M. Pierzynski (eds)
26
3. Immersing baths 4. Polyethylene shaking bottles (100 mL) 5. Polyethylene screen (925 µm openings) 6. Shaking apparatus, end-over-end 7. Air brush
Reagents: 1. Acidified FeCl3 solution: completely dissolve 100 g FeCl3 in 110 mL concentrated HCl
and dilute with distilled water to 1 L. 2. 5 % NH4OH: dilute 200 mL NH4OH (25%) to 1 L with distilled water. 3. 0.01 M CaCl2: stock solution 0.1 M: dissolve 14.7 g CaCl2·2H2O in distilled water and
dilute to 1 L; reagent 0.01 M: dilute the stock solution tenfold with distilled water. 4. 0.1 M H2SO4: stock solution 2.5 M: add 140 mL of concentrated H2SO4 to 750 mL
distilled water, cool and dilute with distilled water to 1 L; reagent 0.1 M, dilute 40 mL of 2.5 M H2SO4 to 1 L with distilled water.
5. Distilled or deionized water.
Procedures: Preparation of FeO paper:
1. Immerse the filter paper in acidified FeCl3, using tweezers, for at least 5 min. 2. Let the paper drip dry at room temperature for 1 h. 3. Pull the paper rapidly and uninterrupted through a bath containing 2.7 M NH4OH to
neutralize the FeCl3 and produce amorphous iron (hydr)oxide (ferrihydrite, denoted as FeO).
4. Rinse the paper with distilled water to remove adhering particles of FeO. 5. After air drying, cut the paper into strips with a (reactive) surface of 40 cm2 (generally 2
by 10 cm). Shaking soil suspension with FeO strip added
1. Add 40 mL 0.01 M CaCl2 to 1 g of soil in a 100 mL bottle; add one strip protected by polyethylene screen, in a fixed position, at room temperature.
2. Shake on a reciprocating shaker at a speed of 130 excursions min-1, or at 4 rpm end-over-end, for 16 h.
3. Take out the strip, thoroughly rinse with distilled water to remove adhering soil particles using an air brush, and remove adhering water.
Determination of P extracted by FeO paper Dissolve the FeO with adsorbed P by shaking 1 h in 40 mL 0.1 M H2SO4 and determine P in the acidic extract with colorimetry or by inductively coupled plasma spectrophotometry.
Methods for P Analysis, J.L. Kovar and G.M. Pierzynski (eds)
27
Calculations: The FeO-extractable P content of a soil, also called Pi-value, is expressed as mg P kg-1 soil, and can be calculated as:
WVC
value P pi =
where:
Cp = P concentration in H2SO4, mg L-1, V = volume of H2SO4, L, W = mass of soil used, kg.
Comments: The method described above can be used as a standard method to estimate soil plant-
available P content. In case total desorbable P is studied one can use more FeO-strips during shaking, increase the shaking time, or the amount of FeO on a strip by using a higher concentration of FeCl3 (Chardon et al., 1996). When long-term desorption kinetics is studied the shaking time can be increased, the paper can be refreshed e.g. daily (Sharpley, 1996), or the technique with an FeO-filled dialysis membrane can be used (Freese et al., 1995; Lookman et al., 1995; Koopmans et al, 2001). Myers et al. (1997) described the use of 5.5 cm diameter filter paper circles, which eliminates the need for cutting strips.
As discussed in detail in Chardon et al. (1996) soil particles adhering to the strip when the FeO on the strip is dissolved in H2SO4 may give erroneous results, since P from the soil particles can also dissolve in the acid as if it was desorbed. The use of a nylon screen around the strip during shaking and an air-brush after shaking to clean the strip (Whelan et al., 1994) will strongly reduce this risk. Since temperature influences P desorption it is recommended to perform the procedure at a constant temperature in order to get reproducible results.
References: Amer, F., D.R. Bouldin, C.A. Black, and F.R. Duke. 1955. Characterization of soil phosphorus
by anion exchange resin adsorption and P32-equilibration. Plant Soil 6:391-408. Chardon, W.J., R.G. Menon, and S.H. Chien. 1996. Iron oxide-impregnated filter paper (Pi test):
a review of its development and methodological research. Nutr. Cycl. Agroecosyst. 46:41-51. Freese, D., R. Lookman, R. Merckx, and W.H. van Riemsdijk. 1995. New method for
assessment of long-term phosphate desorption from soils. Soil Sci. Soc. Am. J. 59:1295-1300.
Hsu, P.S., and C.I. Rich. 1960. Aluminum fixation in a synthetic cation exchanger. Soil Sci. Soc. Am. Proc. 24: 21-25.
Koopmans, G.F., N.E. van der Zeeuw, W.J. Chardon, and J. Dolfing. 2001. Selective extraction of labile phosphorus using dialysis membrane tubes filled with hydrous iron hydroxide. Soil Sci. 166:475-483.
Lookman, R., D. Freese, R. Merckx, K. Vlassak, and W.H. van Riemsdijk. 1995. Long-term kinetics of phosphate release from soil. Environ. Sci. Technol. 29:1569-1575.
Menon, R.G., S.H. Chien, and L.L. Hammond. 1990. Development and evaluation of the Pi soil test for plant-available phosphorus. Commun. Soil Sci. Plant Anal. 21:1131-1150.
Methods for P Analysis, J.L. Kovar and G.M. Pierzynski (eds)
28
Menon, R.G., S.H. Chien, and W.J. Chardon. 1997. Iron hydroxide-impregnated filter paper (Pi test): II. A review of its application. Nutr. Cycl. Agroecosyst. 47:7-18.
Myers, R.G., G.M. Pierzynski, and S.J. Thien. 1997. Iron oxide sink method for extracting soil phosphorus paper preparation and use. Soil Sci. Soc. Am. J. 61:1400-1407.
Robarge,W.P., and R.B. Corey. 1979. Adsorption of phosphate by hydroxy-aluminum species on a cation exchange resin. Soil Sci. Soc. Am. J. 43: 481-487.
Sharpley, A.N. 1996. Availability of residual phosphorus in manured soils. Soil Sci. Soc. Am. J. 60:1459-1466.
Sharpley, A.N., J.S. Robinson, and S.J. Smith. 1995. Bioavailable phosphorus dynamics in agricultural soils and effects on water quality. Geoderma 67:1-15.
Sissingh, H.A. 1983. Estimation of plant-available phosphates in tropical soils. A new analytical technique. Haren, Netherlands, Inst Soil Fertility Research.
Whelan, B.R., K. Wittwer, S.P. Roe, N.J. Barrow, and R.G.V. Bramley. 1994. An air brush and water to clean the iron oxide strips in the Pi soil test for phosphorus. Trans. 15th Int. Congress Soil Sci., Acapulco, Mexico, 1994, vol 5b pp 166-167.
Methods for P Analysis, J.L. Kovar and G.M. Pierzynski (eds)
29
Determination of the Degree of Phosphate Saturation in Noncalcareous Soils O.F. Schoumans, Alterra, Wageningen UR. Wageningen, The Netherlands
Introduction: The transport of phosphorus (P) by leaching, erosion and surface runoff from agricultural
soils can contribute to the eutrophication of surface waters. In flat areas with shallow groundwater tables, like many areas in the Netherlands, leaching can be an important transport pathway. In order to quantify the eutrophication risk of agricultural land in areas with intensive livestock production in the Netherlands (noncalcareous sandy soils), the degree of P saturation of soils has been introduced as a simple index (Breeuwsma and Schoumans, 1987; Breeuwsma et al., 1995). In general, the degree of P saturation (DPS) is defined as the ratio between the amount of phosphate accumulated in soils to a critical depth (Pact) and the maximum phosphate sorption capacity (PSC) of the soil to that depth. The relationship is described by:
100*PSCP
DPS act= Eq. (1)
where DPS = degree of phosphate saturation (%), Pact = actual amount of sorbed phosphate to the critical depth (mmol m-2), PSC = maximum phosphate sorption capacity to critical depth (mmol m-2)
In the Netherlands the mean highest groundwater level (MHW) is used as a critical depth.
The phosphate sorption capacity of soils depends on soil characteristics (e.g. aluminum, iron, clay, lime and organic matter). In acid to neutral soils fixation of P mainly takes place with reactive forms of Fe and Al (as hydroxides and Al and Fe bound to the organic matter). These reactive forms of Fe and Al can be extracted from soil samples (Beek, 1978; Schwertmann, 1964) by shaking at a 1:20 weight to volume ratio with a solution of oxalic acid and ammonium oxalate having a nearly constant pH of 3. The maximum phosphate sorption capacity of noncalcareous sandy soils, determined at a high concentration of P and with a long equilibration time, can be assessed by (Schoumans et al., 1986; Van der Zee, 1988):
i
n
iidioxox LFeAlPSC *.*)(5.0
1,∑
=
+= ρ Eq. (2)
where Alox = oxalate extractable aluminum of soil layer i (mmol kg-1), Feox = oxalate extractable iron of soil layer i (mmol kg-1), ρd,i = dry bulk density of soil layer i (kg m-3), Li = thickness of soil layer i (m) n = amount of observed layers.
Methods for P Analysis, J.L. Kovar and G.M. Pierzynski (eds)
30
The amount of P which is bound to the reactive amount of Al and Fe comes into solution with the oxalate extraction. Therefore, the actual amount of sorbed P can be calculated by means of:
i
n
iidioxact LPP *.*
1,,∑
=
= ρ Eq. (3)
where Pox = oxalate extractable P of soil layer i (mmol kg-1).
If the dry bulk densities of the observed layers (from the soil surface to the reference
depth) are identical, or a soil sample has been taken over the complete depth (on volume basis), the degree of P saturation can be calculated by the mean contents of Pox, Alox and Feox (in mmol kg-1) over the observed depth:
100*)(5.0 oxox
ox
FeAlP
DPS+
= Eq. (4)
Based on desorption characteristics of noncalcareous sandy soils, van der Zee et al.
(1990) have shown that at a degree of P saturation of 25% the P concentration in pore water will become higher than 0.1 mg L-1 ortho-P at the long term (after redistribution of the P front in the soil). In the Netherlands this concentration is used as a target level at the mean highest water table.
A disadvantage of the definition of the phosphate saturation degree is that this parameter depends on the phosphate sorption capacity of the soil (Equation 1), which varies from layer to layer and which is in most situations assessed (e.g., for noncalcareous sandy soils by means of 0.5 (Alox + Feox) ). In order to omit this assessment of the phosphate sorption capacity also an independent P saturation index (PSI) can be used:
oxox
ox
FeAlP
PSI+
= Eq. (5)
Reagents: 1. Extraction solution (pH = 3). Dissolve 16.2 g of ammonium oxalate monohydrate.
(COONH4)2·H20 and 10.8 g of oxalic acid dihydrate, (COOH2)·2H2O in water in a 1 L volumetric flask. The pH of this solution must be 3.0 ± 0.1.
2. Hydrochloric acid. 1 M. Dilute 83 mL of concentrated hydrochloric acid, HCl (ρ= 1.19 g cm-3), with water to volume of 1 L.
3. Hydrochloric acid. 0.01 M. Dilute 10 mL of 1 M HCl with water to volume of 1 L. 4. Standard Fe solution. 1000 mg L-1 5. Standard Al solution. 1000 mg L-1 6. Standard P solution. 500 mg L-1. Dissolve 2.1950 g of potassium dihydrogen phosphate
(KH2PO4) in water in a volumetric flask of 1 L and dilute to 1 L with water.
Methods for P Analysis, J.L. Kovar and G.M. Pierzynski (eds)
31
Procedure: The method, which is described below, is a summary of the Dutch norm (NEN 5776, 2006).
1. Weigh 2.5 (± 0.01) g of air-dry soil (< 2 mm) in a dry, 100 mL polyethene bottle. 2. Add with a dispenser 50 mL of the oxalate extraction solution (1) and close the bottle. 3. Prepare two blanks and take three reference samples. 4. Shake at 180 excursions min-1 on a reciprocating shaker for 2 h in a darkened conditioned
room at constant temperature (20 °C). 5. Filter the extracts through a fine filter paper (e.g., Whatman 42). 6. Discard the first three mL of the filtrate and collect the remainder in a 100 mL polyethene
bottle. Pipet 10 mL of the soil extracts in flasks. Add 40 mL of 0.01 M HCl (3) and mix. 7. Measure the concentration of P, Al and Fe within one week with ICP-AES.
Standards:
1. Pipette 0, 2.5, 10.0, 25.0, and 50.0 mL of each standard element solution ((4), (5) and (6)) into a volumetric flask of 1 L.
2. Add 10 mL of (1 M HCl) and 200 mL of (extraction solution) and mix. 3. Dilute to 1 L with water. This standard series contains 0, 1.25, 5.0, 12.5, and 25.0 mg L-1
P and 0, 2.5, 10.0, 25.0, and 50.0 mg L-1 Al and Fe.
Comments: The extraction should be performed in the dark because the extraction solution (1)
partially reduces the poorly soluble Fe3+ ions to the much more soluble Fe2+ ions and light influences the reducing action of oxalic acid. The soil filtrates should be stored in a refrigerator if they are not used directly for analysis.
Calculation:
97.30*05.0*)(
mbaPox
−= ,
85.55*05.0*)(
mbaFeox
−= , and
98.26*05.0*)(
mbaAlox
−=
where:
Pox, Feox, Alox = P, Fe, Al content of the air-dry soil sample, mmol kg-1 a = P, Fe, Al concentration in soil extraction solution, mg L-1 b = P, Fe, Al concentration in blank extraction solution, mg L-1 m = air-dry soil sample weight, g.
Methods for P Analysis, J.L. Kovar and G.M. Pierzynski (eds)
32
oxox
ox
FeAlP
PSI+
=
DPS= 200 PSI
Comments: Since the results of soil analysis are generally expressed on an “oven-dry” basis, the moisture content of “air-dry” soil should be determined shortly before soil analysis and the appropriate correction should be made.
References: Beek, J. 1978. Phosphate retention by soil in relation to waste disposal. Ph. D. Thesis,
Wageningen, The Netherlands. Breeuwsma, A., and O.F. Schoumans. 1987. Forecasting phosphate leaching on a regional scale.
p. 973-981. In W. van Duijvenboode and H.G. van Waegeningh (ed.) Proceedings of the Int. Conf. on Vulnerability of soil and groundwater to pollutants on March 30 to April 3, 1987 at Noordwijk aan Zee.. The Hague: TNO Committee on Hydrological Research, The Hague, Proceedings and Information No. 38.
Breeuwsma, A., J.G.A. Reijerink, and O.F. Schoumans, 1995. Impact of manure on accumulation and leaching of phosphate in areas of intensive livestock farming. p. 239-249. In K. Steele (ed.) Animal Waste and the Land-Water Interface. Lewis Publishers, New York.
NEN 5776, Soil. 2006. Determination of iron, aluminum and phosphorus in an ammonium oxalate-oxalic acid extract for estimation of the saturation with phosphate. Netherlands Normalization Institute (NNI), Delft, The Netherlands.
Schoumans, O.F., W. de Vries, and A. Breeuwsma. 1986. A phosphate transport model for application on regional scale. Winand Staring Centre for Integrated Land, Soil and Water Research, Wageningen, The Netherlands, Report 1951 (in Soil Survey series).
Schwertmann, U. 1964. Differenzierung der Eisenoxide des Bodens durch photochemische Extraktion mit saurer Ammoniumoxalat-Lösung. Z. Pflanzenernaehr. Dueng. Bodenkd. 105:194-202.
van der Zee, S.E.A.T.M. 1988. Transport of reactive contaminants in hetereogeneous soil systems. Ph. D. Thesis, Agricultural University, Wageningen, The Netherlands.
van der Zee, S.E.A.T.M., W.H. van Riemsdijk, and F.A.M. de Haan. 1990. Protocol phosphate saturated soils. Department of Soil Science and Plant Nutrition, Agricultural University, Wageningen, The Netherlands.
Methods for P Analysis, J.L. Kovar and G.M. Pierzynski (eds)
33
Phosphorus Sorption Isotherm Determination D.A. Graetz, University of Florida V.D. Nair, University of Florida
Introduction: Phosphorus (P) retention by soils is an important parameter for understanding soil
fertility problems, as well as for determining the environmental fate of P. The P sorption capacity of a soil or sediment is generally determined by batch-type experiments in which soils or sediments are equilibrated with solutions varying in initial concentrations of P. Equations such as the Langmuir, Freundlich and Tempkin models have been used to describe the relationship between the amount of P adsorbed and the P in solution at equilibrium (Berkheiser et al., 1980; Nair et al., 1984).
Advantages of the batch technique include: the soil and solution are easily separated, a large volume of solution is available for analysis, and the methodology can be easily adapted as a routine laboratory procedure. Disadvantages include difficulties in measuring the kinetics of the sorption reaction and optimizing the mixing of solution and soil without particle breakdown (Burgoa et al. 1990). Despite the disadvantages, the batch technique has been, and still is, widely used to describe P sorption in soils and sediments.
Nair et al. (1984) noted that P sorption varies with soil/solution ratio, ionic strength and cation species of the supporting electrolyte, time of equilibration, range of initial P concentrations, volume of soil suspension to head space volume in the equilibration tube, rate and type of shaking, and type and extent of solid/solution separation after equilibration. Although most researchers use a similar basic procedure for measuring P adsorption, there is considerable variation observed among studies with regard to the above parameters. This variation often makes comparisons of results among studies difficult. Thus, Nair et al. (1984) proposed a standard P adsorption procedure that would produce consistent results over a wide range of soils. This procedure was evaluated, revised, tested among laboratories and was eventually proposed as a standardized P adsorption procedure. This procedure as described below is proposed as the standard procedure recommended by the SERA-IEG 17 group.
Equipment: 1. Shaker: End-over-end type 2. Filter Apparatus: Vacuum filter system using 0.45 or 0.2 μm filters 3. Equilibration tubes: 50 mL or other size to provide at least 50% head space 4. Spectrophotometer: Manual or automated system capable of measuring at 880 nm
Reagents: 1. Electrolyte: 0.01 M CaCl2, unbuffered 2. Microbial inhibitor: Chloroform 3. Inorganic P solutions: Selected concentrations as KH2PO4 or NaH2PO4 (in 0.01 M CaCl2,
containing 20 g L-1 chloroform)
Procedure: 1. Air-dry soil samples and screen through a 2 mm sieve to remove roots and other debris.
Methods for P Analysis, J.L. Kovar and G.M. Pierzynski (eds)
34
2. Add 0.5 to 1.0 g air-dried soil to a 50 mL equilibration tube. 3. Add sufficient 0.01 M CaCl2 solution containing 0, 0.2, 0.5, 1, 5, and 10 mg P L-1 as
KH2PO4 or NaH2PO4, to produce a soil:solution ratio of 1:25. The range of P values could vary from 0 to 100 mg P L-1 and the soil/solution ratio could be as low as 1:10 depending on the sorbing capacity and the P concentrations of the soils in the study.
4. Place equilibration tubes on a mechanical shaker for 24 h at 25 ± 1 °C. 5. Allow the soil suspension to settle for an hour and filter the supernatant through a 0.45
μm membrane filter. 6. Analyze the filtrate for soluble reactive P (SRP) on a spectrophotometer at a wavelength
of 880 nm.
Calculations and Recommended Presentation of Results: Two of the often used isotherms are the Langmuir and the Freundlich isotherms; the
Langmuir having an advantage over the Freundlich in that it provides valuable information on the P sorption maximum, Smax and a constant k, related to the P bonding energy.
The Langmuir equation The linearized Langmuir adsorption equation is:
maxmax
1SC
kSSC
+=
where: S = S' + So, the total amount of P retained, mg/kg S' = P retained by the solid phase, mg/kg So = P originally sorbed on the solid phase (previously adsorbed P), mg/kg
C = concentration of P after 24 h equilibration, mg L-1 Smax = P sorption maximum, mg/kg, and k = a constant related to the bonding energy, L/mg P.
The linearized form of the Langmuir equation, as presented herein, is the most commonly used procedure to determine the sorption parameters for P because of its ease of use. The Langmuir equation in its nonlinear form may provide more accurate sorption parameters but fitting this model to experimental data requires a “trial and error” approach which is relatively difficult to accomplish. However, recent development of optimization programs to solve the nonlinear equation provides an opportunity to more easily utilize the nonlinear equation in P sorption studies (Bolster and Hornberger, 2007; Schulthess, 2007).
The Freundlich equation The linear form is:
log S = log K + n log C where: K is the adsorption constant, expressed as mg P/kg, n is a constant expressed as L/kg, and
Methods for P Analysis, J.L. Kovar and G.M. Pierzynski (eds)
35
C and S are as defined previously.
A plot of log S against log C will give a straight line with log K as the intercept, and n as the slope.
Previously adsorbed P (also referred to as native sorbed P) Adsorption data should be corrected for previously adsorbed P (So). For the calculation of
previously sorbed P, Nair et al. (1984) used isotopically exchangeable P (Holford et al., 1974) prior to calculations by the Langmuir, Freundlich and Tempkin procedures. Other procedures used to calculate the previously adsorbed P include oxalate-extractable P (Freese et al., 1992; Yuan and Lavkulich, 1994), anion-impregnated membrane (AEM) technology (Cooperband and Logan, 1994) and using the least squares fit method (Graetz and Nair, 1995; Nair et al., 1998; Reddy et al., 1998). Sallade and Sims (1997) used Mehlich 1 extractable P and Brock et al. (2007) have used Mehlich 3 extractable P as a measure of previously sorbed P.
Investigations by Villapando (1997) have indicated a good agreement among native sorbed P values estimated by the least squares fit method, oxalate extractions, and the AEM technology. At this point, it appears that selection of the method for determination of native sorbed P would depend on the nature of the soils in the study and reproducibility of the results. The procedure for calculation of So using the least square fit method is based on the linear relationship between S' and C at low equilibrium P concentrations. The relationship can be described by:
S' = K'C - So where
K' = the linear adsorption coefficient, and all other parameters are as defined earlier.
(Note: It is recommended that the linear portion of the isotherm has an r2 value of 0.95 or better).
Equilibrium P Concentration The “equilibrium P concentration at zero sorption” (EPC0) represents the P concentration
maintained in a solution by a solid phase (soil or sediment) when the rates of P adsorption and desorption are the same (Pierzynski et al., 1994). Values for EPC0 can be determined graphically from isotherm plots of P sorbed vs. P in solution at equilibrium. From the calculations given above, EPC0 is the value of C when S' = 0.
Comments: The above procedure was developed to provide a standardized procedure with a fixed set
of conditions that could be followed rigorously by any laboratory. The procedure uses a low and narrow range of dissolved inorganic P concentrations because these are the concentrations likely to be encountered in natural systems and because higher concentrations may result in precipitation of P solid phases. However, higher concentrations of P (up to 500 mg L-1) and/or lower soil:solution ratios (1:10) have been used for isotherm determinations on soils and sediments (Mozaffari and Sims, 1994; Sallade and Sims, 1997; Nair et al., 1998; Reddy et al., 1998, Brock et al, 2007). A 0.01 M KC1 solution may be used as the background electrolyte to avoid precipitation of Ca in neutral and alkaline soils.
Methods for P Analysis, J.L. Kovar and G.M. Pierzynski (eds)
36
Toluene and chloroform have been shown to increase the dissolved P concentration in the supernatant, apparently due to lysis of microbial cells, and thus, some researchers do not try to inhibit microbial growth (Reddy et al., 1998).
Most adsorption studies are conducted under aerobic conditions; however, with certain studies it is more appropriate to use anaerobic conditions, as they more closely represent the natural environments of the soils or sediments. Reddy et al. (1998) preincubated sediment/soil samples in the dark at 25oC under a N2 atmosphere, to create anaerobic conditions. Adsorption experiments were then conducted, performing all equilibrations and extractions in an O2-free atmosphere.
References: Berkheiser, V.E., J.J. Street, P.S.C. Rao, and T.L. Yuan. 1980. Partitioning of inorganic
orthophosphate in soil-water systems. CRC Critical Reviews in Environmental Control. 179-224.
Bolster, C. H. and G. M. Hornberger, 2007. On the use of linearized Langmuir equations. Soil Sci. Soc. Am. J. 71:1796-1806.
Brock, E.H., Q.M. Ketterings, and P.J. Kleinman. 2007. Measuring and predicting the phosphorus sorption capacity of manure-amended soils. Soil Sci. 172:266-278.
Burgoa, B., R.S. Mansell, and D. Rhue. 1990. Effects of solids concentrations upon non-equilibrium phosphorus sorption in aqueous soil suspensions. Soil and Crop Sci. Soc. Fla. Proc. 49:60-66.
Cooperband, L.R., and Logan T.L. 1994. Measuring in situ changes in labile soil phosphorus with anion-exchange membranes. Soil Sci. Soc. Am. J. 58:105-114.
Freese, D., S.E.A.T.M. van der Zee, and W.H. van Riemsdijk. 1992. Comparison of different models for phosphate sorption as a function of the iron and aluminum oxides of soils. J. Soil Sci. 43:729-738.
Graetz, D.A., and V.D. Nair. 1995. Fate of phosphorus in Florida Spodosols contaminated with cattle manure. Ecol. Eng. 5:163-181.
Holford, I.C.R, R.W.M. Wedderburn, and G.E.G. Mattingly. 1974. A Langmuir two surface equation as a model for phosphate adsorption by soils. J. Soil Sci. 25:242-255.
Mozaffari, M. and J.T. Sims. 1994. Phosphorus availability and sorption in Atlantic Coastal Plain watershed dominated by animal-based agriculture. Soil Sci. 157:97-107.
Nair. P.S., T.J. Logan, A.N. Sharpley, L.E. Sommers, M.A. Tabatabai, and T.L. Yuan. 1984. Interlaboratory comparison of a standardized phosphorus adsorption procedure. J. Environ. Qual. 13:591-595.
Nair, V.D., D.A. Graetz, and K.R. Reddy. 1998. Dairy manure influences on phosphorus retention capacity of Spodosols. J. Environ. Qual. 27:522-527.
Pierzynski, G.M., J.T. Sims and G.F.Vance. 1994. Soils and Environmental Quality. Lewis Publishers, Boca Raton, FL.
Sallade, Y.E., and J.T. Sims. 1997. Phosphorus transformations in the sediments of Delaware’s agricultural drainageways: I. Phosphorus forms and sorption. J. Environ. Qual. 26:1571-1579.
Schulthess, C. P. 2008. LMMpro (version 1.06). The Langmuir Optimization Program plus The Michaelis-Menten Optimization Program. (http://alfisol.com/soil.php).

Methods for P Analysis, J.L. Kovar and G.M. Pierzynski (eds)
37
Reddy, K.R., G.A. O’Connor, and P.M. Gale. 1998. Phosphorus sorption capacities of wetland soils and stream sediments impacted by dairy effluent. J. Environ. Qual. 27:438-447.
Villapando, R.R. 1997. Reactivity of inorganic phosphorus in the spodic horizon. Ph.D. Dissertation, University of Florida, Gainesville, Florida. (Diss. Abstr. Vol. 58. No. 7B). 258pp.
Yuan, G., and L.M. Lavkulich. 1994. Phosphate sorption in relation to extractable iron and aluminum in Spodosols. Soil Sci. Soc. Am. J. 58:343-346.
Methods for P Analysis, J.L. Kovar and G.M. Pierzynski (eds)
38
Bioavailable Phosphorus in Soil Andrew N. Sharpley, University of Arkansas
Introduction: Biologically available P (BAP) has been operationally defined as "..the amount of
inorganic P, a P-deficient algal population can utilize over a period of 24 h or longer" (Sonzogni et al., 1982). The amount of P in soil, sediment, and water that is potentially available for algal uptake (bioavailable P) can be quantified by algal assays, which require up to 100-d incubations (Miller et al., 1978). Thus, more rapid chemical extractions, such as those using NaOH (Butkus, et al., 1988; Dorich et al., 1980), NH4F (Porcella et al., 1970), ion exchange resin (Huettl et al., 1979) and citrate-dithionite-bicarbonate (Logan et al., 1979), have been used routinely to estimate bioavailable P. The weaker extractants (NH4F and NaOH) and short-term resin extractions may represent P that could be utilized by algae in the photic zone of lakes under aerobic conditions. In contrast, the more severe extractants (citrate-dithionite-bicarbonate) represent P that may become bioavailable under the reducing conditions found in the anoxic hypolimnion of stratified lakes.
Sharpley et al. (1991) showed that when using a wide solution:soil ratio (500:1), 0.1 M NaOH extractable P (NaOH-P) was closely related to the growth of several algal species. However, the complexity of algal assay and chemical extraction methods often limits their use by soil testing laboratories. For example, long assay incubation (7 to 100 d) and chemical extraction times (> 16 hr), as well as large solution volumes (> 500 mL) are particularly inconvenient. As the amount of P extracted depends on ionic strength, cationic species, pH, and volume of the extractant used (Hope and Syers, 1976; Sharpley et al., 1981), these limitations will be difficult to overcome. Questions also have been raised as to the validity of relating the form or availability of P extracted by chemical solutions to P bioavailability in the aquatic environment. As a result, P sink approaches have been developed to estimate BAP in soil, sediment, and water.
P-Sink Approaches: The concept of exposing the soil to a P-sink has merit toward the goal of assessing soil,
sediment, and water BAP (i.e., available to plants and algae) for both agronomic and environmental goals. Presumably, this would allow only P that was able to respond to such a sink to be measured, which is analogous to a root acting as a sink in the soil or to the concentration gradient that exists when a small quantity of sediment is placed in a large volume of water. The analogy of a root is not entirely accurate because root exudates and mycorrhizae fungi can alter P availability in the rhizosphere such that the root does not behave as a pure sink. Still, P-sinks are likely the closest manifestation of the root environment that are available. Some authors assume that the sink maintains extremely low P concentrations in the aqueous media employed and can be considered an "infinite P-sink" in the sense that P release by the soil is clearly the rate-limiting step (Sibbesen, 1978; van der Zee et al., 1987; Yli-Halla, 1990). For anion-exchange resins used at low resin:soil ratios, this relationship cannot be assumed (Barrow and Shaw, 1977; Pierzynski, 1991) and is not necessary for the assessment of bioavailable P.
Methods for P Analysis, J.L. Kovar and G.M. Pierzynski (eds)
39
Iron-oxide-Impregnated Paper Another P sink that has received attention is Fe-oxide impregnated filter paper, which has
successfully estimated plant available P in a wide range of soils and management systems (Menon et al., 1989; 1990, Sharpley, 1991). Also, Sharpley (1993) observed that the Fe-oxide strip P content of runoff was closely related to the growth of several algal species incubated for 29-d with runoff as the sole source of P. As the resin membranes and Fe-oxide strips act as a P sink, they simulate P removal from soil or sediment-water samples by plant roots and algae. Thus, they have a stronger theoretical justification for use over chemical extractants to estimate bioavailable P. These methods have potential use as environmental soil P tests to identify soils liable to enrich runoff with sufficient P to accelerate eutrophication. The Fe-oxide impregnanted filter paper procedure was described in the section by Chardon (2008) in this bulletin and will not be described further here.
Anion-exchange Resins The use of anion-exchange resins is the most common P-sink approach for assessing
available inorganic P in soils. The procedure typically involves the use of chloride-saturated resin at a 1:1 resin-to-soil ratio in 10 to 100 mL of water or weak electrolyte for 16 to 24 h (Amer et al., 1955; Olsen and Sommers, 1982). Correlations between plant response and resin-extractable P are comparable or superior to correlations with chemical extraction methods (Fixen and Grove, 1990).
Ion-exchange Resin-Impregnated Membranes A similar approach using ion-exchange resin impregnated membranes has been
investigated by several researchers (Abrams and Jarrell, 1992; Qian et al., 1992: Saggar et al., 1992). Impregnation of the resin onto a plastic membrane facilitates separation of the resin beads from the soil and may eliminate the soil grinding step. Also, an extraction time as short as 15 min can be used without reducing the accuracy of predicted P availability for a wide range of soils (Qian et al., 1992). In pot studies, the resin membranes have provided a better index of P availability than conventional chemical extraction methods for canola (Qian et al., 1992) and ryegrass (Saggar et al., 1992). It is likely that the utility of the resin membranes will make the use of loose resin obsolete.
Ion exchange membranes have the potential to estimate P availability in aquatic as well as soil environments. Edwards et al. (1993) used ion exchange membranes to obtain in-situ estimates of the chemical composition of river water for two Scottish watersheds. It was suggested that direct multi-element analysis by X-ray fluorescence of ions retained on the membranes removes the need for sample storage or filtration, both of which can be sources of potential contamination and error. Thus, the membranes can provide useful information in addition to that obtained by conventional sampling (Edwards et al., 1993).
Soil Sampling: Soil sampling protocol for environmental concerns should be re-evaluated since the
primary mechanism for P transport from most agricultural soils is by surface runoff and erosion. Although most samples submitted to soil testing laboratories are obtained from 0 to 20 cm, the zone of interaction of runoff waters with most soils is normally less than 5 cm. Consequently, environmental soil sampling should reflect this shallower depth of soil influencing runoff P. Hence, environmental soil samples should, in general, be taken from no deeper than 5 cm. This
Methods for P Analysis, J.L. Kovar and G.M. Pierzynski (eds)
40
protocol is compatible with sampling of no-till fields, currently recommended by extension specialists in several states, where the traditional 0- to 20-cm depth is split into two or three increments. Thus, on soils identified as vulnerable to P loss in runoff, the surface increment could be analyzed for environmental interpretation and all increments integrated for agronomic interpretations.
Equipment: The following equipment is needed to conduct BAP extraction of soil and analysis for P:
1. Resin membrane, anion exchange. 2. End-over-end shaker - used to equilibrate sample and sink 3. Volumetric flasks - usually 25 or 50 mL volume 4. Pipets to aliquot samples and color reagents 5. Spectrophotometer to determine P concentration in the color developed reagent with
sample.
Reagents:
Resin membranes 1. Hydrochloric acid to extract P from the membranes - 1.0 M HCl (166 mL concentrated
HCl in 2 L)
Murphy and Riley Molybdenum Blue Color Reagent 1. Murphy and Riley Reagent A:
a. Mix 1500 mL H2O and 125 mL H2SO4 and allow to cool down before adding molybdate and tartrate
b. Add 10.66 g ammonium molybdate c. Add 50 mL antimony potassium tartrate d. Make the solution up to 2 L e. Store in refrigerator
2. Murphy and Riley Reagent B: a. Dissolve 42 g ascorbic acid in 1 L b. Store in refrigerator
3. Murphy and Riley Reagent The color development reagent is made up by mixing nine parts of reagent A and 1 part of reagent B in a measuring cylinder. Each sample in a 25 mL volumetric flask requires 5 mL of this reagent. As it takes time to make up the Murphy and Riley reagent and some of the reagents are expensive (e.g., ammonium molybdate), only make up what is needed for the day. Also, solutions A and B, once mixed, will not keep for more than a day. For example, if you have 20 samples to run this will require at least 100 mL of color reagent plus standards and some for reruns. Thus, 250 mL of color reagent should be mixed, and this will require 225 mL of reagent A and 25 mL of reagent B.
4. Neutralizing Reagents: a. p-nitrophenol indicator (pnp - yellow): mix 1.5 g p-nitrophenol in 500 mL of
deionized distilled water on a magnetic stirrer until dissolved. Filter the solution to remove any undissolved residue.
b. 4 M NaOH: 160 g NaOH in 1 L
Methods for P Analysis, J.L. Kovar and G.M. Pierzynski (eds)
41
c. 0.1 M H2SO4: 11.1 mL conc. H2SO4 in 2 L 5. Solution Neutralizing
a. Add one drop of pnp indicator to an appropriate aliquot of the filtered solution on which P is to be measured in a volumetric flask.
b. Add 4 M NaOH to solution drop-wise until solution just turns yellow. c. Add 0.1 M H2SO4 drop-wise until solution just turns back to clear, the solution is now
neutral and the Murphy and Riley reagent can be added.
Resin Strip Procedure: 1. Anion exchange resin sheets are cut into 2 x 2 cm squares and are stored in propylene
glycol. Wash the resin squares in distilled water to remove all the propylene glycol. If not already saturated with an anion, saturation with C1- , HCO3- or acetate may be necessary. They are now ready for use.
2. Phosphorus is extracted from soil or sediment by shaking a 1-g sample and one resin membrane square in 40 mL of deionized distilled water end-over-end for 16 hours at 25° C.
3. Remove the resin membrane square and wash thoroughly with distilled water until all soil particles are removed.
4. The BAP content of runoff can also determined by shaking 50 mL of an unfiltered runoff sample with one resin membrane square for 16 hours. Smaller runoff sample volumes should be used if P concentrations are expected to be high (>1 or 2 mg L-1) and made up to 50 mL with distilled water.
5. Phosphorus retained on the resin membrane square is removed by shaking the square end-over-end with 40 mL of 1 M HCl for 4 hours. Remove square and rinse with distilled water. Retain the HCl desorption solution for analysis. Repeat this step. Do not mix the first and second desorption solutions.
6. Measure the P concentration of the two solutions separately. The total amount of P desorbed from the resin membrane square is the sum of the amounts in the two solutions.
Calculations: Resin extractable P (mg P/kg) = [Concentration of P in 1 MHCl, mg L-1] x [0.04 L ÷ 0.001 kg] Resin BAP in runoff (mg P L-1) = [concentration of P in 1 M HC1, mg L-1] x [0.04L ÷ volume of runoff, L]
References: Abrams, M.M., and W.M. Jarrell. 1992. Bioavailability index for phosphorus using nonexchange
resin impregnated membranes. Soil Sci. Soc. Am. J. 56:1532-1537. Amer, F., D.R. Bouldin, C.A. Black, and F.R. Duke. 1955. Characterization of soil phosphorus
by anion exchange resin and adsorption by P-32 equilibration. Plant Soil 6:391-408. Barrow, N.J., and T.C. Shaw. 1977. Factors affecting the amount of phosphate extracted from
soil by anion exchange resin. Geoderma 18:309-323. Butkus, S.R., E.B. Welch, R.R. Horner, and D.E. Spyridakis. 1988. Lake response modeling
using biologically available phosphorus. J. Water Pollut. Cont. Fed. 60:1663-1669.
Methods for P Analysis, J.L. Kovar and G.M. Pierzynski (eds)
42
Chardon, W.J. 2008. Phosphorus extraction with iron oxide-impregnated filter paper (Pi test). p. 25-28. In J.L. Kovar and G.M. Pierzynski (ed.), Methods for Phosphorus Analysis for Soils, Sediments, Residuals, and Waters – 2nd Edition. Southern Cooperative Series Bulletin No. 396.
Dorich, R.A., D.W. Nelson, and L.E. Sommers. 1980. Algal availability of sediment phosphorus in drainage water of the Black Creek watershed. J. Environ. Qual. 9:557-563.
Edwards, T., B. Ferrier, and R. Harriman. 1993. Preliminary investigation on the use of ion-exchange resins for monitoring river water composition. Sci. of Total Environ. 135:27-36.
Fixen, P.E., and J.H. Grove. 1990. Testing soils for phosphorus. p. 141-180. In R.L. Westerman (ed.) Soil testing and plant analysis. 3rd ed. SSSA Book Ser. 3. SSSA, Madison, WI.
Hope, G.D., and J.K. Syers. 1976. Effects of solution to soil ratio on phosphate sorption by soils. J. Soil Sci. 27:301-306.
Huettl, P.J., R.C. Wendt, and R.B. Corey. 1979. Prediction of algal available phosphorus in runoff suspension. J. Environ. Qual. 4:541-548.
Logan, T.J., T.O. Oloya, and S.M. Yaksich. 1979. Phosphate characteristics and bioavailability of suspended sediments from streams draining into Lake Erie. J. Great Lakes. Res. 5:112-123.
Menon, R.G., L.L. Hammond, and H.A. Sissingh. 1989. Determination of plant-available phosphorus by the iron hydroxide-impregnated filter paper (Pi) soil test. Soil Sci. Soc. Am. J. 52:110-115.
Menon, R.G., S.H. Chien, L.L. Hammond, and B.R. Arora. 1990. Sorption of phosphorus by iron oxide-impregnated filter paper (Pi soil test) embedded in soils. Plant Soil 126:287-294.
Miller, W.E., J.C. Greene, and T. Shiroyarna. 1978. The Selenastrum capricornutum Printz algal assay bottle test and data interpretation protocol. U.S. EPA, Tech. Rep. EPA-600/9-78-018. USEPA, Covallis, OR.
Olsen, S.R., and L.E. Sommers. 1982. Phosphorus. p. 403-429. In A.L. Page et al. (eds.), Methods of soil analysis. Agronomy No. 9, Part 2, 2nd ed., Am. Soc. of Agronomy, Madison, WI.
Pierzynski, G.M. 1991. The chemistry and mineralogy of phosphorus in excessively fertilized soils. Critical Reviews in Environ. Control 21:265-295.
Porcella, D.B., J.S. Kumazar, and E.J. Middlebrooks. 1970. Biological effects on sediment-water nutrient interchange. J. Sanit. Eng. Div., Proc. Am. Soc. Civil Eng. 96:911-926.
Qian, P., J.J. Schoenau, and W.Z. Huang. 1992. Use of ion exchange membranes in routine soil testing. Commun. Soil Sci. Plant Anal. 23:1791-1804.
Saggar, S., M.J. Hedley, R.E. White, P.E.H. Gregg, K.W. Perrot, and I.S. Conforth. 1992. Development and evaluation of an improved soil test for phosphorus. 2. Comparison of the Olsen and mixed cation-anion exchange resin tests for predicting the yield of ryegrass growth in pots. Fert. Res. 33:135-144.
Sharpley, A.N. 1991. Soil phosphorus extracted by iron-aluminum-oxide-impregnated filter paper. Soil Sci. Soc. Am. J. 55:1038-1041.
Sharpley, A.N. 1993. An innovative approach to estimate bioavailable phosphorus in agricultural runoff using iron oxide-impregnated paper. J. Environ. Qual. 22:597-601.
Sharpley, A.N., W.W. Troeger, and S.J. Smith. 1991. The measurement of bioavailable phosphorus in agricultural runoff. J. Environ. Qual. 20:235-238.
Sharpley, A.N., L.R. Ahuja, M. Yamamoto, and R.G. Menzel. 1981. The kinetics of phosphorus desorption from soil. Soil Sci. Soc. Am. J. 45:493-496.

Methods for P Analysis, J.L. Kovar and G.M. Pierzynski (eds)
43
Sibbesen, E. 1978. An investigation of the anion-exchange resin method for soil phosphate extraction. Plant Soil 50:305-321.
Sonzogni, W.C., S.C. Chapra, D.E. Armstrong, and T.J. Logan. 1982. Bioavailability of phosphorus inputs to lakes. J. Environ. Qual. 11:555-563.
van der Zee, S.E.A.T.M., L.G.J. Fokkink, and W.H. van Riemsdijk. 1987. A new technique for assessment of reversibly adsorbed phosphate. Soil Sci. Soc. Am. J. 51:599-604.
Yli-Halla, M. 1990. Comparison of a bioassay and three chemical methods for determination of plant-available P in cultivated soils of Finland. J. Agric. Sci. Finl. 62:213-319.
Methods for P Analysis, J.L. Kovar and G.M. Pierzynski (eds)
44
Total Phosphorus in Soil April Leytem, USDA-ARS, Northwest Irrigation and Soils Research Laboratory Kokoasse Kpomblekou-A, Tuskegee University
Introduction: As discussed by Bender and Wood (2000) in the first edition of this manual, there have
been many methods developed to extract and analyze total phosphorus (P) in soil (Bray and Kurtz, 1945; Muir, 1952; Jackson, 1958; Syers et al., 1968; Sommers and Nelson, 1972; Dick and Tabatabai, 1977; Olsen and Sommers, 1982; Bowman, 1988). Four methods have been more commonly used: sodium carbonate (Na2CO3) fusion (Jackson, 1958), perchloric acid (HClO4) digestion (Jackson, 1958), sulfuric acid-hydrogen peroxide-hydrofluoric acid (H2SO4-H2O2 -HF) digestion (Bowman, 1988), and sodium hypobromite (NaOBr) oxidation followed by H2SO4 dissolution (Dick and Tabatabai, 1977). These four methods convert soil organic P to inorganic P to allow total P determination (Kuo, 1996). Of these methods, Na2CO3 fusion is thought to give more reliable results (Syers et al., 1967; Syers et al., 1968; Sherrell and Saunders, 1966; Sommers and Nelson, 1972). Underestimation of total P by acid digestion is thought to be due to inability of these methods to extract P from apatite inclusions or imbedded in the matrix of silicate minerals (Syers et al., 1967). The ability of an acid digestion to extract P from inclusions depends upon the acid or combination of acids used. Syers et al. (1967) showed that the effectiveness of extraction generally followed the order: Na2CO3 fusion > HF digestion > HClO4 digestion > H2SO4 digestion > ignition. Methods developed by Sommers and Nelson (1972) and Bowman (1988) are variations of standard HClO4 and HF digestion methods. These methods were shown to give a similar degree of underestimation of total P as standard HClO4 digestion methods. Dick and Tabatabai (1977) proposed an alkaline oxidation method using NaOBr. This method was shown to give results 1% higher than those found by HClO4 digestion. However, the method still underestimated total P by 4% when compared to results from Na2CO3 fusion.
The methods presented here are similar to Na2CO3 fusion and HClO4 digestion as described by Kuo (1996) in Methods of Soil Analysis - Part 3 Chemical Methods, and the alkaline oxidation method developed by Dick and Tabatabai (1977). In addition, microwave-assisted acid digestion (Kingston and Jassie, 1988) is also included for laboratories that have the required equipment.
Sodium Carbonate Fusion (Kuo, 1996):
Reagents 1. Anhydrous sodium carbonate (Na2CO3) 2. 4.5 M H2SO4. Prepare by slowly adding 250 mL of concentrated H2SO4 to 500 mL of
deionized water in a 1-L volumetric flask. Cool the solution to room temperature and dilute to 1 L.
3. 2.5 M H2SO4. Prepare by slowly adding 140 mL of concentrated H2SO4 to 800 mL of deionized water in a 1-L volumetric flask. Cool the solution to room temperature and dilute to 1 L.
4. 1 M H2SO4. Prepare by slowly adding 56 mL of concentrated H2SO4 to 800 mL of deionized water in a 1-L volumetric flask. Cool the solution to room temperature and dilute to 1 L.
Methods for P Analysis, J.L. Kovar and G.M. Pierzynski (eds)
45
5. Sodium hydroxide, 5 M. Prepare by dissolving 200 g of NaOH in deionized water and dilute to 1 L.
6. p-nitrophenol indicator, 0.25%. Prepare by dissolving 0.25 g of p-nitrophenol in 100 mL of deionized water.
7. Ammonium paramolybdate [(NH4)6Mo7O24 ·4H2O]. Prepare by dissolving 12 g of (NH4)6Mo7O24 ·4H2O in 250 mL of deionized water. Store in a glass-stoppered bottle.
8. Potassium antimony tartrate (KSbO·C4H4O6·1/2 H2O). Prepare by dissolving 0.2728 g of KSbO·C4H4O6·1/2 H2O in 100 mL of deionized water.
9. Mixed reagent. Mix the ammonium paramolybdate, the potassium antimony tartrate, and the sulfuric acid (2.5 M) in a 2 L volumetric flask; mix well and make the volume with deionized water. Call this reagent A. Store in a dark and cool place.
10. Ascorbic acid. Prepare by dissolving 1.056 g of ascorbic acid into 150 ml of reagent A and dilute the volume to 200 mL. Call this reagent B. Prepare the solution the day it is required.
Procedure Place a mixture of 1.0 g of air-dried soil (<0.15 mm) and 4 g of Na2CO3 in a 30-mL
platinum (Pt) crucible. For soils high in Fe, use 0.5 g of soil. Place 1 g of Na2CO3 on top of the mixture. Drive off moisture from mixture by gently heating with a Meeker burner. Place a lid on the crucible so that approximately one fifth of the crucible remains open. Apply heat with a low flame for 10 min so the mass fuses gently. Adjust heat of Meeker burner to full, and heat mass for 15 to 20 min. To provide an oxidizing environment for this step, lift the lid of the crucible periodically. Do not allow the reduced portion of the flame to come in contact with the crucible. Remove crucible from flame. Rotate crucible as it cools so to deposit the melt thinly onto the walls of the crucible. After the crucible has cooled, gently roll it between your hands to facilitate the removal of the melt. Remove the melt with 30 mL of 4.5 M H2SO4, using care to avoid loss by effervescence. Place crucible and lid in a beaker containing 25 mL of 1 M H2SO4, and heat contents to a boil. Transfer the solution from the beaker and the solution from the melt to a 250 mL volumetric flask. Dilute the solution to volume using deionized water. Allow sediment to settle. Remove an aliquot of clear supernatant solution for total P analysis by the ascorbic acid method.
To analyze for total P, transfer an aliquot (2 mL) into a 50-mL volumetric flask (for samples containing <150 mg of P). With 5 M NaOH, adjust pH of the aliquot to 5 using five drops of p-nitrophenol indicator (color changes from colorless to yellow). Add 4 mL of reagent B, mix contents of the flask and bring to 50 mL volume with deionized water and mix thoroughly. Measure the absorbance at 880 nm; maximum color intensity develops in 10 min, and color is stable for 24 hours.
Comments The method for color development was described as outlined by Murphy and Riley
(1962) and Watanabe and Olsen (1965). It has the advantages over the stannous chloride method because of the longer stability of the heteropoly blue color and its tolerance of high salt and Fe3+ (up to 2.5 mg L-1) concentrations. It should be noted that polyphosphates and organic P compounds which hydrolyze in acid solution (Dick and Tabatabai, 1977a) and the presence of arsenic in the form of AsO3-
4 in soil samples gives the same blue color as phosphate. To eliminate this problem, AsO3-
4 can be
Methods for P Analysis, J.L. Kovar and G.M. Pierzynski (eds)
46
reduced to AsO3-3 using a NaHSO3 solution. The ascorbic acid method has been used extensively
in determining P concentrations in soils, acid (HClO4 or HF) digests and Na2CO3 fusion.
Calculations Total P, mg/kg = [Concentration of P in initial 250 mL dilution, mg L-1] x [0.25 L ÷ mass of soil, kg]
Perchloric Acid Digestion (Kuo, 1996):
Reagents 1. 70% Perchloric acid (HClO4). 2. Nitric acid (HNO3), concentrated.
M H2SO4. Prepare by slowly adding 140 mL of concentrated H2SO4 to 800 mL of deionized water in a 1-L volumetric flask. Cool the solution to room temperature and dilute to 1 L.
3. Potassium antimony tartrate (KSbO·C4H4O6·1/2 H2O). Prepare by dissolving 0.2728 g of KSbO·C4H4O6·1/2 H2O in 100 mL of deionized water.
4. Ammonium paramolybdate (NH4)6Mo7O24 ·4H2O]. Prepare by dissolving 12 g of (NH4)6Mo7O24 ·4H2O in 250 mL of deionized water. Store in a glass-stoppered bottle.
5. Mixed reagent. Mix the ammonium paramolybdate, the potassium antimony tartrate, and the sulfuric acid in a 2 L volumetric flask; mix well and make the volume with deionized water. Call this reagent A. Store in a dark and cool place.
6. Ascorbic acid. Prepare by dissolving 1.056 g of ascorbic acid into 150 ml of reagent A and dilute the volume to 200 mL. Call this reagent B. Prepare the solution the day it is required.
7. p-nitrophenol indicator, 0.25%. Prepare by dissolving 0.25 g of p-nitrophenol in 100 mL of deionized water.
8. Sodium hydroxide, 5 M. Prepare by dissolving 200 g of NaOH in deionized water and dilute to 1 L.
Procedure In a 250 mL volumetric or Erlenmeyer flask, mix 2.0 g of finely ground soil (<0.5 mm)
with 30 mL of 70% HClO4. Place a pyrex funnel on the Erlenmeyer flask to ensure reflux of the HClO4. Digest contents of the fask on a preheated sand bath on a hot plate at 130°C in a well-ventilated, perchloric acid hood until the dark color from organic matter disappears. Continue to heat at 203°C for 20 min longer. Heavy white fumes will appear, and the insoluble material will become like white sand. If any black particles stick to the side of the flask, add 1 or 2 mL of HClO4 to wash down the particles. If the sample is high in organic matter it may be necessary to add 20 mL of HNO3 and heat to oxidize organic matter before adding HClO4 (or alternatively allow the oxidation of organic matter to continue overnight at room temperature prior to HClO4 digestion). When digestion is complete, cool the mixture before bringing the volume to 250 mL with deionized water. Mix contents of the flask, and then allow sediment to settle.
To analyze for total P, transfer an aliquot into a 50-mL volumetric flask (for samples containing 2 to 40 µg P). Add five drops of p-nitrophenol indicator, mix flask contents, and adjust the solution pH (color changes from colorless to yellow) by adding dropwise 5 M NaOH. To develop the heteropoly blue color, add 4 mL of the reagent B, mix well the flask contents,
Methods for P Analysis, J.L. Kovar and G.M. Pierzynski (eds)
47
bring volume to 50 mL with deionized water, and mix thoroughly. Measure the absorbance at 880 nm; maximum color intensity develops in 10 min, and color is stable for 24 hours.
Calculations Total P, mg/kg = [Concentration of P in initial 250 mL dilution, mg L-1] x [0.25 ÷ mass of soil, kg]
Microwave Assisted Acid Digestion (EPA 3051A):
Reagents 1. Concentrated nitric acid (HNO3) 2. Concentrated hydrochloric acid (HCl)
Procedure Place a mixture of 0.25 g finely ground air dried soil into the microwave digestion vessel. While under a fume hood, add 9 mL of concentrated HNO3 and 3 mL of concentrated HCl. If a vigorous reaction occurs, allow the reaction to stop before capping the vessel. Cap the vessel and torque the cap according to the unit manufacturer’s directions. Place the vessels in the microwave carousel. The EPA method calls for a 10 minute digestion time (up to 175°C in less than 5.5 minutes and between 170-180°C for the balance of the 10 minutes). For example: Stage 1. Ramp temperature to 165°C over 2 minutes. Stage 2. Ramp temperature to 175°C over 3 minutes and then hold at 175° for 5 minutes. You can extend the digestion time to 12-17 minutes if necessary for better digestion. After vessels have cooled sufficiently in the microwave, remove the carousel and place samples in fume hood. Remove caps and transfer all of the digests into 100 mL volumetric flasks. Bring to volume and then filter (0.45 μm) into appropriate vessels for analysis using colorimetry or ICP.
Calculations Total P, mg/kg = [concentration of P in initial 100 mL dilution, mg L-1] x [0.1 L ÷ mass of soil, kg]
Alkaline Oxidation (Dick and Tabatabai, 1977):
Reagents 1. Sodium hypobromite solution (NaOBr-NaOH). Prepare by slowly adding 3 mL of
bromine (0.5 mL/min) to 100 mL of 2 M NaOH under constant stirring. Prepare reagent immediately prior to use.
2. 90 % formic acid (HCOOH) 3. 0.5 M H2SO4. Prepare by adding 27.8 mL H2SO4 to 800 mL of deionized water and
diluting to 1 L.
Methods for P Analysis, J.L. Kovar and G.M. Pierzynski (eds)
48
4. Sodium hydroxide, 5 M. Prepare by dissolving 200 g of NaOH in deionized water and dilute to 1 L.
5. p-nitrophenol indicator, 0.25%. Prepare by dissolving 0.25 g of p-nitrophenol in 100 mL of deionized water.
6. Ammonium molybdate-Antimony potassium tartrate solution. Prepare by dissolving 12 g of ammonium molybdate ((NH4)6Mo7O24 ·4H2O) in 250 mL of distilled water, and dissolving 0.2908 g of antimony potassium tartrate (KSbO·C4H4O6·1/2 H2O) in 100 mL of deionized water. Add both solutions to 1 L of 2.5 M sulfuric acid, and dilute volume to 2 L with deionized water. Store reagent in a cool place, in a dark Pyrex glass bottle.
7. Ascorbic acid reagent. Prepare by dissolving 1.056 g of ascorbic acid in 200 mL of ammonium molybdate-antimony reagent. Prepare reagent daily.
Procedure Place a 100 to 200 mg sample of finely ground (<100-mesh), air-dried soil in a 50 mL
boiling flask. Add 3 mL of sodium hypobromite solution to the flask, and swirl flask for a few seconds to mix contents. Allow flask to stand for 5 min. Swirl flask again and place it in a sand bath adjusted to a temperature between 260 and 280oC. The sand bath should be situated in a hood. Heat flask until contents evaporate to dryness. Evaporation time is 10 to 15 min. After evaporation, continue to heat for an additional 30 min. Remove flask from sand bath, and allow it to cool for 5 min. Then add 4 mL of deionized water and 1 mL of formic acid. Mix contents before adding 25 mL of 0.5 M H2SO4. Stopper flask and mix contents. Transfer mixture to a 50-mL plastic centrifuge tube and centrifuge sample at 12,000 rpm for 1 min.
To analyze for total P, transfer an aliquot of 1 to 2 mL into a 25-mL volumetric flask. Add five drops of p-nitrophenol indicator, mix flask contents, and adjust the solution pH (color changes from colorless to yellow) by adding dropwise 5 M NaOH. To develop the heteropoly blue color, add 4 mL of ascorbic acid reagent. Mix well the flask contents, bring volume to 25 mL with deionized water, and mix thoroughly. Measure the absorbance at 880 nm; maximum color intensity develops in 10 min, and color is stable for 24 hours.
Comments The sodium hypobromite (NaOBr-NaOH) reagent should be prepared just prior to use.
The reagent should be made in a fume hood. Formic acid added after the hypobromite treatment will destroy any residual hypobromite remaining after oxidation of the sample. The method is useful for routine analysis. Tests have shown that the amounts of P determined by this method are similar to those determined by the HClO4 method, but less than those determined by the Na2CO3 or H2SO4-H2O2-HF method (Bowman, 1988) when silicate minerals containing imbedded P minerals are present in samples.
Calculations Total P, mg/kg = [Concentration of P in initial formic acid/H2SO4 solution, mg L-1] x [0.03 L ÷ mass of soil, kg]
Methods for P Analysis, J.L. Kovar and G.M. Pierzynski (eds)
49
References: Bender, M.R., and C.W. Wood. 2000. Total phosphorous in soil. p. 45-49. In: G.M. Pierzynski
(ed.) Methods of phosphorus analysis for soils, sediments, residuals, and waters. Southern Cooperative Series Bulletin #396. North Carolina State Univ., Raleigh, NC.
Bowman, R.A. 1988. A rapid method to determine total phosphorus in soils. Soil Sci. Soc. Am. J. 52:1301-1304.
Bray, R.H., and L.T. Kurtz. 1945. Determination of total, organic, and available forms of phosphorus is soils. Soil Sci. 59:39-45.
Dick, W.A., and M.A. Tabatabai. 1977a. Determination of orthophosphate in aqueous solutions containing labile organic and inorganic phosphorus compounds. J. Environ. Qual. 6:82-85.
Dick, W.A., and M.A. Tabatabai. 1977b. An alkaline oxidation method for determination of total phosphorus in soils. Soil Sci. Soc. Am. J. 41:511-514.
Harwood, J.E., R.A. van Steenderen, and A.L. Kuhn. 1969. A rapid method for orthophosphate analysis at high concentrations in water. Water Res. 3:417-423.
Jackson, M.L. 1958. Soil chemical analysis. Prentice-Hall, Inc., Englewood Cliffs, N.J. Kingston, H.M., and L.B. Jassie. 1988. Introduction to Microwave Sample Preparation Theory
and Practice. ACS Professional Reference Book Series. American Chemical Society, Washington, DC.
Kuo, S. 1996. Phosphorus. p. 869-920. In: D.L. Sparks, A.L. Page, P.A. Helmke, and R.H. Loeppert (eds.), Methods of Soil Analysis. Part 3 Chemical Methods. SSSA Book Series No. 5, Soil Science Society of America, Inc., Madison, WI.
Muir, J.W. 1952. The determination of total phosphorus in soil. Analyst 77:313-317. Murphy, J., and J.P. Riley. 1962. A modified single solution method for determination of
phosphate in natural waters. Anal. Chim. Acta 27:31-36. Olsen, S.R., and L.E. Sommers. 1982. Phosphorus. p. 403-430. In: A.L. Page. R.H. Miller, and
D.R. Keeney (eds.), Methods of Soil Analysis. 2nd ed. Agronomy Series No.9, Part 2. Soil Science Society of America, Inc., Madison, WI.
Sherrell, C.G., and W.M.H. Saunders. 1966. An evaluation of methods for the determination of total phosphorus in soils. N.Z.J. Agric. Res. 9:972-979.
Sommers, L.E., and D.W. Nelson. 1972. Determination of total phosphorus in soils: a rapid perchloric acid digestion procedure. Soil Sci. Soc. Amer. Proc. 36:902-904.
Syers, J.K., J.D.H. Williams, A.S. Campbell, and T.W. Walker. 1967. The significance of apatite inclusions in soil phosphorous studies. Soil Sci. Soc. Amer. Proc. 31:752-756.
Syers, J.K., J.D.H. Williams, and T.W. Walker. 1968. The determination of total phosphorus in soils and parent materials. N.Z.J. Agric. Res. 11:757-762.
Watanabe, F.S., and S.R. Olsen. 1965. Test of an ascorbic acid method for determinatiing phosphorus in water and NaHCO3 extracts from soil. Soil Sci. Am. Proc. 29:677-678.
Methods for P Analysis, J.L. Kovar and G.M. Pierzynski (eds)
50
Fractionation of Soil Phosphorus Hailin Zhang, Oklahoma State University John L. Kovar, USDA-ARS National Soil Tilth Laboratory
Introduction: The biogeochemistry of phosphorus (P) in soils is complicated. Inorganic P can react
with calcium (Ca), iron (Fe) and aluminum (Al) to form discrete phosphates. Organic P can be found in forms with varying resistance to microbial degradation.
The fractionation procedure of Chang and Jackson (1957) has been widely used to investigate the forms of inorganic P (Pi) and transformations of applied P fertilizers. Subsequent research indicated that the various extractants were not as specific as first envisioned. For example, retention of P by calcium fluoride (CaF2), formed from calcium carbonate (CaCO3) during ammonium fluoride (NH4F) extraction, affects results when the Chang and Jackson (1957) method is used to fractionate P in calcareous soils and sediments. Since its development, modifications made by Fife (1962), Peterson and Corey (1966), Williams et al. (1967), and Smillie and Syers (1972) have improved extractability and allowed for use with calcareous soils. The original fractionation procedures and the most important modifications were summarized by Kuo (1996). The Pi fractionation scheme in this chapter is primarily based on the procedures described by Kuo (1996).
Soil organic P (Po) consists of inositol phosphates, phospholipids, nucleic acids, phosphoproteins, and various sugar phosphates, as well as a significant number of compounds that have yet to be identified. Organic P tied up in microbial biomass consists of nucleic acids, inositol phosphates, and polyphosphates. Microbial biomass P usually represents a small fraction of the total P in soil, and rapidly turns over to supply inorganic P to plant roots (Tate, 1984). Quantification of the various known Po compounds in soil has been described in several studies (Anderson, 1967; Halstead and Anderson, 1970; Stott and Tabatabai, 1985) and is advocated by Kuo (1996) as a means of fractionating soil Po. An alternative method for characterizing soil Po fractions involves the use of acid and alkaline extractants that separate the various fractions based on the type and strength of Po physicochemical interactions with other soil components (Bowman and Cole, 1978; Hedley et al., 1982; Cross and Schlesinger, 1995). The most common extractants are 0.5 M sodium bicarbonate (NaHCO3) and various concentrations of hydrochloric acid (HCl) and sodium hydroxide (NaOH). The fractionation scheme involves a sequence of extractions that separates soil Po into labile, moderately labile, and nonlabile fractions. In recent years, this scheme has been widely used to evaluate Po cycling in diverse soils under varying management (Hedley et al., 1982; Sharpley and Smith, 1985; Ivanoff et al., 1998).
The qualitative and quantitative information provided by fractionation data is useful for addressing both agronomic and water quality issues (Hountin et al., 2000; Schroeder and Kovar, 2006). Phosphorus fractionation data are also useful for understanding P biogeochemistry in extreme environments (Cross and Schlesinger, 2001; Blecker et al., 2006).
Fractionation of Inorganic Phosphorus:
Principles The fractionation procedures are based on the differential solubilities of the various inorganic P forms in various extracts. Ammonium chloride (NH4Cl) is used first to remove soluble and
Methods for P Analysis, J.L. Kovar and G.M. Pierzynski (eds)
51
loosely bound P. Al-P is separated from Fe-P with NH4F, then Fe-P is removed with NaOH. Reductant-soluble P within the matrices of retaining aggregates/minerals (Evans and Syers, 1971) is removed with CDB (sodium citrate (Na3C6H5O7•2H2O)-sodium dithionite (Na2S2O4)-sodium bicarbonate) extraction. The Ca-P is extracted with sulfuric acid (H2SO4) or HCl, because Ca-P is insoluble in CDB. Since NH4F reacts with CaCO3 in calcareous soils to form CaF2, which will precipitate soluble P and reduce the effectiveness of NH4F to extract P, the NH4F extraction is omitted for calcareous soils. In calcareous soils, however, the initial NaOH/NaCl extraction will remove soluble L-1oosely bound P as well as a fraction of both Al-P and Fe-P.
Equipment 1. Balance 2. Shaker 3. Centrifuge and 100-mL centrifuge tubes 4. Hot water bath 5. Spectrophotometer
Reagents (N.B. Not all reagents are used in procedures for noncalcareous and calcareous soils.)
1. 1 M NH4Cl. Dissolve 53.3 g of NH4Cl in 1 L deionized water. 2. 0.5 M NH4F, pH 8.2. Dissolve 18.5 g of NH4F in 1 L deionized water and adjust pH to 8.2
with 4 M NH4OH. 3. 2 M and 0.1 M NaOH. Dissolve 80 g and 4.0 g, respectively, of NaOH in 1 L deionized
water. 4. 0.1 M NaOH + 1 M NaCl. Dissolve 4.0 g of NaOH and 58.5 g of NaCl in 1 L deionized
water. 5. Saturated NaCl. Add ~ 400 g of NaCl to 1 L deionized water. 6. 0.25 M H2SO4. Dilute 14 mL of concentrated H2SO4 to 1 L with deionized water. (N.B.
Always add acid to water.) 7. 2 M HCl. Dilute 168 mL of concentrated HCl to 1 L with deionized water. 8. 0.5 M HCl. Dilute 42 mL of concentrated HCl to 1 L with deionized water. 9. 0.3 M Na3C6H5O7•2H2O. Dissolve 88.2 g of Na3C6H5O7•2H2O in 1 L deionized water. 10. 1 M NaHCO3. Dissolve 84 g of NaHCO3 in 1L deionized water. 11. 0.8 M H3BO3. Dissolve 50 g of H3BO3 in 1 L deionized water. 12. Na2S2O4, reagent grade. 13. p-nitrophenol indicator. Dissolve 0.25 g of p-nitrophenol in 100 mL deionized water. 14. Phospho-molybdate reagents. Dissolve 12 g of ammonium paramolybdate
[(NH4)6Mo7O24•4H2O] in 250 mL of deionized water. Dissolve 0.2908 g of potassium antimony tartrate (KSbO•C4H4O6) in 100 mL of deionized water. Add these solutions to 1 L of 2.5 M H2SO4 (141 mL of concentrated H2SO4 diluted to 1 L), mix thoroughly, and after cooling, dilute to 2 L with deionized water. Store solution (Reagent A) in a dark, cool place. To prepare reagent B, dissolve 1.056 g of L-ascorbic acid (C6H8O6) in 200 mL of Reagent A, and mix. Reagent B should be prepared as needed, because it must be used within 24 h.
Methods for P Analysis, J.L. Kovar and G.M. Pierzynski (eds)
52
Procedures for Noncalcareous Soils (see flow chart, Fig. 1) 1. Add 1.0 g (<2 mm) of soil and 50 mL of 1M NH4Cl to a 100 mL centrifuge tube and
shake for 30 min to extract the soluble and loosely bound P. Centrifuge and decant the supernatant into a 50-mL volumetric flask and bring to volume with deionized water (extract A).
2. Add 50 mL of 0.5 M NH4F (pH 8.2) to the residue and shake the suspension for 1 h to extract aluminum phosphates. Centrifuge and decant the supernatant into a 100-mL volumetric flask (extract B). Wash the soil sample twice with 25-mL portions of saturated NaCl and centrifuge. Combine the washings with extract B and bring to volume.
3. Add 50 mL of 0.1 M NaOH to the soil residues and shake for 17 h to extract iron phosphates. Centrifuge and decant the supernatant solution into a 100-mL volumetric flask (extract C). Wash the soil twice with 25-mL portions of saturated NaCl and centrifuge. Combine the washings with extract C and bring to volume.
4. Add 40 mL of 0.3 M Na3C6H5O7•2H2O and 5 mL of 1 M NaHCO3 to the residue, and heat the suspension for 15 min in a water bath at 85°C. Add 1.0 g of Na2S2O4 (sodium dithionate) and stir rapidly to extract reductant-soluble P. Continue to heat for 15 min and then centrifuge. Decant the supernatant solution into a 100-mL volumetric flask (extract D). Wash the soil twice with 25-mL portions of saturated NaCl and centrifuge. Combine the washings with extract D, and dilute to volume. Expose extract D to air to oxidize Na2S2O4.
5. Add 50 mL of 0.25 M H2SO4 to the soil residue and shake for 1 h. Centrifuge the suspension for 10 min and decant the supernatant into a 100-mL volumetric flask (extract E). Wash the soil twice with 25-mL portions of saturated NaCl, and centrifuge. Combine the washings with the extract E and dilute to volume.
6. Transfer an aliquot containing 2 to 40 µg P from each of extracts A, B, C, D, and E to separate 50-mL volumetric flasks. Add five to 10 mL deionized water and five drops of p-nitrophenol indicator to the volumetric flasks containing extracts C and E, and adjust the pH with 2 M HCl or 2 M NaOH until the indicator color just changes. The indicator color changes from yellow to colorless for extract C, and from colorless to yellow for extract E. Add 15 mL 0.8 M H3BO3 to the volumetric flask containing extract B. Phosphorus concentrations in the various solutions can be determined using the phospho-molybdate method (Murphy and Riley, 1962). Prepare P standards that contain the same volume of extracting solution as in the extracts.
Calculations The amount of P in each fraction is calculated with the following equation:
P concentration in given fraction (mg kg-1) = [Conc. of P (mg L-1) x Volume of extractant (L)] ÷ mass of soil (kg)
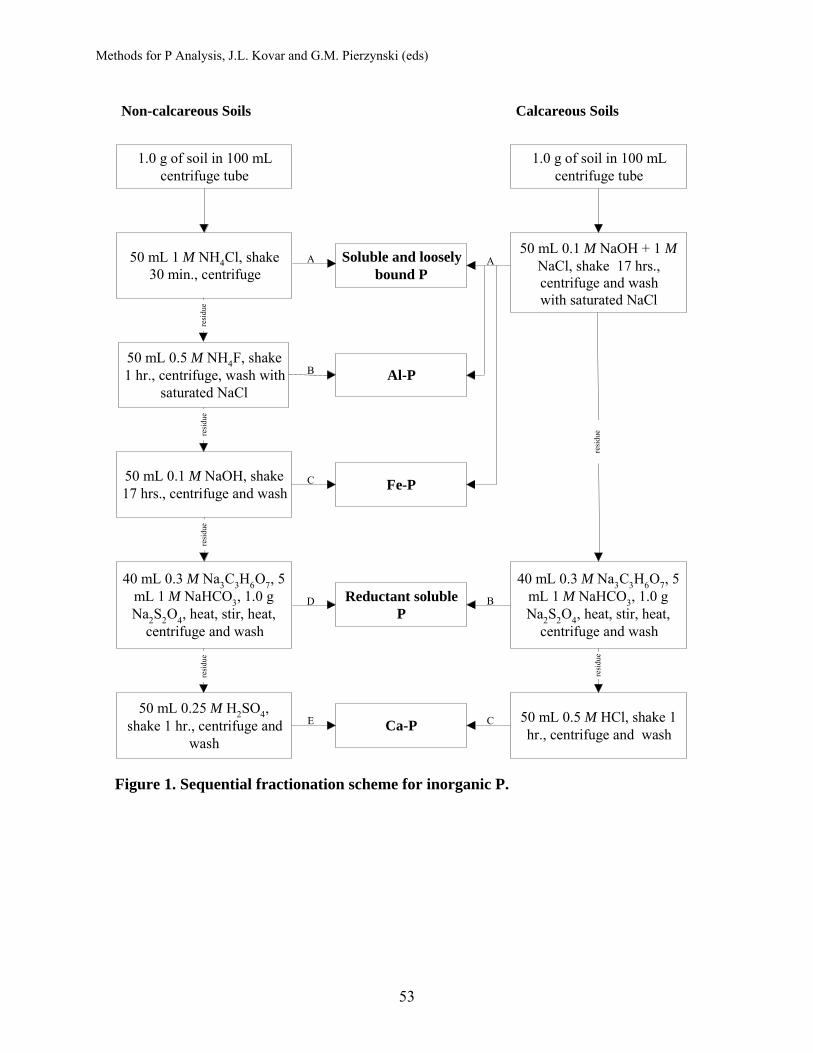
Methods for P Analysis, J.L. Kovar and G.M. Pierzynski (eds)
53
Figure 1. Sequential fractionation scheme for inorganic P.
1.0 g of soil in 100 mL centrifuge tube
50 mL 0.5 M NH 4 F, shake 1 hr., centrifuge, wash with
saturated NaCl
50 mL 1 M NH 4 Cl, shake 30 min., centrifuge
50 mL 0.1 M NaOH, shake 17 hrs., centrifuge and wash
40 mL 0.3 M Na 3 C 3 H 6 O 7 , 5 mL 1 M NaHCO 3 , 1.0 g Na 2 S 2 O 4 , heat, stir, heat,
centrifuge and wash
50 mL 0.25 M H 2 SO 4 , shake 1 hr., centrifuge and
wash
Non-calcareous Soils
Soluble and looselybound P
Al-P
Fe-P
Reductant solubleP
Ca-P
Calcareous Soils
1.0 g of soil in 100 mLcentrifuge tube
50 mL 0.1 M NaOH + 1 MNaCl, shake 17 hrs.,centrifuge and wash with saturated NaCl
40 mL 0.3 M Na 3 C 3 H 6 O7, 5mL 1 M NaHCO 3 , 1.0 gNa2S2O 4 , heat, stir, heat,
centrifuge and wash
50 mL 0.5 M HCl, shake 1hr., centrifuge and wash
A
B
C
C
B
E
D
A
resi
due
resi
due
resi
due
resi
due
resi
due
resi
due
Methods for P Analysis, J.L. Kovar and G.M. Pierzynski (eds)
54
Procedures for Calcareous Soils (see flow chart, Fig. 1) 1. Add 1.0 g (<2 mm) of soil and 50 mL of 0.1 M NaOH + 1 M NaCl to a 100 mL
centrifuge tube and shake for 17 h. Centrifuge and decant the supernatant solution into a 100-mL volumetric flask (extract A). Wash the soil twice with 25-mL portions of saturated NaCl and centrifuge. Combine the washings with extract A and bring to volume.
2. Add 40 mL of 0.3 M Na3C6H5O7•2H2O and 5 mL of 1 M NaHCO3 to the residue and heat the suspension in a water bath at 85ºC. Add 1.0 g of Na2S2O4 and stir rapidly. Continue to heat for 15 min and centrifuge. Decant the supernatant solution into a 100-mL volumetric flask (extract B). Wash the soil twice with 25-mL portions of saturated NaCl and centrifuge. Combine the washings with extract B, and dilute to volume. Expose extract B to air to oxidize Na2S2O4.
3. Add 50 mL of 0.5 M HCl to the soil residue and shake for 1 h. Centrifuge the suspension, and decant the supernatant into a 100-mL volumetric flask (extract C). Wash the soil twice with 25-mL portions of saturated NaCl, and centrifuge. Combine the washings with extract C and dilute to volume.
4. Transfer an aliquot containing 2 to 40 µg P from each of extracts A, B, and C to separate 50-mL volumetric flasks. Add five to 10 mL deionized water and five drops of p-nitrophenol indicator to each of the volumetric flasks containing extracts A and C, and adjust the pH with 2 M HCl or 2 M NaOH. The indicator color changes from yellow to colorless for Extract A, and from colorless to yellow for Extract C. Phosphorus concentrations in the various solutions can be determined using the phospho-molybdate method (Murphy and Riley, 1962). Prepare P standards that contain the same volume of extracting solution as in the extracts.
Calculations The amount of P in each fraction is calculated with the following equation:
P concentration in given fraction (mg kg-1) = [Conc. of P (mg L-1) x Volume of extractant (L)] ÷ mass of soil (kg)
Comments: If a supply of 100-mL centrifuge tubes is a problem, smaller tubes (e.g., 50-mL or 40-
mL) can be used. In this case, the sample size and volume of extracting solutions should be decreased by half.
Dithionite, citrate, iron, and silicon are potential interferences for the determination of reductant soluble P mobilized by the CDB extractant. Excess dithionite must be oxidized to prevent precipitation of sulfur when the acid-molybdate reagent (Murphey and Riley, 1962) is added to the extract. If exposure of the extracts to air for several hours does not solve the problem with blue color development, it may be necessary to bubble air through the extracts, as suggested by Weaver (1974). To correct the problem with excess citrate, add 3 mL of a 5% ammonium molybdate solution to each sample before adding the acid-molybdate reagent (Weaver, 1974). When citrate concentration in the extract is greater than that of molybdate, the formation of the phospho-molybdate complex fails, so that the blue color does not develop.
Methods for P Analysis, J.L. Kovar and G.M. Pierzynski (eds)
55
Fractionation of Organic Phosphorus:
Principles In general, this fractionation scheme follows the procedures developed by Bowman and
Cole (1978), and modified by Sharpley and Smith (1985) and Ivanoff et al. (1998). Organic P in both calcareous and noncalcareous soils is fractionated into a labile pool, a moderately labile pool, and a nonlabile pool. The labile pool is extracted with 0.5M NaHCO3 at pH 8.5. The extracted P includes both Po and Pi in soil solution and sorbed on soil colloids. If desired, microbial biomass P in the soil can be determined at this point via a chloroform (CHCl3) fumigation technique (Hedley et al., 1982). The moderately labile pool is extracted with 1.0 M HCl, followed by 0.5 M NaOH. The NaOH extract is acidified with concentrated HCl to separate the nonlabile fraction (humic acid fraction) from the moderately labile fraction (fulvic acid fraction). Finally, the highly resistant, nonlabile fraction is determined by ashing the residue from the NaOH extraction at 550°C for 1 h, followed by dissolution in 1.0 M H2SO4. The complete soil Po fractionation scheme is shown in Figure 2. In all cases, P concentration in the extracts is determined colorimetrically by the phospho-molybdate method of Murphy and Riley (1962). Acid or alkaline extracts are neutralized prior to P determinations. Organic P in the extracts is calculated from the difference between total P and Pi. Total P in the extracts is measured after an aliquot is digested with 2.5 M H2SO4 and potassium persulfate (K2S2O8), according to the method of Bowman (1989), as modified by Thien and Myers (1992).
Equipment 1. Balance 2. Calibrated scoop 3. Reciprocating shaker 4. Centrifuge and 100 mL tubes 5. Hot plate 6. Muffle furnace 7. Spectrophotometer
Reagents 1. 0.5 M NaHCO3 solution. Dissolve 42 g of NaHCO3 in 1 L deionized water. Adjust the pH
of this solution to 8.5 with 1 M NaOH (40 g of NaOH in 1 L deionized water). Avoid exposure of solution to air. Prepare fresh solution if solution has been stored more than 1 month in a glass container. Solution can be stored more than 1 month in polyethylene, but pH should be checked each month.
2. p-nitrophenol indicator. Dissolve 0.25 g of p-nitrophenol in 100 mL of deionized water. 3. Concentrated HCl. 4. 2 M and 1 M HCl. Dilute 168 mL and 84 mL, respectively, of concentrated HCl to 1 L
with deionized water. (N.B. Add acid to water.) 5. 2.5 M and 1 M H2SO4. Dilute 141 mL and 56 mL, respectively, of concentrated H2SO4 to
1 L with deionized water. 6. 2 M and 0.5 M NaOH. Dissolve 80 g and 20 g, respectively, of NaOH in 1 L deionized
water. 7. K2S2O8 – reagent grade 8. CHCl3 – ethanol free, reagent grade
Methods for P Analysis, J.L. Kovar and G.M. Pierzynski (eds)
56
9. Phospho-molybdate reagents. Dissolve 12 g of ammonium paramolybdate [(NH4)6Mo7O24•4H2O] in 250 mL of deionized water. Dissolve 0.2908 g of potassium antimony tartrate (KSbO•C4H4O6) in 100 mL of deionized water. Add these solutions to 1 L of 2.5 M H2SO4 (141 mL of concentrated H2SO4 diluted to 1 L), mix thoroughly, and after cooling, dilute to 2 L with deionized water. Store solution (Reagent A) in a dark, cool place. To prepare reagent B, dissolve 1.056 g of L-ascorbic acid (C6H8O6) in 200 mL of Reagent A, and mix. Reagent B should be prepared as needed, because it must be used within 24 h.
Procedures (see flow chart, Fig.2)
Labile Organic P: Weigh duplicate 1.0 g (oven-dry weight basis) samples of sieved (2 mm), field-moist soil
into two 100 mL centrifuge tubes. To one tube, add 50 mL of 0.5 M NaHCO3 (pH 8.5) and place sample horizontally on a reciprocating mechanical shaker for 16 h. At the end of the extraction period, centrifuge sample at 7000 rpm for 15 min and filter supernatant through Whatman No. 41 quantitative paper into a 50-mL volumetric flask. Bring to volume with deionized water and mix well.
To determine labile Pi, transfer an aliquot containing 2 to 40 μg P to a 50-mL volumetric flask, add five drops of p-nitrophenol indicator to the flask and adjust the pH with 2 M HCl until the indicator color just changes from pale yellow to colorless. Add approximately 40 mL of deionized water to the flask, followed by 8 mL of Reagent B. Bring to volume with deionized water, and mix well. After 20 min., determine P concentration on a calibrated spectrophotometer at 880 nm.
To determine total labile P in the extract, add 0.5 g of K2S2O8 with a calibrated scoop to a 25-mL volumetric flask, transfer an appropriate aliquot (usually 1 to 5 mL, depending on P concentration) of the extract into the flask, and add 3 mL of 2.5 M H2SO4. Digest sample on a hot plate at >150°C for 20 to 30 min. Digestion is complete after vigorous boiling subsides. Cool sample, add 5 mL of deionized water. After mixing, add five drops of p-nitrophenol indicator to the flask and adjust the pH with 2 M NaOH. Add approximately 10 mL of deionized water to the flask, followed by 4 mL of Reagent B. Bring to volume with deionized water, and mix well. After 20 min., determine P concentration on a calibrated spectrophotometer at 880 nm.
The difference between total labile P following persulfate oxidation and labile Pi gives an estimate of labile Po. The Pi analysis should be performed as soon as possible after the soil extraction to minimize hydrolysis of Po.
To estimate P associated with soil microbial biomass, treat the second duplicate weighed sample with 2 mL of ethanol-free CHCl3. Cover the uncapped tubes loosely with paper towels and place under a fume hood for 24 h. At the end of this period, extract samples with 0.5 M NaHCO3 as previously described for total labile P. The difference between the amounts of total labile P in the CHCl3-treated and untreated duplicate soil samples provides a measure of biomass P that originated from lysed microbial cells.
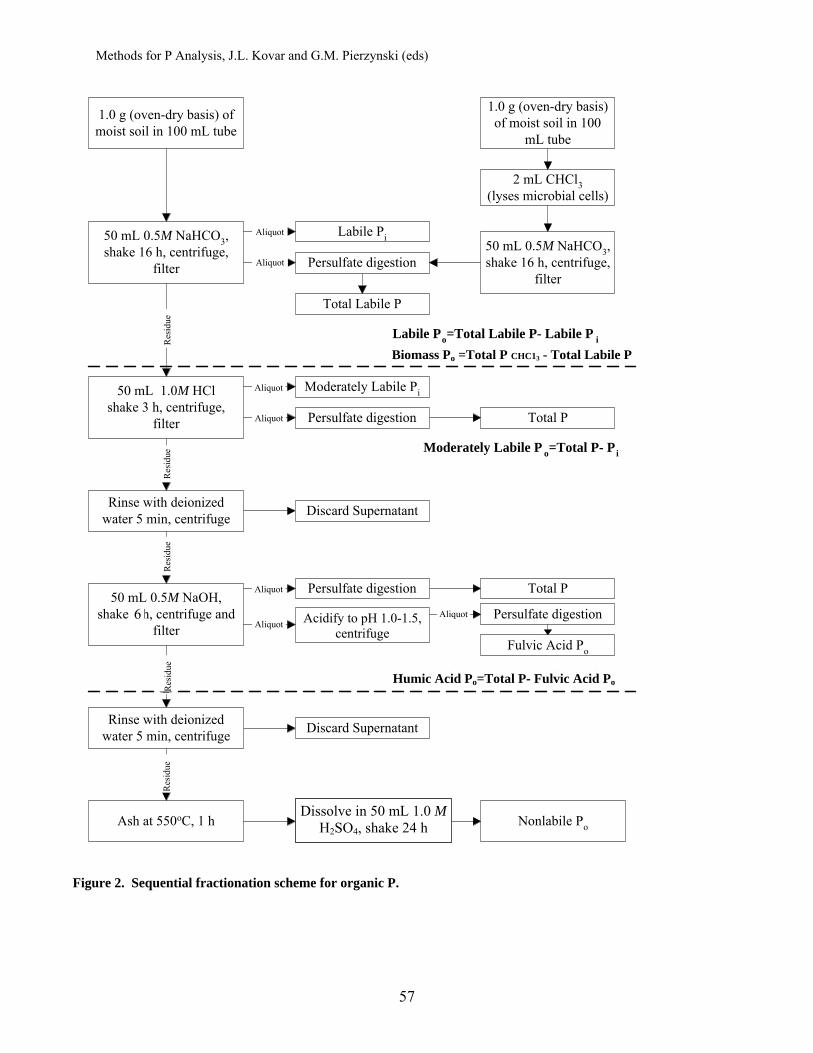
Methods for P Analysis, J.L. Kovar and G.M. Pierzynski (eds)
57
1.0 g (oven-dry basis) ofmoist soil in 100 mL tube
50 mL 1.0M HClshake 3 h, centrifuge,
filter
50 mL 0.5M NaHCO3,shake 16 h, centrifuge,
filter
Rinse with deionizedwater 5 min, centrifuge
50 mL 0.5M NaOH,shake 3 h, centrifuge and
filter
Ash at 550oC, 1 h
Labile Pi
1.0 g (oven-dry basis)of moist soil in 100
mL tube
Dissolve in 1.0 MH2SO4, shake 24 h
Res
idue
Res
idue
Res
idue
2 mL CHCl3(lyses microbial cells)
50 mL 0.5M NaHCO3,shake 16 h, centrifuge,
filterPersulfate digestion
Total Labile P
Aliquots
Moderately Labile Pi
Persulfate digestion Total P
Discard Supernatant
Persulfate digestion
Acidfy to pH 0.2,centrifuge
Persulfate digestion
Total P
Fulvic Acid Po
Rinse with deionizedwater 5 min, centrifuge Discard Supernatant
Aliquots
Labile Po=Total Labile P- Labile P i
Biomass Po=Total Labile P- Total P CHCl3
Moderately Labile P o=Total P- Pi
Res
idue
Aliquot
Aliquot
Aliquot
Aliquot
Humic Acid Po= Total P- Fuvlic Acid P o
Res
idue
Aliquot
Nonlabile Po
Figure 2. Sequential fractionation scheme for organic P.
Res
idue
R
esid
ue
Res
idue
R
esid
ue
Res
idue
Aliquot
Aliquot
Aliquot
Aliquot
Aliquot
Aliquot Aliquot
Biomass Po =Total P CHC13 - Total Labile P
Humic Acid Po=Total P- Fulvic Acid Po
Acidify to pH 1.0-1.5,centrifuge
6
Dissolve in 50 mL 1.0 MH2SO4, shake 24 h
Methods for P Analysis, J.L. Kovar and G.M. Pierzynski (eds)
58
Moderately Labile Organic P: A two-step process is required to determine moderately labile Po. Add 50 mL of 1 M HCl
to the residue from the labile P extraction and place sample on a reciprocating mechanical shaker for 3 h. An aliquot of 1 M HCl should be used to rinse residue from filter paper used in the labile P extraction. After 3 h, centrifuge sample at 7000 rpm for 15 min and filter supernatant through Whatman No. 41 quantitative paper into a 50-mL volumetric flask. Bring to volume with deionized water and mix well. Determine total P and Pi in the extract as previously described. Any Po extracted in the 1 M HCl is considered part of the moderately labile P fraction.
Rinse the residue from the HCl extraction with deionized water, shake for 5 min, centrifuge, and discard the supernatant solution. Add 50 mL of 0.5 M NaOH to the residue and shake sample for 3 h. At the end of the extraction time, centrifuge sample at 7000 rpm for 15 min. The supernatant contains both moderately labile Po (fulvic acid P) and nonlabile Po (humic acid P). To separate these fractions, remove an aliquot of the NaOH extract and acidify to pH 1.0 to 1.5 with concentrated HCl. At this pH, humic acids precipitate, and fulvic acids remain in solution. Centrifuge acidified sample at 7000 rpm for 15 min. Determine total P in both the NaOH extract and the acidified sample as previously described. Total P in the acidified sample is a measure of fulvic acid P. Estimate humic acid P by subtracting fulvic acid P from the total P measured in the NaOH extract (Fig. 2).
Nonlabile Organic P: To determine highly-resistant, nonlabile Po, rinse the residue from the NaOH extraction with deionized water, shake for 5 min., centrifuge, and discard the supernatant solution. Place the residue in a crucible and ash at 550°C for 1 h. Dissolve ash by shaking in 50 mL of 1 M H2SO4 for 24 h, and measure P in solution as previously described.
Calculations The amount of P in each fraction is calculated with the following equation:
P concentration in given fraction (mg kg-1) =
[Conc. of P (mg L-1) x Volume of extractant (L)] ÷ mass of soil (kg)
Comments: Because this P fractionation scheme is operationally defined, it is difficult to identify
which discrete Po compounds are extracted with each step. Moreover, hydrolysis of some Po compounds by 1 M HCl or 0.5 M NaOH, sorption of labile P, and heterogeneity of soil particles within a sample may limit the accuracy of this fractionation procedure. If a supply of 100-mL centrifuge tubes is a problem, smaller tubes (e.g., 50-mL or 40-mL) can be used. In this case, the sample size and volume of extracting solutions should be decreased by half.
Excess persulfate in the digests can interfere with color development in the determination step. Persulfate oxidizes the ascorbic acid, so that no or less reductive agent is present to produce the blue color of the phosphomolybdate complex. To solve this problem, the length of the digestion time may be increased, or the digests can be diluted before the acid molybdate reagent is added. As an alternative, the method described by Rowland and Haygarth (1997) requires less
Methods for P Analysis, J.L. Kovar and G.M. Pierzynski (eds)
59
persulfate (0.15g K2S2O8) and utilizes an autoclave (1 h, 103.5 kPa, 120 ºC) to complete sample digestion.
References: Anderson, G. 1967. Nucleic acids, derivatives, and organic phosphates. p. 67-90. In: A.D.
McLaren and G.H. Peterson (ed.). Soil Biochemistry. Marcel Dekker, New York. Blecker, S.W., J.A. Ippolito, J.E. Barrett, D.H. Wall, R.A. Virginia, and K.L. Norvell. 2006.
Phosphorus fractions in soils of Taylor Valley, Antarctica. Soil Sci. Soc. Am. J. 70:806-815. Bowman, R.A., and C.V. Cole. 1978. An exploratory method for fractionation of organic
phosphorus from grassland soils. Soil Sci. 125:95-101. Bowman, R.A. 1989. A sequential extraction procedure with concentrated sulfuric acid and
dilute base for soil organic phosphorus. Soil. Sci. Soc. Am. J. 53:362-366. Chang, S.C., and M.L Jackson. 1957. Fractionation of soil phosphorus. Soil Sci. 84:133-144. Cross, A.F., and W.H. Schlesinger. 1995. A literature review of the Hedley fractionation:
Applications to the biogeochemical cycle of soil phosphorus in natural ecosystems. Geoderma. 64:197-214.
Cross, A.F., and W.H. Schlesinger. 2001. Biological and geochemical controls on phosphorous fractions in semiarid soils. Biogeochemistry. 52:155-172.
Evans, T.D., and J.K. Syers. 1971. An application of autoradiography to study the special distribution of 33P-labelled orthophosphate added to soil crumbs. Soil Sci. Soc Amer. Proc. 35:906-909.
Fife, C.V. 1962. An evaluation of ammonium fluoride as a selective extractant for aluminum-bound soil phosphate: detailed study of soils. Soil Sci. 96:112-120.
Halstead, R.L., and G. Anderson. 1970. Chromatographic fractionation of organic phosphates from alkali, acid, and aqueous acetylacetone extracts of soils. Can. J. Soil Sci. 50:11-119.
Hedley, M.J., J.W.B. Stewart, and B.S. Chauhan. 1982. Changes in inorganic and organic soil phosphorus fractions induced by cultivation practices and by laboratory incubations. Soil Sci. Soc. Am. J. 46:970-976.
Houtin, J.A., A. Karam, D. Couillard, and M.P. Cescas. 2000. Use of a fractionation procedure to assess the potential for P movement in a soil profile after 14 years of liquid pig manure fertilization. Agric. Ecosystems Environ. 78:77-84.
Ivanoff, D.B., K.R. Reddy, and S. Robinson. 1998. Chemical fractionation of organic phosphorus in selected histosols. Soil Sci. 163: 36-45.
Kuo, S. 1996. Phosphorus. p. 869-919. In: D.L. Sparks (ed.) Methods of soil analysis:Chemical methods. Part 3. SSSA No.5. ASA-CSSA-SSSA, Madison, WI.
Murphy, J., and J.P. Riley. 1962. A modified single solution method for the determination of phosphate in natural waters. Anal Chem. Acta. 27:31-36.
Peterson, G.W., and R.B. Corey. 1966. A modified Chang and Jackson procedure for routine fractionation of inorganic soil phosphates. Soil Sci. Soc. Amer. Proc. 30:563-565.
Rowland, A.P. and P.M. Haygarth. 1997. Determination of total dissolved phosphorus in soil solutions. J. Environ. Qual. 26:410-415.
Sharpley, A.N., and S.J. Smith. 1985. Fractionation of inorganic and organic phosphorus in virgin and cultivated soils. Soil Sci. Soc. Am. J. 49:127-130.
Schroeder, P.D., and J.L. Kovar. 2006. Comparison of organic and inorganic phosphorus fractions in an established buffer and adjacent production field. Commun. Soil Sci. Plant Anal. 37:1219-1232.
Methods for P Analysis, J.L. Kovar and G.M. Pierzynski (eds)
60
Smillie, G.W., and J.K. Syers. 1972. Calcium chloride formation during extraction of calcareous soil with fluoride: II. Implications to the Bray-1 test. Soil Sci. Soc. Am. Proc. 36:25-30.
Stott, D.E., and M.A. Tabatabai. 1985. Identification of phospholipids in soils and sewage sludges by high performance liquid chromatography. J. Environ. Qual. 14:107-110.
Tate, K.R. 1984. The biological transformation of P in soil. Plant Soil. 76:245-256. Thien, S.J., and R. Myers. 1992. Determination of bioavailable phosphorus in soil. Soil Sci. Soc.
Am. J. 56:814-818. Weaver, R.M. 1974. A simplified determination of reductant-soluble phosphate in soil phosphate
fractionation schemes. Soil Sci. Soc. Amer. Proc. 38:153-154. Williams, J.D.H., J.K.Syers, and T.W. Walker. 1967. Fractionation of soil inorganic phosphorus
by a modification of Chang and Jackson’s procedure. Soil Sci. Soc. Amer. Proc. 31:736-739.
Methods for P Analysis, J.L. Kovar and G.M. Pierzynski (eds)
61
Phosphorus Fractionation in Flooded Soils and Sediments Philip Moore, USDA-ARS, Fayetteville, AR Frank Coale, University of Maryland
Introduction: Phosphorus (P) chemistry in soils and sediments is greatly influenced by the oxidation-
reduction status (redox potential). Under oxidized conditions, ferric and manganic oxides and hydroxides are important adsorption sites for P. In addition, ferric and manganic phosphate minerals, such as strengite (FePO4
.2H2O), and trivalent Mn phosphate (MnPO3.1.5H2O) can form
and persist under oxidized conditions. However, under reducing conditions these minerals are unstable, resulting in dissolution and release of soluble P into the soil solution (Patrick et al., 1973; Emerson, 1976; Emerson and Widmer, 1978; Boyle and Lindsay, 1986; Moore and Reddy, 1994).
Since Fe and Mn phosphate mineral formation is controlled by the redox potential of the soil or sediment, it is important that soil and sediment samples that are collected under reduced conditions are handled appropriately during P fractionation to get an accurate picture of the P status. Allowing anaerobic sediments to become oxidized results in the rapid conversion of ferrous iron (Fe2+) to ferric iron (Fe3+). Within a very short time (seconds to minutes), solid phase Fe(OH)3 precipitates out of solution. Fresh ferric hydroxide precipitates have tremendous P sorption capacities, and they can cause the soluble P levels in the porewater to be reduced by orders of magnitude in minutes. To avoid this, samples should be maintained under anerobic conditions during the initial phases of P fractionation.
Sequential extraction schemes for P (phosphorus fractionation) have been employed by various workers over the past 60 years, yet this is not an exacting science (Dean, 1938; Williams, 1950; Chang and Jackson, 1957; Williams et al., 1967; Chang et al., 1983). It must be kept in mind that these are rather crude methods, with many extractants causing the dissolution of more than one type of P solid phase. For example, sodium hydroxide is often used to extract Al and Fe-bound P (van Eck, 1982; Hieltjes and Lijklema, 1980). However, this compound will also extract organic P fractions, particularly in soils that have been heavily manured in the past. Hence, authors must be aware of the pitfalls and fallibility of the methods we are outlining, and use them only when they are the best procedure available.
Materials: 1. PVC or plexiglas cylinder for taking cores 2. Purified N2 3. Glove bag 4. Vacumn pump 5. Centrifuge and 250 mL centrifuge tubes with caps equipped with rubber septums
Reagents: 1. Deionized water 2. 1 M KCl 3. 0.1 M NaOH 4. 0.5 M HCl 5. Concentrated HCl (trace metal grade)
Methods for P Analysis, J.L. Kovar and G.M. Pierzynski (eds)
62
Method: The P fractionation procedure described below is similar to that of van Eck (1982) as
modified by Moore and Reddy (1994).
Sampling: Flooded soil or sediment samples can be taken with a PVC or plexiglas cylinder. The
coring device should be beveled from the outside so that it can be inserted into the sediment. Under certain conditions, such as in salt marshes or rice fields, it may be necessary to pound on the coring device with a hammer to reach the desired sampling depth.
The sample can be returned to the lab in the sampling cylinder or it can transferred to a pre-weighed centrifuge tube. If it is to be transported in the cylinder, then a rubber stopper should be placed on the bottom of the core to hold the sediment in place. It is a good idea to tape the stopper in place. If the sample is taken under flooded conditions, leave some of the floodwater on top of the sample. If samples have been taken from a lake bottom, then the entire headspace should be filled with lake water and a stopper should be placed on the top of the cylinder as well. This reduces the amount of shaking and minimizes disturbance of the sediment/water interface.
If samples are taken in flooded or saturated agricultural fields, transfer them directly into a 250 mL polycarbonate centrifuge tube. It is important that the sampling corer have an inside diameter slightly smaller than the inside diameter of the centrifuge tube. To take the sample, simply push the corer into the sediment to the desired depth (e.g., 10 cm). It may be difficult to remove the core from the sediment without disturbing the sample. It may be necessary to hold the sediment in place from underneath the core (usually by hand) when pulling the core out of the ground to prevent the soil from falling out. If the soil is relatively fine textured the core can be rocked side to side and removed. After the core has been removed from the sediment, pour the water off and place the cylinder over the mouth of the centrifuge tube. If the sample is from a coarse textured soil, it will fall into the tube. However, when clay contents are high, it will adhere to the sampling core. In this case it is necessary to have a ramrod with a rubber stopper (outside diameter slightly smaller than sampling cylinder’s inside diameter) to force the sample into the centrifuge tube.
After the sample is in the centrifuge tube, tap the tube on a hard surface (palm of your hand) to allow any entrained air bubbles to escape to the surface. If these air bubbles are not removed, then the sample will become oxidized.
Next, screw the lid onto the centrifuge tube and insert a 12 gauge needle through the rubber septum in the tube's top. Insert another 12 gauge needle that is connected via tygon tubing to the N2 gas cylinder and begin purging. Purge the headspace for 5-10 minutes with N2 at a pressure of about 69 kPa (10 psi). This pressure, coupled with the needle size, will result in a loud hissing sound; absence of the sound may mean the needle is clogged with sediment. Extra needles should be taken into the field in case this happens. After purging the sample, remove the needle not connected to the N2 first, then the other needle. This allows a positive pressure of N2 on the sample, so if the container leaks, the leak will be outward.
If the samples are to be processed in less than two days, refrigeration is not required. For longer periods, the samples should be put on ice to slow down biological activity. It should be noted that many plastics, like polycarbonate, allow slow diffusion of oxygen. If samples are stored for months in the refrigerator, the sediment along the walls of the tubes will change color
Methods for P Analysis, J.L. Kovar and G.M. Pierzynski (eds)
63
to red and orange, as oxygen enters the tube and oxidizes iron. If this happens, the sample should not be used.
Water-Soluble P: The first fraction of P to be extracted from the sample is water-soluble P. If the sample
was taken in intact sediment cores and the researcher desires to obtain a depth distribution of P in the core, then a glove bag is needed. Place the top of the core into the glove bag. Also place any supplies (spatula, purged centrifuge tubes, syringes, etc.) into the bag. Fill the bag with N2 gas, and empty it two or three times to make sure it is oxygen-free. Use a ramrod with rubber stopper (plunger) as described above to slowly push the sediment to the surface. Using the spatula, take the first sample to the desired depth [it helps to have the depth increment (e.g., 5 cm) marked on the plexiglas corer]. After the sediment has been placed in the tube, tap the tubes to get rid of bubbles. Then push the plunger upward another 5 cm (or whatever depth is desired). Repeat this process until all of the samples are in the tubes.
Open the glove bag and purge the headspace in the centrifuge tube as described earlier. The headspace should be anaerobic, if the glove bag worked correctly. However, trace quantities of O2 can cause problems, so this extra step is warranted. If the samples were transferred to centrifuge tubes in the field, purge them in the laboratory immediately prior to centrifugation to make certain the headspace is oxygen-free.
First, record the weight of the tube plus sediment. Since the weight of the tube was recorded earlier, the wet sediment weight will be known. Centrifuge the samples at 7500 rpm for 20 minutes. At this point the samples are most susceptible to oxidation, since the porewater is separated from the soil. Hence, do not open the centrifuge tubes unless you are ready to filter immediately.
It is preferable to filter the samples quickly, so vacuum filtration is strongly recommended, using a 0.45 μm membrane filter. Turn on the pump and quickly open and pour the soil solution onto the filter. It should filter in a few seconds. Quickly pour the supernatant into a plastic sample container and acidify with concentrated HCl to pH 2. It is mandatory that the water-soluble sample be acidified. Otherwise, when the sample oxidizes, soluble iron will precipitate soluble P, as discussed earlier.
If pH measurements are to be taken, do not filter all of the sample. Using a 60 mL syringe, remove a suitable aliquot of the porewater for pH measurement. Hold the syringe upright and get rid of any air bubbles. Keep the sample in the syringe until pH is measured. Flooded soil/sediment samples have a high partial pressure of CO2 (often greater than 5%). If degassing occurs prior to pH measurement, the pH will often change by one to two units.
The acidified, filtered sample for water-soluble P can be analyzed by several methods. If the Murphy-Riley method (Murphy and Riley, 1962) is used, then the anaylses can be referred to as soluble reactive P. It is considered soluble since it passed through the 0.45 μm membrane, and reactive since it reacted with the reagents in the Murphy-Riley method.
The residual sediment from the water-soluble fraction will be used for the remaining fractionation. Hence, after the porewater has been removed, screw the lid back on the tube and purge with N2 to maintain anaerobic conditions.
Loosely Sorbed P: Various salts have been used in the past for loosely sorbed P. van Eck (1982) utilized
NH4Cl for this purpose. However, in many studies focusing on P, it is also desirable to measure
Methods for P Analysis, J.L. Kovar and G.M. Pierzynski (eds)
64
the amount of inorganic N present as ammonium. Hence, Moore and Reddy (1994) utilized KC1 for this fraction, so that exchangeable NH4 (and exchangeable metals minus K) could be determined on one sample.
After the porewater has been removed for water-soluble P, the tubes should be weighed to determine how much water was removed from the sample. Next, the tubes are placed into a glove bag and purged with N2 gas as described above. The sediment in the tubes should then be homogenized with a spatula, and a subsample (approximately 1 gram dry weight) should be transferred into another pre-weighed centrifuge tube. Another subsample will be taken for moisture content, so that the exact weight of the sample for P fractionation is known. While still in the glove bag, add 20 mL of de-aerated 1 M KCl to the tubes. When the tubes are removed from the glove bag, purge again with N2 gas to ensure the headspace is oxygen-free. Shake the tubes for 2 h on reciprocating shaker, then centrifuge at 7,500 rpm for 20 minutes, and quickly filter through a 0.45 μm membrane as described above. The supernatant should be acidified to pH 2 with concentrated HCl. The sample can then be analyzed by the Murphy-Riley method. This fraction is loosely sorbed P.
After this fraction has been taken, precautions to maintain anaerobic conditions are no longer needed. Decant excess KCl, then weigh again. Weights of each successive fraction are needed to calculate the entrained liquid (containing soluble P) from the prior extraction.
Aluminum and Iron-bound P: The residual sediment from the KCl extraction will be utilized “as is” for the next
extraction (with NaOH). Add 20 mL of 0.1 M NaOH to the sample, and shake for 17 hours. Then centrifuge at 7500 rpm and filter through 0.45 μm membrane filters. Analyze using the Murphy-Riley method. This fraction is referred to as Al and Fe-bound P.
It should be noted that some researchers will split this sample and digest half of the sample prior to analysis with Murphy-Riley. The difference between the undigested NaOH sample and the digested NaOH sample is referred to as "organic-bound P."
Calcium-bound or Apatite P: After removing excess NaOH and weighing the previous sample, add 20 mL of 0.5 M
HCl and shake for 24 h. If the sediment contains free carbonates, open the samples during the first 15 minutes or so to relieve the pressure from CO2 buildup. After they have shaken for 24 hours, filter through 0.45 μm membrane filters, and analyze using the Murphy-Riley method. This aliquot is referred to as Ca-bound P, but may also contain some organic P.
Residual P: The remaining sample can then be analyzed for total P following a nitric-perchloric acid
digestion or other suitable method. This is simply referred to as residual P, since it probably contains some Al and Fe-bound P, as well as organic P. Residual P can also be calculated by measuring total P on the original sample and subtracting the various fractions.
References: Boyle, F.W., Jr. and W.L. Lindsay. 1986. Manganese phosphate equilibrium relationships in
soils. Soil Sci. Soc. Am. J. 50:588-593. Chang, S.C. and M.L. Jackson. 1957. Fractionation of soil phosphorus. Soil Sci. 84:133-144.
Methods for P Analysis, J.L. Kovar and G.M. Pierzynski (eds)
65
Chang, A.C., A.L. Page, F.H. Sutherland, and E. Grgurevic. 1983. Fractionation of phosphorus in sludge-affected soils. J. Environ. Qual. 12:286-290.
Dean, L.A. 1938. An attempted fractionation of the soil phosphorus. J. Agric. Sci. 28:234-246. Emerson, S. 1976. Early diagenesis in anaerobic lake sediments: Chemical equilibria in
interstitial waters. Geochim. Cosmochim. Acta 40:925-934. Emerson, S. and G. Widmer. 1978. Early diagenesis in anaerobic lake sediments: II.
Thermodynamic and kinetic factors controlling the formation of iron phosphates. Geochim. Cosmochim. Acta 42:1307-1316.
Hieltjes, A.H.M and L. Lijklema. 1980. Fractionation of inorganic phosphates in calcareous sediments. J. Environ. Qual. 9:405-407.
Moore, P.A., Jr. and K.R. Reddy. 1994. Role of Eh and pH on phosphorus geochemistry in sediments of Lake Okeechobee, Florida. J. Environ. Qual. 23:955-964.
Murphy, J. and J.P. Riley. 1962. A modified single solution method for the determination of phosphate in natural waters. Analytica Chimica Acta 27:31-36.
Patrick, W.H., Jr., S. Gotoh, and B.G. Williams. 1973. Strengite dissolution in flooded soils and sediments. Science 179:564-565.
Williams, C.H. 1950. Studies on soil phosphorus: I. A method for the partial fractionation of soil phosphorus. J. Agric. Sci. 40:233-242.
Williams, J.D.H., J.K. Syers, and T.W. Walker. 1967. Fractionation of soil inorganic phosphate by a modification of Chang and Jackson's procedure. Soil Sci. Soc. Am. Proc. 31:736-739.
van Eck, G.T.M. 1982. Forms of phosphorus in particulate matter from the Hollands Diep/Haringvliet, the Netherlands. Hydrobiologia 91:665-681.
Methods for P Analysis, J.L. Kovar and G.M. Pierzynski (eds)
66
Phosphorus Retention and Flux in Soil Thanh H. Dao, USDA-ARS, Beltsville, MD ______________________________________________________________________
Introduction: In soils and sediments, physicochemical and biological processes jointly act to control phosphorus (P) in solution. The soluble reactive P fraction is taken up by plants, sequestered in soil, or disperses in the surrounding environment. Although the primary mechanism for environmental transport of P from agricultural soils is by erosion and surface runoff, specific instances of subsurface movement have been reported (Heckrath et al., 1995; Eghball et al., 1996; Gachter et al., 1998). Agricultural P inputs to nearby surface waters have been associated with toxic algal blooms and the depletion of oxygen in aquatic systems. An improved understanding of P retention and transport mechanisms is needed to develop management practices to mitigate P transport and inputs to surface waters. Typical methods used for assessing the environmental behavior of native and added P in terrestrial and aquatic ecosystems include procedures for measuring the retention capacity of soils and sediments and the associated kinetic parameters. Phosphorus retention has been commonly determined by batch equilibrium methods in which soil or sediment samples are agitated with P solutions of known concentrations (Graetz and Nair, 2008, this publication). The suspension is equilibrated for a sufficient time to achieve apparent equilibrium in the system. The advantages and disadvantages of the technique have been extensively reviewed (Green and Karickoff, 1990; Sparks et al., 1996). Flow methods have also been used to study water and dissolved solute movement, the retention and desorption processes, for P in particular (Rao et al., 1979; van Riemsdijk and van der Linden, 1984; Miller et al., 1989; Beauchemin et al., 1996). Flow methods are open systems where solute and the reaction products with soil and sediment constituents are removed, minimizing re-adsorption, secondary precipitation reactions, or inhibition of desorption. Important parameters include water flux, chemical and hydrodynamic dispersion, sorption, exchange and desorption characteristics, and transformation rates coefficients.
Applications: A flow displacement approach facilitates the simulation of the dynamic sorption- desorption, transformations, and transport of P in the soil and water system. Displacement studies provide insights in the kinetics of P release and physical and chemical non-equilibrium conditions that may influence nutrient mineralization and transport in soil. Columns experiments have been conducted to study the miscible displacement of organic chemicals (Green and Corey, 1971; Rao et al., 1979; Dao et al., 1980; Wagenet and Rao, 1990) and for PO4-P in particular (van Riemsdijk and van der Linden, 1984; Miller et al., 1989; Chen et al., 1996). Breakthrough curves yield characteristics of the adsorption-desorption non-equilibrium and soil-solvent-solute interactions (Green and Karickoff, 1990; Chen et al., 1996). Materials and Equipment:
1. Columns made from PVC tubing of known inner diameter (ID) ranging from 5 to 100 mm and length ranging from 100 to 300 mm.
Methods for P Analysis, J.L. Kovar and G.M. Pierzynski (eds)
67
2. A Mariott bottle setup to achieve a constant hydraulic head above column intake for steady-state flow.
3. A fraction collector, operating on a time- or volume-based mode. 4. A spectrophotometer for manual or automated P analysis. 5. Centrifuge, to attain 10,000 x g.
Reagents:
1. P-free nutrient solution, i.e., deionized water or a 0.01M CaCl2 solution. Dissolve 1.47 g of CaCl2·2H2O in deionized water and dilute to 1 L.
2. Solution of known Br- concentration (10 mg Br L-1). Dissolve .0149 g of KBr per L. 3. Solution of known P concentration (10 mg P L-1). Dissolve 0.056 g of K2HPO4 per L. 4. Microbial growth inhibitor, such as acetone or chloroform (20 g L-1 of influent).
Procedures: Soil/Sediment columns Either obtain intact soil cores or pack a column with uniformly mixed soil/sediment materials at overall density of 1.2-1.3 Mg m-3. The lower end of the column is fitted with a fritted glass porous plate and a drainage port. P sorption Deliver from a Mariott bottle maintaining a constant hydraulic head above the column intake for steady-state flow. Collect effluent with a fraction collector. Acidify effluent fraction and determine P concentrations. P desorption Upon achieving a steady-state outflow P concentration, substitute a P-free nutrient solution as the influent to study P desorption from the soil/sediment column. It is important to be able to switch rapidly from one solution to the other and minimize mixing of the two solutions at the influent assembly. Collect fractions of the effluent as previously, and determine P concentrations. Analysis of P in effluent Filter effluent through a 0.45-m membrane or centrifuge at 10, 000 x g for 15 min to remove particulate matter, then acidify with HCl (<pH 2). Determine phosphorus concentrations of effluent samples using spectrophotometric (Murphy and Riley, 1962; APHA, 1998a), inductively-coupled plasma atomic-emission spectroscopic (APHA, 1998b), or ion chromatographic (Nieto and Frankenberger, 1985; Dao, 2003) methods. Calculations Plot P concentrations against either time or volume of effluent to obtain an effluent or breakthrough curve (BTC). The analysis of BTCs is greatly facilitated by expressing P concentrations as relative or reduced concentration (C/Co) and the effluent volume as dimensionless pore volumes. Calculate the number of pore volume (V/Vo) by dividing the amount of effluent by the liquid capacity of the column (Vo). The latter can be calculated either as:
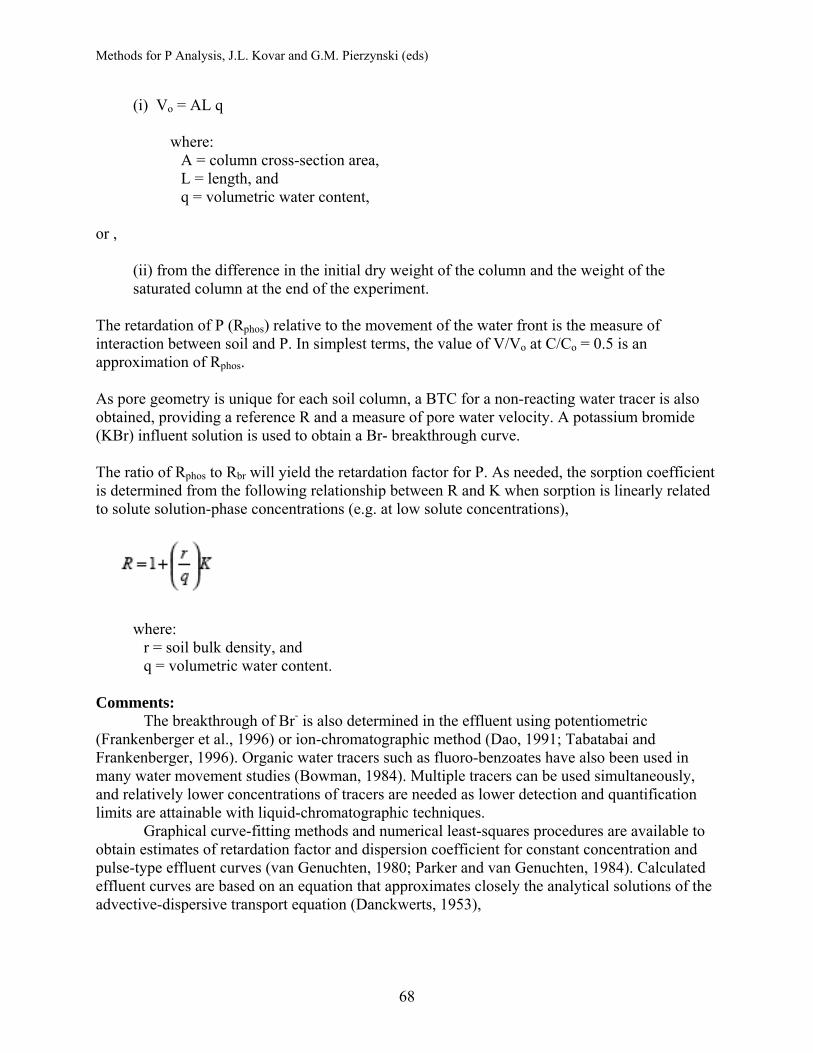
Methods for P Analysis, J.L. Kovar and G.M. Pierzynski (eds)
68
(i) Vo = AL q
where: A = column cross-section area, L = length, and q = volumetric water content,
or ,
(ii) from the difference in the initial dry weight of the column and the weight of the saturated column at the end of the experiment.
The retardation of P (Rphos) relative to the movement of the water front is the measure of interaction between soil and P. In simplest terms, the value of V/Vo at C/Co = 0.5 is an approximation of Rphos. As pore geometry is unique for each soil column, a BTC for a non-reacting water tracer is also obtained, providing a reference R and a measure of pore water velocity. A potassium bromide (KBr) influent solution is used to obtain a Br- breakthrough curve. The ratio of Rphos to Rbr will yield the retardation factor for P. As needed, the sorption coefficient is determined from the following relationship between R and K when sorption is linearly related to solute solution-phase concentrations (e.g. at low solute concentrations),
where: r = soil bulk density, and q = volumetric water content.
Comments: The breakthrough of Br- is also determined in the effluent using potentiometric (Frankenberger et al., 1996) or ion-chromatographic method (Dao, 1991; Tabatabai and Frankenberger, 1996). Organic water tracers such as fluoro-benzoates have also been used in many water movement studies (Bowman, 1984). Multiple tracers can be used simultaneously, and relatively lower concentrations of tracers are needed as lower detection and quantification limits are attainable with liquid-chromatographic techniques. Graphical curve-fitting methods and numerical least-squares procedures are available to obtain estimates of retardation factor and dispersion coefficient for constant concentration and pulse-type effluent curves (van Genuchten, 1980; Parker and van Genuchten, 1984). Calculated effluent curves are based on an equation that approximates closely the analytical solutions of the advective-dispersive transport equation (Danckwerts, 1953),
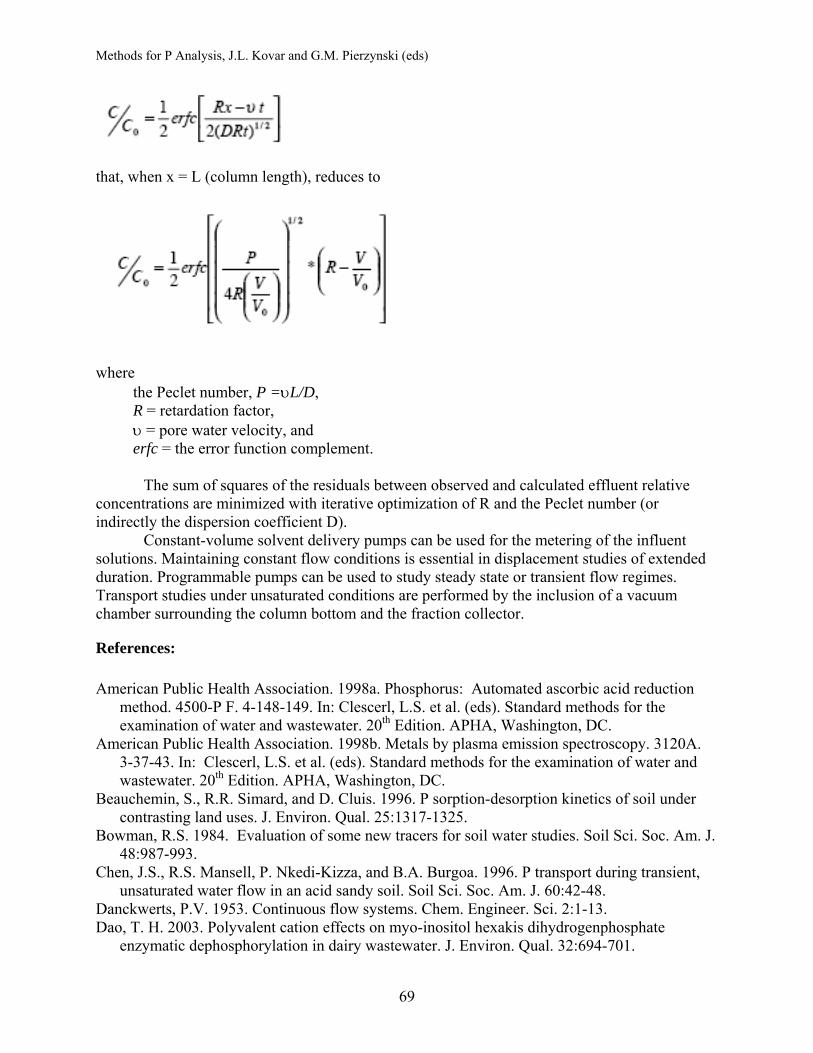
Methods for P Analysis, J.L. Kovar and G.M. Pierzynski (eds)
69
that, when x = L (column length), reduces to
where
the Peclet number, P =υL/D, R = retardation factor, υ = pore water velocity, and erfc = the error function complement.
The sum of squares of the residuals between observed and calculated effluent relative concentrations are minimized with iterative optimization of R and the Peclet number (or indirectly the dispersion coefficient D). Constant-volume solvent delivery pumps can be used for the metering of the influent solutions. Maintaining constant flow conditions is essential in displacement studies of extended duration. Programmable pumps can be used to study steady state or transient flow regimes. Transport studies under unsaturated conditions are performed by the inclusion of a vacuum chamber surrounding the column bottom and the fraction collector.
References: American Public Health Association. 1998a. Phosphorus: Automated ascorbic acid reduction
method. 4500-P F. 4-148-149. In: Clescerl, L.S. et al. (eds). Standard methods for the examination of water and wastewater. 20th Edition. APHA, Washington, DC.
American Public Health Association. 1998b. Metals by plasma emission spectroscopy. 3120A. 3-37-43. In: Clescerl, L.S. et al. (eds). Standard methods for the examination of water and wastewater. 20th Edition. APHA, Washington, DC.
Beauchemin, S., R.R. Simard, and D. Cluis. 1996. P sorption-desorption kinetics of soil under contrasting land uses. J. Environ. Qual. 25:1317-1325.
Bowman, R.S. 1984. Evaluation of some new tracers for soil water studies. Soil Sci. Soc. Am. J. 48:987-993.
Chen, J.S., R.S. Mansell, P. Nkedi-Kizza, and B.A. Burgoa. 1996. P transport during transient, unsaturated water flow in an acid sandy soil. Soil Sci. Soc. Am. J. 60:42-48.
Danckwerts, P.V. 1953. Continuous flow systems. Chem. Engineer. Sci. 2:1-13. Dao, T. H. 2003. Polyvalent cation effects on myo-inositol hexakis dihydrogenphosphate
enzymatic dephosphorylation in dairy wastewater. J. Environ. Qual. 32:694-701.
Methods for P Analysis, J.L. Kovar and G.M. Pierzynski (eds)
70
Dao, T.H. 1991 Field decay of wheat straw and its effects on metribuzin and S-ethyl metribuzin sorption and elution from crop residues. J. Environ. Qual. 20:203-208.
Dao, T.H., T. L. Lavy, and R. Sorensen. 1980. Atrazine degradation and residue distribution in soil. Soil Sci. Soc. Am. J. 43:1129-1134.
Eghball, B., G.D. Binford, and D.D. Baltensperger. 1996. Phosphorus movement and adsorption in a soil receiving long-term manure and fertilizer application. J. Environ. Qual. 25:1339-1343.
Frankenberger, Jr., W.T., M.A. Tabatabai, D.C. Adriano, and H.E. Doner. 1996. Bromine, chlorine, and fluorine. p. 833-867. In: Sparks, D.L. (ed). Methods of soil analysis. Part 3. Chemical methods. Soil Sci. Soc. Am. Book Series No. 5. Soil Sci. Soc. Am., Madison, WI.
Gachter, R., J.M. Ngatiah, and C. Stamm. 1998. Transport of phosphate from soil to surface waters by preferential flow. Environ. Sci. Tech. 32:1865-1869.
Graetz, D.A., and V.D. Nair. 2008. Phosphorus sorption isotherm determination. p. 33-36. In: J.L. Kovar and Pierzynski, G.M. (ed) Methods of P analysis for soils, sediments, residuals, and waters - 2nd Edition. SERA-IEG 17. So. Coop. Ser. Bull. No. 396, p. 35-38.
Green, R.E., and J.C. Corey. 1971. Pesticide adsorption measurement by flow equilibration and subsequent displacement. Soil Sci. Soc. Am. Proc. 35:561-565.
Green, R.E., and S.W. Karickhoff. 1990. Sorption estimates for modeling. p. 79-101. In: Cheng, H.H. (ed) Pesticides in the soil environment: Processes, impacts, and modeling. Soil Sci. Soc. Am. Book Series No. 2. Soil Sci. Soc. Am., Madison, WI.
Heckrath, G., P.C. Brooks, P.R. Poulton, K.W.T. Goulding. 1995. Phosphorus leaching from soils containing different P concentrations in the Broadbalk Experiment. J. Environ. Qual. 24:904-910.
Miller, D.M., M.E. Sumner, and W.P. Miller. 1989. A comparison of batch and flow-generated anion adsorption isotherms. Soil Sci. Soc. Am. J. 53:373-380.
Murphy, J., and J.P. Riley. 1962. A modified single solution method for the determination of phosphate in natural waters. Anal. Chem. Acta 27:31-36.
Nieto, K.F., and W.T. Frankenberger, Jr. 1985. Single ion chromatography: I. Analysis of inorganic anions in soils. Soil Sci. Soc. Am. J. 49:587-592.
Parker, J.C., and M. Th. Van Genuchten. 1984. Determining transport parameters from laboratory and field tracer experiments. VA Agric. Exp. Stn. Bull. 84.
Rao, P.S.C., J.M. Davidson, R.E. Jessup, and H.M. Selim. 1979. Evaluation of conceptual models for describing kinetics of adsorption-desorption of pesticides during steady-state flow in soils. Soil Sci. Soc. Am. J. 43:22-28.
Sparks, D.L., S.C. Fendorf, C.V. Toner IV, and T.H. Carski. 1996. Kinetic methods and measurements. p.1275-1307. In: Sparks, D.L. (ed). Methods of soil analysis. Part 3. Chemical methods. Soil Sci. Soc. Am. Book Series No. 5. Soil Sci. Soc. Am., Madison, WI.
Tabatabai, M.A., and W.T. Frankenberger, Jr. 1996. Liquid chromatography. p. 225- 245. In: Sparks, D.L. (ed). Methods of soil analysis. Part 3. Chemical methods. Soil Sci. Soc. Am. Book Series No. 5. Soil Sci. Soc. Am., Madison, WI.
van Genuchten, M. Th. 1980. Determining transport parameters from solute displacement experiments. Res. Rep. 118 US Salinity Lab., Riverside, CA.
van Riemsdijk, V.H., and A.M.A. van der Linden, 1984. Phosphate sorption in soils: II. Sorption measurement technique. Soil Sci. Soc. Am. J. 48:541-544.

Methods for P Analysis, J.L. Kovar and G.M. Pierzynski (eds)
71
Wagenet, R. J., and P.S.C. Rao. 1990. Modeling pesticide fate in soils. p. 351-399. In: Cheng, H.H. (ed) Pesticides in the soil environment: Processes, impacts, and modeling. Soil Sci. Soc. Am. Book Series No. 2. Soil Sci. Soc. Am., Madison, WI.
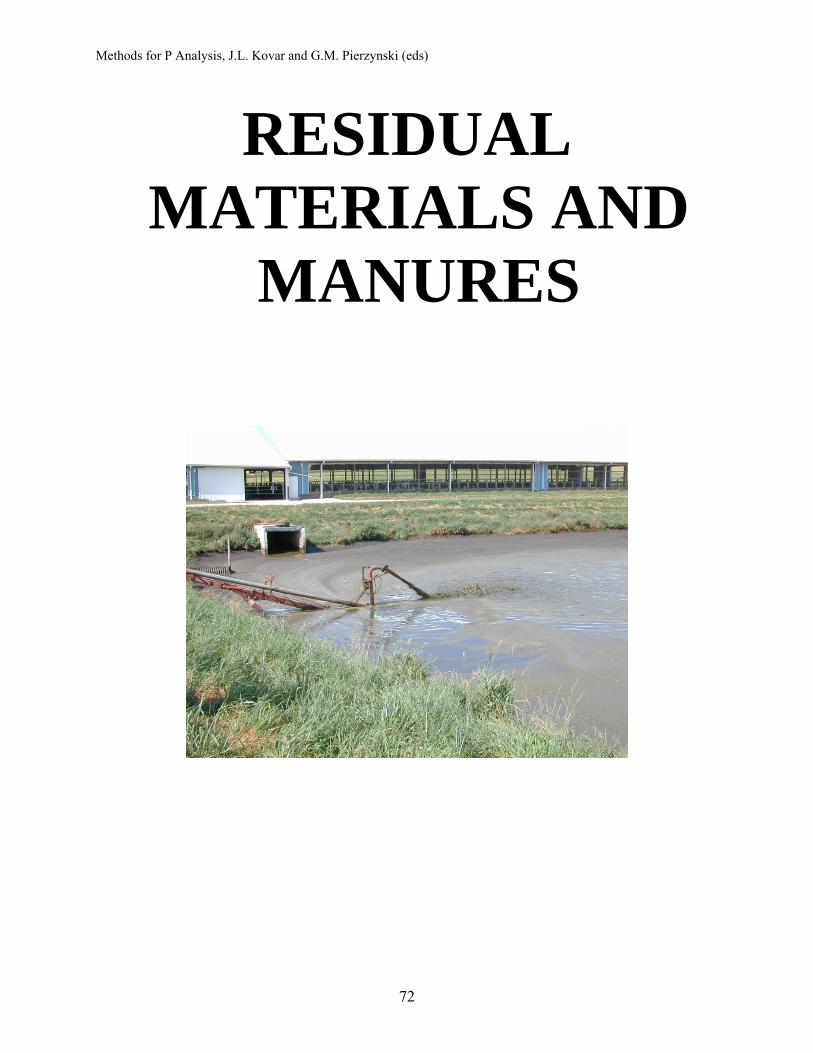
Methods for P Analysis, J.L. Kovar and G.M. Pierzynski (eds)
72
RESIDUAL MATERIALS AND
MANURES
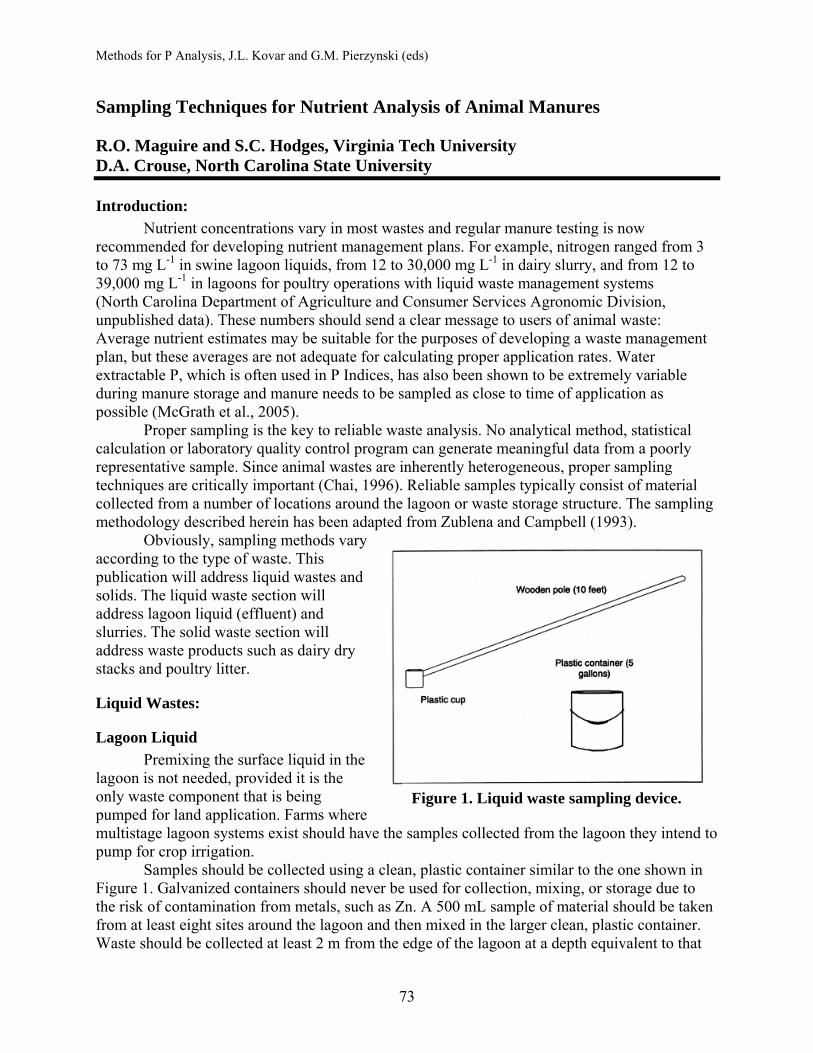
Methods for P Analysis, J.L. Kovar and G.M. Pierzynski (eds)
73
Figure 1. Liquid waste sampling device.
Sampling Techniques for Nutrient Analysis of Animal Manures R.O. Maguire and S.C. Hodges, Virginia Tech University D.A. Crouse, North Carolina State University
Introduction: Nutrient concentrations vary in most wastes and regular manure testing is now
recommended for developing nutrient management plans. For example, nitrogen ranged from 3 to 73 mg L-1 in swine lagoon liquids, from 12 to 30,000 mg L-1 in dairy slurry, and from 12 to 39,000 mg L-1 in lagoons for poultry operations with liquid waste management systems (North Carolina Department of Agriculture and Consumer Services Agronomic Division, unpublished data). These numbers should send a clear message to users of animal waste: Average nutrient estimates may be suitable for the purposes of developing a waste management plan, but these averages are not adequate for calculating proper application rates. Water extractable P, which is often used in P Indices, has also been shown to be extremely variable during manure storage and manure needs to be sampled as close to time of application as possible (McGrath et al., 2005).
Proper sampling is the key to reliable waste analysis. No analytical method, statistical calculation or laboratory quality control program can generate meaningful data from a poorly representative sample. Since animal wastes are inherently heterogeneous, proper sampling techniques are critically important (Chai, 1996). Reliable samples typically consist of material collected from a number of locations around the lagoon or waste storage structure. The sampling methodology described herein has been adapted from Zublena and Campbell (1993).
Obviously, sampling methods vary according to the type of waste. This publication will address liquid wastes and solids. The liquid waste section will address lagoon liquid (effluent) and slurries. The solid waste section will address waste products such as dairy dry stacks and poultry litter.
Liquid Wastes:
Lagoon Liquid Premixing the surface liquid in the
lagoon is not needed, provided it is the only waste component that is being pumped for land application. Farms where multistage lagoon systems exist should have the samples collected from the lagoon they intend to pump for crop irrigation.
Samples should be collected using a clean, plastic container similar to the one shown in Figure 1. Galvanized containers should never be used for collection, mixing, or storage due to the risk of contamination from metals, such as Zn. A 500 mL sample of material should be taken from at least eight sites around the lagoon and then mixed in the larger clean, plastic container. Waste should be collected at least 2 m from the edge of the lagoon at a depth equivalent to that
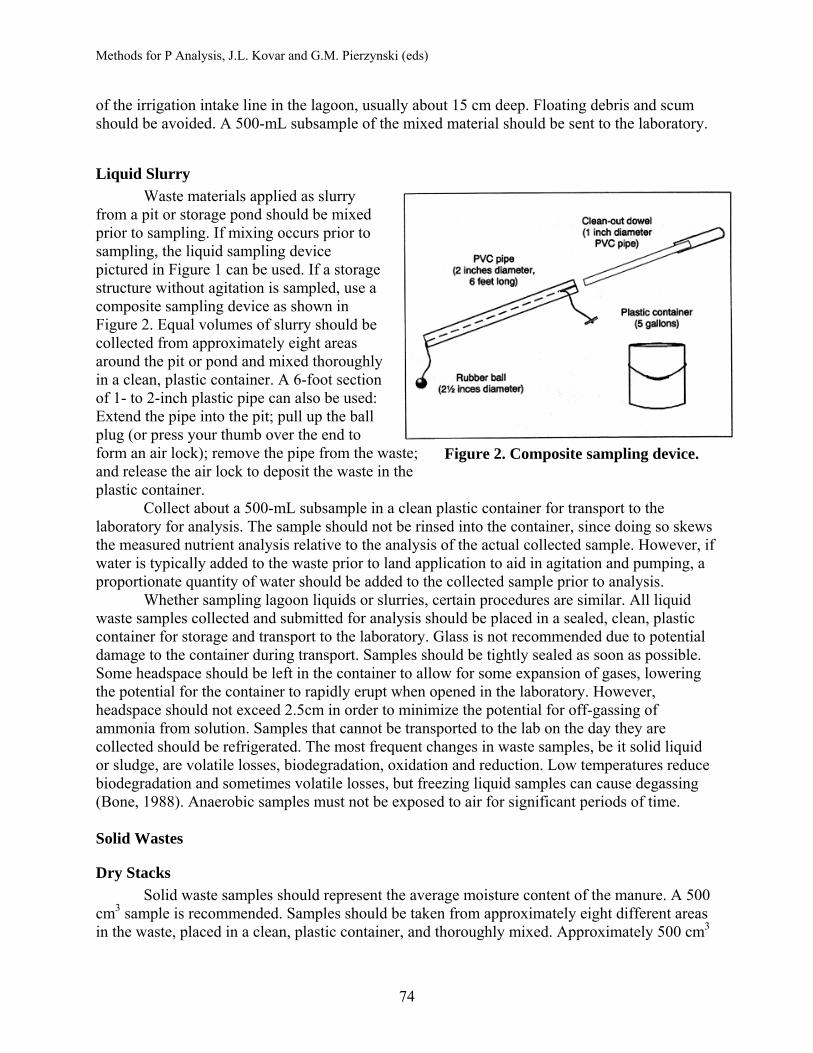
Methods for P Analysis, J.L. Kovar and G.M. Pierzynski (eds)
74
Figure 2. Composite sampling device.
of the irrigation intake line in the lagoon, usually about 15 cm deep. Floating debris and scum should be avoided. A 500-mL subsample of the mixed material should be sent to the laboratory.
Liquid Slurry Waste materials applied as slurry
from a pit or storage pond should be mixed prior to sampling. If mixing occurs prior to sampling, the liquid sampling device pictured in Figure 1 can be used. If a storage structure without agitation is sampled, use a composite sampling device as shown in Figure 2. Equal volumes of slurry should be collected from approximately eight areas around the pit or pond and mixed thoroughly in a clean, plastic container. A 6-foot section of 1- to 2-inch plastic pipe can also be used: Extend the pipe into the pit; pull up the ball plug (or press your thumb over the end to form an air lock); remove the pipe from the waste; and release the air lock to deposit the waste in the plastic container.
Collect about a 500-mL subsample in a clean plastic container for transport to the laboratory for analysis. The sample should not be rinsed into the container, since doing so skews the measured nutrient analysis relative to the analysis of the actual collected sample. However, if water is typically added to the waste prior to land application to aid in agitation and pumping, a proportionate quantity of water should be added to the collected sample prior to analysis.
Whether sampling lagoon liquids or slurries, certain procedures are similar. All liquid waste samples collected and submitted for analysis should be placed in a sealed, clean, plastic container for storage and transport to the laboratory. Glass is not recommended due to potential damage to the container during transport. Samples should be tightly sealed as soon as possible. Some headspace should be left in the container to allow for some expansion of gases, lowering the potential for the container to rapidly erupt when opened in the laboratory. However, headspace should not exceed 2.5cm in order to minimize the potential for off-gassing of ammonia from solution. Samples that cannot be transported to the lab on the day they are collected should be refrigerated. The most frequent changes in waste samples, be it solid liquid or sludge, are volatile losses, biodegradation, oxidation and reduction. Low temperatures reduce biodegradation and sometimes volatile losses, but freezing liquid samples can cause degassing (Bone, 1988). Anaerobic samples must not be exposed to air for significant periods of time. Solid Wastes
Dry Stacks Solid waste samples should represent the average moisture content of the manure. A 500
cm3 sample is recommended. Samples should be taken from approximately eight different areas in the waste, placed in a clean, plastic container, and thoroughly mixed. Approximately 500 cm3
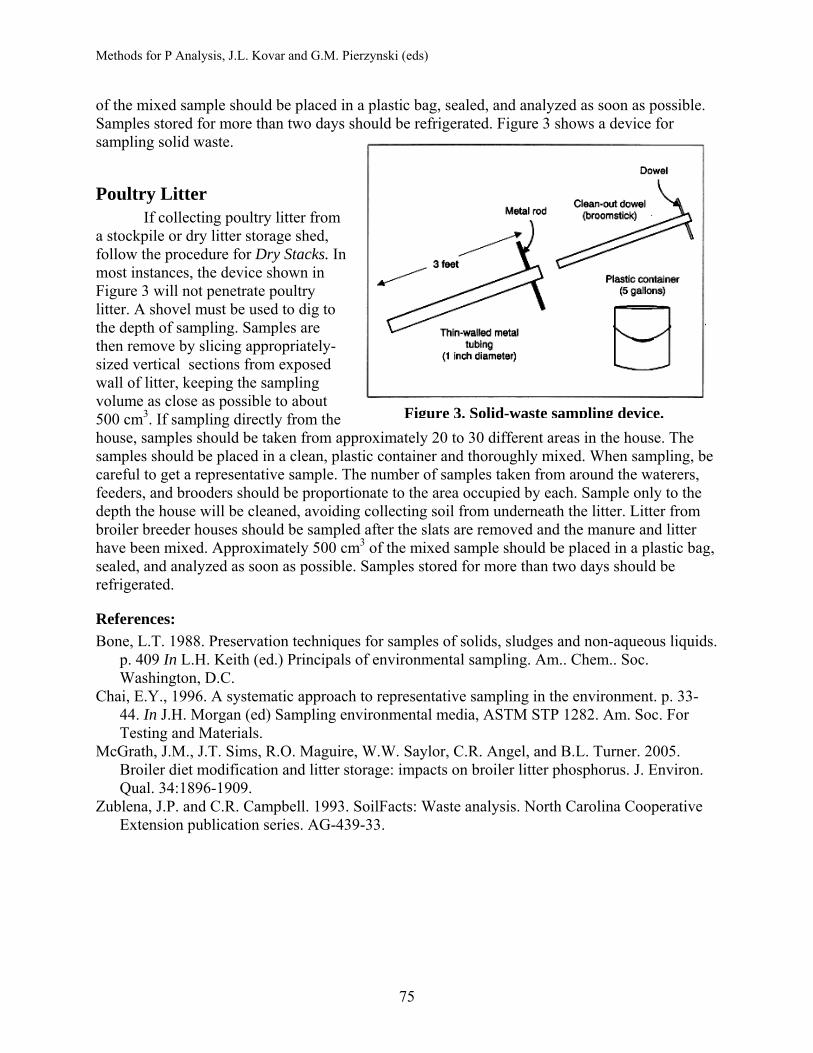
Methods for P Analysis, J.L. Kovar and G.M. Pierzynski (eds)
75
Figure 3. Solid-waste sampling device.
of the mixed sample should be placed in a plastic bag, sealed, and analyzed as soon as possible. Samples stored for more than two days should be refrigerated. Figure 3 shows a device for sampling solid waste.
Poultry Litter If collecting poultry litter from
a stockpile or dry litter storage shed, follow the procedure for Dry Stacks. In most instances, the device shown in Figure 3 will not penetrate poultry litter. A shovel must be used to dig to the depth of sampling. Samples are then remove by slicing appropriately-sized vertical sections from exposed wall of litter, keeping the sampling volume as close as possible to about 500 cm3. If sampling directly from the house, samples should be taken from approximately 20 to 30 different areas in the house. The samples should be placed in a clean, plastic container and thoroughly mixed. When sampling, be careful to get a representative sample. The number of samples taken from around the waterers, feeders, and brooders should be proportionate to the area occupied by each. Sample only to the depth the house will be cleaned, avoiding collecting soil from underneath the litter. Litter from broiler breeder houses should be sampled after the slats are removed and the manure and litter have been mixed. Approximately 500 cm3 of the mixed sample should be placed in a plastic bag, sealed, and analyzed as soon as possible. Samples stored for more than two days should be refrigerated.
References: Bone, L.T. 1988. Preservation techniques for samples of solids, sludges and non-aqueous liquids.
p. 409 In L.H. Keith (ed.) Principals of environmental sampling. Am.. Chem.. Soc. Washington, D.C.
Chai, E.Y., 1996. A systematic approach to representative sampling in the environment. p. 33-44. In J.H. Morgan (ed) Sampling environmental media, ASTM STP 1282. Am. Soc. For Testing and Materials.
McGrath, J.M., J.T. Sims, R.O. Maguire, W.W. Saylor, C.R. Angel, and B.L. Turner. 2005. Broiler diet modification and litter storage: impacts on broiler litter phosphorus. J. Environ. Qual. 34:1896-1909.
Zublena, J.P. and C.R. Campbell. 1993. SoilFacts: Waste analysis. North Carolina Cooperative Extension publication series. AG-439-33.
Methods for P Analysis, J.L. Kovar and G.M. Pierzynski (eds)
76
Water-Extractable Phosphorus in Animal Manure and Biosolids Ann M. Wolf, Pennsylvania State University Philip A. Moore, Jr., USDA-ARS, Fayetteville, AR Peter J.A. Kleinman, USDA-ARS, University Park, PA Dan M. Sullivan, Oregon State University Introduction:
The water extractable P content of land-applied manures and biosolids is a key water quality indicator, and has been used in a variety of contexts to evaluate different materials on the basis of their potential to release dissolved P to runoff water. Consistent and meaningful measurement of water extractable P has been obtained by a variety of methods, each with its own set of advantages and limitations (Self-Davis and Moore, 2000; Sharpley and Moyer, 2000, Haggard et al., 2005; Baum et al., 2006; Vadas and Kleinman, 2006). Key differences in methods include how materials are processed (drying, grinding), whether fresh materials are extracted on a dry weight equivalent basis or on a wet basis, the amount of sample that is extracted, extraction ratio (solution:solids), extraction time, solid separation technique, and method of P determination (ICP vs. colorimetry). Recent efforts by SERA-17 culminated in the selection of a universal water extraction protocol that addresses the concerns of testing laboratories (reproducibility, ease of implementation, and adaptation to different manures and biosolids) while providing a strong correlation between WEP and with dissolved P in runoff (Kleinman et al., 2007).
Two water extraction methods are reported in this chapter. The first, adapted from Kleinman et al. (2007) represents the consensus method of SERA-17 and, more importantly, has been shown to work well with a broad array of manures and biosolids (dry and liquid). The second method, derived from Self-Davis and Moore (2000), is also reported because it is currently required by the Arkansas P Index for Pastures. That method has been used consistently and reliably with poultry litter samples. However, because the Self-Davis and Moore (2000) method does not fix the extraction ratio, it does not provide reliable comparisons of water extractable P across manures with varying moisture content (see Kleinman et al., 2002). Furthermore, due to the relatively low extraction ratio (approximately 10:1) of the Self-Davis and Moore (2000) method, it presents practical difficulties and cannot be used with certain manures and biosolids (see Kleinman et al., 2007).
UNIVERSAL WATER EXTRACTABLE P TEST FOR MANURE AND BIOSOLIDS (adapted from Kleinman et al., 2007) Summary of Method:
A representative sample containing 2.0 g of solids is extracted with water at a 100:1 solution:solids ratio for 1 hr, centrifuged and, if necessary, filtered. The filtrate is analyzed for phosphorus (P) by inductively coupled argon plasma spectroscopy (ICP). Apparatus and Materials:
1. Analytical balance, 300 g capacity, minimum accuracy of + 0.001 g 2. 250 mL centrifuge bottles
Methods for P Analysis, J.L. Kovar and G.M. Pierzynski (eds)
77
3. Reciprocating shaker capable of 180-200 epm 4. Centrifuge capable of 3,000 or greater rpm 5. Whatman No. 40 filter paper and filter funnels
Reagents:
1. Reagent grade water, minimum resistance of 17 MΩ cm 2. ICP Standards: P standards ranging from 0 (Reagent grade water blank) up to 100 mg L-1
P. Sample Preservation and Handling:
1. All sample containers should be pre-washed with phosphate-free detergents and rinsed with deionized water. Plastic and glass containers are both suitable.
2. Samples shall be refrigerated (4°C) upon receipt and analyzed within three weeks.
Procedure 1. Determine the percent solids of the manure on a separate subsample (Peters, 2003). 2. Based on the percent solids determination, weigh or pipet a sample containing 2.0 g solids
(see calculations below) into a 250 mL centrifuge bottle. 3. Add reagent grade water to bring to a final weight of 202 g. If solids content of sample is
less than or equal to 1%, do not add additional water. Use 200 g of the as-received sample. 4. Shake samples on a reciprocating shaker (180-200 epm) for 60 minutes. 5. Remove bottles from shaker and centrifuge (3,000 rpm or greater) for 10 minutes. If
particulates are present, filter the centrifugate (No. 40 Whatman). 6. Analyze centrifugate for P on the ICP. If sample extract can not be analyzed immediately,
acidify to prevent precipitation of calcium phosphates by adding 5 drops of concentrated HCl for each 20 mL of extract to lower pH to approximately 2.0. Acidified extracts can be held for up to three weeks before P measurement. Samples may also be analyzed colorimetrically but should be referenced to ICP analyses due to matrix interference issues.
Calculations:
1. Sample size needed to provide 2.0 g solids is determined as follow: Sample size to provide 2.0 g = 2 x 100 % solids
2. The P concentration on an as-received (wet weight) basis in mg/kg is determined as follows:
P (mg/kg) as-received basis = ICP P result (mg L-1) x 200 Sample size wet (g)
3. The P concentration on a dry weight basis is in mg/kg is determined as follows P (mg/kg) as-received basis = ICP P result (mg L-1) x 200 x 100 Sample size wet (g) % solids
Methods for P Analysis, J.L. Kovar and G.M. Pierzynski (eds)
78
ARKANSAS WATER-EXTRACTABLE P TEST FOR POULTRY LITTER (adapted from Self-Davis and Moore, 2000) Summary of Method:
A representative sample containing 20.0 g of fresh (as received) litter is extracted with 200 mL distilled water for 2 hrs, centrifuged and filtered. The filtrate is analyzed for P by colorimetry. Equipment:
1. Shaker (reciprocating or end-over-end) 2. Centrifuge 3. Centrifuge tubes (250 mL) 4. Filtration apparatus (0.45-m pore diameter) 5. Spectrophotometer with infrared phototube for use at 880 nm 6. Acid-washed glassware and plastic bottles: graduated cylinders (5 mL to 100 mL),
volumetric flasks (100 mL, 500 mL, and 1000 mL), storage bottles, pipets, dropper bottles, and test tubes or flasks for reading sample absorbance.
Reagents:
1. Concentrated hydrochloric acid (HCl) 2. Reagents used for ascorbic acid technique, Murphy-Riley (1962)
Procedure:
Weigh 20 g of fresh litter into a 250 mL centrifuge tube. Add 200 mL of distilled water and shake for two hrs. This ratio of 20 g manure to 200 mL distilled water leaves sufficient room in the centrifuge tube for proper shaking. Centrifuge at 6,000 rpm for 20 minutes. Filter the solution through a 0.45 μm membrane filter. Acidify to pH 2.0 with HCl to prevent precipitation of phosphate compounds (normally add about 5 drops of concentrated HCl per 20 mL). Freeze the sample if it is not going to be analyzed that day. Previous articles discussing the colorimetric determination of P have noted that hydrolysis of condensed phosphates can occur when the solution is acidified or in contact with acid for extended periods of time (Lee et al., 1965). Also, at this pH level, there is the possibility of flocculation of organics. However, it is necessary to make the sample solution as stable as possible, especially when there is a delay between the extraction process and actual analysis. It is vital to ensure that P remains in solution. Therefore, the negative effects of acid addition are often considered minimal.
In order to calculate the amount of water extractable P per kilogram of dry manure, the water content of the manure should be measured. On the same day the manure is extracted, weigh out another subsample (approximately 10 g) into a pre-weighed metal container and dry in a forced draft oven at 60o C for 48 hrs. Analysis:
To determine water extractable P in litter, analyze the samples by a colorimetric method, such as that of Murphy and Riley (1962). Colorimetric determination yields an estimate of reactive P in the filtrate and will result in somewhat lower values than those obtained by ICP, which approximates total P in the filtrate (Kleinman et al., 2007).
Methods for P Analysis, J.L. Kovar and G.M. Pierzynski (eds)
79
Calculations: It is preferred to report P concentrations on a dry weight basis (mg P/kg dry manure) Manure P conc. (mg/kg) = [P conc. in extract (mg L-1)] x [Extractant volume (L) ÷ Mass of dry manure (kg)] If presenting on an “as is” basis: Manure P conc. (wet basis) (mg/kg) = [P conc. in extract (mg L-1)] x [Extractant volume (L) ÷ Mass of wet manure (kg)] Comments:
It can be difficult to filter manure extracts (particularly swine and dairy manure). To improve the filter process first try increasing the centrifuge speed from 6,000 to 8,000 rpm or higher (be sure to note the maximum rpm your centrifuge tubes can withstand). Also, samples can be prefiltered though a glass-fiber filter to prepare them for 0.45 μm membrane filtration. If filtering is still difficult, manure-to-water ratios can be increased (from 1:10 to 1:15 or 1:20). References: Baum, K., G. Pierzynski, P. Kleinman, J. Kovar, R. Maguire, P.A. Moore and T. Zhang. 2006.
Evaluating the influence of storage time, sampling handling method and filter paper on the measurement of water extractable phosphorus in animal manures. Commun. Soil Sci. Plant Anal. 37: 451-463.
Haggard, B.E., P.A. Vadas, D.R. Smith, P.B. DeLaune, and P.A. Moore, Jr. 2005. Effect of extraction ratios on soluble phosphorus content and its relation with runoff phosphorus concentrations. Biosyst. Eng. 92:409–417.
Kleinman, P.J.A., A.N. Sharpley, A.M. Wolf, D.B. Beegle, and P.A. Moore, Jr. 2002. Measuring water-extractable phosphorus in manure as an indicator of phosphorus in runoff. Soil Sci. Soc. Am. J. 66:2009–2015.
Kleinman, P., D. Sullivan, A. Wolf, R. Brandt, Z. Dou, H. Elliott, J. Kovar, A. Leytem, R. Maguire, P. Moore, L. Saporito, A. Sharpley, A. Shober, T. Sims, J. Toth, G. Toor, H. Zhang, T. Zhang. 2007. Selection of a water extractable phosphorus test for manures and biosolids as an indicator of runoff loss potential. J. Environ. Qual. 36: 1357-1367.
Lee, G.F., N.L. Clesceri, and G.P. Fitzgerald. 1965. Studies on the analysis of phosphates in algal cultures. Internat. J. Air Water Poll. 9:715-722.
Murphy, J., and J.P. Riley. 1962. A modified single solution method for the determination of phosphate in natural waters. Anal. Chim. Acta 27:31–36.
Peters, J.B. 2003. Recommended methods of manure analysis [On-line]. University of Wisconsin, Madison, Cooperative Extension Publication A3769. Available at http://uwlab.soils.wisc.edu/pubs/A3769.pdf (verified 1 June 2008).
Self-Davis, M.L., and P.A. Moore, Jr. 2000. Determining water-soluble phosphorus in animal manure. p. 74–76. In G.M. Pierzynski (ed.) Methods of phosphorus analysis for soils, sediments, residuals, and waters. Southern Cooperative Series Bulletin #396. North Carolina State Univ., Raleigh, NC.
Sharpley, A., and B. Moyer. 2000. Phosphorus forms in manure and compost and their release during simulated rainfall. J. Environ. Qual. 29:1462–1469.

Methods for P Analysis, J.L. Kovar and G.M. Pierzynski (eds)
80
Technicon. 1976. Individual/simultaneous determination of nitrogen and/or phosphorus in BD digest. Industrial method no. 329-74W/A. Technicon Industrial Systems, Tarrytown, NY.
Vadas, P.A. and P. J. A. Kleinman. 2006. Effect of methodology in estimating and interpreting water-extractable phosphorus in animal manures. J. Environ. Qual. 35: 1151-1159.
Methods for P Analysis, J.L. Kovar and G.M. Pierzynski (eds)
81
Total Phosphorus in Residual Materials M.R. Bender, St. Cloud State University C.W. Wood, Auburn University
Introduction: A review of literature pertaining to the analysis of total P in residual materials shows the use of varied methods. Many methods employed are the same as those used in the determination of total P in soil, such as NaHCO3 fusion and alkali oxidation as described by Olsen and Sommers (1982) and Dick and Tabatabai (1977), respectively (Wen et al., 1997; Harris et al., 1994). In this case, it is important that the selected method effectively oxidizes the organic matter of the residual material, since this component may contain P. The methods discussed here are perchloric acid digestion, nitric acid-sulfuric acid digestion, and persulfate oxidation used in conjunction with colormetric methods for determination of total P as described by APHA (1989), and a rapid perchloric acid digestion for analysis of total P by ion chromatography developed by Adler (1995). These methods have been developed for the organic materials found in wastewater and other types of residual materials.
Perchloric Acid Digestion (APHA (1989))
Reagents 1. Concentrated HNO3 2. 70-72% HClO4 reagent grade 3. 6 M NaOH 4. Methyl orange indicator solution 5. Phenolphthalein indicator aqueous solution
Procedure Add a known volume of a well-mixed sample to a 125 mL Erlenmeyer flask, and acidify to a methyl orange endpoint (from orange to red) with concentrated HNO3. Add 5 mL more of HNO3. Evaporate solution to 15 to 20 mL on a steam bath or hot plate. Add 10 mL each of concentrated HNO3 and HClO4 to the flask. Be sure to cool the flask before each addition. After adding a few boiling chips, heat flask on a hot plate, and evaporate until dense, white fumes of HClO4 appear. If the solution is not clear, cover the flask with a watch glass and keep solution barely boiling until it clears. If necessary, 10 mL more of concentrated HNO3 can be added to aid oxidation. Cool the digested solution, and add 1 drop of phenolphthalein indicator solution. Then add 6 M NaOH until solution turns pink in color. If necessary, filter the neutralized solution to remove particulate material. Wash the filter liberally with distilled water. Bring the volume of the solution to 100 mL with distilled water. To determine total P, use one of the colormetric methods discussed in the colormetric methods section of this chapter. Please note that choice of colormetric method depends on the concentration range of orthophosphate in the sample. The vanadomolybdophosphoric acid method can be used for samples that range between 1 to 20 mg P L-1. The ascorbic acid method can be used for samples that range between 0.01 to 6 mg P L-1.
Methods for P Analysis, J.L. Kovar and G.M. Pierzynski (eds)
82
Comments The perchloric digestion method is recommended for samples that are difficult to digest. Caution must be taken when mixing HClO4 with organic materials. To avoid a violent reaction:
• Do not add HClO4 to a hot solution containing organic matter. • Begin digestion of sample containing organic material with HNO3 first, then complete
digestion with HNO3 and HClO4 mixture. • Only use a fume hood designed for HClO4 use. • Do not allow solution to evaporate to dryness.
Nitric Acid and Sulfuric Acid Digestion (APHA (1989)):
Reagents 1. Concentrated H2SO4 2. Concentrated HNO3 3. Phenolphthalein indicator aqueous solution 4. 1 M NaOH
Procedure Add a known volume of a well-mixed sample to a micro-kjeldahl flask. Add 1 mL of concentrated H2SO4 and 5 mL of concentrated HNO3. Digest the solution to a volume of 1 mL, and then continue digestion until solution becomes colorless to remove HNO3. Cool solution, then add 20 mL of distilled water. Add 1 drop of phenolphthalein indicator solution and add 1 M NaOH to the solution until a faint pink color is reached. If necessary, filter neutralized solution to remove particulate material. Wash filter liberally with distilled water. Bring the volume of the solution to 100 mL with distilled water. To determine total P use one of the colormetric methods discussed in the colormetric methods section of this chapter. Please note that choice of colormetric method depends on the concentration range of orthophosphate in sample. The vanadomolybdophosphoric acid method can be used for samples that range between 1 to 20 mg P L-1. The ascorbic acid method can be used for samples that range between 0.01 to 6 mg P L-1.
Comments Nitric acid and sulfuric acid digestion is recommended for most samples.
Persulfate Oxidation Method (APHA (1989)):
Reagents 1. Sulfuric acid solution (H2SO4). Prepare by adding 300 mL of concentrated H2SO4 to 600
mL of distilled water. Dilute solution to 1 L with distilled water. 2. Ammonium persulfate ((NH4)2S2O8) solid or potassium persulfate (K2S2O8) solid 3. 1 M (NaOH) 4. Phenolphthalein indicator aqueous solution
Methods for P Analysis, J.L. Kovar and G.M. Pierzynski (eds)
83
Procedure Add 50 mL of a well-mixed sample (or any other suitable volume) to a flask. Add 1 drop of phenolphthalein indicator solution. If a red color develops, add H2SO4 solution dropwise until color disappears. Then add 1 mL of H2SO4 solution and either 0.4 g of (NH4)2S2O8 or 0.5 g of K2S2O8. Boil the solution gently on a preheated hot plate for 30 to 40 min or until a final volume of 10 mL is reached. Those samples containing organophosphorous may take as much as 1.5 to 2 hr for complete digestion. Cool solution and dilute to 30 mL with distilled water. Add 1 drop of phenolphthalein indicator solution. Then add 1 M NaOH until solution turns a faint pink color. Heat the solution for 30 min in an autoclave or a pressure cooker at 98 to 137 kPa, then cool the solution. Add 1 drop of phenolphthalein indicator solution. Then add 1 M NaOH until solution turns a faint pink color. Bring the volume of the sample to 100 mL with distilled water. If a precipitate forms, do not filter. The precipitate will redissolve during the colormetric method used to determine total P. Mix solution well before further subdivision of the sample. To determine total P use one of the colormetric methods discussed in the colormetric methods section of this chapter. Please note that choice of colormetric method depends on the concentration range of orthophosphate in sample. The vanadomolybdophosphoric acid method can be used for samples that range between 1 to 20 mg P L-1. The ascorbic acid method can be used for samples that range between 0.01 to 6 mg P L-1.
Comments Though the persulfate digestion method is a simple method, it may be prudent to check this
method against one of the other methods described in this chapter. COLORIMETRIC METHODS
Vanadomolybdophosphoric Acid Method:
Reagents 1. Phenolphthalein indicator aqueous solution 2. 6 M HC1 or similar strength solution of H2SO4 or HNO3. 3. Activated carbon (Darco G60 or equivalent). Rinse with distilled water to remove fine
particulate material. 4. Vanadate-molybdate reagent. Prepare solution A by dissolving 25 g ammonium
molybdate ((NH4)6Mo7O24.4H2O) in 300 mL of distilled water. Prepare solution B by
dissolving 2.5 g of ammonium metavanadate (NH4VO3) by heating to boil in 300 mL of distilled water. Cool solution and then add 330 mL conc. HCl. Cool solution B to room temperature. Pour solution A into solution B, mix, and then dilute to 1 L with distilled water.
5. Standard P solution. Prepare by dissolving 219.5 mg of anhydrous KH2PO4 in distilled water. Dilute solution to 1 L with distilled water. (1.00 mL = 50.00 μg PO4-P).
Procedures If sample pH is greater than 10, add 1 drop of phenolphthalein indicator solution to 50 mL sample and add 6 M HC1 drop until the indicator changes color. Dilute sample to 100 mL. To remove excess color, shake sample with 200 mg of activated carbon for 5 min in an Erlenmeyer flask. Place 35 mL or less of sample in a 50 mL volumetric flask. Add 10 mL of
Methods for P Analysis, J.L. Kovar and G.M. Pierzynski (eds)
84
vanadate-molybdate solution to the flask and dilute the contents to 50 mL with distilled water. To prepare a blank, add 35 mL of distilled water to a 50 mL volumetric flask in place of sample. Prepare a standard curve by using suitable volumes of standard solution in place of sample. Add standard solution to a 50 mL volumetric flask. Add 10 mL of vanadate-molybdate solution to the flask and dilute the contents to 50 mL with distilled water. After 10 min or more read absorbance of sample against blank. For solutions with 1-5 mg P L-1, 2-10 mg P L-1, or 4-18 mg P L-1 measure absorbence at 400, 420, or 470 nm, respectively.
Calculations To calculate mg P L-1: mg P L-1 = [mg P (in 50 mL final volume) x 1000] ÷ [sample volume (mL)]
Comments Check activated carbon for P. Phosphorus in the activated carbon can result in high reagent blanks. Use acid-washed glassware for determining low concentrations of P. Wash glassware with a P-free detergent, then clean all glassware with hot, diluted HCl and rinse well with distilled water. For a P range of 1.0 to 5.0 mg P L-1 use a filter wavelength of 400 nm for the spectrophotometer. For a range of 2.0 to 10 mg P L-1 use a filter wavelength of 420 nm for the spectrophotometer. For a P range of 4.0 to 18 mg P L-1 use a filter wavelength of 470 nm for the spectrophotometer.
Ascorbic Acid Method:
Reagents 1. 2.5 M sulfuric acid (H2SO4). Prepare by diluting 5 mL of concentrated H2SO4 into 500
mL of distilled water. 2. Potassium antimonyl tartrate solution (K(SbO)C4H4O6
.1/2H2O). Prepare by dissolving 1.3715 g K(SbO)C4H4O6
.1/2H2O in 400 mL of distilled water in a 500 mL volumetric flask, and dilute to volume with distilled water. Store reagent in a glass-stoppered bottle.
3. Ammonium molybdate solution ((NH4)6Mo7O24.4H2O). Prepare by dissolving 20 g
(NH4)6Mo7O24.4H2O in 500 mL of distilled water. Store reagent in a glass-stoppered
bottle. 4. 0.01M ascorbic acid. Prepare by dissolving 1.76 g of ascorbic acid in 100 mL of distilled
water. Reagent is stable for approximately 1 week at 4oC. 5. Mixed reagent. Prepare by mixing 50 mL 5N H2SO4, 5 mL potassium antimonyl tartrate
solution, 15 mL ammonium molybdate solution, and 30 mL ascorbic acid solution. Mix after addition of each reagent. Be sure that all reagents are at room temperature before mixing, and be sure to mix in the order given. If turbidity forms during the combination of reagents, shake and allow to stand until turbidity disappears before continuing.
6. Stock P solution. Prepare by dissolving 219.5 mg of anhydrous KH2PO4 in distilled water. Dilute solution to 1 L with distilled water. (1.00 mL = 50.00 μg PO4-P).
7. Standard P solution. Prepare by diluting 50 mL of stock P solution to 1000 mL of distilled. (1.00 mL = 2.50 μg PO4-P).
Methods for P Analysis, J.L. Kovar and G.M. Pierzynski (eds)
85
Procedures Pipet 50 mL of sample into a clean, dry test tube or a 125 mL Erlenmeyer flask. Add 1 drop of phenolphthalein indicator solution, if a pink color develops add 2.5M H2SO4 dropwise to the solution. Add 8.0 mL of mixed reagent to the solution and mix thoroughly. Prepare a standard curve by using suitable volumes of standard solution in place of sample. Use a series of 6 standard solutions within the approximate range of 0.01 to 2.0 mg P L-1. After 10 min, and before 30 min, measure absorbance at 880 nm. Use a reagent blank as a reference solution.
Calculations To calculate mg P L-1: mg P L-1 = [mg P (in approximately 58 mL final volume) x 1000] ÷ [sample volume (mL)]
Comments For a P range of 0.30 to 2.0 mg P L-1 use a light path of 0.5 cm for the spectro-photometer.
For a range of 0.15 to 1.3 mg P L-1 use a light path of 1.0 cm for the spectrophotometer. For a range of 0.01 to 0.25 mg P L-1 use a light path of 5.0 cm for the spectrophotometer.
Rapid Perchloric Acid Digestion for Analysis by Ion Chromatography (Adler (1995)):
Reagents 1. 70 % HNO3 2. 70-72% HClO4 reagent grade 3. 30% H2O2 solution
Procedures Add 200 mg (dry wt.) of the sample to a graduated 50 mL digestion (N.P.N.) tube. Add 1.0 mL of each HNO3 and HClO4 to the tube. Place tube into a 300oC preheated aluminum digestion block and digest at boiling point until the HNO3 has boiled off (10 min). This is indicated by the subsidence of boiling. Then add 1.0 mL of H2O2 to the solution and continue digestion for another 20 min. Dilute the solution to 25 mL with double deionized water, vortex, and filter solution through a 0.2 mm Gelman ion chromatography acrodisc. The sample can then be further diluted for analysis by ion chromatography. Dilution of sample for determining total P depends upon the column setup for ion chromatography. Adler (1995) found that a 1:10 dilution of the sample is suitable when both Dionex IonPac-AG4A and AS4A columns are used. A 1:50 dilution of the sample must be used when only an Dionex IonPac-AG4A column is used. The eluent for either column setup should be 1.80 mM Na2CO3 and 1.70 mM NaHCO3 at a flow rate of 2.0 mL/min. The regenerant for the suppressor should be 12.5 mm H2SO4 at a flow rate of 3 mL/min. The sample loop volume should be 50 μL. Use standards containing equivalent concentrations of HClO4 as digested samples to develop a 3 point standard curve.
Methods for P Analysis, J.L. Kovar and G.M. Pierzynski (eds)
86
Comments Adler (1995) found that the addition of an IonPac-AG4A guard column aided in better separation of peaks of PO4 and SO4 in a HClO4 matrix, and that all ions were eluted in less than 10 min. This also allows for up to 75% reduction in run time and the use of organic solvents can be avoided.
References: Adler, P.R. 1995. Rapid perchloric acid digestion methods for analysis of phosphorus and sulfur
in aquacultural wastewater and biosolids by ion chromatography. Commun. Soil Sci. Plant Anal. 26:85-90.
APHA. 1989. Standard Methods for the Examination of Water and Wastewater, 17th edition. American Public Health Association, Washington, D.C.
Dick, W.A., and M.A. Tabatabai. 1977. An alkaline oxidation method for determination of total phosphorus in soils. Soil Sci. Soc. Am. J. 41:511-514.
Harris, W.G., H.D. Wang, and K.R. Reddy. 1994. Dairy manure influence on soil and sediment compostion: implications for phosphorus retention. J. Environ. Qual. 23:1071-1081.
Olsen, S.R. and L.E. Sommers. 1982. Phosphorus. pp. 403-430. In: A.L. Page, R.H. Miller, and D.R. Keeney (eds.), Methods of Soil Analysis. 2nd ed. Agronomy Series No. 9, Part 2. SoilScience Society of America, Inc., Madison, WI.
Wen, G., T.E. Bates, R.P. Voroney, J.P. Winter, M.P. Schellenbert. 1997. Comparison of phosphorus availability with application of sewage sludge, sludge compost, and manure compost. Commun. Soil Sci. Plant Anal. 28:1481-1497.
Methods for P Analysis, J.L. Kovar and G.M. Pierzynski (eds)
87
Bioactive Phosphorus Fractions in Animal Manure, Soil, and Extracts of Soils and Manures Thanh H. Dao, USDA-ARS, Beltsville, MD ______________________________________________________________________
Introduction A wide variety of phosphatases or phosphohydrolases that cleave the ~C-OPO3 linkage
exist to release orthophosphate from phosphorus-containing organic compounds. Phosphohydrolases include acid and an alkaline phosphatases (EC 3.1.3.2), wheat phytases (EC 3.1.3.26), fungal phytases (EC 3.1.3.8), nuclease P1 (EC 3.6.1.9), and nucleotide pyrophosphatases (EC 3.1.30.1).
Enzymatic dephosphorylation of compounds such as inositol phosphates and other orthophosphate monoesters, phosphorylated lipids, and phosphodiesters have been used in their characterization in many biological media including organic residuals and soils. Substrate specificity provide an analytical approach to determining these organic phosphorus forms in animal manure (He and Honeycutt, 2001; Dao, 2003) Dao et al., 2006), and extracts of soils (Hino, 1989; Shand and Smith, 1997; Turner et al., 2002; Toor et al., 2003; He et al., 2004) and their in situ measurements in soils (Dao, 2004a, b; Dao et al., 2005; Green et al., 2005; 2006).
In an enzymatic assay, a manure sample, a soil sample, or an aqueous extract of these matrices is incubated with a specific phosphohydrolase enzyme. The appearance and accumulation of orthophosphate in the reaction medium indicates the presence of a form or class of organic phosphorus-containing compound and concentration of the sample. However, current enzymatic methods have been hampered by the low recovery of organic phosphorus substrates to be a quantitative analytical tool. For instance, in sequential extractions of samples of swine and cattle manures, less than 50% of the organic phosphorus extracted by water and NaOH were enzymehydrolysable, and less than 15% of the organic phosphorus in the bicarbonate and NaOH extracts were hydrolyzed (He and Honeycutt, 2001), in comparison to other analytical methodology, i.e., Turner and Leytem (2004). Similarly, Hayes et al., (2000) reported less than 2% of soil total phosphorus (6.2 mg kg-1) was desorbed and hydrolyzed in a 50-mM citric acid extract and much less (0.3 mg kg-1) in a water extract.
The intermediate and end product compounds of the dephosphorylation reaction are reactive and many biogeochemical sinks for orthophosphate and inositol phosphates exist in soils. For example, enzyme-hydrolysable P fraction in manure can be significantly underestimated because inositol hexaphosphate complexed with polyvalent cations (i.e., Al+3, Fe+3, Ca+2, etc.) and was not susceptible to enzymatic dephosphorylation. The low recovery and underestimation of organic P forms were not attributed to a lack of enzymes or the lack of the organic phosphate substrates in the soil or manure samples. Dao (2004b; 2005) discussed the probable causes of the overall inefficiency of enzymatic methods that include the biochemical environment of organic phosphates.
A ligand-based mild fractionation assay was developed to differentiate in situ bioactive orthophosphate and orthophosphate monoesters, including inositol phosphates in manure (Dao, 2003; Dao et al., 2006) and soils (Dao, 2004b; Dao et al., 2005; Green et al., 2006) into pools that reflect their potential for being desorbed and released to the liquid phase. The task is critical to the accurate assessment of fate of environmental phosphorus and the protracted impairment of
Methods for P Analysis, J.L. Kovar and G.M. Pierzynski (eds)
88
aquatic environments by time-dependent solubilization and dephosphorylation of organic phosphates by ubiquitous phosphohydrolases in agricultural and natural ecosystems.
Applications An assay of potentially bioactive forms and pools based on biological and biochemical
mechanisms may better reflect the biological stability of the phosphorus forms and their availability to plants and microorganisms and the propensity of the bioactive species to trigger eutrophic responses when discharged into an aquatic environment. The in situ enzymatic assay has been applied to determine bioactive P fractions in dairy manures (Toor et al., 2005; Dao et al., 2006). Dao et al. (2005) described the time dependent release of bioactive forms from immobilized P in Ca, Fe-treated soils. Green et al. (2005; 2006) quantified P distribution in soil aggregates and the potential loss of bioactive forms from conventional, no-till, and organic cropping systems. A strong correlation was found between the release and movement of manure bioactive P and manure-borne indicator pathogens in field transport studies (Dao et al. unpublished data, 2006). In- situ Bioactive Phosphorus Fractionation in Animal Manures.
Phosphorus is present in manures as inorganic and organic forms in proportions that depend upon feed composition, mineral supplements added in the feed, feed intake and absorption efficiency, and the external environmental conditions upon excretion.
Fractions of manure phosphorus that are measured in the in situ ligand-based enzyme-hydrolysable phosphorus assay include:
• a water-extractable orthophosphate-phosphorus (WEP), • a ligand-exchangeable, in particular EDTA-extractable inorganic orthophosphate-P
(EEPi) pool that was not previously extracted by water alone, • the total desorbed inorganic fraction, • a water-extractable uncomplexed phosphohydrolase enzyme labile organic
phosphorus (UPHPo) pool, • an EDTA-exchangeable and phosphohydrolase enzyme labile organic phosphorus
(EDTA-PHPo) pool that include phytate/inositol phosphates/phosphate diesters, specific to the nature of the enzymes used,
• the total bioactive P fraction, and • a residual non-water extractable or ligand-exchangeable phosphorus (RESID-P)
pool.
Materials and Equipment 1. Sample cups and caps, plastic, 100mL-capacity 2. Test tubes, plastic, 14-mL capacity 3. Re-pipettes and disposable tips, plastic 4. Balance 5. Temperature-controlled water bath or shaker in controlled temperature chamber/room 6. Centrifuge, to attain 10,000 x g
Methods for P Analysis, J.L. Kovar and G.M. Pierzynski (eds)
89
Reagents 1. Ethylenediamine-N, N, N', N'-tetraacetate (EDTA), sodium salt: Make 0.1M stock
solution by dissolving 37.2 g and diluting to 1-L mark with DI water. Use 5.0 mL of this stock solution and dilute to 1-L with DI water to the 0.5 mM EDTA working solution.
(NOTE: A working solution, of 0.5 mM and up to 5 mM EDTA can be used to determine the exchangeable inorganic (EEPi) and the organic ligand-exchangeable PHPo fractions without interfering with the colorimetric measurements of phosphate-P by the phosphomolybdateascorbic acid method).
2. Phytases/Phosphohydrolase enzyme preparation(s). Weigh appropriate amount to have
0.05 unit/mL of suspension, depending upon enzyme preparation specific activity.
For example, if measurements are made in a 100-mL sample of manure suspension and the enzyme preparation has a specific activity 3.5 unit/mg, prepare an enzyme stock solution containing
0.05 unit/mL * 100 mL = 5 units or = 1.43 mg of enzyme preparation per mL of the enzyme stock solution.
Procedures Water-extractable inorganic P (WEP): Manure WEP is measured in duplicate
subsamples weighing between 0.5 to 0.7 g of dry manure (poultry or beef) or 0.1 to 0.2-g dry weight equivalent for liquid manure (i.e., dairy feces, manure). Deionized water is added to attain 1 to 100 (weight/volume) ratio of solid to liquid in a 100-ml plastic jar. The mixture is shaken for 1 h on a gyratory shaker at 250 rpm. After centrifugation of a 5 mL aliquot at 10,000 x g for 15 min, subsamples of the supernatant (nominally, 2 mL) are acidified with 1 M HCl before orthophosphate analysis.
Desorbable inorganic P: In another similar subsample of the manure, an aliquot of the 0.5 mM EDTA working solution is added (1 to 100 w/v) and the suspension shaken for 1 h (250 rpm). After centrifugation of a 5 mL aliquot at 10,000 x g for 15 min, subsamples of the supernatant (similarly, 2 mL) are acidified with 1 M HCl before orthophosphate analysis. Uncomplexed phosphohydrolase enzyme labile organic P (UPHPo): To the remainder of the suspension used for the WEP measurement, add an aliquot of a stock of fungal phytases EC 3.1.3.8 (0.05 unit/mL of suspension) and deionized water to replace that volume removed for WEP measurements.
The manure-enzyme mixture is agitated at 250 rpm for 20 h at 24º C. Naturally, a preliminary time course study can be conducted separately to determine the progress of the dephosphorylation reaction over time to determine the optimal equilibration period for different incubation conditions (See Dao, 2003). At the end of the equilibration period, the samples in test tubes are immersed in boiling water for 10 min to denature the enzymes and stop the hydrolysis reaction. The mixture is centrifuged at 10,000 x g, and aliquots of the supernatant are acidified and used for P analysis.
Methods for P Analysis, J.L. Kovar and G.M. Pierzynski (eds)
90
The total bioactive P fraction and complexed phosphohydrolase enzyme labile organic P (EDTA-PHPo) are determined in the same samples used for the EEPi measurements. Aliquots of a phosphohydrolase/phytases (e.g., EC 3.1.3.8) stock are added. The manure-enzyme mixture is agitated for 20 h at 24
oC, immersed in boiling water, centrifuged, and aliquots of the
supernatant is acidified prior to P analysis. Residual P: The total P of the solid residues (RESID-P) is then be analyzed using a persulfateconcentrated acid digestion. Residual P can also be calculated by determining the total P of the original sample and subtracting the bioactive P fraction.
Calculations The concentration of P in each fraction is calculated using the following equation: P concentration of a given fraction (mg/kg) = [Conc. of P (mg L-1)] x [Volume of extractant (L) ÷ mass of dry manure solids (kg)] Water-extractable water: WEP concentration (mg/kg) = [Conc. of WEP (mg L-1)] x [Volume of extractant (L) ÷ mass of dry manure solids (kg)] Ligand-exchangeable inorganic P (EEPi) = Desorbable inorganic P - WEP Uncomplexed phosphohydrolase enzyme labile organic P (PHPo) = UPHPo - WEP EDTA-exchangeable phosphohydrolase enzyme labile organic P (EDTA-PHPo) = Total bioactive P - Desorbable inorganic P
Note that the P concentration in the UPHPo and total bioactive P must be adjusted for the volume removed in the preceding analysis for either WEP or EEPi. In- situ Soil Bioactive Phosphorus Fractionation.
Fractions of soil phosphorus that are measured in the ligand-based enzyme-hydrolysable phosphorus assay include:
• the water-extractable orthophosphate-phosphorus, • an EDTA-extractable inorganic phosphate-P (EEPi) pool that was not previously
extracted by water alone, • the total desorbed inorganic fraction, • an EDTA-exchangeable and phosphohydrolase enzyme labile organic phosphorus
(EDTA-PHPo) pool that include phytate/inositol phosphates given the nature of the enzymes used,
• the total bioactive fraction, and • a residual non-extractable by water or ligand-exchangeable phosphorus (RESID-P)
pool.
Materials and Equipment 1. Sample cups and caps, plastic, 100-mL capacity 2. Test tubes, plastic, 14-mL capacity 3. Re-pipettes and disposable tips 4. Balance
Methods for P Analysis, J.L. Kovar and G.M. Pierzynski (eds)
91
5. Temperature-controlled water bath or shaker in controlled temperature chamber/room 6. Centrifuge, to attain 10,000 x g
Procedures Water-extractable inorganic soil P (WEP) is measured in duplicate samples (0.5 g of
soil, dry weight basis). Fifty mL of deionized water is added to attain 1 to 100 (weight/volume) ratio of solid to liquid in a 100-ml plastic jar. The mixture is shaken for 1 h on a gyratory shaker at 250 rpm. After centrifugation at 10,000 x g for 15 min, subsamples of the supernatant (nominally, 2 mL) are acidified with 1 M HCl before P analysis.
Desorbable inorganic P and ligand-exchangeable inorganic P (EEPi): In another soil sample (0.5 g), a 0.5 mM EDTA is added (1 to 100 w/v) and the suspension agitated for 1 h on a gyratory shaker (250 rpm) to measure complexed inorganic phosphates that are exchangeable with the ligand, EDTA. Aliquots of the supernatant (similarly, 2 mL) are used for immediate P analysis after centrifugation and acidification.
Total bioactive P and ligand-exchangeable phosphohydrolase enzyme labile organic P (EDTA-PHPo): Aliquots of a stock of fungal phytases EC 3.1.3.8 (0.05 unit/mL) and deionized water are added to replace that volume removed for EEPi measurements. The soil-enzyme suspension is agitated for 20 h at 24º C, immersed in boiling water, centrifuged, and aliquots of the supernatant is acidified prior to P analysis.
The RESID-P fraction is the difference between soil total P and the total bioactive P fraction.
Calculations The concentration of P in each fraction is calculated using the following equation: P concentration of a given fraction (mg/kg) = [Conc. of P (mg L-1)] x [Volume of extractant (L) ÷ mass of dry soil (kg)] The P concentration in the total bioactive P fraction must be adjusted for the volume removed in the analysis for EEPi.
Comments Note that the UPHPo is not determined as hydrolyzed phosphate can be re-sorbed by soil
particles and thus underestimate this fraction. Bioactive Phosphorus Fractions in Extracts of manure or soil samples and Runoff samples.
Materials and Equipment: 1. Test tubes and caps, plastic, 14 mL-capacity 2. Re-pipettes and disposable tips 3. Balance 4. Temperature-controlled water bath or shaker 5. Centrifuge, to attain 10,000 x g
Methods for P Analysis, J.L. Kovar and G.M. Pierzynski (eds)
92
Procedures: Total bioactive P in aqueous extracts of dry solid manure or the liquid phase of dairy or
swine manures, and extracts of soil samples as well as in runoff samples can be separated into WEP, LEPi, PHPo, and EDTA-PHPo, and RESID-P in accordance with the above procedures. The extracted and hydrolyzed orthophosphate are subsequently determined to quantify each fraction.
Water-extractable inorganic P (WEP) fraction is determined directly in the extracts. Desorbed inorganic P and ligand-exchangeable inorganic P (EEPi): In another 9-mL
subsample of the extracts, aliquots of the 0.1 M EDTA stock solution are added to attain a concentration of 0.5 mM EDTA and a final volume of 10 mL. The suspension is agitated for 1 h (250 rpm) to measure complexed inorganic phosphates that are exchanged with the ligand, EDTA. Aliquots of the supernatant (2 mL) are used for immediate P analysis after centrifugation and acidification. The remaining 8 mL volume is used for determining EDTA-PHPo.
Uncomplexed phosphohydrolase enzyme labile organic P (UPHPo): To a 9-mL aliquot of an extract, a 1-mL aliquot of a stock of fungal phytases EC 3.1.3.8 (0.05 unit of enzyme/mL of suspension). The extract-enzyme suspension is agitated for 20 h at 24º C, immersed in boiling water, centrifuged, and aliquots of the supernatant is acidified prior to P analysis.
Total bioactive P and ligand-exchangeable phosphohydrolase enzyme labile organic P (EDTA-PHPo): Aliquots (1 mL) of a stock of fungal phosphohydrolase EC 3.1.3.8 and DI water are added to replace that volume removed for EEPi measurements. The extract-enzyme suspension is agitated for 20 h at 24º C, immersed in boiling water, centrifuged, and aliquots of the supernatant is acidified prior to P analysis.
The RESID-P fraction is calculated as the difference between soil total P and the total bioactive P fraction.
Calculations The concentration of P in each fraction is calculated using the following equation: P concentration of a given fraction (mg/kg) = [Conc. of P (mg L-1)] x [Volume of extractant (L) ÷ mass of dry manure solids (kg)] The P concentration in the UPHPo and EDTA-PHPo must be adjusted for the volume removed in the preceding analyses for either WEP or EEPi.
Orthophosphate Determination Although phosphorus concentrations of each fraction could be determined by inductively-
coupled plasma atomic-emission spectroscopy, colorimetric analysis (Murphy and Riley, 1962; Amer. Public Health Assoc., 1998) or ion chromatography (Nieto and Frankenberger, 1985; Dao, 2003), methods should be used to measure orthophosphate that is exchanged or released upon enzymatic dephosphorylation.
References American Public Health Association. 1998. Phosphorus: Automated ascorbic acid reduction
method. 4500-P F. 4-148-149. In: Clescerl, L.S. et al. (eds). Standard methods for the examination of water and wastewater. 20th Edition. APHA, Washington, DC.
Dao, T. H. 2003. Polyvalent cation effects on myo-inositol hexakis dihydrogenphosphate enzymatic dephosphorylation in dairy wastewater. J. Environ. Qual. 32:694-701.
Methods for P Analysis, J.L. Kovar and G.M. Pierzynski (eds)
93
Dao, T. H. 2004a. Organic ligand effects on the enzymatic dephosphorylation of myo-inositol hexakis dihydrogenphosphate in dairy wastewater. J. Environ. Qual. 33:349-358.
Dao, T. H. 2004b. Ligands and phytase hydrolysis of organic phosphorus in soils amended with dairy manure. Agron. J. 96:1188-1195.
Dao, T.H. 2005. Ligand effects on phytic acid in animal manures: Assessing time dependence of inositol phosphate solubilization and bioactivity. In: Turner et al. (eds) Inositol Phosphates in the Soil–Plant–Animal System: Linking Agriculture and the Environment, 2005 Bouyoucous Conference, 21-24 August 2005, Sun Valley, ID.
Dao, T.H., E.E. Codling, and R.C. Schwartz. 2005. Time-dependent phosphorus extractability in calcium- and iron-treated high-phosphorus Soils. Soil Sci. 170:810-821.
Dao, T. H., A. Lugo-Ospina, J.B. Reeves, and H. Zhang. 2006. Wastewater chemistry and fractionation of bioactive phosphorus in dairy manure. Comm. Soil Sci. Plant Analysis 37:907-924.
Green, V.S., T.H. Dao, and M.A. Cavigelli. 2005. Characterizing bioactive phosphorus of soil aggregates in conventional and manure-based cropping systems. p. 1166-1167. In: CJ. Li et al., (Eds.). Plant Nutrition for Food Security, Human Health, and Environmental Protection. Tsinghua Univ. Press, Beijing, China.
Green, V.S., T.H. Dao, M.A. Cavigelli, and D.C. Flanagan. 2006. Phosphorus Fractions and Dynamics Among Soil Aggregate Size Classes of Organic and Conventional Cropping Systems. Soil Sci. (Accepted May 20, 2006)
Hayes, J.E., A.E. Richardson, and R.J. Simpson. 2000. Components of organic phosphorus in soil extracts that are hydrolyzed by phytase and acid phosphatase. Biol. Fertility Soils 32: 279-286.
He, Z. and C.W. Honeycutt. 2001. Enzymatic characterization of organic phosphorus in animal manure. J. Environ. Qual. 30:1685-1692.
He, Z.L., V.C. Baligar, D.C. Martens, and K.D. Ritchey. 1998. Determination of soluble phosphorus in the presence of organic ligands or fluoride. Soil Sci. Soc. Am. J. 62: 1538-1541.
He, Z., T. S. Griffin, and C. W. Honeycutt. 2004. Evaluation of soil phosphorus transformations by sequential fractionation and phosphatase hydrolysis. Soil Sci. 169:515– 527.
Hedley, M.J., J.W.B. Stewart, and B.S. Chauhan. 1982. Changes in inorganic and organic soil P fraction induced by cultivation practices and by laboratory incubations. Soil Sci. Soc. Am. J. 46: 970-976.
Hino, S. 1989. Characterization of orthophosphate release from dissolved organic phosphorus by gel filtration and several hydrolytic enzymes. Hydrobiologia 174:49-55.
Murphy, J., and J.P. Riley. 1962. A modified single solution method for the determination of phosphate in natural waters. Anal. Chem. Acta 27:31-36.
Nieto, K.F., and W.T. Frankenberger, Jr. 1985. Single ion chromatography: I. Analysis of inorganic anions in soils. Soil Sci. Soc. Am. J. 49:587-592.
Shand, C.A., and S. Smith. 1997. Enzymatic release of phosphate from model substrates and P compounds in soil solution from peaty podzol. Biol. Fertility Soils 24: 183-187.
Toor, G. S., Condron, L.M., Di, H.J., Cameron, K.C. and Cade-Menun, B.J. 2003. Characterization of organic phosphorus in leachate from a grassland soil. Soil Biol. Biochem. 35:1317-1323.
Toor, G.S., B.J. Cade-Menun, , J.T. Sims. 2005. Establishing a linkage between phosphorus forms in dairy diets, feces, and manures. J. Environ. Qual. 34:1380-1391.

Methods for P Analysis, J.L. Kovar and G.M. Pierzynski (eds)
94
Turner, B.L., and A.B. Leytem. 2004. Phosphorus compounds in sequential extracts of animal manures: Chemical speciation and a novel fractionation procedure. Environ. Sci. Tech. 38:6101-6108.
Turner, B.L., I.D. McKelvie, and P.M. Haygarth. 2002. Characterization of water-soluble soil organic phosphorus by phosphatase hydrolysis. Soil Biol. Biochem. 34: 27-35.
Methods for P Analysis, J.L. Kovar and G.M. Pierzynski (eds)
95
Phosphorus Speciation in Soils and Manures by Solution 31P NMR Spectroscopy Benjamin L. Turner, Smithsonian Tropical Research Institute, Republic of Panama April B. Leytem, USDA-ARS, Kimberly, ID
Introduction: Phosphorus occurs in a diverse range of compounds that exhibit markedly different
behavior in the environment. Information on the chemical nature of phosphorus in soils and manures is therefore of interest for studies that aim to understand phosphorus availability to plants or its fate in the environment. The phosphorus composition of both soils and manures can be conveniently determined by alkaline extraction and solution 31P nuclear magnetic resonance (NMR) spectroscopy. The method is superior to conventional chromatographic separation techniques because multiple phosphorus compounds can be quantified simultaneously with minimal sample preparation and handling. The procedure outlined here involves extraction in a solution containing sodium hydroxide and EDTA and can be applied to both soils and manures with minor adjustments.
Chemicals: 1. Sodium hydroxide (NaOH), FW 40.00. 2. Ethylenediaminetetraacetic acid (EDTA), disodium salt dihydrate, C10H14N2O8Na2.2H2O,
FW 372.2 3. (Optional) Methylene diphosphonic acid (MDP), trisodium salt, CH3O6P2Na3, FW 241.95 4. Deuterium oxide (D2O), FW 20.03
Reagents: 1. NaOH–EDTA extraction solution: Dissolve 10.0 g of NaOH and 18.6 g of EDTA in 1 L
of deionized water. The solution contains 0.25 M NaOH and 50 mM EDTA. For poultry and swine manures the NaOH concentration can be increased to 0.5 M to improve spectral resolution (see discussion).
2. MDP solution: For soils, dissolve 39.05 mg of MDP in 100 mL deionized water to make a solution containing 100 µg P mL-1. For manures dissolve 390.5 mg of MDP in 100 mL deionized water to make a solution containing 1 mg P mL-1. Note that MDP often contains several moles of water per mole of solid, which must be accounted for when preparing the standard solution. The solution is stable for several months in the refrigerator.
3. NaOH–EDTA solution for NMR spectroscopy: Dissolve 4.00 g NaOH and 3.72 g EDTA in 100 mL of deionized water. The solution contains 1.0 M NaOH and 100 mM EDTA.
Extraction procedure:
1. Weigh 5.00 ± 0.01 g of air-dried soil or manure into a 250 mL centrifuge bottle and add 100 mL of NaOH–EDTA extraction solution (1:20 solid/solution ratio).
2. Cap the bottle and shake for 4 h (or 16 h overnight) at room temperature. 3. Centrifuge at approx. 10,000 g for 30 min and decant the supernatant.
Methods for P Analysis, J.L. Kovar and G.M. Pierzynski (eds)
96
4. Retain an aliquot of the supernatant for determination of total phosphorus by inductively coupled-plasma optical-emission spectrometry (ICP–OES) or persulfate digestion following an appropriate dilution (e.g., 10-fold for soil extracts or 100-fold for manure extracts).
5. (Optional) To 50 mL of the remaining supernatant add 1 mL of MDP solution as an internal standard.
6. Freeze the sample at –30°C or lower and lyophilize (freeze-dry). Homogenize the lyophilized powder by gently crushing and mixing.
NMR spectroscopy:
1. Re-dissolve the lyophilized powder (50–100 mg) in 0.9 mL of 1.0 M NaOH–100 mM EDTA solution and add 0.1 mL of D2O.
2. Transfer the sample to a 5-mm NMR tube and analyze by solution 31P NMR spectroscopy. Appropriate machine parameters for soil extracts are: a 45° pulse, 2.0 s delay time, 0.8 s acquisition time, 20°C probe temperature. Broadband proton decoupling should be used for all samples. Manure extracts may require a longer delay time of 5 s or more (McDowell et al., 2006). The number of scans required to obtain a well-resolved spectrum will vary depending on the phosphorus concentration in the sample, but most soil extracts will require between 5000 and 30,000 scans. Typical experiment times using the above parameters on a 500 MHz instrument are 12 h for soil extracts and 4 h for manure extracts. Spectra are normally plotted with a line broadening of 5–10 Hz, although values as low as 0.5 Hz can be used for well-resolved spectra of manures with high phosphorus contents (e.g., Turner, 2004). A comprehensive description of the procedure for solution 31P NMR spectroscopy of environmental samples can be found in a recent review (Cade-Menun, 2005).
3. Determine chemical shifts of signals in parts per million (ppm) relative to an external standard of 85% H3PO4. Assign signals to individual phosphorus compounds or functional groups (see Table 1). Signals areas are determined by integration and phosphorus concentrations calculated either on the basis of the total phosphorus value determined by digestion or using the MDP internal standard.
4. Example solution 31P NMR spectra of soil and manure extracts are shown in Fig. 1. Note that when resolution allows, it is possible to identify and quantify individual signals in the phosphate monoester region in detail (for detailed assignments see Turner et al., 2003a). In particular, it is possible to quantify the four signals from myo-inositol hexakisphosphate, which occur in a 1:2:2:1 ratio and are notably prominent in extracts of swine manure and poultry litter (Fig. 1b). This compound can also be quantified in less well-resolved spectra using spectral deconvolution software (Turner et al., 2003b) or by using the signal from the C-2 phosphate at approx. 5.9 ppm.
Comments: The NaOH–EDTA procedure described here is an adaptation of the original method,
which involved a 2-h extraction at 85°C (Bowman and Moir, 1993). This procedure is assumed to quantitatively extract organic phosphorus from soil (Bowman and Moir, 1993; Turner et al., 2005) and can extract > 90% of the total phosphorus from high organic matter soils (Cade-Menun et al., 2000; Turner et al., 2004). Similar results have been reported for a range of manures, notably swine manure and poultry litter (Leytem et al., 2004; Maguire et al., 2004;
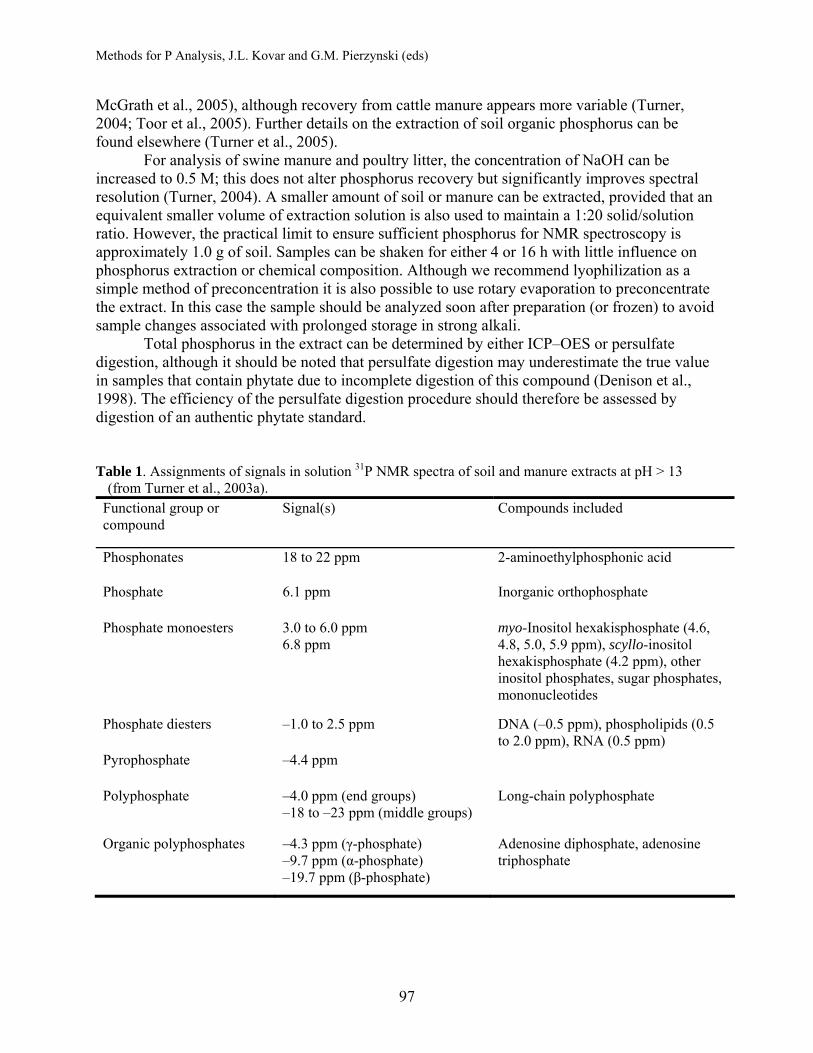
Methods for P Analysis, J.L. Kovar and G.M. Pierzynski (eds)
97
McGrath et al., 2005), although recovery from cattle manure appears more variable (Turner, 2004; Toor et al., 2005). Further details on the extraction of soil organic phosphorus can be found elsewhere (Turner et al., 2005).
For analysis of swine manure and poultry litter, the concentration of NaOH can be increased to 0.5 M; this does not alter phosphorus recovery but significantly improves spectral resolution (Turner, 2004). A smaller amount of soil or manure can be extracted, provided that an equivalent smaller volume of extraction solution is also used to maintain a 1:20 solid/solution ratio. However, the practical limit to ensure sufficient phosphorus for NMR spectroscopy is approximately 1.0 g of soil. Samples can be shaken for either 4 or 16 h with little influence on phosphorus extraction or chemical composition. Although we recommend lyophilization as a simple method of preconcentration it is also possible to use rotary evaporation to preconcentrate the extract. In this case the sample should be analyzed soon after preparation (or frozen) to avoid sample changes associated with prolonged storage in strong alkali.
Total phosphorus in the extract can be determined by either ICP–OES or persulfate digestion, although it should be noted that persulfate digestion may underestimate the true value in samples that contain phytate due to incomplete digestion of this compound (Denison et al., 1998). The efficiency of the persulfate digestion procedure should therefore be assessed by digestion of an authentic phytate standard.
Table 1. Assignments of signals in solution 31P NMR spectra of soil and manure extracts at pH > 13 (from Turner et al., 2003a).
Functional group or compound
Signal(s) Compounds included
Phosphonates 18 to 22 ppm 2-aminoethylphosphonic acid
Phosphate 6.1 ppm Inorganic orthophosphate
Phosphate monoesters 3.0 to 6.0 ppm 6.8 ppm
myo-Inositol hexakisphosphate (4.6, 4.8, 5.0, 5.9 ppm), scyllo-inositol hexakisphosphate (4.2 ppm), other inositol phosphates, sugar phosphates, mononucleotides
Phosphate diesters –1.0 to 2.5 ppm DNA (–0.5 ppm), phospholipids (0.5 to 2.0 ppm), RNA (0.5 ppm)
Pyrophosphate –4.4 ppm
Polyphosphate –4.0 ppm (end groups) –18 to –23 ppm (middle groups)
Long-chain polyphosphate
Organic polyphosphates –4.3 ppm (γ-phosphate) –9.7 ppm (α-phosphate) –19.7 ppm (β-phosphate)
Adenosine diphosphate, adenosine triphosphate
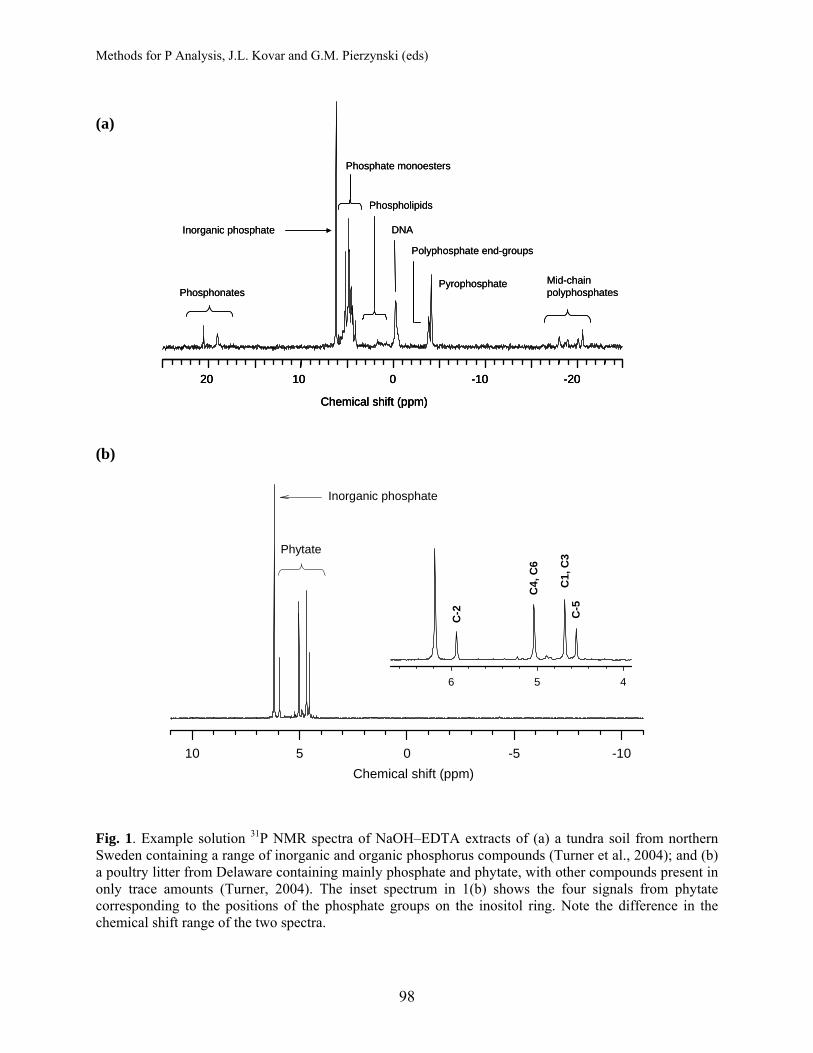
Methods for P Analysis, J.L. Kovar and G.M. Pierzynski (eds)
98
(a) (b) Fig. 1. Example solution 31P NMR spectra of NaOH–EDTA extracts of (a) a tundra soil from northern Sweden containing a range of inorganic and organic phosphorus compounds (Turner et al., 2004); and (b) a poultry litter from Delaware containing mainly phosphate and phytate, with other compounds present in only trace amounts (Turner, 2004). The inset spectrum in 1(b) shows the four signals from phytate corresponding to the positions of the phosphate groups on the inositol ring. Note the difference in the chemical shift range of the two spectra.
Phosphonates
Inorganic phosphate
Phospholipids
Phosphate monoesters
Polyphosphate end-groups
Mid-chain polyphosphates
DNA
Pyrophosphate
Chemical shift (ppm)
-20-1001020
Phosphonates
Inorganic phosphate
Phospholipids
Phosphate monoesters
Polyphosphate end-groups
Mid-chain polyphosphates
DNA
Pyrophosphate
Chemical shift (ppm)
-20-1001020
Chemical shift (ppm)
-20-1001020
Chemical shift (ppm)-10-50510
456
Inorganic phosphate
PhytateC
4, C
6
C1,
C3
C-2 C-5
Methods for P Analysis, J.L. Kovar and G.M. Pierzynski (eds)
99
Nuclear Magnetic Resonance spectroscopy is performed on samples re-dissolved in a strong alkaline solution to ensure well-resolved signals and consistent chemical shifts. A pH of < 13 in the redissolved extract should be avoided as it complicates signal identification and can increase line broadening (Crouse et al., 2000). The D2O is added for signal lock in NMR spectroscopy, while the EDTA improves spectral resolution by chelating free iron (Turner and Richardson, 2004). The use of a 10-mm probe allows spectra to be acquired more rapidly than with a 5-mm probe, although the larger probes are less commonly available in university chemistry laboratories.
A key limitation on the NMR procedure is that degradation of RNA and some phospholipids occurs relatively rapidly in strong alkali (Makarov et al., 2002; Turner et al., 2003a), so these compounds will be detected as phosphate monoesters in NMR spectra. However, the monoester degradation products are stable, so the total organic phosphorus concentration is unaffected. This is a lesser concern for manure analysis, especially swine and poultry manures, because only a minor component of the organic phosphorus occurs as alkali-labile compounds.
For manures, the NaOH–EDTA extraction procedure can form part of a simple two-step fractionation scheme when combined with a preliminary extraction of soluble phosphorus in sodium bicarbonate or water (Turner and Leytem, 2004). This allows manure phosphorus to be conveniently separated into mobile/bioavailable and stable/refractory compounds. References Bowman, R. A., and J. O. Moir. 1993. Basic EDTA as an extractant for soil organic phosphorus.
Soil Sci. Soc. Am. J. 57:1516-1518. Cade-Menun, B. J. 2005. Using phosphorus-31 nuclear magnetic resonance spectroscopy to
characterize organic phosphorus in environmental samples. pp. 21-44. In B. L. Turner, E. Frossard, and D. S. Baldwin (Eds), Organic Phosphorus in the Environment. CAB International, Wallingford, UK.
Cade-Menun, B. J., S. M. Berch, C. M. Preston, and L. M. Lavkulich. 2000. Phosphorus forms and related soil chemistry of Podzolic soils on northern Vancouver Island. 1. A comparison of two forest types. Can. J. Forest Res. 30:1714-1725.
Crouse, D. A., H. Sierzputowska-Gracz, and R. L. Mikkelsen. 2000. Optimization of sample pH and temperature for phosphorus-31 nuclear magnetic resonance spectroscopy of poultry manure extracts. Commun. Soil Sci. Plant Anal. 31:229-240.
Denison, F. H., P. M. Haygarth, W. A. House, and A. W. Bristow. 1998. The measurement of dissolved phosphorus compounds: Evidence for hydrolysis during storage and implications for analytical definitions in environmental analysis. Int. J. Environ. Anal. Chem. 69:111-123.
Leytem, A. B., B. L. Turner, and P. A. Thacker. 2004. Phosphorus composition of manure from swine fed low-phytate grains: Evidence for hydrolysis in the animal. J. Environ. Qual. 33:2380-2383.
Maguire, R. O., J. T. Sims, W. W. Saylor, B. L. Turner, R. Angel, and T. J. Applegate. 2004. Influence of phytase addition to poultry diets on phosphorus forms and solubility in litters and amended soils. J. Environ. Qual. 33:2306-2316.
Makarov, M. I., L. Haumaier, and W. Zech. 2002. Nature of soil organic phosphorus: an assessment of peak assignments in the diester region of 31P NMR spectra. Soil Biol. Biochem. 34:1467-1477.
Methods for P Analysis, J.L. Kovar and G.M. Pierzynski (eds)
100
McDowell, R. W., I. Stewart, and B. J. Cade-Menun. 2006. An examination of spin-lattice relaxation times for analysis of soil and manure extracts by liquid state phosphorus-31 nuclear magnetic resonance spectroscopy. J. Environ. Qual. 35:293 - 302.
McGrath, J. M., J. T. Sims, R. O. Maguire, W. W. Saylor, C. R. Angel, and B. L. Turner. 2005. Broiler diet modification and litter storage: Impacts on phosphorus in litters, soils, and runoff. J. Environ. Qual. 34:1896-1909.
Toor, G. S., B. J. Cade-Menun, and J. T. Sims. 2005. Establishing a linkage between phosphorus forms in dairy diets, feces, and manures. J. Environ. Qual. 34:1380-1391.
Turner, B. L. 2004. Optimizing phosphorus characterization in animal manures by solution phosphorus-31 nuclear magnetic resonance spectroscopy. J. Environ. Qual. 33:757-766.
Turner, B. L., and A. B. Leytem. 2004. Phosphorus compounds in sequential extracts of animal manures: chemical speciation and a novel fractionation procedure. Environ. Sci. Technol. 38:6101-6108.
Turner, B. L., and A. E. Richardson. 2004. Identification of scyllo-inositol phosphates in soils by solution phosphorus-31 nuclear magnetic resonance spectroscopy. Soil Sci. Soc. Am. J. 68:802-808.
Turner, B. L., R. Baxter, N. Mahieu, S. Sjogersten, and B. A. Whitton. 2004. Phosphorus compounds in subarctic Fennoscandian soils at the moutain birch (Betula pubescens)–tundra ecotone. Soil Biol. Biochem. 36:815-823.
Turner, B. L., B. J. Cade-Menun, L. M. Condron, and S. Newman. 2005. Extraction of soil organic phosphorus. Talanta 66:294-306.
Turner, B. L., N. Mahieu, and L. M. Condron. 2003a. Phosphorus-31 nuclear magnetic resonance spectral assignments of phosphorus compounds in soil NaOH-EDTA extracts. Soil Sci. Soc. Am. J. 67:497-510.
Turner, B. L., N. Mahieu, and L. M. Condron. 2003b. Quantification of myo-inositol hexakisphosphate in alkaline soil extracts by solution 31P NMR spectroscopy and spectral deconvolution. Soil Sci. 168:469-478.
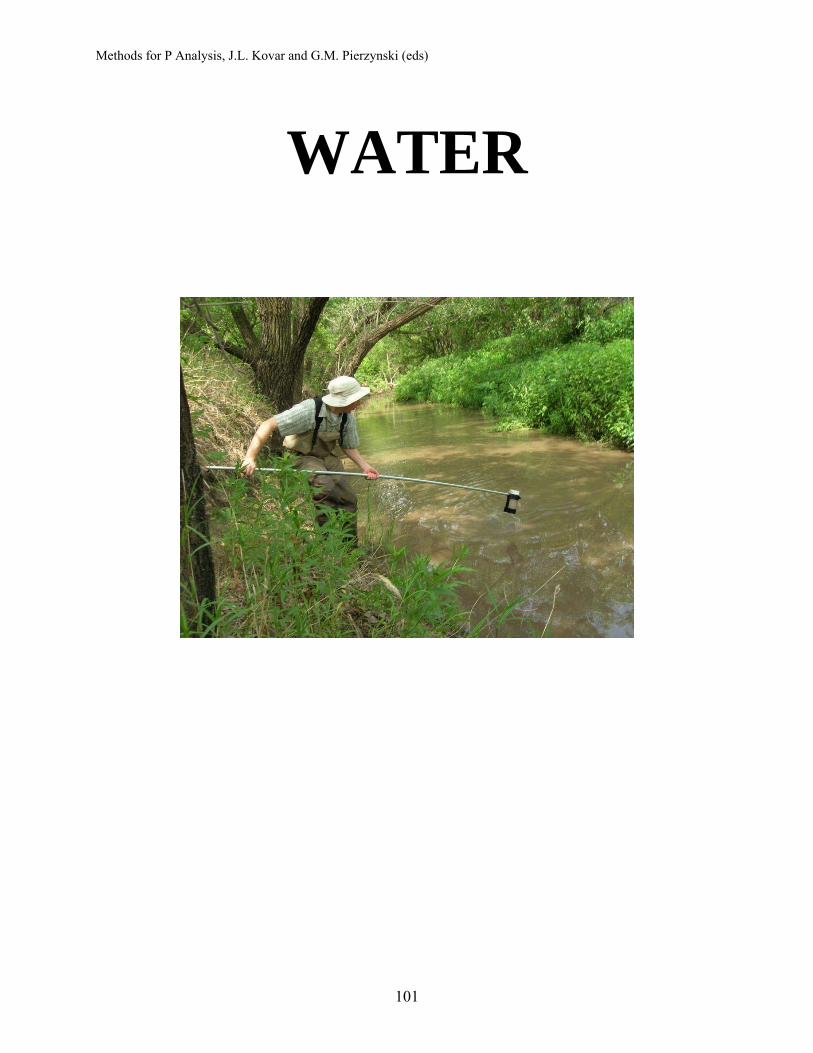
Methods for P Analysis, J.L. Kovar and G.M. Pierzynski (eds)
101
WATER
Methods for P Analysis, J.L. Kovar and G.M. Pierzynski (eds)
102
Water Sample Collection, Handling, Preparation and Storage P.M. Haygarth, North Wyke, Okehampton, England A.C. Edwards, Nether Backhill, Ardallie, By Peterhead, Scotland
Introduction: Interfacing between the field, laboratory and chemical analysis is critical in determining
the forms of phosphorus (P) present in soil-water samples (Worsfold et al., 2005). Collection, handling, preparation and storage procedures play a key role the operational definitions of P forms (Rowland and Haygarth, 1997, Haygarth and Sharpley, 2000) and the lack of a standard protocol can introduce serious bias into the precision and accuracy of the determination of the P forms (Haygarth et al., 1995). It is therefore essential to adhere to sensible protocols.
Nomenclature: To understand the problems of collection, handling, preparation, and storage it is first
necessary to consider the definitions and nomenclature of P forms commonly determined in a water sample: Collection, handling, preparation, and storage can directly affect the analytical endpoint. Forms of P in water attract differing and confusing nomenclature, and a systematic and logical means of classification is required. Some fraction of the total P content of any water has previously been classified by names which define the P in terms of filtration, and subsequently chemical (i.e., Murphy and Riley (1962) molybdenum (Mo) blue reaction) methodologies (Haygarth et al., 1998). Filtration is strictly a physically based definition of the carrier rather than P form, but has been used to define the difference between ‘soluble’ or ‘dissolved’ and ‘particulate’ forms. However, any classification of nomenclature based on ‘dissolved,’ ‘soluble,’ or ‘particulate’ is potentially flawed, because (a) the filter size and type has not been standardized and (b) P can be associated with a continuum of <0.45 µm sized particles/colloids, and samples vary widely in size distribution of particulate/colloidal material (De Haan et al., 1984; Haygarth et al., 1997).
There are similar problems with chemically based definitions. Traditionally, the Murphy-Riley method has been the standard, but this has been subject to many modifications, which alter analytical conditions and introduce uncertainties about what forms of P are actually being included in the determination. Ion chromatography and inductively coupled plasma (ICP) techniques have increased in popularity, but these determine different forms of P than the Murphy-Riley reaction. Users therefore need to be aware that P forms are very much methodology defined, and the problem is identifying exactly what P forms are determined by each method, and ultimately finding a system of nomenclature to incorporate these difficulties. Because of this, methodologically driven definitions should be used in the nomenclature where possible.
Reactive P is defined as that which is readily determined analytically by the Mo blue reaction (Murphy and Riley, 1962). This is a very specific color reaction that determines orthophosphate, but the analytical conditions (e.g., acidity) during color development stage can change the chemical forms of P present within the sample. This means that Mo blue methodology is prone to overestimating P, in comparison to chromatographic determinations (Denison et al., 1998; Edwards and Withers, 1998), because the procedure may also determine loosely bound inorganic/organic forms of P, by either acid-enhanced hydrolysis (Tarapchak, 1993) or hydrous ferric oxide-orthophosphate. Using P-31 NMR Turner et al. (2006)

Methods for P Analysis, J.L. Kovar and G.M. Pierzynski (eds)
103
demonstrated the overestimation of organic-P in alkali extracts using molybdate colorimitry due to the presence of inorganic-P associated with organic matter. The reaction is also vulnerable to interferences with silica (Ciavatta et al., 1990). Conversely, the part of the P present in a sample that requires digestion prior to detection should be called unreactive P. Unreactive P will contain organic forms and some condensed forms of P, such as polyphosphates (Ron Vaz et al., 1993). Therefore, any attempt to classify P as ‘orthophosphate,’ ‘organic,’ or ‘inorganic’ in context with Murphy-Riley chemistry is technically incorrect, as it relies on the Mo-reaction. Methodology defined terms for describing the P chemistry with the Murphy-Riley reaction are therefore ‘reactive P’(RP), ‘unreactive P’(UP) and ‘total P’(TP) (i.e., reactive + unreactive, occurring after an appropriate method of digestion, or measured directly by ICP). Thus RP, UP or TP are the three prefixes of the suggested nomenclature.
Similarly, a systematic nomenclature for filtration is proposed, to be used as a suffix after chemical form, which removes ambiguity associated with terms like ‘soluble,’ ‘dissolved’ or ‘particulate,’ all of which are non-exacting and subjective. Samples are defined specifically according to filter size, with a suffix denoting the pore size (in microns) of the filter used in parenthesis (e.g., <0.45 or >0.45). Therefore, the established system of classifying dissolved reactive P (DRP) would be replaced by RP(<0.45). Where a sample has not been subjected to filtration, the suffix (unf) is used. Figure 1 provides a visual summary of this nomenclature. Ultimately, researchers can expand and adapt this methodology-defined nomenclature to include other analytical methods such as ICP or ion chromatography.
Background: An idealized and all-encompassing methodology for sample collection is impossible to
prescribe because it depends on circumstances and samples. Sampling designs must be systematic, defensible and hypothesis-driven and therefore random and non-orthogonal sample collection programs are not advisable. Typical soil/water environmental samples may vary from laboratory soil extracts, (2) tension and zero-tension samples and, (3) flowing or standing waters. Soil extractions are considered in other chapters, but it is necessary to be aware that storing and sieving soil samples have been found to markedly affect the resulting extractable soil P characteristics (Chapman et al., 1997). Tension (suction cup) samplers present uncertainties in terms of their representativeness to ‘mobile’ soil water. Users of these techniques need to be aware of these limitations. When sampling flowing waters from soils, there are three types of procedures: grab samples, flow proportional samples and continuous (regular) samples (Haygarth et al., 1998; Lennox et al., 1997). Flow proportional or continuous regular sampling provides a truer estimate if determining export coefficients is the aim, whereas grab samples can be used for comparative studies of spatial differences at one time. Harmel et al. (2006) suggest the following recommendations as being generally applicable to field and small watershed studies: (1) consider wet-weather access, travel time, equipment costs, and sample collection method in the selection of sampling site numbers and locations; (2) commit adequate resources for equipment maintenance and repair; (3) assemble a well-trained, on-call field staff able to make frequent site visits; (4) establish reliable stage-discharge relationships for accurate discharge measurement; (5) use periodic manual grab sample collection with adequate frequency to characterize baseflow water quality; (6) use flow-interval or time-interval storm sampling with adequate frequency to characterize storm water quality; and (7) use composite sampling to manage sample numbers without substantial increases in uncertainty.
Methods for P Analysis, J.L. Kovar and G.M. Pierzynski (eds)
104
Phosphorus is vulnerable to transformations during handling and storage, and there have been many publications suggesting recommended handling strategies (Annett and D'Itri, 1973; Bull et al., 1994; Gilmartin, 1967; Haygarth et al., 1995; Henriksen, 1969; Heron, 1962; Krawczyk, 1975; Mackereth et al., 1989; Jarvie et al 2002). Changes can occur in the long term (Bull et al., 1994) and short term (Haygarth et al., 1995) and can be classified into two types: removal or transformation.
Removal (or ‘apparent’ removal) occurs by sorption to vessel wall (Latterell et al., 1974) or precipitation. All forms of P can potentially suffer from removal by sorption/precipitation reactions (indirectly affected by pH, redox, dissolved organic carbon (DOC), Ca, Al and Fe content) with container walls. Colloid and particulate content of the water will also provide surfaces for sinks and sources of P. Storage vessel size and material are critical at regulating the extent of removal by sorption (Annett and D'Itri, 1973; Haygarth et al., 1995). Freezing of samples is known to reduce losses by sorption, but is not recommended because it causes physical transformations to occur (Johnson et al., 1975).
Transformation can occur through either chemical or biological mechanisms (Fitzgerald and Faust, 1967; Heron, 1962). The sensitivity to transformations in storage brought about by microbial mineralization/immobilization, hydrolysis and cell lysis generally increase with the complexity of analysis and fractionation performed. For example, analysis for total P will only be vulnerable to sorption/desorption interactions (see Figure 1) with vessel walls whereas filtered, Mo reactive and unreactive forms of P are also vulnerable to transformations and therefore may require a more stringent sample treatment. The presence/absence of chemical or biological preservative has been shown to affect rates of transformation and Krawczyk (1975) demonstrated that HgCl2 at an equivalent concentration of 400 mg L-1 suppressed microbial transformations, but has the disadvantage of suppressing Mo-blue color reaction in flow-injection systems (Haygarth et al., 1995). Other preservatives, such as chloroform, iodine and dilute H2SO4 solutions have been described (Chakrabarti et al., 1978; Fishman et al., 1986; Murphy and Riley, 1959), but these techniques can (1) kill microbial populations – releasing reactive P, and (2) hydrolyse organic/polyphosphate P. Storage in darkness and temperature regime has been shown to have a direct effect on transformations (Haygarth et al., 1995). Freezing as a method of preventing transformation is not advisable because it can rupture microbial cells and release P into solution upon thawing (Nelson and Romkens, 1972).
Sizes and types of filters affect the concentrations of P determined (Haygarth et al., 1997) and, although threshold sizes used vary from 0.2 to 0.5 µm, 0.45 µm cellulose-nitrate-acetate (CNA) filters are most common. The relationship between soluble and particulate P is not fixed, but depends on the subsequent storage time and conditions. Samples with a high particulate content may cause rapid blocking of filters and effectively reducing the filter pore size.
Recommended ‘Best Practice’: Since the range and permutations of sample type, experimental conditions and requirements
are very high, we are reluctant to recommend a stringent ‘best procedure.’ One of the key conclusions of Haygarth et al. (1995) was that the range of conditions and recommendations by researchers vary in response to different types of sample. For example, a suction cup sample from a chalk soil with a high Ca content may require a different set of storage conditions than a sample of drainage water from plots recently treated with cattle slurry: The former may be vulnerable to removal by Ca-P precipitation, while the sample influenced by slurry may be more vulnerable to microbial transformations. Further, since the kinetics of change during storage are
Methods for P Analysis, J.L. Kovar and G.M. Pierzynski (eds)
105
extremely variable between water samples, uniform procedures may not help as a broad-brush recommendation for all samples. Similar conclusions have been made by Jarvie et al. (2002) who considered the potential sensitivity of rivers with different physical, chemical and biological characteristics (trophic status: turbidity, flow regime, matrix chemistry) in terms of errors associated with sampling, sample preparation, storage, contamination, interference and analytical errors. Key issues identified by these authors include:
• The need to tailor analytical reagents and concentrations to take into account the characteristics of the sample matrix;
• The effects of matrix interference on the colorimetric analysis; • The influence of variable rates of phospho-molybdenum blue colour formation; • The differing responses of river waters to physical and chemical conditions of storage; • The higher sensitivities of samples with low P concentrations to storage and analytical
errors.
On this cautionary note, we therefore recommend a ‘best practice’ rather than a ‘best procedure.’ Researchers must be aware of the potential hazards and be ready to adapt the procedures to suit their particular circumstances.
Equipment: With field sampling, ceramic suction cups may have a tendency to sorb P, whereas PTFE
samplers may present less of a problem. Storage vessels made with PTFE may minimize sorption, but the removal effects of using polyethylene are only slightly worse (Haygarth et al., 1995). Sample bottles should be as large as is practicable because this reduces the surface area to volume ratio, with volumes >100 mL most effective for minimizing changes. Researchers need to consider whether bottles should be washed (e.g., 10% v/v H2SO4 or in a P free detergent such as Decon) and if so, how often and the appropriate rinsing procedure. If bottles are to be used again perhaps it may be more appropriate to store them in clean water. Filtration usually should be through 0.45-µm CNA membranes, according to the water industry standards.
Reagents: No chemical preservatives should be used, as these change microbial populations, which
affect the forms of P determined. In extreme circumstances, with waters that are particularly vulnerable to transformations, researchers may wish to consider the relative advantage of using a 0.22-µm CNA membrane to sterilize by filtration.
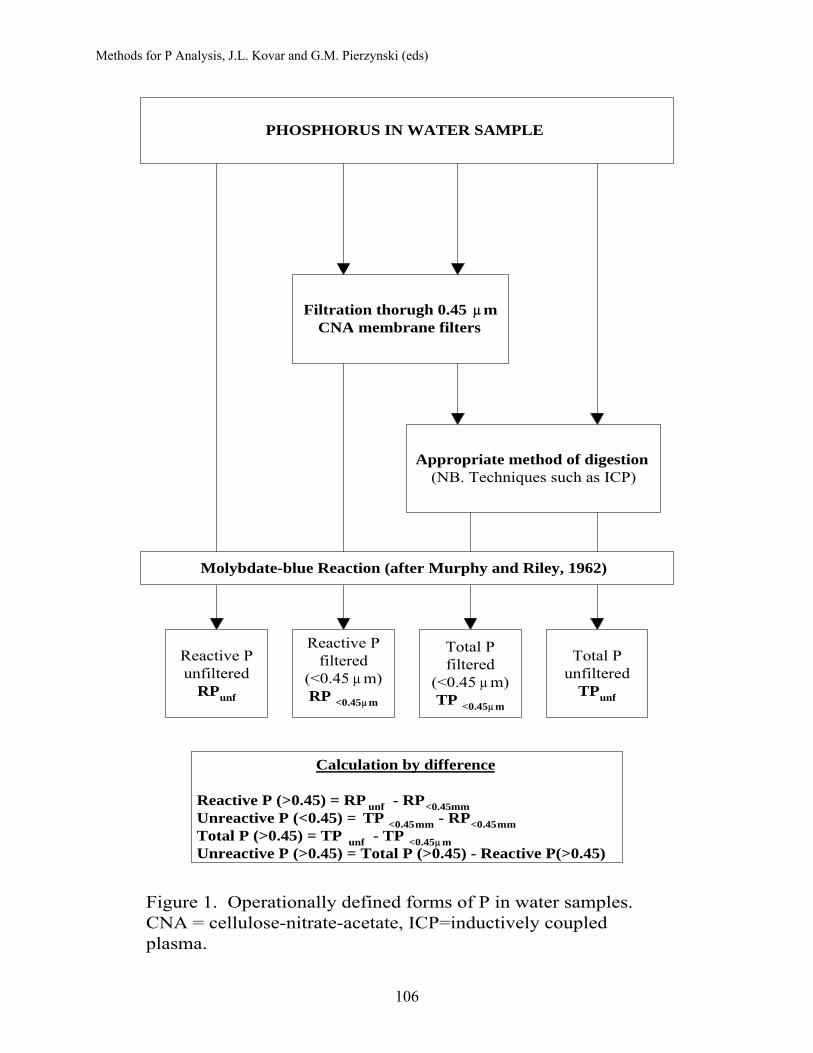
Methods for P Analysis, J.L. Kovar and G.M. Pierzynski (eds)
106
PHOSPHORUS IN WATER SAMPLE
Filtration thorugh 0.45 μmCNA membrane filters
Appropriate method of digestion(NB. Techniques such as ICP)
Reactive Punfiltered
RPunf
Reactive Pfiltered
(<0.45 μm)RP <0.45μm
Total Pfiltered
(<0.45 μm)TP <0.45μm
Total Punfiltered
TPunf
Molybdate-blue Reaction (after Murphy and Riley, 1962)
Calculation by difference
Reactive P (>0.45) = RP unf - RP<0.45mmUnreactive P (<0.45) = TP <0.45mm - RP<0.45mmTotal P (>0.45) = TP unf - TP <0.45μmUnreactive P (>0.45) = Total P (>0.45) - Reactive P(>0.45)
Figure 1. Operationally defined forms of P in water samples.CNA = cellulose-nitrate-acetate, ICP=inductively coupledplasma.
Methods for P Analysis, J.L. Kovar and G.M. Pierzynski (eds)
107
Procedure: 1. When sampling, three bottle fills should be discarded and the fourth sample retained, in
order to ‘condition’ the bottle. This may be difficult to achieve with an autosampler. 2. Samples must be rapidly transferred to the laboratory and stored in a refrigerator at 4°C. 3. The pressure of filtration should not ordinarily exceed 60 cm /Hg (80 kPa). All filtration
should be undertaken within 12 h. Filters should be pre-washed with deionized water, conditioned with sample, and both these eluent solutions discarded.
4. For samples that are vulnerable to transformation (such as those for reactive/unreactive P), the total time between sampling and analytical determination should not be greater than 24 h. Researchers should be aware of the potential for transformations to occur when samplers store storm samples at remote sites.
5. For samples only vulnerable to removal (such as those for total P determination), the total time between sampling and analysis can be longer than 24 h, most ideally stored at 4oC. It is recommended that if samples must be stored for TP, where digestions are needed, they should be readily pipetted into bottles for digestion prior to storage, to minimize problems of sorption to bottle walls.
Comments: The wide range of sample properties means that it is difficult to set a standard protocol and the above recommendations must be interpreted in this context. For example, there may be a need for setting different protocols for different extremes of particulate content or electrolyte concentration. The main principle behind sampling is minimal disturbance and rapid transfer to the analytical end point. There is a need to be aware of the varying methodological definitions of P, controlled by the analytical methods. Recognize that storage starts in the field – perhaps in the suction cup collection vessel or in an autosampler bottle, so this must be borne in mind in adopting a best practice. Quality control and quality assurance schemes, which use real samples, are to be encouraged and adopted.
References: Annett, C.S., and F.M. D'Itri. 1973. Preservation of total soluble phosphorus. In ‘Proceedings
16th Conference Great Lake Research,’ pp. 214-220. International Association Great Lakes Research.
Bull, K. R., K.H. Lakhani, and A.P. Rowland. 1994. Effects of chemical preservative and temperature storage conditions on cations and anions in natural water. Chemistry and Ecology 9: 47-62.
Chakrabarti, C. L., K.S. Subramanian, J.E. Sueiras, and D.J. Young. 1978. Presevation of some anionic species in natural waters. J. Amer. Water Works Assoc. October 1978, 560-565.
Chapman, P.J., C.A. Shand, A.C. Edwards, and S. Smith. 1997. Effect of storage and sieving on the phosphorus composition of soil solution. Soil Sci. Soc. Am. J. 61:315-321.
Ciavatta, C., L.V. Antisari, and P. Sequi. 1990. Interference of soluble silica in the determination of orthophosphate-phosphorus. J. Environ. Qual. 19:761-764.
De Haan, H., T. De Boer, J. Voerman, A.J. Kramer, and J.R. Moed. 1984. Size classes of ‘dissolved’ nutrients in shallow, alkaline, humic and eutrophic Tjeukemeer, The Netherlands, as fractionated by ultrafiltration. Verh. Int. Ver., Theor. Angew. Limnol. 22:876-881.
Denison, F.H., P.M. Haygarth, W.A. House, and A.W. Bristow. 1998. The measurement of dissolved phosphorus compounds: Evidence for hydrolysis during storage and implications
Methods for P Analysis, J.L. Kovar and G.M. Pierzynski (eds)
108
for analytical definitions in environmental analysis. International Journal of Environmental Analytical Chemistry. 69:111-123.
Edwards, A.C., and P.J.A. Withers. 1998. Soil phosphorus management and water quality: A UK perspective. Soil Use Manage. 14:124-130.
Fishman, M.J., L.J. Schroder, and M.W. Shockey. 1986. Evaluation of methods for preservation of water samples for nutrient analysis. International Journal of Environmental Studies 26:231-238.
Fitzgerald, G.P., and S.L. Faust. 1967. Effect of water sample preservation methods on the release of phosphorus from algae. Limnol.and Oceanog. 12:332-334.
Gilmartin, M. 1967. Changes in inorganic phosphate concentration occurring during seawater sample storage. Limnol. and Oceanog. 12:325-328.
Harmel, R.D., K.W. King, B.E. Haggard, D.G. Wren. and J.M. Sheridan. 2006. Practical guidance for discharge and water quality data collection on small watersheds. Transactions of the ASABE, 49 (4): 937-948.
Haygarth, P. M., and Sharpley, A. N. 2000. Terminology for phosphorus transfer. J. Environ. Qual. 29:10-15.
Haygarth, P.M., C.D. Ashby, and S.C. Jarvis. 1995. Short term changes in the molybdate reactive phosphorus of stored soil waters. J. Environ. Qual. 24:1133-1140.
Haygarth, P.M., L. Hepworth, and S.C. Jarvis. 1998. Forms of phosphorus transfer in hydrological pathways from soil under grazed grassland. European J. Soil Science 49:65-72.
Haygarth, P. M., M.S. Warwick, and W.A. House. 1997. Size distribution of colloidal molybdate reactive phosphorus in river waters and soil solution. Water Res. 31:439-442.
Henriksen, A. 1969. Preservation of water samples for phosphorus and nitrogen determination. Vatten 25:247-254.
Heron, J. 1962. Determination of phosphate in water after storage in polyethylene. Limnol. and Oceanog. 7:316-321.
Jarvie, H.P., P.J.A. Withers, and C. Neal, 2002. Review of robust measurement of phosphorus in river water: sampling, storage, fractionation and sensitivity. Hydrol. and Earth Syst. Sci., 6 (1): 113-131.
Johnson, A.H., D.R. Bouldin, and G.W. Hergert. 1975. Some observations concerning preparation and storage of stream samples for dissolved inorganic phosphate analysis. Water Resourc. Res. 11:559-562.
Krawczyk, D.F. 1975. Preservation of wastewater effluent samples for forms of nitrogen and phosphorus. Philadelphia, 152-163. In ‘Water Quality Parameters,’ pp. 152-163. American Society for Testing and Materials.
Latterell, J.J., D.R. Timmons, R.F. Holt, and E.M. Sherstad. 1974. Sorption of orthophosphate on the surface of water sample containers. Water Resourc. Res. 10:865-889.
Lennox, S.D., R.H. Foy, R.V. Smith, and C. Jordan. 1997. Estimating the contribution from agriculture to the phosphorus load in surface water. In ‘Phosphorus Loss from Soil to Water’ (H. Tunney, O.T. Carton, P.C. Brookes and A.E. Johnston, eds.). CAB International, Oxford.
Mackereth, F.J.H., J. Heron, and J.F. Talling. 1989. ‘Water Analysis,’ Titus Wilson and Sons Ltd., Kendal.
Murphy, J., and J.P. Riley. 1959. The storage of sea-water samples for the determination of dissolved inorganic phosphate. Anal. Chim. Acta 14:318-319.
Murphy, J., and J.P. Riley. 1962. A modified single solution method for the determination of phosphate in natural waters. Anal. Chim. Acta 27:31-36.
Methods for P Analysis, J.L. Kovar and G.M. Pierzynski (eds)
109
Nelson, D.W., and M.J.M. Romkens. 1972. Suitability of freezing as a method of preserving runoff samples for analysis of soluble phosphate. J. Environ. Qual. 1:323-324.
Ron Vaz, M.D., A.C. Edwards, C.A. Shand, and M.S. Cresser. 1993. Phosphorus fractions in soil solution: Influence of soil acidity and fertilizer additions. Plant Soil 148:179-183.
Rowland, A.P., and P.M. Haygarth. 1997. Determination of total dissolved phosphorus in soil solutions. J. Environ. Qual. 26: 410-415.
Tarapchak, S.J. 1993. Soluble reactive phosphorus in lake water: Evidence for molybdate enhanced hydrolysis. J. Environ. Qual. 12:105-108.
Turner, B.L., S. Newman, and K.R. Reddy, 2006. Overestimation of organic phosphorus in wetland soils by alkaline extraction and molybdate colorimetry. Environ. Science & Technol., 40 (10): 3349-3354.
Worsfold, P.J., L.J. Gimbert, U. Mankasingh, O.N. Omaka, G. Hanrahan, P.C.F.C. Gardolinski, P.M. Haygarth, B.L. Turner, M.J. Keith-Roach, and I.D. McKelvie, 2005. Sampling, sample treatment and quality assurance issues for the determination of phosphorus species in natural waters and soils. Talanta, 66 (2): 273-293.
Methods for P Analysis, J.L. Kovar and G.M. Pierzynski (eds)
110
Dissolved Phosphorus in Water Samples D.H. Pote, USDA-ARS, Booneville, AR T.C. Daniel, University of Arkansas
Introduction: Dissolved P (DP) in water samples refers to the P fraction that passes through a 0.45-µm-
pore-diameter membrane filter. Although the filtration process may not completely separate dissolved and suspended forms of P, this method can be easily replicated. Therefore, it provides a convenient technique for clearly defining the analytical separation of the dissolved and suspended P fractions.
Filtered water samples have usually been analyzed for DP by the Murphy-Riley colorimetric procedure (Murphy and Riley, 1962) to obtain the fraction known as dissolved reactive P (DRP), as discussed in the following paragraphs. However, some laboratories now find it more convenient to analyze filtered water samples by inductively-coupled plasma (ICP) spectrometry to determine the DP concentration. A discussion of this fraction (ICP-DP) and its comparison to DRP is provided in Chapter 1 of this publication.
DRP Analysis: Dissolved reactive P, sometimes called soluble reactive P, refers to the P fraction that
passes through a 0.45-µm-pore-diameter membrane filter and responds to the molybdate colorimetric test without preliminary hydrolysis or oxidative digestion of the water sample. It is largely a measure of dissolved orthophosphate, the form of P most readily available to aquatic plants, and thus is often considered the most critical P fraction contributing to accelerated eutrophication of surface waters.
Development of the molybdate colorimetric test for ortho-P in water samples was based on the observation that ammonium molybdate and potassium antimony tartrate react with dilute ortho-P solutions in an acid medium to form an antimony-phospho-molybdate complex. Reduction of this complex by ascorbic acid gives it an intense blue color that is proportional to the ortho-P concentration. Early prototypes of this colorimetric technique were being used more than 70 years ago to determine P concentrations. Ammon and Hinsberg (1936) reported using ascorbic acid to reduce phosphomolybdic acid to molybdenum blue as a method of analyzing for P and As. Greenfield and Kalber (1954) suggested using the technique for analysis of sea water. Murphy and Riley (1958) recommended altering the method to provide a single reagent for phosphate determination in sea water, but their initial modified technique required 24 h at room temperature or 30 min at 60oC for full color development. The higher temperature or long time period required for color development raised concerns because either condition may allow hydrolysis of some organic P compounds to orthophosphate. Therefore, Murphy and Riley (1962) revised the method again when they found that adding antimony (as potassium antimonyl tartrate) to the reagent caused full color development in 10 min at room temperature. The basic procedure has changed little since 1962, but it has been modified for use on autoanalyzers.
For the procedure as described below, the minimum detectable P concentration is approximately 10 µg L-1.
Equipment: 1. Filtration apparatus (0.45-µm pore diameter)
Methods for P Analysis, J.L. Kovar and G.M. Pierzynski (eds)
111
2. Photometer - Spectrophotometer with infrared phototube for use at 880 nm and providing a light path of at least 2.5 cm or a filter photometer with a red color filter and a light path of at least 0.5 cm. For light path lengths of 0.5, 1.0, and 5.0 cm, the P ranges are 0.3-2.0, 0.15-1.30, and 0.01-0.25 mg L-1, respectively.
3. Acid-washed glassware and plastic bottles: graduated cylinders (5 mL to 100 mL measurements), volumetric flasks (100 mL, 500 mL, and 1000 mL), storage bottles (including dark glass-stoppered, and opaque plastic), pipettes, eye droppers, and test tubes or flasks for reading sample absorbance.
Reagents: 1. 2.5 M H2SO4. Slowly add 70 mL of concentrated H2SO4 to approximately 400 mL of
distilled water in a 500 mL volumetric flask. After the solution has cooled, dilute to 500 mL with distilled water, mix, and transfer to a plastic bottle for storage.
2. Ammonium molybdate solution. Dissolve 20 g of (NH4)6Mo7O24·4H2O in 500 mL of distilled water. Store in a plastic bottle at 4°C.
3. Ascorbic acid, 0.1 M. Dissolve 1.76 g of ascorbic acid in 100 mL of distilled water. The solution is stable for about a week if stored in an opaque plastic bottle at 4°C.
4. Potassium antimonyl tartrate solution. Using a 500 mL volumetric flask, dissolve 1.3715 g of K(SbO)C4H4O6·1/2 H2O in approximately 400 mL of distilled water, and dilute to volume. Store in a dark, glass-stoppered bottle.
5. Combined reagent. When making the combined reagent, all reagents must be allowed to reach room temperature before they are mixed, and they must be mixed in the following order. To make 100 mL of the combined reagent:
• Transfer 50 mL of 2.5 M H2SO4 to a plastic bottle. • Add 15 mL of ammonium molybdate solution to the bottle and mix. • Add 30 mL of ascorbic acid solution to the bottle and mix. • Add 5 mL of potassium antimonyl tartrate solution to the bottle and mix. If
turbidity has formed in the combined reagent, shake and let stand for a few min until turbidity disappears before proceeding. Store in an opaque plastic bottle. The combined reagent is stable for less than 8 h, so it must be freshly prepared for each run.
6. Stock phosphate solution. Using a 1000 mL volumetric flask, dissolve 219.5 mg anhydrous KH2PO4 in distilled water and dilute to 1000 mL volume; 1 mL contains 50 µg of P.
7. Standard P solutions. Prepare a series of at least six standard P solutions within the desired P range by diluting stock phosphate solution with distilled water.
8. Phenolphthalein indicator solution.
Procedure: 1. Filter sample through a membrane filter (0.45-µm pore diameter). Hard-to-filter samples
can be prefiltered through a glass fiber filter to prepare them for membrane filtration. 2. Pipet 50.0 mL of sample into a clean, dry test tube or flask. Add 1 drop (0.05 mL) of
phenolphthalein indicator and mix. If a red color develops, add just enough drops of 2.5 M H2SO4 to remove the color. Add 8.0 mL of combined reagent and mix thoroughly. Wait at least 10 min (but no more than 30 min) before measuring the absorbance of each sample at 880 nm, using reagent blank as the reference solution.
Methods for P Analysis, J.L. Kovar and G.M. Pierzynski (eds)
112
3. Natural color of water should not interfere at the high wavelength used in this procedure. However, if the water samples are turbid or strongly colored, prepare a blank by adding all reagents except potassium antimonyl tartrate and ascorbic acid to a water sample. To obtain the actual absorbance of each sample, subtract absorbance of the blank from the sample's measured absorbance.
4. Prepare a calibration curve from the series of at least six standard P solutions within the desired P range. Use a distilled water blank with the combined reagent when making the photometric readings for a calibration curve, and plot absorbance vs. P concentration to obtain a straight line passing through the origin. Each set of samples should include at least one P standard to assure accuracy of the results.
Comments: Arsenate concentrations as low as 0.1 mg L-1 can interfere with the P determination by
reacting with the molybdate reagent to produce a blue color. Hexavalent chromium and NO2- at 1
mg L-1 can interfere to give results about 3% low, and at 10 mg L-1 give results 10-15% low. If an autoanalyzer is being used for this procedure, the following adjustment in reagent preparation is recommended: When making potassium antimonyl tartrate solution, 1.5 g of K(SbO)C4H4O6
.1/2H2O should be dissolved in distilled water to make 500 mL of solution.
References: Ammon, R., and K. Hinsberg. 1936. Colorimetric determination of phosphorus and arsenic with
ascorbic acid. Hoppe-Seyl. Z. 239: 207. Edwards, G.P., A.H. Molof, and R.W. Schneeman. 1965. Determination of orthophosphate in
fresh and saline waters. J. Amer. Water Works Assoc. 57: 917-925. Greenfield, L.J., and F.A. Kalber. 1954. Inorganic phosphate measurement in sea water. Bul.
Marine Sci. Gulf Caribbean 4: 323-335. Methods for chemical analysis of water and wastes. 1979. EPA-600/4-79-020. Methods 365.1
and 365.2. U.S. Environmental Protection Agency, Environmental Monitoring and Support Laboratory, Office of Research and Development, Cincinnati, Ohio
Murphy, J., and J.P. Riley. 1958. A single-solution method for the determination of soluble phosphate in natural waters. J. Marine Biol. Assoc. UK 37: 9
Murphy, J., and J.P. Riley. 1962. A modified single solution method for the determination of phosphate in natural waters. Anal. Chim. Acta. 27: 31-36.
Peters, R.H. 1981. Phosphorus availability in Lake Memphremagog and its tributaries. Limnol. Oceanogr. 26: 1150-1161.
Reddy, G.Y., E.O. McLean, G.D. Hoyt, and T.J. Logan. 1978. Effects of soil, cover crop, and nutrient source on amounts and forms of phosphorus movement under simulated rainfall conditions. J. Environ. Qual. 7: 50-54.
Sharpley, A.N., and R.G. Menzel. 1987. The impact of soil and fertilizer phosphorus on the environment. Adv. Agron. 41: 297-324.
Standard methods for the examination of water and wastewater (18th edition). 1992. APHA, AWWA, and WPCF, American Public Health Association, Washington, DC.
Walton, C.P., and G.F. Lee. 1972. A biological evaluation of the molybdenum blue method for orthophosphate analysis. Verh. Int. Verein. Limnol. 18: 676-684.
Methods for P Analysis, J.L. Kovar and G.M. Pierzynski (eds)
113
Total Phosphorus and Total Dissolved Phosphorus in Water Samples D.H. Pote, USDA-ARS, Booneville, AR T.C. Daniel and P.B. DeLaune, University of Arkansas
Introduction: Dissolved orthophosphate is the form of P most readily available to aquatic plants, but
numerous studies have shown that other forms of P can be hydrolyzed to the orthophosphate form in wastewater-treatment facilities and in natural waters. Therefore, when assessing the long-term potential for accelerated eutrophication of surface water due to P loading, many researchers and watershed managers want to know the total P concentration (regardless of P form) in water samples.
Polyphosphates and phosphates bound to organic substances do not react with the molybdate reagent used for colorimetric P analysis, and particulate P can not be directly measured by colorimetric analysis or by inductively-coupled plasma (ICP) spectrometry. Therefore, analysis for total P content of water samples requires that all condensed and organic P compounds, including particulate P, first be converted (hydrolyzed) to orthophosphate so they can be determined colorimetrically or by ICP spectrometry. This is accomplished by digesting the sample in strong acid at high temperature to oxidize the organic matter and release P as orthophosphate. Published methods for the digestion process have been available for many decades. Improved methods have been developed, but all of them use heat and/or various strong acids, sometimes in combination with strong oxidizing reagents. For example, the wet ashing digestion method (using concentrated HNO3 and H2SO4) described by Peters and Van Slyke (1932) was considered reliable, but was very time-consuming, so other researchers developed faster digestion procedures. Perchloric acid digestion, described by Robinson (1941), is still considered a standard method for total P analysis, but it is time-consuming and dangerous because heated mixtures of HClO4 and organic matter may explode violently. Therefore, other digestion methods (listed below) are usually preferred.
To determine the total dissolved P fraction, the particulate P is separated by filtering the water sample through a 0.45 µm pore diameter membrane filter before beginning the digestion procedure. To determine total P (dissolved + particulate), an unfiltered sample is shaken (to suspend the particulate matter) just before measuring the subsample for digestion. Sulfuric Acid - Nitric Acid Digestion Method:
Equipment 1. Digestion rack. Digestion racks designed for micro-Kjeldahl digestions can be used, but
need to include a provision for withdrawal of fumes. A digestion rack heated by either gas or electricity is suitable.
2. Micro-Kjeldahl flasks. 3. Acid-washed graduated cylinders, pipettes, eye droppers, 100 mL volumetric flasks, and
glass boiling beads. 4. Any additional equipment required for colorimetric determination of P in the digested
sample solution (described in previous chapter on Dissolved P) or for analysis by ICP spectrometry.
Methods for P Analysis, J.L. Kovar and G.M. Pierzynski (eds)
114
Reagents 1. Concentrated H2SO4 2. Concentrated HNO3 3. Phenolphthalein indicator aqueous solution 4. 1 M NaOH 5. Any additional reagents required for colorimetric determination of P in the digested
sample solution (described in previous chapter on Dissolved P) or for analysis by ICP spectrometry.
Procedure 1. Transfer a measured volume of sample into a micro-Kjeldahl flask. We recommend a
volume of at least 25 mL if adequate sample is available. Larger volumes can be used, but they require a longer digestion time.
2. Add 1 mL of concentrated H2SO4 3. Add 5 mL of concentrated HNO3 4. Add a few glass boiling beads. Start the digestion at 100°C, and gradually ramp the
solution temperature up to approximately 200°C. 5. Digest to a volume of 1 mL and then continue digesting until the solution becomes
colorless (to remove the HNO3). Note: Some dirty water samples may not become clear enough for good spectrophotometer readings. These dirty samples can be clarified by gradually adding drops of 30% sodium peroxide during the digestion process (when the sample volume has been reduced to about 5 mL).
6. Cool the flask and add approximately 20 mL of distilled water. 7. Add 1 drop (0.05 mL) of phenolphthalein indicator and mix. 8. Add drops of 1 M NaOH until the sample solution acquires a faint pink tinge. 9. Transfer the neutralized solution (if necessary, filtering to remove turbidity or particles)
into a 100-mL volumetric flask. If a filter is used, be sure to add distilled-water filter washings to the flask.
10. Adjust sample volume to 100 mL with distilled water. 11. Use the molybdate colorimetric test (described in previous chapter on Dissolved P) or
ICP spectrometry to determine the P content of the digested solution. 12. To prepare the calibration curve, carry a series of standards through the digestion process.
Do not use standards that have not been digested.
Persulfate Digestion Method A (traditional):
Equipment 1. Hot plate with adequate heating surface. An autoclave or pressure cooker capable of
developing 98 - 137 kPa may be used instead of a hot plate. 2. Acid-washed graduated cylinders, pipettes, eye droppers, and volumetric flasks (100 mL
and 1000 mL). 3. Any additional equipment required for colorimetric determination of P in the digested
sample solution (described in previous chapter on Dissolved P) or for analysis by ICP spectrometry.
Methods for P Analysis, J.L. Kovar and G.M. Pierzynski (eds)
115
Reagents 1. Phenolphthalein indicator solution 2. Sulfuric acid solution. Transfer approximately 600 mL of distilled water to a 1000 mL
volumetric flask. Slowly (and carefully) add 300 mL of concentrated H2SO4. After the solution has cooled, dilute to 1000 mL with distilled water and mix.
3. Ammonium persulfate, (NH4)2S2O8 solid or potassium persulfate, K2S2O8 solid. 4. 1M NaOH 5. Any additional reagents required for colorimetric determination of P in the digested
sample solution (described in previous chapter on Dissolved P) or for analysis by ICP spectrometry.
Procedure 1. Thoroughly mix the sample, and measure a suitable portion (50 mL is recommended) into
a flask. 2. Add 1 drop (0.05 mL) of phenolphthalein indicator and mix. If a red color develops, add
just enough drops of H2SO4 to remove the color. 3. Add 1 mL of H2SO4 solution. 4. Add either 0.4 g of solid (NH4)2S2O8 or 0.5 g of solid K2S2O8 and mix. 5. Boil the sample solution gently on the preheated hot plate for at least 30-40 min or until
the volume is reduced to 10 mL. Some organophosphorus compounds may require 2 h for complete digestion.
6. Cool the solution, and dilute to approximately 30 mL with distilled water. 7. Add 1 drop (0.05 mL) of phenolphthalein indicator. 8. Add drops of 1M NaOH until the sample solution is neutralized (acquires a faint pink
tinge). 9. Dilute to 100 mL volume with distilled water. If a precipitate forms, do not filter, but
shake well for any subdividing of the sample. The precipitate redissolves during the colorimetric test due to increased acidity.
10. Use the molybdate colorimetric test (described in previous chapter on Dissolved P) or ICP spectrometry to determine the P content of the digested solution.
11. To prepare the calibration curve, carry a series of standards through the digestion process. Do not use standards that have not been digested.
Persulfate Digestion Method B (alternative): This alternative persulfate digestion method was developed recently for determining total
P in relatively clean water samples. It has gained popularity because it is easier to use and produces less toxic residues than other procedures, and does not require a vent hood apparatus. Because this method works well for clear water samples, it is often preferred for measuring total dissolved P (TDP). However, this alternative persulfate method is not recommended for water samples that contain visible quantities of sediment or suspended solids, so it is not always appropriate for determining TP.
Equipment 1. Autoclave (120°C).
Methods for P Analysis, J.L. Kovar and G.M. Pierzynski (eds)
116
2. Acid-washed graduated cylinders, pipettes, eye droppers, and volumetric flasks (100 mL to 1000 mL).
3. Aluminum foil. 4. Any additional equipment required for colorimetric determination of P in the digested
sample solution (described in previous chapter on Dissolved P) or for analysis by ICP spectrometry.
Reagents 1. Phenolphthalein indicator aqueous solution (1.2 g / 250 mL). 2. Sulfuric acid solution (2 M). Transfer approximately 600 mL of distilled water to a 1000
mL volumetric flask. Slowly (and carefully) add 112 mL of concentrated H2SO4. Let the solution cool, dilute to 1000 mL with distilled water, and mix.
3. Sodium hydroxide solution (3 M). Transfer approximately 600 mL of distilled water to a 1000 mL volumetric flask. Add 120 g of NaOH, dilute to 1000 mL with distilled water, and mix.
4. Potassium persulfate (K2S2O8) oxidizing solution. Using a 1000-mL volumetric flask, dissolve 64 g of K2S2O8 solid in approximately 500 mL of distilled water (warm to dissolve), add 80 mL of 3 M NaOH, and dilute to 1000 mL.
5. Any additional reagents required for colorimetric determination of P in the digested sample solution (described in previous chapter on Dissolved P) or for analysis by ICP spectrometry.
Procedure 1. Thoroughly mix the sample, and measure 50 mL into a flask. 2. Add 5 mL of potassium persulfate oxidizing solution. 3. Autoclave for 55 minutes at 120 degrees C. Cap the flask with aluminum foil, but do not
seal. 4. Allow to cool, then add 0.1 mL (2 drops) of phenolphthalein indicator. Neutralize the
sample to a faint pink color by gradually adding 3 M NaOH. If too much NaOH is added and the solution turns basic, add drops of the 2 M H2SO4 solution to reach neutrality.
5. Dilute to 100 mL volume with distilled water. If a precipitate forms, do not filter, but shake well for any subdividing of the sample. The precipitate redissolves during the colorimetric test due to increased acidity.
6. Use the molybdate colorimetric test (described in previous chapter on Dissolved P) or ICP spectrometry to determine the P content of the digested solution.
7. To prepare the calibration curve, carry a series of standards through the digestion process. Do not use standards that have not been digested.
Kjeldahl Digestion Method: The Kjeldahl digestion procedure also converts condensed and organic P compounds,
including particulate P, to orthophosphate. Therefore, if the water samples are being digested by the Kjeldahl method to determine their total Kjeldahl nitrogen content, then total P can also be measured (without further digestion) by simply using the molybdate colorimetric test (described in the previous chapter on Dissolved P) or ICP spectrometry to determine the P content of the
Methods for P Analysis, J.L. Kovar and G.M. Pierzynski (eds)
117
digested solution. To prepare the calibration curve, carry a series of standards through the Kjeldahl digestion process.
Calculations: For any of the digestion methods listed above, always use the correct dilution ratio when calculating the total P concentration in the original sample. For example, if a 50-mL sample is used, and the sample is diluted to a final volume of 100 mL following the digestion procedure, then the measured concentration should be multiplied by 2 to obtain the concentration in the original water sample.
Total P (mg / L) = P concentration in analyzed solution (mg / L) x TotalDilutedVolume(mL)
OriginalSampleVolume(mL)
Comments: The sulfuric acid - nitric acid digestion method is recommended for most samples. The
persulfate digestion method is much simpler to use and usually gives excellent recovery rates, but when digesting potentially difficult samples, it should probably be checked against the sulfuric acid - nitric acid digestion and adopted if nearly-identical recoveries are obtained. As noted above, the alternative persulfate digestion method is not recommended for water samples that contain visible quantities of sediment.
Bibliography: Clesceri, N.L., and G.F. Lee. 1965a. Hydrolysis of condensed phosphates - 1. Nonsterile
environment. Int. J. Air Water Pollut. 9: 723-742. Clesceri, N.L., and G.F. Lee. 1965b. Hydrolysis of condensed phosphates - 1. Sterile
environment. Int. J. Air Water Pollut. 9: 743-751. Gales, M.E., Jr., E.C. Julian, and R.C. Kroner. 1966. Method for quantitative determination of
total phosphorus in water. J. Amer. Water Works Assoc. 58: 1363-1368. Lee, G.F., N.L. Clesceri, and G.P. Fitzgerald. 1965. Studies on the analysis of phosphates in
algal cultures. Int. J. Air Water Pollut. 9: 715-722. Methods for chemical analysis of water and wastes. 1979. EPA-600/4-79-020. Methods 365.1
and 365.2. U.S. Environmental Protection Agency, Environmental Monitoring and Support Laboratory, Office of Research and Development, Cincinnati, Ohio
Methods for chemical analysis of fresh waters. 1970. H.L. Golterman and R.S. Clymo (ed.). International Biological Programme Handbook No. 8., Blackwell Scientific Publications, Oxford and Edinburgh, UK.
Peters, J.P., and D.D. Van Slyke. 1932. Quantitative Clinical Chemistry, Vol II Methods. The Williams and Wilkins Co., Baltimore, MD.
Robinson, R.J. 1941. Perchloric acid oxidation of organic phosphorus in lake waters. Industr. Engng. Chem. (Anal.) 13: 465-466.
Shannon, J.E., and G.F. Lee. 1966. Hydrolysis of condensed phosphates in natural waters. Air & Water Pollut. Int. J. 10: 735-756.
Sharpley, A.N., and R.G. Menzel. 1987. The impact of soil and fertilizer phosphorus on the environment. Adv. Agron. 41: 297-324.
Standard methods for the examination of water and wastewater (20th edition). 1998. APHA, AWWA, and WPCF, American Public Health Assoc., Washington, DC.
Methods for P Analysis, J.L. Kovar and G.M. Pierzynski (eds)
118
Using the Iron Oxide Method to Estimate Bioavailable Phosphorus in Runoff R.G. Myers*, Kansas State University G.M. Pierzynski, Kansas State University
Introduction: The use of iron-oxide (FeO) coated paper to test soil was first reported by Sissingh
(1983), who wanted to develop a soil phosphorus (P) test that would estimate plant-available P in tropical soils without mobilizing other forms of phosphates. A strip of filter paper impregnated with iron hydroxide functioned as a P sink and adsorbed mobile P from solution, so Sissingh (1983) called the analyzed P, the Pi value (i referring to iron hydroxide). Interest in the method was soon extended to a wider range of soils (Menon et al., 1989). The test has an advantage over standard soil P tests because the FeO paper functions as an ion sink and doesn't react with soil as do chemical extractants. A unique feature of the FeO method rests in its inherent preferential selectivity of FeO for P ions over all other anions found in soil, except OH (Menon, 1993; van der Zee et al., 1987).
The FeO test has been identified by quite a number of different terms in various papers and publications, e.g., Pi test, Fe-oxide strip method, and Pi test (Chardon et al., 1997; Perrot and Wise, 1993; Sharpley, 1993a). To avoid confusion, P extraction by FeO-coated paper will be called the FeO method, and the P extracted will be called FeO-P.
Interest in applying the FeO method to agricultural runoff has been developing recently in an effort to assess the potential of P in runoff to stimulate freshwater eutrophication. The bioavailable P content (BAP) of dilute runoff sediment assessed by the FeO method was related (r2 = 0.63-0.96) to the growth of P-starved algae (Selanastrum capricornutum) (Sharpley, 1993a). Additional work showed that FeO-P from runoff sediment was related (P > 0.001) to algal growth in Anabaena, Ankistrodesmus, and Euglena (Sharpley, 1993b). The FeO method has the unique capability of differentiating soluble inorganic P from FeO-P in sediment of runoff. The sediment FeO-P is called bioavailable particulate P (BPP) and is calculated according to
BPP = total BAP - SP [1] where total BAP is total FeO-P from unfiltered runoff, and SP is soluble inorganic P in filtered runoff (0.45-µm filter).
The FeO method has a stronger theoretical justification for estimating P availability of soil and runoff for plants and algae than do chemical methods (Sharpley, 1993a). The rationale for this theoretical justification lies in the mechanism of P adsorption onto the FeO-coated paper. Such adsorption closely simulates that of plants and algae and thereby gives an estimation of BAP, whereas chemical methods may mobilize additional forms of P which are not available to plants or algae. Therefore, the FeO method is an additional tool used to assess the potential for runoff to increase fresh-water eutrophication.
* Deceased
Methods for P Analysis, J.L. Kovar and G.M. Pierzynski (eds)
119
In the past, filter paper with large pores up to 20 to 25 µm sometimes was used to make
FeO paper, however, there is less tendency for soil particles to become lodged in papers with small pores, e.g. < 5.0 µm, so small-pore paper is now recommended (Chardon et al., 1997). Traditionally, filter paper circles with a 15-cm diameter were coated with FeO by immersing them first in a FeCl3 solution, then after drying, they were immersed in an NH4OH solution (van der Zee, et al. 1987). After drying they were cut into strips, often 2 x 10 cm--from whence came the term strip-P.
Recently, filter circles with a 5.5 cm diameter have been used to make the FeO papers instead of cutting strips from the larger circles (Myers et al., 1995, 1997). The surface area of the 5.5-cm circles exceeds that of the traditional 2 x 10-cm strips by about 20%; however, the primary reason for using circles instead of strips is to eliminate the need for cutting strips. Within a 12 h shaking time, each 5.5-cm FeO circle has adequate adsorption capacity to remove 99% of the P in a solution containing 16.1 µm P (Myers et al., 1997). van der Zee et al. (1987) reported similar results with adsorption of 18 µmol P after shaking one 2 x 10-cm strip for 20 h.
Holding the FeO paper in a fixed orientation during shaking helps to prevent soil particles from lodging in the pores of the paper and contaminating it (Myers et al., 1995; 1997). Although runoff aliquots usually contain much less than 1.0 g of sediment, the amount of soil used in soil extraction, stabilization of each FeO paper between polyethylene screens is still recommended for analysis of runoff samples, some of which can contain substantial quantities of sediment. Holding the screens in a fixed orientation during shaking also prevents the FeO papers from sticking to the walls of the shaking vessel, as often occurs when the papers are allowed to shake freely in solution. Such sticking could reduce adsorption effectiveness of the FeO paper.
A solution of 0.01 M CaCl2 is used as the shaking matrix for the FeO paper and soil because deionized water has the tendency to disperse soil, which may then lodge in the pores of the filter paper (Sissingh, 1983). This may lead to errors in P analysis (Myers et al., 1995); however, runoff has been extracted by the FeO method without addition of any CaCl2 (Sharpley, 1993a). We have found that FeO-P from runoff made with 0.01 M CaCl2 was the same as that from duplicate runoff samples shaken without CaCl2 (data unpublished), but similar results may not always hold true for every type of runoff in every location. The potential for significant contamination of FeO papers by not amending the runoff with CaCl2 during shaking may depend upon the clay content of the sediment and the P content of the clay as well as the amount of sediment in the runoff.
Equipment: 1. End-over-end shakers have been used for the FeO method (Sissingh, 1983; Sharpley,
1993). Reciprocating shakers have also been used (Menon et al., 1989; Myers et al., 1997).
2. 2 L beaker 3. 118-mL wide-mouthed glass bottles 4. 125-mL Erlenmeyer flasks 5. 50-mL Erlenmeyer flasks 6. Spectra/Mesh polyethylene screens (925 µm, Spectra/Mesh filters, Fisher Co., St. Louis;
Fisher cat. no. 08-670-175) 7. Parafilm
Methods for P Analysis, J.L. Kovar and G.M. Pierzynski (eds)
120
Reagents: 1. 0.65 M FeCl3·6H2O + 0.6 M HCl 2. 2.7 M NH4OH 3. 0.2 M H2SO4 4. Reagents used for the Murphy and Riley (1962) colorimetric procedure
Procedure: We use hardened 5.5 cm circles of Whatman no. 50 filter paper for making the FeO paper
(Myers et al., 1997). Briefly, we immerse the papers, one by one, in 0.65 M FeCl3 ·6H2O containing 50 mL of concentrated HCl per liter of solution, and leave them in the container overnight. Chardon et al. (1997) recommend acidification of the FeCl3 solution if the papers are to be stored, thus we acidify with HCl. After air-drying the papers on a rack, they are immersed in 2.7 M NH4OH for 30 s and then allowed to drain for 15 s before thoroughly rinsing in two containers of clean distilled water. They are placed in a bucket of clean water for 1 h to permit dissipation of any residual ammonia. The papers are then ready to use immediately or they can be dried for later use. For further details on paper preparation, see Myers et al. (1997).
Polyethylene screens are cut approximately 9 cm in diameter from Spectra/Mesh filters. These screens are used to enclose each FeO paper during shaking (Myers et al., 1997). One FeO paper is placed between two of these screens held together by a plastic clamp, making a paper-screen assembly to insert into the shaking bottle.
We have followed the traditional FeO method for determining BAP in runoff (Sharpley, 1993a), except that we use a total shaking volume of 80 mL. We add 50 mL of runoff plus 30 mL of deionized water. When 80 mL of solution is shaken in 118-mL bottles orientated horizontally and end-to-end, the shaking action completely rinses the sides and top of the bottles with each excursion of the reciprocating shaker. If shaking action is adequate in some other type of shaking vessel, the total volume of solution is optional and discretionary. Also, for runoff with low levels of FeO-P, 80 mL of runoff may be used without adding any water.
The FeO paper-screen assembly is inserted, clamp end first, into the bottle containing runoff. Cover the bottles tightly with a layer of Parafilm, and then screw the closures on tightly to seal. The bottles are shaken on a reciprocating shaker for 16 h at a speed of 125 to 135 excursions/min. Shaking speed can be increased, if needed, to increase mixing.
After a 16 h shaking period, we remove the papers from the screens and rinse each paper under a stream of deionized water for a few seconds. The papers are coiled and placed in the neck of a 125-mL Erlenmeyer flask where they may either be left to dry or pushed to the bottom and extracted immediately. Extract the P from the papers by adding 50 mL of 0.2 MH2SO4 to flasks and shaking them 1 h at 100 to 125 excursion/min. An aliquot of the H2SO4 solution is analyzed for P using the Murphy and Riley (1962) after neutralization of acidity. For neutralization, phenolphthalein color indicator gives a clear end point in the FeO solution. Duplicate, or triplicate, control FeO papers, without any soil or runoff, are also shaken and extracted to correct for any P contained in reagents and water. For further details on the FeO procedure described above, see Myers et al. (1995, 1997).
Calculations: The Murphy and Riley (1962) method of P analysis gives FeO-P in µg P/mL. If data for FeO-P are presented in units of µg L-1 then the appropriate calculations for BAP are:

Methods for P Analysis, J.L. Kovar and G.M. Pierzynski (eds)
121
Total BAP (µg L-1) = [volume of H2SO4 (L) x P in H2SO4 (µg L-1 )] ÷ [volume of runoff sample extracted with FeO (L)]
where total BAP is the total bioavailable P in the runoff, and H2SO4 is 50 mL of 0.2 MH2SO4 used to extract P from each FeO paper. Calculations for bioavailable particulate P (BPP), the FeO-P associated with the sediment, are given in Eq. 1 above.
Comments: Algae use only the orthophosphate form of P; however, organic forms of P can undergo
mineralization and also become available (Correll, 1998). Thus, organic P can be considered a latent source of BAP. Some discussion has been focused on methods to limit hydrolysis of organic P adsorbed onto FeO paper (Robinson and Sharpley, 1994); however, it appears that such adsorption and hydrolysis of organic P is not a problem in using the FeO method to estimate BAP because organic P may be justifiably classified as latent BAP which may be mineralized at any time and thereby become immediately available for algal uptake.
References: Chardon, W.J., R.G. Menon, and S.H. Chien. 1997. Iron oxide impregnated filter paper (Pi test):
A review of its development and methodological research. Nutr. Cycl. Agroecosyst. 46:41-51.
Correll, D.L. 1998. The role of phosphorus in the eutrophication of receiving waters: A review. J. Environ. Qual. 27:261-266.
Menon, R.G. 1993. The Pi test for evaluating bioavailability of phosphorus. p. 58-67. In K.B. Hoddinott and T.A. O’Shay (ed.) Application of agricultural analysis in environmental studies. ASTM STP 1162, Philadelphia, PA.
Menon, R.G., L.L. Hammond, and H.A. Sissingh. 1989. Determination of plant-available phosphorus by the iron hydroxide-impregnated filter paper (Pi ) soil test. Soil Sci. Soc. Am. J. 53:110-115.
Murphy, J., and J.P. Riley. 1962. A modified single solution method for the determination of phosphate in natural waters. Anal. Chim. Acta 27:31-36.
Myers, R.G., G.M. Pierzynski, and S.J. Thien. 1995. Improving the iron oxide sink method for extracting soil phosphorus. Soil Sci. Soc. Am. J. 59:853-857.
Myers, R.G., G.M. Pierzynski, and S.J. Thien. 1997. Iron oxide sink method for extracting soil phosphorus: Paper preparation and use. Soil Sci. Soc. Am. J. 61:1400-1407.
Perrott, K.W., and R.G. Wise. 1993. An evaluation of some aspects of the iron oxide-impregnated filter paper (Pi) test for available soil phosphorus with New Zealand soils. N. Z. J. Agric. Res. 36:157-162.
Robinson, J.S., and A.N. Sharpley. 1994. Organic phosphorus effects on sink characteristics of iron-oxide-impregnated filter paper. Soil Sci. Soc. Am. J. 58:758-761.
Sharpley, A.N. 1993a. An innovative approach to estimate bioavailable phosphorus in agricultural runoff using iron oxide-impregnated paper. J. Environ. Qual. 22:597-601.
Sharpley, A.N. 1993b. Estimating phosphorus in agricultural runoff available to several algae using iron-oxide paper strips. J. Environ. Qual. 22:678-680.
Sissingh, H. A. 1983. Estimation of plant-available phosphates in tropical soils. A new analytical technique. Nota 235. Inst. for Soil Fertility Res., Haren, the Netherlands.

Methods for P Analysis, J.L. Kovar and G.M. Pierzynski (eds)
122
van der Zee, S.E.A.T.M., L.G.J. Fokkink, and W.H. van Riemsdijk. 1987. A new technique for assessment of reversibly adsorbed phosphate. Soil Sci. Soc. Am. J. 51:599-604.