metrics and test procedures for data...
TRANSCRIPT
Metrics and Test Procedures for Data QualityEstimation in the Aeronautical Telemetry Channel
Item Type text; Proceedings
Authors Hill, Terry
Publisher International Foundation for Telemetering
Journal International Telemetering Conference Proceedings
Rights Copyright © held by the author; distribution rights InternationalFoundation for Telemetering
Download date 08/06/2018 20:20:37
Link to Item http://hdl.handle.net/10150/596445

METRICS AND TEST PROCEDURES FOR DATA QUALITY ESTIMATION IN THE AERONAUTICAL TELEMETRY
CHANNEL
Terry Hill Quasonix, West Chester, OH
Abstract: There is great potential in using Best Source Selectors (BSS) to improve link availability in aeronautical telemetry applications. While the general notion that diverse data sources can be used to construct a consolidated stream of "better" data is well founded, there is no standardized means of determining the quality of the data streams being merged together. Absent this uniform quality data, the BSS has no analytically sound way of knowing which streams are better, or best. This problem is further exacerbated when one imagines that multiple vendors are developing data quality estimation schemes, with no standard definition of how to measure data quality. In this paper, we present measured performance for a specific Data Quality Metric (DQM) implementation, demonstrating that the signals present in the demodulator can be used to quickly and accurately measure the data quality, and we propose test methods for calibrating DQM over a wide variety of channel impairments. We also propose an efficient means of encapsulating this DQM information with the data, to simplify processing by the BSS. This work leads toward a potential standardization that would allow data quality estimators and best source selectors from multiple vendors to interoperate. Keywords: Data Quality Metrics, Data Quality Encapsulation, Best Source Selection, Maximum Likelihood Data Combining
1 INTRODUCTION
Numerous devices in the general category of “Source Selectors” have been available in the telemetry market for over a decade. The fundamental premise of source selectors is that by using multiple receiving assets to collect the telemetry from a single test article, errors and dropouts in the recovered data can be eliminated. Source selectors typically accept anywhere from 2 to 32 input data streams, sometimes accompanied by some measure of “data quality”, and then synthesize a single data stream that is ostensibly better than the input streams (or at least the better of the two, in the two-input case). An overview of this concept is shown in Figure 1. From a system perspective this would seem to have great potential, but not all that potential has been achieved. One of the most significant limitations to source selector performance has been the lack of a consistent, uniform definition of data quality. Some products rely upon an estimate of Eb/N0 or dB above “AGC zero”, while others attempt to measure the opening in the PCM/FM
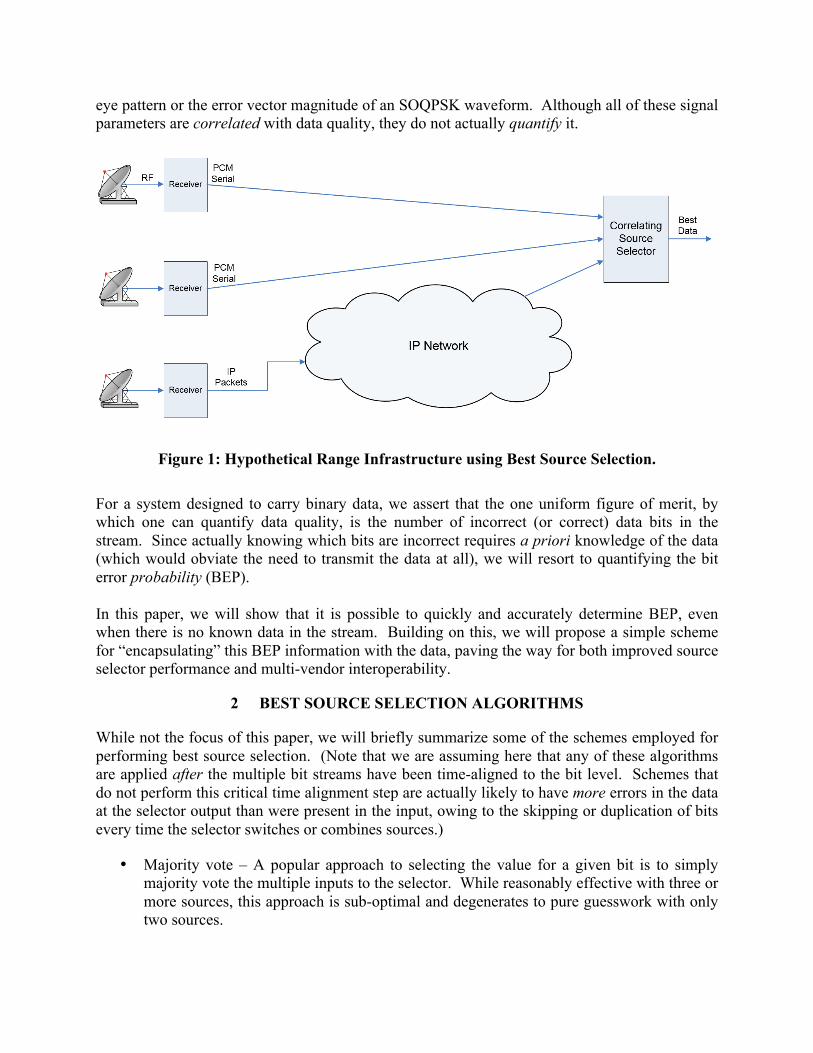
eye pattern or the error vector magnitude of an SOQPSK waveform. Although all of these signal parameters are correlated with data quality, they do not actually quantify it.
Figure 1: Hypothetical Range Infrastructure using Best Source Selection. For a system designed to carry binary data, we assert that the one uniform figure of merit, by which one can quantify data quality, is the number of incorrect (or correct) data bits in the stream. Since actually knowing which bits are incorrect requires a priori knowledge of the data (which would obviate the need to transmit the data at all), we will resort to quantifying the bit error probability (BEP). In this paper, we will show that it is possible to quickly and accurately determine BEP, even when there is no known data in the stream. Building on this, we will propose a simple scheme for “encapsulating” this BEP information with the data, paving the way for both improved source selector performance and multi-vendor interoperability.
2 BEST SOURCE SELECTION ALGORITHMS
While not the focus of this paper, we will briefly summarize some of the schemes employed for performing best source selection. (Note that we are assuming here that any of these algorithms are applied after the multiple bit streams have been time-aligned to the bit level. Schemes that do not perform this critical time alignment step are actually likely to have more errors in the data at the selector output than were present in the input, owing to the skipping or duplication of bits every time the selector switches or combines sources.)
• Majority vote – A popular approach to selecting the value for a given bit is to simply majority vote the multiple inputs to the selector. While reasonably effective with three or more sources, this approach is sub-optimal and degenerates to pure guesswork with only two sources.

• Frame sync errors – An alternative scheme is to examine the known bits in the PCM frame sync header, and use errors in this field to estimate the BEP of the whole frame. However, this approach uses only a tiny fraction of all the bits in the stream to estimate BEP, leading to very coarse and noisy estimates. Furthermore, it cannot be used at all with encrypted data, since the PCM frame headers are not visible until after decryption.
• Log-likelihood weighting – Rice and Perrins show in [1] that voting each bit with a weighting factor calculated as log {(1 - BEP) / BEP} leads to the maximum likelihood (optimal) output decision. We will assume in this paper that this scheme is employed at the best source selector.
3 DATA QUALITY METRIC (DQM)
Since [1] points us toward a maximum likelihood data combining scheme based on bit error probability, we propose to utilize BEP as the basis for our data quality encapsulation (DQE) scheme. We note here that using a measured bit error rate (BER) instead of the BEP is not practical, since it requires known data in the stream, something that is not possible with encrypted data. Bit error probability (BEP), however, does not require any known data, can be determined quickly and accurately from internal demodulator statistics, and is a true data quality metric, regardless of the channel impairment that created the likelihood of errors. When calibrated per a standardized procedure as described later in this paper, a DQM that is based on BEP allows DQE from multiple vendors to interoperate.
Because of the wide variety of demodulation algorithms employed by the various vendors, we will not attempt to define how to calculate BEP. Each vendor will likely develop their own algorithm for deriving BEP from the signals present in their demodulators.
We define DQM as calculated directly from BEP, as follows. We first compute the Likelihood Ratio (LR) in the conventional manner as
LR = (1 - BEP) / BEP.
We then define the data quality metric (expressed as a 16-bit unsigned integer) as
DQM = min (round (-log10 (LR) / 12 * (2^16)), 2^16 -1).
The use of the log function not only allows easy representation of a wide range of error rates, but it also paves the way to a direct implementation of the maximum likelihood data combining scheme defined in [1].
The conversion to a 16-bit integer allows DQM to be easily processed in common digital hardware, and the numerical scaling then represents BEP from 0.5 to 1e-12, as shown in Table 1. We note here that this representation yields a DQM of zero when the BEP is 50%, which is intuitively satisfying.
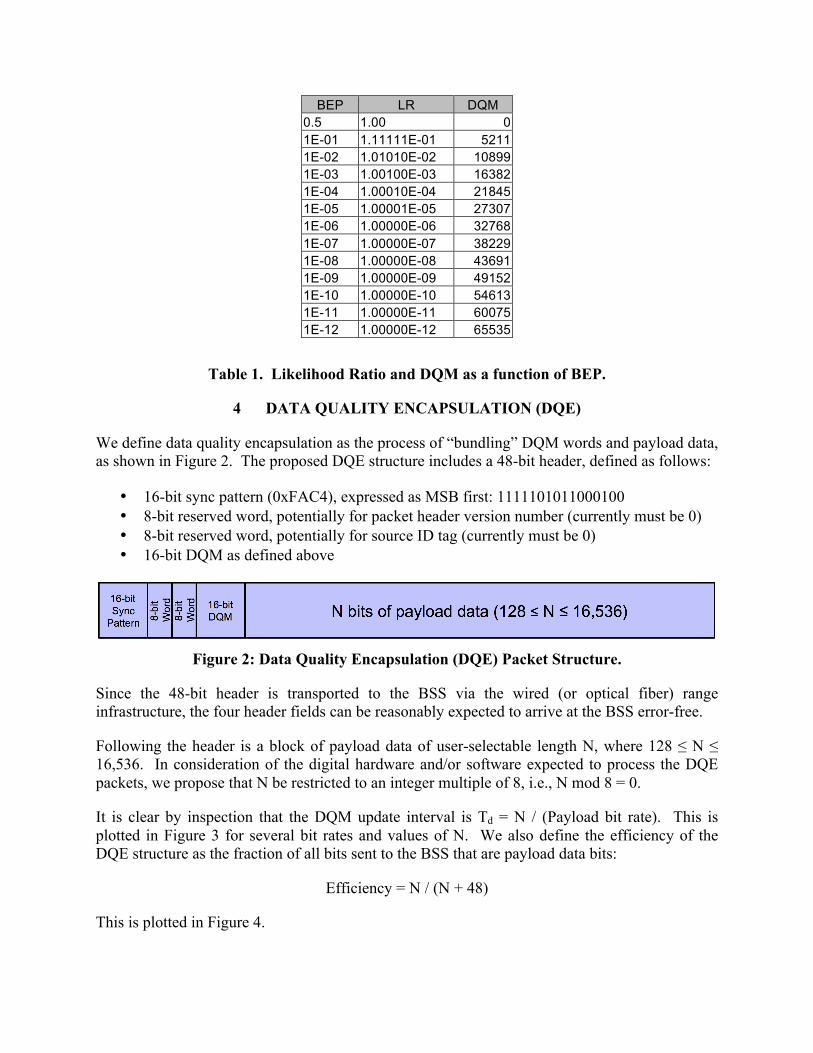
BEP LR DQM 0.5 1.00 0 1E-01 1.11111E-01 5211 1E-02 1.01010E-02 10899 1E-03 1.00100E-03 16382 1E-04 1.00010E-04 21845 1E-05 1.00001E-05 27307 1E-06 1.00000E-06 32768 1E-07 1.00000E-07 38229 1E-08 1.00000E-08 43691 1E-09 1.00000E-09 49152 1E-10 1.00000E-10 54613 1E-11 1.00000E-11 60075 1E-12 1.00000E-12 65535
Table 1. Likelihood Ratio and DQM as a function of BEP.
4 DATA QUALITY ENCAPSULATION (DQE)
We define data quality encapsulation as the process of “bundling” DQM words and payload data, as shown in Figure 2. The proposed DQE structure includes a 48-bit header, defined as follows:
• 16-bit sync pattern (0xFAC4), expressed as MSB first: 1111101011000100 • 8-bit reserved word, potentially for packet header version number (currently must be 0) • 8-bit reserved word, potentially for source ID tag (currently must be 0) • 16-bit DQM as defined above
Figure 2: Data Quality Encapsulation (DQE) Packet Structure.
Since the 48-bit header is transported to the BSS via the wired (or optical fiber) range infrastructure, the four header fields can be reasonably expected to arrive at the BSS error-free.
Following the header is a block of payload data of user-selectable length N, where 128 ≤ N ≤ 16,536. In consideration of the digital hardware and/or software expected to process the DQE packets, we propose that N be restricted to an integer multiple of 8, i.e., N mod 8 = 0.
It is clear by inspection that the DQM update interval is Td = N / (Payload bit rate). This is plotted in Figure 3 for several bit rates and values of N. We also define the efficiency of the DQE structure as the fraction of all bits sent to the BSS that are payload data bits:
Efficiency = N / (N + 48)
This is plotted in Figure 4.

The programmability of the payload data block size allows the telemetry system engineer to strike a balance between more frequent DQM updates (to allow tracking of more rapidly varying channels), or less frequent updates (making more efficient use of the range infrastructure bandwidth). Note that since DQM is inserted during demodulation, it has no effect whatsoever on the over-the-air bandwidth. Since the update rate also increases as the data rate increases, it’s quite likely that the “sweet spot” for N will depend on the data rate.
It should also be noted here that regardless of the algorithm used to calculate DQM from the demodulator’s internal statistics, the block-to-block variation of DQM will necessarily increase as the block size decreases. Consequently, the block size N should be no smaller than is required to achieve the desired update rate.
Figure 3: DQM Update Rate as a Function of Data Rate and Payload Data Block Size.
Figure 4: Network Bandwidth Efficiency as a Function of Payload Data Block Size.

5 DQM CALIBRATION TECHNIQUES
As defined above, the proposed DQM and DQE approach can provide the BSS with a mathematically sound means of combining multiple data streams to create a new stream with fewer bit errors, and it can do so with minimal utilization of network bandwidth to deliver the DQM information. While this simple packet structure can be readily implemented in any modern demodulator, this still does not ensure interoperability amongst equipments developed by different vendors. To achieve this, we need to provide a means of calibrating the DQM values against the actual BEP of the data stream.
As has been well documented over the years, the aeronautical telemetry channel is fraught with a wide variety of impairments including additive white Gaussian noise (AWGN), signal dropouts (which might be regarded as a step function in AWGN level), interfering signals (both in-band and adjacent channel), phase noise, timing jitter, and multipath (both static and dynamic).
In order for DQE / DQM to reliably steer the BSS toward the best signal or signals, the DQM values must provide a timely and (reasonably) accurate evaluation of the BEP. Toward that end, we propose a set of calibration procedures, as described below. Figure 5 shows the proposed test fixture for performing these calibrations.
Figure 5: DQM Calibration Fixture.
The data flow through the test fixture starts with any standard PN generator. To ensure good characterization of patterns with long strings of ones or zeros, such as will occur with encrypted data, we propose a maximal length PN sequence of length 223-1 or greater. Note that the computation of DQM does not in any way depend upon the data being a known sequence; this is only necessary for the calibration of the DQM.
The input data is then converted to the modulation of interest at the RF carrier frequency of interest. At a minimum, this generator should be capable of producing accurate ARTM Tier 0, Tier I, and Tier II signals, as it is quite likely that the DQM results will be different for each modulation.
Finally, and most importantly, this test setup must be capable of synthesizing the impairments previously listed. This is done using the Quasonix Receiver Analyzer, which can generate a wide range of calibrated RF impairments. While Figure 5 shows this as a post-modulation step, certain impairments (timing jitter, for example) may be better imposed at the input to the modulator.
The “corrupted” RF signal is input to the unit under test (UUT), and the UUT delivers “corrupted” data with a synchronous clock. (If the UUT does not include a bit synchronizer, then an external synchronizer is required.) The test system then extracts the frame sync word and measures the actual BER of the payload data. This is computed and stored on a packet-by-packet basis. Finally, the captured DQM is converted to BEP using
BEP = 1 / (1 + 10(-12 * DQM / 2^16))
This allows direct comparison of BEP and BER.
6 DQM CALIBRATION RESULTS
For the results presented here, the test equipment comprised a Quasonix 3rd Generation RDMS™ telemetry receiver (model QSX-RDMS-3R1D-A1-1111-00-EQ-14), and a Quasonix Receiver Analyzer (model QSX-RXAN-3R1D-A1-1111). This pairing of equipment afforded a considerable degree of automation in the test process. All the results presented here used a payload data block size (N) of 4096 bits.
The impact of signal impairments on receiver performance will likely vary from one receiver (or demodulator) to the next. It is important to bear in mind that our objective here is not to determine the demodulator’s performance with these impairments (although that emerges from the test procedures), but rather the demodulator’s ability to evaluate and quantify its own performance, so that the BSS can make informed decisions about how to combine sources.
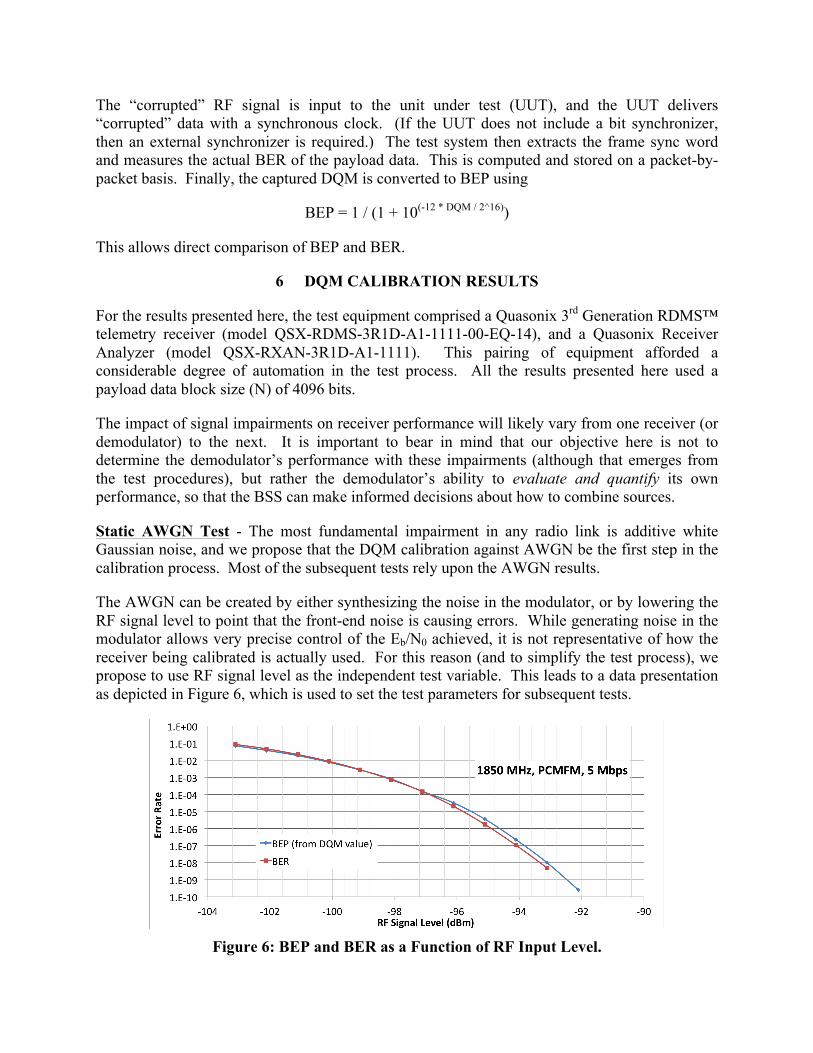
Static AWGN Test - The most fundamental impairment in any radio link is additive white Gaussian noise, and we propose that the DQM calibration against AWGN be the first step in the calibration process. Most of the subsequent tests rely upon the AWGN results.
The AWGN can be created by either synthesizing the noise in the modulator, or by lowering the RF signal level to point that the front-end noise is causing errors. While generating noise in the modulator allows very precise control of the Eb/N0 achieved, it is not representative of how the receiver being calibrated is actually used. For this reason (and to simplify the test process), we propose to use RF signal level as the independent test variable. This leads to a data presentation as depicted in Figure 6, which is used to set the test parameters for subsequent tests.
Figure 6: BEP and BER as a Function of RF Input Level.

Dynamic AWGN Test - The test data collected for Figure 6 can be averaged over a long period of time, because the AWGN level is essentially static for as long as the test engineer would like it to be. Actual telemetry channels are not so gracious, and rapid fluctuations in RF level can arise from a multitude of conditions. Since our goal is to help the BSS construct the best source out of several such dynamically varying signals, we propose to measure the DQM step response as a way of characterizing the ability of the DQM to track these variations.
The BEP and BER data plotted in Figure 6 sets the test limits for the step response test, as follows. Note the RF levels that yield a BER of 1e-2 and 1e-7. For most telemetry modulations, these two levels will be about 6 to 7 dB apart, although in modes using forward error correction, they may only be 1 to 2 dB apart. Set the signal generator to “step” between these two levels. Note that the step response time of the signal generator must be significantly less than the DQE block length.
Since the two RF levels are selected to yield a BER of 1e-2 and 1e-7, there is no need to re-measure the BER; only the BEP needs to be plotted. The figure of merit in this test is how quickly the BEP settles to the values previously determined in the Static AWGN test. The DQM is only calculated and inserted into the data stream every N payload data bits. Therefore, at the point the RF level changes, one DQM value will be a mix of the 1e-2 state and the 1e-7 state, and it should be expected that one measurement of BEP will be somewhere between those two values. The data from this test can be presented as shown in Figure 7. The “blended” values are evident at the transitions.
Figure 7: BEP Response for Abrupt Change in RF Signal Level.
In some telemetry receivers, the AGC time constant may have an effect on the step response of the DQM. The step response test should be repeated with at least two different AGC time constants to determine what impact, if any, the receiver’s AGC loop has on the response time of the DQM value.
Dropout Recovery Test - The Dynamic AWGN Test evaluates the ability of the DQM to track modest variations in signal level. This is relevant to the case where the RF signal stays within the receiver’s synchronization range. Again, real telemetry channels are not so benign, and complete dropouts will occur. Therefore, we propose a set of three additional tests, modelled after the Flat Fade Recovery Test in IRIG-118, to assess how rapidly DQM settles to an accurate value when the receiver has lost sync on the signal.
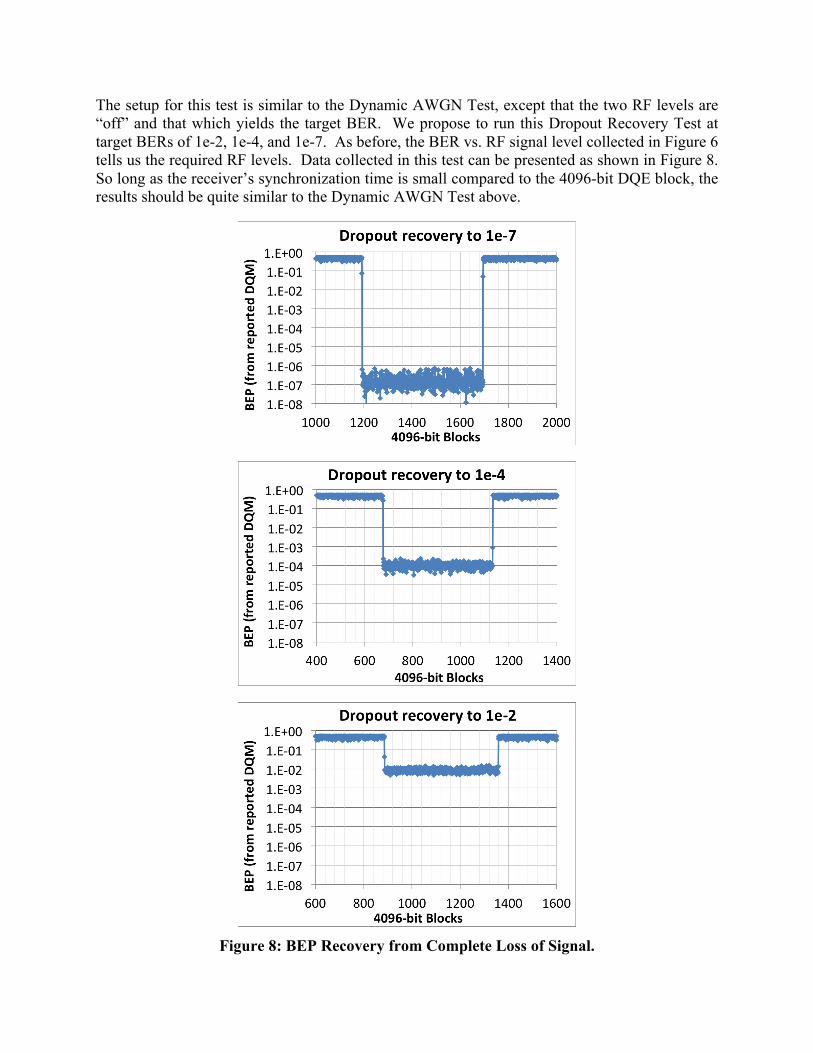
The setup for this test is similar to the Dynamic AWGN Test, except that the two RF levels are “off” and that which yields the target BER. We propose to run this Dropout Recovery Test at target BERs of 1e-2, 1e-4, and 1e-7. As before, the BER vs. RF signal level collected in Figure 6 tells us the required RF levels. Data collected in this test can be presented as shown in Figure 8. So long as the receiver’s synchronization time is small compared to the 4096-bit DQE block, the results should be quite similar to the Dynamic AWGN Test above.
Figure 8: BEP Recovery from Complete Loss of Signal.
Adjacent Channel Interference Test - The tests described above provide a reasonably thorough characterization of the DQM performance under both static and dynamic AWGN. However, there are bigger challenges than AWGN. Despite frequency managers’ best efforts, there are many cases where multiple signals appear within the passband of the receiver. Since these interfering signals are often other telemetry signals, they are quite different from AWGN in terms of their impact on the receiver. Consequently, we propose to evaluate the ability of the DQM to quantify the degradation caused by interfering signals.
Tallying the number of modulations that might appear as interferers, the data rates they might be carrying, and their relative amplitudes and frequencies, the list of candidate interfering signals is literally infinite. We propose a test that is an adaptation of the test procedures for adjacent channel interference in section 7.5 of IRIG-118.
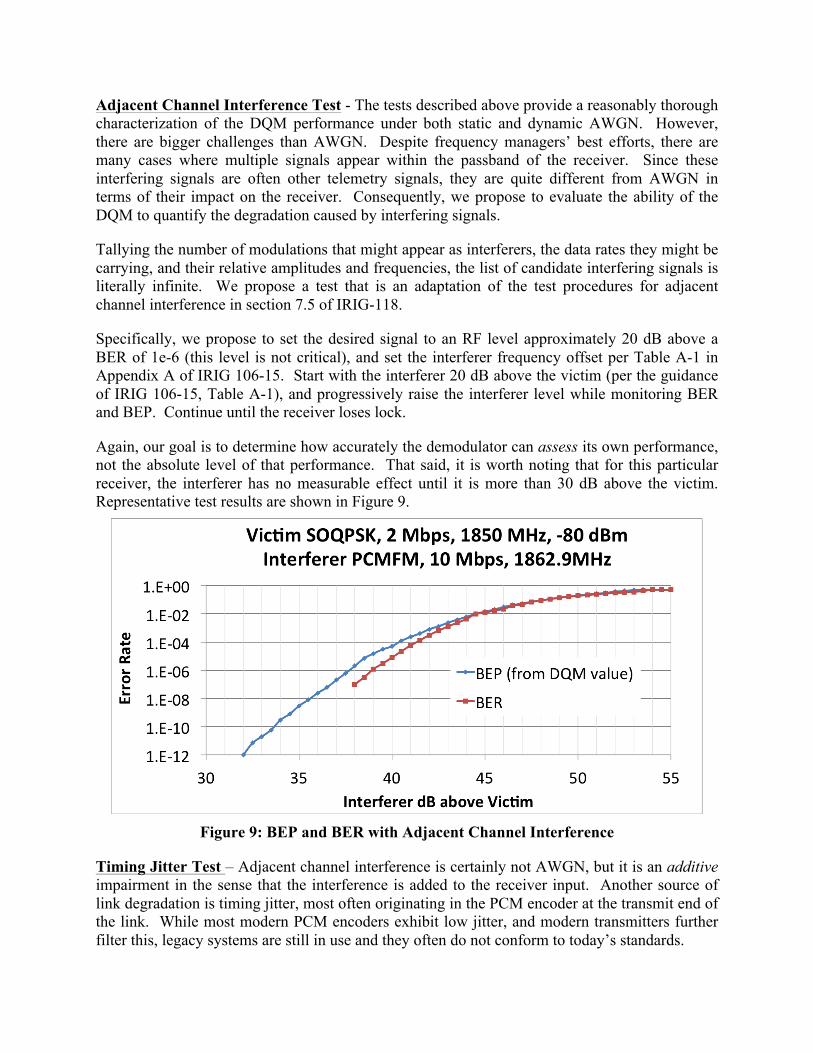
Specifically, we propose to set the desired signal to an RF level approximately 20 dB above a BER of 1e-6 (this level is not critical), and set the interferer frequency offset per Table A-1 in Appendix A of IRIG 106-15. Start with the interferer 20 dB above the victim (per the guidance of IRIG 106-15, Table A-1), and progressively raise the interferer level while monitoring BER and BEP. Continue until the receiver loses lock.
Again, our goal is to determine how accurately the demodulator can assess its own performance, not the absolute level of that performance. That said, it is worth noting that for this particular receiver, the interferer has no measurable effect until it is more than 30 dB above the victim. Representative test results are shown in Figure 9.
Figure 9: BEP and BER with Adjacent Channel Interference
Timing Jitter Test – Adjacent channel interference is certainly not AWGN, but it is an additive impairment in the sense that the interference is added to the receiver input. Another source of link degradation is timing jitter, most often originating in the PCM encoder at the transmit end of the link. While most modern PCM encoders exhibit low jitter, and modern transmitters further filter this, legacy systems are still in use and they often do not conform to today’s standards.

The impact of timing jitter on receiver performance will likely vary from one receiver (or demodulator) to the next, and our objective here is determine the demodulator’s ability to evaluate and quantify that impact. To achieve this, we propose to drive the signal generator in Figure 5 with a clock that has a calibrated degree of jitter, while driving the receiver with the RF signal level that results in a BER of 1e-7 (again, found from the results of the Static AWGN Test in Figure 6). Start with no added jitter, and increase the jitter until the demodulator loses lock. Typical results are shown in Figure 10.
Figure 10: BEP and BER with Timing Jitter.
Static Multipath Test – Most telemetry links utilize high gain antennas on the ground. When the test article is well above the horizon, the highly directive receive antenna pattern can be quite effective at rejecting signals reflected off the ground or water. For low-flying or grounded test articles, however, multipath reflections can cause severe signal distortion. This distortion, if not mitigated by techniques such as adaptive equalization, can create bit errors even when the signal level is very high.
We propose to characterize a receiver’s ability to recognize and quantify this condition with a Static Multipath Test. As in the case of adjacent channel interference, there are literally an infinite number of possible channels, so we will test a miniscule subset, using only a two-ray multipath model. The three channel parameters of interest in this case are the delay between the two paths and the magnitude and phase shift of the second path relative to the first path. Since we are focused on the impact of multipath, we propose to run this test at -40 dBm input level. This is high enough that receiver front-end noise is negligible, and low enough that the front end should still be safely away from saturation.
A complete characterization of even this simple case is beyond the scope of this paper, but an example, with differential delay as the independent variable, is shown in Figure 11. The signal in this case is SOQPSK at 1850 MHz and -40 dBm.

Figure 11: BEP and BER with Static Multipath.
7 SYSTEM-LEVEL PERFORMANCE
All of this effort to have the receiver assess its own performance would be an academic exercise if there were no best source selectors (BSS) to utilize the DQM / DQE packet structure. However, as of this writing in August 2015, there are at least two BSS vendors (NetAcquire and GDP Space Systems) who have already developed the processing algorithms necessary to read and utilize the DQM values provided by the 3rd Generation Quasonix receivers. A four-receiver test system with best source selectors from both vendors has been installed at Naval Air Weapons Station China Lake, and this system is slated for flight test in September 2015.
Lab testing at the system level (including the NetAcquire Advanced Correlating Source Selector) has been underway for many months, and the measured bit error rate at the BSS input and output is shown in Figure 12 (note the inverted BER scale). Since zero cannot be plotted on a log scale, an error-free BERT test interval is plotted as BER = 1e-10. It is quite apparent that the source selector, driven with the DQM / DQE packet structure, can turn four very mediocre telemetry links into nearly error-free data.
Figure 12: BER Improvement with Four Slowly Fading Channels and a BSS.

8 AREAS FOR FUTURE RESEARCH
The results and test procedures described above could provide a starting point for a new chapter of IRIG 118, which would have the potential to enable receivers and best source selectors from multiple vendors to interoperate. To provide a more comprehensive evaluation, we propose to develop at least two more tests.
Phase Noise Test – Similar to timing jitter, phase noise can degrade demodulator performance, even at high RF signal levels. Phase noise is additive through the complete RF link, so contributions from both the transmitter and receiver impact performance. Quasonix is developing a calibrated phase noise generator for the Receiver Analyzer, and DQM calibration results for phase noise may be included in a future publication.
Dynamic Multipath Test – IRIG 118 includes the Break Frequency Test as a way of characterizing the ability of a diversity combiner to keep up with rapid fading. The Receiver Analyzer already automates the Break Frequency Test, and evaluation of the DQM algorithms under this dynamic test case may also be published in a future paper.
9 CONCLUSIONS
We have defined a packet structure for bundling data quality information along with the payload data, for the purpose of assisting a correlating best source selector to combine multiple streams carrying the same data. We have proposed that bit error probability within a block of data is a uniformly understood metric for data quality, and presented a numerical representation of that error probability, which leads directly to a maximum likelihood data combiner. We have shown that there are computational techniques that yield timely and accurate calculations of bit error probability, and we have proposed test methods by which the accuracy of these calculations can be assessed in the presence of several types of channel impairments. Finally, we have shown that best source selectors available in the market today can utilize the DQM / DQE scheme defined here to produce nearly error-free data from relatively poor sources.
10 ACKNOWLEDGEMENTS
The author would like to thank his consistently brilliant and always-helpful colleagues at Quasonix, especially Jim Uetrecht, who invented both the DQM algorithms used in the Quasonix RDMS™ telemetry receivers and the signal generators and BERTs used in the Quasonix Receiver Analyzer. Special thanks also to Quasonix colleagues Jim McCurdy, Chopper Eckhoff, and Sean Wilson, who developed the hardware, software, and meticulous calibration techniques for the Receiver Analyzer, and collected the voluminous data at the bench.
11 REFERENCES
[1] Rice, Michael and Perrins, Erik. "Maximum Likelihood Detection From Multiple Bit Sources", Proceedings of the International Telemetering Conference, Las Vegas, NV, USA, 2015.