metro mining (mmi)
TRANSCRIPT
Shaw and Partners
0.1500 00000 000
MMI – Equity Report –03/12/2019–Pg. 1
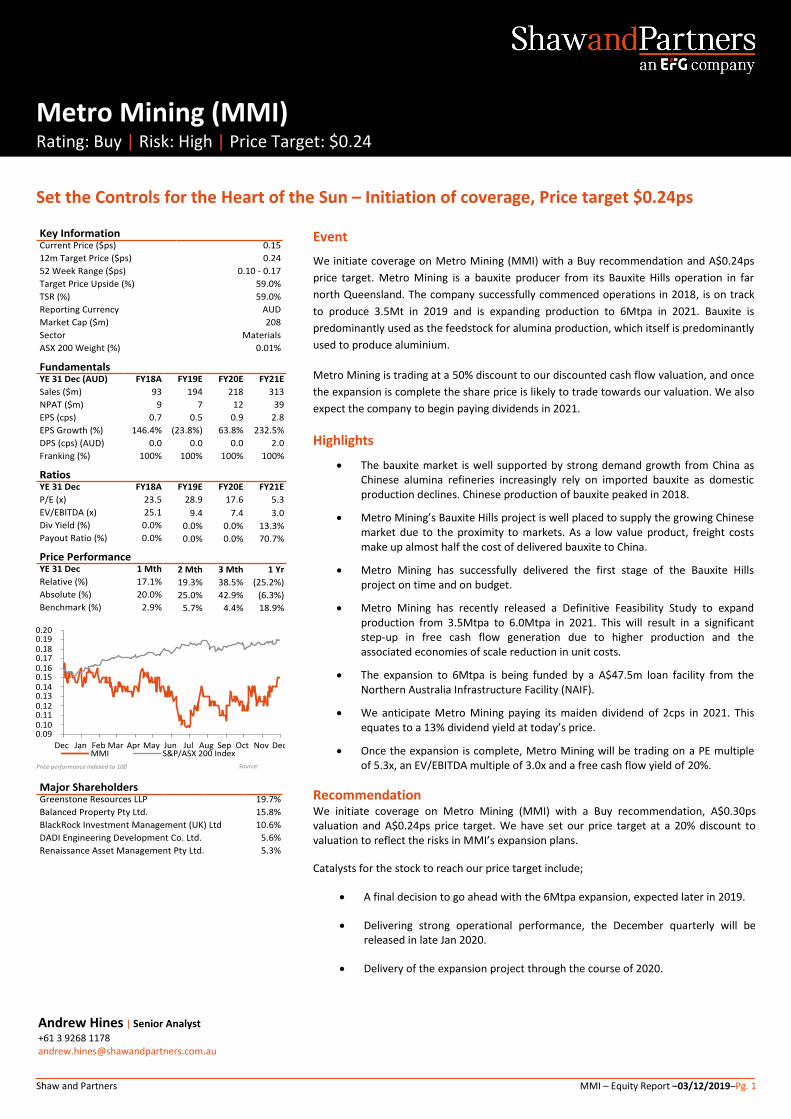
Metro Mining (MMI) Rating: Buy | Risk: High | Price Target: $0.24
Set the Controls for the Heart of the Sun – Initiation of coverage, Price target $0.24ps
Andrew Hines | Senior Analyst
+61 3 9268 1178 [email protected]
Event
We initiate coverage on Metro Mining (MMI) with a Buy recommendation and A$0.24ps
price target. Metro Mining is a bauxite producer from its Bauxite Hills operation in far
north Queensland. The company successfully commenced operations in 2018, is on track
to produce 3.5Mt in 2019 and is expanding production to 6Mtpa in 2021. Bauxite is
predominantly used as the feedstock for alumina production, which itself is predominantly
used to produce aluminium.
Metro Mining is trading at a 50% discount to our discounted cash flow valuation, and once
the expansion is complete the share price is likely to trade towards our valuation. We also
expect the company to begin paying dividends in 2021.
Highlights
The bauxite market is well supported by strong demand growth from China as Chinese alumina refineries increasingly rely on imported bauxite as domestic production declines. Chinese production of bauxite peaked in 2018.
Metro Mining’s Bauxite Hills project is well placed to supply the growing Chinese market due to the proximity to markets. As a low value product, freight costs make up almost half the cost of delivered bauxite to China.
Metro Mining has successfully delivered the first stage of the Bauxite Hills project on time and on budget.
Metro Mining has recently released a Definitive Feasibility Study to expand production from 3.5Mtpa to 6.0Mtpa in 2021. This will result in a significant step-up in free cash flow generation due to higher production and the associated economies of scale reduction in unit costs.
The expansion to 6Mtpa is being funded by a A$47.5m loan facility from the Northern Australia Infrastructure Facility (NAIF).
We anticipate Metro Mining paying its maiden dividend of 2cps in 2021. This equates to a 13% dividend yield at today’s price.
Once the expansion is complete, Metro Mining will be trading on a PE multiple of 5.3x, an EV/EBITDA multiple of 3.0x and a free cash flow yield of 20%.
Recommendation We initiate coverage on Metro Mining (MMI) with a Buy recommendation, A$0.30ps valuation and A$0.24ps price target. We have set our price target at a 20% discount to valuation to reflect the risks in MMI’s expansion plans.
Catalysts for the stock to reach our price target include;
A final decision to go ahead with the 6Mtpa expansion, expected later in 2019.
Delivering strong operational performance, the December quarterly will be released in late Jan 2020.
Delivery of the expansion project through the course of 2020.

Shaw and Partners MMI – Equity Report –03/12/2019–Pg. 2
Metro Mining Ltd. is engaged in the explortion of coal and bauxite. It holds interest in Bauxite Hills and Coal projects. The company was founded on January 6, 2006 and is headquartered in Brisbane, Australia.
* Metro Mining changed to a December balance date in 2018, the first set of FY18 data is for the 12 months to June 2018, the second set of FY18 data is for the six months to Dec-2018
Shaw and Partners MMI – Equity Report –03/12/2019–Pg. 3
Table of Contents
Metro Mining key financials 4
Executive Summary 5
Metro Mining in charts 6
The global bauxite market 8
Bauxite price history and outlook 10
Metro Mining Operations 12
Expansion to 6mtpa 13
Earnings Drivers 14
Balance Sheet 16
Cash flow and dividends 17
Valuation 18
Key risks 19
Appendix: Key personnel 20

Shaw and Partners MMI – Equity Report –03/12/2019–Pg. 4
Metro Mining Key financials
Profit & Loss FY18 FY19 FY20f FY21f FY22f Company Information
Revenue 93 194 218 313 321 Financial Year End Date 31 Dec
Expenses -84 -170 -188 -239 -244 Share Price 0.15
Underlying EBITDA 9 24 30 74 77 Market Capitalisation 208
Depreciation & Amort -3 -7 -8 -12 -12 Valuation 0.30
Underlying EBIT 6 17 22 62 65 Recommendation Buy
Net Interest -4 -7 -6 -6 -5
Profit Before Tax 2 10 17 56 60 Per Share Data (c) FY18 FY19 FY20f FY21f FY22f
Tax 7 -3 -5 -17 -18 Shares (m) 1,384 1,384 1,384 1,384 1,384
NPAT (Underlying) 9 7 12 39 42 Normalised EPS 0.7 0.5 0.9 2.8 3.0
Exceptional items 0 0 0 0 0 Dividends 0.0 0.0 0.0 2.0 2.0
NPAT (reported) 9 7 12 39 42 Dividend Yield (%) 0.0% 0.0% 0.0% 13.3% 13.3%
Book Value 0.1 0.1 0.1 0.1 0.1
Balance Sheet FY18 FY19 FY20f FY21f FY22f Normalised P/E 20.5 28.9 17.6 5.3 5.0
Cash 23 24 11 33 35 EV/EBITDA (underlying) 22.4 9.5 8.9 3.3 3.1
Net Receivables 21 43 48 69 70
Other 9 12 13 16 16 DCF Valuation @ 10% WACC A$m A$ps
Current Assets 53 79 72 118 121 Operations 467 0.34
Property, Plant & Equipment 139 142 195 187 189 Net debt -18 -0.01
Other 9 9 9 9 9 Rehabilitation -7 0.00
Non Current Assets 148 151 204 196 198 Development assets 0 0.00
Total Assets 201 230 276 313 319 Corporate costs -30 -0.02
Trade Creditors 20 39 44 55 57 Total Valuation 413 0.30
Borrow ings 3 3 3 3 3
Other 9 9 9 9 9
Current Liabilities 32 51 55 67 68 Assumptions FY18 FY19 FY20f FY21f FY22f
Borrow ings 31 34 64 64 54 Prices
Other 8 8 8 8 8 A$/US$ 0.73 0.69 0.70 0.75 0.75
Non Current Liabilities 39 43 73 73 63 Bauxite (US$/t) 54 51 49 51 52
Net Assets 129 137 148 174 188 Bauxite (A$/t) 73 74 70 67 69
Shareholder Capital 176 176 176 176 176
Retained earnings -56 -49 -37 -12 3 Operating Metrics FY18 FY19 FY20f FY21f FY22f
Minorities/others 9 9 9 9 9 Bauxite sales (kt) 1,638 3,400 4,000 6,000 6,000
Total Equity 129 137 148 174 188 Average price (A$/t) 57 57 55 52 53
Average cost (A$/t) 51 50 47 40 41
Cash Flow FY18 FY19 FY20f FY21f FY22f EBITDA margin (A$/t) 6 7 8 12 13
Receipts 84 194 218 313 321
Payments -80 -170 -188 -239 -244
Other Operating Cash Flow 0 -6 -1 -17 -17 Financial metrics (%) FY18 FY19 FY20f FY21f FY22f
Operating Cash Flow 4 18 29 58 60 EBITDA margin 10.0% 12.2% 13.9% 23.7% 24.0%
Capex -1 -2 -56 -5 -5 EBIT margin 6.7% 8.7% 10.2% 19.9% 20.2%
Other Investing Cash Flow -3 -11 -10 -10 -10 ROIC 3.1% 7.9% 7.6% 21.0% 21.6%
Investing Cash Flow -4 -13 -66 -15 -15 Return on Assets 4.9% 3.3% 4.6% 13.3% 13.3%
Dividends Paid 0 0 0 -14 -28 Return on Equity 7.5% 5.4% 8.3% 24.3% 23.2%
Net Borrow ings 0 3 30 0 -10
Other 0 -7 -6 -7 -6 Balance sheet metrics FY18 FY19 FY20f FY21f FY22f
Financing Cash flow 0 -4 24 -20 -43 Net Debt (m) 16 18 61 39 28
Total Cash Change 0 1 -13 22 2 ND / ND+E 10.9% 11.7% 29.2% 18.4% 12.8%

Shaw and Partners MMI – Equity Report –03/12/2019–Pg. 5
Executive Summary
We initiate coverage on Metro Mining (MMI) with a Buy recommendation, A$0.30ps
valuation and a A$0.24ps price target. We have set our price target at a 20% discount to
valuation to reflect the risks in MMI’s expansion plans.
Metro Mining is a bauxite producer from its Bauxite Hills operation in far north
Queensland. The company successfully commenced operations in 2018 and is expanding
production to 6Mtpa in 2021.
Core drivers & catalysts
The bauxite market is well supported by strong demand growth from China as Chinese alumina refineries increasingly rely on imported bauxite as domestic production declines. Chinese production of bauxite peaked in 2018.
Metro Mining’s Bauxite Hills project is well placed to supply the growing Chinese market due to the proximity to markets. As a low value product, freight costs make up almost half the cost of delivering bauxite to China.
Metro Mining has recently released a Definitive Feasibility Study to expand production from 3.5Mtpa to 6.0Mtpa in 2021. This will result in a significant step-up in free cash flow generation due to higher production and the associated economies of scale reduction in unit costs.
We anticipate Metro Mining paying its maiden dividend of 2cps in 2021. This equates to a 13% dividend yield at today’s share price.
Once the expansion is complete, Metro Mining will be trading on a PE multiple of 5.3x, an EV/EBITDA multiple of 3.2x and a free cash flow yield of 20%.
Key risks
The bauxite market is currently modestly over-supplied due to the strong growth from Guinea which is backed by Chinese investment. There is a risk that MMI will not be able to sell its expanded production, or be forced to discount the price.
The aluminium market is currently depressed globally and many smelters are assessing their viability. Further capacity closures will impact demand for alumina and bauxite.
Metro Mining is expanding its operation from 3.5Mt to 6.0Mt. The mining and barging component of the expansion is straight-forward, but MMI is intending to use a Floating Terminal (FT) to load ocean going vessels. There are design and operating risks with the FT. It may cost more than expected to build, and it may not operate as expected.
Figure 1: Free cash flow (A$m) Figure 2: Valuation sensitivity to bauxite prices
Source: Company data & Shaw and Partners analysis Source: Company data & Shaw and Partners analysis
-60
-40
-20
0
20
40
60
80
20
17
FY1
8
20
18
20
19
f
20
20
f
20
21
f
20
22
f
20
23
f
20
24
f
20
25
f
0.00
0.10
0.20
0.30
0.40
0.50
0.60
Shaw
US$
40/t
US$
45/t
US$
50/t
US$
55/t
US$
60/t
spot
Current shareprice

Shaw and Partners MMI – Equity Report –03/12/2019–Pg. 6
Metro Mining in Charts
Figure 3: Production (kt) – ramping up to 6mtpa in 2021 Figure 4: Revenue (A$m) – strong growth in line with production
Source: Company data & Shaw and Partners analysis Source: Company data & Shaw and Partners analysis
Figure 5: EBITDA (A$m) – growth boosted by lower unit costs Figure 6: EBIT (A$m) – more than doubling in 2021
Source: Company data & Shaw and Partners analysis Source: Company data & Shaw and Partners analysis
Figure 7: NPAT (A$m) – PE multiple drops to 4x in 2021 Figure 8: Operating cash flow (A$m) – growth in line with EBITDA
Source: Company data & Shaw and Partners analysis Source: Company data & Shaw and Partners analysis
* Metro Mining changed to a December balance date in 2018, the data for 2018 is for the six months to Dec-2018
0
1,000
2,000
3,000
4,000
5,000
6,000
7,000
2017
FY1
8
2018
2019
f
2020
f
2021
f
2022
f
2023
f
2024
f
2025
f 0
50
100
150
200
250
300
350
400
20
17
FY1
8
20
18
20
19
f
20
20
f
20
21
f
20
22
f
20
23
f
20
24
f
20
25
f
-20.0
0.0
20.0
40.0
60.0
80.0
100.0
20
17
FY1
8
20
18
20
19
f
20
20
f
20
21
f
20
22
f
20
23
f
20
24
f
20
25
f
-20
0
20
40
60
80
100
20
17
FY18
20
18
20
19
f
20
20
f
20
21
f
20
22
f
20
23
f
20
24
f
20
25
f
-30
-20
-10
0
10
20
30
40
50
60
2017
FY18
2018
2019
f
2020
f
2021
f
2022
f
2023
f
2024
f
2025
f
-10
0
10
20
30
40
50
60
70
2017
FY18
2018
2019
f
2020
f
2021
f
2022
f
2023
f
2024
f
2025
f
Shaw and Partners MMI – Equity Report –03/12/2019–Pg. 7
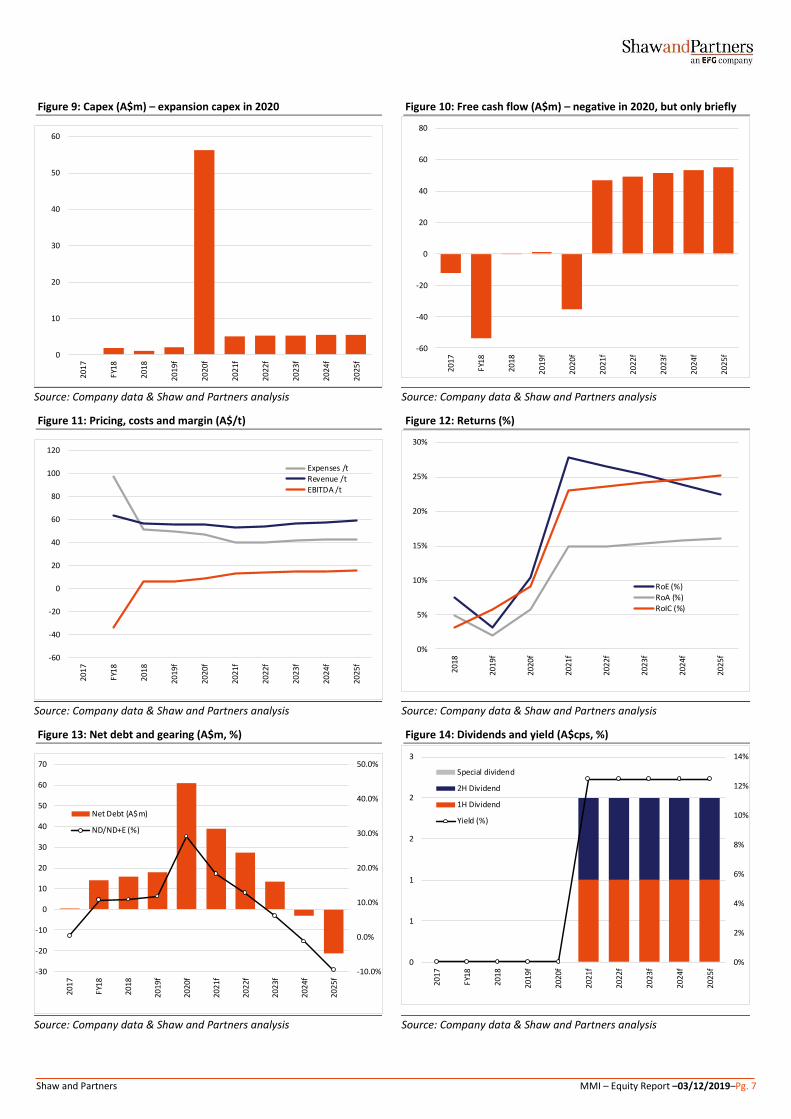
Figure 9: Capex (A$m) – expansion capex in 2020 Figure 10: Free cash flow (A$m) – negative in 2020, but only briefly
Source: Company data & Shaw and Partners analysis Source: Company data & Shaw and Partners analysis
Figure 11: Pricing, costs and margin (A$/t) Figure 12: Returns (%)
Source: Company data & Shaw and Partners analysis Source: Company data & Shaw and Partners analysis
Figure 13: Net debt and gearing (A$m, %) Figure 14: Dividends and yield (A$cps, %)
Source: Company data & Shaw and Partners analysis Source: Company data & Shaw and Partners analysis
0
10
20
30
40
50
60
20
17
FY1
8
20
18
20
19
f
20
20
f
20
21
f
20
22
f
20
23
f
20
24
f
20
25
f-60
-40
-20
0
20
40
60
80
20
17
FY1
8
20
18
20
19
f
20
20
f
20
21
f
20
22
f
20
23
f
20
24
f
20
25
f
-60
-40
-20
0
20
40
60
80
100
120
2017
FY1
8
2018
2019
f
2020
f
2021
f
2022
f
2023
f
2024
f
2025
f
Expenses /tRevenue /tEBITDA /t
0%
5%
10%
15%
20%
25%
30%
2018
2019
f
2020
f
2021
f
2022
f
2023
f
2024
f
2025
f
RoE (%)
RoA (%)RoIC (%)
-10.0%
0.0%
10.0%
20.0%
30.0%
40.0%
50.0%
-30
-20
-10
0
10
20
30
40
50
60
70
2017
FY1
8
2018
2019
f
2020
f
2021
f
2022
f
2023
f
2024
f
2025
f
Net Debt (A$m)
ND/ND+E (%)
0%
2%
4%
6%
8%
10%
12%
14%
0
1
1
2
2
3
2017
FY18
2018
2019
f
2020
f
2021
f
2022
f
2023
f
2024
f
2025
f
Special dividend
2H Dividend
1H Dividend
Yield (%)
Shaw and Partners MMI – Equity Report –03/12/2019–Pg. 8
The Global Bauxite Market
Bauxite 101 Bauxite is a naturally occurring material which is predominantly used as a feedstock for
the manufacture of alumina, which in turn is predominantly used to produce aluminium. It
takes around 5t of bauxite to produce 2t of alumina to produce 1t of aluminium.
Bauxite is classified according to its intended commercial application; metallurgical,
cement, fertiliser, abrasive, chemical or refractory. The vast majority (~85%) of bauxite
mined globally is classified as metallurgical and is converted to alumina (Al2O3) for the
production of aluminium metal.
The quality of bauxite as a feedstock for alumina production is determined largely by its
grade (% alumina) and by amount of impurities, particularly reactive silica. Higher
amounts of reactive silica require increased consumption of caustic in the refining process
and significantly add to alumina refining costs.
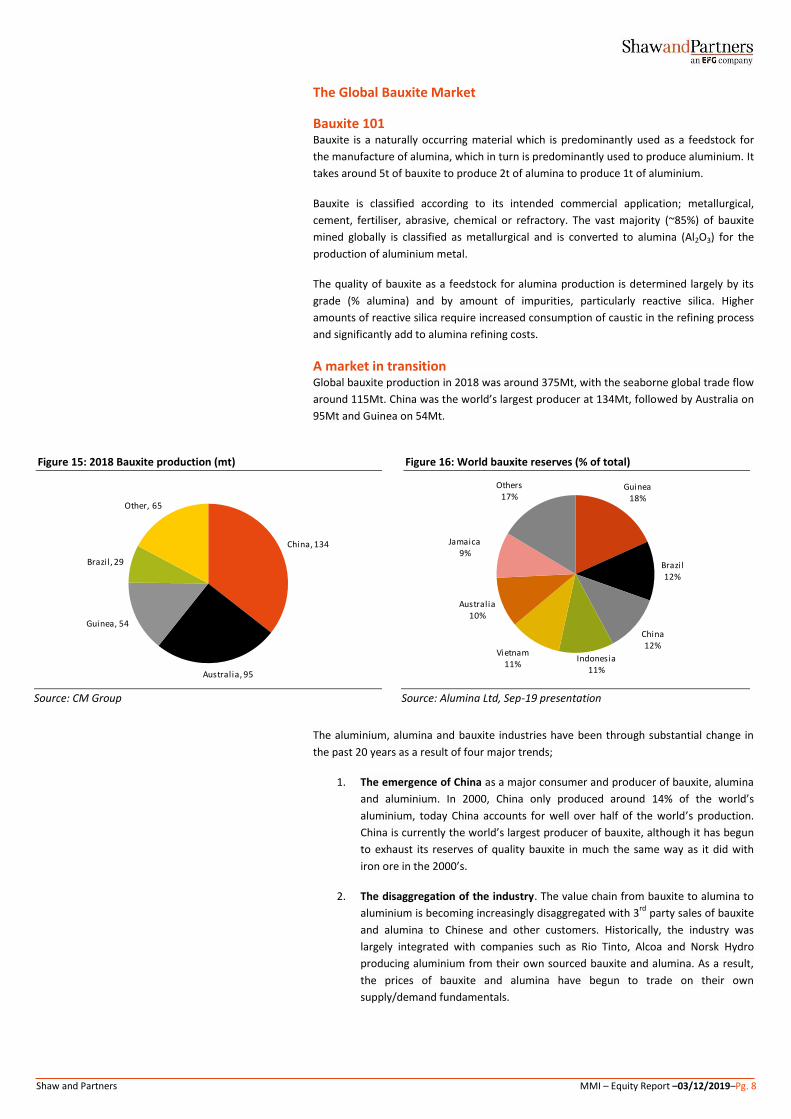
A market in transition
Global bauxite production in 2018 was around 375Mt, with the seaborne global trade flow
around 115Mt. China was the world’s largest producer at 134Mt, followed by Australia on
95Mt and Guinea on 54Mt.
Figure 15: 2018 Bauxite production (mt) Figure 16: World bauxite reserves (% of total)
Source: CM Group Source: Alumina Ltd, Sep-19 presentation
The aluminium, alumina and bauxite industries have been through substantial change in
the past 20 years as a result of four major trends;
1. The emergence of China as a major consumer and producer of bauxite, alumina
and aluminium. In 2000, China only produced around 14% of the world’s
aluminium, today China accounts for well over half of the world’s production.
China is currently the world’s largest producer of bauxite, although it has begun
to exhaust its reserves of quality bauxite in much the same way as it did with
iron ore in the 2000’s.
2. The disaggregation of the industry. The value chain from bauxite to alumina to
aluminium is becoming increasingly disaggregated with 3rd
party sales of bauxite
and alumina to Chinese and other customers. Historically, the industry was
largely integrated with companies such as Rio Tinto, Alcoa and Norsk Hydro
producing aluminium from their own sourced bauxite and alumina. As a result,
the prices of bauxite and alumina have begun to trade on their own
supply/demand fundamentals.
China, 134
Australia, 95
Guinea, 54
Brazil, 29
Other, 65
Guinea18%
Brazil12%
China12%
Indonesia11%
Vietnam11%
Australia10%
Jamaica9%
Others17%

Shaw and Partners MMI – Equity Report –03/12/2019–Pg. 9
3. Increased demand for imported bauxite from China. The quality of China’s
domestic bauxite production has begun to decline, and so Chinese alumina
refineries have begun to source bauxite from outside China. In 2018, China
imported around 83Mt out of a total seaborne bauxite of 115Mt. This was seen
as a significant opportunity for Australian and Brazilian exports, but the
opportunity has been less than expected due to the emergence of Guinea.
Chinese domestic production is expected to continue to decline and China will
become further reliant on imports.
Figure 17: Chinese bauxite consumption – increased reliance on imports (Mt)
Source: CM Group, Alumina Ltd presentation Aug-19
4. The emergence of Guinea as a bauxite producer and world’s largest exporter.
The growth in Guinean exports has been phenomenal in the past five years due
to Chinese investment. Guinea is expected to grow from just 0.5Mt of exports in
2015, to 60Mt in 2019 and 80Mt by 2021. In 2017, a consortium of Chinese
companies ‘lent’ the Guinean government US$20b for infrastructure projects in
return for bauxite concessions. The growth in Guinea is not over, and as a result,
the bauxite market is expected to remain modestly over-supplied in the near
term.
Figure 18: Global bauxite trade 2018 (Mt) Figure 19: World bauxite trade flows
Source: CM Group Source: CM Group
Exporter Importer Mt
Guinea China 36.8
Australia China 28.9
Indonesia China 10.1
Brazil China 2.4
Solomon Islands China 1.6
Malaysia China 1.0
Other China 2.7
Guinea Spain 4.0
Guinea Ukraine 3.7
Guinea Ireland 3.1
Guinea Germany 2.7
Guinea Other 2.2
Jamaica U.S. 3.1
Brazil Canada 2.4
Brazil Ireland 1.6
Other 9.5
Total Seaborne 115.5
China Portion 83.4

Shaw and Partners MMI – Equity Report –03/12/2019–Pg. 10
Bauxite price history and outlook
As noted above, the price of bauxite has begun to trade on its own supply/demand
fundamentals, although given the vast bulk of bauxite is used to produce alumina, the
markets remain strongly linked. The price is now largely driven by the CBIX price index
which is a value in use adjusted price index monitored by CM Group. It is similar to the
Metal Bulletin or Platts price index for iron ore in that the index is formed by recent
transactions with CM Group triangulating between data from buyers and sellers.
Over the past decade, bauxite has averaged US$50/t, or US$57/t in real 2019$. The past
decade high was US$68/t at the tail end of the initial China boom, and the low was
US$32/t in the global financial crisis. The price recovered post the GFC and was trending
higher until the emergence of Guinean exports in 2015.
Figure 20: Bauxite price (US$/t) Figure 21: Bauxite price (US$/t real 2019$)
Source: CM, company reports, Shaw and Partners analysis Source: CM, company reports, Shaw and Partners analysis
For the past four years the bauxite price has been range bound between US$45/t and
US$55/t with the spot price today at about US$50/t.
Figure 22: Recent bauxite price and catalysts (US$/dmt, cif China)
Source: CRU, Bauxite price index, Alumina Ltd presentation Aug-19
0
10
20
30
40
50
60
70
80
Mar
-08
Mar
-09
Mar
-10
Ma
r-1
1
Ma
r-1
2
Ma
r-1
3
Ma
r-1
4
Mar
-15
Mar
-16
Mar
-17
Mar
-18
Mar
-19
Mar
-20f
Mar
-21f
Mar
-22f
Mar
-23f
Mar
-24f
Mar
-25f
0
10
20
30
40
50
60
70
80
90
100
Mar
-08
Mar
-09
Mar
-10
Ma
r-1
1
Mar
-12
Mar
-13
Mar
-14
Mar
-15
Mar
-16
Mar
-17
Mar
-18
Ma
r-1
9
Mar
-20f
Mar
-21f
Mar
-22f
Mar
-23f
Mar
-24f
Mar
-25f

Shaw and Partners MMI – Equity Report –03/12/2019–Pg. 11
In our view, the bauxite price is likely to trade within the recent range of US$45/t to
US$55/t whilst Guinean production is supplying the marginal tonne into the Chinese
market.
Chinese demand for imported bauxite is expected to continue to grow, but supply growth
from Guinea is likely to meet this demand until at least 2022/23. There may be an
opportunity for the price to escalate beyond 2023 as Chinese demand continues to grow,
but in our view, bauxite is not a scarce commodity and any surge in price is likely to be
short lived as supply responds.
According to CM group, an industry cost curve puts Guinean exports at a delivered cost to
China of ~US$50/t. So the price of bauxite is unlikely to trade significantly below US$50/t
for extended periods. In our forecasts we assume a long term sustainable bauxite price of
US$50/t (real 2019$).
Figure 23: Seaborne bauxite cost curve (US$/t) – unadjusted for value in use
Source: CM Group
Metro mining achieved bauxite price
Metro mining is planning to produce about 3.5Mt of bauxite in 2019, of which
approximately 2.2Mt will be sold under a long–term off-take to Xinfa. This contract
extends into 2020. Under this contract, prices received are linked to an RMB denominated
alumina price index. As such, Metro Mining will be exposed to moves in the more volatile
alumina price, and is currently achieving a price below the CBIX index.
For the past 2 years, MMI’s average price achievement has been 89% of the CBIX index.
Figure 24: Metro Mining price achievement (US$/t)
Source: Company reports, Shaw and Partners analysis
Price achievement 1Q18 2Q18 3Q18 4Q18 1Q19 2Q19 3Q19 4Q19
Achieved price (A$/wmt) - 63 53 61 - 57 56 -
Achieved price (US$/wmt) - 47 38 42 - 40 38 -
Achieved price (US$/dmt) - 53 44 48 - 46 43 -
CBIX index (US$/dmt) 54 53 55 53 52 52 50 49
Metro price achievement (%) 100% 79% 91% 88% 86%

Shaw and Partners MMI – Equity Report –03/12/2019–Pg. 12
Metro Mining Operations Metro Mining's Bauxite Hills mine, is located 95kms north of Weipa on Western Cape York
where the company holds a total tenement package covering approximately 1,900 square
kilometres.
Figure 25: Project location Figure 26: Mining leases
Source: Metro Mining Source: Metro Mining
It is a very simple mining operation. Bauxite is mined by front-end loaders, trucked to a
port infrastructure area, screened to a max product size of 100mm and fed onto the Barge
Loading Facility and into barges. Barges are towed down the Skardon River to an
anchorage point at sea where the bauxite is transhipped to freight vessels. Mining
operations are undertaken only in the dry season from April to November.
Figure 27: Simple mining operation – strip mining, rehabilitation, ore haulage, barge, ship-loading
Source: Metro Mining corporate presentation

Shaw and Partners MMI – Equity Report –03/12/2019–Pg. 13
Expansion to 6Mtpa
Metro Mining recently reported the results of a Definitive Feasibility Study to take the
operation from its current 3.5Mtpa production rate to 6.0Mtpa. The current reserve is
110Mt, so the mine life will be 19 years at the new production rate.
The key features of the expansion include;
Expansion to 4Mtpa in 2020 and 6Mtpa in 2021 (wet metric tonnes).
The use of a Floating Terminal (FT) to speed up ship loading and allow the
loading of ungeared vessels including Cape Size vessels.
Total capital costs of A$51.4m including contingency
An expected reduction in annual unit operating costs of 18%
Metro Mining has estimated that the project payback is only 18mths.
The main feature of the expansion project is the design and installation of the FT. Metro
Mining has commissioned Rocktree Consulting to design the FT with the final design
expected to be completed in November 2019. The preferred design is likely to be a 100m
barge, equipped with two cranes and a materials handling conveyor and stacker system
that will have the ability to load up to 40,000tpd of bauxite.
The advantage of the FT is that it will allow Metro Mining to take advantage of chartering
Cape Size vessels to realise significant freight savings (estimated at a $3-4/t saving), whilst
maintaining customer flexibility with the ability to still load smaller OGVs.
Figure 28: Example of a Floating Terminal
Source: Metro Mining corporate presentation

Shaw and Partners MMI – Equity Report –03/12/2019–Pg. 14
Earnings Drivers We expect a significant jump in Metro Mining’s earnings in 2021 to A$39m from just
A$9m in 2018.
As for all resource companies, there are three primary drivers of earnings – price, volume
and cost. Metro Mining’s volumes are expected to increase due to the ramp up of
production with the commissioning of the Floating Terminal.
We are expecting bauxite prices to remain relatively stable at around US$50/dmt (CBIX)
with Metro Mining continuing to achieve 88% of the CBIX price. We may be under-
estimating price achievement in 2022 once the contract with Xinfa expires.
Total unit costs have averaged A$51/wmt in the six months to Dec-18, but have trended
down in 2019 as production has increased. Metro Mining reported total site operating
costs (excluding overheads) of A$40/wmt in the September quarter.
We expect costs to further reduce in 2021 due to the economies of scale of taking
production from 3.5Mt to 6.0Mt. Metro Mining has estimated that the expansion will
reduce unit costs by about 18%.
Figure 29: Metro Mining P&L (A$m)
Source: Company reports, Shaw and Partners analysis
Figure 30: NPAT (A$m) Figure 31: Unit revenue, costs and EBITDA margin (A$/wmt)
Source: Company reports, Shaw and Partners analysis Source: Company reports, Shaw and Partners analysis
Profit & Loss 2017 FY18 2018 2019f 2020f 2021f 2022f 2023f 2024f 2025f
Production (kt) 0 399 1,638 3,400 4,000 6,000 6,000 6,000 6,000 6,000
Revenue 0 25 93 194 218 313 321 328 336 344
per tonne 63 57 57 55 52 53 55 56 57
Other income 9 0 0 0 0 0 0 0 0 0
Operating expenses 0 -26 -71 -148 -163 -201 -205 -209 -213 -218
Royalties 0 -3 -9 -19 -20 -31 -32 -33 -34 -34
Admin & other expenses -7 -10 -3 -3 -4 -6 -6 -6 -7 -7
Total costs -7 -39 -84 -170 -188 -239 -244 -249 -254 -259
per tonne 97 51 50 47 40 41 41 42 43
EBITDA 2 -13 9 24 30 74 77 80 82 84
Depreciation & Amortisation 0 -1 -3 -7 -8 -12 -12 -12 -12 -12
EBIT 2 -15 6 17 22 62 65 68 70 72
Net Finance Expense -4 -3 -4 -7 -6 -6 -5 -4 -3 -2
Profit before tax -2 -17 2 10 17 56 60 64 67 70
Income tax (expense)/benefi t 0 0 7 -3 -5 -17 -18 -19 -20 -21
Reported NPAT -2 -17 9 7 12 39 42 45 47 49
-30
-20
-10
0
10
20
30
40
50
60
2017
FY18
2018
2019
f
2020
f
2021
f
2022
f
2023
f
2024
f
2025
f
0
10
20
30
40
50
60
70
2018
2019
f
2020
f
2021
f
2022
f
2023
f
2024
f
2025
f
Expenses /tRevenue /tEBITDA /t

Shaw and Partners MMI – Equity Report –03/12/2019–Pg. 15
Other than the growth in production, the main driver of Metro Mining’s profitability will
be movements in the bauxite price and the company’s operating cost performance.
In figure 32 we show our forecast of Metro Mining’s NPAT to percentage movements in
the bauxite price away from our base case forecast, which is largely flat at around US$50/t
(CBIX). Every 5% move on the bauxite price is worth around A$10m to NPAT.
Figure 32: Metro Mining NPAT sensitivity to bauxite price (A$m)
Source: Company reports, Shaw and Partners analysis
Metro Mining is already showing leverage to volume in its quarterly cost performance.
Costs in 3Q19 dropped to A$40.4/t from A$46.4/t in the previous quarter as production
increased from 880kt to 1,420kt.
Figure 33: Metro Mining operating costs (A$/t) - historic Figure 34: Metro Mining operating cost (A$/t) - forecast
Source: Company reports, Shaw and Partners analysis Source: Company reports, Shaw and Partners analysis
-30
-20
-10
0
10
20
30
40
50
60
70
80
2017 FY18 2018 2019f 2020f 2021f 2022f
+15%
+10%
+5%
basecase
-5%
-10%
-15%
0
10
20
30
40
50
60
1Q18
2Q18
3Q18
4Q18
1Q19
2Q19
3Q19
0
5
10
15
20
25
30
35
40
45
50
2018 2019f 2020f 2021f 2022f 2023f 2024f 2025f

Shaw and Partners MMI – Equity Report –03/12/2019–Pg. 16
Balance sheet Metro Mining has modest levels of debt – A$44m gross debt and A$33m of net debt at 30-
Jun-2019. Metro Mining’s cash flow is second half weighted due to the lack of production
in the March quarter and so we expect net debt to reduce to A$18m at year end 2019.
The expansion to 6.0Mt is being funded by a $47.5m loan facility from the Northern
Australia Infrastructure Facility (NAIF) which is in the process of being finalised. We expect
net debt to peak at A$61m at the end of 2020 which would leave the company with
gearing of 29%. We consider that level of gearing too high for a single asset, single
commodity company, but it is manageable and is likely to be paid down relatively quickly.
Even with the assumption that dividends will commence in 2021, the company is likely to
be debt free by 2025.
Figure 35: Metro Mining Balance Sheet (A$m)
Source: Company reports, Shaw and Partners analysis
Figure 36: Net debt & gearing (%) Figure 37: Capex (A$m)
Source: Company reports, Shaw and Partners analysis Source: Company reports, Shaw and Partners analysis
BALANCE SHEET (A$m) 2017 FY18 2018 2019f 2020f 2021f 2022f 2023f 2024f 2025f
Cash and cash equiva lents 15 23 23 24 11 33 35 39 35 34
Trade and other receivables 1 12 21 43 48 69 70 72 74 75
Inventories 0 2 2 5 6 9 9 9 9 9
Other 0 8 7 7 7 7 7 7 7 7
Total current assets 16 45 53 79 72 118 121 127 125 126
Property, plant and equipment 77 137 139 142 195 187 189 191 193 196
Exploration and evaluation expenditure 7 2 2 2 2 2 2 2 2 2
Deferred tax assets 2 0 7 7 7 7 7 7 7 7
Total non-current assets 86 139 148 151 204 196 198 200 202 205
TOTAL ASSETS 102 184 201 230 276 313 319 327 328 330
Trade and other payables 5 16 20 39 44 55 57 58 59 60
Lease l iabi l i ties 0 3 3 3 3 3 3 3 3 3
Provis ions 15 8 9 9 9 9 9 9 9 9
Total current liabilities 20 27 32 51 55 67 68 69 71 72
Borrowings 0 29 31 34 64 64 54 44 24 4
Total non-current liabilities 1 38 39 43 73 73 63 53 33 13
TOTAL LIABILITIES 21 65 71 94 128 140 131 122 103 84
NET ASSETS 81 119 129 137 148 174 188 205 224 246
Net Debt 0 14 16 18 61 39 28 13 -3 -21
Gearing (ND/ND+E) 0% 11% 11% 12% 29% 18% 13% 6% -1% -10%
-10.0%
0.0%
10.0%
20.0%
30.0%
40.0%
50.0%
-30
-20
-10
0
10
20
30
40
50
60
70
2017
FY1
8
2018
2019
f
2020
f
2021
f
2022
f
2023
f
2024
f
2025
f
Net Debt (A$m)
ND/ND+E (%)
0
10
20
30
40
50
60
20
17
FY1
8
20
18
20
19
f
20
20
f
20
21
f
20
22
f
20
23
f
20
24
f
20
25
f

Shaw and Partners MMI – Equity Report –03/12/2019–Pg. 17
Cash flow and Dividends In our view, the chart which best summarises the upside for investors in Metro Mining is
the free cash flow chart. Although the company is expected to be free cash positive in
2019, it is not until after the expansion is funded in 2020 that the free cash flow picture
begins to look highly attractive in 2021. If our projections are accurate, Metro Mining will
be trading on a free cash flow yield in excess of 25% at the current share price. In reality,
we expect substantial share price appreciation to reflect the cash generation.
The free cash flow will initially be used for debt reduction, but at this stage we anticipate
that Metro Mining will pay its maiden dividend in 2021. We assume a total dividend of
A$0.02ps.
Post the expansion, we are assuming a dividend payout ratio of 60% which equates to an
annual dividend of A$0.02ps which we assume will be equally split 1H/2H. At the current
share price, that equates to a dividend yield of 15%.
Figure 38: Metro Mining cash flow (A$m)
Source: Company reports, Shaw and Partners analysis
Figure 39: Free cash flow (A$m) Figure 40: Dividends and yield (A$ps, %)
Source: Company reports, Shaw and Partners analysis Source: Company reports, Shaw and Partners analysis
CASH FLOW (AS$m) 2017 FY18 2018 2019f 2020f 2021f 2022f 2023f 2024f 2025f
Operating activities
Receipts from customers 0 18 84 194 218 313 321 328 336 344
Payments to suppl iers and employees -4 -23 -80 -170 -188 -239 -244 -249 -254 -259
Income taxes paid 0 0 0 0 0 -5 -17 -18 -19 -20
Net cash flow from operating activities -3 -4 4 18 29 58 60 62 63 65
Investing activities
Payments for PPE 0 -2 -1 -2 -56 -5 -5 -5 -5 -6
Other -53 -53 -3 -11 -10 -10 -10 -10 -10 -10
Net cash flow from investing activities -53 -55 -4 -13 -66 -15 -15 -15 -15 -16
Free cash flow -12 -54 0 5 -37 42 45 47 48 49
Financing activities
Proceeds from borrowings 64 39 0 3 30 0 0 0 0 0
Repayments of borrowings -51 -15 0 0 0 0 -10 -10 -20 -20
Dividends paid 0 0 0 0 0 -14 -28 -28 -28 -28
Other 56 43 0 -7 -6 -7 -6 -5 -4 -3
Net cash flow from financing activities 69 67 0 -4 24 -20 -43 -43 -52 -51
Net increase/(decrease) in cash 13 8 0 1 -13 22 2 4 -4 -2
-60
-40
-20
0
20
40
60
20
17
FY1
8
20
18
20
19
f
20
20
f
20
21
f
20
22
f
20
23
f
20
24
f
20
25
f
0%
2%
4%
6%
8%
10%
12%
14%
16%
18%
0
1
1
2
2
3
2017
FY18
2018
2019
f
2020
f
2021
f
2022
f
2023
f
2024
f
2025
f
Special dividend
2H Dividend
1H Dividend
Yield (%)

Shaw and Partners MMI – Equity Report –03/12/2019–Pg. 18
Valuation Our preferred valuation technique is a discounted cash flow (DCF) valuation with post-tax
operational cash flows discounted at Metro Mining’s weighted average cost of capital of
10%.
We then subtract off net debt, an allowance for rehabilitation obligations, development
assets and corporate costs. The bulk of Metro Mining’s rehabilitation is expensed as it
mines and so is incorporated into our DCF valuation of the operations. Metro Mining has
undeveloped thermal coal resources in the Surat Basin, but we have conservatively
allowed no value for these assets. Metro Mining is in the process of trying to find a buyer
for the coal assets.
Our DCF valuation is $0.30ps and Metro is currently trading at a 50% discount to this
valuation.
Figure 41: DCF valuation Figure 42: WACC
Source: Company reports, Shaw and Partners analysis Source: Company reports, Shaw and Partners analysis
The main valuation sensitivity is to the bauxite price. In figure 43, we outline the Metro
Mining DCF valuation at a range of bauxite prices (held flat real in perpetuity) and the
current spot price of US$51/t.
On our analysis, the current share price is pricing Metro Mining as if the bauxite price
remained at US$45/t in perpetuity. Every US$5/t on the bauxite price adds or subtracts
A$0.14ps to our valuation.
Figure 43: Metro Mining DCF Valuation sensitivity to bauxite (A$ps v’s US$/t)
Source: Company reports, Shaw and Partners analysis
Metro Mining Valuation A$m A$ps
Operations 467 0.34
Net debt -18 -0.01
Rehabi l i tation -7 0.00
Development assets 0 0.00
Corporate costs -30 -0.02
Total Valuation 413 0.30
WACC
Risk Free Rate 4.0%
Equity Risk Premium 6.0%
Beta 1.3
Cost of Equity 11.8%
Target Gearing 20%
Cost of Debt 4.0%
Tax Rate 30%
WACC 10.0%
0.00
0.10
0.20
0.30
0.40
0.50
0.60
Shaw US$40/t US$45/t US$50/t US$55/t US$60/t spot
Current share price

Shaw and Partners MMI – Equity Report –03/12/2019–Pg. 19
Key risks As a small mining company with exposure to a single commodity and a single project, we
consider an investment in Metro Mining to be high risk. The key risks include;
Commodity prices are driven by global growth and the markets expectations of growth. In the current geo-political climate there are numerous risks to global growth expectations which have largely been downgraded in the past two years. Issues such as the US-China strategic and trade war and Brexit may dampen global growth, and hence commodity prices.
Metro Mining is operating in a region that is exposed to cyclone activity. There are risks that severe storms could damage and incapacitate mining, barge and/or transhipping activities. Metro Mining mitigates these risks by not operating during the March quarter.
The bauxite market is currently modestly over-supplied due to the strong growth from Guinea which is backed by Chinese investment. There is a risk that MMI will not be able to sell its expanded production, or be forced to discount the price.
The aluminium market is currently depressed globally and many smelters are assessing their viability. Further capacity closures will impact demand for alumina and bauxite.
Metro Mining is expanding its operation from 3.5Mt to 6.0Mt. The mining and barging component of the expansion is straight-forward, but MMI is intending to use a Floating Terminal (FT) to load ocean going vessels. There are design and operating risks with the FT. It may cost more than expected to build, and it may not operate as expected.
Forecasting future commodity prices and operating costs has considerable uncertainty. Our forecasts may prove to be too optimistic on both. If bauxite prices do not remain at around U$50/t and/or Metro Mining’s costs increase faster than we expect then our cash flow forecasts will be too high.
Smaller companies carry more significant ‘key personnel’ risk than larger organisations. If senior management depart the company then it could delay projects or exacerbate operational risks.

Shaw and Partners MMI – Equity Report –03/12/2019–Pg. 20
Appendix: Key Personnel
Board of Directors
Stephen Everett | Chairman
A graduate of chemical engineering from UNSW has more than 40 years Board and
Management experience in the resources and construction industries both in Australia
and overseas. Mr Everett's vast management experience includes production and project
management, marketing, corporate restructuring, debt/equity financing and government
relations. His senior executive positions have included Managing Director and Chief
Executive Officer of private and publicly listed companies. Mr Everett was formerly
Chairman of BeMaX Resources NL, Australian Solomons Gold Limited. JMS Civil and Mining
Pty Ltd and IronRidge Resources Limited.
Simon Finnis | Managing Director & CEO
Mr Finnis is an experienced Executive with a 30 year career in underground and open cut
mining. Joining Metro as CEO in January 2015, he was appointed to the Board in January
2017. Prior to joining the company Mr Finnis was CEO of Grand Cote Operations in
Senegal. Previous roles held by Mr Finnis have included Managing Director of Global
Resources Corporation Limited and Chief Operating Officer for the redevelopment of the
Gold Ridge Mine in the Solomon Islands. Mr Finnis has extensive experience through
feasibility, construction and commissioning of both new and brown fields' operations.
Mark Sawyer | Non-Executive Director
Mr Sawyer is Senior Partner at Greenstone Capital LLP and co-founder of Greenstone
Resources LP private equity fund. Mr Sawyer co-founded Greenstone in 2013 after a 19
year career in the mining sector including as co-head of group business development at
Xstrata plc, and senior roles at Rio Tinto plc and Cutfield Freeman & Co Ltd. Mr Sawyer,
together with Greenstone's co-founder, oversees all aspects of the management of the
business. He serves as a Director of Greenstone Management Ltd, the fund's General
Partner and is a member and co-Chair of the Investment Committee.
Fiona Murdoch | Independent Non-Executive Director
Ms Murdoch has 28+ years experience in the resources and infrastructure sectors in
Australia and Internationally with senior operational roles held with AMCI Investments,
MIM Holdings and Xstrata Queensland. Currently, Ms Murdoch serves as a Non-Executive
Director for KGL Resources Ltd as well as Chair of KGL’s Risk and Audit Committee. In
addition, Ms Murdoch serves on the Board of Building Queensland and on the Joint
Venture Committee for the West Pilbara Iron Ore Project. She is also a Director of
metallurgical services company, Core Resources and its subsidiary Toowong Process. Ms
Murdoch has an MBA and Honours Degree in Law.
Philip Hennessy | Independent Non-Executive Director
With a Bachelor of Business and 30+ years corporate experience Mr Hennessy has been
involved with all aspects of corporate financing and company reconstruction in a variety of
industries including construction, manufacturing, mining, professional & financial services
and was KPMG Qld Chair for 13 years. He is an Independent Company Director & Advisor
serving on public & private boards across the resources, financial services, property &
manufacturing sectors and is a Director of Proton Therapy Australia. Mr Hennessy's
knowledge & experience aids Metro in driving good governance, cohesive & effective
collaboration and effective processes & communications with shareholders &
stakeholders.

Shaw and Partners MMI – Equity Report –03/12/2019–Pg. 21
Executive Team
Simon Finnis | Managing Director & CEO
Mr Finnis is an experienced Executive with a 30 year career in underground and open cut
mining. Joining Metro as CEO in January 2015, he was appointed to the Board in January
2017. Prior to joining the company Mr Finnis was CEO of Grand Cote Operations in
Senegal. Previous roles held by Mr Finnis have included Managing Director of Global
Resources Corporation Limited and Chief Operating Officer for the redevelopment of the
Gold Ridge Mine in the Solomon Islands. Mr Finnis has extensive experience through
feasibility, construction and commissioning of both new and brown fields' operations.
Duane Woodbury | Chief Financial Officer
Duane holds a Bachelor of Economics (Honours) Accounting & Finance from Macquarie
University and is an Associate of CPA. Duane has 25+ years’ experience in the Resource
Industry with comprehensive resources knowledge gained through many years working
nationally and internationally in various roles including analyst, broker, banker and CFO.
Duane was previously CFO of ASX listed company Kingsgate and has held senior roles with
Macquarie Bank in New York and Sydney. Due to Duane's international experience, having
worked in the UK, USA and Asia, he also has extensive regulatory experience with the LSE,
NYSE, SGX, and HKSE.
Graham Tanner | General Manager Bauxite Hills Mine
Graham is a multi-skilled mining and processing professional with over 25 years’
experience in the mining industry having held senior roles working in Western Australia,
Northern Territory, Eastern Australia and West Africa.
Graham is responsible for all aspects of the mine’s operations and has proven experience
in achieving optimum outcomes particularly in the areas of quality performance and
safety. Graham is very experienced in fostering safe working environs and the
integration of health and safety into all aspects of work practices, ensuring individuals are
focused on safety and the creation of safety focused work places.
Mitchell Petrie | Company Secretary
Mitchell is a Chartered Accountant with a Bachelor of Commerce. Until end 2015, Mitchell
was a Partner at KPMG, where he headed up the Queensland Risk Advisory practice.
Mitchell has provided assurance and advisory services to many National and International
participants in the Resource Industry including leadership of the co-sourced assurance
services team to Rio Tinto. Mitchell also brings extensive experience in providing services
to publicly listed companies and is currently an adjunct lecturer at the Bond University
Business School as well as being a member of a number of Governing Boards and
Committees in the Public and Private Sector.
Mike O’Brien | Project Director
Mike holds a B.Sc. (Min)(Eng) from the University of Witwatersrand and has a 35 year
mining & minerals background including 25+ years extensive management experience
with multinational companies Shell Coal and Anglo coal (subsidiary of Anglo American).
Mike has worked in operational roles including GM of both a large underground longwall
mine and a large opencast mine that included a CSG operation. He's also held senior
corporate positions such as GM of Shell Coal's technical group which included
responsibility for mining, geological and engineering development.
Mike brings broad industry knowledge and expertise in strategic planning, underpinned by
strong skills in operations management and technical evaluation, to the company.

Shaw and Partners MMI – Equity Report –03/12/2019–Pg. 22
Rating Classification
Buy Expected to outperform the overall market
Hold Expected to perform in line with the overall market
Sell Expected to underperform the overall market
Not Rated Shaw has issued a factual note on the company but does not have a recommendation
Risk Rating
High Higher risk than the overall market – investors should be aware this stock may be speculative
Medium Risk broadly in line with the overall market
Low Lower risk than the overall market
RISK STATEMENT: Where a company is designated as ‘High’ risk, this means that the analyst has determined that the risk profile for this company is
significantly higher than for the market as a whole, and so may not suit all investors. Clients should make an assessment as to whether this stock
and its potential price volatility is compatible with their financial objectives. Clients should discuss this stock with their Shaw adviser before making
any investment decision.
Disclaimer
Shaw and Partners Limited ABN 24 003 221 583 (“Shaw”) is a Participant of ASX Limited, Chi-X Australia Pty Limited and holder of Australian Financial Services Licence number 236048. ANALYST CERTIFICATION: The Research Analyst who prepared this report hereby certifies that the views expressed in this document accurately reflect the analyst's personal views about the Company and its financial products. The Research Analyst has not been, is not, and will not be receiving direct or indirect compensation for expressing the specific recommendations or views in this report. As at the date of this report the Research Analyst does not have an interest in the financial products of the Company. DISCLAIMER: This report is published by Shaw to its clients by way of general, as opposed to personal, advice. This means it has been prepared for multiple distribution without consideration of your investment objectives, financial situation and needs (“personal circumstances”). Accordingly, the advice given is not a recommendation that a particular course of action is suitable for you and the advice is therefore not to be acted on as investment advice. You must assess whether or not the advice is appropriate for your personal circumstances before making any investment decisions. You can either make this assessment yourself, or if you require a personal recommendation, you can seek the assistance of your Shaw client adviser. This report is provided to you on the condition that it not be copied, either in whole or in part, distributed to or disclosed to any other person. If you are not the intended recipient, you should destroy the report and advise Shaw that you have done so. This report is published by Shaw in good faith based on the facts known to it at the time of its preparation and does not purport to contain all relevant information with respect to the financial products to which it relates. Although the report is based on information obtained from sources believed to be reliable, Shaw does not make any representation or warranty that it is accurate, complete or up to date and Shaw accepts no obligation to correct or update the information or opinions in it. If you rely on this report, you do so at your own risk. Any projections are estimates only and may not be realised in the future. Except to the extent that liability under any law cannot be excluded, Shaw disclaims liability for all loss or damage arising as a result of any opinion, advice, recommendation, representation or information expressly or impliedly published in or in relation to this report notwithstanding any error or omission including negligence. This publication has been prepared in accordance with Shaw’s Research Policy. A copy of the Policy can be found at www.shawandpartners.com.au. DISCLOSURE: Shaw will charge commission in relation to client transactions in financial products and Shaw client advisers will receive a share of that commission. Shaw, its authorised representatives, its associates and their respective officers and employees may have earned previously, or may in the future earn fees and commission from dealing in the Company's financial products.