metro regional transit authority - ohio auditor · pdf filemetro regional transit authority...
TRANSCRIPT

METRO REGIONAL
TRANSIT AUTHORITY
AUDIT REPORT
For the year ended December 31, 2013


88EastBroadStreet,FifthFloor,Columbus,Ohio43215‐3506Phone:614‐466‐4514or800‐282‐0370Fax:614‐466‐4490
www.ohioauditor.gov
Board of Trustees Metro Regional Transit Authority 416 Kenmore Blvd. Akron, Ohio 44301 We have reviewed the Independent Auditors’ Report of the Metro Regional Transit Authority, Summit County, prepared by Charles E. Harris & Associates, Inc., for the audit period January 1, 2013 through December 31, 2013. Based upon this review, we have accepted these reports in lieu of the audit required by Section 117.11, Revised Code. The Auditor of State did not audit the accompanying financial statements and, accordingly, we are unable to express, and do not express an opinion on them. Our review was made in reference to the applicable sections of legislative criteria, as reflected by the Ohio Constitution, and the Revised Code, policies, procedures and guidelines of the Auditor of State, regulations and grant requirements. The Metro Regional Transit Authority is responsible for compliance with these laws and regulations. Dave Yost Auditor of State July 21, 2014

This page intentionally left blank.

- i -
Metro Regional Transit Authority SUMMIT COUNTY, OHIO
AUDIT REPORT For the Year Ended December 31, 2013
TABLE OF CONTENTS
Title Page Schedule of Federal Awards Expenditures 1 Notes to the Schedule of Federal Awards Expenditures 2 Independent Auditors’ Report on Internal Control Over Financial Reporting and on Compliance and Other Matters Required by Government Auditing Standards 3-4 Independent Auditors’ Report on Compliance with Requirements Applicable to Each Major Program and on Internal Control Over Compliance Required by OMB Circular A-133 5-7 Schedule of Findings 8 Schedule of Prior Audit Findings 9

This page intentionally left blank.

Metro Regional Transit AuthoritySchedule of Federal Awards ExpendituresFor the Year Ended December 31, 2013
Federal Grantor/Pass Through Grantor Grant CFDA Program Program Title Number Number Expenditures
U.S. Department of TransportationFederal Transit Administration: Direct Programs:
Federal Transit Cluster Urbanized Area Formula Grants OH-90-X761 20.507 1,000,000$
OH-90-X784 20.507 8,616,000 Formula Grants - AVL for fixed route service OH-95-X145 20.507 119,557
OH-95-X128 20.507 652,064
10,387,621
Capital Investment Grants OH-04-0086 20.500 3,472,000
Total Federal Transit Cluster 13,859,621
Alternatives Analysis Project Grant OH-39-0006 20.522 197,591
Job Access-Reverse Commute Grant OH-37-X065 20.516 8,005 OH-37-X100 20.516 59,736
Total Job Access-Reverse Commute Grant 67,741
Total Federal Transit Administration - Direct Programs 14,124,953
Federal Highway Administration: Passed through Ohio Department of Transportation (ODOT):
Ohio Rail Development Commission (ORDC) - Railroad crossing protection grant NA 20.205 361,967
Total Federal Highway Administration - Passed through ODOT 361,967
Total Federal Financial Assistance 14,486,920$
See accompanying Notes to the Schedule of Federal Awards Expenditures
1

2
Metro Regional Transit Authority
Notes to the Schedule of Federal Awards Expenditures For the Year Ended December 31, 2013
1. General
The accompanying schedule of federal awards expenditures is a summary of the activity of Metro Regional Transit Authority’s federal awards programs. The schedule has been prepared on the accrual basis of accounting.
2. Matching Requirements
Certain federal programs require that the Board contribute non-federal funds (matching funds) to support the federally-funded programs. The expenditure of non-federal funds are not included on this schedule.

3
Rockefeller Building 614 W Superior Ave Ste 1242 Cleveland OH 44113-1306
Charles E. Harris & Associates, Inc. Office phone - (216) 575-1630 Certified Public Accountants Fax - (216) 436-2411
INDEPENDENT AUDITORS’ REPORT ON INTERNAL CONTROL OVER FINANCIAL REPORTING AND ON COMPLIANCE AND OTHER MATTERS
REQUIRED BY GOVERNMENT AUDITING STANDARDS Metro Regional Transit Authority Summit County 416 Kenmore Blvd. Akron, Ohio 44301 To the Board of Trustees: We have audited, in accordance with auditing standards generally accepted in the United States and the Comptroller General of the United States’ Government Auditing Standards, the financial statements of the Metro Regional Transit Authority, Summit County, (the Authority) as of and for the year ended December 31, 2013 and 2012, and the related notes to the financial statements, and have issued our report thereon dated May 14, 2014.
Internal Control Over Financial Reporting As part of our financial statement audit, we considered the Authority’s internal control over financial reporting (internal control) to determine the audit procedures appropriate in the circumstances to the extent necessary to support our opinions on the financial statements, but not to the extent necessary to opine on the effectiveness of the Authority’s internal control. Accordingly, we have not opined on it. A deficiency in internal control exists when the design or operation of a control does not allow management or employees, when performing their assigned functions, to prevent, or detect and timely correct misstatements. A material weakness is a deficiency, or combination of internal control deficiencies resulting in a reasonable possibility that internal control will not prevent or detect and timely correct a material misstatement of the Authority’s financial statements. A significant deficiency is a deficiency, or a combination of deficiencies, in internal control that is less severe than a material weakness, yet important enough to merit attention by those charged with governance. Our consideration of internal control was for the limited purpose described in the first paragraph of this section and was not designed to identify all internal control deficiencies that might be material weaknesses or significant deficiencies. Given these limitations, we did not identify any deficiencies in internal control that we consider material weaknesses. However, unidentified material weaknesses may exist. Compliance and Other Matters
As part of reasonably assuring whether the Authority’s financial statements are free of material misstatement, we tested its compliance with certain provisions of laws, regulations, contracts, and grant agreements, noncompliance with which could directly and materially affect the determination of financial statement amounts. However, opining on compliance with those provisions was not an objective of our audit and accordingly, we do not express an opinion. The results of our tests disclosed no instances of noncompliance or other matters we must report under Government Auditing Standards.

4
Metro Regional Transit Authority, Summit County Independent Auditors’ Report on Internal Control over Financial Reporting and on Compliance and Other Matters Required by Government Auditing Standards Page 2 Purpose of this Report
This report only describes the scope of our internal control and compliance testing and our testing results, and does not opine on the effectiveness of the Authority’s internal control or on compliance. This report is an integral part of an audit performed under Government Auditing Standards in considering the Authority’s internal control and compliance. Accordingly, this communication is not suitable for any other purpose.
Charles E. Harris & Associates, Inc. May 14, 2014
5
Rockefeller Building 614 W Superior Ave Ste 1242 Cleveland OH 44113-1306
Charles E. Harris & Associates, Inc. Office phone - (216) 575-1630 Certified Public Accountants Fax - (216) 436-2411
INDEPENDENT AUDITORS’ REPORT ON COMPLIANCE WITH REQUIREMENTS
APPLICABLE TO EACH MAJOR FEDERAL PROGRAM AND ON INTERNAL CONTROL OVER COMPLIANCE REQUIRED BY OMB CIRCULAR A-133
Metro Regional Transit Authority Summit County 416 Kenmore Blvd. Akron, Ohio 44301 To the Board of Trustees:
Report on Compliance for Each Major Federal Program
We have audited the Metro Regional Transit Authority’s (the Authority) compliance with the applicable requirements described in the U.S. Office of Management and Budget (OMB) Circular A-133, Compliance Supplement that could directly and materially affect the Authority’s major federal program for the year ended December 31, 2013. The Summary of Auditor’s Results in the accompanying schedule of findings identifies the Authority’s major federal program. Management’s Responsibility The Authority’s management is responsible for complying with the requirements of laws, regulations, contracts, and grants applicable to its federal program. Auditor’s Responsibility Our responsibility is to opine on the Authority’s compliance for the Authority’s major federal program based on our audit of the applicable compliance requirements referred to above. Our compliance audit followed auditing standards generally accepted in the United States of America; the standards for financial audits included in the Comptroller General of the United States’ Government Auditing Standards; and OMB Circular A-133, Audits of States, Local Governments, and Non-Profit Organizations. These standards and OMB Circular A-133 require us to plan and perform the audit to reasonably assure whether noncompliance with the applicable compliance requirements referred to above that could directly and materially affect a major federal program occurred. An audit includes examining, on a test basis, evidence about the Authority’s compliance with those requirements and performing such other procedures as we considered necessary in the circumstances. We believe our audit provides a reasonable basis for our compliance opinion on the Authority’s major program. However, our audit does not provide a legal determination of the Authority’s compliance. Opinion on Each Major Federal Program In our opinion, the Metro Regional Transit Authority complied, in all material respects with the compliance requirements referred to above that could directly and materially affect its major federal program for the year ended December 31, 2013.

6
Metro Regional Transit Authority, Summit County Independent Auditors’ Report on Compliance with Requirements Applicable to Each Major Federal Program and on Internal Control Over Compliance Required by OMB Circular A-133 Page 2 Report on Internal Control Over Compliance
The Authority’s management is responsible for establishing and maintaining effective internal control over compliance with the applicable compliance requirements referred to above. In planning and performing our compliance audit, we considered the Authority’s internal control over compliance with the applicable requirements that could directly and materially affect a major federal program, to determine our auditing procedures appropriate for opining on each major federal program’s compliance and to test and report on internal control over compliance in accordance with OMB Circular A-133, but not to the extent needed to opine on the effectiveness of internal control over compliance. Accordingly, we have not opined on the effectiveness of the Authority’s internal control over compliance. A deficiency in internal control over compliance exists when the design or operation of a control over compliance does not allow management or employees, when performing their assigned functions, to prevent, or to timely detect and correct, noncompliance with a federal program’s applicable compliance requirement. A material weakness in internal control over compliance is a deficiency, or combination of deficiencies, in internal control over compliance, such that there is a reasonable possibility that material noncompliance with a federal program compliance requirement will not be prevented, or timely detected and corrected. A significant deficiency in internal control over compliance is a deficiency, or a combination of deficiencies, in internal control over compliance with a federal program’s applicable compliance requirement that is less severe than a material weakness in internal control over compliance, yet important enough to merit attention by those
charged with governance. Our consideration of internal control over compliance was for the limited purpose described in the first paragraph of this section and would not necessarily identify all deficiencies in internal control over compliance that might be material weaknesses or significant deficiencies. We did not identify any deficiencies in internal control over compliance that we consider to be material weaknesses.
However, material weaknesses may
exist that have not been identified.
This report only describes the scope of our internal control compliance tests and the results of this testing based on OMB Circular A-133 requirements. Accordingly, this report is not suitable for any other purpose.

7
Metro Regional Transit Authority, Summit County Independent Auditors’ Report on Compliance with Requirements Applicable to Each Major Federal Program and on Internal Control Over Compliance Required by OMB Circular A-133 Page 3 Report on Federal Expenditures Schedule
We have also audited the financial statements of the Metro Regional Transit Authority, Summit County (the Authority) as of and for the year ended December 31, 2013 and the related notes to the financial statements, which collectively comprise the Authority’s basic financial statements. We issued our report thereon dated May 14, 2014. We conducted our audit to opine on the Authority’s basic financial statements. The accompanying federal awards expenditures schedule presents additional analysis required by the U.S. Office of Management and Budget Circular A-133, Audits of States, Local Governments, and Non-Profit Organizations and is not a required part of basic financial statements. The Schedule is management’s responsibility, and was derived from and relates directly to the underlying accounting and other records management used to prepare the basic financial statements. We subjected this schedule to the auditing procedures we applied to the basic financial statements. We also applied certain additional procedures, including comparing and reconciling this schedule directly to the underlying accounting and other records used to prepare the basic financial statements or to the basic financial statements themselves, in accordance with auditing standards generally accepted in the United States of America. In our opinion, this schedule is fairly stated, in all material respects, in relation to the basic financial statements taken as a whole.
Charles E. Harris & Associates, Inc. May 14, 2014

SCHEDULE OF FINDINGS OMB CIRCULAR A-133 SECTION .505
METRO REGIONAL TRANSIT AUTHORITYSUMMIT COUNTY
DECEMBER 31, 2013
1. SUMMARY OF AUDITOR'S RESULTS
(d)(1)(i) Type of Financial Statement Unmodified
Opinion
(d)(1)(ii) Were there any material control No
weaknesses reported at
the financial statement level
(GAGAS)?
(d)(1)(ii) Were there any significant No
deficiencies reported at the financial
statement level (GAGAS)?
(d)(1)(iii) Was there any reported material No
non-compliance at the financial
statement level (GAGAS)?
(d)(1)(iv) Were there any material internal No
control weaknesses
reported for major federal
programs?
(d)(1)(iv) Were there any significant No
deficiencies reported for major
federal programs?
(d)(1)(v) Type of Major Programs' Unmodified
Compliance Opinion
(d)(1)(vi) Are there any reportable findings No
under Section .510
(d)(1)(vii) Major Programs: Federal Transit Administration:
Federal Transit Cluster -
Capital Investment Grants CFDA #20.500
Urbanized Area Formula CFDA #20.507
(d)(1)(viii) Dollar Threshold: Type A\B Type A: > $434,608
Programs Type B: all others
(d)(1)(ix) Low Risk Auditee? Yes
2. FINDINGS RELATED TO THE FINANCIAL STATEMENTSREQUIRED TO BE REPORTED IN ACCORDANCE WITH GAGAS
3. FINDINGS FOR FEDERAL AWARDS
None
None
8

9
METRO REGIONAL TRANSIT AUTHORITY SUMMIT COUNTY, OHIO
December 31, 2013
SCHEDULE OF PRIOR AUDIT FINDINGS
The prior audit report, for the year ending December 31, 2012, reported no material citations or recommendations.

This page intentionally left blank.

Comprehensive Annual Financial Report
SUMMIT COUNTY416 Kenmore Blvd. • Akron, Ohio • 44301
for the fiscal years ending December 31, 2013 & 2012

This page intentionally left blank.

METRO Regional Transit Authority
COMPREHENSIVE ANNUAL FINANCIAL REPORT
For the Fiscal Year Ended December 31, 2013 and 2012
Saundra M. Foster Richard M. Enty President, Executive Director/ Board of Trustees Secretary-Treasurer
Prepared by:
The General Administration Department Dean J. Harris, CPA
Director of Finance/Assistant Secretary-Treasurer
Summit County, Ohio

This page intentionally left blank.

METRO Regional Transit Authority
COMPREHENSIVE ANNUAL FINANCIAL REPORT For the Fiscal Year Ended December 31, 2013 and 2012
TABLE OF CONTENTS PAGE
Introductory Section
Letter of Transmittal . . . . . . . . . . . . . . . . . . . . . . . . . . . . . . . . 1 Certificate of Achievement Award in Financial Reporting . . . . . . . . . . . . 3 Board of Trustees and Administration . . . . . . . . . . . . . . . . . . . . . . . 4 Organization Chart . . . . . . . . . . . . . . . . . . . . . . . . . . . . . . . . . 5 Reporting Entity . . . . . . . . . . . . . . . . . . . . . . . . . . . . . . . . . . 7 Economic Condition and Outlook . . . . . . . . . . . . . . . . . . . . . . . . . 8 Major Initiatives. . . . . . . . . . . . . . . . . . . . . . . . . . . . . . . . . . . 9 Financial Information . . . . . . . . . . . . . . . . . . . . . . . . . . . . . . . . 10 Other Information . . . . . . . . . . . . . . . . . . . . . . . . . . . . . . . . . . 13
Financial Section Independent Auditors’ Report . . . . . . . . . . . . . . . . . . . . . . . . . . . 15 Management Discussion and Analysis . . . . . . . . . . . . . . . . . . . . . . . 17 Financial Statements: Statement of Net Position . . . . . . . . . . . . . . . . . . . . . . . . . . 23 Statement of Revenues, Expenses and Changes in Net Position . . . . . . 25 Statement of Cash Flows . . . . . . . . . . . . . . . . . . . . . . . . . . 26 Notes to Financial Statements . . . . . . . . . . . . . . . . . . . . . . . 27
Statistical Section Financial Trend Information Net Position by Component . . . . . . . . . . . . . . . . . . . . . . . . . . . . 45 Changes in Net Position . . . . . . . . . . . . . . . . . . . . . . . . . . . . . . 46 Revenues and Operating Assistance Comparison to Industry Trend Data . . . . . . . . . . . . . . . . . . . . 48 Operating Expenses – Comparison to Industry Trend Data . . . . . . . . . . . . . . . . . . . . . 49 Passenger Fares vs. Operating Expenses (Graph) . . . . . . . . . . . . . . . . . . 50 Sales Tax – Comparison to other Regional Transit Authorities in Ohio . . . . . . . . . . . . . . . . . . . . . . . . . . . . . . . . . . . 51
i

TABLE OF CONTENTS (continued) PAGE Revenue Capacity Information Revenues by Source . . . . . . . . . . . . . . . . . . . . . . . . . . . . . . . . 52 Revenues by Source (Graph) . . . . . . . . . . . . . . . . . . . . . . . . . . . . 53 Expenses by Object Class . . . . . . . . . . . . . . . . . . . . . . . . . . . . . 54 Debt Capacity Information Debt Service . . . . . . . . . . . . . . . . . . . . . . . . . . . . . . . . . . . . . 55 Demographic and Economic Information Demographic Statistics . . . . . . . . . . . . . . . . . . . . . . . . . . . . . . 56 Personal Income (Graph) . . . . . . . . . . . . . . . . . . . . . . . . . . . . . . 57 Largest Employers . . . . . . . . . . . . . . . . . . . . . . . . . . . . . . . . . 58 Operating Information Operating Statistics . . . . . . . . . . . . . . . . . . . . . . . . . . . . . . . . . 59 Fare Rate Structure . . . . . . . . . . . . . . . . . . . . . . . . . . . . . . . . . 61 Miscellaneous Statistics . . . . . . . . . . . . . . . . . . . . . . . . . . . . . . . 62
ii

This Page Left Intentionally Blank
iii

This page intentionally left blank.

Introductory Section

This page intentionally left blank.
Introductory Section – 2013
The Introductory Section includes the Authority’s transmittal letter, the Certificate of Achievement for Excellence in Financial Reporting, and a Reporting Entity Profile.

This page intentionally left blank.

May 14, 2014
Saundra Foster, President, and Members, Board of Trustees METRO Regional Transit Authority and Residents of Summit County, Ohio:
It is a pleasure to submit to you the Comprehensive Annual Financial Report (CAFR) of the METRO Regional Transit Authority (“METRO” or “Authority”) for the fiscal year ended December 31, 2013. This report was prepared by the Finance Department of the METRO Regional Transit Authority and represents METRO’s commitment to provide accurate, concise and high-quality financial information to the Board of Trustees, interested parties and residents in METRO’s service area.
This report contains financial statements and statistical data which provide full disclosure of all of METRO’s material financial operations. The financial statements, supplemental schedules, statistical information, and all data contained herein are the representations of METRO’s management. METRO’s management bears the responsibility for the accuracy, completeness and fairness of this report. For a summary of financial activities, please review the management’s discussion and analysis located in the financial section should be reviewed. This report is indicative of METRO’s commitment to provide accurate, concise and high quality financial information to the residents of this area and to all other interested parties.
1
The Government of Finance Officers Association of the United States and Canada (GFOA) awarded a Certificate of Achievement for Excellence in Financial Reporting to METRO Regional Transit Authority for its comprehensive annual financial report for the fiscal year ended December 31, 2012. This was the thirteenth consecutive year

The Government of Finance Officers Association of the United States and Canada (GFOA) awarded a Certificate of Achievement for Excellence in Financial Reporting to METRO Regional Transit Authority for its comprehensive annual financial report for the fiscal year ended December 31, 2012. This was the thirteenth consecutive year that METRO has achieved this prestigious award. In order to be awarded a Certificate of Achievement, a government unit must publish an easily readable and efficiently organized comprehensive annual financial report. This report must satisfy both generally accepted accounting principles and applicable legal requirements. A Certificate of Achievement is valid for a period of one year only. We believe that our current comprehensive annual financial report continues to meet the Certificate of Achievement Program’s requirements and we are submitting it to the GFOA to determine its eligibility for another certificate. This report would not have been possible without the determination and high standards of the entire staff of the Accounting Department. METRO wishes to thank all who contributed to this project.
Richard M. Enty, Dean J. Harris, Executive Director/ Director of Finance Secretary-Treasurer Assistant Secretary-Treasurer
2

3

METRO Regional Transit Authority
Board of Trustees and Administration as of December 31, 2013
Members of the Board of Trustees
Representing the City of Akron
Bernard Bear Elizabeth Britton
Saundra M. Foster Renee Greene Jack Hefner
James D. Switzer
Representing the County of Summit
Heather Heslop Licata Scott C. Meyer Dave Prentice
Representing the City of Barberton
Craig Megyes
Representing the City of Cuyahoga Falls
Stephan Kremer
Representing the City of Stow
William Lutz
Administration
Richard M. Enty, Executive Director/Secretary-Treasurer Dean J. Harris, Director of Finance/Assistant Secretary-Treasurer
Dehavilland McCall, Director of Operations James Miller, Director of Maintenance
Christine Hoffer, Director of Human Resources Molly Becker, Director of Communication & Marketing
Bambi Miller, Director of Customer Service Kris Liljeblad, Director of Planning
Mark Pry, Director of Safety & Security
4

5

SUMMIT COUNTY, OHIO
Summit County is located in the northeastern portion of the State of Ohio and was named because it was the highest point along the Erie-Ohio canal. The County consists of twenty-two municipalities (cities and villages) and nine townships. The seat of the county government is the City of Akron.
6

REPORTING ENTITY
General
METRO’s reporting entity has been defined in accordance with Governmental Accounting Standards Board (GASB) Statement No. 14. Accordingly, the financial statements contained within this comprehensive annual financial report include only the accounts and transactions of METRO. A discussion of METRO’s reporting entity is included in Note 1 to the financial statements.
METRO was created under Chapter 306 of the Ohio Revised Code by resolution of the City of Akron, Ohio adopted originally in 1969 and amended on January 28, 1991 to transform the three-city transit system to a countywide transit system. METRO’s service area covers 419.92 square miles in Summit County. Express service to downtown Cleveland, Ohio is also provided.
Operations and Funding
Voters approved a ¼ of 1 percent continuous sales and use tax in November 1990 that permitted METRO to expand to a countywide service. In March 2008 the voters approved an additional ¼ of 1 percent continuous sales and use tax to maintain service levels.
Facilities
METRO has six facilities that are located at:
* 416 Kenmore Boulevard - METRO’s main administration and maintenance facility.
* 631 South Broadway – an intermodal facility located in downtown Akron that provides ticket sales and customer information, passenger amenities, and the facility includes a Greyhound terminal. The facility also provides connection to Portage Area Regional Transportation Authority, Stark Area Regional Transit Authority and to the University of Akron’s Roo Express
* 2340 Romig Road –Transfer Center (Southwest Akron) * 465 Ghent Road – James Fisher Park and Ride lot (West Akron) * 2600 Creekside Drive – Park and Ride lot (Twinsburg) * 1280 Independence Avenue – Independence Turn Around (Northwest Akron)
Services
METRO provides fixed route and demand response (SCAT) service in the County of Summit, Ohio and Express Service into downtown Cleveland, Ohio.
Management, Board of Trustees
METRO is managed by a Board of Trustees, which is vested by Ohio law with the powers necessary to manage METRO. The legislation and agreements establishing METRO provide for a twelve-member board serving three-year terms. The Board members are appointed by five different governmental agencies. The City of Akron has six seats, the County of Summit has three, and the cities of Barberton, Cuyahoga Falls and Stow have one each.
7

Administration
The administration of METRO, subject to the policies and supervision of its Board of Trustees, is directed by an Executive Director. The Executive Director is under contract to the Board of Trustees. The Executive Director selects the remaining senior administrative staff. An organizational chart, which depicts the key functional responsibilities, is shown on page 5 of this Introductory Section.
ECONOMIC CONDITION AND OUTLOOK
General
Summit County (METRO’s primary service area) is located in northeast Ohio, and the City of Akron is located near the center of the county and is the county seat. The Primary Akron Metropolitan Statistical Area (PMSA) consists of Summit and Portage Counties. The, 2010 PMSA population was 703,200. Summit County represents 78% of the two counties’ total population.
Summit County is served by diversified transportation facilities. Interstate I-77 runs north and south through the county while I-76 crosses east and west through the county. The Ohio Turnpike crosses the northern portion of the county. A total of five interstate highways, one U.S. highway and seventeen state highways are located in the county. The Summit County unemployment rate for 2013 was 6.9%, compared with a national average of 7.4%. Once known as the “Rubber Capital of the World”, Akron has moved forward into the world of liquid crystal and polymer research, development, and technology. More than 400 companies in the area are at work on one aspect or another of polymers, creating what is now referred to as the “Polymer Valley." The University of Akron supports the industry with both a College of Polymer Engineering and a specialized laboratory and research facility accessible by Akron area business partners. Population
Population in METRO’s principal service area since 1960 has been as follows:
YEAR AKRON SUMMIT COUNTY
1960 290,351 513,569 1970 275,425 553,371 1980 238,177 524,472
1990 223,019 514,990 2000 217,074 542,899 2010 199,110 541,781
8

Employment
The following table shows comparative unemployment statistics for Summit County, the State of Ohio and the United States for the last five years:
Year Summit County Ohio U.S.
2009 9.8% 10.2% 9.3%2010 10.0% 10.1% 9.6%2011 8.5% 8.6% 8.9%2012 6.8% 7.2% 8.1%2013 6.9% 7.3% 7.4%
Average Unemployment Rates (last five years)
MAJOR INITIATIVES
Recent Developments
Highlights of the 2013 year of operations include the following:
* Took delivery of ten 40-foot Gillig CNG buses, thirty-one CNG Paratransit buses and six 60’ New Flyer articulated buses.
* Replaced two bridges on the Sandyville rail line. * Installed 50 trash cans at passenger shelters. * Began the replacement of the bus service and fueling lanes, this project is expected
to be complete in 2014. * Provided 5,189,095 line service passenger trips on METRO. * Provided 239,141 demand response passenger trips on SCAT.
Future Projects METRO continues to implement its current long-range plan. This plan was developed to provide METRO with a strategy for implementing capital and operational projects. The five-year portion of the long-range plan includes: Continue the rehabilitation of the Administration and Maintenance facilities. Replace thirty (30) 40-foot CNG low floor buses. Replace forty-eight (48) Paratransit buses. Install an Automatic Vehicle Location System on line service buses. Construct a new employee parking lot. Construct a new canopy parking area for Paratransit buses.
9

FINANCIAL INFORMATION
Internal Control Structure
The management of METRO is responsible for establishing and maintaining an internal control structure designed to ensure that METRO’s assets are protected from loss, theft, or misuse. Its responsibility is also to ensure that accurate accounting data is compiled to allow for the preparation of financial statements in conformity with accounting principles generally accepted in the United States of America.
In developing and evaluating METRO’s accounting system, emphasis is placed on the adequacy of internal controls. Internal accounting controls are designed to provide reasonable, but not absolute, assurance regarding the protection of assets against loss from unauthorized use or disposition, and the reliability of financial records used to prepare financial statements. The concept of “reasonable assurance” recognizes that the cost of the control should not exceed the benefits likely to be derived and that the evaluation of costs and benefits require estimates and judgments by management. All internal control evaluations occur within the above framework. Management believes that METRO’s internal accounting controls adequately safeguard assets and provide reasonable assurance of proper recording of financial transactions. Management also believes that the data, as presented herein, is accurate in all material respects, that it presents fairly the financial position, results of operations and cash flows of METRO, and that all disclosures necessary to enable the reader to obtain an understanding of METRO’s financial affairs have been included. Basis of Accounting
METRO accounting records are maintained on the accrual basis. The activities are accounted for in a single enterprise (Proprietary-type) fund. Budgetary Controls
The annual accrual-basis operating budget and capital budget are proposed by METRO management and adopted by the Board of Trustees in a public meeting. The annual budget is prepared using overall guidelines established after consideration of METRO’s long-range financial plan.
All capital and operating items exceeding $100,000 receive Board approval prior to purchase. The long-range plan, updated annually, projects sources over the next five years and establishes service levels and growth commensurate with such revenue limits.
METRO maintains budgetary control by not permitting total operating expenses and expenditures for individual capital projects to exceed their appropriations without approval by the Board of Trustees. Management ensures that expenses and capital expenditures stay within the total appropriation. On a monthly basis, the Board reviews budget variations. It is the responsibility of each department to administer its operations in such a manner as to ensure that the use of funds is consistent with the goals and programs authorized by the Board of Trustees.
10

Financial Operating Results
Revenues
METRO’s revenues are classified by source and described as shown below:
2013 2012 2011
Sales Tax 38,536,699$ 39,686,825 36,279,210Passenger Fares 5,433,355 5,333,938 4,606,232Federal Assistance 4,718,920 5,962,190 5,998,391State Assistance 218,943 260,230 629,962Interest income 35,095 73,074 92,127Auxiliary Transportation Revenue 451,535 405,113 398,486Non-Transportation Revenue 519,967 487,804 420,977
49,914,514$ 52,209,174 48,425,385
Revenue by Source
Sales Tax revenues decreased 2.8% over last year. This is a sales and use tax of ½ of 1% on all goods and services sold in Summit County. There is no limit on its duration. Sales tax decreased due to a lower than expected sales. Passenger fares are comprised of farebox revenues, tickets sales, special transit fares and a contract with the Akron Board of Education. METRO also has additional contracts with local governmental agencies to provide Paratransit service. The increase in passenger fares of 1.8% percent in 2013 can be attributed to an increase in the use of tickets and passes. Federal assistance funds are received from the Federal Transit Administration for certain items that are classified as capital assistance. Capital assistance, as defined by the FTA, includes preventive maintenance, leases, planning, and other operating items that are part of capital projects. The level of funds received in 2013 were down compared to 2012. This decrease was a reduction in funding for the Job Access and Reverse Commute federal grant program that assisted METRO with funding for new routes. State assistance funds are from fuel tax refunds. The amounts in 2013 were 15.9% lower compared to 2012 due to a switch from diesel to CNG (Compressed Natural Gas) as a fuel for METRO’s buses. Auxiliary Transportation Revenue consists of advertising and miscellaneous revenue. Auxiliary revenue in 2013 was 11.5% higher compared to 2012. This was due to an increase in rates for advertising and additional advertising sales.
Non-Transportation Revenue consists primarily of revenue from the sales of obsolete assets, gain disposal of assets, sales of Solar Renewable Energy Credits and all other miscellaneous revenue. In 2013 there was a 6.5% increase compared to 2012 due to sales of additional Solar Renewable Energy Credits.
11

Operating Expenses
2013 2012 2011Labor 17,836,348$ 16,649,367$ 15,729,019$ Fringe benefits 9,886,508 10,108,654 10,490,896 Materials and supplies 6,041,098 6,259,905 6,083,212 Services 2,198,643 2,349,651 2,320,702 Utilities 539,188 539,714 582,260 Casualty and liability 1,163,565 1,099,473 1,166,261 Taxes 228,390 273,560 276,498 Purchased transportation 611,026 834,256 1,374,797 Interest Expense 10,250 15,000 19,234 Miscellaneous 453,314 467,333 401,032
38,968,330$ 38,596,913$ 38,443,911$
Operating Expense by Object Class
Total operating expenses, excluding depreciation, increased in 2013 by less than 1% compared to 2012. The small increase in 2012 was due to a decrease in the cost of medical expenses and the reduction in the use of purchase transportation services.
Labor and Fringe Benefits are METRO’s major expense items. Wages were up a little more than 7% in 2013 due to wage increases and hiring of additional Operators to expand bus service. Fringe benefits were down about 2.2% in 2013 due to a decrease in medical claims and Workers Compensation insurance cost. Material and Supplies were down 3.5% in 2013 due to the switch from diesel to CNG and a fuel for the buses. Services were down 6.4% in 2013 compared to 2012 due to the reduction in outside consultant services. Utilities were about the same in 2013 compared to 2012. Casualty and Liability were 5.8% lower in 2013 due to an increase in the premium cost. Purchased Transportation was down 26.8% in 2013 due to a reduction in the use of purchase transportation for passenger trips. Miscellaneous Expenses were down 3% in 2013 due to slightly lower costs for media, travel and meetings.
12

Financial Operating Results
METRO’s net revenue for the years ended December 31, 2013 and 2012 was $10,946,184 and $13,612,261 respectively. This is before Capital Contributions and Depreciation. Debt Administration The Authority has outstanding bonds of $105,000, a decrease of $100,000 from the prior year. This debt consists of capital facilities bonds issued for the purpose of purchasing, acquiring, constructing, replacing, improving, extending and enlarging transit facilities and other equipment. In December 2013, the Authority, made its annual principal payment on its bonds. There was no other activity relating to debt for the Authority. OTHER INFORMATION METRO’s independent auditing firm, Charles E. Harris and Associates, Inc, has rendered an unqualified auditors’ report on METRO’s financial statements for the fiscal year ended December 31, 2013. METRO also participates in the Federal single audit program, which consists of a single audit of all federally funded programs administrated by METRO. As a requirement for continued funding eligibility, participation in the single audit program is mandatory for most local governments, including METRO. The single audit performed by Charles E. Harris and Associates, Inc met the requirements set forth by the State of Ohio and the Federal Single Audit Act of 1984 (as amended in 1996) and related OMB Circular A-133. The independent auditors’ reports issued thereon noted no instances of direct and material noncompliance by METRO with applicable State or Federal laws or regulations for the fiscal year ended December 31, 2013. Certificate of Achievement Program
It is the intention of METRO’s management to submit this and future CAFR’s for review under the GFOA’s “Certificate of Achievement for Excellence in Financial Reporting” program. Management believes the current report conforms to the program requirements and expects that participation will result in continued improvement in METRO’s financial reporting in future years.
13

This page intentionally left blank.

Financial Section

This page intentionally left blank.

Financial Section – 2013 The Financial Section includes the Independent Auditor’s
Report, Management’s Discussion and Analysis (MD&A),
the Basic Financial Statements, Notes to the Financial
Statements, other Required Supplementary Information
(RSI) and other financial schedules.

This page intentionally left blank.

15
Rockefeller Building
614 W Superior Ave Ste 1242
Cleveland OH 44113-1306
Charles E. Harris & Associates, Inc. Office phone - (216) 575-1630 Certified Public Accountants Fax - (216) 436-2411
INDEPENDENT AUDITORS’ REPORT Metro Regional Transit Authority Summit County 416 Kenmore Blvd. Akron, Ohio 44301 To the Board of Trustees: Report on the Financial Statements We have audited the accompanying financial statements of the Metro Regional Transit Authority, Summit County, Ohio (the Authority), as of and for the years ended December 31, 2013 and 2012, and the related notes to the financial statements, which collectively comprise the Authority’s basic financial statements as listed in the table of contents. Management’s Responsibility for the Financial Statements Management is responsible for preparing and fairly presenting these financial statements in accordance with accounting principles generally accepted in the United States of America; this includes designing, implementing, and maintaining internal control relevant to preparing and fairly presenting financial statements that are free from material misstatement, whether due to fraud or error. Auditor's Responsibility Our responsibility is to opine on these financial statements based on our audit. We audited in accordance with auditing standards generally accepted in the United States of America and the financial audit standards in the Comptroller General of the United States’ Government Auditing Standards. Those standards require us to plan and perform the audit to reasonably assure the financial statements are free from material misstatement. An audit requires obtaining evidence about financial statement amounts and disclosures. The procedures selected depend on our judgment, including assessing the risks of material financial statement misstatement, whether due to fraud or error. In assessing those risks, we consider internal control relevant to the Authority's preparation and fair presentation of the financial statements in order to design audit procedures that are appropriate in the circumstances, but not to the extent needed to opine on the effectiveness of the Authority's internal control. Accordingly, we express no opinion. An audit also includes evaluating the appropriateness of management’s accounting policies and the reasonableness of their significant accounting estimates, as well as our evaluation of the overall financial statement presentation. We believe the audit evidence we obtained is sufficient and appropriate to support our audit opinions. Opinion In our opinion, the financial statements referred to above present fairly, in all material respects, the financial position of the Metro Regional Transit Authority, Summit County, Ohio as of December 31, 2013 and 2012, and the respective changes in financial position and cash flows thereof for the years then ended in accordance with the accounting principles generally accepted in the United States of America.

16
Metro Regional Transit Authority Summit County Independent Auditors’ Report Page 2 Other Matters Required Supplementary Information Accounting principles generally accepted in the United States of America require this presentation to include Management’s discussion and analysis, listed in the table of contents, to supplement the basic financial statements. Although this information is not part of the basic financial statements, the Governmental Accounting Standards Board considers it essential for placing the basic financial statements in an appropriate operational, economic, or historical context. We applied certain limited procedures to the required supplementary information in accordance with auditing standards generally accepted in the United States of America, consisting of inquiries of management about the methods of preparing the information and comparing the information for consistency with management’s responses to our inquiries, to the basic financial statements, and other knowledge we obtained during our audit of the basic financial statements. We do not opine or provide any assurance on the information because the limited procedures do not provide us with sufficient evidence to opine or provide any other assurance. Supplementary and Other Information Our audit was conducted to opine on the Authority’s basic financial statements taken as a whole. The introductory section and the statistical section information present additional analysis and are not a required part of the basic financial statements. We did not subject the introductory section and statistical section information to the auditing procedures applied in the audit of the basic financial statements and, accordingly, we express no opinion or any other assurance on them. Other Reporting Required by Government Auditing Standards In accordance with Government Auditing Standards, we have also issued our report dated May 14, 2014, on our consideration of the Authority’s internal control over financial reporting and our tests of its compliance with certain provisions of laws, regulations, contracts and grant agreements and other matters. That report describes the scope of our internal control testing over financial reporting and compliance, and the results of that testing, and does not opine on internal control over financial reporting or on compliance. That report is an integral part of an audit performed in accordance with Government Auditing Standards in considering the Authority’s internal control over financial reporting and compliance.
Charles E. Harris & Associates, Inc. May 14, 2014

METRO REGIONAL TRANSIT AUTHORITY
MANAGEMENT DISCUSSION AND ANALYSIS
For the Years Ended December 31, 2013 and 2012 As the financial management team for the METRO Regional Transit Authority (the “Authority”), we offer readers of these financial statements this narrative overview and analysis of the financial activities of the Authority for the fiscal years ended December 31, 2013 and 2012. This discussion and analysis is designed to assist the reader in focusing on the significant financial issues and activities and to identify any significant changes in financial position. We encourage readers to consider the information presented here in conjunction with the financial statements as a whole. Financial Highlights for 2013 • The Authority has a net position of $116.9 million. This net position results from the
difference between total assets of $120.4 million and total liabilities of $3.5 million. • Current assets of $43.2 million primarily consist of non-restricted Cash and Cash
Equivalents of $25.4 million; Sales and Use Tax receivable of $5.2 million and long-term investments of $9.4 million.
• Current liabilities of $3.5 million primarily consist of accrued payroll and payroll
liabilities of $2.8 million and accounts payable of $0.4 million. METRO’s overall financial picture is in a very good position. With the economy recovering sales tax increases have allowed a growth to the overall revenue while maintaining a strong fiscal control over cost. These two factors have allowed METRO to continue to increase service while also rebuilding our fund balance. Financial Highlights in 2012 • The Authority has a net position of $104.6 million. This net position results from the
difference between total assets of $108.5 million and total liabilities of $3.9 million. • Current assets of $37.7 million primarily consist of non-restricted Cash and Cash
Equivalents of $24.6 million; Sales and Use Tax receivable of $6.4 million and long-term investments of $5.1 million.
• Current liabilities of $3.8 million primarily consist of accrued payroll and payroll
liabilities of $2.6 million and accounts payable of $0.9 million. • Long-Term Debt consists of bonds of $105,000 or 2.7% of the total liabilities balance of
$3.9 million.
17

METRO REGIONAL TRANSIT AUTHORITY
MANAGEMENT DISCUSSION AND ANALYSIS
For the Years Ended December 31, 2013 and 2012
Basic Financial Statements and Presentation The financial statements presented by the Authority are the Statement of Net Position, the Statement of Revenues, Expenses and Changes in Net Position and the Statement of Cash Flows. These statements are presented using the economic resources measurement focus and the accrual basis of accounting. The Authority is structured as single enterprise fund with revenues recognized when earned and measurable, not when received. Expenses are recognized when they are incurred, not when paid. Capital assets, except land, are capitalized and depreciated over their estimated useful lives. The Statement of Net Position presents information on all the Authority’s assets and liabilities, with the difference between the two reported as net Position. Over time, increases and decreases in the net position may serve as a useful indicator of whether the financial position of the Authority is improving or deteriorating. The net position increases when revenues exceed expenses. Increases in assets without a corresponding increase to liabilities results in increased net position, which indicate improved financial position. The Statement of Revenues, Expenses and Changes in Net Position presents information showing how the Authority’s net position changed during the year. This statement summarizes operating revenues and expenses along with non-operating revenues and expenses. In addition, this statement lists capital grant revenues received from federal, state and local governments. The Statement of Cash Flows allows financial statement users to assess the Authority’s adequacy or ability to generate sufficient cash flows to meet its obligations in a timely manner. The statement is classified into four categories 1) Cash flows from operating activities, 2) Cash flows from non-capital financing activities, 3) Cash flows from capital and related financing activities, and 4) Cash flows from investing activities. Notes to the Financial Statements The notes provide additional information that is essential to a full understanding of the data provided in the basic financial statements. The Notes to the Financial Statements can be found on pages 27-43 of this report.
18

METRO REGIONAL TRANSIT AUTHORITY
MANAGEMENT DISCUSSION AND ANALYSIS
For the Years Ended December 31, 2013 and 2012 Financial Analysis of the Authority Condensed Summary of Net Position
2013 2012 2011Current and other assets 43,232,074$ 37,879,697$ 28,986,315$ Capital assets, net of accumulated depreciation 77,159,974 70,595,408 60,030,829
Total assets 120,392,048 108,475,105 89,017,144
Current liabilities 3,513,434 3,761,772 3,485,528 Non-current liabilities - 105,000 534,367
Total liabilities 3,513,434 3,866,772 4,019,895
Net position:
Net Investment in capital assets 77,054,974 70,390,408 59,730,829 Unrestricted net position 39,823,640 34,217,925 25,266,420
Total net position 116,878,614$ 104,608,333$ 84,997,249$
By far, the largest portion of the Authority’s net position reflect net investment in capital assets (e.g., line service and Paratransit buses, operating facilities including our administrative/maintenance office, Robert K Pfaff Transit Center, Rolling Acres Transfer Center and our banked railroad property) less any related debt used to acquire those assets that is still outstanding. The Authority uses these capital assets to provide public transportation service for Summit County citizens. These assets are not available to liquidate liabilities or to cover other spending. Equity related to Capital Acquisitions is reflected in the line item “Net investment in capital assets”. The equity includes funding provided by the Federal Transit Administration (FTA) and the State of Ohio Department of Transportation (ODOT). The Authority’s investment in capital assets, net of accumulated depreciation, was $77.1 million as of December 31, 2013, an increase of $6.6 million from 2012 as capital asset expenditures represented more than depreciation expense and asset write-offs during the year. However, approximately 75.2% of the equity pertains to the FTA and ODOT, whereas approximately 24.8% relates to local match dollars provided by the Authority. The equity related to the FTA and ODOT cannot be liquidated to provide a source of cash flow, as any premature sale would require payments to both the FTA (approximately $62.4 million) and ODOT (approximately $0.7 million) for their remaining equity in capital equipment as of year-end 2013. Major capital asset expenditures during 2013 included the following: • Purchase of ten (10) 40’ Low Floor CNG buses • Purchase of six (6) 60’ Low Floor Articulated CNG buses • Purchase of Thirty-one (31) Paratransit CNG buses
19

METRO REGIONAL TRANSIT AUTHORITY
MANAGEMENT DISCUSSION AND ANALYSIS
For the Years Ended December 31, 2013 and 2012
Condensed Summary of Net Position (Continued)
The Authority’s investment in capital assets, net of accumulated depreciation, was $70.4 million as of December 31, 2012, an increase of $10.7 million from 2011 as capital asset expenditures represented more than depreciation expense and asset write-offs during the year.
Major capital asset expenditures during 2012 included the following: • Purchase of Thirty-three (33) 40’ Low Floor CNG buses • Purchase of Ten (10) Paratransit CNG buses • Purchase of AVL and scheduling system for the Paratransit • Upgrade of the fareboxes to use smartcards
Condensed Summary of Revenues, Expenses and Changes in Net Position
2013 2012 2011OPERATING REVENUES:
Passenger fares 4,998,875$ 4,846,581$ 4,207,746$ Advertising and concessions 451,535 405,113 398,486 Total Operating Revenues 5,450,410$ 5,251,694$ 4,606,232$
OPERATING EXPENSESLabor 17,836,348$ 16,649,367$ 15,729,019$ Fringe benefits 9,886,508 10,108,654 10,490,896 Materials and supplies 2,921,486 3,036,989 3,070,339 Fuel 3,119,612 3,222,916 3,012,873 Services 2,198,643 2,349,651 2,320,702 Utilities 539,188 539,714 582,260 Casualty and liability 1,163,565 1,099,473 1,166,261 Taxes 228,390 273,560 276,498 Purchased transportation service 611,026 834,256 1,374,797 Miscellaneous 453,314 467,333 401,032 Total Operating Expenses excluding depreciation 38,958,080$ 38,581,913$ 38,424,677$
(33,507,670)$ (33,330,219)$ (33,818,445)$ Depreciation Expense (8,513,768) (6,920,312) (6,397,734)
OPERATING LOSS (42,021,438)$ (40,250,531)$ (40,216,179)$ NON-OPERATING REVENUES (EXPENSES):
Sales tax revenue 38,536,699$ 39,686,825$ 36,279,210$ Federal operating grants and reimbursements 4,718,920 5,962,190 5,998,391 State operating grants and special fare assistance 218,943 260,230 629,962 Student fare and other assistance 434,480 487,357 852,768 Interest income 35,095 73,074 92,127 Interest expense (10,250) (15,000) (19,234) Gain (Loss) from disposal of assets 46,064 (75,107) 54,422 Other 473,903 562,911 366,555
Total Non-Operating Revenues - net 44,453,854$ 46,942,480$ 44,254,201$ CAPITAL GRANT REVENUE
Capital Grant Revenue 9,837,865$ 12,919,135$ 7,583,812$
CHANGE IN NET POSITION 12,270,281 19,611,084 11,621,834
Net Position, Beginning Balance 104,608,333$ 84,997,249$ 73,101,530$ Prior Period Auditor Adjustment - - 273,885 Net Position, Ending Balance 116,878,614$ 104,608,333$ 84,997,249$
OPERATING LOSS BEFORE DEPRECIATION
20

METRO REGIONAL TRANSIT AUTHORITY
MANAGEMENT DISCUSSION AND ANALYSIS
For the Years Ended December 31, 2013 and 2012
The Authority’s total revenue was $49.9 million in 2013. This is a 4.4% decrease over 2012. This decrease is a result from a decrease in federal assistance and sales tax revenue. While in 2012 METRO had total revenue of $52.2 million. This was an increase of 6.8% over 2011. This increase was a result of an increase in sales tax and federal assistance.
Operating expenses, excluding depreciation, increased by $0.4 million in 2013 and $0.2 million in 2012. In 2013 wages increased but this was mostly off-set by decreases in fringe benefits and purchase transportation. In 2012 increases included wages and fuel; these increases were off-set by decreases in fringe benefits and purchase transportation.
Depreciation expense increased by $1.6 million in 2013 and by $0.6 million in 2012.
Condensed Summary of Cash Flows
Net cash used for operating activities increased by $1.9 million in 2013 as a result of a increase in expenses for wages and fuel costs. Net cash used for operating activities decreased by $1.2 million in 2012 as a result of a decrease in expenses for benefits. In 2013 net cash from non-capital activity decreased by $0.2 million due to a decrease in grant revenue. In 2012 net cash from non-capital activity increased by $3.3 million due to increased sales tax revenue and grant revenue. In 2013 net cash from capital and related financing activity decreased by $0.5 million due to a decrease in grant revenue. In 2012 net cash capital and related financing activity decreased by $0.6 million due to increased acquisitions and construction of capital asset with local funds. Cash and cash equivalents increased in 2013 by $0.8 million and increased in 2012 by $4.9 million.
CASH FLOWS FROM OPERATING ACTIVITIES: 2013 2012 2011Cash received from customers 4,993,726$ 4,882,721$ 4,045,546$ Cash received from others for miscellaneous services 451,535 405,113 398,486Cash payments to suppliers for goods and services (12,911,978) (11,882,173) (11,505,112)Cash payments to employees for services (27,800,197) (26,737,174) (27,452,166) Net cash used in operating activities (35,266,914) (33,331,513) (34,513,246)
CASH FLOWS FROM NONCAPITAL FINANCING ACTIVITIESSales taxes received 39,716,763 38,092,648 36,203,544Operating grants and other assistance received 5,846,246 7,672,688 6,228,353 Net cash provided by non-capital financing activities 45,563,009 45,765,336 42,431,897
CASH FLOWS FROM CAPITAL AND RELATED FINANCINGACTIVITIES:
Capital grants received 9,837,865 12,919,135 6,527,673Acquisition and construction of capital assets (15,078,335) (17,614,265) (10,628,610)Principal paid on bonds (100,000) (95,000) (95,000)Interest paid on bonds (10,250) (15,000) (19,193) Net cash provided by capital and related financing activities (5,350,720) (4,805,130) (4,215,130)
CASH FLOWS FROM INVESTING ACTIVITIES:Cash proceeds from sale of investments - net (4,175,456) (2,845,227) 1,739,052Interest received from investments 35,095 73,074 92,127 Net cash provided by investing activities (4,140,361) (2,772,153) 1,831,179
NET INCREASE IN CASH AND CASH EQUIVALENTS 805,014 4,856,540 5,534,700
CASH AND CASH EQUIVALENTS, BEGINNING OF YEAR 24,633,883 19,777,343 14,242,643CASH AND CASH EQUIVALENTS, END OF YEAR 25,438,897$ 24,633,883$ 19,777,343$
21

METRO REGIONAL TRANSIT AUTHORITY
MANAGEMENT DISCUSSION AND ANALYSIS
For the Years Ended December 31, 2013 and 2012 Capital Asset and Debt Administration Capital Assets The Authority’s net investment in capital assets amounts to $77.2 million, net of accumulated depreciation as of December 31, 2013, an increase of $6.6 million compared to 2012. Capital assets include land and land improvements, revenue producing and service equipment, buildings and structures, shop equipment, office furnishings and computer equipment. Additional information on capital asset activity can be found in note 5 to the financial statements. Long-term Debt The Authority has outstanding bonds of $105,000 a decrease of $100,000 from 2012. While in 2012 the Authority had outstanding bonds of $205,000 which was a decrease of $95,000 from 2011. This debt consists solely of capital facilities bonds issued for the purpose of purchasing, acquiring, constructing, replacing, improving, extending and enlarging transit facilities and other equipment. The bonds were authorized to be issued and sold under resolutions passed by the Board of Trustees. The bonds are general obligations of the Authority. During 2013 the Authority had no new debt activity except for payments made for interest and principal. Additional information on long-term debt activity can be found in note 4 to the financial statements. Requests for Information This financial report is designed to provide a general overview of the Authority’s finances for all those with an interest in its finances. Questions concerning any of the information provided in this report or requests for additional financial information should be addressed to the Director of Finance, METRO Regional Transit Authority, 416 Kenmore Boulevard, Akron, OH 44301.
22

ASSETS 2013 2012CURRENT ASSETS:
Cash and cash equivalents 25,438,897$ 24,633,883$ Investments 9,374,043 5,058,688 Receivables: Sales taxes 5,179,625 6,359,689 Trade and other 263,345 258,196 Materials and supplies inventory 1,013,216 881,181 Prepaid expenses 1,883,293 521,106
Total current assets 43,152,419 37,712,743
PROPERTY, FACILITIES AND EQUIPMENTLand 4,168,020 4,168,020 Construction in Progress 1,521,736 - Buildings and building improvements 34,227,127 34,087,919 Infrastructure 5,685,238 5,076,567 Right-of-ways 10,653,206 10,653,206 Transportation equipment 60,870,960 55,435,686 Other equipment 11,021,035 10,590,591 Total 128,147,322 120,011,989 Less: Accumulated depreciation (50,987,348) (49,416,581)
Property, facilities and equipment - net 77,159,974 70,595,408
OTHER ASSETS 79,655 166,954
TOTAL ASSETS 120,392,048$ 108,475,105$
(Continued)
See accompanying notes to the financial statements.
METRO REGIONAL TRANSIT AUTHORITYSTATEMENT OF NET POSITIONDECEMBER 31, 2013 and 2012
23

2013 2012
CURRENT LIABILITIES:Bonds payable - current maturities 105,000$ 100,000$ Accrued interest payable 1,900 5,125 Accounts payable 366,006 570,522 Accrued payroll 1,911,462 1,725,732 Accrued payroll taxes 937,506 900,577 Unearned revenue - advertising, rents & leases 14,213 4,453 Other estimated liability 1,000 301,000 Other liabilities 176,347 154,363
Total current liabilities 3,513,434$ 3,761,772$
NONCURRENT LIABILITIES:Bonds payable -$ 105,000$
Total noncurrent liabilities -$ 105,000$
Total liabilities 3,513,434$ 3,866,772$
NET POSITION:Net Investment in capital assets 77,054,974$ 70,390,408$ Unrestricted 39,823,640 34,217,925
Total net position 116,878,614$ 104,608,333$
See accompanying notes to the financial statements.
METRO REGIONAL TRANSIT AUTHORITYSTATEMENT OF NET POSITION (Continued)
DECEMBER 31, 2013 and 2012
24

2013 2012OPERATING REVENUES:
Passenger fares 4,998,875$ 4,846,581$ Advertising and concessions 451,535 405,113 Total operating revenues 5,450,410$ 5,251,694$
OPERATING EXPENSESLabor 17,836,348$ 16,649,367$ Fringe benefits 9,886,508 10,108,654 Materials and supplies 2,921,486 3,036,989 Fuel 3,119,612 3,222,916 Services 2,198,643 2,349,651 Utilities 539,188 539,714 Casualty and liability 1,163,565 1,099,473 Taxes 228,390 273,560 Purchased transportation service 611,026 834,256 Miscellaneous 453,314 467,333 Total operating expenses excluding depreciation 38,958,080$ 38,581,913$
OPERATING LOSS BEFORE DEPRECIATION EXPENSE (33,507,670) (33,330,219)
DEPRECIATION EXPENSE:On assets acquired with capital grants 8,467,878$ 6,877,445$ On other assets 45,890 42,867 Total depreciation expense 8,513,768 6,920,312
OPERATING LOSS (42,021,438)$ (40,250,531)$
NON-OPERATING REVENUES (EXPENSES):Sales tax revenue 38,536,699$ 39,686,825$ Federal operating grants and reimbursements 4,718,920 5,962,190 State operating grants, reimbursements, and special fare assistance 218,943 260,230 Student fare and other assistance 434,480 487,357 Interest income 35,095 73,074 Interest expense (10,250) (15,000) Gain (Loss) from disposal of assets 46,064 (75,107) Other 473,903 562,911 Total Non-Operating Revenues - net 44,453,854$ 46,942,480$
NET INCOME BEFORE CAPITAL CONTRIBUTION 2,432,416 6,691,949
CAPITAL CONTRIBUTIONS 9,837,865 12,919,135
Increase (decrease) in Net Position 12,270,281$ 19,611,084$
Net Position, Beginning Balance 104,608,333$ 84,997,249$ Net Position, Ending Balance 116,878,614$ 104,608,333$
See accompanying notes to the financial statements.
METRO REGIONAL TRANSIT AUTHORITYSTATEMENT OF REVENUES, EXPENSES AND CHANGES IN NET POSITION
FOR THE YEARS ENDED DECEMBER 31, 2013 and 2012
25

2013 2012CASH FLOWS FROM OPERATING ACTIVITIES:
Cash received from customers 4,993,726$ 4,882,721$ Cash received from others for miscellaneous services 451,535 405,113 Cash payments to suppliers for goods and services (12,911,978) (11,882,173) Cash payments to employees for services (27,800,197) (26,737,174) Net cash used in operating activities (35,266,914)$ (33,331,513)$
CASH FLOWS FROM NONCAPITAL FINANCING ACTIVITIESSales taxes received 39,716,763$ 38,092,648$ Operating grants and other assistance received 5,846,246 7,672,688 Net cash provided by non-capital financing activities 45,563,009$ 45,765,336$
CASH FLOWS FROM CAPITAL AND RELATED FINANCINGACTIVITIES:
Capital grants received 9,837,865$ 12,919,135$ Acquisition and construction of capital assets (15,078,335) (17,614,265) Principal paid on bonds (100,000) (95,000) Interest paid on bonds (10,250) (15,000) Net cash provided (used) by capital and related financing activities
(5,350,720)$ (4,805,130)$
CASH FLOWS FROM INVESTING ACTIVITIES:Cash proceeds from sale of investments - net (4,175,456)$ (2,845,227)$ Interest received from investments 35,095 73,074 Net cash provided by investing activities (4,140,361)$ (2,772,153)$
NET INCREASE IN CASH AND CASH EQUIVALENTS 805,014$ 4,856,540$
CASH AND CASH EQUIVALENTS, BEGINNING OF YEAR 24,633,883 19,777,343 CASH AND CASH EQUIVALENTS, END OF YEAR 25,438,897$ 24,633,883$
RECONCILIATION OF OPERATING LOSS TO NET CASH USEDIN OPERATING ACTIVITIES:
Operating loss (42,021,438)$ (40,250,531)$ Adjustment to reconcile operating loss to net cash usedin operating activities:Depreciation 8,513,768 6,920,312 Change in assets and liabilities: Accounts receivable-trade (5,149) 43,323 Materials and supplies inventory (132,035) (33,070) Prepaid expenses (1,362,187) 25,887 Accounts payable (204,516) 149,692 Accrued payroll 185,730 85,125 Accrued payroll taxes 36,929 (64,278) Other estimated liability (300,000) - Other current liabilities 21,984 (207,973)
NET CASH USED IN OPERATING ACTIVITIES (35,266,914)$ (33,331,513)$
See accompanying notes to the financial statements.
METRO REGIONAL TRANSIT AUTHORITYSTATEMENT OF CASH FLOWS
FOR THE YEARS ENDED DECEMBER 31, 2013 and 2012
26

METRO REGIONAL TRANSIT AUTHORITY
NOTES TO FINANCIAL STATEMENTS
For the Years Ended December 31, 2013 and 2012 1. ORGANIZATION AND SIGNIFICANT ACCOUNTING POLICIES
Organization – METRO Regional Transit Authority (“METRO” or the “Authority”) was created pursuant to Sections 306.30 through 306.71 of the Ohio Revised Code for the purpose of providing public transportation in Summit County, Ohio. As a political subdivision it is distinct from, and is not an agency of, the State of Ohio or any other local governmental unit. The Authority is not subject to federal or state income taxes. Under Ohio law, the Authority is authorized to levy a sales and use tax for transit purposes, including both capital improvement and operating expenses, at the rate of .25 percent, .5 percent, 1 percent, or 1.5 percent if approved by a majority of the electors residing within the territorial boundaries of the Authority. Such a sales and use tax is in addition to the sales and use taxes levied by the State of Ohio and summit County. During 1990, the voters of Summit County approved a 0.25 percent sales and use tax with no limit on its duration. In 2008 the voters of Summit County approved an additional 0.25 percent sales and use tax with no limit on its duration for a total of 0.5 percent. The Authority is managed by a 12-member Board of Trustees and provides virtually all mass transportation within Summit County. Reporting Entity – The Authority has adopted the provisions of Statement No. 14 of the Governmental Accounting Standards Board (“GASB”) regarding the definition of the financial reporting entity. Accordingly, the accompanying financial statements include only the accounts and transactions of the Authority. Under the criteria specified in Statement No. 14, the Authority has no component units nor is it considered a component unit of any other entity. These conclusions regarding the financial reporting entity are based on the concept of financial accountability. The Authority is not financially accountable for any other organization nor is any other organization accountable for the Authority. This is evidenced by the fact that the Authority is a legally and fiscally separate and distinct organization under the provisions of the Ohio Revised Code. Basis of Accounting – The Authority follows the accrual basis of accounting, whereby revenues and expenses are recognized in the period earned or incurred. The measurement focus is on determination of net income, financial position and cash flows. All transactions are accounted for in a single enterprise fund.
27

METRO REGIONAL TRANSIT AUTHORITY
NOTES TO FINANCIAL STATEMENTS
For the Years Ended December 31, 2013 and 2012 1. ORGANIZATION AND SIGNIFICANT ACCOUNTING POLICIES (Continued)
Pursuant to GASB Statement No. 62, codification of Accounting and Financial Reporting Guidance Contained in Pre-November 30, 1989 FASB and AICPA Pronouncements, the Authority follows GASB guidance as applicable to enterprise funds. Nonexchange Transactions - The Authority has also complied with the provisions of Statement No. 33 of the Governmental Accounting Standards Board (“GASB”) regarding the Accounting and Financial Reporting for Nonexchange Transactions. This statement requires that capital contributions be recognized as revenue. Accordingly, during the years ended December 31, 2013 and 2012, $9,837,865 and $12,919,135 in capital contribution were recognized as revenue in the Statement of Revenues, Expenses and Changes in Net Position for the Authority. In 2005, the Authority implemented a financial reporting model, as required by the provisions of the Governmental Accounting Standards Board (GASB) Statement No. 34, Basic Financial Statements and Management’s Discussion and Analysis for State and Local Governments, as amended and interpreted. In fiscal year 2012, the Authority has implemented Governmental Accounting Standard Board (GASB) Statement No. 63, “Financial Reporting of Deferred Outflows of Resources, Deferred Inflows of Resources, and Net Position” and Statement No. 65, “Items Previously Reported as Assets and Liabilities.” GASB Statement No. 63 provides guidance for reporting deferred outflows of resources, deferred inflows of resources, and net position in a statement of financial position and related note disclosures. These changes were incorporated in the Authority’s fiscal year 2012 financial statements; however, there was no effect on beginning net position/fund balance. GASB Statement No. 65 properly classifies certain items that were previously reported as assets and liabilities as deferred outflows of resources or deferred inflows of resources or recognizes certain items that were previously reported as assets and liabilities as outflows of resources (expenses or expenditures) or inflows of resources (revenues). These changes were incorporated in the Authority’s fiscal year 2012 financial statements; however, there was no effect on beginning net position/fund balance. The Authority will continue applying all applicable pronouncements issued by the GASB.
28

METRO REGIONAL TRANSIT AUTHORITY
NOTES TO FINANCIAL STATEMENTS
For the Years Ended December 31, 2013 and 2012
1. ORGANIZATION AND SIGNIFICANT ACCOUNTING POLICIES (Continued)
Cash and Cash Equivalents – For purposes of the statement of cash flows, the Authority considers all highly liquid investments (including restricted assets) with a maturity, at date of purchase, of three months or less to be cash equivalents. Cash and cash equivalents are carried at cost, which approximates fair value. Investments – The Authority’s investments are stated at fair value. Materials and Supplies Inventory – Materials and supplies inventory is stated at cost (average cost method). Inventory generally consists of maintenance parts and supplies for rolling stock and other transportation equipment. Use of Estimates – The preparation of financial statements in conformity with accounting principles generally accepted in the United States of America requires management to make estimates and assumptions that affect reported amounts of assets, liabilities, revenues and expenses, at and during the reported period. Actual results could differ from those estimates. Property, Facilities and Equipment – Property, facilities and equipment are stated at historical cost. The cost of maintenance and repairs is charged to operations as incurred. Property over $5,000 is capitalized. Depreciation is computed using the straight-line method over the estimated useful lives of the respective assets, as follows:
Description YearsBuilding and Building Improvements 20-40Infrastructure 20-30Transportation equipment 5-12Other equipment 3-10
29

METRO REGIONAL TRANSIT AUTHORITY
NOTES TO FINANCIAL STATEMENTS
For the Years Ended December 31, 2013 and 2012
1. ORGANIZATION AND SIGNIFICANT ACCOUNTING POLICIES (Continued)
Net Position is displayed in three components as follows:
Net Investment in Capital Assets – This consists of capital assets, net of accumulated depreciation, less the outstanding balances of any bonds, notes, or other borrowings that are attributable to the acquisition, construction, or improvements of those assets.
Restricted – This consists of net position that is legally restricted by outside parties or by law through constitutional provisions or enabling legislation. When both restricted and unrestricted resources are available for use, generally it is the Authority’s policy to use restricted resources first, then unrestricted resources when they are needed.
Unrestricted – This consists of net position that does not meet the definition of “restricted” or “net investment in capital assets.”
Classifications of Revenues The Authority has classified its revenues as either operating or non-operating. Operating revenue includes activities that have the characteristics of exchange transactions including passenger fares, advertising, and concession revenue. Non-operating revenue includes activities that have the characteristics of non-exchange transactions, such as sales tax proceeds and most federal, state, and local grants and contracts. Recognition of Revenue and Receivables The Federal Transit Administration (“FTA”) and the Ohio Department of Transportation (“ODOT”) provide financial assistance and make grants directly to the Authority for operations and acquisition of property and equipment. Operating grants and special fare assistance awards made on the basis of entitlement periods are recorded as grant receivables and revenue over the entitlement period. Capital grants for the acquisition of property and equipment (reimbursement type grants) are recorded as revenue when the expenditure has been made and the revenue is available. Capital grant funds received in advance of project costs being incurred are recorded as liabilities.
30

METRO REGIONAL TRANSIT AUTHORITY
NOTES TO FINANCIAL STATEMENTS
For the Years Ended December 31, 2013 and 2012
1. ORGANIZATION AND SIGNIFICANT ACCOUNTING POLICIES (Continued) Compensated Absences The Authority accrues vacation and sick pay benefits as earned by its eligible employees. In the event of termination, an employee is reimbursed for accumulated vacation leave. In the event an employee retires they are reimbursed for accumulated sick leave, otherwise accumulated sick leave is forfeited. Deferred Outflows/Inflows of Resources In addition to assets, the statements of financial position will sometimes report a separate section for deferred outflows of resources. Deferred outflows of resources, represents a consumption of net position that applies to a future period and will not be recognized as an outflow of resources (expense/expenditure) until then. In addition to liabilities, the statements of financial position report a separate section for deferred inflows of resources. Deferred inflows of resources represent an acquisition of net position that applies to a future period and will not be recognized as an inflow of resources (revenue) until that time. Passenger Fares
Passenger fares are recorded as revenue at the time services are performed. Budgetary Accounting and Control
The Authority’s annual budget is prepared on the accrual basis of accounting as permitted by law. The Authority maintains budgetary control by not allowing total expenditures to exceed total appropriations without the approval of the Board of Trustees. Estimates
The preparation of financial statements in conformity with accounting principles generally accepted in the United State of America requires management to make estimates and assumptions that affect the reported amounts of assets and liabilities and disclosures of contingent assets and liabilities as of the date of the financial statements and the reported amounts of revenue and expenses during the reporting period. Actual results could differ from those estimates.
31

METRO REGIONAL TRANSIT AUTHORITY
NOTES TO FINANCIAL STATEMENTS
For the Years Ended December 31, 2013 and 2012
2. DEPOSITS AND INVESTMENTS
The investment and deposit of Authority monies are governed by the provisions of the Ohio Revised Code. In accordance with these statutes, only banks located in Ohio and domestic building and loan associations are eligible to hold public deposits. The statutes also permit the Authority to invest in certificates of deposit, savings accounts, money market accounts, the State Treasurer’s investment pool (“STAROhio”), and obligations of the United States government and certain agencies thereof. The Authority may also enter into repurchase agreements with eligible depository or any eligible security dealer who is a member of the National Association of Securities Dealer for a period not exceeding 30 days.
Deposits
Custodial credit risk is the risk that, in the event of a bank failure, the Authority’s deposits may not be returned. According to state law, public depositories must give security for all public funds on deposit in excess of those funds that are insured by the federal deposit insurance corporation (FDIC) or by any other agency or instrumentality of the federal government. These institutions may either specifically collateralize individual accounts in lieu of amounts insured by the FDIC, or may pledge a pool of government securities valued at least 105% of the total value of public monies on deposit at the institution. The Authority’s policy is to deposit money with financial institutions that are able to abide by laws governing insurance and collateral of public funds.
The Authority is prohibited from investing in any financial instrument, contract, or obligation whose value or return is based upon or linked to another asset or index, or both, separate from the financial instruments, contract, or obligation itself (Commonly known as a “derivative”). The Authority is also prohibited from investing in reverse repurchase agreements. At December 31, 2013, the carrying amount of the Authority’s deposits was $16,138,650 and the bank balance was $16,434,575, $250,000 of which was covered by the FDIC and $16,174,575 of which was uninsured and uncollateralized as defined by the GASB. At December 31, 2013 the Authority had $2,075 in petty cash. At December 31, 2012, the carrying amount of the Authority’s deposits was $2,663,675 and the bank balance was $2,843,355, $250,000 of which was covered by the FDIC and $2,593,355 of which was uninsured and uncollateralized as defined by the GASB. At December 31, 212 the Authority had $2,075 in petty cash. The uncollateralized deposits were, however, covered by a pledged collateral pool not held in the Authority’s name, as permitted under Ohio law.
32

METRO REGIONAL TRANSIT AUTHORITY
NOTES TO FINANCIAL STATEMENTS
For the Years Ended December 31, 2013 and 2012
2. DEPOSITS AND INVESTMENTS (Continued)
The Board of Trustees has designated $4,438,172 in 2013 and $2,963,520 in 2012 as contingencies for future use that are included in cash and cash equivalents.
Investments at December 31, 2013 are summarized as follows:
Rating Moody Description Fair value One year of less
More than one year and less than
three yearsMore than three
years
Percentage of total
investment
AaaRepurchase Agreements
$ 4,860,000 4,860,000 - - 26%
Aaa Money Market $ 311,790 311,790 - - 2%
Aaa U.S. Treasury Notes $ 304,274 202,047 102,227 - 2%
AaaU. S. Government Agencies
$ 4,232,705 552,997 2,697,526 982,182 23%
VariousNegotiable Certificate of Deposits
$ 6,661,696 3,252,703 1,793,530 1,615,463 36%
VariousOhio Municipal Obligations
$ 2,301,750 350,543 1,951,207 - 12%
$ 18,672,215 $ 9,530,080 $ 6,544,490 $ 2,597,645 100%
Investment Maturities
Investments at December 31, 2012 are summarized as follows:
Rating Moody Description Fair value One year of less
More than one year and less than
three yearsMore than three
years
Percentage of total
investment
AaaRepurchase Agreements $ 15,460,000 15,460,000 - - 57%
Aaa Money Market $ 895,447 895,447 - - 3%
AaaU.S. Treasury Bonds
$ 201,867 201,867 - - 1%
Aaa U.S. Treasury Notes $ 488,583 178,759 309,824 - 2%
AaaU. S. Government Agencies
$ 3,282,437 - 1,321,585 1,960,852 12%
VariousNegotiable Certificate of Deposits
$ 4,934,962 1,500,593 2,631,800 802,569 18%
VariousOhio Municipal Obligations
$ 1,763,525 - 568,049 1,195,476 7%
$ 27,026,821 $ 18,236,666 $ 4,831,258 $ 3,958,897 100%
Investment Maturities
33

METRO REGIONAL TRANSIT AUTHORITY
NOTES TO FINANCIAL STATEMENTS
For the Years Ended December 31, 2013 and 2012 2. DEPOSITS AND INVESTMENTS (Continued)
Custodial credit risk: an investment is the risk that in the event of failure of the counter-party, the Authority will not be able to recover the value of its investments or collateral securities that are in the possession of an outside party. The Authority’s investments in repurchase agreements, money markets, U.S. treasuries bonds, U.S. treasuries notes, U.S. government agencies, certificate of deposits and Ohio municipal obligations are held in the Authority’s name by its custodian (agent).
Interest rate risk: the Authority has no investment policy that addresses interest rate risk. State statute requires that an investment mature within five years from the date of purchase, unless matched to a specific obligation or debt of the Authority, and that an investment must be purchased with the expectation that it will be held to maturity.
Credit risk: the possibility that an issuer or other counter-party to an investment will not fulfill its obligation. The Authority’s investment policy limits investments to, among others, obligations of the U.S. government or agencies thereof.
3. LONG TERM OBLIGATIONS
During fiscal year 2013, the following changes occurred in long term obligations: A. Bonds
Average Balance BalanceInterest January December Due Within
Issue Rate 1, 2013 Additions Reductions 31, 2013 One Year
General obligation bonds 2004
4.03% $ 205,000 -$ $ 100,000 $ 105,000 $ 105,000
In June 2004, the Authority issued general obligation bonds, which are tax-exempt and have annual maturity dates through 2014. These bonds were used to refinance bonds issued in June 1992 and to provide additional funds to cover the local share for capital projects. The proceeds were deposited into a trust fund for the purpose paying the 1992 bonds and, therefore are excluded from the financial statements. The refinance resulted in an accounting gain of $39,948 and an economic gain of $30,090.
34

METRO REGIONAL TRANSIT AUTHORITY
NOTES TO FINANCIAL STATEMENTS
For the Years Ended December 31, 2013 and 2012
3. LONG TERM OBLIGATIONS (continues)
The annual requirements to pay principal and interest on the general obligation bonds and loan outstanding at December 31, 2013 are as follows:
Principal Interest2014 $ 105,000 $ 5,250 Total $ 105,000 $ 5,250
B. Compensated Absences
2013 2012
Beginning Balance $ 1,010,085 $ 1,011,890 Liability Earned 1,414,287 1,135,854 Liability Paid 1,305,526 1,137,659
Ending Balance $ 1,118,846 $ 1,010,085
Due Within One Year $ 1,118,846 $ 1,010,085
The Authority accrues compensated absences based on the estimated amounts employees are entitled to according to Authorities policies. Vacation time is earned in the current year and eligible to be used by the employee in the following year. Any unused vacation benefits that are eligible to be used in a given year are paid to the employee at the end of the year. An employee that separates from employment with the Authority is paid any vacation time unused during the current period and any vacation time earned during the year. Sick time is earned in the current year and eligible to be used by the employee is available as soon as earned. Any unused sick time is carried over and is useable in the future. An employee that retires from employment with the Authority is paid 25% of available sick time; otherwise all time is forfeited for any other termination of service.
35

METRO REGIONAL TRANSIT AUTHORITY
NOTES TO FINANCIAL STATEMENTS
For the Years Ended December 31, 2013 and 2012
4. CAPITAL ASSETS
Capital asset activity for the year ended December 31, 2013 is as follows:
Balance Balance
Description 1/1/2013 Additions Disposals 12/31/2013
Capital Assets Not Being Depreciated
Land $ 4,168,020 $ - $ - $ 4,168,020 Right-of-ways 10,653,206 - - 10,653,206 Construction-in-progress - 1,521,736 - 1,521,736
Total Capital Assets Not Being Depr 14,821,226 1,521,736 - 16,342,962
Capital Assets Being Depreciated: Building & Building Improvements 34,087,921 139,206 - 34,227,127
Infrastructure 5,076,567 608,671 - 5,685,238 Transportation Equipment 55,435,685 12,365,892 6,930,617 60,870,960 Other Equipment 10,590,590 442,829 12,384 11,021,035
Total Capital Assets Being Depr 105,190,763 13,556,598 6,943,001 111,804,360
Less Accumulated Depreciation: Building & Building Improvements 15,667,334 1,375,127 - 17,042,461
Infrastructure 3,714,016 255,357 - 3,969,373 Transportation Equipment 23,038,068 5,686,183 6,930,617 21,793,634 Other Equipment 6,997,163 1,197,101 12,384 8,181,880
Total Accumulated Depreciation 49,416,581 8,513,768 6,943,001 50,987,348 Total Capital Assets Being Depreciated, Net 55,774,181 60,817,011
Total Capital Assets, Net 70,595,407$ 77,159,973$
Fixed Assets
36

METRO REGIONAL TRANSIT AUTHORITY
NOTES TO FINANCIAL STATEMENTS
For the Years Ended December 31, 2013 and 2012
4. CAPITAL ASSETS (Continued)
Capital asset activity for the year ended December 31, 2012 is as follows:
Balance Balance Description 1/1/2012 Additions Disposals 12/31/2012
Capital Assets Not Being DepreciatedLand $ 3,765,689 $ 402,331 $ - $ 4,168,020
Right-of-ways 10,653,206 - - 10,653,206
Total Capital Assets Not Being
Depreciated 14,418,895 402,331 - 14,821,226
Capital Assets Being Depreciated: Building & Building Improvements 40,768,339 10,508 (6,690,927) 34,087,920 Infrastructure 4,784,735 291,832 - 5,076,567 Transportation Equipment 46,129,486 15,409,617 (6,103,418) 55,435,685 Other Equipment 10,024,045 1,499,976 (933,431) 10,590,590
Total Capital Assets Being Depreciated 101,706,605 17,211,933 (13,727,776) 105,190,762
Less Accumulated Depreciation: 120,011,988 Building & Building Improvements 20,982,806 1,375,454 (6,690,926) 15,667,334 Infrastructure 3,432,439 281,577 - 3,714,016 Transportation Equipment 24,888,593 4,123,522 (5,974,046) 23,038,069 Other Equipment 6,790,834 1,139,759 (933,430) 6,997,163 Total Accumulated Depreciation 56,094,672 6,920,312 (13,598,403) 49,416,581 Total Capital Assets Being Depreciated, Net 45,611,933 55,774,181
Total Capital Assets, Net 60,030,828$ 70,595,407$
5. PURCHASED TRANSPORTATION SERVICES
During 2013 and 2012, the Authority had a contract with a local transportation company to provide transit services within Summit County for elderly and handicapped persons. Expenses under this contract amounted to $611,026 and $834,256, in 2013 and 2012, respectively. All passenger fares related to these transit services are collected by the Authority and recorded as revenue.
37

METRO REGIONAL TRANSIT AUTHORITY
NOTES TO FINANCIAL STATEMENTS
For the Years Ended December 31, 2013 and 2012 6. EMPLOYEE RETIREMENT PLANS
The Authority participates in the Ohio Public Employees Retirement System. A. Ohio Public Employees Retirement System (OPERS) administers three separate
pension plans as described below:
1. The Traditional Pension Plan - a cost sharing, multiple-employer defined benefit pension plan.
2. The Member-Directed Plan - a defined contribution plan in which the member invests both member and employer contributions (employer contributions vest over five years at 20% per year). Under the Member-Directed Plan, members accumulate retirement assets equal to the value of member and (vested) employer contributions plus any investment earnings.
3. The Combined Plan - a cost sharing, multiple-employer defined benefit pension plan. Under the Combined Plan, OPERS invests employer contributions to provide a formula retirement benefit similar in nature to, but less than, the Traditional Pension Plan benefit. Member contributions, the investment of which is self-directed by the members, accumulate retirement assets in a manner similar to the Member-Directed Plan.
B. OPERS provides retirement, disability, survivor and death benefits and annual
cost-of living adjustments to members of the Traditional Pension and Combined Plans. Members of the Member-Directed Plan do not qualify for ancillary benefits.
C. Authority to establish and amend benefits is provided in Chapter 145 of the Ohio Revised Code.
D. OPERS issues a stand-alone financial report. Interested parties may obtain a copy by visiting https://www.opers.org/investments/cafr.shtml, by writing to OPERS, 277 East Town Street, Columbus, OH 43215-4642, or by calling 614-222-5601 or 800-222-7377.
38

METRO REGIONAL TRANSIT AUTHORITY
NOTES TO FINANCIAL STATEMENTS
For the Years Ended December 31, 2013 and 2012
6. EMPLOYEE RETIREMENT PLANS (Continued)
E. The Ohio Revised Code provides statutory authority for member and employer
contributions. For 2013, member and employer contribution rates were consistent across all three plans. Members in the state and local divisions may participate in all three plans.
F. The 2013 member contribution rates were 10.00% of covered payroll for members in state and local classifications. The 2013 employer contribution rate for state and local employers was 14.00% of covered payroll.
G. The Authority’s required contributions for pension obligations to the traditional and combined plans for the years ended December 31, 2013, 2012 and 2011 were $2,698,106, $2,180,303 and $2,105,400, respectively. The full amount has been contributed for 2012 and 2011. Ninety-two (92%) percent of the 2013 contribution has been made and the remaining eight (8%) balance was due in 2014. There were no contributions to the member-directed plan for 2013 or 2012.
H. In June 2012, the Governmental Accounting Standards Board (GASB) issued GASB Statement No. 68, Accounting and Financial Reporting for Pensions. This accounting standard replaces GASB Statement 27, and it is effective for employer fiscal years beginning after June 15, 2014.
39

METRO REGIONAL TRANSIT AUTHORITY
NOTES TO FINANCIAL STATEMENTS
For the Years Ended December 31, 2013 and 2012
7. POST EMPLOYMENT BENEFITS
A. Plan Description Ohio Public Employees Retirement System (OPERS) administers three separate pension plans: The Traditional Pension Plan—a cost-sharing, multiple-employer defined benefit pension plan; the Member-Directed Plan—a defined contribution plan; and the Combined Plan—a cost sharing, multiple-employer defined benefit pension plan that has elements of both a defined benefit and defined contribution plan.
OPERS maintains a cost-sharing multiple employer defined benefit post-employment health care plan, which includes a medical plan, prescription drug program and Medicare Part B premium reimbursement, to qualifying members of both the Traditional Pension and the Combined plans. Members of the Member-Directed Plan do not qualify for ancillary benefits, including post-employment health care coverage. In order to qualify for post-employment health care coverage, age-and-service retirees under the Traditional Pension and Combined plans must have 10 or more years of qualifying Ohio service credit. Health care coverage for disability benefit recipients and qualified survivor benefit recipients is available. The health care coverage provided by OPERS meets the definition of an Other Post Employment Benefit (OPEB) as described in GASB Statement 45. The Ohio Revised Code permits, but does not mandate, OPERS to provide the OPEB Plan to its eligible members and beneficiaries. Authority to establish and amend the OPEB Plan is provided in Chapter 145 of the Ohio Revised Code. OPERS issues a stand-alone financial report. Interested parties may obtain a copy by visiting https://www.opers.org/investments/cafr.shtml, by writing to OPERS, 277 East Town Street, Columbus, OH 43215-4642, or by calling 614-222-5601 or 800-222-7377. B. Funding Policy The Ohio Revised Code provides the statutory authority requiring public employers to fund post retirement health care coverage through their contributions to OPERS. A portion of each employer’s contribution to OPERS is set aside for the funding of post retirement health care coverage.
40

METRO REGIONAL TRANSIT AUTHORITY
NOTES TO FINANCIAL STATEMENTS
For the Years Ended December 31, 2013 and 2012
7. POST EMPLOYMENT BENEFITS (Continued) Employer contribution rates are expressed as a percentage of the covered payroll of active members. In 2013 and 2012, state and local employers contributed at a rate of 14.00% of covered payroll. OPERS’ Post Employment Health Care plan was established under, and is administrated in accordance with, Internal Revenue Code 401(h). Each year, the OPERS Board of Trustees determines the portion of the employer contribution rate that will be set aside for funding of post employment health care benefits. The portion of employer contributions allocated to health care for members in the Traditional Plan was 4.0% during calendar year 2012. The portion of employer contributions allocated to health care for members in the Combined Plan was 6.05% during calendar year 2012. These are the maximum employer contribution rates permitted by the Ohio Revised Code. Active members do not make contributions to the OPEB Plan. The portion of employer contributions allocated to health care for members in the Traditional Plan was 1.0% during calendar year 2013. The portion of employer contributions allocated to health care for members in the Combined Plan was 1% during calendar year 2013. Effective January 1, 2014, the portion of employer contributions allocated to healthcare was raised to 2 percent for both plans, as recommended by the OPERS Actuary. The OPERS Board of Trustees is also authorized to establish rules for the retiree or their surviving beneficiaries to pay a portion of the health care benefits provided. Payment amounts vary depending on the number of covered dependents and the coverage selected.
C. Information from employer’s records
The rates stated in Section B, above, are the contractually required contribution rates for OPERS. As part of this disclosure, it will be necessary for the employer to disclose the employer contributions actually made to fund post-employment benefits.
41

METRO REGIONAL TRANSIT AUTHORITY
NOTES TO FINANCIAL STATEMENTS
For the Years Ended December 31, 2013 and 2012
7. POST EMPLOYMENT BENEFITS (Continued)
The Authority’s contributions allocated to fund postemployment healthcare benefits for the years ended December 31, 2013, 2012 and 2011 were $172,645, $872,060 and $842,101 respectively. The full amount has been contributed for 2012 and 2011. Ninety-two (92%) percent of the 2013 contribution has been made and the remaining eight (8%) balance was due in 2014.
D. OPERS Board of Trustees Adopt Changes to the Health Care Plan
Changes to the health care plan were adopted by the OPERS Board of Trustees on September 19, 2012, with a transition plan commencing January 1, 2014. With the recent passage of pension legislation under SB 343 and the approved health care changes, OPERS expects to be able to consistently allocate 4 percent of the employer contributions toward the health care fund after the end of the transition period.
8. FEDERAL AND STATE GRANTS, REIMBURSEMENTS AND SPECIAL FARE ASSISTANCE
Grants, reimbursements and special fare assistance in the statements of revenues and expenses for the years ended December 31 2013 and 2012, consist of the following:
2013 2012FEDERAL:FTA Maintenance and Other Assistance $ 4,718,920 $ 5,962,190 FTA Capital Contribution 9,837,865 12,919,135 Total 14,556,785$ 18,881,325$
STATE:ODOT Fuel Tax Reimbursement 218,943 260,230 Total 218,943$ 260,230$
9. RISK MANAGEMENT
Since December 31, 1994, the Authority has been a member of the Ohio Transit Risk Pool (OTRP), a joint self-insurance pool, created pursuant to Section 2744.081 of the Ohio Revised Code. OTRP has been in existence since 1994 and operates pursuant to By-Laws and a Board of Trustees. OTRP provides self-insurance through risk retention and the group purchase of property and liability coverage from A-rated, or greater, commercial carriers.
42

METRO REGIONAL TRANSIT AUTHORITY
NOTES TO FINANCIAL STATEMENTS
For the Years Ended December 31, 2013 and 2012 9. RISK MANAGEMENT (Continued) During the loss year of 2013, OTRP provided to the Authority commercial property coverage with limits of $200,000,000. The pool retained the first $100,000 of these losses. For auto-physical damage the pool provided $50,000,000 in coverage and retained $250,000. For crime the pool provided $4,000,000 in coverage. METRO’s deductible for property coverage is $1,000 except for physical damage which was $25,000. For Auto Liability, General Liability, E&O and EBL the pool provided $10,000,000. For each of these lines the pool retained $1,000,000 per occurrence. METRO’s deductible for all liability claims was $5,000 for 2012 and 2013.
OTRP provides to the Treasurer of the Authority a bond as is required by Ohio law. As of January 1, 2013, the Authority has met all obligations to OTRP. The Authority pays OTRP through an initial contribution for purchased insurance and quarterly payments for their self-insured loss and administrative costs. The Authority’s contribution percentage for 2013 it was 28.755%. In 2012 it was 28.88%.
The Authority continues to carry commercial insurance for all other risks of loss, including workers' compensation and employee health and accident insurance. There has not been a reduction in coverage from the prior year and claims have not exceeded the coverage in any of the past three years. The Authority pays the State Worker’s Compensation System a premium based on a rate per $100 of salaries. The Authority’s contributions allocated to fund Worker’s Compensation benefits for the years ended December 31, 2013, 2012 and 2011 were $706,430, $711,510 and $759,362 respectively. The full amount has been contributed for those years.
10. CONTINGENCIES
The Authority received financial assistance from federal and state agencies in the form of grants. The disbursement of funds received under these grants requires compliance with terms and conditions specified in the grant agreements. These grants are subject to audit by the grantor agencies and disallowed claims resulting from these audits could become a liability of the Authority.
43

METRO REGIONAL TRANSIT AUTHORITY
NOTES TO FINANCIAL STATEMENTS
For the Years Ended December 31, 2013 and 2012 10. CONTINGENCIES (continued)
At December 31, 2013, there were no material questioned costs that had not been resolved with appropriate federal and state agencies. Questioned costs could still be identified during audits to be conducted in the future. In the opinion of the Authority’s management, no material grant expenditures will be disallowed.
11. SUBSEQUENT EVENTS/PENDING LITIGATION
The Authority has evaluated subsequent events for potential recognition and/or disclosure through the date of the financial statements. Management believes that any ongoing litigation in the normal course of business will not materially affect the Authority’s financial results or financial position.
12. FUEL PRICING MANAGEMENT PROGRAM
Pursuant to Ohio Revised Code sections 9.835 (A), (B) and (C) and Section 135.14, the Authority utilizes futures contracts and commodity swaps to manage the volatility of fuel costs. These techniques are traditional used to limit exposure to price fluctuations. Management recognized that fluctuations in fuel process could have a negative impact on the Authority’s financial affairs. Accordingly, the Authority has utilized futures contracts and firm-fixed price contracts to offset against price volatility of diesel fuel in accordance with the Authority’s Energy Price Risk Management Policy established by the Board of Trustees. These transactions are completely separate from the physical fuel purchase transactions. For the years ending December 31, 2013 and 2012, gains of $21,481 and $0 were recognized as a decrease in diesel fuel expense. On December 31, 2013 the open contracts for 2014 and 2015 had $96,542 and $121,742, respectively, of unrealized gain. The gain or loss amount realized will change based on the market price at the time of contract settlement. There is no debt associated with these contracts.
44

Statistical Section

Statistical Section – 2013
The Statistical Section includes Financial Trend Information, Revenue Capacity Information, Operating Information, Debt Capacity Information, and Demographic and Economic Information. Financial Trends and Revenue Capacity pages 45‐54 These schedules indicate how the Authority’s performance and conditions have changed over a ten year time frame. Also contained in these schedules is information to help the reader understand the Authority’s most significant revenue sources. Debt Capacity page 55 These schedules indicate the Authority’s debt service. Economic and Demographic Information pages 56‐58 These schedules contain economic and demographic indicators to help the reader understand the environment within which the Authority’s financial activities take place. Operating Information pages 59‐62 These schedules contain data to help the reader understand how the information in the Authority’s financial report relates to the services the Authority provides and the activities it performs.

Financial Trend Information
2013
(Unaudited) Table 1 – Net Position Table 2 – Changes in Net Position Table 3 – Revenues and Operating Assistance – Comparison to Industry Trend Data
Table 4 – Operating Expenses – Comparison to Industry Trend Data
Table 5 – Passenger Fares vs. Operating Expenses (Graph) Table 6 – Sales Tax: Comparison to other Regional Transit
Authorities in Ohio

TA
BL
E 1
2013
2012
2011
2010
2009
NE
T P
OS
ITIO
NN
et I
nves
tmen
t in
capi
tal a
sset
s77
,054
,974
$
70
,390
,408
$
59
,730
,829
$
55
,228
,863
$
49
,737
,003
$
Res
tric
ted
Unr
estr
icte
d (D
efic
its)
39,8
23,6
40
34,2
17,9
25
25,2
66,4
20
17,8
72,6
67
16,0
62,5
06
TO
TA
L N
ET
PO
SIT
ION
116,
878,
614
$
104,
608,
333
$
84,9
97,2
49$
73,1
01,5
30$
65,7
99,5
09$
2008
2007
2006
2005
2004
NE
T P
OS
ITIO
NN
et I
nves
tmen
t in
capi
tal a
sset
s47
,352
,867
$
37
,831
,113
$
38
,662
,489
$
39
,524
,117
$
42
,117
,832
$
Res
tric
ted
Unr
estr
icte
d (D
efic
its)
7,95
2,56
7
3,72
3,84
9
4,89
1,10
7
5,42
2,39
2
5,68
9,44
8
TO
TA
L N
ET
PO
SIT
ION
55,3
05,4
34$
41,5
54,9
62$
43,5
53,5
96$
44,9
46,5
09$
47,8
07,2
80$
Sou
rce:
ME
TR
O's
aud
ited
ann
ual f
inan
cial
sta
tem
ents
45
ME
TR
O R
egio
nal T
rans
it A
utho
rity
NE
T P
OS
ITIO
N B
Y C
OM
PO
NE
NT
(Una
udit
ed)
FO
R T
HE
LA
ST
TE
N F
ISC
AL
YE
AR
S

TABLE 22013 2012 2011 2010 2009
OPERATING REVENUES:
Passenger fares 4,998,875$ 4,846,581 4,207,746 4,004,439 3,758,642
Charter revenue - - - - -
Advertising and concessions 451,535 405,113 398,486 363,317 275,014
TOTAL OPERATING REVENUE 5,450,410$ 5,251,694 4,606,232 4,367,756 4,033,656
OPERATING EXPENSES
Labor 17,836,348$ 16,649,367 15,729,019 14,808,947 14,424,006
Fringe benefits 9,886,508 10,108,654 10,490,896 9,359,814 8,463,897
Materials and supplies 6,041,098 6,259,905 6,083,212 5,676,943 5,405,463
Services 2,198,643 2,349,651 2,320,702 2,331,548 2,342,761
Utilities 539,188 539,714 582,260 573,273 582,685
Casualty and liability 1,163,565 1,099,473 1,166,261 1,264,872 975,060
Taxes 228,390 273,560 276,498 250,354 229,918
Purchased transportation service 611,026 834,256 1,374,797 1,209,177 1,057,824
Miscellaneous 453,314 467,333 401,032 441,111 355,603
TOTAL OPERATING EXPENSES
BEFORE DEPRECIATION EXPENSE 38,958,080$ 38,581,913 38,424,677 35,916,039 33,837,217
OPERATING LOSSBEFORE DEPRECIATION EXPENSE (33,507,670)$ (33,330,219) (33,818,445) (31,548,283) (29,803,561)
Depreciation expense 8,513,768 6,920,312 6,397,734 6,237,556 6,446,278
OPERATING LOSS (42,021,438)$ (40,250,531) (40,216,179) (37,785,839) (36,249,839)
NON-OPERATING REVENUES (EXPENSES)
Sales tax revenue 38,536,699$ 39,686,825 36,279,210 34,521,101 33,616,287
Federal operating grants and reimbursements 4,718,920 5,962,190 5,998,391 4,123,465 3,655,202
State operating grants and special fare assistance 218,943 260,230 629,962 829,767 1,003,295
Student fare and other assistance 434,480 487,357 852,768 1,099,910 1,033,958
Investment loss 0 0 0 0 0
Interest income 35,095 73,074 92,127 55,230 14,130
Interest expense (10,250) (15,000) (19,234) (24,072) (19,050)
Gain (Loss) from disposal of assets 46,064 (75,107) 54,422 6,990 22,533
Other 473,903 562,911 366,555 441,795 310,553
NON-OPERATING REVENUES/EXPENSES - NET 44,453,854$ 46,942,480 44,254,201 41,054,186 39,636,908
CAPITAL CONTRIBUTIONSCapital Grant Contributions 9,837,865$ 12,919,135 7,583,812 6,059,733 7,107,006
CHANGE IN NET POSITION 12,270,281$ 19,611,084 11,621,834 9,328,080 10,494,075
Net Position, Beginning Balance 104,608,333 84,997,249 73,101,530 65,799,509 55,305,434
Prior Period Adjustment 0 - 273,885 (2,026,059) 0
Net Position, Ending Balance 116,878,614$ 104,608,333 84,997,249 73,101,530 65,799,509
Source: METRO's audited annual financial statements
46
METRO Regional Transit AuthoritySTATEMENT OF REVENUES, EXPENSES AND CHANGES IN NET POSITION
FOR THE LAST TEN FISCAL YEARS(Unaudited)
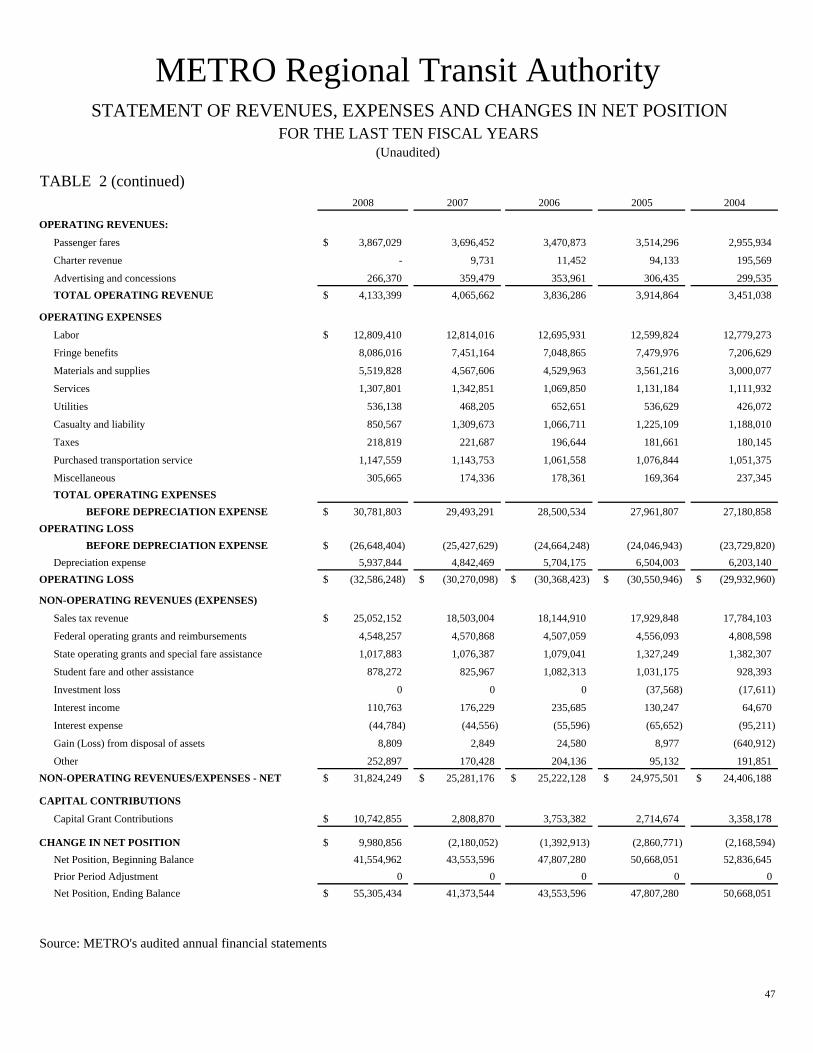
TABLE 2 (continued)2008 2007 2006 2005 2004
OPERATING REVENUES:
Passenger fares 3,867,029$ 3,696,452 3,470,873 3,514,296 2,955,934
Charter revenue - 9,731 11,452 94,133 195,569
Advertising and concessions 266,370 359,479 353,961 306,435 299,535
TOTAL OPERATING REVENUE 4,133,399$ 4,065,662 3,836,286 3,914,864 3,451,038
OPERATING EXPENSES
Labor 12,809,410$ 12,814,016 12,695,931 12,599,824 12,779,273
Fringe benefits 8,086,016 7,451,164 7,048,865 7,479,976 7,206,629
Materials and supplies 5,519,828 4,567,606 4,529,963 3,561,216 3,000,077
Services 1,307,801 1,342,851 1,069,850 1,131,184 1,111,932
Utilities 536,138 468,205 652,651 536,629 426,072
Casualty and liability 850,567 1,309,673 1,066,711 1,225,109 1,188,010
Taxes 218,819 221,687 196,644 181,661 180,145
Purchased transportation service 1,147,559 1,143,753 1,061,558 1,076,844 1,051,375
Miscellaneous 305,665 174,336 178,361 169,364 237,345
TOTAL OPERATING EXPENSESBEFORE DEPRECIATION EXPENSE 30,781,803$ 29,493,291 28,500,534 27,961,807 27,180,858
OPERATING LOSSBEFORE DEPRECIATION EXPENSE (26,648,404)$ (25,427,629) (24,664,248) (24,046,943) (23,729,820)
Depreciation expense 5,937,844 4,842,469 5,704,175 6,504,003 6,203,140
OPERATING LOSS (32,586,248)$ (30,270,098)$ (30,368,423)$ (30,550,946)$ (29,932,960)$
NON-OPERATING REVENUES (EXPENSES)
Sales tax revenue 25,052,152$ 18,503,004 18,144,910 17,929,848 17,784,103
Federal operating grants and reimbursements 4,548,257 4,570,868 4,507,059 4,556,093 4,808,598
State operating grants and special fare assistance 1,017,883 1,076,387 1,079,041 1,327,249 1,382,307
Student fare and other assistance 878,272 825,967 1,082,313 1,031,175 928,393
Investment loss 0 0 0 (37,568) (17,611)
Interest income 110,763 176,229 235,685 130,247 64,670
Interest expense (44,784) (44,556) (55,596) (65,652) (95,211)
Gain (Loss) from disposal of assets 8,809 2,849 24,580 8,977 (640,912)
Other 252,897 170,428 204,136 95,132 191,851
NON-OPERATING REVENUES/EXPENSES - NET 31,824,249$ 25,281,176$ 25,222,128$ 24,975,501$ 24,406,188$
CAPITAL CONTRIBUTIONS
Capital Grant Contributions 10,742,855$ 2,808,870 3,753,382 2,714,674 3,358,178
CHANGE IN NET POSITION 9,980,856$ (2,180,052) (1,392,913) (2,860,771) (2,168,594)
Net Position, Beginning Balance 41,554,962 43,553,596 47,807,280 50,668,051 52,836,645
Prior Period Adjustment 0 0 0 0 0
Net Position, Ending Balance 55,305,434$ 41,373,544 43,553,596 47,807,280 50,668,051
Source: METRO's audited annual financial statements
47
(Unaudited)FOR THE LAST TEN FISCAL YEARS
STATEMENT OF REVENUES, EXPENSES AND CHANGES IN NET POSITION
METRO Regional Transit Authority

TABLE 3
TRANSPORTATION INDUSTRY (1):
OPERATING AND OTHER REVENUE TOTAL YEAR PASSENGER OTHER (2) TOTAL LOCAL STATE FEDERAL TOTAL REVENUES
2004 32.9% 16.7% 49.6% 20.8% 22.6% 7.0% 50.4% 100.0%2005 32.4% 15.7% 48.1% 21.0% 23.6% 7.3% 51.9% 100.0%2006 33.2% 15.2% 48.4% 21.1% 22.8% 7.7% 51.6% 100.0%2007 31.4% 6.5% 37.9% 31.0% 23.6% 7.5% 62.1% 100.0%2008 31.3% 6.4% 37.7% 29.5% 25.8% 7.0% 62.3% 100.0%2009 31.5% 5.8% 37.4% 29.0% 25.3% 8.2% 62.6% 100.0%2010 32.1% 5.4% 37.5% 28.1% 25.0% 9.4% 62.5% 100.0%2011 32.8% 4.9% 37.7% 28.2% 24.3% 9.8% 62.3% 100.0%
2012 *2013 *
METRO Regional Transit Authority
OPERATING AND OTHER REVENUE TOTAL YEAR PASSENGER OTHER (2) TOTAL LOCAL STATE FEDERAL TOTAL REVENUES
2004 10.3% 2.6% 12.9% 65.4% 4.8% 16.8% 87.1% 100.0%2005 12.1% 2.0% 14.2% 65.5% 4.6% 15.7% 85.8% 100.0%2006 11.9% 2.8% 14.7% 66.1% 3.7% 15.5% 85.3% 100.0%2007 12.6% 2.4% 15.0% 65.8% 3.7% 15.6% 85.0% 100.0%2008 10.7% 1.8% 12.5% 72.0% 2.8% 12.6% 87.5% 100.0%2009 8.6% 1.4% 10.0% 79.4% 2.3% 8.4% 90.0% 100.0%2010 8.8% 1.9% 10.7% 78.4% 1.8% 9.1% 89.3% 100.0%2011 8.6% 1.8% 10.4% 76.1% 1.3% 12.3% 89.6% 100.0%2012 9.3% 2.0% 11.3% 76.8% 0.5% 11.4% 88.7% 100.0%2013 9.8% 1.9% 11.6% 78.7% 0.4% 9.2% 88.4% 100.0%
(1) Source: The American Public Transit Association, "APTA 2013 Transit Fact Book - Table 26"
(2) Includes auxiliary transportation revenues, interest, and other non-transportation revenues
* Information not available
48
OPERATING ASSISTANCE
OPERATING ASSISTANCE
METRO Regional Transit AuthorityRevenue and Operating Assistance - Comparison to Industry Trend Data
Last Ten Years(Unaudited)

TABLE 4
TRANSPORTATION INDUSTRY (1):
Labor & Material & Casualty & Purchased TotalYear Fringes Supplies Services Utilities Liability Transportation Other Expenses
2004 68.7% 9.1% 5.8% 3.0% 2.6% 13.4% -2.6% 100.0%2005 66.9% 10.1% 5.8% 3.2% 2.5% 13.8% -2.3% 100.0%2006 66.1% 11.3% 5.9% 3.2% 2.5% 13.4% -2.4% 100.0%2007 65.8% 11.6% 6.1% 3.4% 2.4% 13.0% -2.3% 100.0%2008 63.9% 12.8% 6.3% 3.4% 2.2% 13.7% -2.3% 100.0%2009 64.8% 11.3% 6.6% 3.5% 2.3% 14.0% -2.5% 100.0%2010 65.2% 10.7% 6.6% 3.4% 2.6% 13.8% -2.3% 100.0%2011 65.0% 11.4% 6.6% 3.3% 2.6% 13.3% -2.2% 100.0%
2012 *2013 *
METRO Regional Transit Authority (2)
Labor & Material & Casualty & Purchased TotalYear Fringes Supplies Services Utilities Liability Transportation Other Expenses
2004 73.3% 11.0% 4.1% 1.6% 4.4% 3.9% 1.7% 100.0%2005 71.6% 12.7% 4.0% 1.9% 4.4% 3.8% 1.6% 100.0%2006 69.3% 15.7% 3.8% 2.3% 3.7% 3.7% 1.5% 100.0%2007 68.6% 15.5% 4.5% 1.6% 4.4% 3.9% 1.5% 100.0%2008 67.8% 17.9% 4.2% 1.7% 2.8% 3.7% 1.9% 100.0%2009 67.6% 16.0% 6.9% 1.7% 2.9% 3.1% 1.8% 100.0%2010 67.2% 15.8% 6.5% 1.6% 3.5% 3.4% 2.0% 100.0%2011 68.2% 15.8% 6.0% 1.5% 3.0% 3.6% 1.8% 100.0%2012 69.3% 16.2% 6.1% 1.4% 2.8% 2.2% 2.0% 100.0%2013 71.1% 15.5% 5.6% 1.4% 3.0% 1.6% 1.8% 100.0%
(1) Source: The American Public Transit Association, "APTA 2013 Transit Fact Book - Table 22"
(2) Source: METRO's annual financial audited statements
* Information not available
49
METRO Regional Transit AuthorityOperating Expenses - Comparison to Industry Trend Data
Last Ten Years(Unaudited)

METRO Regional Transit Authority TABLE 5
50

TA
BL
E 6
Sys
tem
Rat
eD
ate
Impo
sed
2004
2005
2006
2007
2008
*20
0920
1020
1120
1220
13
GC
RT
A1.
00%
Oct
1, 1
975
167,
894,
949
167,
165,
307
169,
262,
438
173,
161,
230
170,
707,
698
155,
282,
828
163,
220,
649
173,
242,
328
181,
219,
251
189,
630,
644
CO
TA
0.50
%Ja
n 1,
200
844
,940
,803
44,7
41,9
7946
,371
,674
47,5
98,9
9588
,246
,021
87,8
19,5
5391
,961
,890
97,9
52,5
1510
4,47
9,13
011
0,04
9,66
1
Lak
etra
n0.
25%
Aug
1, 1
988
7,63
7,13
57,
552,
509
7,72
8,33
37,
913,
161
7,74
4,81
57,
157,
306
7,24
0,99
97,
665,
538
7,84
3,54
88,
142,
460
WR
TA
0.25
%A
pr 1
, 200
94,
167,
214
6,73
2,48
57,
343,
527
7,59
0,58
07,
886,
661
GD
RT
A0.
50%
Jul 1
, 198
032
,783
,222
32,9
23,9
8532
,363
,030
32,1
85,3
7032
,149
,806
29,3
41,6
9730
,150
,943
32,7
59,6
1734
,312
,875
35,2
90,3
73
PA
RT
A0.
25%
Feb
1, 2
002
3,39
0,06
13,
412,
879
3,58
3,44
53,
705,
852
3,77
5,72
63,
608,
868
3,91
4,53
74,
080,
738
4,31
9,28
14,
496,
596
SA
RT
A0.
25%
Jul 1
, 199
711
,371
,235
11,2
87,3
3311
,525
,065
11,7
85,6
9111
,696
,465
10,4
10,5
8111
,016
,628
11,7
20,0
2712
,401
,259
12,9
54,3
97
ME
TR
O0.
50%
Jul 1
, 200
817
,605
,364
17,7
49,8
4517
,989
,459
18,3
06,1
5524
,848
,457
32,8
29,0
0134
,194
,603
35,8
42,0
8137
,713
,252
39,3
20,3
06
Sou
rce:
F
igur
es s
how
n ar
e fr
om r
ecor
ds o
f th
e R
even
ue A
ccou
ntin
g D
ivis
ion
of th
e O
hio
Dep
artm
ent o
f T
axat
ion
Not
e:
The
se f
igur
es a
re n
et o
f th
e 1%
adm
inis
trat
ion
fee.
The
se a
mou
nts
are
base
d on
mon
th s
ales
tax
coll
ecte
d, th
e di
stri
buti
on o
ccur
s tw
o m
onth
s fo
llow
ing
the
coll
ecti
on m
onth
.
Num
bers
are
on
a ca
sh b
asis
.
* C
OT
A in
crea
sed
the
sale
s ta
x pe
rcen
t fro
m .2
5% to
.50%
on
Janu
ary
1, 2
008
* M
ET
RO
incr
ease
d th
e sa
les
tax
perc
ent f
rom
.25%
to .5
0% o
n Ju
ly 1
, 200
8
51
Las
t Ten
Yea
rs
Sal
es T
ax -
Com
pari
son
to o
ther
Reg
iona
l Tra
nsit
Aut
hori
ties
in O
hio
ME
TR
O R
egio
nal T
rans
it A
utho
rity
(Una
udit
ed)

Revenue Capacity Information
2013 (Unaudited)
Table 7 – Revenues by Source Table 8 – Revenues by Source (Graph) Table 9 – Expenses by Object Class

TA
BL
E 7
Ope
rati
ng R
even
ues
2004
2005
2006
2007
2008
2009
2010
2011
2012
2013
Pas
seng
ers
Far
es$2
,955
,934
$3,5
14,2
96$3
,470
,873
$3,6
96,4
52$3
,867
,029
$3,7
58,6
42$4
,004
,439
$4,2
07,7
46$4
,846
,581
$4,9
98,8
75
Cha
rter
Far
es19
5,56
994
,133
11,4
529,
731
00
00
00
Adv
erti
sing
299,
535
306,
435
353,
961
359,
479
266,
370
275,
014
363,
317
398,
486
405,
113
451,
535
Tot
al o
pera
ting
rev
enue
s3,
451,
038
3,91
4,86
43,
836,
286
4,06
5,66
24,
133,
399
4,03
3,65
64,
367,
756
4,60
6,23
25,
251,
694
5,45
0,41
0
Non
-ope
rati
ng R
even
ues
Sal
es T
ax r
even
ue17
,784
,103
17,9
29,8
4818
,144
,910
18,5
03,0
0425
,052
,152
33,6
16,2
8734
,521
,101
36,2
79,2
1039
,686
,825
38,5
36,6
99
Fed
eral
gra
nts
4,80
8,59
84,
556,
093
4,50
7,05
94,
570,
868
4,54
8,25
73,
655,
202
4,12
3,46
55,
998,
391
5,96
2,19
04,
718,
920
Sta
te g
rant
s1,
382,
307
1,32
7,24
91,
079,
041
1,07
6,38
71,
017,
883
1,00
3,29
582
9,76
762
9,96
226
0,23
021
8,94
3
Stu
dent
far
es a
ssis
tanc
e92
8,39
31,
031,
175
1,08
2,31
382
5,96
787
8,27
21,
033,
958
1,09
9,91
085
2,76
848
7,35
743
4,48
0
Inte
rest
inco
me
30,0
6392
,679
235,
685
176,
229
110,
763
14,1
3055
,230
92,1
2773
,074
35,0
95
Gai
n (l
oss)
fro
m d
ispo
sal o
f as
sets
(640
,912
)8,
977
24,5
802,
849
8,80
922
,533
6,99
054
,422
(75,
107)
46,0
64
Oth
er n
on-t
rans
port
atio
n re
venu
e20
8,84
795
,132
204,
136
170,
428
252,
897
310,
553
441,
795
366,
555
562,
911
473,
903
Tot
al n
on-o
pera
ting
rev
enue
s24
,501
,399
25,0
41,1
5325
,277
,724
25,3
25,7
3231
,869
,033
39,6
55,9
5841
,078
,258
44,2
73,4
3546
,957
,480
44,4
64,1
04
Tot
al R
even
ues
$27,
952,
437
$28,
956,
017
$29,
114,
010
$29,
391,
394
$36,
002,
432
$43,
689,
614
$45,
446,
014
$48,
879,
667
$52,
209,
174
$49,
914,
514
Sou
rce:
ME
TR
O's
inde
pend
entl
y au
dite
d an
nual
fin
anci
al s
tate
men
ts
52
ME
TR
O R
egio
nal T
rans
it A
utho
rity
Rev
enue
s by
Sou
rce
- L
ast T
en Y
ears
(Una
udit
ed)

METRO Regional Transit Authority TABLE 8
53

TA
BL
E 9
Ope
rati
ng E
xpen
ses
2004
2005
2006
2007
2008
2009
2010
2011
2012
2013
Lab
or$1
2,77
9,27
3$1
2,59
9,82
4$1
2,69
5,93
1$1
2,81
4,01
6$1
2,80
9,41
0$1
4,42
4,00
6$1
4,80
8,94
7$1
5,72
9,01
9$1
6,64
9,36
7$1
7,83
6,34
8
Fri
nge
Ben
efit
s7,
206,
629
7,47
9,97
67,
048,
865
7,45
1,16
48,
086,
016
8,46
3,89
79,
359,
814
10,4
90,8
9610
,108
,654
9,88
6,50
8
Mat
eria
ls a
nd S
uppl
ies
3,00
0,07
73,
561,
216
4,52
9,96
34,
567,
606
5,51
9,82
85,
405,
463
5,67
6,94
36,
083,
212
6,25
9,90
56,
041,
098
Ser
vice
s1,
111,
932
1,13
1,18
41,
069,
850
1,34
2,85
11,
307,
801
2,34
2,76
12,
331,
548
2,32
0,70
22,
349,
651
2,19
8,64
3
Uti
liti
es42
6,07
253
6,62
965
2,65
146
8,20
553
6,13
858
2,68
557
3,27
358
2,26
053
9,71
453
9,18
8
Cas
ualt
y an
d L
iabi
lity
1,18
8,01
01,
225,
109
1,06
6,71
11,
309,
673
850,
567
975,
060
1,26
4,87
21,
166,
261
1,09
9,47
31,
163,
565
Tax
es18
0,14
518
1,66
119
6,64
422
1,68
721
8,81
922
9,91
825
0,35
427
6,49
827
3,56
022
8,39
0
Pur
chas
ed T
rans
port
atio
n1,
051,
375
1,07
6,84
41,
061,
558
1,14
3,75
31,
147,
559
1,05
7,82
41,
209,
177
1,37
4,79
783
4,25
661
1,02
6
Inte
rest
Exp
ense
95,2
1165
,652
55,5
9644
,556
44,7
8419
,050
24,0
7219
,234
15,0
0010
,250
Mis
cell
aneo
us23
7,34
516
9,36
417
8,36
117
4,33
630
5,66
535
5,60
344
1,11
140
1,03
246
7,33
345
3,31
4
Tot
al27
,276
,069
28,0
27,4
5928
,556
,130
29,5
37,8
4730
,826
,587
33,8
56,2
6735
,940
,111
38,4
43,9
1138
,596
,913
38,9
68,3
30
Dep
reci
atio
n6,
173,
717
6,20
3,14
05,
704,
175
4,84
2,46
95,
937,
844
6,44
6,27
86,
237,
556
6,39
7,73
46,
920,
312
8,51
3,76
8
Tot
al E
xpen
ses
$33,
449,
786
$34,
230,
599
$34,
260,
305
$34,
380,
316
$36,
764,
431
$40,
302,
545
$42,
177,
667
$44,
841,
645
$45,
517,
225
$47,
482,
098
Sou
rce:
ME
TR
O's
aud
ited
ann
ual f
inan
cial
sta
tem
ents
54
ME
TR
O R
egio
nal T
rans
it A
utho
rity
Exp
ense
s by
Obj
ect C
lass
- L
ast T
en y
ears
(Una
udit
ed)

Debt Capacity Information
2013 (Unaudited)
Table 10 – Debt Service

Tab
le 1
0
GE
NE
RA
LT
OT
AL
PE
RC
EN
TA
GE
BO
ND
OB
LIG
AT
ION
PE
RS
ON
AL
OF
PE
RS
ON
AL
DE
BT
YE
AR
BO
ND
S (
1)P
OP
UL
AT
ION
(4)
INC
OM
E (
5)IN
CO
ME
PE
R C
AP
ITA
2004
2,11
7,02
9(2
)54
5,54
518
,055
,061
0.01
2%$3
.88
2005
1,78
2,02
9(3
)54
5,34
718
,746
,168
0.01
0%$3
.27
2006
1,00
5,00
054
5,93
119
,596
,752
0.00
5%$1
.84
2007
650,
000
543,
899
20,9
12,7
960.
003%
$1.2
020
0857
0,00
054
2,56
221
,687
,810
0.00
3%$1
.05
2009
485,
000
542,
405
20,7
63,0
830.
002%
$0.8
920
1039
5,00
054
1,78
621
,160
,681
0.00
2%$0
.73
2011
300,
000
541,
227
22,2
05,7
880.
001%
$0.5
520
1220
5,00
054
0,81
123
,257
,941
0.00
1%$0
.38
2013
105,
000
541,
824
**
$0.1
9
(1)
Tot
al p
rinc
ipal
due
on
all o
utst
andi
ng d
ebt.
(2)
In 2
004
ME
TR
O r
efin
ance
the
rem
aini
ng b
alan
ce o
f bo
nds
issu
ed in
199
2 an
d in
crea
sed
the
bond
deb
t by
$430
,000
. B
onds
are
pay
able
thro
ugh
2014
.
(3)
In 2
003
ME
TR
O e
nter
ed in
to a
no
inte
rest
loan
agr
eem
ent w
ith
the
Sta
te o
f O
hio,
Dep
artm
ent o
f T
rans
port
atio
n fo
r a
Sta
te I
nfra
stru
ctur
e B
ank
(SIB
) lo
an o
f $4
42,0
29 w
hich
was
pai
d in
ful
l in
2005
.
(4)
U.S
. Bur
eau
of C
ensu
s, B
urea
u of
Lab
or S
tati
stic
s, P
opul
atio
n fo
r S
umm
it C
ount
y, O
hio
(5)
U. S
. Bur
eau
of E
cono
mic
Ana
lysi
s, T
otal
Per
sona
l Inc
ome
(TP
I) e
stim
ates
are
in th
ousa
nds
of d
olla
rs, n
ot a
djus
ted
for
infl
atio
n
* =
Not
Ava
ilab
le
55
ME
TR
O R
egio
nal T
rans
it A
utho
rity
Deb
t Ser
vice
(Una
udit
ed)

Demographic & Economic Information
2013
(Unaudited) Table 11 – Demographic Statistics Table 12 – Personal Income (graph) Table 13 – Largest Employers

TABLE 11
Per Capita Personal K - 12 School UnemploymentYear Population Income Income Enrollment Rate
(1) (2) (2) (3) (4)
2004 545,545 33,594 18,055,061 83,555 6.1%2005 545,347 34,822 18,746,168 83,231 5.7%2006 545,931 36,698 19,596,752 82,122 5.2%2007 543,899 38,423 20,912,796 80,682 5.4%2008 542,562 39,932 21,687,810 80,598 6.2%2009 542,405 38,299 20,763,083 75,791 9.8%2010 541,652 39,079 21,160,681 76,073 10.0%2011 541,227 41,135 22,205,788 73,414 8.5%2012 540,811 43,006 23,257,941 75,084 6.8%2013 541,824 * * * 6.9%
Note: All information is presented for Summit County, Ohio
Personal Income ($000)
Sources: (1) U.S. Bureau of Census, Bureau of Labor Statistics
(2) Bureau of Economic Analysis
(3) Ohio Department of Education - enrollment data
(4) Bureau of Labor Statistics
* Information not available
56
METRO Regional Transit Authority
Demographic Statistics
(Unaudited)Last Ten Years

METRO Regional Transit Authority TABLE 12
Source: Bureau of Economic Analysis Note: Personal Income ($000)
2012 is the last year data is available
57

TA
BL
E 1
3
2005
2007
2009
2010
2011
2012
2013
Com
pany
/Org
aniz
atio
nE
mpl
oyee
sE
mpl
oyee
sE
mpl
oyee
sE
mpl
oyee
sE
mpl
oyee
sE
mpl
oyee
sE
mpl
oyee
s
Sum
ma
Hea
lth
Sys
tem
3,65
06,
104
10,0
006,
926
6,93
86,
959
7,40
3
Akr
on G
ener
al H
ealt
h S
yste
m**
4,26
34,
277
3,83
83,
698
3,87
93,
639
Akr
on S
choo
l Dis
tric
t3,
000
3,05
03,
095
3,38
53,
370
3,76
03,
582
Sum
mit
Cou
nty
**3,
470
3,46
83,
588
3,35
73,
345
3,32
4
Akr
on C
hild
ren'
s H
ospi
tal
1,54
32,
569
2,68
11,
697
1,78
53,
157
3,24
4
Goo
dyea
r T
ire
& R
ubbe
r C
ompa
ny4,
700
3,50
23,
000
3,00
03,
000
3,00
03,
000
Ste
rlin
g Je
wel
ers,
Inc
.1,
313
1,92
32,
045
2,25
02,
250
2,26
82,
613
Uni
vers
ity
of A
kron
Akr
on**
2,84
72,
845
2,49
92,
533
2,52
62,
427
Fir
stE
nerg
y C
orp
****
****
**2,
456
2,34
5
Fir
stM
erit
Cor
pora
tion
*1,
475
2,69
72,
695
3,05
83,
018
2,00
02,
000
Cit
y of
Akr
on A
kron
3,00
02,
520
2,15
01,
951
1,74
01,
725
1,80
2
Bab
cock
& W
ilco
x, C
o**
****
1,94
11,
923
1,94
01,
771
Acm
e F
resh
Mar
kets
2,00
0**
1,65
01,
403
1,35
61,
452
1,62
9
Die
bold
Inc
. **
2,00
2**
1,87
31,
813
1,76
51,
614
Gia
nt E
agle
, Inc
****
**1,
522
1,53
21,
573
1,53
1
Info
Cis
ion
Man
agem
ent C
orp
****
**1,
244
1,45
81,
460
1,36
0
All
stat
e In
sura
nce
Co.
**1,
627
1,62
51,
403
1,24
81,
298
1,29
8
Jo-A
nn S
tore
s, I
nc**
****
****
1,17
31,
267
Sou
rces
: Akr
on C
ham
ber
of C
omm
erce
(20
05, 2
007
and
2009
), A
kron
Bea
con
Jour
nal n
ewsp
aper
art
icle
s (2
010-
2013
)
Not
e: I
nfor
mat
ion
2004
and
pro
ir, 2
006
and
2008
are
not
ava
ilab
le
*
= I
nlcu
des
empl
oyee
s ou
tsid
e of
Sum
mit
Cou
nty,
Ohi
o
**
= I
nfor
mat
ion
not a
vila
ble
for
the
year
list
ed
58
ME
TR
O R
egio
nal T
rans
it A
utho
rity
Sum
mit
Cou
nty,
Ohi
o -
Lar
gest
Em
ploy
ers
(Una
udit
ed)

Operating Information
2013 (Unaudited)
Table 14 – Operating Statistics Table 15 – Fare Rate Structure Table 16 – Miscellaneous Statistics

TA
BL
E 1
4
2004
2005
2006
2007
2008
2009
2010
2011
2012
2013
Sys
tem
Rid
ersh
ip (
1)M
otor
Bus
5,56
2,40
65,
534,
269
5,61
2,01
15,
290,
612
5,50
1,36
74,
792,
622
4,79
8,74
55,
044,
895
5,23
0,11
85,
189,
095
Dem
and
Res
pons
e21
6,25
217
9,65
215
3,33
621
2,14
421
4,00
023
0,80
822
7,94
928
1,26
427
0,28
023
9,14
1
Ave
rage
Wee
kday
Sys
tem
Rid
ersh
ip (
1)M
otor
Bus
19,2
1019
,466
19,7
9518
,490
19,0
3316
,342
16,5
0717
,264
17,9
2717
,734
Dem
and
Res
pons
e82
869
559
682
682
788
988
582
690
392
2
Tot
al V
ehic
le M
iles
(1)
Mot
or B
us3,
363,
806
3,19
6,71
83,
110,
541
3,30
6,37
43,
351,
379
3,76
2,51
43,
786,
757
3,80
6,02
14,
242,
323
4,37
7,92
5
Dem
and
Res
pons
e2,
220,
854
2,09
0,66
81,
571,
295
1,49
1,10
41,
511,
480
1,85
3,84
31,
451,
973
1,96
8,70
92,
027,
448
1,96
7,49
2
Tot
al R
even
ue M
iles
(1)
Mot
or B
us2,
930,
046
2,70
2,62
22,
647,
393
2,66
5,09
82,
672,
512
3,02
0,06
53,
057,
428
3,12
9,67
53,
540,
815
3,71
7,67
3
Dem
and
Res
pons
e2,
005,
785
1,83
1,63
11,
418,
170
1,37
3,63
81,
368,
460
1,62
0,67
11,
213,
859
1,70
4,81
31,
820,
017
1,75
3,50
1
Pas
seng
er M
iles
(1)
Mot
or B
us20
,641
,957
21,2
15,0
5821
,432
,595
21,4
88,6
1622
,171
,408
19,5
21,8
7119
,720
,879
18,7
14,7
4917
,201
,858
22,4
12,5
79
Dem
and
Res
pons
e99
9,20
81,
158,
916
947,
262
1,23
7,76
61,
399,
324
1,38
1,93
91,
218,
265
1,70
4,81
31,
540,
795
1,51
5,77
8
(Continued) 59
ME
TR
O R
egio
nal T
rans
it A
utho
rity
Ope
rati
ng S
tati
stic
s -
Las
t Ten
Yea
rs(U
naud
ited
)

2004
2005
2006
2007
2008
2009
2010
2011
2012
2013
Ful
l Tim
e E
mpl
oyee
s (1
)32
232
632
631
232
435
234
936
536
638
2
Tot
al V
ehic
le H
ours
(1)
Mot
or B
us26
1,81
826
0,73
425
5,17
425
5,50
825
1,55
226
6,76
228
4,61
929
6,03
630
6,88
633
2,95
3
Dem
and
Res
pons
e13
1,57
813
1,03
811
1,83
211
8,48
811
1,92
011
9,16
512
7,55
913
0,38
913
3,19
212
1,98
0
Tot
al V
ehic
le R
even
ue H
ours
(1)
Mot
or B
us22
9,08
422
9,00
822
8,46
922
6,73
422
6,39
724
0,12
725
6,79
226
7,13
427
6,96
230
2,39
2
Dem
and
Res
pons
e12
6,20
512
5,18
510
7,11
211
2,69
210
4,79
610
2,53
910
4,28
811
2,92
912
2,49
311
0,44
4
Veh
icle
Acc
iden
ts a
vera
ge p
er m
onth
(2)
Mot
or B
us3.
62.
17.
76.
85.
87.
36.
88.
38.
67.
1
Dem
and
Res
pons
e1.
51.
81.
52.
12.
42.
31.
23.
33.
43.
5
Mil
es b
etw
een
Roa
dcal
ls (
2)3,
538
2,62
94,
391
4,22
62,
650
3,33
43,
140
4,44
85,
453
5,49
4
Tot
al R
even
ue V
ehic
les
(1)
Mot
or B
us13
712
211
710
911
112
513
912
313
813
7
Dem
and
Res
pons
e14
414
815
214
513
915
016
716
715
611
5
(1)
ME
TR
O's
ann
ual "
Nat
iona
l Tra
nsit
Dat
abas
e" a
s re
port
ed to
Fed
eral
Tra
nsit
Adm
inis
trat
ion
(2)
ME
TR
O's
Mon
thly
Per
form
ance
rep
ort
Not
e: D
eman
d R
espo
nse
incl
udes
dir
ectl
y op
erat
ed a
nd p
urch
ased
tran
spor
tati
on
60
(Una
udit
ed)
ME
TR
O R
egio
nal T
rans
it A
utho
rity
Ope
rati
ng S
tati
stic
s -
Las
t Ten
Yea
rs (
Con
tinu
ed)

TABLE 15
Cash fares
General - Line Service 1.25$ Senior / Disability - Line Service 0.50 North Coast Express 5.00 Call-A-Bus 4.00 SCAT 2.00 SCAT ADA 2.50
Tickets/Passes
10 Ride Pass - North Coast Express 40.00$ Ten Ride - SCAT Ticket 20.00 Day Pass - Line Service 2.50 31 Day Pass - Line Service General $50.00 Senior / Disability 30.00
Source: METRO's Fare resolution passed by the Board of Trustees on July 31, 2013
61
METRO Regional Transit Authority
Fare Rate Structure as of December 31, 2013

TABLE 16
Date METRO was created August 26, 1969
Form of Government Regional Transit AuthorityBoard of Trustees
Number of Trustees 12
Type of tax support 1/2 of 1 percent sales and use tax
for Summit County
Size of service area (Square miles) 419.92
Population of County (2013) 541,824
Miles of routes 442.4
Number of buses (Directly Operated) Motor bus 137 Demand Response 91
Number of routes 33
Customer Service information calls answered (2013) 222,969
SCAT Reservation calls answered (2013) 169,139
62
METRO Regional Transit Authority
Miscellaneous Statistics(Unaudited)

This page intentionally left blank

88 East Broad Street, Fourth Floor, Columbus, Ohio 43215-3506 Phone: 614-466-4514 or 800-282-0370 Fax: 614-466-4490
www.ohioauditor.gov
METRO REGIONAL TRANSIT AUTHORITY
SUMMIT COUNTY
CLERK’S CERTIFICATION This is a true and correct copy of the report which is required to be filed in the Office of the Auditor of State pursuant to Section 117.26, Revised Code, and which is filed in Columbus, Ohio.
CLERK OF THE BUREAU CERTIFIED JULY 31, 2014