metsä board q4/2015 and other ir... · •metsä board is market leader in folding boxboard in...
TRANSCRIPT
Metsä BoardInvestor presentation Q4/2015
Metsä BoardInvestor presentation Q4/2015

2
Contents
Q4 2015
Investment highlights 3
Operating environment and market position 15
Strategic cornerstones and financial targets 22
Finalising the transformation 30
Q4/2015 results and outlook 38
Balance sheet and funding 50
Product development and capital expenditure 59
Capacity and deliveries 64
Cost structure and sourcing 69
Sustainability 74
General information 81
Owners 90
Contact information 93

Investment highlights

Metsä Board in brief
4
• Metsä Board is market leader in folding boxboard in
Europe and global market leader in coated white top
kraftliner
• Best-in class profitability and technology leader
• Steady cash flow generation and strong balance sheet
• Strong fibre know-how and self-sufficiency in pulp
• Valuable holdings in Metsä Fibre (24.9%) and
Pohjolan Voima (2.6%)
• Global sales to over 100 countries and eight production
units in Finland and Sweden
Sales split2015
Paperboard*
Paper
Sales by region 2015
EMEA
Americas
APAC
*) Includes market pulpQ4 2015
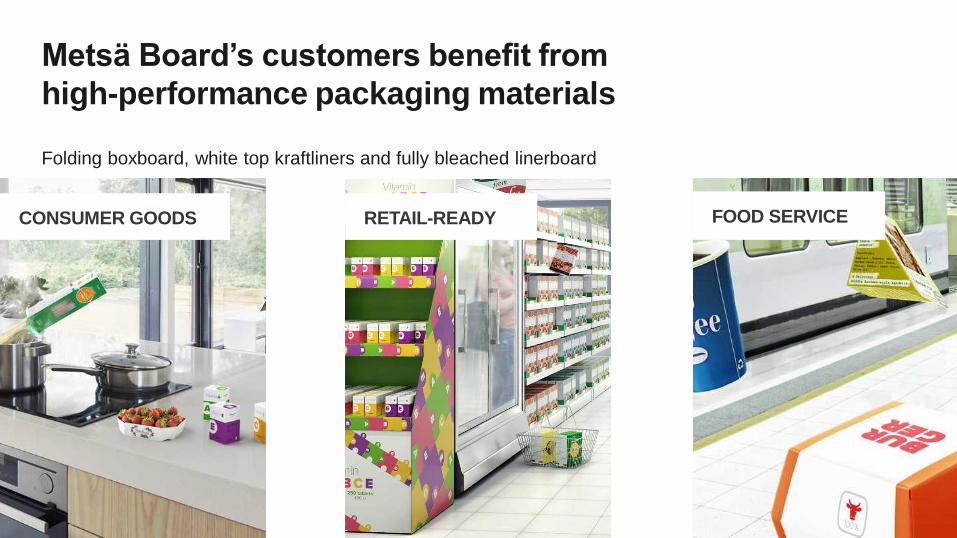
RETAIL-READY FOOD SERVICECONSUMER GOODS
Metsä Board’s customers benefit from
high-performance packaging materials
Folding boxboard, white top kraftliners and fully bleached linerboard

6
Metsä Board’s broad spectrum of customers
FOLDING BOXBOARD WHITE LINERBOARDSfresh forest fibre-based
CONVERTERSfolding cartons
and food service
CORRUGATED BOX
MANUFACTURERS
MERCHANTSGraphics and
packaging
BRAND OWNERS
Q4 2015
7
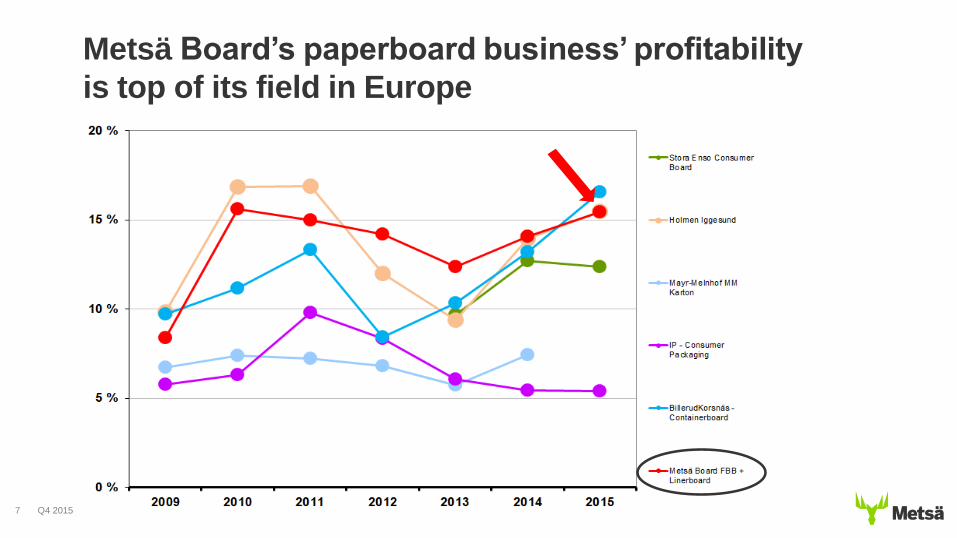
Metsä Board’s paperboard business’ profitability
is top of its field in Europe
Q4 2015

Strong profitability development
3,4
4,8
6,4
9,1
11,3
0
2
4
6
8
10
12
2011 2012 2013 2014 2015
%
2,4
3,6
5,2
6,8
9,0
0
2
4
6
8
10
2011 2012 2013 2014 2015
%
Q4 20158
ROCE-%, excl. non-recurring items EBIT-%, excl. non-recurring items
Target over 12% from 2017

9
1000
1100
1200
1300
1400
1500
1600
1700
1800
1900
2000
1 000
1 300
1 600
1 900
2 200
2 500
2 800
2006 2007 2008 2009 2010 2011 2012 2013 2014 2015 2016E
Production capacity/employee Number of employees
Strong continuing improvement in productivity
Production capacity (tonnes) / employee at current mills
Q4 2015
No. of
employees
Production
capacity/
employee

• Lightweight*)
• Printability and runnability
• Purity and safety
• Bioenergy
• Wood from known origin
10
Benefits of Metsä Board paperboards
Metsä Board’s folding boxboards are
produced from either mechanical or
chemi-thermo-mechanical pulps. CTMP
or mechanical pulp is used in the middle
layer (3) to make the board bulky and
light. The two outer fibre layers (2 and 4)
are made of chemical pulp, which
maximizes the strength of the board.
Folding boxboard is the stiffest yet lightest
paperboard grade
*) Can be even 30% lighter: Recycled fibre board 40.8 g vs. Metsä Board’s FBB 27.7gQ4 2015

• Continuous steady growth above the market
• The biggest growth drivers are
– strong and long-term customer relationships
– innovative high-performance product portfolio to replace other
packaging materials
– best-in class customer service concept
• In Europe, paperboard sales volume in 2015 up
by 12% compared to 2014
Q4 201511
Metsä Board is the market
leader in Europe
Metsä Board uses only
fresh forest fibres from
sustainably managed
northern forests
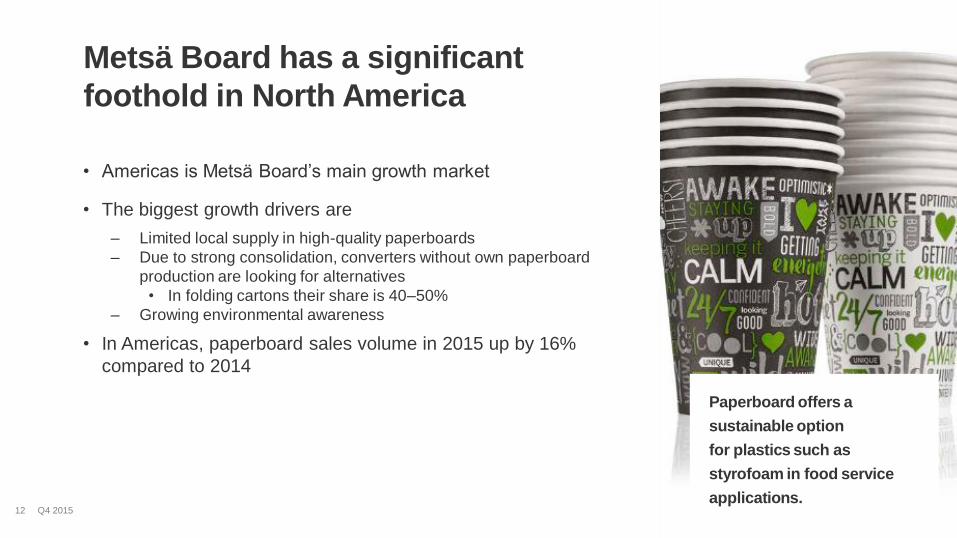
• Americas is Metsä Board’s main growth market
• The biggest growth drivers are
– Limited local supply in high-quality paperboards
– Due to strong consolidation, converters without own paperboard
production are looking for alternatives
• In folding cartons their share is 40–50%
– Growing environmental awareness
• In Americas, paperboard sales volume in 2015 up by 16%
compared to 2014
Q4 201512
Metsä Board has a significant
foothold in North America
Paperboard offers a
sustainable option
for plastics such as
styrofoam in food service
applications.

• Metsä Board is the paperboard quality benchmark in Asia
• Responsible consumer goods companies promote good
packaging
– Sustainability
– Traceable raw materials
– Product safety
• Due to the local overcapacity in Asia, the timing is not good for
aggressive growth
Q4 201513
Focus on the high-quality segment
in APAC
Global consumer goods
companies not willing to
change paperboard
suppliers easily in the
high-quality segments
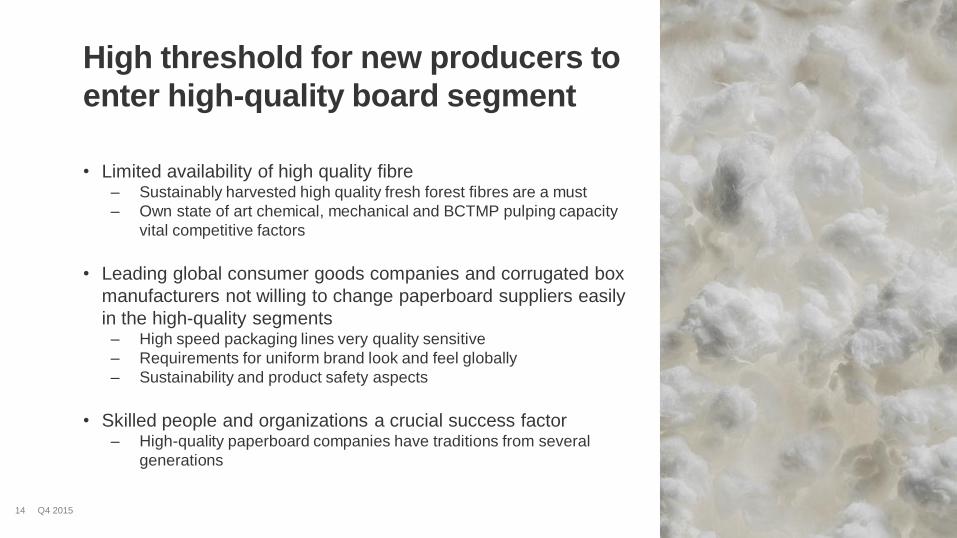
• Limited availability of high quality fibre – Sustainably harvested high quality fresh forest fibres are a must
– Own state of art chemical, mechanical and BCTMP pulping capacity
vital competitive factors
• Leading global consumer goods companies and corrugated box
manufacturers not willing to change paperboard suppliers easily
in the high-quality segments– High speed packaging lines very quality sensitive
– Requirements for uniform brand look and feel globally
– Sustainability and product safety aspects
• Skilled people and organizations a crucial success factor– High-quality paperboard companies have traditions from several
generations
Q4 201514
High threshold for new producers to
enter high-quality board segment

Operating environment and market position

GLOBALISATION TECHNOLOGY SUSTAINABILITY CONSUMPTION
• Increasing role of retail
and harmonisation of
global brands
• Growing importance of
logistics
• Consolidation of carton
converters
• New innovations
utilising wood fibre and
other biomaterials
• Continuous
development of
production
technologies
• Digitisation and
automatisation change
business dynamics
• Greater significance of
resource efficiency
drives circular
economy and life-cycle
thinking
• Increasing regulation
brings additional
obligations
• Social responsibility
through value chain
• Growing consumption
and consumers’
increasing quality
needs globally
• Stronger demand for
sustainable packaging
• Digital services change
purchasing behavior
Demand is based on global trends
Fresh forest fibre paperboard
Other wood fibre based materials
Non-fibre based materials
17
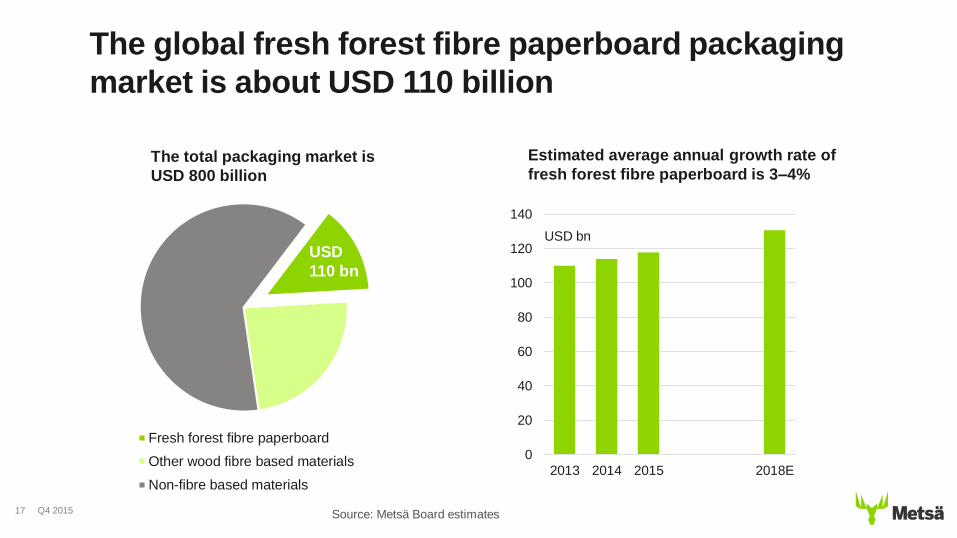
The global fresh forest fibre paperboard packaging
market is about USD 110 billion
Source: Metsä Board estimates
0
20
40
60
80
100
120
140
2013 2014 2015 2018E
USD bn
USD
110 bn
The total packaging market is
USD 800 billion
Estimated average annual growth rate of
fresh forest fibre paperboard is 3–4%
Q4 2015

Global cartonboard market is about 36 Mt/a*The share of FBB is 9 Mt or 25% of the total market
18
Folding boxboard
Other fresh forest fibre grades
Recycled grades
Source: Metsä Board estimates
APAC20 Mt/a
EMEA8 Mt/a
North America6 Mt/a
Lat. Am.2 Mt/a
Q4 2015
Avg. growth rate
for premium
cartonboards is
3–4%/a
*) Excluding liquid packaging board, cup & plate
stock, liner and uncoated recycled board.

Metsä Board has a strong position in Europe
Q4 201519
33%
24%
14%
10%
8%
42%
22%
11%
8%
6%
Largest Folding Boxboard Producers
in Europe
Capacity: 1,000 tonnes/a
Largest White Fresh Forest Fibre Linerboard
Producers in Europe
Capacity: 1,000 tonnes/a
* The paperboard machine BM2 in Husum produces simultaneously uncoated paper (capacity
100,000 tn/a). This production will be finished by the end of 2017.Sources: Metsä Board, Pöyry Management Consulting Oy
*

Market price development in EuropeFolding boxboard and white-top kraftliner
Q4 201520
Folding boxboard
1/2009–12/2015
White-top kraftliner
1/2009–12/2015
EUR/tonne
Sources: Pöyry Management consulting, FOEX Indexes Ltd.
500
600
700
800
900
1000
1100
2009 2010 2011 2012 2013 2014 2015
Folding boxboard White-top kraftliner

350
400
450
500
550
600
650
700
750
800
850
900
950
1000
1050
350
400
450
500
550
600
650
700
750
800
850
900
950
1000
1050
'04 '05 '06 '07 '08 ´09 '10 '11 '12 '13 '14 '15
Havu
Lehti
Lehti
Havu
USD
EUR
Pulp price development in USD and EUR (PIX)Pulp Price Indexes Europe
Q4 201521
Source: Foex Indexes Ltd
USD EUR
Softwood pulp
Hardwood pulp
Softwood pulp
Hardwood pulp
Strategic cornerstones and financial targets

Metsä Board’s vision is to be the preferred
supplier of premium paperboards creating
value for customers globally
Strategic cornerstones are
• Focus
• Growth
• Profitability
Q4 201523
Responsible profitability
Reliability
Cooperation
Renewal

Focus
Focus on premium fresh forest fibre
paperboards for consumer and retail packaging
This means to us:
• We focus on serving customers whose quality
expectations require our high quality, light and strong
packaging materials
• Our paperboards are produced from fresh forest fibres
• Our products are used for packages at the store and
from the store to the consumer
Q4 201524
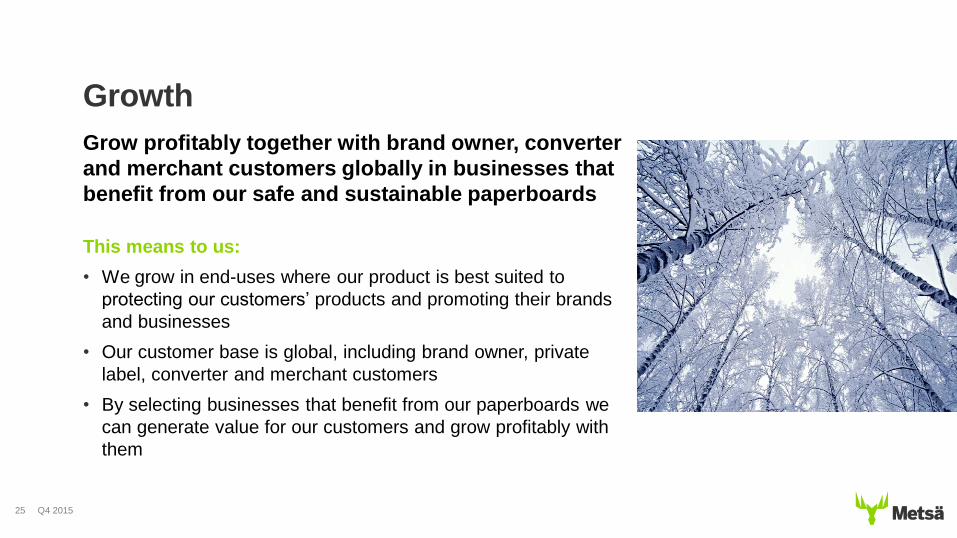
Growth
Grow profitably together with brand owner, converter
and merchant customers globally in businesses that
benefit from our safe and sustainable paperboards
This means to us:
• We grow in end-uses where our product is best suited to
protecting our customers’ products and promoting their brands
and businesses
• Our customer base is global, including brand owner, private
label, converter and merchant customers
• By selecting businesses that benefit from our paperboards we
can generate value for our customers and grow profitably with
them
Q4 201525

Profitability
Profitability is based on superior cost efficiency
and healthy sales prices driven by high-quality
pulps and unique technical know-how
This means to us:
• Our superior cost efficiency will be achieved by further
developing productivity and efficiency of our mills, operations
and people
• We will continue to drive down purchasing costs in all areas
• Our self-sufficiency in high-quality pulps together with unique
paperboard making expertise helps us to improve our market
position further and maintain healthy price levels
Q4 201526

Financial targets
Minimum ROCE 12%* from 2017
3,4
4,8
6,4
9,1
11,3
2011 2012 2013 2014 2015
106
72 70
51
32
2011 2012 2013 2014 2015
Q4 201527
Maximum net gearing 70%
* excl. non-recurring items
%%
• Return on capital employed (ROCE) a minimum of 12% from 2017 onwards• Net gearing not to exceed 70%

• Grow the paperboard businesses profitably globally
• Ensure successful sales of new capacity
• Secure good price levels
• Keep best in class product quality and improve supply chain
• Develop new products for existing and new end uses
• Continue productivity improvements and cost savings
Q4 201528
Main priorities and actions to achieve
financial targets

The Board proposes a dividend of 0,17 EUR / share
from FY 2015 which equals 44% of EPS
0,06
0,09
0,12
0,17
0
0,02
0,04
0,06
0,08
0,1
0,12
0,14
0,16
0,18
0,2
2012 2013 2014 2015
Q4 201529
• Metsä Board’s dividend payout target is at least 1/3 of EPS
• Average pay-out ratio during 2012–2014 has been 40%
Finalising the transformation
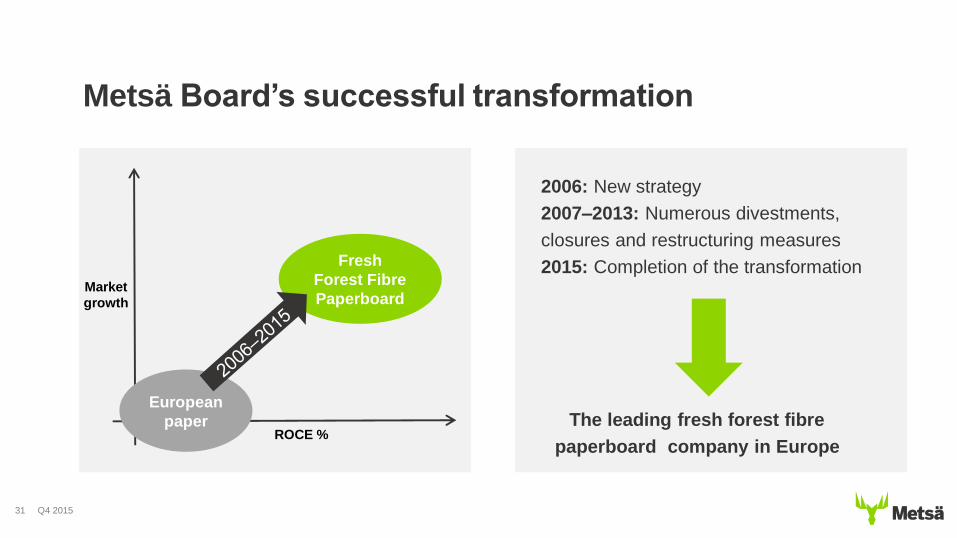
Metsä Board’s successful transformation
Q4 201531
Market
growth
Fresh
Forest Fibre
Paperboard
ROCE %
European
paper
2006: New strategy
2007–2013: Numerous divestments,
closures and restructuring measures
2015: Completion of the transformation
The leading fresh forest fibre
paperboard company in Europe
32
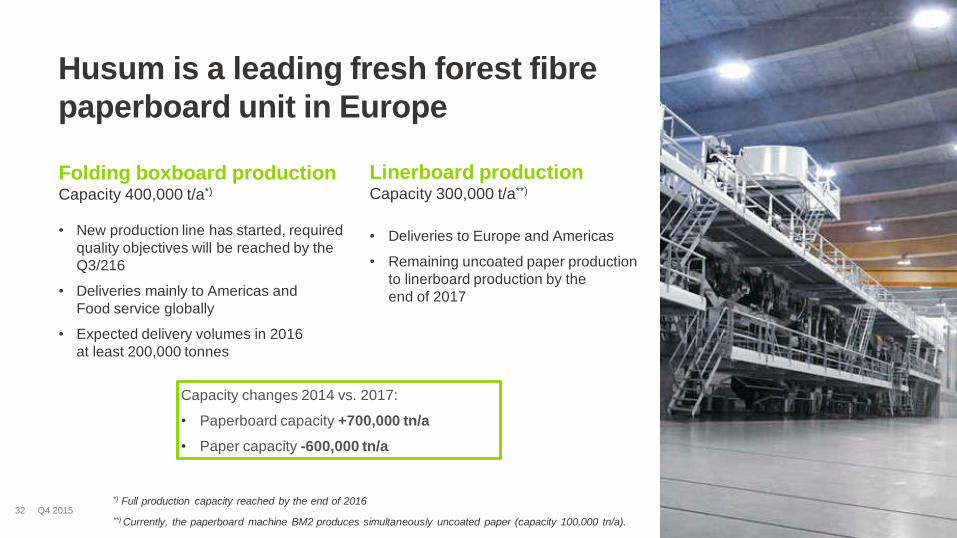
Husum is a leading fresh forest fibre
paperboard unit in Europe
Folding boxboard productionCapacity 400,000 t/a*)
• New production line has started, required
quality objectives will be reached by the
Q3/216
• Deliveries mainly to Americas and
Food service globally
• Expected delivery volumes in 2016
at least 200,000 tonnes
Linerboard productionCapacity 300,000 t/a**)
• Deliveries to Europe and Americas
• Remaining uncoated paper production
to linerboard production by the
end of 2017
Capacity changes 2014 vs. 2017:
• Paperboard capacity +700,000 tn/a
• Paper capacity -600,000 tn/a
*) Full production capacity reached by the end of 2016
**) Currently, the paperboard machine BM2 produces simultaneously uncoated paper (capacity 100,000 tn/a). Q4 2015

250
150150
0
500
1 000
1 500
2 000
Deliveries in 2015 Folding boxboardto Americas
Food serviceboard globally
Linerboard toEurope andAmericas
Targeteddeliveries in 2018
33
A total of 400,000 tonnes
of new FBB capacity
1,0
00 tonnes
Q4 2015
If the demand/supply situation so requires in the coming years,
Metsä Board has possibilities to adjust its production accordingly
Ambitious growth targets for new paperboard
volume from Husum mill

Most important growth area is Americas
0
50
100
150
200
250
300
2011 2012 2013 2014 2015 2018 target
Folding boxboard Fresh forest fibre linerboard
34
Actual and targeted deliveries to Americas
1,0
00 tonnes
300
250
Q4 2015

35
Gohrsmühle mill in Germany
divested to mutares in May 2015
• mutares AG is a stock listed German industrial holding
company focusing on acquiring companies in special situations
• Negative cash flow impact of about EUR 37 million, which was
clearly less than in the case of a potential closure
• Positive non-recurring item of EUR 17.5 million was booked in
Q2/2015
• Gohrsmühle’s main products are cast coated and label
papers and there are approximately 480 employees
Q4 2015

• Based on growth of paperboard business and discontinuation
of paper production, Metsä Board’s annual sales is expected to
remain rather stable
• Transformation process in Husum mill, Sweden
– Annual Operating result impact +EUR 50 million
– Fully impact mostly in 2017 and fully in 2018
– Expected impact on 2016 is roughly one third of the total
• Gohrsmühle divestment
– Annual Operating result impact +EUR 20 million
– Roughly half materialised in 2015
– Reduces annual sales by EUR 90 million
• Total paperboard capacity after the transformation
over 2 million tonnes
Q4 201536
Completion of the transformation
and expected impacts

Paperboard is Metsä Board’s core business
74 %
26 %
2014
Paperboard Paper
37
81 %
19 %
2015
Paperboard Paper
96 %
4 %
2016E
Paperboard Paper
Paperboard incl. market pulpQ4 2015

Metsä Board Financial statements review 2015
Q4/2015 results and outlook

• Paperboard delivery volumes increased by 12% compared to 2014
• Operating profit improved 32%
• Strong operating cash flow and balance sheet
• Board proposes to AGM a dividend of 0,17 EUR / share
• Husum investment programme proceeded as planned
• Investment decision on own extrusion line
• Divestment of Gohrsmühle mill and exit from paper production
Q4 201539
Highlights in 2015

Strong financial performance in 2015
2015 2014 Change
Sales EUR million 2,008 2,008 ---
EBITDA, excl. NRIs EUR million 283 236 20%
% of sales % 14,1 11,8 ↑
Operating result, excl. NRIs EUR million 180 137 31%
% of sales % 9,0 6,8 ↑
Result before taxes, excl. NRIs EUR million 150 100 50%
Earnings per share EUR 0,39 0,20 95%
ROCE, excl. NRIs % 11,3 9,1 ↑
Gross investments EUR million 178 44
Cash flow from operations EUR million 247 198 25%
Q4 201540

Continuous improvement in profitability
3,4
4,8
6,4
9,1
11,3
0
2
4
6
8
10
12
2011 2012 2013 2014 2015
%
2,4
3,6
5,2
6,8
9,0
0
2
4
6
8
10
2011 2012 2013 2014 2015
%Q4 201541
ROCE-%, excl. non-recurring itemsEBIT-%, excl. non-recurring items
Target over 12% from 2017

Operating result in Q4 weakened as expected,
sales down due to the decreased paper deliveries
Q4 201542
29 36 28 35 37 43 47 55 35
6%7%
6%7%
7%8%
9%
11%
8%
0%
5%
10%
15%
0
10
20
30
40
50
Q4/13 Q1/14 Q2/14 Q3/14 Q4/14 Q1/15 Q2/15 Q3/15 Q415
Operating result*EUR million and % of sales
18 21 20 27 32 32 40 48 30
4% 4% 4%5%
6% 6%
8%
10%
7%
0%
5%
10%
15%
0
10
20
30
40
50
Q4/13 Q1/14 Q2/14 Q3/14 Q4/14 Q1/15 Q2/15 Q3/15 Q4/15
Pre-tax result* EUR million and % of sales
479 501 494 514 499 526 522 498 462200
300
400
500
600
Q4/13 Q1/14 Q2/14 Q3/14 Q4/14 Q1/15 Q2/15 Q3/15 Q4/15
SalesEUR million
*) excluding non-recurring items
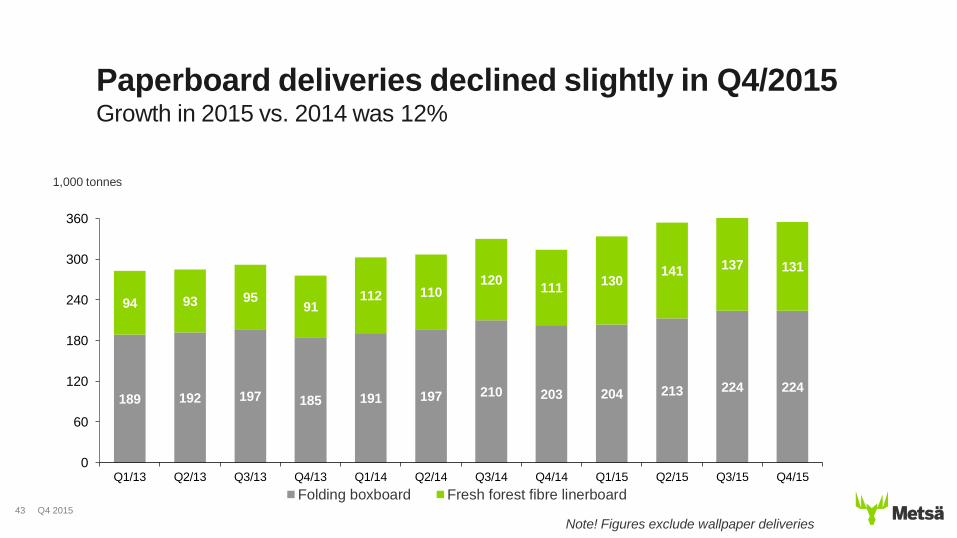
Paperboard deliveries declined slightly in Q4/2015Growth in 2015 vs. 2014 was 12%
Q4 201543
189 192 197 185 191 197 210 203 204 213 224 224
94 93 9591
112 110120
111130
141 137 131
0
60
120
180
240
300
360
Q1/13 Q2/13 Q3/13 Q4/13 Q1/14 Q2/14 Q3/14 Q4/14 Q1/15 Q2/15 Q3/15 Q4/15
Folding boxboard Fresh forest fibre linerboard
1,000 tonnes
Note! Figures exclude wallpaper deliveries
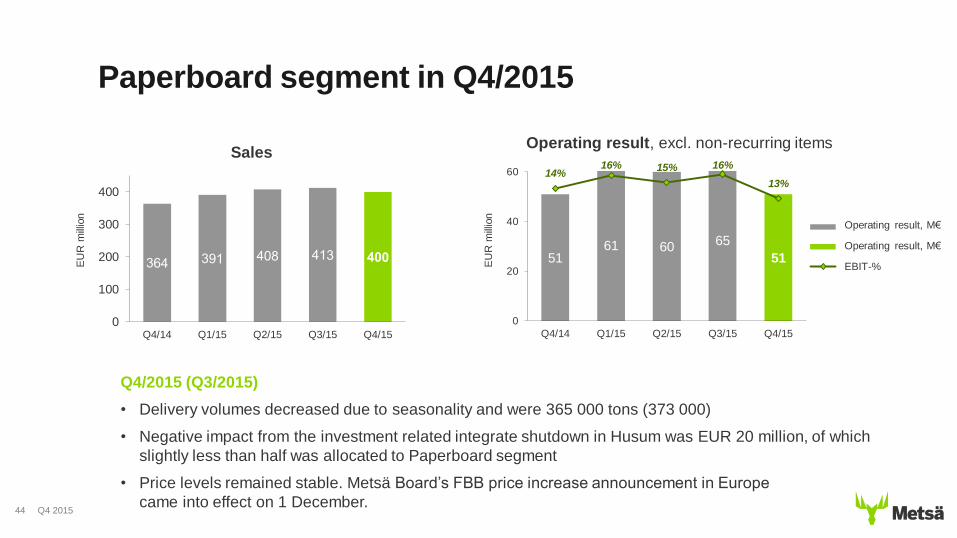
Paperboard segment in Q4/2015
Q4 201544
Operating result, excl. non-recurring itemsSales
EU
R m
illio
n
EU
R m
illio
n
5161 60 65
51
14%16% 15% 16%
13%
-2%
1%
4%
7%
10%
13%
16%
0
20
40
60
Q4/14 Q1/15 Q2/15 Q3/15 Q4/150
100
200
300
400
Q4/14 Q1/15 Q2/15 Q3/15 Q4/15
Q4/2015 (Q3/2015)
• Delivery volumes decreased due to seasonality and were 365 000 tons (373 000)
• Negative impact from the investment related integrate shutdown in Husum was EUR 20 million, of which
slightly less than half was allocated to Paperboard segment
• Price levels remained stable. Metsä Board’s FBB price increase announcement in Europe
came into effect on 1 December.
Operating result, M€
Operating result, M€
EBIT-%
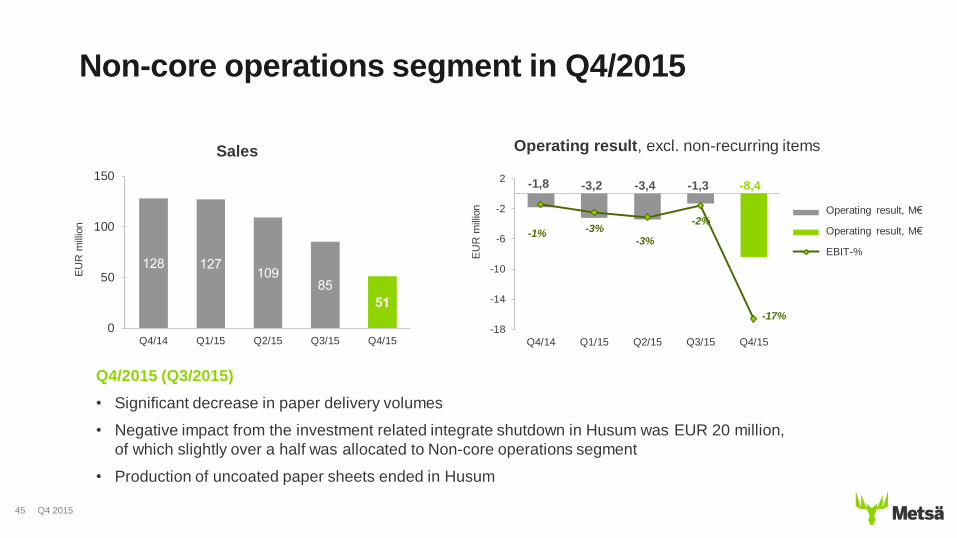
Non-core operations segment in Q4/2015
Q4 201545
Operating result, excl. non-recurring itemsSales
EU
R m
illio
n
EU
R m
illio
n
0
50
100
150
Q4/14 Q1/15 Q2/15 Q3/15 Q4/15
-1,8 -3,2 -3,4 -1,3 -8,4
-1% -3%
-3%
-2%
-17%
-18%
-16%
-14%
-12%
-10%
-8%
-6%
-4%
-2%
0%
2%
-18
-14
-10
-6
-2
2
Q4/14 Q1/15 Q2/15 Q3/15 Q4/15
Q4/2015 (Q3/2015)
• Significant decrease in paper delivery volumes
• Negative impact from the investment related integrate shutdown in Husum was EUR 20 million,
of which slightly over a half was allocated to Non-core operations segment
• Production of uncoated paper sheets ended in Husum
Operating result, M€
Operating result, M€
EBIT-%

Other operations segment in Q4/2015
Q4 201546
-2 -6 -6 -12 -14 -9 -9 -8
-15
-12
-9
-6
-3
0
Q1/14 Q2/14 Q3/14 Q4/14 Q1/15 Q2/15 Q3/15 Q4/15
Other operations segment:
Operating result, excl. non-recurring itemsEUR million
• Other operations segment include costs which
are not allocated to units, e.g. head office costs
• Cost base of these is roughly EUR 5 million per
quarter
• Result fluctuation is mainly caused by hedge
accounting, which had a total negative impact of
EUR 22 million in 2015 (-10)

Strong cash flow from operations
-19
92
51 74 33 56 91 66
-24
78
46 56 9 8 45 8
19
114
157
198
250
214
254 245
-37
57
110155
188
119 118
70
-100
-50
0
50
100
150
200
250
300
Q1/14 Q2/14 Q3/14 Q4/14 Q1/15 Q2/15 Q3/15 Q4/15
Cash flow from operations, quarterly Free cash flow, quarterly
Cash flow from operations, rolling 12 months Free cash flow, rolling 12 months
Q4 201547
EUR million

Q4 201548
Outlook for Q1/2016
• Total delivery volumes in paperboard will grow
compared to Q4/2015
• Average price level in FBB is expected to decline due
to the start-up volumes from the new FBB production
line
• The delayed start-up of the new FBB production line
will reduce paperboard and pulp production volumes in
Husum
• Total production costs are expected to remain stable

Metsä Board’s operating result excluding
non-recurring items in Q1/2016 is expected
to remain at the same level as in Q4/2015
Q4 201549
Profit guidance for Q1/2016

2Q/2015 Results and OutlookFunding and Debt InformationBalance sheet and funding

Strong balance sheet
Equity ratio, %
27%
33%
41%39%
47%
0%
10%
20%
30%
40%
50%
2011 2010 2013 2014 2015
106%
73% 70%
51%
32%
0%
20%
40%
60%
80%
100%
120%
2011 2012 2013 2014 2015
Q4 201551
Net gearing, %
783 625 597 427 333
4,4
3,4
2,9
1,8
1,2
0
1
2
3
4
5
0
200
400
600
800
1000
2011 2012 2013 2014 2015
Net debt, EUR million
Net debt/EBITDA
Net debt, EUR million and Net debt/EBITDA
Target 70%
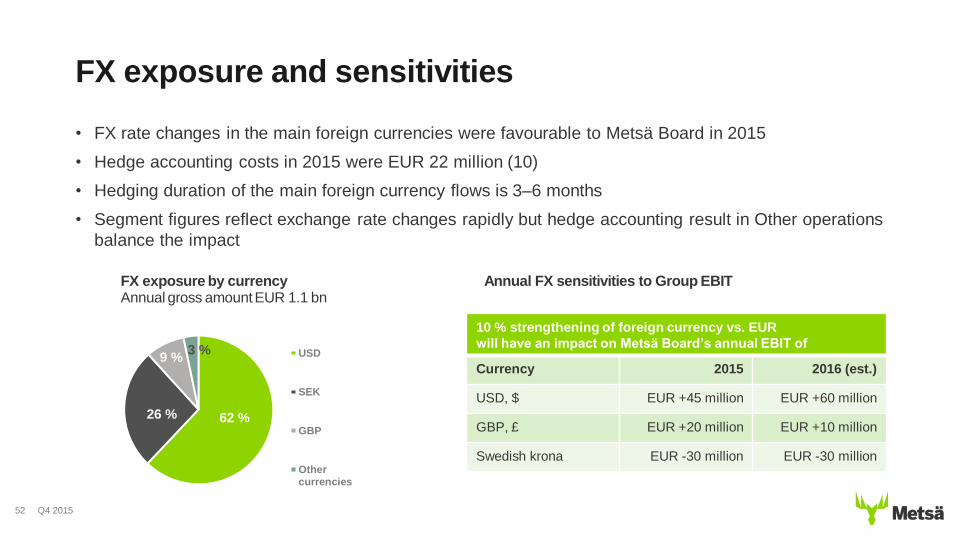
FX exposure by currency Annual gross amount EUR 1.1 bn
62 %26 %
9 %3 % USD
SEK
GBP
Othercurrencies
10 % strengthening of foreign currency vs. EUR
will have an impact on Metsä Board’s annual EBIT of
Currency 2015 2016 (est.)
USD, $ EUR +45 million EUR +60 million
GBP, £ EUR +20 million EUR +10 million
Swedish krona EUR -30 million EUR -30 million
52
Annual FX sensitivities to Group EBIT
• FX rate changes in the main foreign currencies were favourable to Metsä Board in 2015
• Hedge accounting costs in 2015 were EUR 22 million (10)
• Hedging duration of the main foreign currency flows is 3–6 months
• Segment figures reflect exchange rate changes rapidly but hedge accounting result in Other operations
balance the impact
Q4 2015
FX exposure and sensitivities

Diversified funding sources, strong liquidity
34 %
39 %
24 %
3%Bonds
Loans from financialinstitutions
Pension loans
Finance leases andother loans
Q4 201553
Debt structureTotal EUR 659 million
31 December 2015
67 %
20 %
13 % Liquid assets andinvestments
Revolving creditfacility
Undrawn pensionloan
Available liquidityTotal EUR 490 million
31 December 2015
Average interest rate of IB at the end of 2015 was 3.8% and average repayment time of long-term borrowing 2.6 years.
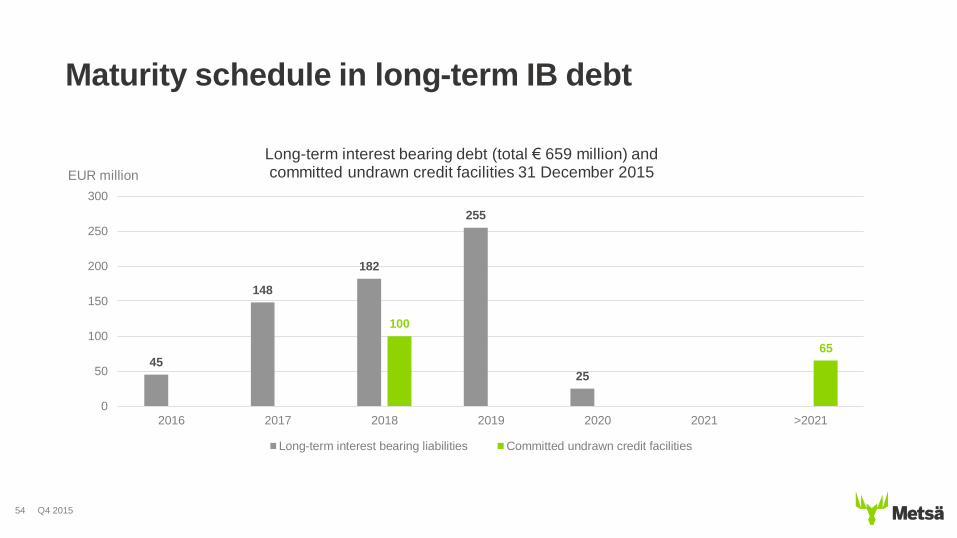
Maturity schedule in long-term IB debt
45
148
182
255
25
100
65
0
50
100
150
200
250
300
2016 2017 2018 2019 2020 2021 >2021
Long-term interest bearing debt (total € 659 million) and committed undrawn credit facilities 31 December 2015
Long-term interest bearing liabilities Committed undrawn credit facilities
Q4 201554
EUR million

Financial costs are declining steadily
47 56 39 323,0
3,5
4,0
4,5
5,0
5,5
0
20
40
60
2012 2013 2014 2015
Net financial costs, EUR million
Average interest rate, %
• Net financial costs in FY2015 totalled EUR 32
million (2014: 39)
• Declining costs due to the lower interest rates
and credit margins as well as decline in IB
debt
• Average interest rate in IB debt in
FY2015 was 3.8% (4.0)
Q4 201555
Net financial costs and average interest rateEUR %

Debt programmes 31 December 2015
Long-term borrowings Total amount, EUR million Outstanding, EUR million Average interest rate*, % Maturity
EUR 225 million bond Issue 2014 225 225 4.5 2019
Syndicated credit facility 2014 250 150 3.8 2018
EUR 104 million bilateral loans 104 104 3.0 2016–2017
EUR 21 million finance leases 22 22 2.0 2016–2022
EUR 218 million pension loans 225 160 3.7 2016–2020
Q4 201556
Metsä Board’s significant debt securities issued and outstanding at 31 December 2015
* The average interest rate take into account outstanding interest rate swaps and amortised arrangement fees
The average interest rate of all Metsä Board interest bearing net liabilities incl. interest rate derivatives per 31 December 2015 is 3.8%
Metsä Board’s principal long-term liquidity reserves at 31 December 2015Liquidity reserves Total amount, EUR million Outstanding, EUR million Average interest rate*, % Maturity
Revolving credit facility 2014 100 0 - 2018
Pension loan facilities 225 160 3.7 -
Short-term funding programmes
Metsä Group internal short-term limit 150 0 - 0–12 months
Metsä Group Treasury funding programmes
EUR 150 million domestic CP programme 150 0 - 0–12 months

Ratings’ history
2000: S&P: Short term ratings lowered to A3, Long term ratingsplaced to credit watch negativeMoody’s: Long and short term ratings outlook changed fromstable to negative
2001: S&P: Long term ratings lowered to BBB-, stable outlookMoody’s: Long and short term ratings lowered to Baa3/P3,negative outlook
2003: S&P: Downgrade to BB+, stable outlook Moody’s: Downgrade to Ba1, negative outlook
2004: S&P: Outlook changed from stable to negative, ratings affirmedMoody’s: Downgrade to Ba2, stable outlook
2005: S&P: Downgrade to BB, stable outlookMoody’s: Outlook changed from stable to negative, ratings affirmed
2006: S&P: Downgrade to BB-, negative outlookMoody’s: Downgrade to Ba3, negative outlookMoody’s: Downgrade to B2, negative outlookS&P: Downgrade to B+, negative outlook
2007: Moody’s: Downgrade to B3, negative outlookS&P: Downgrade to B, negative outlookS&P: Downgrade to B-, stable outlook
2008: S&P: Outlook to negative
2009: S&P: Downgrade to CCC+, negative outlook Moody’s: Downgrade to Caa1, outlook negative
2010: S&P: Outlook to stableMoody’s: Outlook to stableS&P: Upgrade to B-, stable outlookMoody’s: Upgrade to B3, outlook to positive
2011: S&P: Outlook to positiveS&P: Outlook to stableMoody’s: Outlook to stable
2012: Moody’s: Outlook to positive
2013: S&P: Outlook to positiveMoody’s: Upgrade to B2, outlook stableS&P: Upgrade to B, outlook stableMoody’s: Outlook to positive
2014: S&P: Outlook to positiveMoody’s: Upgrade to B1, outlook positive
2015: S&P: Upgrade to BB, outlook stableMoody’s: Upgrade to Ba2, outlook stable
57 Q4 2015

Positive rating development
58
Moody’s
Standard & Poor’s
2005 2006 2007 2008 2009 2010 2011 2012 2013 2014 2015
BB+ | Ba1
StableStableBB | Ba2
BB- | Ba3
B+ | B1
B | B2
B- | B3
CCC+ | Caa1
CCC | Caa2
Q4 2015
2Q/2015 Results and OutlookProduct development and capital expenditureProduct development and capital expenditure

Q4 201560
Increased emphasis on
product development
• Further improvement of product quality and sustainability
• Close cooperation with customers
• Technical properties of food service boards will be developed
and thus the end use range widened
• The Kyro mill has started testing foam forming on a production
scale – Improves printing surface and enables further reduction of weight
– Reduces the use of raw materials, energy and water
– Metsä Board has done extensive development work for several
years to commercialise this new technology

Q4 201561
Metsä Board expands its offering in
food and food service paperboards
by investing in extrusion coating
• Investment value EUR 38 million
• Will be implemented at Husum mill
• Start-up in H1/2017 with capacity of 100,000 t/a
• In 2015–2016 Metsä Board’s paperboards are coated by
external converter
• The company continues to develop other barrier
solutions including biobased materials
Food service packaging requires barrier features
e.g. moisture and fat resistance

Capital expenditure
0
30
60
90
120
150
180
2010 2011 2012 2013 2014 2015 2016E
Capex Growth capex Depreciation
• Annual maintanance capex (excl. the
growth capex) is EUR 40-60 million
• Main growth capexes in 2015–2016:
– Husum investment:
EUR 170 million (in 2015: 132M€)
– Extrusion line:
EUR 38 million (in 2016: 23M€)
– Metsä Fibre’s bioproduct mill*:
EUR 25 million (in 2016)
Q4 201562
EUR million
*) investment in equity

• Net capacity increase at the site is approximately 800,000 t/a– Investment cost of approximately EUR 1.2 billion
– Start up in 3Q 2017
• Capital invested by Metsä Board will be EUR 24,9 million– Metsä Board has no other financial commitments in the project
• Metsä Board’s holding in Metsä Fibre remains unchanged at
24.9 per cent
• All in all, Metsä Board’s pulp balance is expected to be
500,000–600,000 t/a long from 2018 onwards– Majority of the market pulp is softwood chemical pulp
– Reserve to grow paperboard business further in the future while
maintaining self-sufficiency in pulp
Q4 201563
Metsä Board’s associated company
Metsä Fibre builds a bioproduct mill

Capacity and deliveries
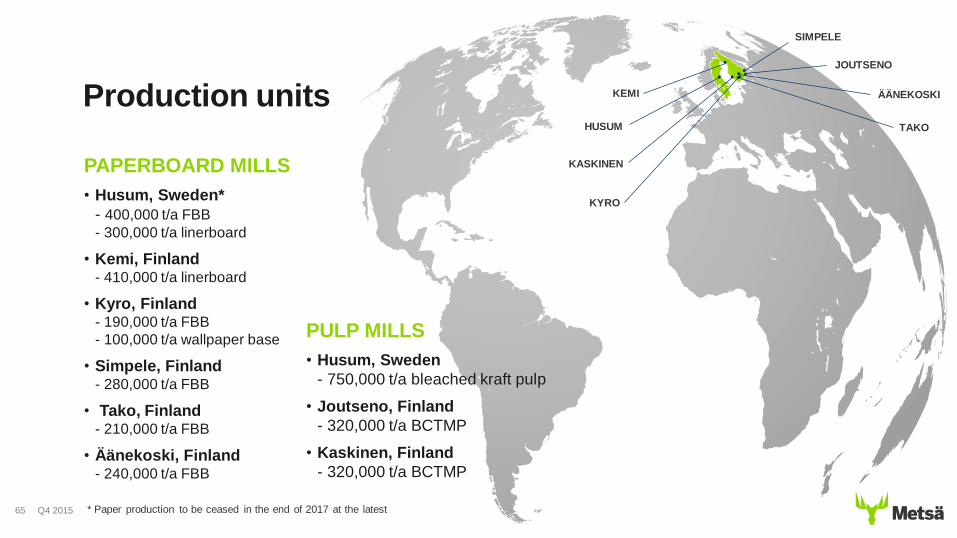
Production units
PAPERBOARD MILLS
• Husum, Sweden*
- 400,000 t/a FBB
- 300,000 t/a linerboard
• Kemi, Finland- 410,000 t/a linerboard
• Kyro, Finland- 190,000 t/a FBB
- 100,000 t/a wallpaper base
• Simpele, Finland- 280,000 t/a FBB
• Tako, Finland- 210,000 t/a FBB
• Äänekoski, Finland- 240,000 t/a FBB
PULP MILLS
• Husum, Sweden
- 750,000 t/a bleached kraft pulp
• Joutseno, Finland
- 320,000 t/a BCTMP
• Kaskinen, Finland
- 320,000 t/a BCTMP
* Paper production to be ceased in the end of 2017 at the latest
HUSUM
ÄÄNEKOSKI
SIMPELE
TAKO
KYRO
JOUTSENO
KASKINEN
KEMI
Q4 201565

Paperboard and specialty paper capacity in 2015
Town Country Machines Folding
boxboard
White fresh
forest fibre
linerboard
Wallpaper
base
Total
Tampere (Tako) Finland 2 210 210
Kyröskoski
(Kyro) Finland 2 190 100** 290
Äänekoski Finland 1 240 240
Simpele Finland 1 280 280
Kemi Finland 1 410 410
Husum Sweden 2 400 300* 700
Total 9 1,320 710 100 2,130
Q4 201566
1,000 t/a
*) Starting from 2016
**) Incl. also linerboard

Pulp capacity in 2015
Metsä Board
pulp mills
Country Chemical
pulp
BCTMP Total
Husum Sweden 750 750
Joutseno Finland 320 320
Kaskinen Finland 320 320
Total 750 640 1,390
Q4 201567
1,000 t/a
Metsä Fibre
pulp mills
Country Chemical
pulp
BCTMP Total
Äänekoski Finland 530 530
Kemi Finland 590 590
Rauma Finland 650 650
Joutseno Finland 690 690
Total 2,460 2,460
Metsä Board ownership share of Metsä Fibre is 24,9%
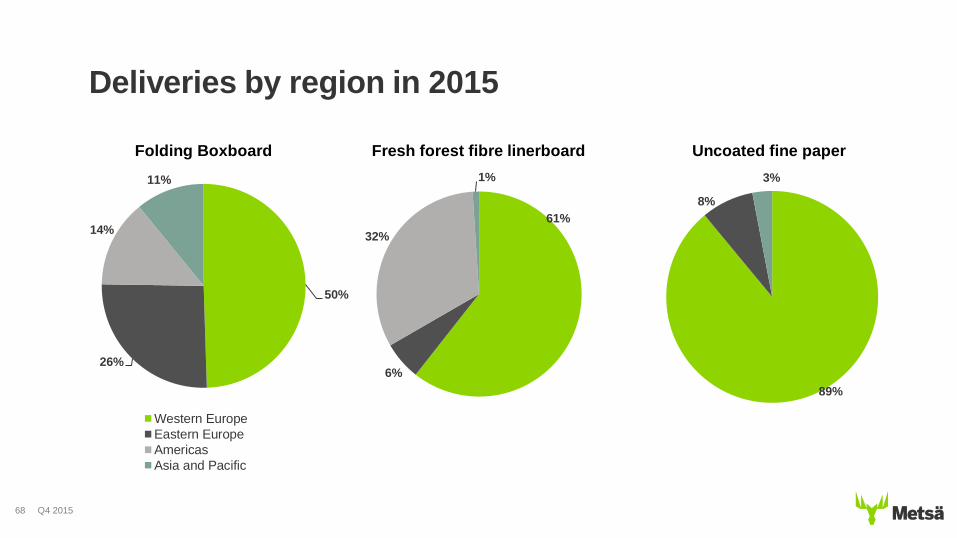
Deliveries by region in 2015
Q4 201568
50%
26%
14%
11%
Western Europe
Eastern Europe
Americas
Asia and Pacific
61%
6%
32%
1%
89%
8%
3%
Folding Boxboard Fresh forest fibre linerboard Uncoated fine paper

Cost structure and sourcingCost structure and sourcing

Cost structure in 2015
Q4 201570
Delivery costs16%
Wood26%
Chemicals, pigments and fillers
14%
Energy10%
Other variables
4%
Personnel 14%
Other fixed16%
Fixed
costs
Variable
costs
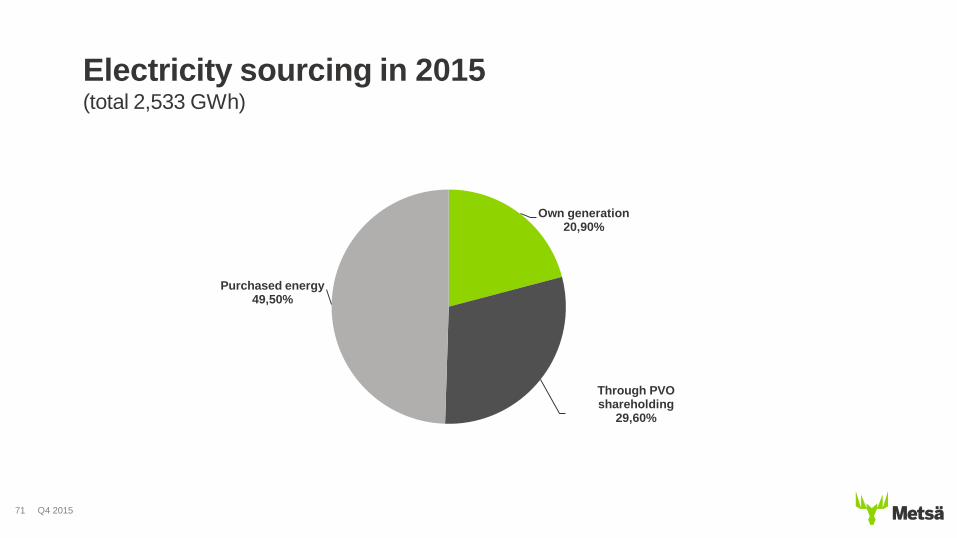
Electricity sourcing in 2015(total 2,533 GWh)
Q4 201571
Own generation20,90%
Through PVO shareholding
29,60%
Purchased energy49,50%

Primary energy used in 2015(total 12.3 TWh)
Q4 201572
Wood-based58%
Nuclear power22%
Natural gas8%
Hydro5%
Coal4%
Oil2%
Other1%

Wood sourcing by country in 2015(total 5.0 million cubic metres)
Sweden 39%
Finland25%
Baltic countries20%
Russia15%
Q4 201573

SourcingSustainability
Sustainability

Stakeholder engagement
• Ensuring ethical
business practices
• Improving safety at work
• Assuring responsible
management
• Contributing to local
livelihoods and society
Supply chain
• Promoting sustainable
forest management,
certification and the
diversity of forest nature
• Enhancing sustainability
in the value chain
• Ensuring the traceability
of raw materials
Resource efficiency and
emissions
• Making efficient use of
raw materials, energy,
water
• Increasing the value of
side streams
• Maximising the share of
bioenergy
• Minimising emissions to
water and air
Products and services
• Turning renewable wood
into sustainable, safe
and recyclable products
• Providing customer-
focused services and
solutions
• Innovating for
continuous improvement
and renewal
We offer sustainable choices
We bring the forest to you
We work for a better climate and environment
We create well-being
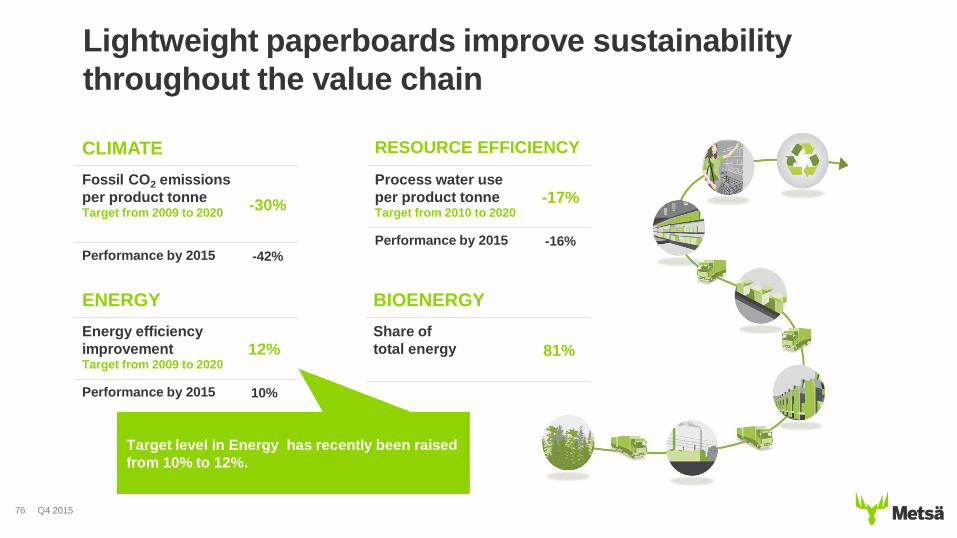
Lightweight paperboards improve sustainability
throughout the value chain
76
ENERGY
Energy efficiency
improvementTarget from 2009 to 2020
12%
Performance by 2015 10%
CLIMATE
Fossil CO2 emissions
per product tonneTarget from 2009 to 2020
-30%
Performance by 2015 -42%
RESOURCE EFFICIENCY
Process water use
per product tonneTarget from 2010 to 2020
-17%
Performance by 2015 -16%
BIOENERGY
Share of
total energy 81%
Q4 2015
Target level in Energy has recently been raised
from 10% to 12%.

• The amount of certified wood was 75%
• A new supply chain management target was
launched: to audit 100% of risk rated key
material suppliers against sustainability
criteria by end 2015
89% of all Metsä Board purchases,
excluding wood, come from countries
where we have own production
Q4 201577
Raw materials and supply chain management 2015
68
17
7
4 3 1
Finland
Sweden
Other EU
Germany
Outside Europe
Other
Metsä Board purchases by country, % (excl. wood supply)

• Share of wood based biofuels was
81% of total fuels
• Energy efficiency has been improved
by 10% from 2009
• Process water use per product tonne has
decreased by 16% from 2010
– 99% of the water we use is surface water
• Total reduction of fossile CO2 emissions
has been 42% since 2009
Q4 201578
Resource and environmental efficiency 2015
976
830 789
681
482
388 380317
0
200
400
600
800
1000
1200
2008 2009 2010 2011 2012 2013 2014 2015
Metsä Board greenhouse gas effect (CO2 equivalent, 1,000 tonnes)

• Metsä Board’s lost-time accident frequency
rate was 11.1 (12.0 in 2014) and sickness
absenteeism rate 4.1 (3.9)
• Metsä Board aims to improve its lost-time
accident frequency rate by 10% each year.
The long-term target is zero
• The target is to keep the sickness
absenteeism rate at the best European
level and below 3% at all times
4,5
3,9 3,9 3,94,1
0
1
2
3
4
5
2011 2012 2013 2014 2015
Q4 201579
Well-being and accident rate development 2015
Metsä Board sickness absenteeism
development, target < 3%

• Highest possible score 100/100 for the depth and quality of
climate change data (2014: 98/100 and 2013: 82/100)
• High scores indicate success in providing robust climate change
data and strong understanding of climate-related issues.
Leaders usually have a solid financial performance
• Metsä Board recognized as world leader for corporate action on
water security
• Metsä Board achieved leadership status in the materials sector
of the Forest programme
Q4 201580
Metsä Board recognised as a leader for
corporate actions on climate change
CDP is an international, not-for-profit organization providing the only global system for companies and
cities to measure, disclose, manage and share vital environmental information. CDP works with market
forces, including 767 institutional investors with assets of USD 92 trillion, to motivate companies to
disclose their impacts on the environment and natural resources and take action to reduce them.

General info
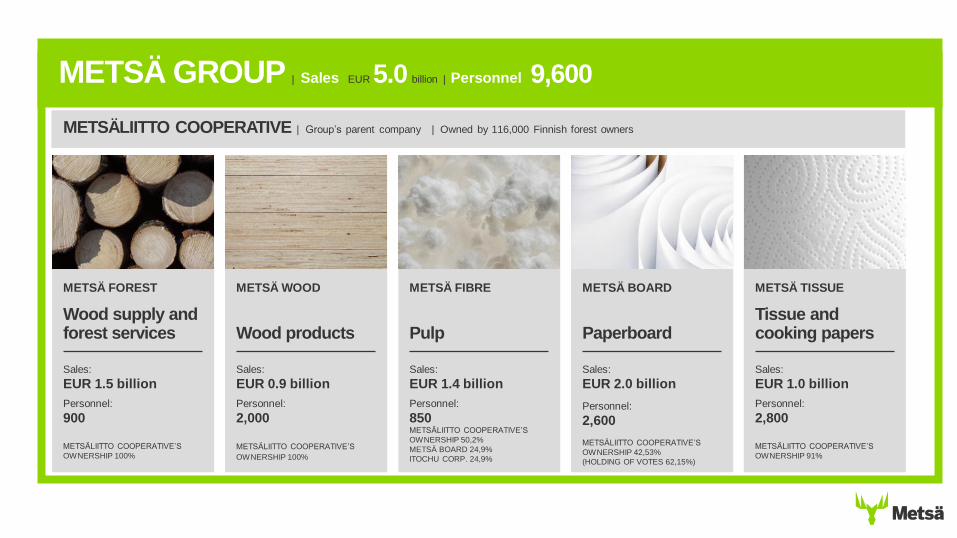
METSÄ BOARD
Paperboard
Sales:
EUR 2.0 billion
Personnel:
2,600-
METSÄLIITTO COOPERATIVE’S
OWNERSHIP 42,53%
(HOLDING OF VOTES 62,15%)
METSÄ WOOD
Wood products
Sales:
EUR 0.9 billion
Personnel:
2,000
METSÄLIITTO COOPERATIVE’S
OWNERSHIP 100%
METSÄ FOREST
Wood supply and forest services
Sales:
EUR 1.5 billion
Personnel:
900
METSÄLIITTO COOPERATIVE’S
OWNERSHIP 100%
METSÄ TISSUE
Tissue and cooking papers
Sales:
EUR 1.0 billion
Personnel:
2,800
METSÄLIITTO COOPERATIVE’S
OWNERSHIP 91%
METSÄ GROUP | Sales EUR 5.0 billion | Personnel 9,600
METSÄLIITTO COOPERATIVE | Group’s parent company | Owned by 116,000 Finnish forest owners
METSÄ FIBRE
Pulp
Sales:
EUR 1.4 billion
Personnel:
850METSÄLIITTO COOPERATIVE’S
OWNERSHIP 50,2%
METSÄ BOARD 24,9%
ITOCHU CORP. 24,9%

Sales development 2000–2015
5 898
6 9236 564
6 044
5 4605 241
5 624
4 440
3 236
2 432 2 605 2 4852 108 2 019 2 008 2 008
0
1000
2000
3000
4000
5000
6000
7000
8000
2000 2001 2002 2003 2004 2005 2006 2007 2008 2009 2010 2011 2012 2013 2014 2015
Q4 201583
EUR million

EBITDA development 2011–2015
180 185208
236
283
7,2 %
8,8 %
10,3 %
11,8 %
14,1 %
0%
2%
4%
6%
8%
10%
12%
14%
16%
0
50
100
150
200
250
300
2011 2012 2013 2014 2015
EU
R m
illio
n
Q4 201584
EBITDA, excl. non-recurring items

1995Sales EUR 2.3 billion
Q4 201585
2015Sales EUR 2.0 billion
Focus on core businesses
17%
32%
12%
9%
12%
6%
9%3%
Paper
Pulp
Paperboard
Packaging
Tissue
Mechanical ForestProducts
Merchanting
Chemicals
19%
17%64%
Paper
Market pulp
Paperboard

Q4 201586
True success story
2005 Structural change starts
Paper businesses over 80% of sales
Decision to exit paper business
2006 Strategic review launched
Restructuring and focused investment programme initiated,
focus on paperboard
2007–2013 Streamlining and focused investments
Paper capacity reduction from about 5 million to 0.8 million annual tonnes
Major divestments incl. Graphic Papers and Map Merchants
Paperboard capacity increases
2013 Strategic review completed
Clear focus on paperboard
Paper production about a quarter of sales
2015 Strong position and growing
Europe’s leading producer of folding boxboard
The world’s leading manufacturer of coated white-top kraftliners
Exit from paper business (fully by end of 2017)

Q4 201587
100 000 B2
shares in
PVO
Acquisitions
Divestments
Biberist Paper Mill
UK Paper
Modo Paper
Zanders
Chemicals
Business
Botnia
WoodCorrugated
PackagingMD Papier Metsä
Tissue
Albbruck Savon
Sellu
Forestia
Kemiart
Liners (53 %)
8% in
Botnia
PSM
9% in
Botnia
Carton
plants
Map
New
Thames MB
Uruguay
Graphic
Papers
Part of
Reflex
Hallein
mill
1997 20001998 1999 2001 2002 2003 2004 2005 2006 2007 20092008 2010 2011
Rest of
Reflex
0.5% in
PVO
2012
7.3 % in Metsä Fibre
2013 2014
Alizay
mill Lielahti
real estate
2015
Gohrsmühle
mill
Simpele Mill
Metsä Board’s restructuring story

Significant Divestments
EUR 3.7 billion in assets divested since 2001
Q4 201588
Year Divestiture Enterprise Value, EUR million
2015 Gohrsmühle mill in Germany neg.
2014 Lielahti real-estate 32
2013 Alizay property and other estates 22
2012 7.3% stake in Metsä Fibre 138
2012 0.5% stake in PVO 64
2011 Hallein 34
2009 Metsä-Botnia’s Uruguayan operations 300*
2008 Graphic Papers 750
2008 100,000 shares in PVO 80
2008 New Thames mill 82**
2007 Map Merchant Group 382
2007 Folding carton plants 60
2007 Botnia (9%) 240
2005 Botnia (8%) 164
2005 Savon Sellu 20
2005 Forestia (95%) 163
2004 Metsä Tissue 570
2002 Papierfabrik Albbruck 235
2001 MD Papier 300
2001 Noviant (19%) 41
3,679
* Cash portion
**Incl. pension liabilities

Metsä Board Corporate Management Team
Q4 201589
CEO
Mika Joukio
Marketing and Sales
Seppo Puotinen
Business Development
Sari Pajari
Production and Technology
Ari Kiviranta
Finance
Markus Holm
Human Resources
Susanna Tainio
SourcingSustainabilityOwners

Market cap and foreign owners31 December 2015
42 %
21 %
17 %
20 %
MetsäliittoCooperative
Domesticinstitutionalinvestors
Domestic privateinvestors
Foreign owners
Q4 201591
Ownership distribution31 December 2015
Rising market cap with more foreign ownersMetsä Board’s new Market cap segmentation from 2016 onwards is Large Cap
0
4
8
12
16
20
24
0
500
1 000
1 500
2 000
2 500
2011 2012 2013 2014 2015
Market cap, EUR million
Share of foreign owners, %
%EUR million
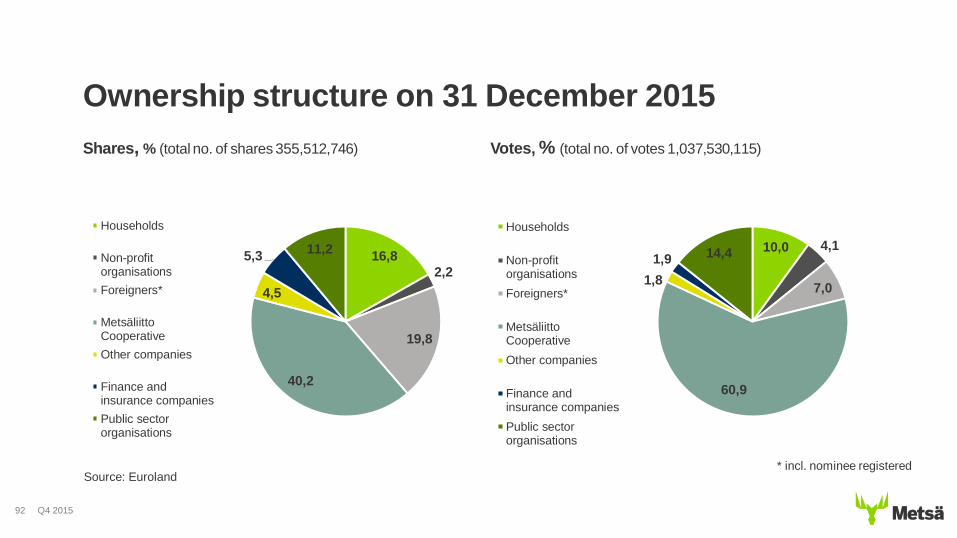
Shares, % (total no. of shares 355,512,746)
92
Votes, % (total no. of votes 1,037,530,115)
16,8
2,2
19,8
40,2
4,5
5,311,2
Households
Non-profitorganisations
Foreigners*
MetsäliittoCooperative
Other companies
Finance andinsurance companies
Public sectororganisations
10,0 4,1
7,0
60,9
1,8
1,9 14,4
Households
Non-profitorganisations
Foreigners*
MetsäliittoCooperative
Other companies
Finance andinsurance companies
Public sectororganisations
Ownership structure on 31 December 2015
* incl. nominee registeredSource: Euroland
Q4 2015

Katri Sundström
Vice President, Investor relations
Tel +358 400 976 333
www.metsaboard.com
Q4 201593
Contact information
