mexico and china education and science & technology policies in perspective with oecd countries
DESCRIPTION
José Antonio Ardavín Acting Head OECD Mexico Centre for Latin America Seminar “Towards a dialogue between China and Mexico: three and two decades of transformations and structural socioeconomic changes” 9 September 2009TRANSCRIPT

Mexico and ChinaMexico and ChinaEducation and Education and
Science & Technology PoliciesScience & Technology PoliciesIn perspective with OECD countriesIn perspective with OECD countries
Comments to panel contributions from:Comments to panel contributions from:
José Antonio ArdavínJosé Antonio ArdavínActing HeadActing Head
OECD Mexico Centre for Latin AmericaOECD Mexico Centre for Latin America
Seminar “Towards a dialogue between China and Mexico: three and two decades of transformations and structural
socioeconomic changes”9 September 20099 September 2009

Some of the recent OECD studies on Mexico’s and China’s Innovation Policies
MEXICO
Avaliable in www.oecdilibrary.org

Summarizing the pannel interventions, a number of key issues:
• Innovation and growth• Strategic policies• Speed of change• Creation and circulation of talent• Regional Dimension

Innovation has become the key driver of economic growth and improvement in quality of life…
Source: OECD Mexico Economic Survey 2007
0
5,000
10,000
15,000
20,000
25,000
30,000
35,000
40,000
45,000
50,000
Indi
a
Chin
a
Braz
il
Chile
Mex
ico
Pola
nd
Kore
a
Spai
n
OEC
D
USA
PPP (constant 2005 USD)
1987 2007
0
100
200
300
400
500
600
Chin
a
Kore
a
Indi
a
Chile
Pola
nd
Spai
n
OEC
D
USA
Mex
ico
Braz
il
1987=100
1987 2007
0
1
2
3
4
5
6
7
8
9
10
Chin
a
Kore
a
Indi
a
Chile
Pola
nd
Spai
n
OEC
D
USA
Mex
ico
Braz
il
Average Growth Rate
1987-1997 1997-2007
GDP per capita

“Most of the rise in material standards of living since the industrial revolution has been the consequence of innovation. New or improved products and services have for a long time been the main motor of economic growth.” (Going for Growth, OECD 2006)
Source: The Knowledge Economy, the Kam methodology and World Bank operations. Derek C. Chen and Carl J. Dahlman

OECD countries invest on average 2.2% of GDP in R&D
OECD Factbook 2009: Economic, Environmental and Social Statistics - ISBN 92-64-05604-1 - © OECD 2009Science and technology - Research and Development (R&D) - Expenditure on R&D
Gross domestic expenditure on R&D
As a percentage of GDP
0.0
0.5
1.0
1.5
2.0
2.5
3.0
3.5
4.02007 or latest available year 1998 or first available year

China and Mexico, as developing countries have an important road to go…
OECD Factbook 2009: Economic, Environmental and Social Statistics - ISBN 92-64-05604-1 - © OECD 2009Science and technology - Research and Development (R&D) - Researchers
Researchers
Per thousand employment, full-time equivalent on R&D
0
3
6
9
12
15
182007 or latest available year 1998 or first available year

…but speed is an very important variable…
OECD Factbook 2009: Economic, Environmental and Social Statistics - ISBN 92-64-05604-1 - © OECD 2009Science and technology - Research and Development (R&D) - Researchers
Growth in gross domestic expenditure on R&D1998 or first available year - 2007 or latest available year
-60%
-40%
-20%
0%
20%
40%
60%
80%
100%
120%
140%

…and strategic policies
OECD Factbook 2009: Economic, Environmental and Social Statistics - ISBN 92-64-05604-1 - © OECD 2009Science and technology - Research and Development (R&D) - Researchers
Growth in number of researchers per thousand employment, full-time equivalent on R&D1998 or first available year - 2007 or latest available year
-50%
0%
50%
100%
150%
200%

…and strategic policies
Source: OECD Reviews of Innovation Policy China (2008)

…and strategic policies
Source: OECD Reviews of Innovation Policy China (2008)

…oriented to achieve results
OECD Factbook 2009: Economic, Environmental and Social Statistics - ISBN 92-64-05604-1 - © OECD 2009
Science and technology - Communications - Exports of information and communications equipment
Exports of ICT equipmentBillion US dollars
0
50
100
150
200
250
300
350
400
1996 1997 1998 1999 2000 2001 2002 2003 2004 2005 2006 2007
China
United States
Japan
Germany
United Kingdom
Mexico

FDI vs FDI+
OECD Factbook 2009, Dinamic Graphs using Trendalyser

Paradoxically FDI in Mexico is not leading to the desired spillovers, as S&T expenditures highest
among manufacturing domestic firms
Source: OECD Regional Innovation Reviews: 15 Mexican States based on Dussel-Peters for the OECD based on data from INEGI
Big Manufacturing Firms by FDI share, 2003

Talent is the key input for innovation…
Percentage of patents with foreign co-inventors

…and talent is created through a system of quality education…
OECD Factbook 2009: Economic, Environmental and Social Statistics - ISBN 92-64-05604-1 - © OECD 2009Education - Outcomes - International student assessment
Performance on the science scale in PISA 2006Mean scores
350
375
400
425
450
475
500
525
550
575
600
625
650
Above the OECD average
Below the OECD average
OECD average in science : 500

High level innovation requires high level, competitive talent
Education at a Glance 2009: OECD Indicators - OECD © 2009 - ISBN 9789264024755Indicator A4 Indicator A4: What is the profile of 15-year-old top performers in science?Version 1 - Last updated: 19-Aug-2009
Chart A4.1. Percentage of top performers on the science scale in PISA 2006
Source : OECD PISA 2006 Database, Table A4.1a.
The chart depicts the proportion of top performers in science defined as those 15-year-old students who are proficient at Levels 5 and 6 on the PISA 2006 science scale and indicates near the country name the score in science for each country.
0
5
10
15
20
Finl
and
563
New
Zea
land
530
Hon
g Ko
ng-C
hina
542
Japa
n 5
31Ch
ines
e Ta
ipei
532
Aust
ralia
527
Cana
da 5
34U
nite
d Ki
ngdo
m 5
15N
ethe
rland
s 5
25Sl
oven
ia 5
19Li
echt
enst
ein
522
Ger
man
y 5
16Cz
ech
Repu
blic
513
Esto
nia
531
Switz
erla
nd 5
12Ko
rea
522
Belg
ium
510
Aust
ria 5
11Ire
land
508
Uni
ted
Stat
es 4
89O
ECD
aver
age
500
Fran
ce 4
95Sw
eden
503
Hun
gary
504
Denm
ark
496
Pola
nd 4
98Ic
elan
d 4
91N
orw
ay 4
87Lu
xem
bour
g 4
86Sl
ovak
Rep
ublic
488
Mac
ao-C
hina
511
Isra
el 4
54Cr
oatia
493
Lith
uani
a 4
88Sp
ain
488
Italy
475
Russ
ian
Fede
ratio
n 4
79La
tvia
490
Gre
ece
473
Port
ugal
474
Bulg
aria
434
Chile
438
Uru
guay
428
Turk
ey 4
24Se
rbia
436
Jord
an 4
22Br
azil
390
Rom
ania
418
Arge
ntina
391
Thai
land
421
Qat
ar 3
49M
onte
negr
o 4
12M
exic
o 4
10Co
lom
bia
388
Tuni
sia 3
86Az
erba
ijan
382
Indo
nesi
a 3
93Ky
rgyz
stan
322
Level 5 Level 6
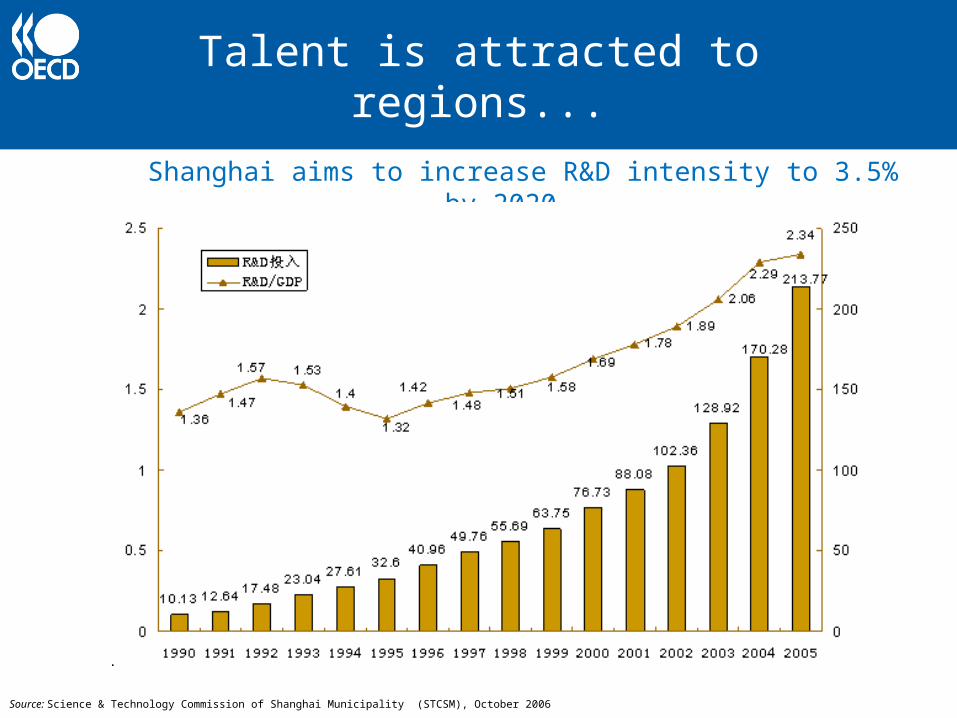
Talent is attracted to regions...
Shanghai aims to increase R&D intensity to 3.5% by 2020
Source: Science & Technology Commission of Shanghai Municipality (STCSM), October 2006

…but policies and structure of incentives can also lead to concentration of inputs of innovation…
Source: INEGI 2008Source: OECD Reviews of Regional Innovation: 15 Mexican States, (2009)

…Producing limited and concentrated innovation, translating into low technological output…
Source: own calculations based on INEGI Economic Survey 2004Source: OECD Reviews of Regional Innovation: 15 Mexican States, (2009)

… and limited knowledge generation
Source: own calculations based on OECD Regional Database
Source: OECD Reviews of Regional Innovation: 15 Mexican States, (2009)
Challenges
• Fostering innovation is more than investing in R&D, patenting, etc…– Creating framework conditions– Investing in inputs of innovation (human capital)– Addressing systemic failures
• Financing• Training• Competition• Intellectual property rights• Barriers to entrepreneurship• Technology brokers• Corporate governance• Industry-Science linkages

Mexico and ChinaMexico and ChinaEducation and Education and
Science & Technology PoliciesScience & Technology PoliciesIn perspective with OECD countriesIn perspective with OECD countries
Comments to panel contributions from:Comments to panel contributions from:
José Antonio ArdavínJosé Antonio ArdavínActing HeadActing Head
OECD Mexico Centre for Latin AmericaOECD Mexico Centre for Latin America
www.oecd.org/centrodemexico