mfk | eea megatrends | may 2007 | 1 ageing, time use and environment. presented to the workshop...
TRANSCRIPT

MFK | EEA Megatrends | May 2007 | 1
Ageing, time use and environment.
Presented to the Workshop
„Research forsight for Environment and Sustainability – megatrends and surprises“
EEA Copenhagen May 2007
Marina Fischer-Kowalski
Institute of Social Ecology, Vienna.
IFF Faculty for Interdisciplinary Studies, Klagenfurt University

MFK | EEA Megatrends | May 2007 | 2
outline
1. Time use as a social driver of environmental pressure. Linkages between demography, time use and the environment: concepts and speculations
2. Development and megatrends. socio-metabolic regimes, demographic change, time use and environmental impact
3. Research questions: time use, quality of life, economy and environmental pressure. How to achieve a maximum of happy human hours at lowest environmental cost?

MFK | EEA Megatrends | May 2007 | 3
cultural sphere of causation
Time in socio-metabolic processes
natural sphere of causation
wastes & emissions
material resources
Recycling
Relevant natural
environmentenergy reproduction
(time)
labour (time)
communi-cation, money
experiences
skills
socialsystem
Solar energy
waste heat

MFK | EEA Megatrends | May 2007 | 4
On which functions / subsystems is human time being used?
1. on the person system: personal reproduction*)
1. basic reproduction: sleep, rest, eat, body care...2. extended reproduction: education, training, entertainment...
2. on household / family: family reproduction
1. household chores2. personal caretaking (children, spouse, sick and aged people)
3. on the community system: community reproduction
1. participation in festivities, religious services, fire brigades, funerals, voting, NGOs, volunteer work...
4. on the economic system (formal labor): socio-economic reproduction
* not subject to division of labor: everyone has to do it oneself („third person exclusion rule“)

MFK | EEA Megatrends | May 2007 | 5
Functional allocations of time: which system is reproduced?
Economy
Household
/ Family
Person
Disposable
time
Community
24 hours
(wage) labour
chores, caretaking
sleep, eat,
hygiene
disposable
Average European day

MFK | EEA Megatrends | May 2007 | 6
Two allocation cycles of time
Primary allocation: guided by needs (natural factors) and strong social expectations
– can end up with a deficit, in which case some function cannot be allocated as much time as needed
– can end up with a surplus (the time difference between what is needed and 24 hours), „disposable time“ that may be used at deliberation. In this case, there is a
Secondary allocation of the remaining („disposable“) time, again to one of the four functions, not guided by needs and obligations, but rather by opportunities and preferences.
The statistically observable time use distribution is the end product (sum) of both allocation cycles

MFK | EEA Megatrends | May 2007 | 7
Functional distinctions of time use: which system is reproduced?
Economy
Household
/ Family
Person
Disposable
time
Community
24 hours
(wage) labour
chores, caretaking
sleep, eat,
hygiene
„leisure“ = person reproduction
MFK | EEA Megatrends | May 2007 | 8
What is time squeeze* ?• Time squeeze is an incompatibility of functional demands on time
and available time.
• It may occur in the course of the primary allocation cycle: within available time being not able to get enough food, to find enough water or firewood, to take care of children and sick people, to earn enough money, to rest after working...
If it occurs occasionally (seasonally or in certain gender/age/class segments of the population), it will in the short run lead to less sleep/rest, and in the long run lower life expectancy. If it occurs chronically, it will threaten the survival of the population
• It may occur in the course of the secondary allocation: more attractive opportunities than can be used, more desire for status, attention, sex, money, adventure... than can be satisfied within time available. (An outcome of social competition?)
Will lead to manic activity, also to reduction of sleep and rest, and disease in the long run
*term coined by Juliet Schor

MFK | EEA Megatrends | May 2007 | 9
Factors influencing the social distribution of time squeeze
Agrarian societies: important factors
– seasons and weather– class (upper classes freed from subsistence work)– gender (women more time squeeze)
Industrial societies:
– Age (retirement)– Employment / unemployment– Gender
MFK | EEA Megatrends | May 2007 | 10
Consequence of time squeeze: Intensification
• If additional need / desire arises, further extension of time use goes at the expense of something else – leads to conflict
• way out: intensification of time use.
– Increase of speed: doing something faster (airplane instead of train, eating high energy/low fibre food, convenience food instead of cooking)
– Increase of efficiency: using technological „amplifiers“ (electrical lawn mower instead of scything, baby food instead of breastfeeding)
– Substituting time with money (giving children presents instead of attention, engaging a professional housekeeper)
• Intensification always means increasing the flow of another, coupled resource

MFK | EEA Megatrends | May 2007 | 11
changes in time use: expansion and / or intensification and the environment
• expanding / shrinking certain types of time use: By expanding time use (on something) you have to reduce time use (on something else).
• intensifying / de-intensifying the use of time: constant quantity of flow at question, but change in the quantity of other flows strongly coupled to it. By intensifying time use you create more output (of something per hour), typically by using more input (of something else per hour – often non-linear relation).
• environmental cost: rises by expanding environmentally costly time-use (e.g. travelling time), or by intensifying given time-use by raising resource input (e.g. travelling faster).
MFK | EEA Megatrends | May 2007 | 13
Part 2: developments and megatrends concerning time use / time squeeze
1. Interrelation with demographic change
2. Interrelation with labor time
MFK | EEA Megatrends | May 2007 | 14
Needs for human time allocation depend on socio-ecological regime
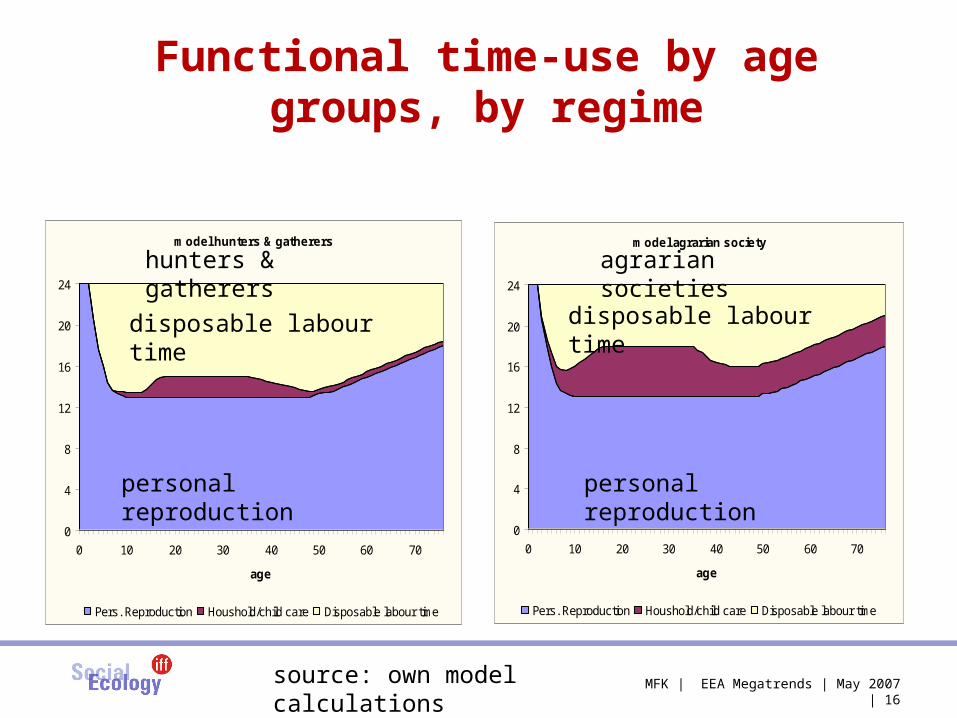
hunting & gathering: „thrifty“ reproduction (low number of children, relatively long and healthy life). Little time on household chores (few children, hardly food storage, simple food preparation, simple dwellings...).
agrarian societies: „prodigal“ reproduction (high number of children, relatively short and unhealthy lives). high household chores: many children, caretaking of animals, elaborate food storage, maintaining household equipment and tools.
(late) industrial societies: few children, much of caretaking professionalized, household work professionalized, but long periods of old age in need of caretaking (professionalization very expensive, often unwelcome)*
*Difficulty: „intensification“ not viable option in caretaking of people

MFK | EEA Megatrends | May 2007 | 15
Demographic features of socio-metabolic regimes
Source: Sieferle 2001
thrifty repr. thrifty repr.
prodigal repr
MFK | EEA Megatrends | May 2007 | 16
Functional time-use by age groups, by regime
model hunters & gatherers
0
4
8
12
16
20
24
0 10 20 30 40 50 60 70
age
Pers. Reproduction Houshold/child care Disposable labour time
model agrarian society
0
4
8
12
16
20
24
0 10 20 30 40 50 60 70
age
Pers. Reproduction Houshold/child care Disposable labour time
hunters & gatherers agrarian societies
personal reproduction personal reproduction
disposable labour time disposable labour time
source: own model calculations

MFK | EEA Megatrends | May 2007 | 17
socially available labour time per day, by age groups and regime (model society of 1000 population)
source: own calculations, mortality/birth rates Sieferle 2001
disposable labour time per 1000 population
0
50
100
150
200
250
300
1 7
13 19 25 31 37 43 49 55 61 67 73age groups
hour
s / d
ay
HuntGath
AgrarS
sum of disp.labour time / 1000 population:Hunter&Gatherers: 8382 hoursAgrarian Soc: 5788 hours
MFK | EEA Megatrends | May 2007 | 18
Questions concerning population and time use
• Is there a link between female time squeeze and low birth rates in Europe?
• Is there a link between generation spacing and time squeeze?
• Under conditions of time squeeze, how can personal caretaking of the elderly be organized?*
• Does the increase of elderly to be taken care of generate further time squeeze, and possibly even lower birth rates?
* See also Schaffer & Stahmer, Time I-O between age groups

MFK | EEA Megatrends | May 2007 | 19
Working time by socio-ecological regime
Hunters & gatherers: low working time, culturally stabilized „leisure preference“. Strong link between working hours and environmental impact.
Agrarian societies: working time differentiated by season and class. Large majority very hard working, agrarian development means more work per unit area for more output per unit area to feed more people. Strong link between working hours and environmental impact.
Industrial societies: hypothesis of three phases:
phase 1: industrial revolution = industrious revolution (increase in working time)
phase 2: creation of the „leisure society“phase 3: inclusion / exclusion: time squeeze for the „included“,
uselessness and boredom for the „excluded“. Link between working hours and environmental impact disappears.

MFK | EEA Megatrends | May 2007 | 20
Total number of working hours and primary energy use (UK 1870-2000)
0
2.000
4.000
6.000
8.000
10.000
12.000
14.000
1870
1880
1890
1900
1910
1920
1930
1940
1950
1960
1970
1980
1990
Pri
mar
y en
erg
y co
nsu
mp
tio
n (
PJ)
, wo
rkin
g
tim
e (1
0 m
illio
n h
ou
rs)
0,0
100,0
200,0
300,0
400,0
500,0
600,0
700,0
PE
C/w
ork
ing
tim
e (M
J/h
)
PEC (PJ)
working hours (10 mio h)
PEC/hours worked
data source: Schandl: IFF UK database

MFK | EEA Megatrends | May 2007 | 21
Total number of working hours and materials use (UK 1870-2000)
0
100
200
300
400
500
600
700
800
900
1870 1890 1910 1930 1950 1970 1990
DM
C (
mil
ion
to
nn
es
), w
ork
ing
tim
e
(hu
nd
red
mil
llio
n h
ou
rs)
0
10
20
30
40
50
60
70
80
90
DM
C/w
ork
ing
ho
ur
(kg
/ho
ur)
DMC
working hours
DMC/working hour
data source: Schandl: IFF UK database

MFK | EEA Megatrends | May 2007 | 22
material (DMC) and energy (PEC) intensity per working hour, UK
0,00
5,00
10,00
15,00
20,00
25,00
30,00
35,00
1850 1900 1950 2000
DMC/working hourkg/hour
PEC/hours worked,MJ/10h
data source: Schandl: IFF UK database

MFK | EEA Megatrends | May 2007 | 23
working hours and primary energy consumption (UK 1870-2000)
3.800
4.000
4.200
4.400
4.600
4.800
5.000
5.200
5.400
4.000 6.000 8.000 10.000 12.000 14.000
PEC in PJ
wo
rkin
g t
ime
in 1
0 m
illio
n h
rs
data source: Schandl: IFF UK database

MFK | EEA Megatrends | May 2007 | 24
LifeTime & Working time in UK1850-1985
0
100
200
300
400
500
600
700
800
female total lifetime male total lifetimefemale formal work male formal work
in 1
000
hour
s
source: Ausubel & Grübler 1996

MFK | EEA Megatrends | May 2007 | 25
Annual working hours per inhabitant 1960-2004, EU15, USA and Japan
200
400
600
800
1000
1200
1400
1600
1800
2000
1960
1962
1964
1966
1968
1970
1972
1974
1976
1978
1980
1982
1984
1986
1988
1990
1992
1994
1996
1998
2000
2002
Japan USA EU
source: OECD, Groningen db
MFK | EEA Megatrends | May 2007 | 26
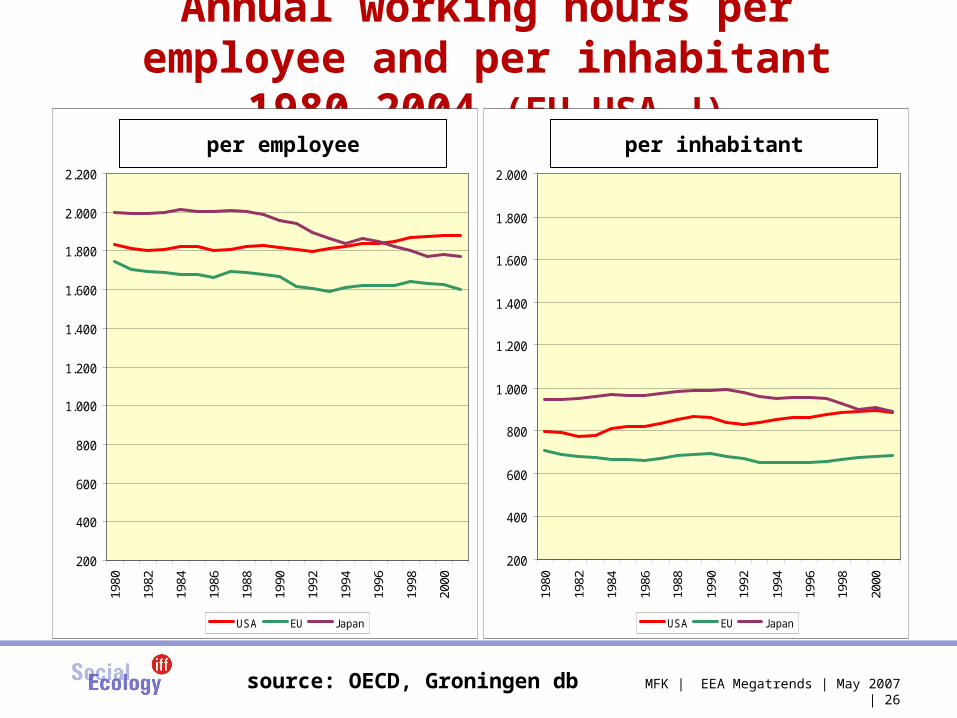
Annual working hours per employee and per inhabitant 1980-2004 (EU,USA,J)
Annual w ork ing hours per em ployee
200
400
600
800
1.000
1.200
1.400
1.600
1.800
2.000
2.200
1980
1982
1984
1986
1988
1990
1992
1994
1996
1998
2000
USA EU Japan
Annual w ork ing hours per inhabitant
200
400
600
800
1.000
1.200
1.400
1.600
1.800
2.000
1980
1982
1984
1986
1988
1990
1992
1994
1996
1998
2000
USA EU Japan
per employee per inhabitant
source: OECD, Groningen db

MFK | EEA Megatrends | May 2007 | 27
Productivity, working hours, hourly real wages and profits EU and USAEuropäische Union
0,00
0,50
1,00
1,50
2,00
labour productivity hourly real wages
total hours profits
USA
0,00
0,50
1,00
1,50
2,00
labour productivity hourly real wages
total hours profits
source: OECD, Groningen db

MFK | EEA Megatrends | May 2007 | 28
Rebound effect: rising income compensates efficiency gains
• Productivity gains not only refer to working time, but may be assumed to refer to all production factors, also to energy and materials
• If productivity gains are not paid off in time, but only in income, there will be a growth in the volume of consumption
• this will generate a rebound effect that prohibits the reduction in energy and material use that would result from efficiency gains.

MFK | EEA Megatrends | May 2007 | 29
Interlinkages of time, money and natural resources
creation machinefor money
person / household system
resources
physical work
time
money
Goods / services
creationmachine forhuman time
Relevant natural
environmentEconomic
System

MFK | EEA Megatrends | May 2007 | 30
Conclusion: time use / time squeeze as a potential social driver?
Interesting analytical features:
– Explanatory value beyond the STEEP drivers?– Behavioural variable, addresses people as agents – Fairly easy to measure and to model– Important link between resource consumption and quality of
life (how many happy hours at which environmental cost?)
Interesting cross linkages to other policy areas:
– Family policy, demografic policies– Social security and welfare– Economic policies, labour and unemployment